Hoonah-Angoon Census Area, AK
Hoonah-Angoon Census Area Overview
2,329
TOTAL POPULATION
1,300
MALE POPULATION
1,029
FEMALE POPULATION
126.34
MALES / 100 FEMALES
79.15
FEMALES / 100 MALES
50.0
MEDIAN AGE
3.3
AVG FAMILY SIZE
2.5
AVG HOUSEHOLD SIZE
$39,257
PER CAPITA INCOME
$79,063
AVG FAMILY INCOME
$62,344
AVG HOUSEHOLD INCOME
34.1%
WAGE / INCOME GAP [ % ]
65.9¢/ $1
WAGE / INCOME GAP [ $ ]
0.47
INEQUALITY / GINI INDEX
1,365
LABOR FORCE [ PEOPLE ]
66.8%
PERCENT IN LABOR FORCE
14.0%
UNEMPLOYMENT RATE
Hoonah-Angoon Census Area Area Codes
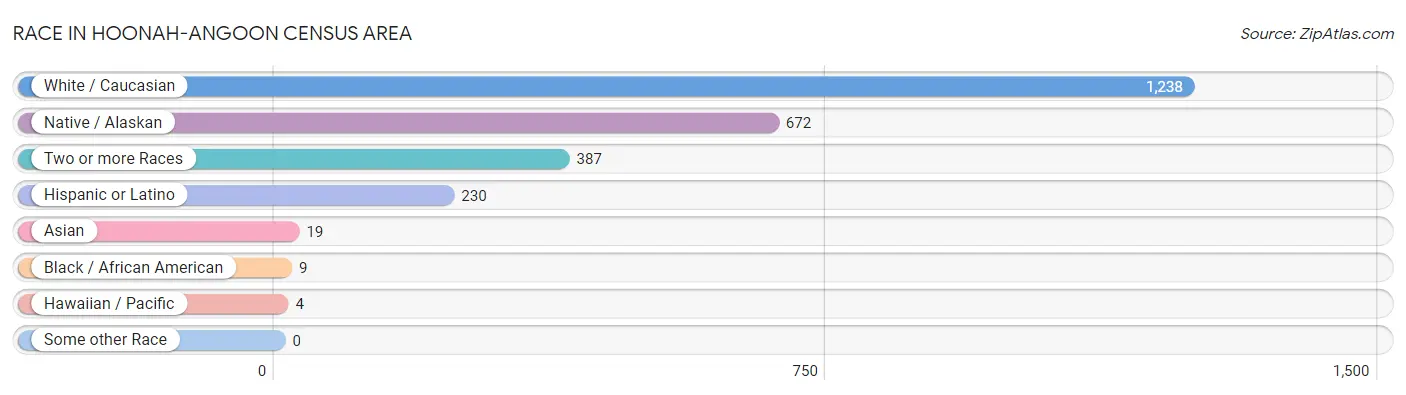
Race in Hoonah-Angoon Census Area
The most populous races in Hoonah-Angoon Census Area are White / Caucasian (1,238 | 53.2%), Native / Alaskan (672 | 28.8%), and Two or more Races (387 | 16.6%).
| Race | # Population | % Population |
| Asian | 19 | 0.8% |
| Black / African American | 9 | 0.4% |
| Hawaiian / Pacific | 4 | 0.2% |
| Hispanic or Latino | 230 | 9.9% |
| Native / Alaskan | 672 | 28.8% |
| White / Caucasian | 1,238 | 53.2% |
| Two or more Races | 387 | 16.6% |
| Some other Race | 0 | 0.0% |
| Total | 2,329 | 100.0% |
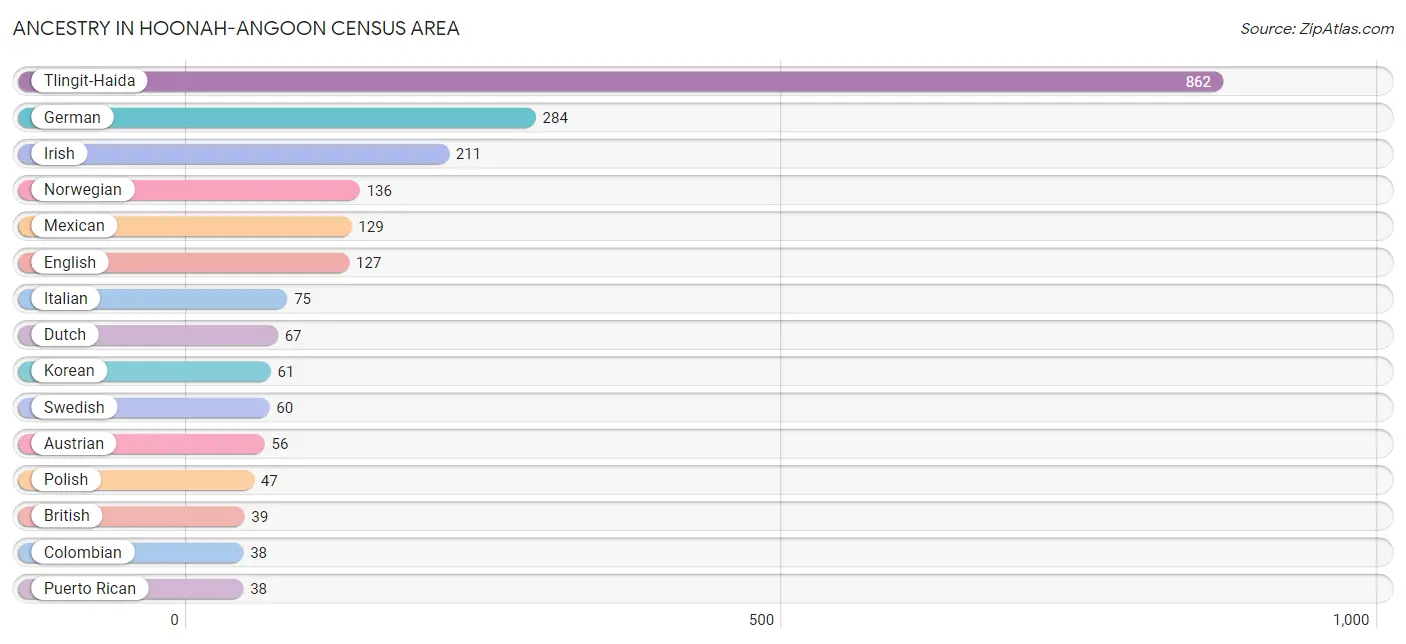
Ancestry in Hoonah-Angoon Census Area
The most populous ancestries reported in Hoonah-Angoon Census Area are Tlingit-Haida (862 | 37.0%), German (284 | 12.2%), Irish (211 | 9.1%), Norwegian (136 | 5.8%), and Mexican (129 | 5.5%), together accounting for 69.6% of all Hoonah-Angoon Census Area residents.
| Ancestry | # Population | % Population |
| Alaska Native | 27 | 1.2% |
| Alaskan Athabascan | 18 | 0.8% |
| Aleut | 9 | 0.4% |
| American | 2 | 0.1% |
| Apache | 5 | 0.2% |
| Arab | 2 | 0.1% |
| Austrian | 56 | 2.4% |
| Bhutanese | 21 | 0.9% |
| British | 39 | 1.7% |
| Bulgarian | 4 | 0.2% |
| Canadian | 15 | 0.6% |
| Cape Verdean | 20 | 0.9% |
| Central American | 3 | 0.1% |
| Cherokee | 5 | 0.2% |
| Chippewa | 11 | 0.5% |
| Colombian | 38 | 1.6% |
| Croatian | 3 | 0.1% |
| Cuban | 8 | 0.3% |
| Czech | 4 | 0.2% |
| Czechoslovakian | 11 | 0.5% |
| Danish | 1 | 0.0% |
| Dutch | 67 | 2.9% |
| English | 127 | 5.4% |
| European | 27 | 1.2% |
| Finnish | 7 | 0.3% |
| French | 7 | 0.3% |
| French American Indian | 1 | 0.0% |
| French Canadian | 30 | 1.3% |
| German | 284 | 12.2% |
| Hungarian | 12 | 0.5% |
| Indian (Asian) | 3 | 0.1% |
| Inupiat | 17 | 0.7% |
| Irish | 211 | 9.1% |
| Israeli | 6 | 0.3% |
| Italian | 75 | 3.2% |
| Korean | 61 | 2.6% |
| Lebanese | 2 | 0.1% |
| Lithuanian | 3 | 0.1% |
| Maltese | 3 | 0.1% |
| Mexican | 129 | 5.5% |
| Mexican American Indian | 3 | 0.1% |
| Native Hawaiian | 15 | 0.6% |
| Northern European | 29 | 1.3% |
| Norwegian | 136 | 5.8% |
| Paiute | 1 | 0.0% |
| Polish | 47 | 2.0% |
| Portuguese | 29 | 1.3% |
| Puerto Rican | 38 | 1.6% |
| Russian | 18 | 0.8% |
| Salvadoran | 3 | 0.1% |
| Scandinavian | 31 | 1.3% |
| Scotch-Irish | 18 | 0.8% |
| Scottish | 31 | 1.3% |
| Sioux | 7 | 0.3% |
| South African | 4 | 0.2% |
| South American | 38 | 1.6% |
| Spanish | 1 | 0.0% |
| Subsaharan African | 24 | 1.0% |
| Swedish | 60 | 2.6% |
| Tlingit-Haida | 862 | 37.0% |
| Tsimshian | 13 | 0.6% |
| Turkish | 5 | 0.2% |
| Ukrainian | 5 | 0.2% |
| Welsh | 3 | 0.1% |
| Yup'ik | 11 | 0.5% | View All 65 Rows |
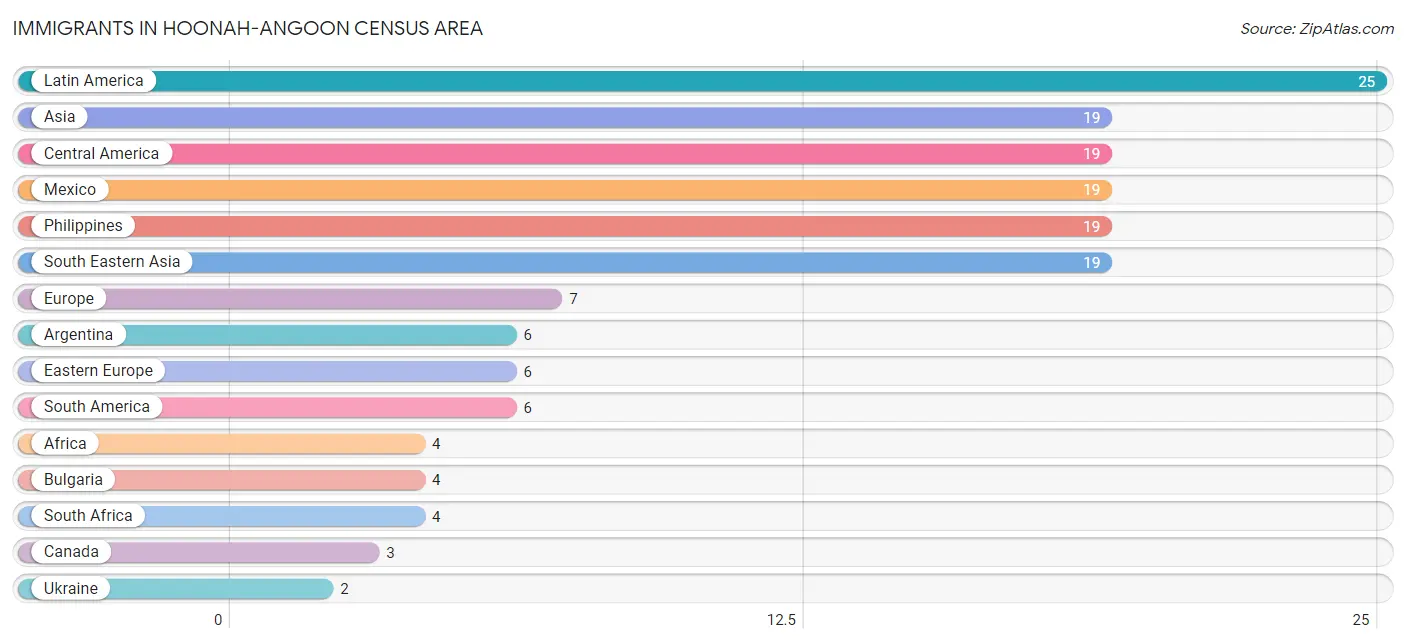
Immigrants in Hoonah-Angoon Census Area
The most numerous immigrant groups reported in Hoonah-Angoon Census Area came from Latin America (25 | 1.1%), Asia (19 | 0.8%), Central America (19 | 0.8%), Mexico (19 | 0.8%), and Philippines (19 | 0.8%), together accounting for 4.3% of all Hoonah-Angoon Census Area residents.
| Immigration Origin | # Population | % Population |
| Africa | 4 | 0.2% |
| Argentina | 6 | 0.3% |
| Asia | 19 | 0.8% |
| Bulgaria | 4 | 0.2% |
| Canada | 3 | 0.1% |
| Central America | 19 | 0.8% |
| Eastern Europe | 6 | 0.3% |
| England | 1 | 0.0% |
| Europe | 7 | 0.3% |
| Latin America | 25 | 1.1% |
| Mexico | 19 | 0.8% |
| Northern Europe | 1 | 0.0% |
| Philippines | 19 | 0.8% |
| South Africa | 4 | 0.2% |
| South America | 6 | 0.3% |
| South Eastern Asia | 19 | 0.8% |
| Ukraine | 2 | 0.1% | View All 17 Rows |
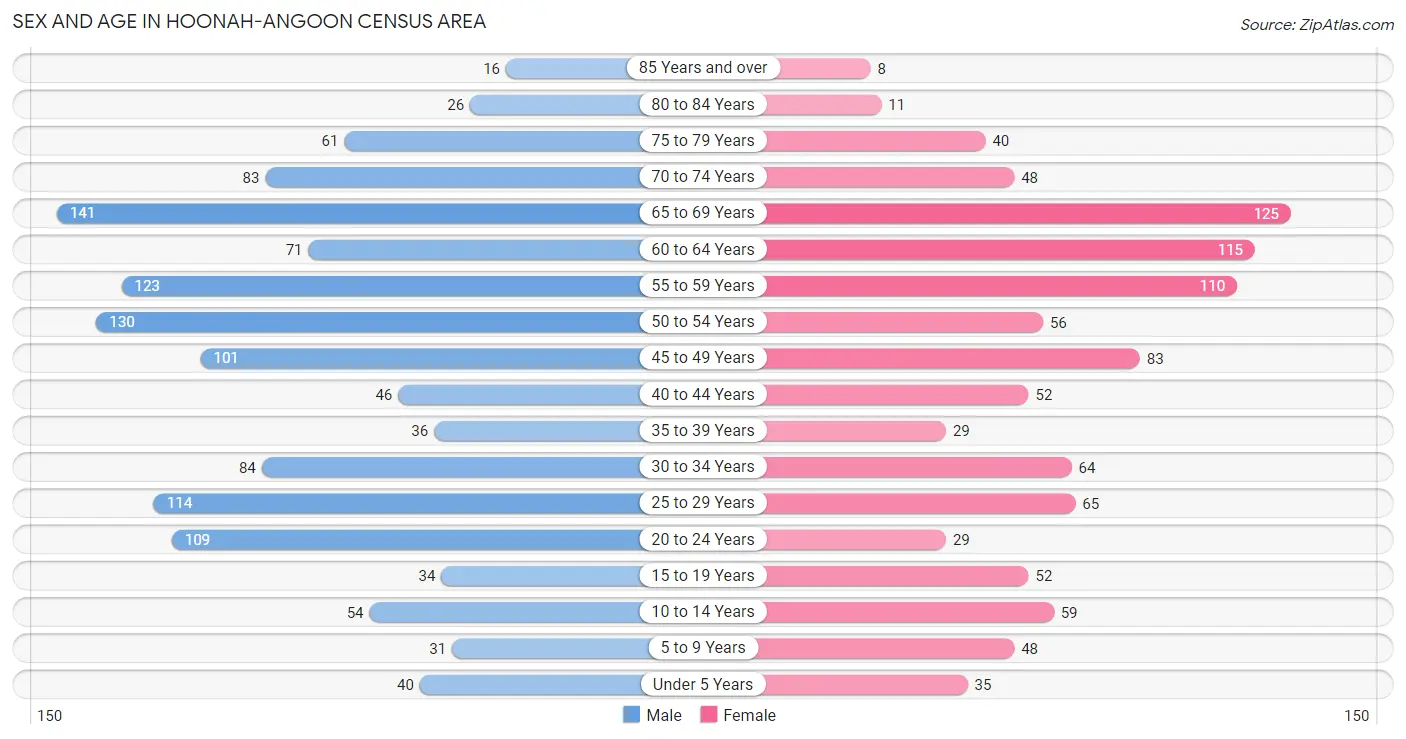
Sex and Age in Hoonah-Angoon Census Area
Sex and Age in Hoonah-Angoon Census Area
The most populous age groups in Hoonah-Angoon Census Area are 65 to 69 Years (141 | 10.8%) for men and 65 to 69 Years (125 | 12.1%) for women.
| Age Bracket | Male | Female |
| Under 5 Years | 40 (3.1%) | 35 (3.4%) |
| 5 to 9 Years | 31 (2.4%) | 48 (4.7%) |
| 10 to 14 Years | 54 (4.2%) | 59 (5.7%) |
| 15 to 19 Years | 34 (2.6%) | 52 (5.1%) |
| 20 to 24 Years | 109 (8.4%) | 29 (2.8%) |
| 25 to 29 Years | 114 (8.8%) | 65 (6.3%) |
| 30 to 34 Years | 84 (6.5%) | 64 (6.2%) |
| 35 to 39 Years | 36 (2.8%) | 29 (2.8%) |
| 40 to 44 Years | 46 (3.5%) | 52 (5.1%) |
| 45 to 49 Years | 101 (7.8%) | 83 (8.1%) |
| 50 to 54 Years | 130 (10.0%) | 56 (5.4%) |
| 55 to 59 Years | 123 (9.5%) | 110 (10.7%) |
| 60 to 64 Years | 71 (5.5%) | 115 (11.2%) |
| 65 to 69 Years | 141 (10.8%) | 125 (12.1%) |
| 70 to 74 Years | 83 (6.4%) | 48 (4.7%) |
| 75 to 79 Years | 61 (4.7%) | 40 (3.9%) |
| 80 to 84 Years | 26 (2.0%) | 11 (1.1%) |
| 85 Years and over | 16 (1.2%) | 8 (0.8%) |
| Total | 1,300 (100.0%) | 1,029 (100.0%) |
Families and Households in Hoonah-Angoon Census Area
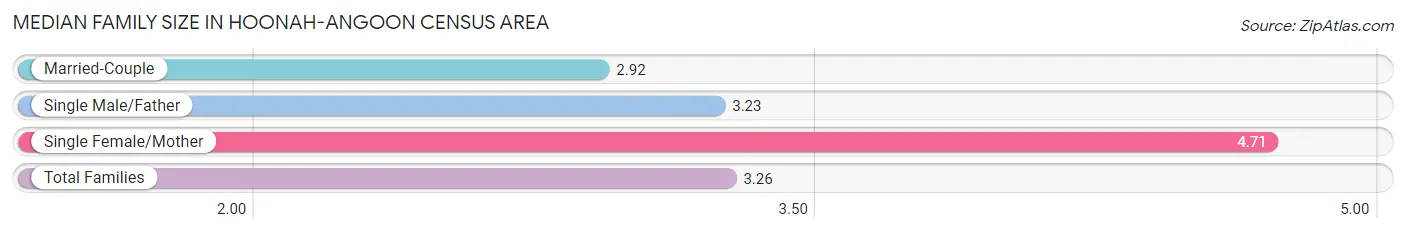
Median Family Size in Hoonah-Angoon Census Area
The median family size in Hoonah-Angoon Census Area is 3.26 persons per family, with single female/mother families (86 | 17.7%) accounting for the largest median family size of 4.71 persons per family. On the other hand, married-couple families (361 | 74.1%) represent the smallest median family size with 2.92 persons per family.
| Family Type | # Families | Family Size |
| Married-Couple | 361 (74.1%) | 2.92 |
| Single Male/Father | 40 (8.2%) | 3.23 |
| Single Female/Mother | 86 (17.7%) | 4.71 |
| Total Families | 487 (100.0%) | 3.26 |
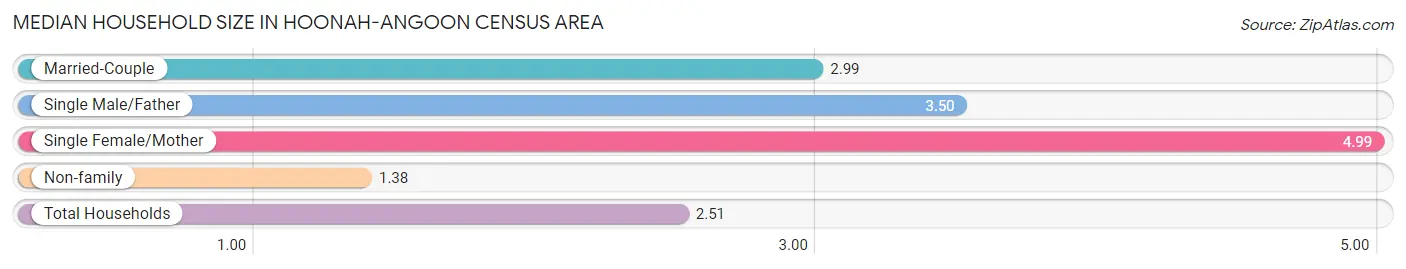
Median Household Size in Hoonah-Angoon Census Area
The median household size in Hoonah-Angoon Census Area is 2.51 persons per household, with single female/mother households (86 | 9.9%) accounting for the largest median household size of 4.99 persons per household. non-family households (380 | 43.8%) represent the smallest median household size with 1.38 persons per household.
| Household Type | # Households | Household Size |
| Married-Couple | 361 (41.6%) | 2.99 |
| Single Male/Father | 40 (4.6%) | 3.50 |
| Single Female/Mother | 86 (9.9%) | 4.99 |
| Non-family | 380 (43.8%) | 1.38 |
| Total Households | 867 (100.0%) | 2.51 |
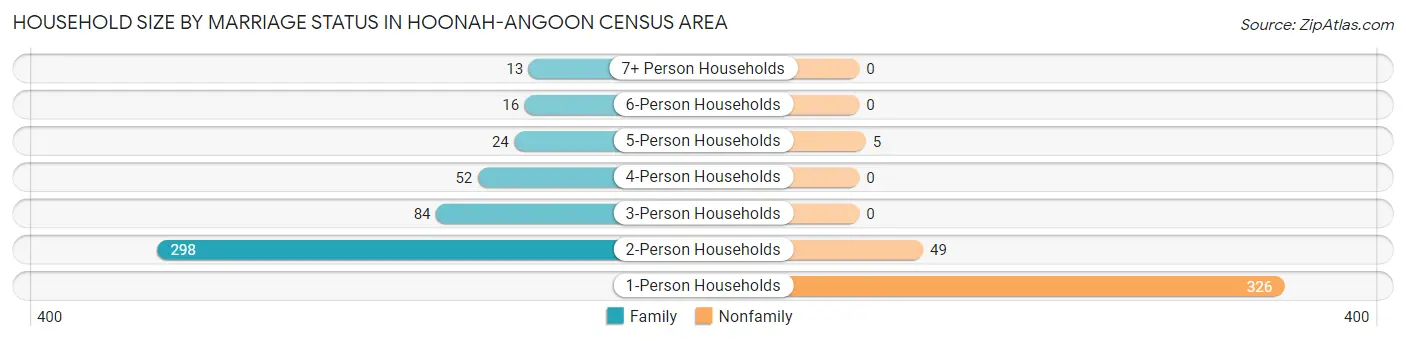
Household Size by Marriage Status in Hoonah-Angoon Census Area
Out of a total of 867 households in Hoonah-Angoon Census Area, 487 (56.2%) are family households, while 380 (43.8%) are nonfamily households. The most numerous type of family households are 2-person households, comprising 298, and the most common type of nonfamily households are 1-person households, comprising 326.
| Household Size | Family Households | Nonfamily Households |
| 1-Person Households | - | 326 (37.6%) |
| 2-Person Households | 298 (34.4%) | 49 (5.7%) |
| 3-Person Households | 84 (9.7%) | 0 (0.0%) |
| 4-Person Households | 52 (6.0%) | 0 (0.0%) |
| 5-Person Households | 24 (2.8%) | 5 (0.6%) |
| 6-Person Households | 16 (1.8%) | 0 (0.0%) |
| 7+ Person Households | 13 (1.5%) | 0 (0.0%) |
| Total | 487 (56.2%) | 380 (43.8%) |
Female Fertility in Hoonah-Angoon Census Area
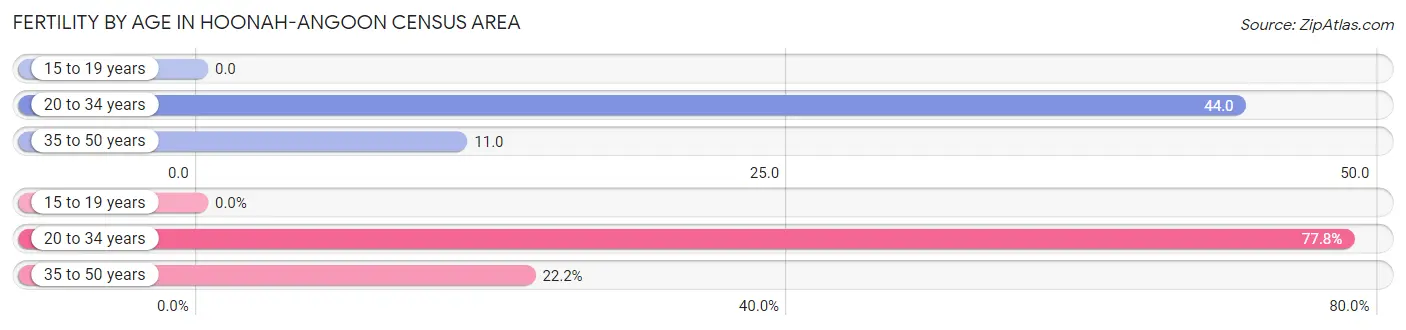
Fertility by Age in Hoonah-Angoon Census Area
Average fertility rate in Hoonah-Angoon Census Area is 23.0 births per 1,000 women. Women in the age bracket of 20 to 34 years have the highest fertility rate with 44.0 births per 1,000 women. Women in the age bracket of 20 to 34 years acount for 77.8% of all women with births.
| Age Bracket | Women with Births | Births / 1,000 Women |
| 15 to 19 years | 0 (0.0%) | 0.0 |
| 20 to 34 years | 7 (77.8%) | 44.0 |
| 35 to 50 years | 2 (22.2%) | 11.0 |
| Total | 9 (100.0%) | 23.0 |
Fertility by Age by Marriage Status in Hoonah-Angoon Census Area
55.6% of women with births (9) in Hoonah-Angoon Census Area are married. The highest percentage of unmarried women with births falls into 35 to 50 years age bracket with 100.0% of them unmarried at the time of birth, while the lowest percentage of unmarried women with births belong to 20 to 34 years age bracket with 28.6% of them unmarried.
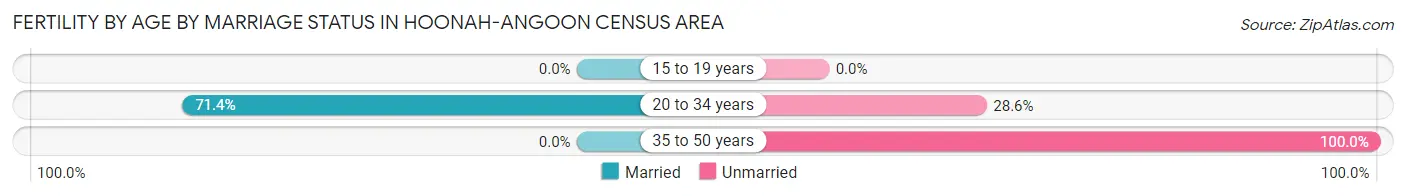
| Age Bracket | Married | Unmarried |
| 15 to 19 years | 0 (0.0%) | 0 (0.0%) |
| 20 to 34 years | 5 (71.4%) | 2 (28.6%) |
| 35 to 50 years | 0 (0.0%) | 2 (100.0%) |
| Total | 5 (55.6%) | 4 (44.4%) |
Fertility by Education in Hoonah-Angoon Census Area
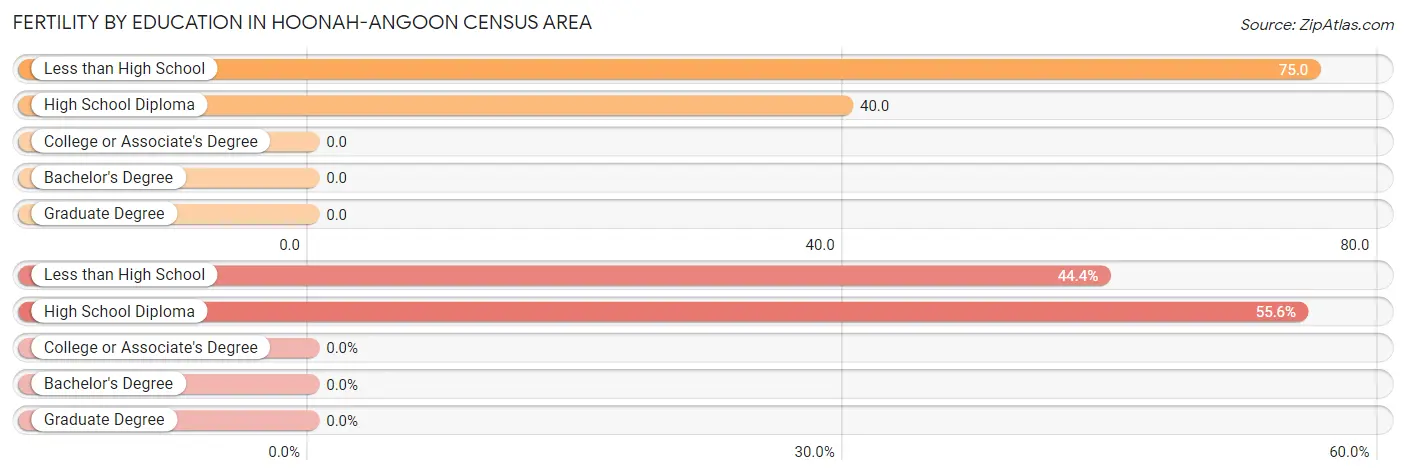
| Educational Attainment | Women with Births | Births / 1,000 Women |
| Less than High School | 4 (44.4%) | 75.0 |
| High School Diploma | 5 (55.6%) | 40.0 |
| College or Associate's Degree | 0 (0.0%) | 0.0 |
| Bachelor's Degree | 0 (0.0%) | 0.0 |
| Graduate Degree | 0 (0.0%) | 0.0 |
| Total | 9 (100.0%) | 23.0 |
Fertility by Education by Marriage Status in Hoonah-Angoon Census Area
44.4% of women with births in Hoonah-Angoon Census Area are unmarried. Women with the educational attainment of high school diploma are most likely to be married with 60.0% of them married at childbirth, while women with the educational attainment of less than high school are least likely to be married with 50.0% of them unmarried at childbirth.
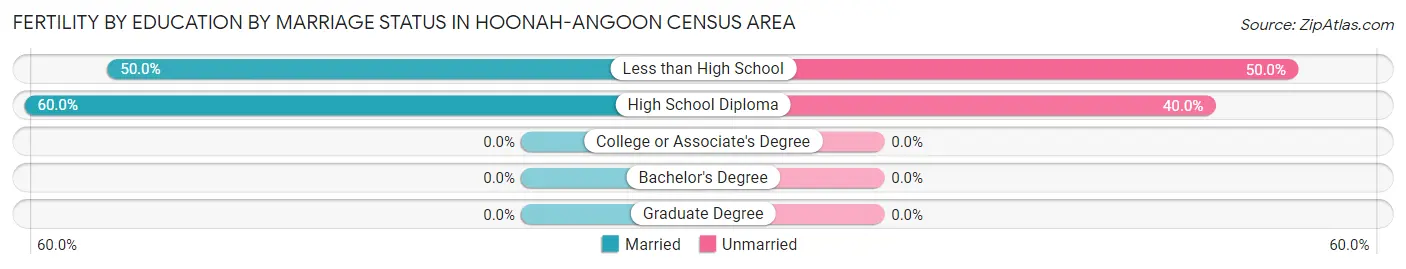
| Educational Attainment | Married | Unmarried |
| Less than High School | 2 (50.0%) | 2 (50.0%) |
| High School Diploma | 3 (60.0%) | 2 (40.0%) |
| College or Associate's Degree | 0 (0.0%) | 0 (0.0%) |
| Bachelor's Degree | 0 (0.0%) | 0 (0.0%) |
| Graduate Degree | 0 (0.0%) | 0 (0.0%) |
| Total | 5 (55.6%) | 4 (44.4%) |
Income in Hoonah-Angoon Census Area
Income Overview in Hoonah-Angoon Census Area
Per Capita Income in Hoonah-Angoon Census Area is $39,257, while median incomes of families and households are $79,063 and $62,344 respectively.
| Characteristic | Number | Measure |
| Per Capita Income | 2,329 | $39,257 |
| Median Family Income | 487 | $79,063 |
| Mean Family Income | 487 | $98,406 |
| Median Household Income | 867 | $62,344 |
| Mean Household Income | 867 | $84,200 |
| Income Deficit | 487 | $0 |
| Wage / Income Gap (%) | 2,329 | 34.12% |
| Wage / Income Gap ($) | 2,329 | 65.88¢ per $1 |
| Gini / Inequality Index | 2,329 | 0.47 |
Earnings by Sex in Hoonah-Angoon Census Area
Average Earnings in Hoonah-Angoon Census Area are $28,361, $34,444 for men and $22,692 for women, a difference of 34.1%.
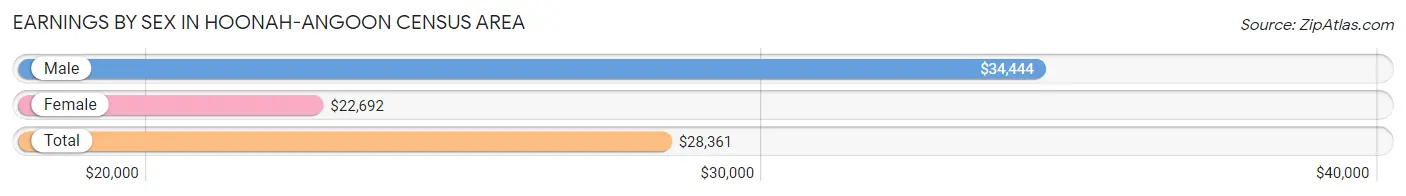
| Sex | Number | Average Earnings |
| Male | 848 (58.2%) | $34,444 |
| Female | 610 (41.8%) | $22,692 |
| Total | 1,458 (100.0%) | $28,361 |
Earnings by Sex by Income Bracket in Hoonah-Angoon Census Area
The most common earnings brackets in Hoonah-Angoon Census Area are $100,000+ for men (105 | 12.4%) and $15,000 to $17,499 for women (96 | 15.7%).
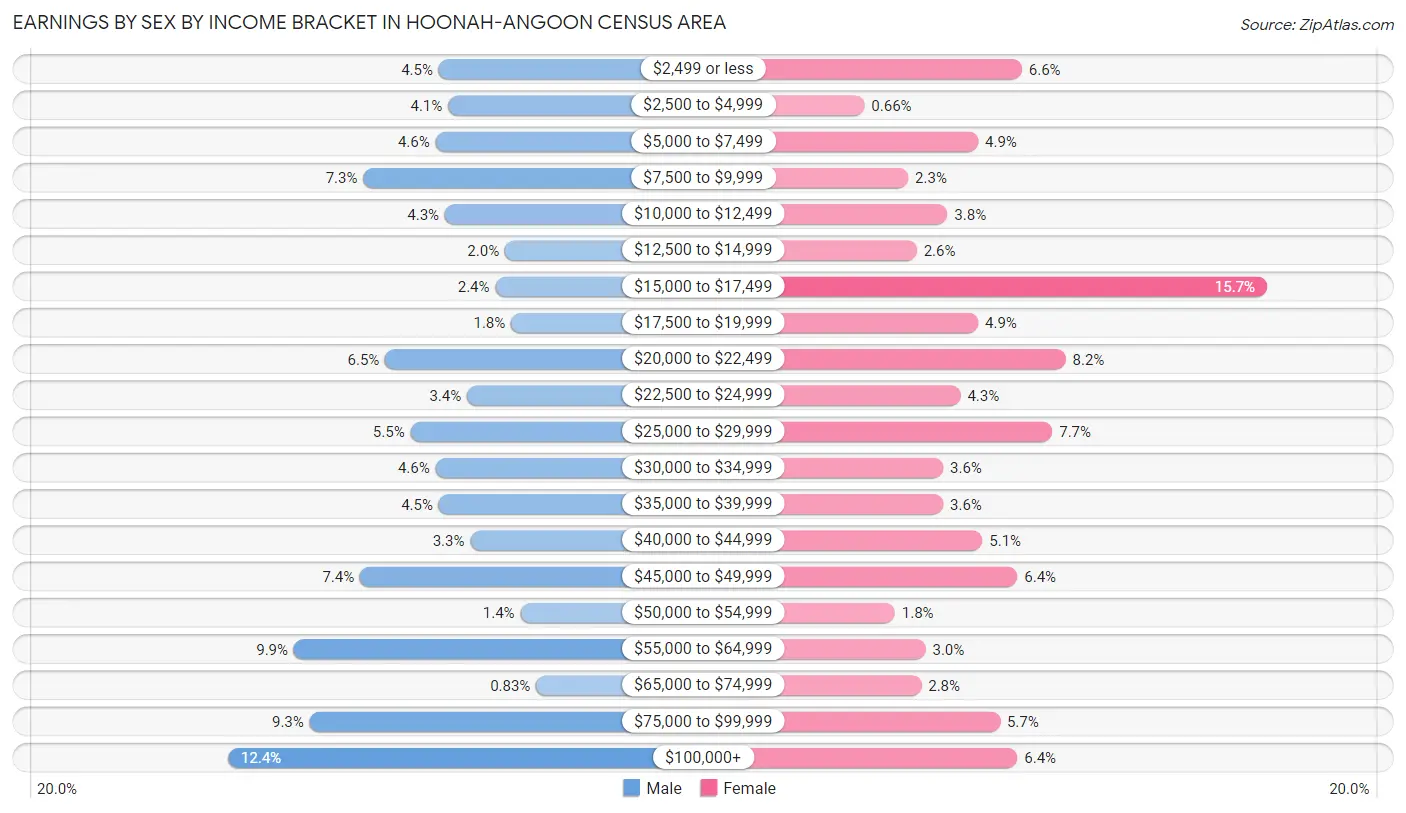
| Income | Male | Female |
| $2,499 or less | 38 (4.5%) | 40 (6.6%) |
| $2,500 to $4,999 | 35 (4.1%) | 4 (0.7%) |
| $5,000 to $7,499 | 39 (4.6%) | 30 (4.9%) |
| $7,500 to $9,999 | 62 (7.3%) | 14 (2.3%) |
| $10,000 to $12,499 | 36 (4.3%) | 23 (3.8%) |
| $12,500 to $14,999 | 17 (2.0%) | 16 (2.6%) |
| $15,000 to $17,499 | 20 (2.4%) | 96 (15.7%) |
| $17,500 to $19,999 | 15 (1.8%) | 30 (4.9%) |
| $20,000 to $22,499 | 55 (6.5%) | 50 (8.2%) |
| $22,500 to $24,999 | 29 (3.4%) | 26 (4.3%) |
| $25,000 to $29,999 | 47 (5.5%) | 47 (7.7%) |
| $30,000 to $34,999 | 39 (4.6%) | 22 (3.6%) |
| $35,000 to $39,999 | 38 (4.5%) | 22 (3.6%) |
| $40,000 to $44,999 | 28 (3.3%) | 31 (5.1%) |
| $45,000 to $49,999 | 63 (7.4%) | 39 (6.4%) |
| $50,000 to $54,999 | 12 (1.4%) | 11 (1.8%) |
| $55,000 to $64,999 | 84 (9.9%) | 18 (2.9%) |
| $65,000 to $74,999 | 7 (0.8%) | 17 (2.8%) |
| $75,000 to $99,999 | 79 (9.3%) | 35 (5.7%) |
| $100,000+ | 105 (12.4%) | 39 (6.4%) |
| Total | 848 (100.0%) | 610 (100.0%) |
Earnings by Sex by Educational Attainment in Hoonah-Angoon Census Area
Average earnings in Hoonah-Angoon Census Area are $42,813 for men and $24,792 for women, a difference of 42.1%. Men with an educational attainment of bachelor's degree enjoy the highest average annual earnings of $46,649, while those with graduate degree education earn the least with $24,318. Women with an educational attainment of graduate degree earn the most with the average annual earnings of $70,625, while those with college or associate's degree education have the smallest earnings of $18,214.
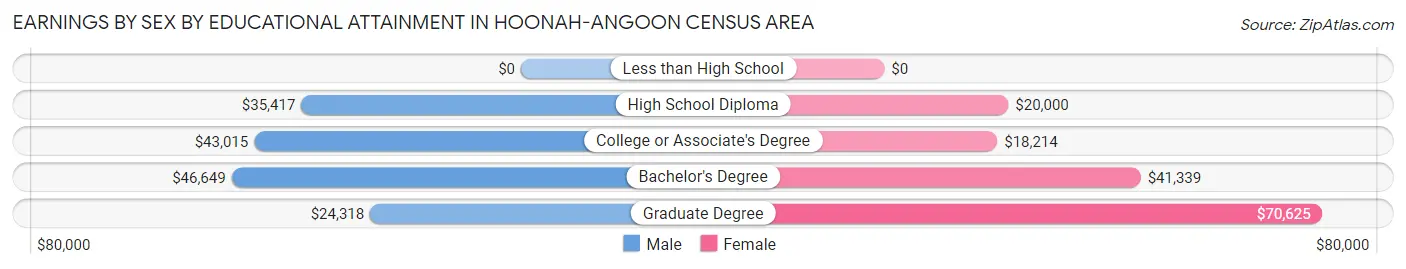
| Educational Attainment | Male Income | Female Income |
| Less than High School | - | - |
| High School Diploma | $35,417 | $20,000 |
| College or Associate's Degree | $43,015 | $18,214 |
| Bachelor's Degree | $46,649 | $41,339 |
| Graduate Degree | $24,318 | $70,625 |
| Total | $42,813 | $24,792 |
Family Income in Hoonah-Angoon Census Area
Family Income Brackets in Hoonah-Angoon Census Area
According to the Hoonah-Angoon Census Area family income data, there are 125 families falling into the $50,000 to $74,999 income range, which is the most common income bracket and makes up 25.7% of all families. Conversely, the $10,000 to $14,999 income bracket is the least frequent group with only 4 families (0.8%) belonging to this category.
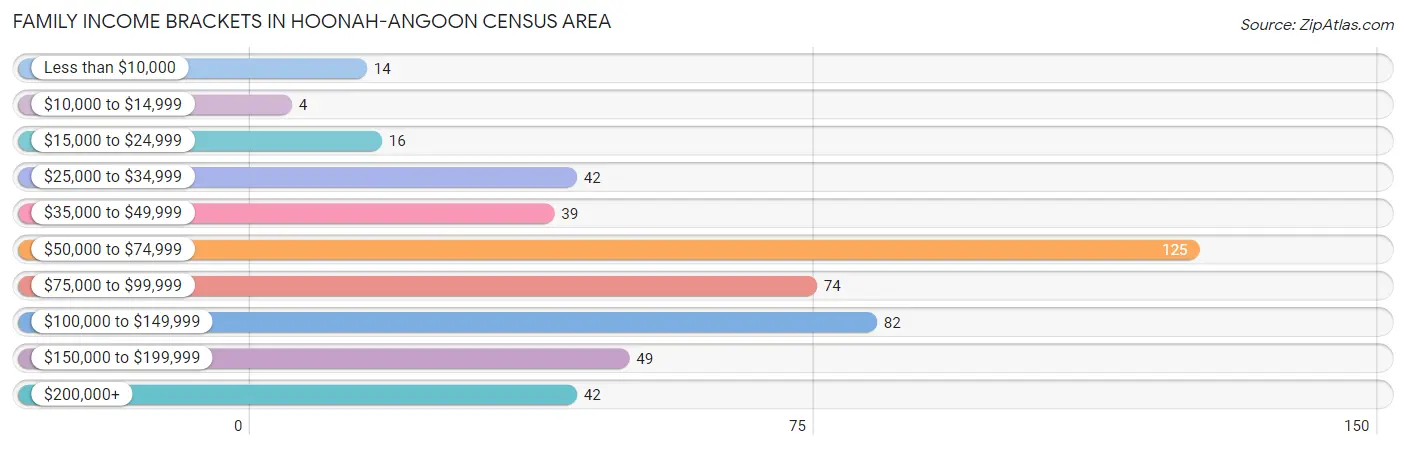
| Income Bracket | # Families | % Families |
| Less than $10,000 | 14 | 2.9% |
| $10,000 to $14,999 | 4 | 0.8% |
| $15,000 to $24,999 | 16 | 3.3% |
| $25,000 to $34,999 | 42 | 8.6% |
| $35,000 to $49,999 | 39 | 8.0% |
| $50,000 to $74,999 | 125 | 25.7% |
| $75,000 to $99,999 | 74 | 15.2% |
| $100,000 to $149,999 | 82 | 16.8% |
| $150,000 to $199,999 | 49 | 10.1% |
| $200,000+ | 42 | 8.6% |
Family Income by Famaliy Size in Hoonah-Angoon Census Area
6-person families (14 | 2.9%) account for the highest median family income in Hoonah-Angoon Census Area with $105,833 per family, while 2-person families (316 | 64.9%) have the highest median income of $41,072 per family member.
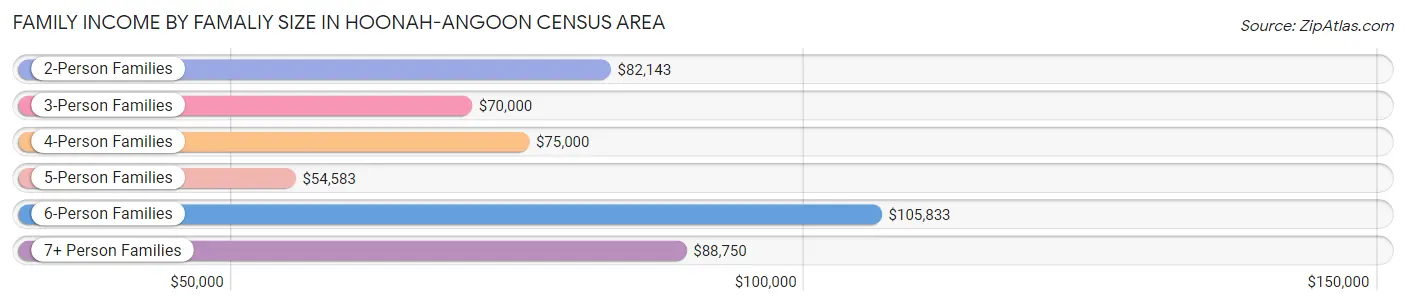
| Income Bracket | # Families | Median Income |
| 2-Person Families | 316 (64.9%) | $82,143 |
| 3-Person Families | 86 (17.7%) | $70,000 |
| 4-Person Families | 36 (7.4%) | $75,000 |
| 5-Person Families | 22 (4.5%) | $54,583 |
| 6-Person Families | 14 (2.9%) | $105,833 |
| 7+ Person Families | 13 (2.7%) | $88,750 |
| Total | 487 (100.0%) | $79,063 |
Family Income by Number of Earners in Hoonah-Angoon Census Area
The median family income in Hoonah-Angoon Census Area is $79,063, with families comprising 2 earners (219) having the highest median family income of $100,625, while families with no earners (87) have the lowest median family income of $52,813, accounting for 45.0% and 17.9% of families, respectively.
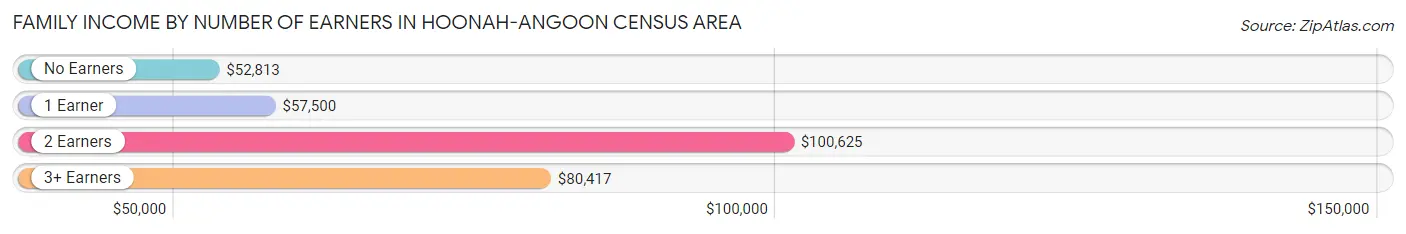
| Number of Earners | # Families | Median Income |
| No Earners | 87 (17.9%) | $52,813 |
| 1 Earner | 154 (31.6%) | $57,500 |
| 2 Earners | 219 (45.0%) | $100,625 |
| 3+ Earners | 27 (5.5%) | $80,417 |
| Total | 487 (100.0%) | $79,063 |
Household Income in Hoonah-Angoon Census Area
Household Income Brackets in Hoonah-Angoon Census Area
With 164 households falling in the category, the $50,000 to $74,999 income range is the most frequent in Hoonah-Angoon Census Area, accounting for 18.9% of all households. In contrast, only 50 households (5.8%) fall into the $10,000 to $14,999 income bracket, making it the least populous group.
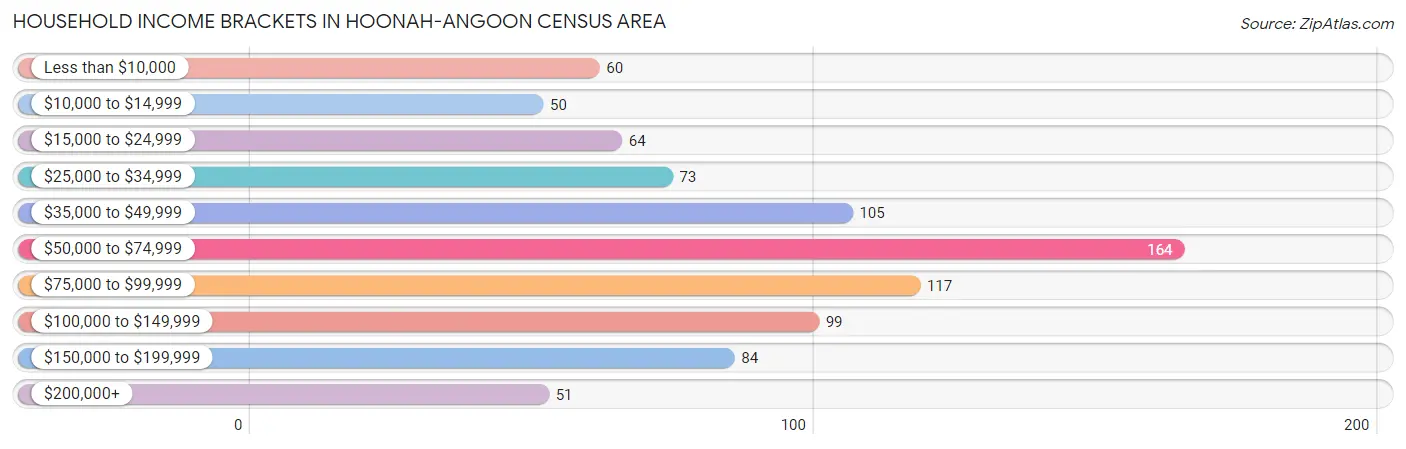
| Income Bracket | # Households | % Households |
| Less than $10,000 | 60 | 6.9% |
| $10,000 to $14,999 | 50 | 5.8% |
| $15,000 to $24,999 | 64 | 7.4% |
| $25,000 to $34,999 | 73 | 8.4% |
| $35,000 to $49,999 | 105 | 12.1% |
| $50,000 to $74,999 | 164 | 18.9% |
| $75,000 to $99,999 | 117 | 13.5% |
| $100,000 to $149,999 | 99 | 11.4% |
| $150,000 to $199,999 | 84 | 9.7% |
| $200,000+ | 51 | 5.9% |
Household Income by Householder Age in Hoonah-Angoon Census Area
The median household income in Hoonah-Angoon Census Area is $62,344, with the highest median household income of $73,482 found in the 25 to 44 years age bracket for the primary householder. A total of 123 households (14.2%) fall into this category. Meanwhile, the 15 to 24 years age bracket for the primary householder has the lowest median household income of $0, with 16 households (1.8%) in this group.
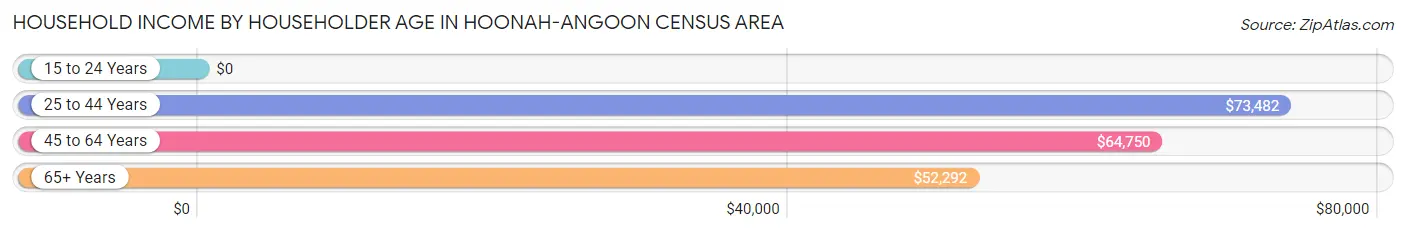
| Income Bracket | # Households | Median Income |
| 15 to 24 Years | 16 (1.8%) | $0 |
| 25 to 44 Years | 123 (14.2%) | $73,482 |
| 45 to 64 Years | 372 (42.9%) | $64,750 |
| 65+ Years | 356 (41.1%) | $52,292 |
| Total | 867 (100.0%) | $62,344 |
Poverty in Hoonah-Angoon Census Area
Income Below Poverty by Sex and Age in Hoonah-Angoon Census Area
With 12.1% poverty level for males and 10.8% for females among the residents of Hoonah-Angoon Census Area, under 5 year old males and 15 year old females are the most vulnerable to poverty, with 8 males (20.0%) and 2 females (33.3%) in their respective age groups living below the poverty level.
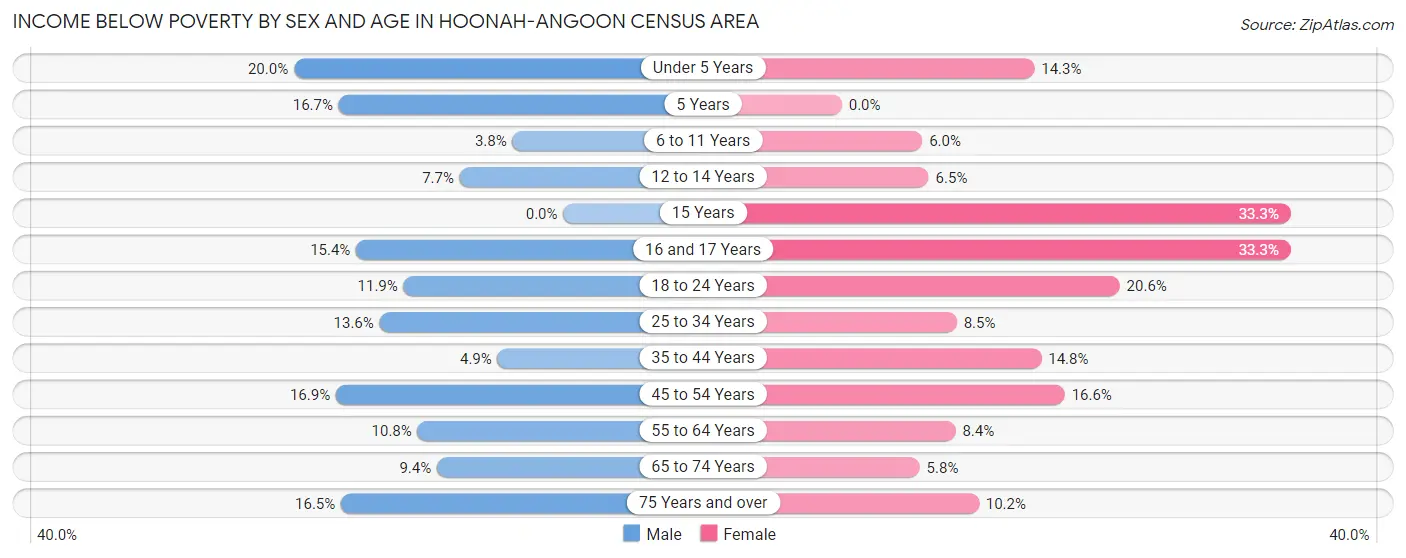
| Age Bracket | Male | Female |
| Under 5 Years | 8 (20.0%) | 5 (14.3%) |
| 5 Years | 1 (16.7%) | 0 (0.0%) |
| 6 to 11 Years | 2 (3.8%) | 4 (6.0%) |
| 12 to 14 Years | 2 (7.7%) | 2 (6.5%) |
| 15 Years | 0 (0.0%) | 2 (33.3%) |
| 16 and 17 Years | 2 (15.4%) | 4 (33.3%) |
| 18 to 24 Years | 14 (11.9%) | 13 (20.6%) |
| 25 to 34 Years | 27 (13.6%) | 11 (8.5%) |
| 35 to 44 Years | 4 (4.9%) | 12 (14.8%) |
| 45 to 54 Years | 39 (16.9%) | 23 (16.6%) |
| 55 to 64 Years | 21 (10.8%) | 19 (8.4%) |
| 65 to 74 Years | 21 (9.4%) | 10 (5.8%) |
| 75 Years and over | 17 (16.5%) | 6 (10.2%) |
| Total | 158 (12.1%) | 111 (10.8%) |
Income Above Poverty by Sex and Age in Hoonah-Angoon Census Area
According to the poverty statistics in Hoonah-Angoon Census Area, males aged 15 years and females aged 5 years are the age groups that are most secure financially, with 100.0% of males and 100.0% of females in these age groups living above the poverty line.
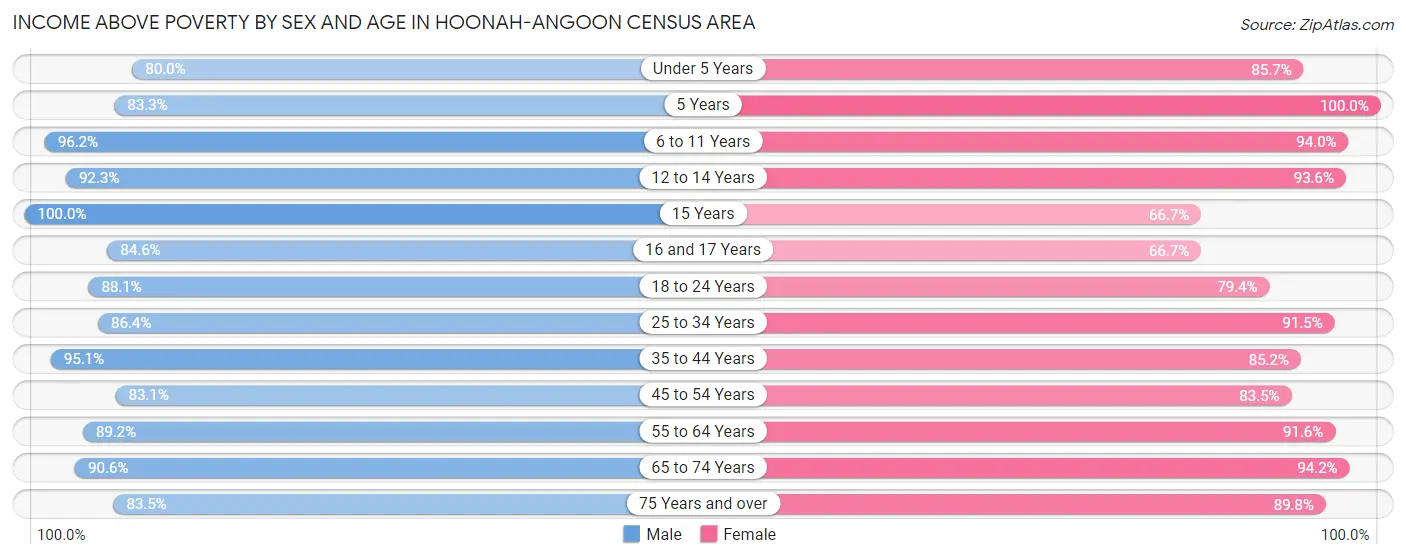
| Age Bracket | Male | Female |
| Under 5 Years | 32 (80.0%) | 30 (85.7%) |
| 5 Years | 5 (83.3%) | 9 (100.0%) |
| 6 to 11 Years | 51 (96.2%) | 63 (94.0%) |
| 12 to 14 Years | 24 (92.3%) | 29 (93.5%) |
| 15 Years | 12 (100.0%) | 4 (66.7%) |
| 16 and 17 Years | 11 (84.6%) | 8 (66.7%) |
| 18 to 24 Years | 104 (88.1%) | 50 (79.4%) |
| 25 to 34 Years | 171 (86.4%) | 118 (91.5%) |
| 35 to 44 Years | 78 (95.1%) | 69 (85.2%) |
| 45 to 54 Years | 192 (83.1%) | 116 (83.5%) |
| 55 to 64 Years | 173 (89.2%) | 206 (91.6%) |
| 65 to 74 Years | 203 (90.6%) | 163 (94.2%) |
| 75 Years and over | 86 (83.5%) | 53 (89.8%) |
| Total | 1,142 (87.8%) | 918 (89.2%) |
Income Below Poverty Among Married-Couple Families in Hoonah-Angoon Census Area
The poverty statistics for married-couple families in Hoonah-Angoon Census Area show that 1.1% or 4 of the total 361 families live below the poverty line. Families with 1 or 2 children have the highest poverty rate of 2.1%, comprising of 1 families. On the other hand, families with 3 or 4 children have the lowest poverty rate of 0.0%, which includes 0 families.
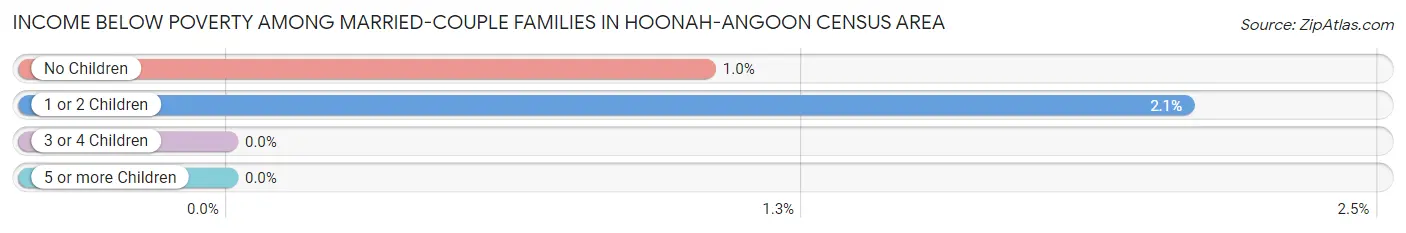
| Children | Above Poverty | Below Poverty |
| No Children | 286 (99.0%) | 3 (1.0%) |
| 1 or 2 Children | 47 (97.9%) | 1 (2.1%) |
| 3 or 4 Children | 23 (100.0%) | 0 (0.0%) |
| 5 or more Children | 1 (100.0%) | 0 (0.0%) |
| Total | 357 (98.9%) | 4 (1.1%) |
Income Below Poverty Among Single-Parent Households in Hoonah-Angoon Census Area
According to the poverty data in Hoonah-Angoon Census Area, 15.0% or 6 single-father households and 20.9% or 18 single-mother households are living below the poverty line. Among single-father households, those with 1 or 2 children have the highest poverty rate, with 4 households (22.2%) experiencing poverty. Likewise, among single-mother households, those with 1 or 2 children have the highest poverty rate, with 13 households (43.3%) falling below the poverty line.
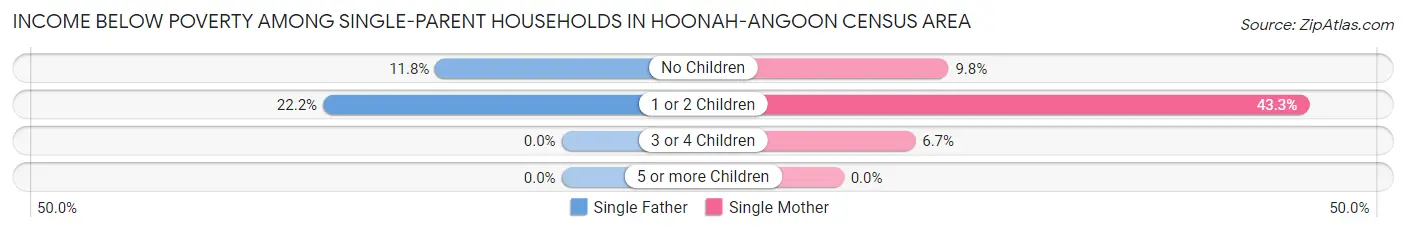
| Children | Single Father | Single Mother |
| No Children | 2 (11.8%) | 4 (9.8%) |
| 1 or 2 Children | 4 (22.2%) | 13 (43.3%) |
| 3 or 4 Children | 0 (0.0%) | 1 (6.7%) |
| 5 or more Children | 0 (0.0%) | 0 (0.0%) |
| Total | 6 (15.0%) | 18 (20.9%) |
Income Below Poverty Among Married-Couple vs Single-Parent Households in Hoonah-Angoon Census Area
The poverty data for Hoonah-Angoon Census Area shows that 4 of the married-couple family households (1.1%) and 24 of the single-parent households (19.1%) are living below the poverty level. Within the married-couple family households, those with 1 or 2 children have the highest poverty rate, with 1 households (2.1%) falling below the poverty line. Among the single-parent households, those with 1 or 2 children have the highest poverty rate, with 17 household (35.4%) living below poverty.
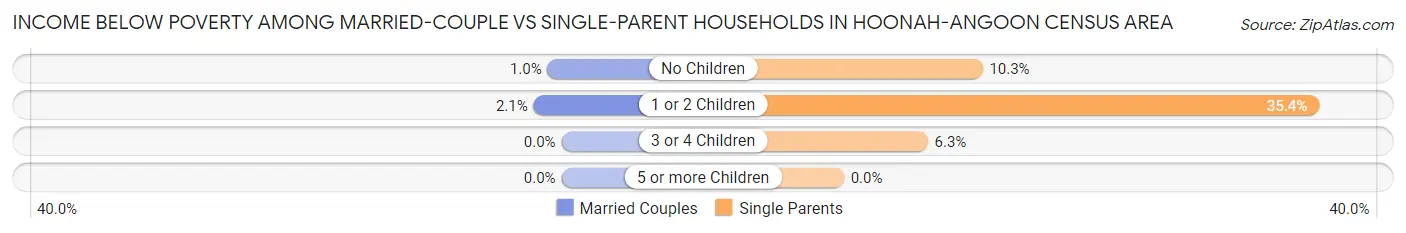
| Children | Married-Couple Families | Single-Parent Households |
| No Children | 3 (1.0%) | 6 (10.3%) |
| 1 or 2 Children | 1 (2.1%) | 17 (35.4%) |
| 3 or 4 Children | 0 (0.0%) | 1 (6.2%) |
| 5 or more Children | 0 (0.0%) | 0 (0.0%) |
| Total | 4 (1.1%) | 24 (19.1%) |
Employment Characteristics in Hoonah-Angoon Census Area
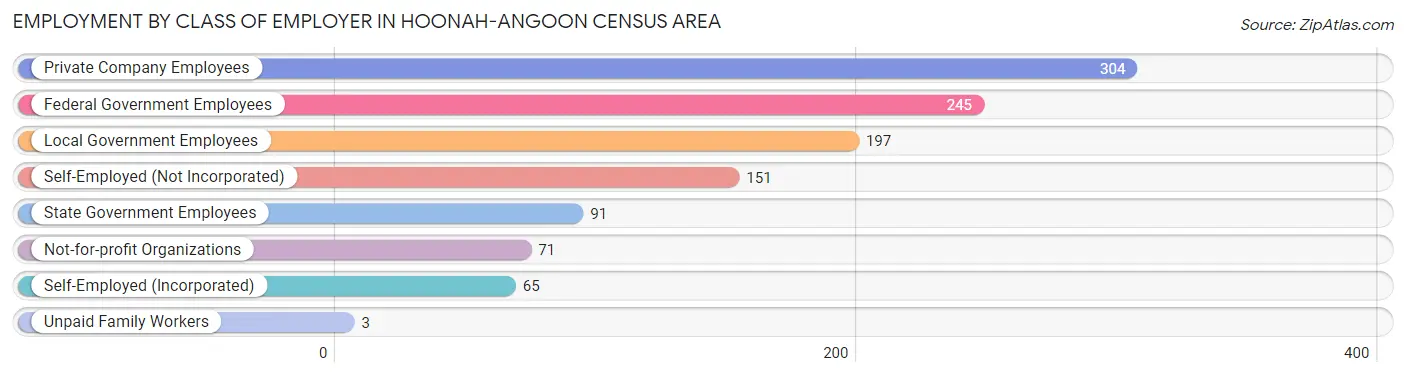
Employment by Class of Employer in Hoonah-Angoon Census Area
Among the 1,127 employed individuals in Hoonah-Angoon Census Area, private company employees (304 | 27.0%), federal government employees (245 | 21.7%), and local government employees (197 | 17.5%) make up the most common classes of employment.
| Employer Class | # Employees | % Employees |
| Private Company Employees | 304 | 27.0% |
| Self-Employed (Incorporated) | 65 | 5.8% |
| Self-Employed (Not Incorporated) | 151 | 13.4% |
| Not-for-profit Organizations | 71 | 6.3% |
| Local Government Employees | 197 | 17.5% |
| State Government Employees | 91 | 8.1% |
| Federal Government Employees | 245 | 21.7% |
| Unpaid Family Workers | 3 | 0.3% |
| Total | 1,127 | 100.0% |
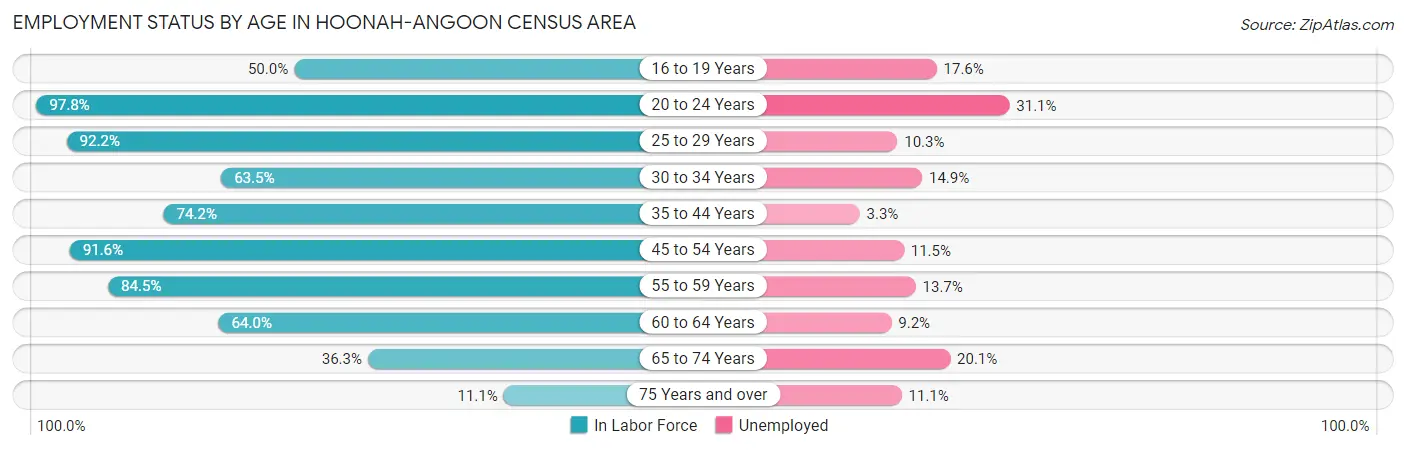
Employment Status by Age in Hoonah-Angoon Census Area
According to the labor force statistics for Hoonah-Angoon Census Area, out of the total population over 16 years of age (2,044), 66.8% or 1,365 individuals are in the labor force, with 14.0% or 191 of them unemployed. The age group with the highest labor force participation rate is 20 to 24 years, with 97.8% or 135 individuals in the labor force. Within the labor force, the 20 to 24 years age range has the highest percentage of unemployed individuals, with 31.1% or 42 of them being unemployed.
| Age Bracket | In Labor Force | Unemployed |
| 16 to 19 Years | 34 (50.0%) | 6 (17.6%) |
| 20 to 24 Years | 135 (97.8%) | 42 (31.1%) |
| 25 to 29 Years | 165 (92.2%) | 17 (10.3%) |
| 30 to 34 Years | 94 (63.5%) | 14 (14.9%) |
| 35 to 44 Years | 121 (74.2%) | 4 (3.3%) |
| 45 to 54 Years | 339 (91.6%) | 39 (11.5%) |
| 55 to 59 Years | 197 (84.5%) | 27 (13.7%) |
| 60 to 64 Years | 119 (64.0%) | 11 (9.2%) |
| 65 to 74 Years | 144 (36.3%) | 29 (20.1%) |
| 75 Years and over | 18 (11.1%) | 2 (11.1%) |
| Total | 1,365 (66.8%) | 191 (14.0%) |
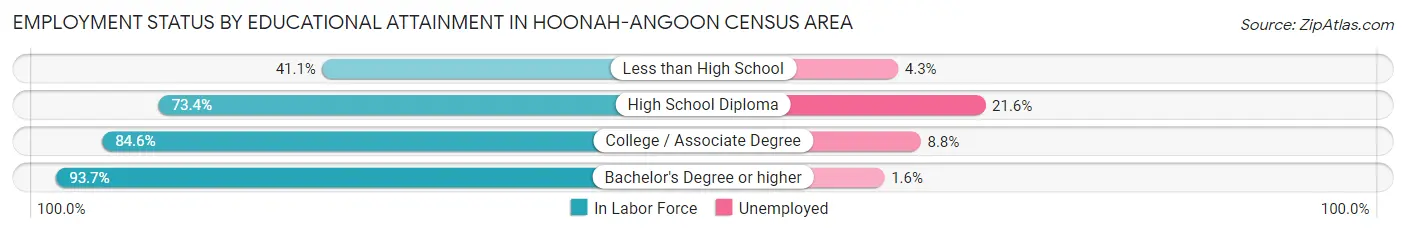
Employment Status by Educational Attainment in Hoonah-Angoon Census Area
According to labor force statistics for Hoonah-Angoon Census Area, 80.9% of individuals (1,035) out of the total population between 25 and 64 years of age (1,279) are in the labor force, with 10.8% or 112 of them being unemployed. The group with the highest labor force participation rate are those with the educational attainment of bachelor's degree or higher, with 93.7% or 313 individuals in the labor force. Within the labor force, individuals with high school diploma education have the highest percentage of unemployment, with 21.6% or 75 of them being unemployed.
| Educational Attainment | In Labor Force | Unemployed |
| Less than High School | 23 (41.1%) | 2 (4.3%) |
| High School Diploma | 347 (73.4%) | 102 (21.6%) |
| College / Associate Degree | 352 (84.6%) | 37 (8.8%) |
| Bachelor's Degree or higher | 313 (93.7%) | 5 (1.6%) |
| Total | 1,035 (80.9%) | 138 (10.8%) |
Employment Occupations by Sex in Hoonah-Angoon Census Area
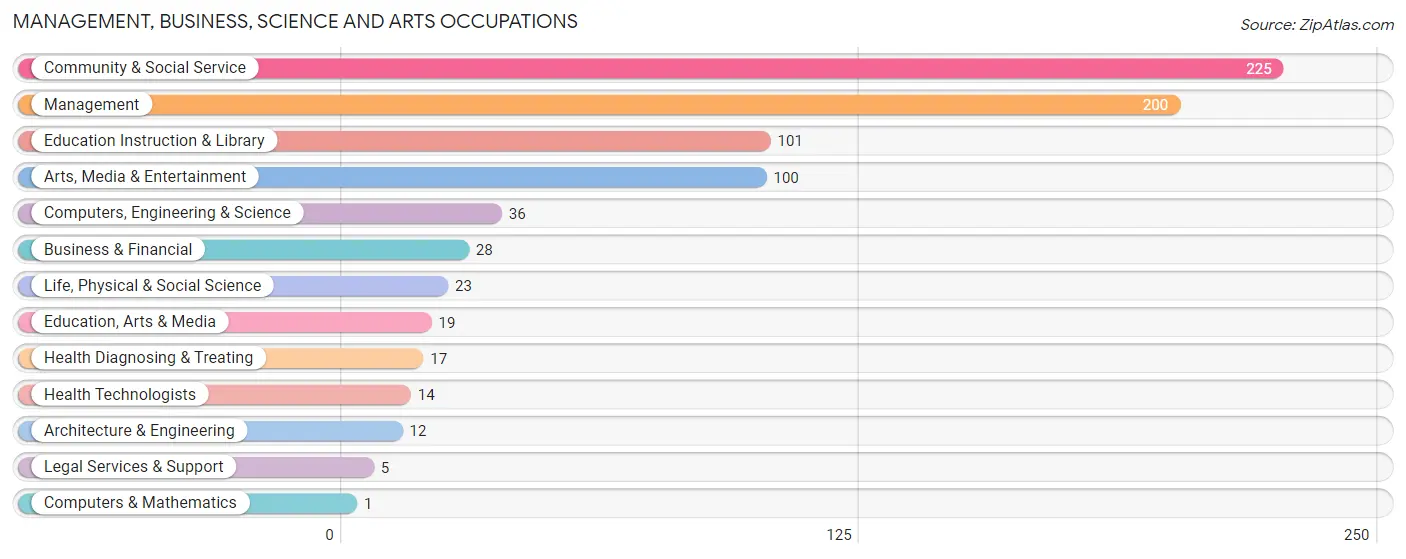
Management, Business, Science and Arts Occupations
The most common Management, Business, Science and Arts occupations in Hoonah-Angoon Census Area are Community & Social Service (225 | 19.2%), Management (200 | 17.0%), Education Instruction & Library (101 | 8.6%), Arts, Media & Entertainment (100 | 8.5%), and Computers, Engineering & Science (36 | 3.1%).
Management, Business, Science and Arts Occupations by Sex
Within the Management, Business, Science and Arts occupations in Hoonah-Angoon Census Area, the most male-oriented occupations are Computers & Mathematics (100.0%), Architecture & Engineering (83.3%), and Computers, Engineering & Science (80.6%), while the most female-oriented occupations are Legal Services & Support (100.0%), Health Technologists (100.0%), and Education Instruction & Library (93.1%).
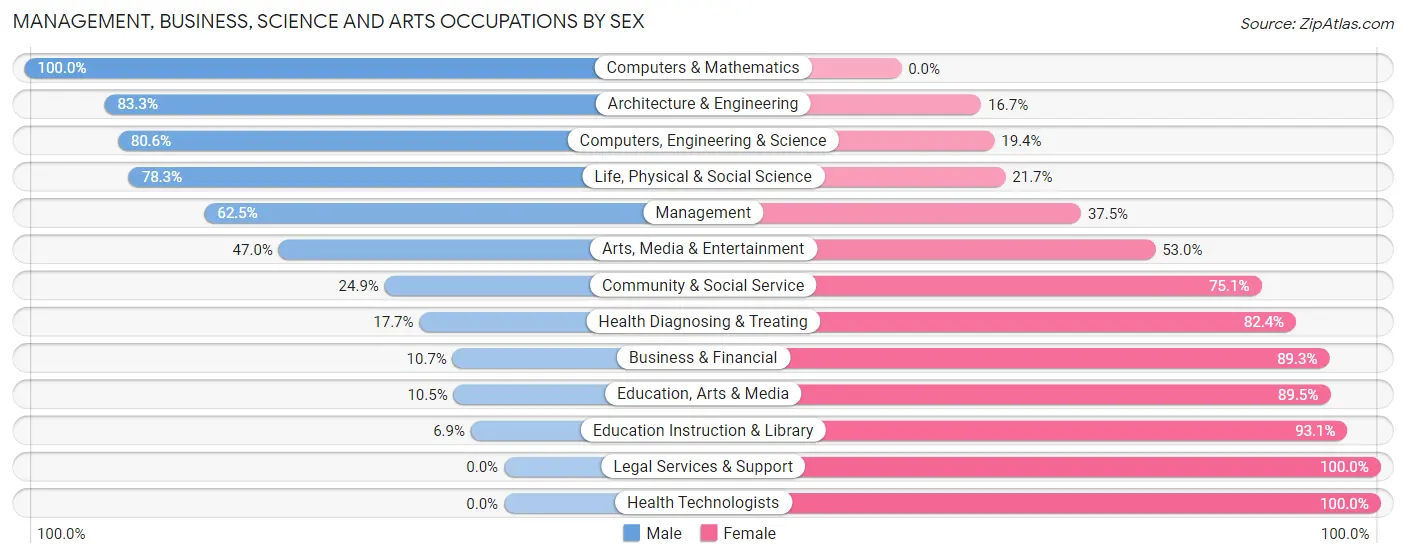
| Occupation | Male | Female |
| Management | 125 (62.5%) | 75 (37.5%) |
| Business & Financial | 3 (10.7%) | 25 (89.3%) |
| Computers, Engineering & Science | 29 (80.6%) | 7 (19.4%) |
| Computers & Mathematics | 1 (100.0%) | 0 (0.0%) |
| Architecture & Engineering | 10 (83.3%) | 2 (16.7%) |
| Life, Physical & Social Science | 18 (78.3%) | 5 (21.7%) |
| Community & Social Service | 56 (24.9%) | 169 (75.1%) |
| Education, Arts & Media | 2 (10.5%) | 17 (89.5%) |
| Legal Services & Support | 0 (0.0%) | 5 (100.0%) |
| Education Instruction & Library | 7 (6.9%) | 94 (93.1%) |
| Arts, Media & Entertainment | 47 (47.0%) | 53 (53.0%) |
| Health Diagnosing & Treating | 3 (17.6%) | 14 (82.4%) |
| Health Technologists | 0 (0.0%) | 14 (100.0%) |
| Total (Category) | 216 (42.7%) | 290 (57.3%) |
| Total (Overall) | 649 (55.2%) | 526 (44.8%) |
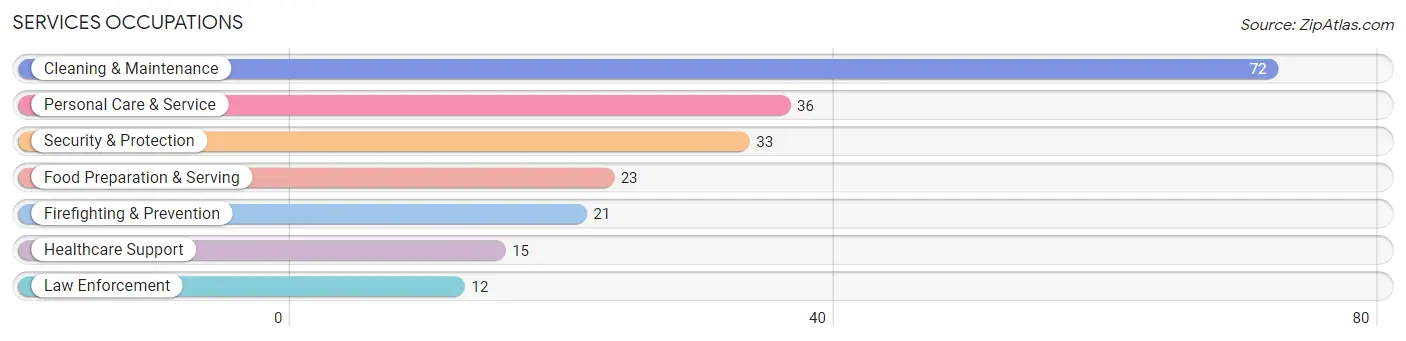
Services Occupations
The most common Services occupations in Hoonah-Angoon Census Area are Cleaning & Maintenance (72 | 6.1%), Personal Care & Service (36 | 3.1%), Security & Protection (33 | 2.8%), Food Preparation & Serving (23 | 2.0%), and Firefighting & Prevention (21 | 1.8%).
Services Occupations by Sex
Within the Services occupations in Hoonah-Angoon Census Area, the most male-oriented occupations are Law Enforcement (100.0%), Security & Protection (69.7%), and Cleaning & Maintenance (61.1%), while the most female-oriented occupations are Food Preparation & Serving (91.3%), Firefighting & Prevention (47.6%), and Healthcare Support (46.7%).
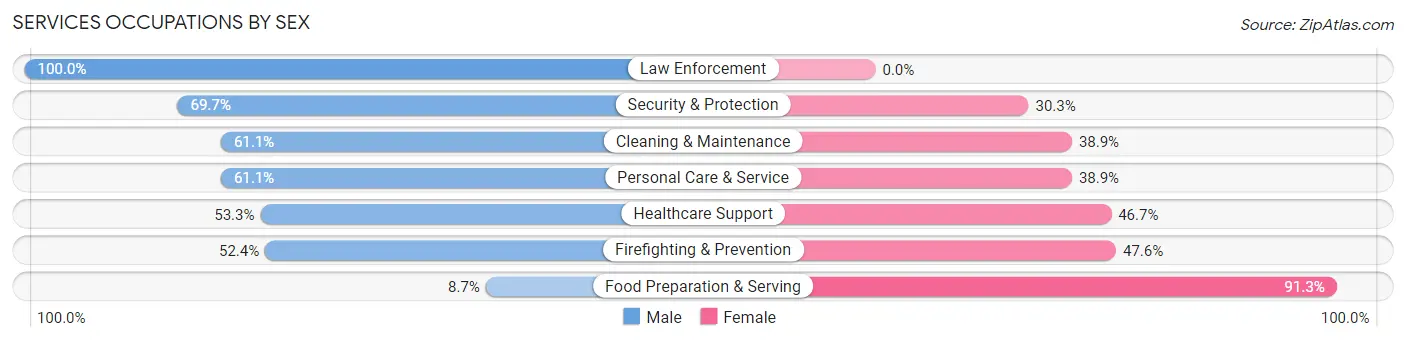
| Occupation | Male | Female |
| Healthcare Support | 8 (53.3%) | 7 (46.7%) |
| Security & Protection | 23 (69.7%) | 10 (30.3%) |
| Firefighting & Prevention | 11 (52.4%) | 10 (47.6%) |
| Law Enforcement | 12 (100.0%) | 0 (0.0%) |
| Food Preparation & Serving | 2 (8.7%) | 21 (91.3%) |
| Cleaning & Maintenance | 44 (61.1%) | 28 (38.9%) |
| Personal Care & Service | 22 (61.1%) | 14 (38.9%) |
| Total (Category) | 99 (55.3%) | 80 (44.7%) |
| Total (Overall) | 649 (55.2%) | 526 (44.8%) |
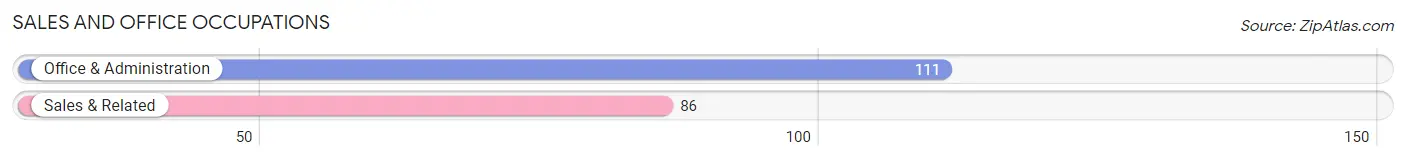
Sales and Office Occupations
The most common Sales and Office occupations in Hoonah-Angoon Census Area are Office & Administration (111 | 9.5%), and Sales & Related (86 | 7.3%).
Sales and Office Occupations by Sex
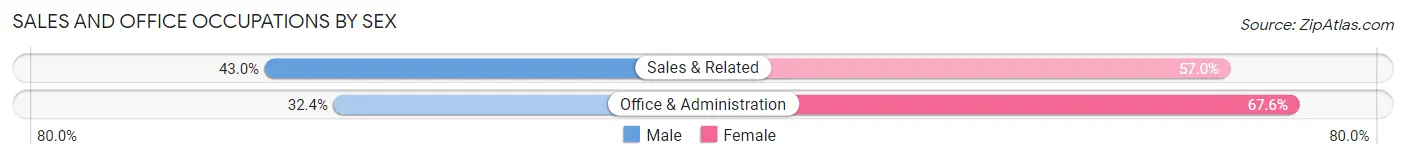
| Occupation | Male | Female |
| Sales & Related | 37 (43.0%) | 49 (57.0%) |
| Office & Administration | 36 (32.4%) | 75 (67.6%) |
| Total (Category) | 73 (37.1%) | 124 (62.9%) |
| Total (Overall) | 649 (55.2%) | 526 (44.8%) |
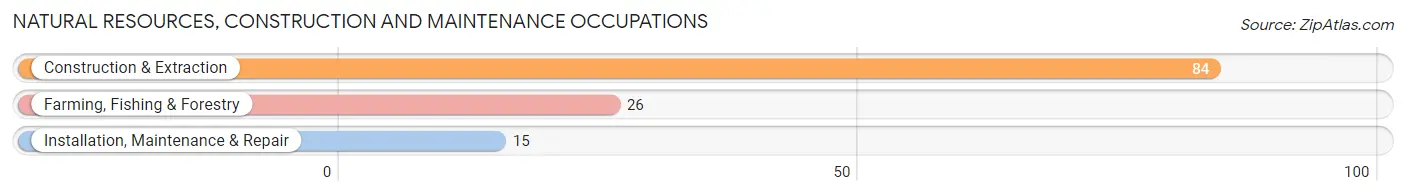
Natural Resources, Construction and Maintenance Occupations
The most common Natural Resources, Construction and Maintenance occupations in Hoonah-Angoon Census Area are Construction & Extraction (84 | 7.1%), Farming, Fishing & Forestry (26 | 2.2%), and Installation, Maintenance & Repair (15 | 1.3%).
Natural Resources, Construction and Maintenance Occupations by Sex
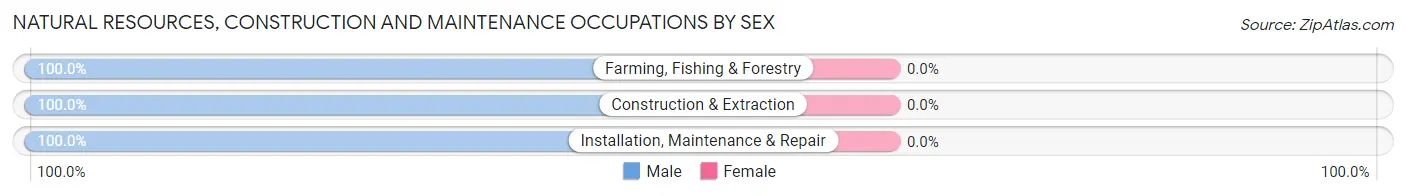
| Occupation | Male | Female |
| Farming, Fishing & Forestry | 26 (100.0%) | 0 (0.0%) |
| Construction & Extraction | 84 (100.0%) | 0 (0.0%) |
| Installation, Maintenance & Repair | 15 (100.0%) | 0 (0.0%) |
| Total (Category) | 125 (100.0%) | 0 (0.0%) |
| Total (Overall) | 649 (55.2%) | 526 (44.8%) |
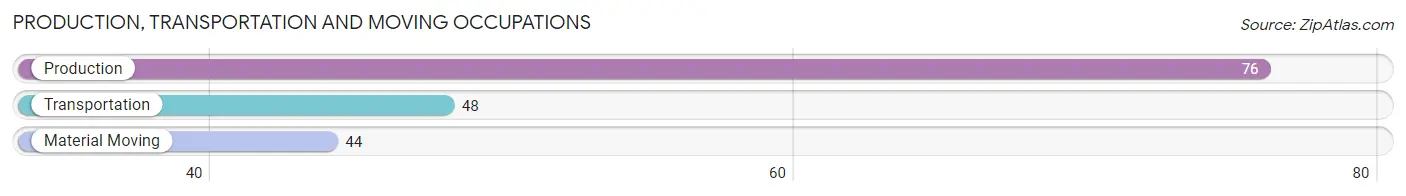
Production, Transportation and Moving Occupations
The most common Production, Transportation and Moving occupations in Hoonah-Angoon Census Area are Production (76 | 6.5%), Transportation (48 | 4.1%), and Material Moving (44 | 3.7%).
Production, Transportation and Moving Occupations by Sex
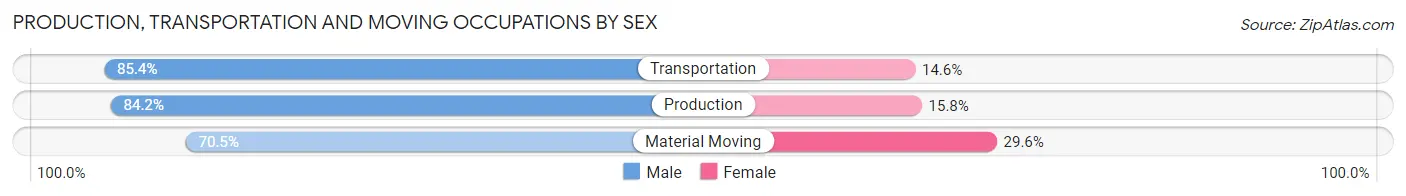
| Occupation | Male | Female |
| Production | 64 (84.2%) | 12 (15.8%) |
| Transportation | 41 (85.4%) | 7 (14.6%) |
| Material Moving | 31 (70.5%) | 13 (29.5%) |
| Total (Category) | 136 (80.9%) | 32 (19.1%) |
| Total (Overall) | 649 (55.2%) | 526 (44.8%) |
Employment Industries by Sex in Hoonah-Angoon Census Area
Employment Industries in Hoonah-Angoon Census Area
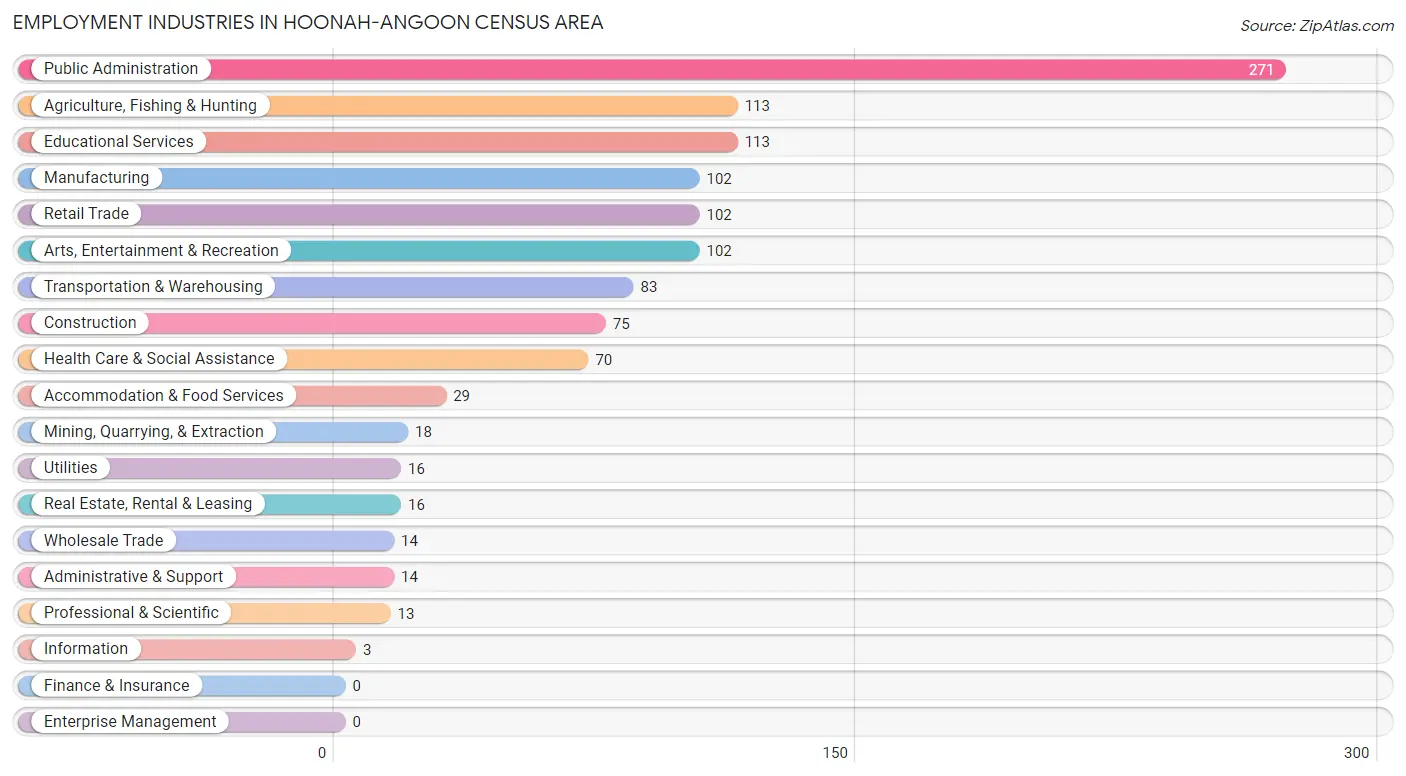
The major employment industries in Hoonah-Angoon Census Area include Public Administration (271 | 23.1%), Agriculture, Fishing & Hunting (113 | 9.6%), Educational Services (113 | 9.6%), Manufacturing (102 | 8.7%), and Retail Trade (102 | 8.7%).
Employment Industries by Sex in Hoonah-Angoon Census Area
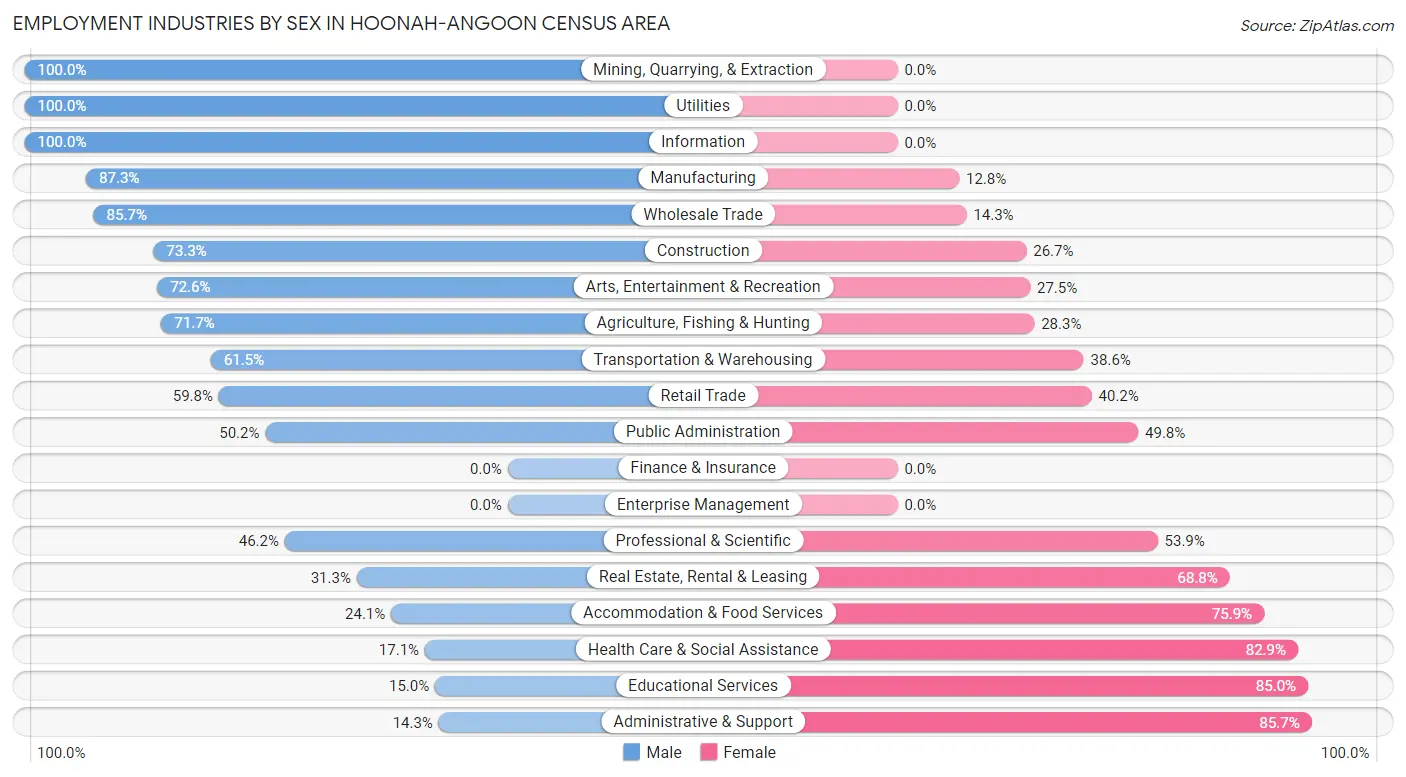
The Hoonah-Angoon Census Area industries that see more men than women are Mining, Quarrying, & Extraction (100.0%), Utilities (100.0%), and Information (100.0%), whereas the industries that tend to have a higher number of women are Administrative & Support (85.7%), Educational Services (85.0%), and Health Care & Social Assistance (82.9%).
| Industry | Male | Female |
| Agriculture, Fishing & Hunting | 81 (71.7%) | 32 (28.3%) |
| Mining, Quarrying, & Extraction | 18 (100.0%) | 0 (0.0%) |
| Construction | 55 (73.3%) | 20 (26.7%) |
| Manufacturing | 89 (87.3%) | 13 (12.8%) |
| Wholesale Trade | 12 (85.7%) | 2 (14.3%) |
| Retail Trade | 61 (59.8%) | 41 (40.2%) |
| Transportation & Warehousing | 51 (61.5%) | 32 (38.6%) |
| Utilities | 16 (100.0%) | 0 (0.0%) |
| Information | 3 (100.0%) | 0 (0.0%) |
| Finance & Insurance | 0 (0.0%) | 0 (0.0%) |
| Real Estate, Rental & Leasing | 5 (31.2%) | 11 (68.8%) |
| Professional & Scientific | 6 (46.2%) | 7 (53.8%) |
| Enterprise Management | 0 (0.0%) | 0 (0.0%) |
| Administrative & Support | 2 (14.3%) | 12 (85.7%) |
| Educational Services | 17 (15.0%) | 96 (85.0%) |
| Health Care & Social Assistance | 12 (17.1%) | 58 (82.9%) |
| Arts, Entertainment & Recreation | 74 (72.6%) | 28 (27.5%) |
| Accommodation & Food Services | 7 (24.1%) | 22 (75.9%) |
| Public Administration | 136 (50.2%) | 135 (49.8%) |
| Total | 649 (55.2%) | 526 (44.8%) |
Education in Hoonah-Angoon Census Area
School Enrollment in Hoonah-Angoon Census Area
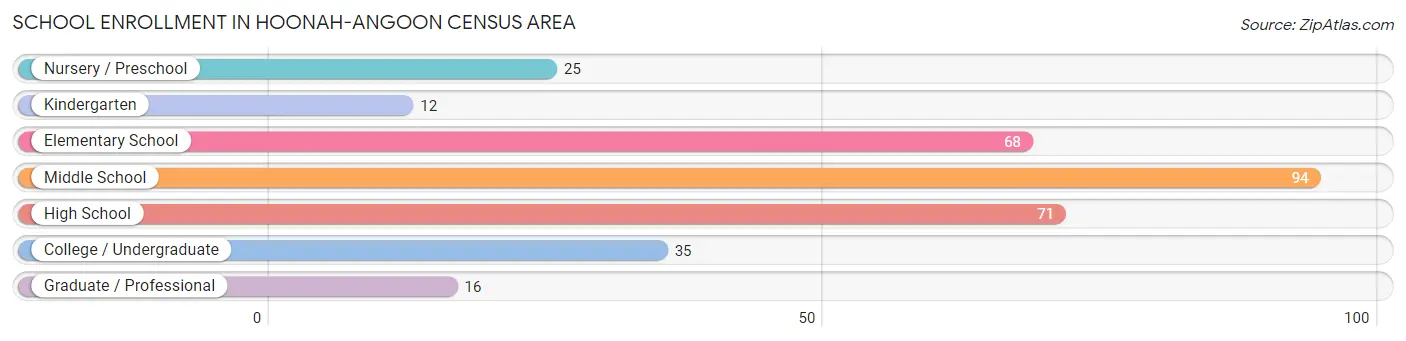
The most common levels of schooling among the 321 students in Hoonah-Angoon Census Area are middle school (94 | 29.3%), high school (71 | 22.1%), and elementary school (68 | 21.2%).
| School Level | # Students | % Students |
| Nursery / Preschool | 25 | 7.8% |
| Kindergarten | 12 | 3.7% |
| Elementary School | 68 | 21.2% |
| Middle School | 94 | 29.3% |
| High School | 71 | 22.1% |
| College / Undergraduate | 35 | 10.9% |
| Graduate / Professional | 16 | 5.0% |
| Total | 321 | 100.0% |
School Enrollment by Age by Funding Source in Hoonah-Angoon Census Area
Out of a total of 321 students who are enrolled in schools in Hoonah-Angoon Census Area, 48 (15.0%) attend a private institution, while the remaining 273 (85.0%) are enrolled in public schools. The age group of 35 years and over has the highest likelihood of being enrolled in private schools, with 8 (25.8% in the age bracket) enrolled. Conversely, the age group of 18 to 19 year olds has the lowest likelihood of being enrolled in a private school, with 26 (100.0% in the age bracket) attending a public institution.
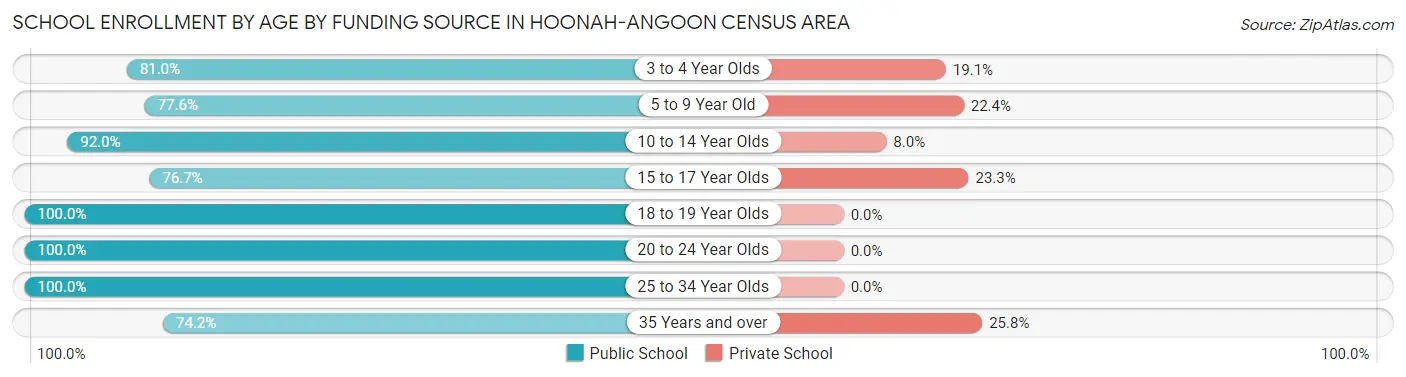
| Age Bracket | Public School | Private School |
| 3 to 4 Year Olds | 17 (80.9%) | 4 (19.1%) |
| 5 to 9 Year Old | 59 (77.6%) | 17 (22.4%) |
| 10 to 14 Year Olds | 104 (92.0%) | 9 (8.0%) |
| 15 to 17 Year Olds | 33 (76.7%) | 10 (23.3%) |
| 18 to 19 Year Olds | 26 (100.0%) | 0 (0.0%) |
| 20 to 24 Year Olds | 4 (100.0%) | 0 (0.0%) |
| 25 to 34 Year Olds | 7 (100.0%) | 0 (0.0%) |
| 35 Years and over | 23 (74.2%) | 8 (25.8%) |
| Total | 273 (85.0%) | 48 (15.0%) |
Educational Attainment by Field of Study in Hoonah-Angoon Census Area
Education (115 | 20.3%), bio, nature & agricultural (74 | 13.1%), social sciences (73 | 12.9%), liberal arts & history (56 | 9.9%), and business (54 | 9.5%) are the most common fields of study among 566 individuals in Hoonah-Angoon Census Area who have obtained a bachelor's degree or higher.
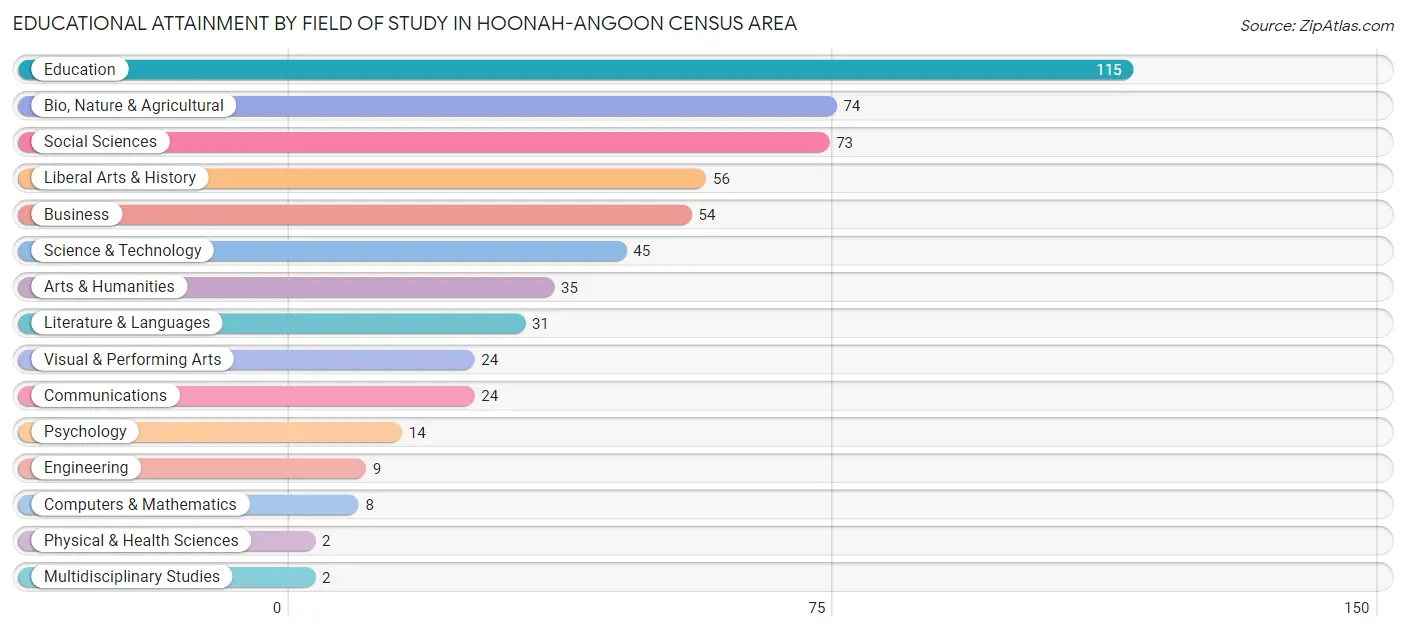
| Field of Study | # Graduates | % Graduates |
| Computers & Mathematics | 8 | 1.4% |
| Bio, Nature & Agricultural | 74 | 13.1% |
| Physical & Health Sciences | 2 | 0.4% |
| Psychology | 14 | 2.5% |
| Social Sciences | 73 | 12.9% |
| Engineering | 9 | 1.6% |
| Multidisciplinary Studies | 2 | 0.4% |
| Science & Technology | 45 | 8.0% |
| Business | 54 | 9.5% |
| Education | 115 | 20.3% |
| Literature & Languages | 31 | 5.5% |
| Liberal Arts & History | 56 | 9.9% |
| Visual & Performing Arts | 24 | 4.2% |
| Communications | 24 | 4.2% |
| Arts & Humanities | 35 | 6.2% |
| Total | 566 | 100.0% |
Transportation & Commute in Hoonah-Angoon Census Area
Vehicle Availability by Sex in Hoonah-Angoon Census Area
The most prevalent vehicle ownership categories in Hoonah-Angoon Census Area are males with 1 vehicle (146, accounting for 29.3%) and females with 1 vehicle (143, making up 29.7%).
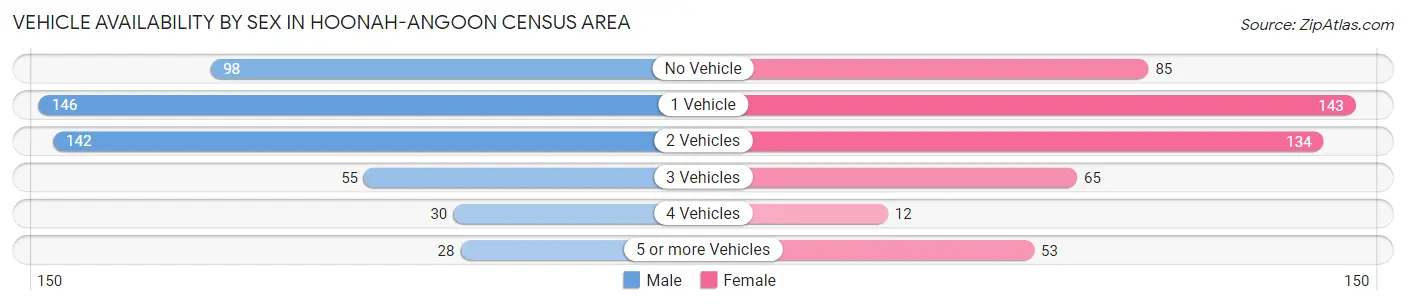
| Vehicles Available | Male | Female |
| No Vehicle | 98 (19.6%) | 85 (17.3%) |
| 1 Vehicle | 146 (29.3%) | 143 (29.1%) |
| 2 Vehicles | 142 (28.5%) | 134 (27.2%) |
| 3 Vehicles | 55 (11.0%) | 65 (13.2%) |
| 4 Vehicles | 30 (6.0%) | 12 (2.4%) |
| 5 or more Vehicles | 28 (5.6%) | 53 (10.8%) |
| Total | 499 (100.0%) | 492 (100.0%) |
Commute Time in Hoonah-Angoon Census Area
The most frequently occuring commute durations in Hoonah-Angoon Census Area are 5 to 9 minutes (292 commuters, 27.5%), less than 5 minutes (290 commuters, 27.3%), and 10 to 14 minutes (188 commuters, 17.7%).
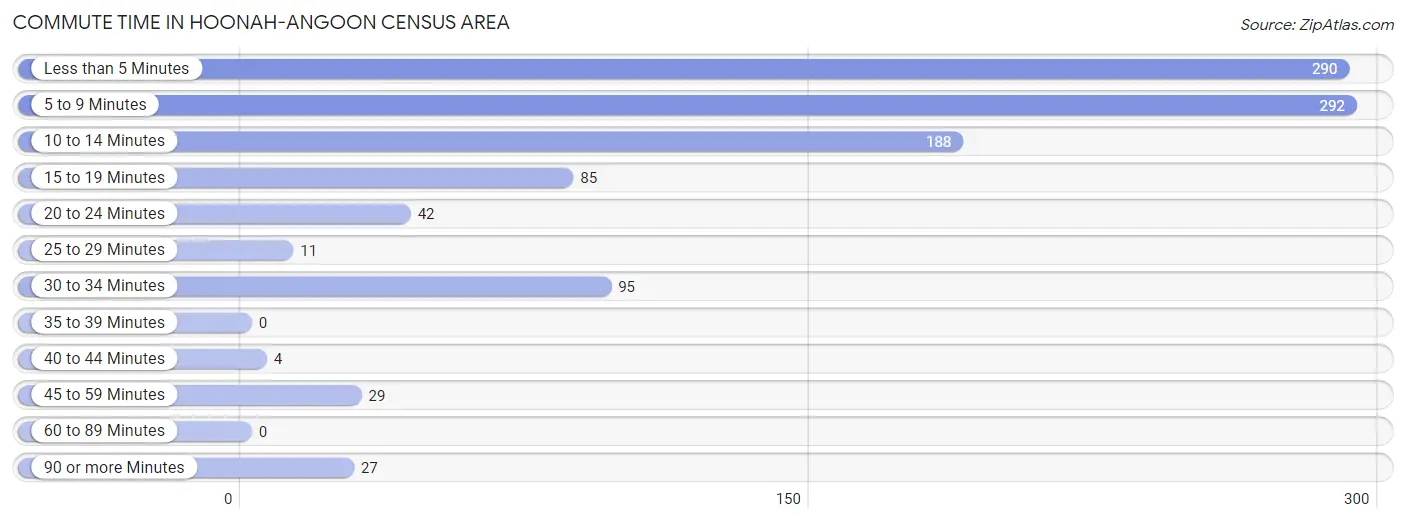
| Commute Time | # Commuters | % Commuters |
| Less than 5 Minutes | 290 | 27.3% |
| 5 to 9 Minutes | 292 | 27.5% |
| 10 to 14 Minutes | 188 | 17.7% |
| 15 to 19 Minutes | 85 | 8.0% |
| 20 to 24 Minutes | 42 | 4.0% |
| 25 to 29 Minutes | 11 | 1.0% |
| 30 to 34 Minutes | 95 | 8.9% |
| 35 to 39 Minutes | 0 | 0.0% |
| 40 to 44 Minutes | 4 | 0.4% |
| 45 to 59 Minutes | 29 | 2.7% |
| 60 to 89 Minutes | 0 | 0.0% |
| 90 or more Minutes | 27 | 2.5% |
Commute Time by Sex in Hoonah-Angoon Census Area
The most common commute times in Hoonah-Angoon Census Area are less than 5 minutes (190 commuters, 32.2%) for males and 5 to 9 minutes (136 commuters, 28.8%) for females.
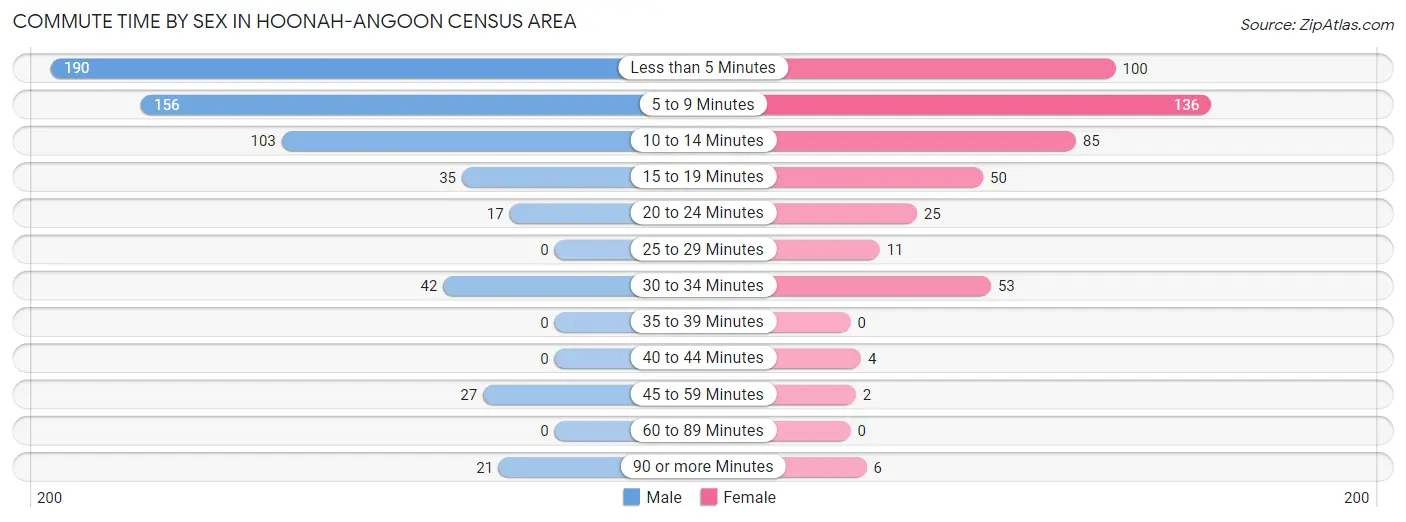
| Commute Time | Male | Female |
| Less than 5 Minutes | 190 (32.2%) | 100 (21.2%) |
| 5 to 9 Minutes | 156 (26.4%) | 136 (28.8%) |
| 10 to 14 Minutes | 103 (17.4%) | 85 (18.0%) |
| 15 to 19 Minutes | 35 (5.9%) | 50 (10.6%) |
| 20 to 24 Minutes | 17 (2.9%) | 25 (5.3%) |
| 25 to 29 Minutes | 0 (0.0%) | 11 (2.3%) |
| 30 to 34 Minutes | 42 (7.1%) | 53 (11.2%) |
| 35 to 39 Minutes | 0 (0.0%) | 0 (0.0%) |
| 40 to 44 Minutes | 0 (0.0%) | 4 (0.9%) |
| 45 to 59 Minutes | 27 (4.6%) | 2 (0.4%) |
| 60 to 89 Minutes | 0 (0.0%) | 0 (0.0%) |
| 90 or more Minutes | 21 (3.5%) | 6 (1.3%) |
Time of Departure to Work by Sex in Hoonah-Angoon Census Area
The most frequent times of departure to work in Hoonah-Angoon Census Area are 7:30 AM to 7:59 AM (147, 24.9%) for males and 8:00 AM to 8:29 AM (111, 23.5%) for females.
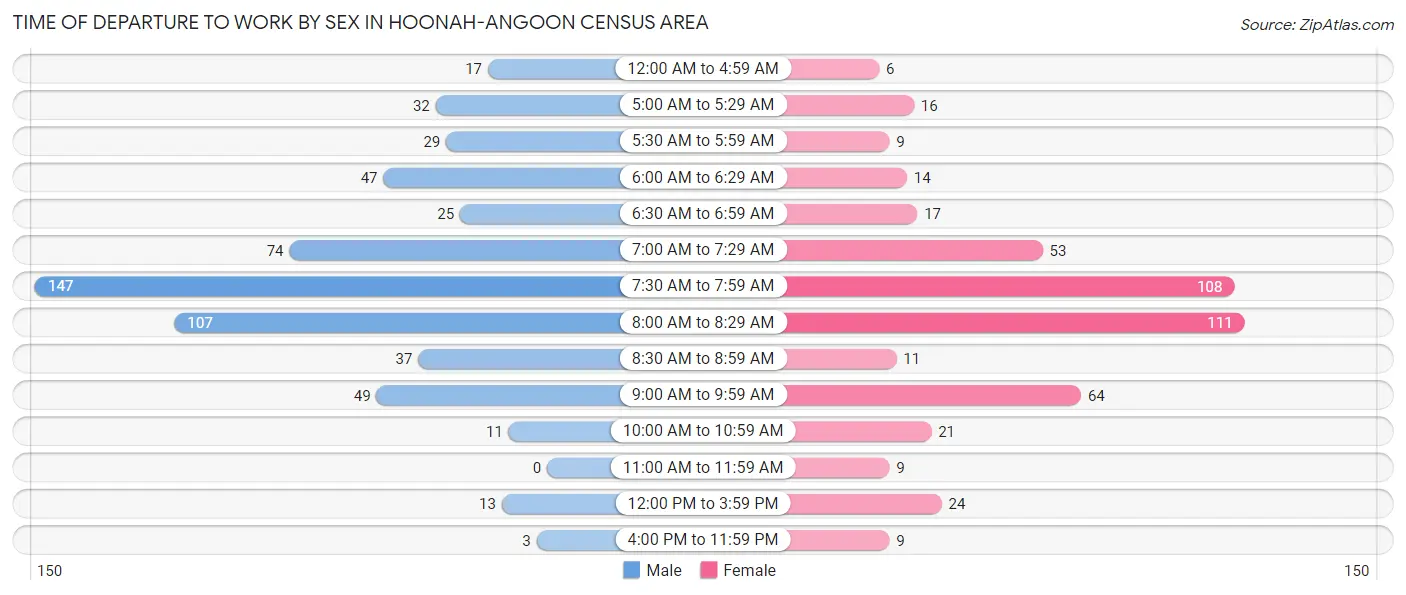
| Time of Departure | Male | Female |
| 12:00 AM to 4:59 AM | 17 (2.9%) | 6 (1.3%) |
| 5:00 AM to 5:29 AM | 32 (5.4%) | 16 (3.4%) |
| 5:30 AM to 5:59 AM | 29 (4.9%) | 9 (1.9%) |
| 6:00 AM to 6:29 AM | 47 (8.0%) | 14 (3.0%) |
| 6:30 AM to 6:59 AM | 25 (4.2%) | 17 (3.6%) |
| 7:00 AM to 7:29 AM | 74 (12.5%) | 53 (11.2%) |
| 7:30 AM to 7:59 AM | 147 (24.9%) | 108 (22.9%) |
| 8:00 AM to 8:29 AM | 107 (18.1%) | 111 (23.5%) |
| 8:30 AM to 8:59 AM | 37 (6.3%) | 11 (2.3%) |
| 9:00 AM to 9:59 AM | 49 (8.3%) | 64 (13.6%) |
| 10:00 AM to 10:59 AM | 11 (1.9%) | 21 (4.4%) |
| 11:00 AM to 11:59 AM | 0 (0.0%) | 9 (1.9%) |
| 12:00 PM to 3:59 PM | 13 (2.2%) | 24 (5.1%) |
| 4:00 PM to 11:59 PM | 3 (0.5%) | 9 (1.9%) |
| Total | 591 (100.0%) | 472 (100.0%) |
Housing Occupancy in Hoonah-Angoon Census Area
Occupancy by Ownership in Hoonah-Angoon Census Area
Of the total 867 dwellings in Hoonah-Angoon Census Area, owner-occupied units account for 646 (74.5%), while renter-occupied units make up 221 (25.5%).
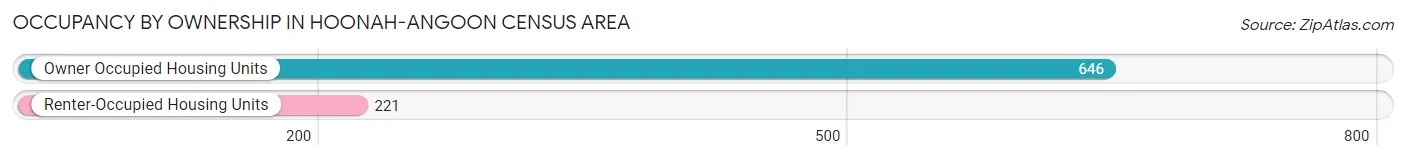
| Occupancy | # Housing Units | % Housing Units |
| Owner Occupied Housing Units | 646 | 74.5% |
| Renter-Occupied Housing Units | 221 | 25.5% |
| Total Occupied Housing Units | 867 | 100.0% |
Occupancy by Household Size in Hoonah-Angoon Census Area
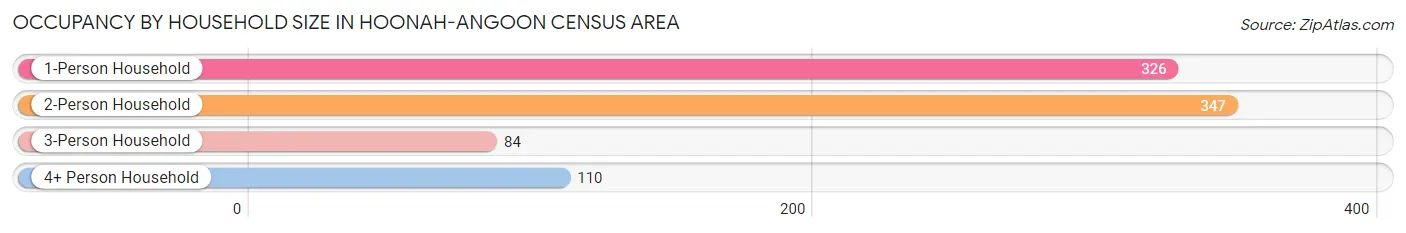
| Household Size | # Housing Units | % Housing Units |
| 1-Person Household | 326 | 37.6% |
| 2-Person Household | 347 | 40.0% |
| 3-Person Household | 84 | 9.7% |
| 4+ Person Household | 110 | 12.7% |
| Total Housing Units | 867 | 100.0% |
Occupancy by Ownership by Household Size in Hoonah-Angoon Census Area
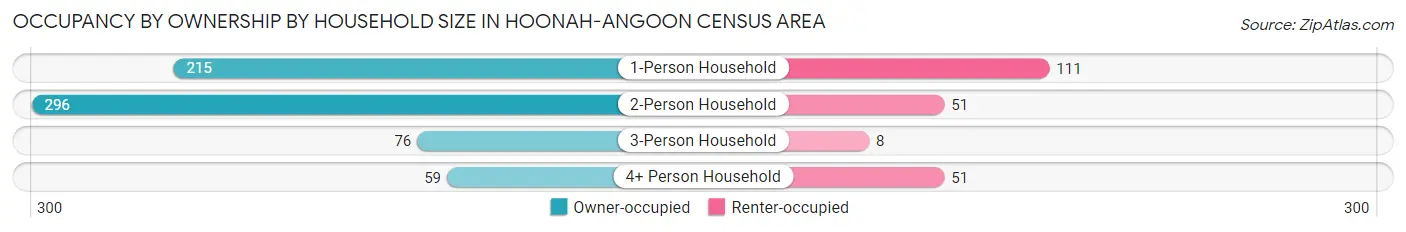
| Household Size | Owner-occupied | Renter-occupied |
| 1-Person Household | 215 (65.9%) | 111 (34.1%) |
| 2-Person Household | 296 (85.3%) | 51 (14.7%) |
| 3-Person Household | 76 (90.5%) | 8 (9.5%) |
| 4+ Person Household | 59 (53.6%) | 51 (46.4%) |
| Total Housing Units | 646 (74.5%) | 221 (25.5%) |
Occupancy by Educational Attainment in Hoonah-Angoon Census Area
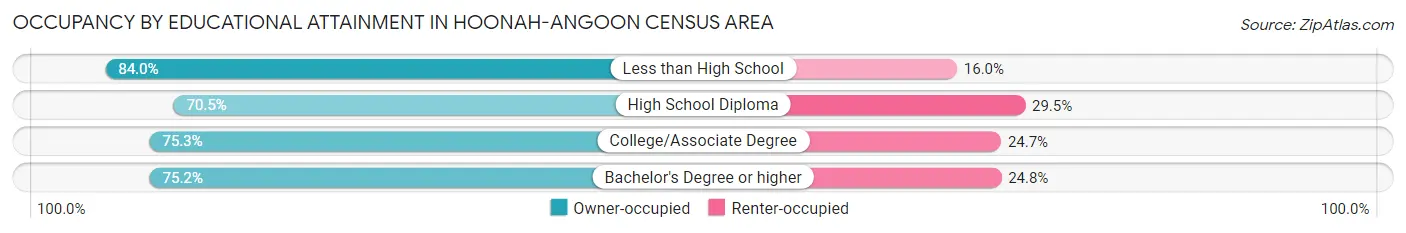
| Household Size | Owner-occupied | Renter-occupied |
| Less than High School | 63 (84.0%) | 12 (16.0%) |
| High School Diploma | 191 (70.5%) | 80 (29.5%) |
| College/Associate Degree | 216 (75.3%) | 71 (24.7%) |
| Bachelor's Degree or higher | 176 (75.2%) | 58 (24.8%) |
Occupancy by Age of Householder in Hoonah-Angoon Census Area
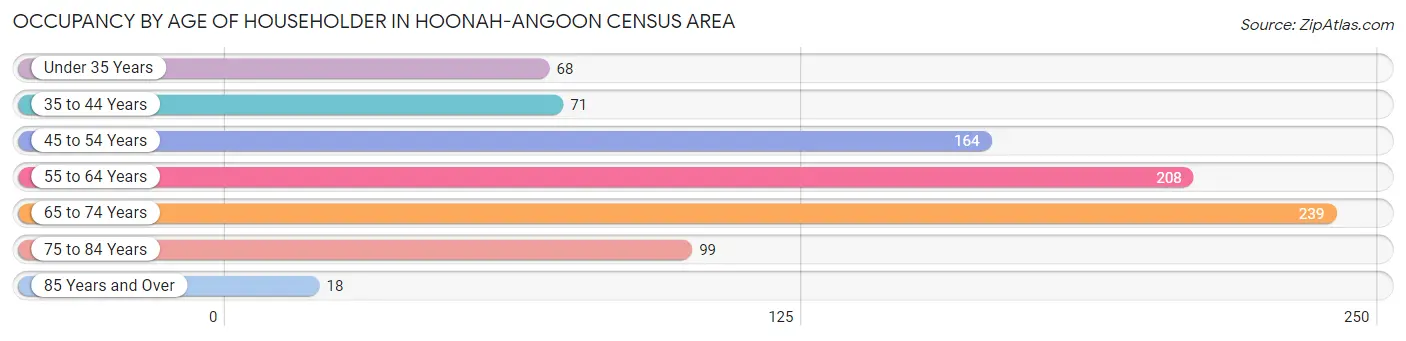
| Age Bracket | # Households | % Households |
| Under 35 Years | 68 | 7.8% |
| 35 to 44 Years | 71 | 8.2% |
| 45 to 54 Years | 164 | 18.9% |
| 55 to 64 Years | 208 | 24.0% |
| 65 to 74 Years | 239 | 27.6% |
| 75 to 84 Years | 99 | 11.4% |
| 85 Years and Over | 18 | 2.1% |
| Total | 867 | 100.0% |
Housing Finances in Hoonah-Angoon Census Area
Median Income by Occupancy in Hoonah-Angoon Census Area
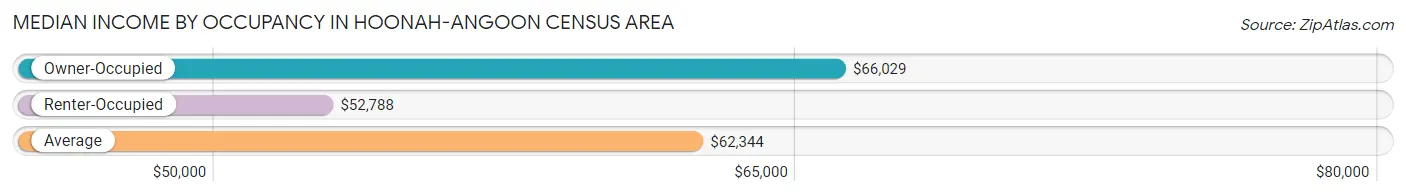
| Occupancy Type | # Households | Median Income |
| Owner-Occupied | 646 (74.5%) | $66,029 |
| Renter-Occupied | 221 (25.5%) | $52,788 |
| Average | 867 (100.0%) | $62,344 |
Occupancy by Householder Income Bracket in Hoonah-Angoon Census Area
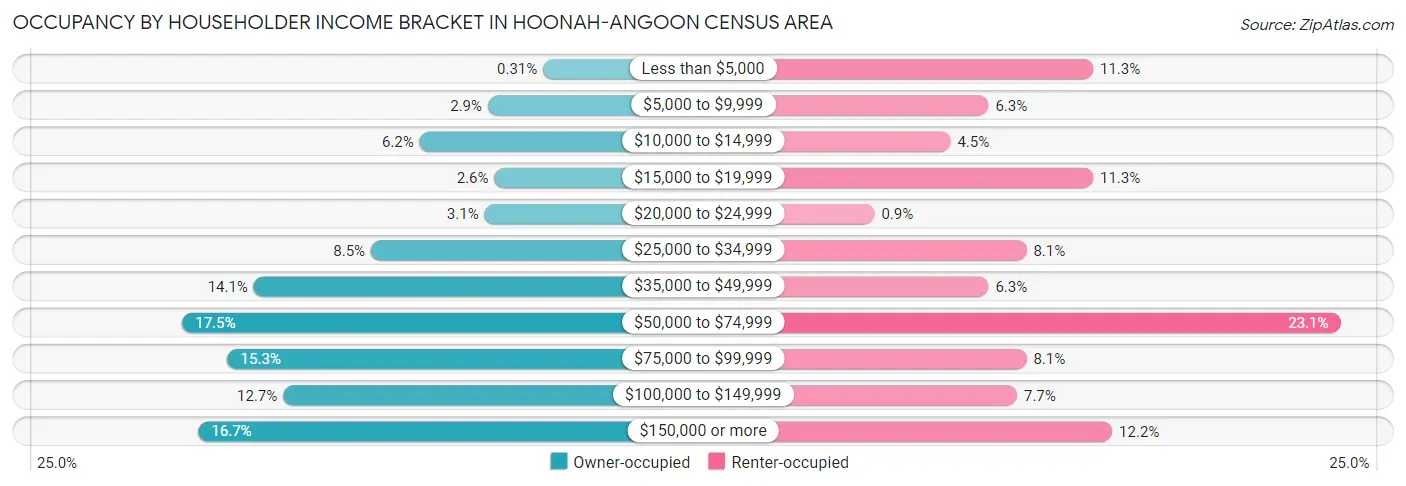
| Income Bracket | Owner-occupied | Renter-occupied |
| Less than $5,000 | 2 (0.3%) | 25 (11.3%) |
| $5,000 to $9,999 | 19 (2.9%) | 14 (6.3%) |
| $10,000 to $14,999 | 40 (6.2%) | 10 (4.5%) |
| $15,000 to $19,999 | 17 (2.6%) | 25 (11.3%) |
| $20,000 to $24,999 | 20 (3.1%) | 2 (0.9%) |
| $25,000 to $34,999 | 55 (8.5%) | 18 (8.1%) |
| $35,000 to $49,999 | 91 (14.1%) | 14 (6.3%) |
| $50,000 to $74,999 | 113 (17.5%) | 51 (23.1%) |
| $75,000 to $99,999 | 99 (15.3%) | 18 (8.1%) |
| $100,000 to $149,999 | 82 (12.7%) | 17 (7.7%) |
| $150,000 or more | 108 (16.7%) | 27 (12.2%) |
| Total | 646 (100.0%) | 221 (100.0%) |
Monthly Housing Cost Tiers in Hoonah-Angoon Census Area
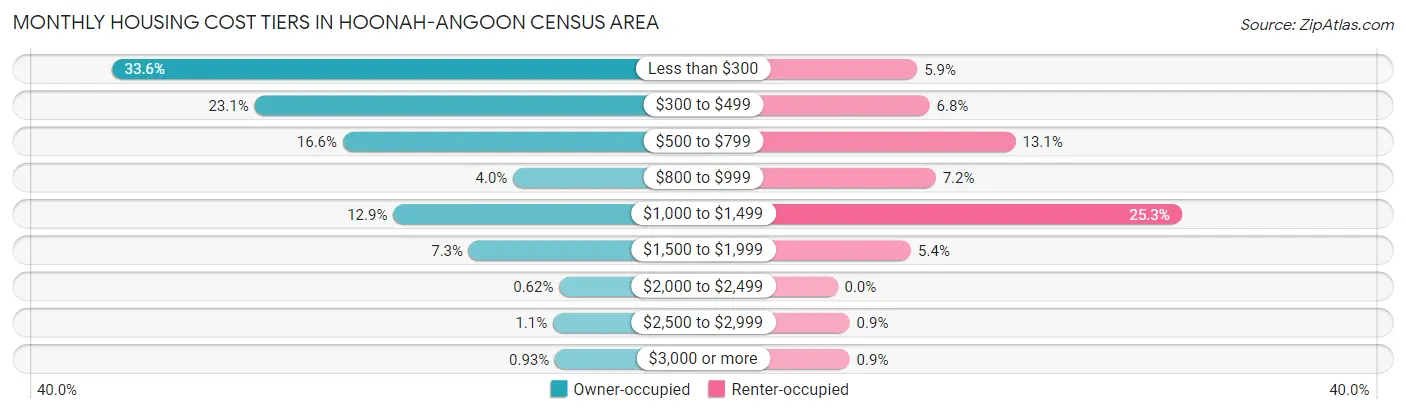
| Monthly Cost | Owner-occupied | Renter-occupied |
| Less than $300 | 217 (33.6%) | 13 (5.9%) |
| $300 to $499 | 149 (23.1%) | 15 (6.8%) |
| $500 to $799 | 107 (16.6%) | 29 (13.1%) |
| $800 to $999 | 26 (4.0%) | 16 (7.2%) |
| $1,000 to $1,499 | 83 (12.9%) | 56 (25.3%) |
| $1,500 to $1,999 | 47 (7.3%) | 12 (5.4%) |
| $2,000 to $2,499 | 4 (0.6%) | 0 (0.0%) |
| $2,500 to $2,999 | 7 (1.1%) | 2 (0.9%) |
| $3,000 or more | 6 (0.9%) | 2 (0.9%) |
| Total | 646 (100.0%) | 221 (100.0%) |
Physical Housing Characteristics in Hoonah-Angoon Census Area
Housing Structures in Hoonah-Angoon Census Area
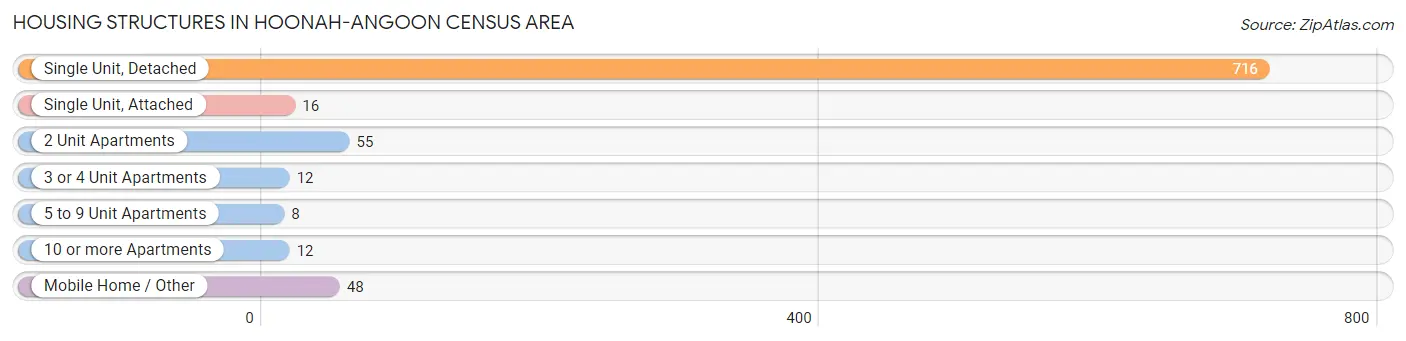
| Structure Type | # Housing Units | % Housing Units |
| Single Unit, Detached | 716 | 82.6% |
| Single Unit, Attached | 16 | 1.8% |
| 2 Unit Apartments | 55 | 6.3% |
| 3 or 4 Unit Apartments | 12 | 1.4% |
| 5 to 9 Unit Apartments | 8 | 0.9% |
| 10 or more Apartments | 12 | 1.4% |
| Mobile Home / Other | 48 | 5.5% |
| Total | 867 | 100.0% |
Housing Structures by Occupancy in Hoonah-Angoon Census Area
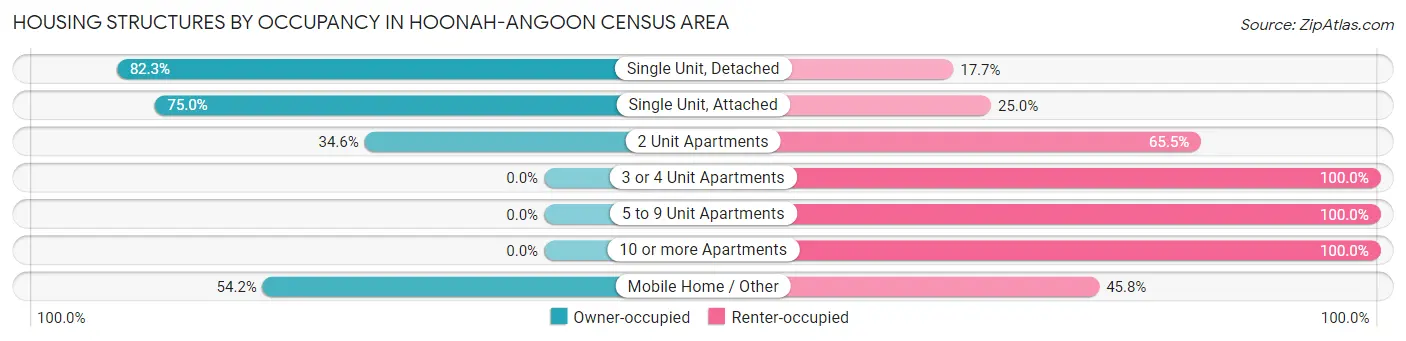
| Structure Type | Owner-occupied | Renter-occupied |
| Single Unit, Detached | 589 (82.3%) | 127 (17.7%) |
| Single Unit, Attached | 12 (75.0%) | 4 (25.0%) |
| 2 Unit Apartments | 19 (34.5%) | 36 (65.4%) |
| 3 or 4 Unit Apartments | 0 (0.0%) | 12 (100.0%) |
| 5 to 9 Unit Apartments | 0 (0.0%) | 8 (100.0%) |
| 10 or more Apartments | 0 (0.0%) | 12 (100.0%) |
| Mobile Home / Other | 26 (54.2%) | 22 (45.8%) |
| Total | 646 (74.5%) | 221 (25.5%) |
Housing Structures by Number of Rooms in Hoonah-Angoon Census Area
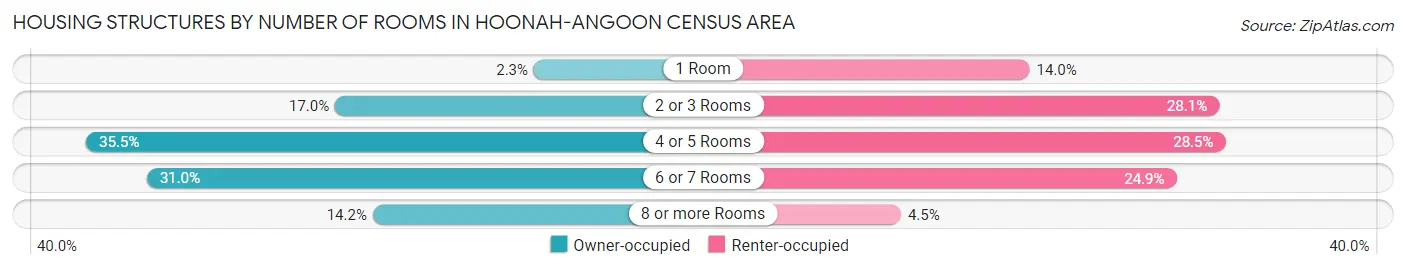
| Number of Rooms | Owner-occupied | Renter-occupied |
| 1 Room | 15 (2.3%) | 31 (14.0%) |
| 2 or 3 Rooms | 110 (17.0%) | 62 (28.1%) |
| 4 or 5 Rooms | 229 (35.4%) | 63 (28.5%) |
| 6 or 7 Rooms | 200 (31.0%) | 55 (24.9%) |
| 8 or more Rooms | 92 (14.2%) | 10 (4.5%) |
| Total | 646 (100.0%) | 221 (100.0%) |
Housing Structure by Heating Type in Hoonah-Angoon Census Area
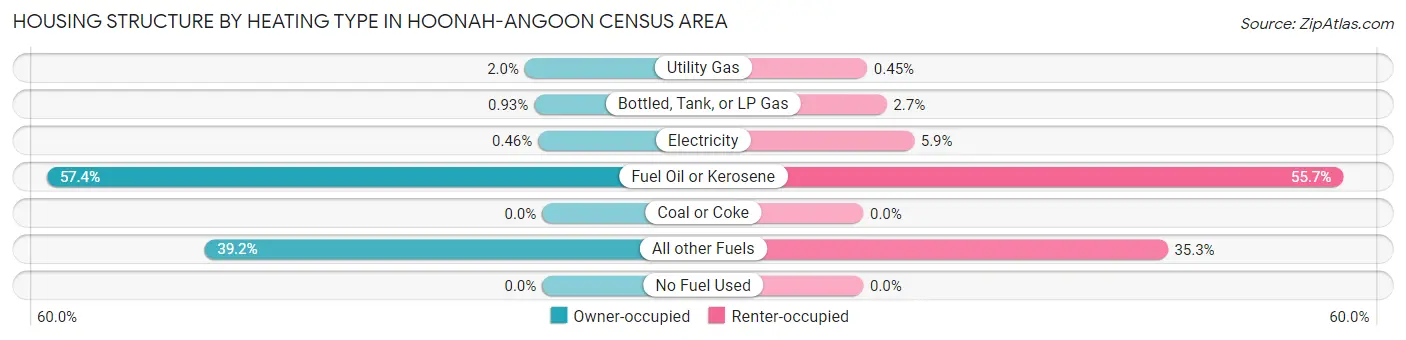
| Heating Type | Owner-occupied | Renter-occupied |
| Utility Gas | 13 (2.0%) | 1 (0.4%) |
| Bottled, Tank, or LP Gas | 6 (0.9%) | 6 (2.7%) |
| Electricity | 3 (0.5%) | 13 (5.9%) |
| Fuel Oil or Kerosene | 371 (57.4%) | 123 (55.7%) |
| Coal or Coke | 0 (0.0%) | 0 (0.0%) |
| All other Fuels | 253 (39.2%) | 78 (35.3%) |
| No Fuel Used | 0 (0.0%) | 0 (0.0%) |
| Total | 646 (100.0%) | 221 (100.0%) |
Household Vehicle Usage in Hoonah-Angoon Census Area
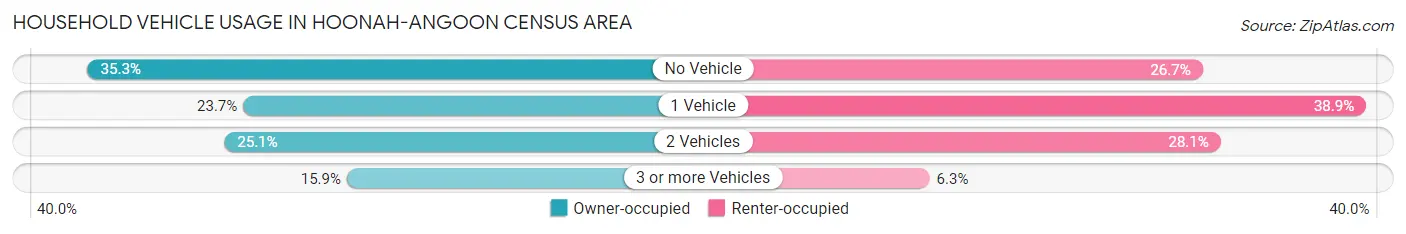
| Vehicles per Household | Owner-occupied | Renter-occupied |
| No Vehicle | 228 (35.3%) | 59 (26.7%) |
| 1 Vehicle | 153 (23.7%) | 86 (38.9%) |
| 2 Vehicles | 162 (25.1%) | 62 (28.1%) |
| 3 or more Vehicles | 103 (15.9%) | 14 (6.3%) |
| Total | 646 (100.0%) | 221 (100.0%) |
Real Estate & Mortgages in Hoonah-Angoon Census Area
Real Estate and Mortgage Overview in Hoonah-Angoon Census Area
| Characteristic | Without Mortgage | With Mortgage |
| Housing Units | 494 | 152 |
| Median Property Value | $217,700 | $308,000 |
| Median Household Income | $60,625 | $11 |
| Monthly Housing Costs | $346 | $6 |
| Real Estate Taxes | - | - |
Property Value by Mortgage Status in Hoonah-Angoon Census Area
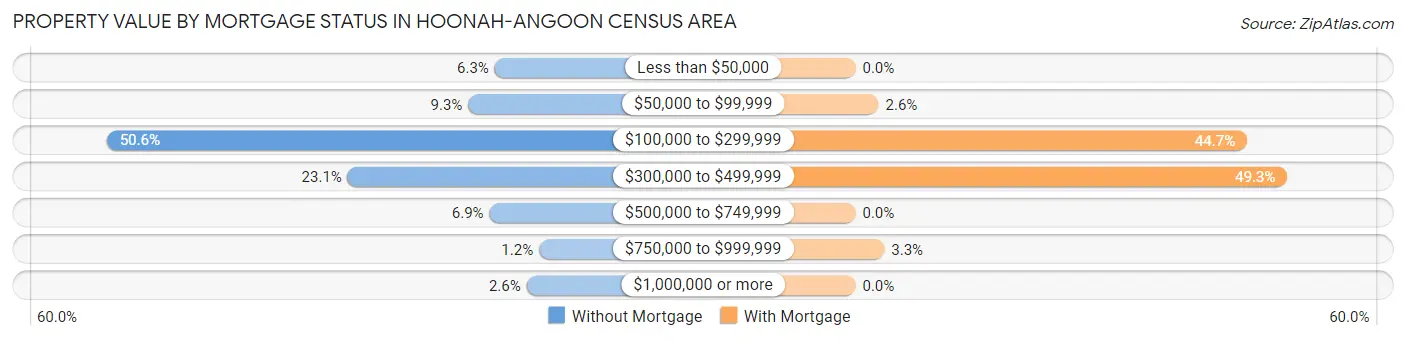
| Property Value | Without Mortgage | With Mortgage |
| Less than $50,000 | 31 (6.3%) | 0 (0.0%) |
| $50,000 to $99,999 | 46 (9.3%) | 4 (2.6%) |
| $100,000 to $299,999 | 250 (50.6%) | 68 (44.7%) |
| $300,000 to $499,999 | 114 (23.1%) | 75 (49.3%) |
| $500,000 to $749,999 | 34 (6.9%) | 0 (0.0%) |
| $750,000 to $999,999 | 6 (1.2%) | 5 (3.3%) |
| $1,000,000 or more | 13 (2.6%) | 0 (0.0%) |
| Total | 494 (100.0%) | 152 (100.0%) |
Household Income by Mortgage Status in Hoonah-Angoon Census Area
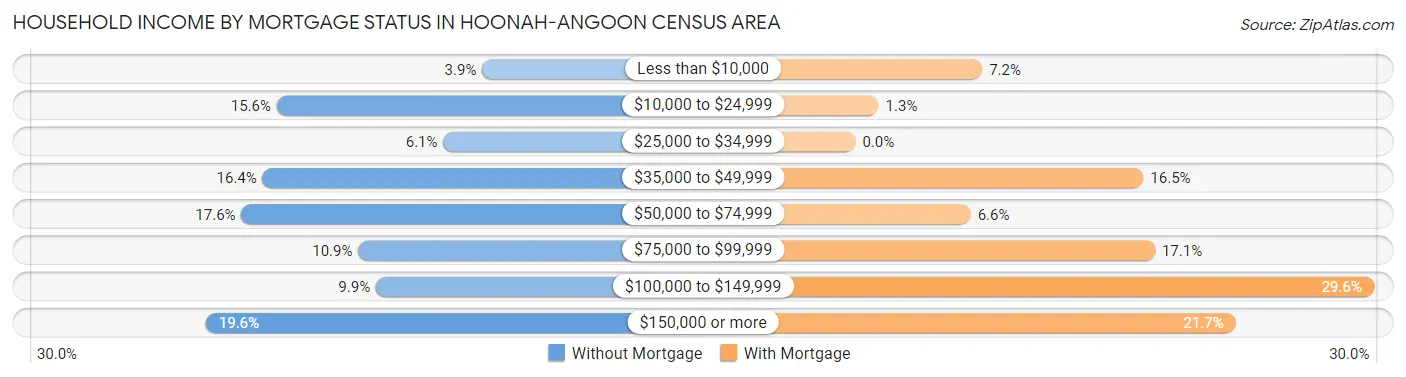
| Household Income | Without Mortgage | With Mortgage |
| Less than $10,000 | 19 (3.8%) | 11 (7.2%) |
| $10,000 to $24,999 | 77 (15.6%) | 2 (1.3%) |
| $25,000 to $34,999 | 30 (6.1%) | 0 (0.0%) |
| $35,000 to $49,999 | 81 (16.4%) | 25 (16.5%) |
| $50,000 to $74,999 | 87 (17.6%) | 10 (6.6%) |
| $75,000 to $99,999 | 54 (10.9%) | 26 (17.1%) |
| $100,000 to $149,999 | 49 (9.9%) | 45 (29.6%) |
| $150,000 or more | 97 (19.6%) | 33 (21.7%) |
| Total | 494 (100.0%) | 152 (100.0%) |
Property Value to Household Income Ratio in Hoonah-Angoon Census Area
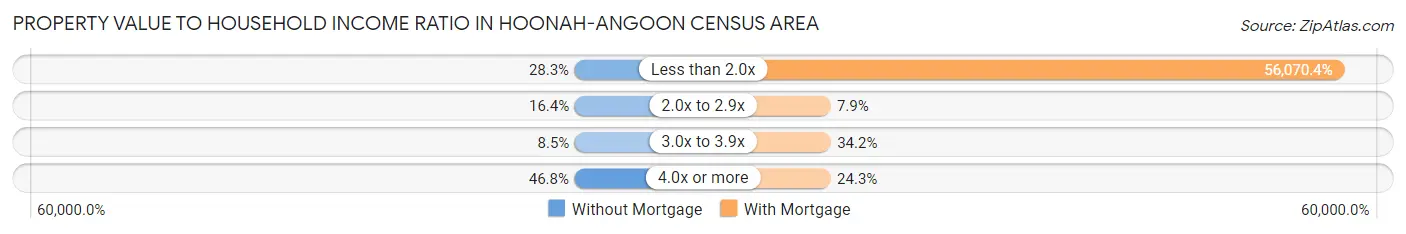
| Value-to-Income Ratio | Without Mortgage | With Mortgage |
| Less than 2.0x | 140 (28.3%) | 85,227 (56,070.4%) |
| 2.0x to 2.9x | 81 (16.4%) | 12 (7.9%) |
| 3.0x to 3.9x | 42 (8.5%) | 52 (34.2%) |
| 4.0x or more | 231 (46.8%) | 37 (24.3%) |
| Total | 494 (100.0%) | 152 (100.0%) |
Real Estate Taxes by Mortgage Status in Hoonah-Angoon Census Area
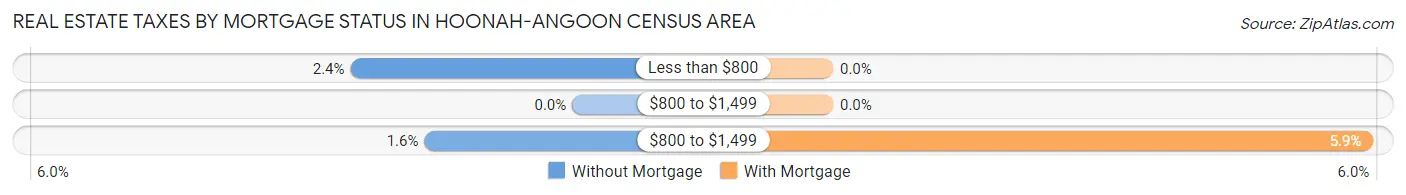
| Property Taxes | Without Mortgage | With Mortgage |
| Less than $800 | 12 (2.4%) | 0 (0.0%) |
| $800 to $1,499 | 0 (0.0%) | 0 (0.0%) |
| $800 to $1,499 | 8 (1.6%) | 9 (5.9%) |
| Total | 494 (100.0%) | 152 (100.0%) |
Health & Disability in Hoonah-Angoon Census Area
Health Insurance Coverage by Age in Hoonah-Angoon Census Area
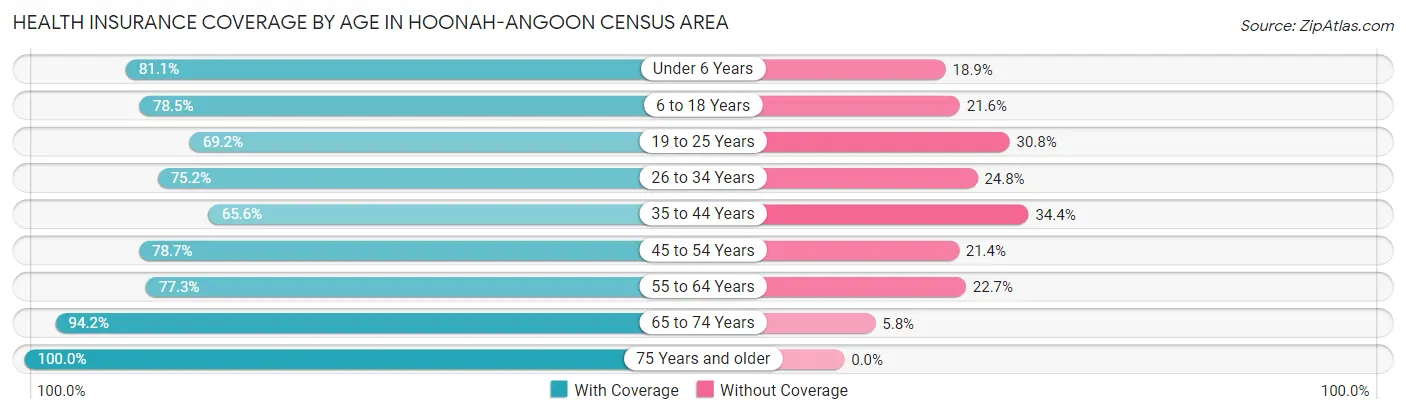
| Age Bracket | With Coverage | Without Coverage |
| Under 6 Years | 73 (81.1%) | 17 (18.9%) |
| 6 to 18 Years | 182 (78.4%) | 50 (21.5%) |
| 19 to 25 Years | 137 (69.2%) | 61 (30.8%) |
| 26 to 34 Years | 224 (75.2%) | 74 (24.8%) |
| 35 to 44 Years | 107 (65.6%) | 56 (34.4%) |
| 45 to 54 Years | 291 (78.6%) | 79 (21.3%) |
| 55 to 64 Years | 324 (77.3%) | 95 (22.7%) |
| 65 to 74 Years | 374 (94.2%) | 23 (5.8%) |
| 75 Years and older | 162 (100.0%) | 0 (0.0%) |
| Total | 1,874 (80.5%) | 455 (19.5%) |
Health Insurance Coverage by Citizenship Status in Hoonah-Angoon Census Area
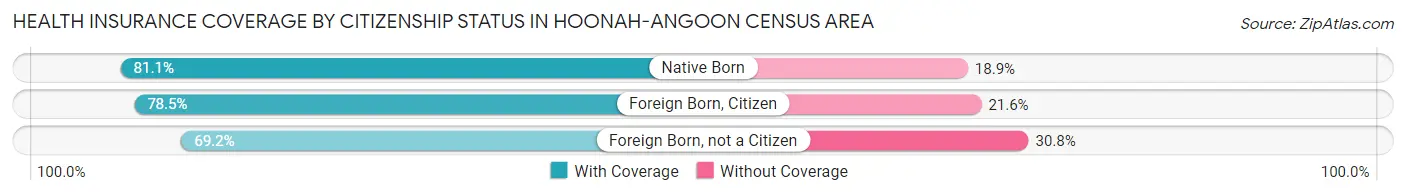
| Citizenship Status | With Coverage | Without Coverage |
| Native Born | 73 (81.1%) | 17 (18.9%) |
| Foreign Born, Citizen | 182 (78.4%) | 50 (21.5%) |
| Foreign Born, not a Citizen | 137 (69.2%) | 61 (30.8%) |
Health Insurance Coverage by Household Income in Hoonah-Angoon Census Area
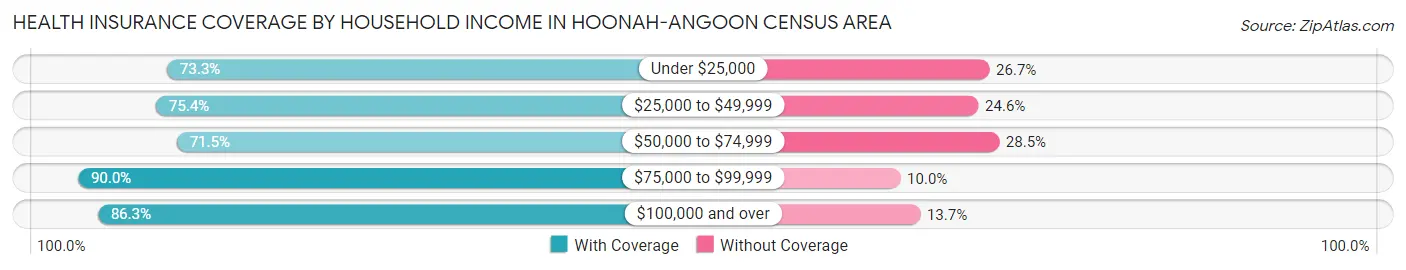
| Household Income | With Coverage | Without Coverage |
| Under $25,000 | 165 (73.3%) | 60 (26.7%) |
| $25,000 to $49,999 | 291 (75.4%) | 95 (24.6%) |
| $50,000 to $74,999 | 281 (71.5%) | 112 (28.5%) |
| $75,000 to $99,999 | 297 (90.0%) | 33 (10.0%) |
| $100,000 and over | 724 (86.3%) | 115 (13.7%) |
Public vs Private Health Insurance Coverage by Age in Hoonah-Angoon Census Area
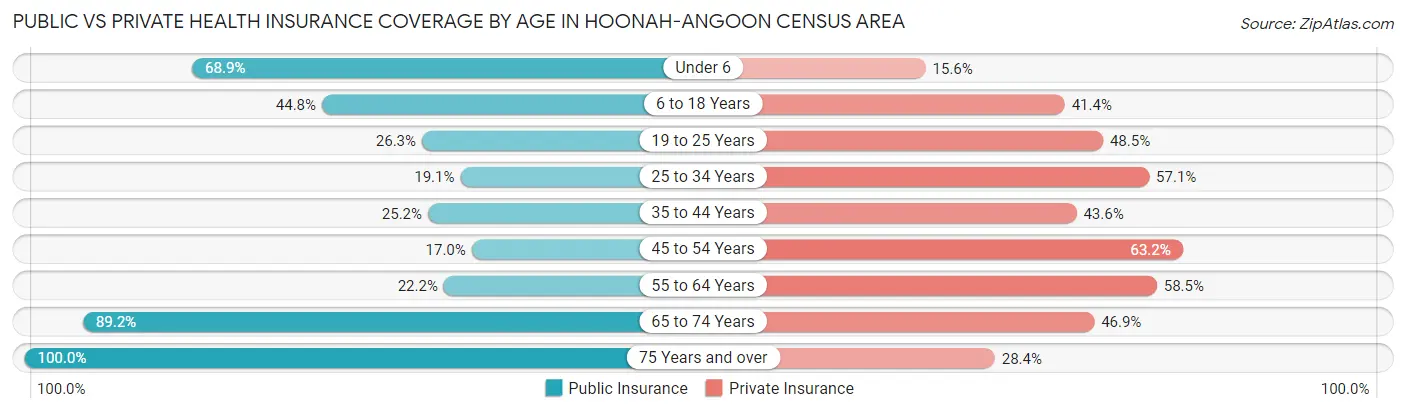
| Age Bracket | Public Insurance | Private Insurance |
| Under 6 | 62 (68.9%) | 14 (15.6%) |
| 6 to 18 Years | 104 (44.8%) | 96 (41.4%) |
| 19 to 25 Years | 52 (26.3%) | 96 (48.5%) |
| 25 to 34 Years | 57 (19.1%) | 170 (57.1%) |
| 35 to 44 Years | 41 (25.2%) | 71 (43.6%) |
| 45 to 54 Years | 63 (17.0%) | 234 (63.2%) |
| 55 to 64 Years | 93 (22.2%) | 245 (58.5%) |
| 65 to 74 Years | 354 (89.2%) | 186 (46.9%) |
| 75 Years and over | 162 (100.0%) | 46 (28.4%) |
| Total | 988 (42.4%) | 1,158 (49.7%) |
Disability Status by Sex by Age in Hoonah-Angoon Census Area
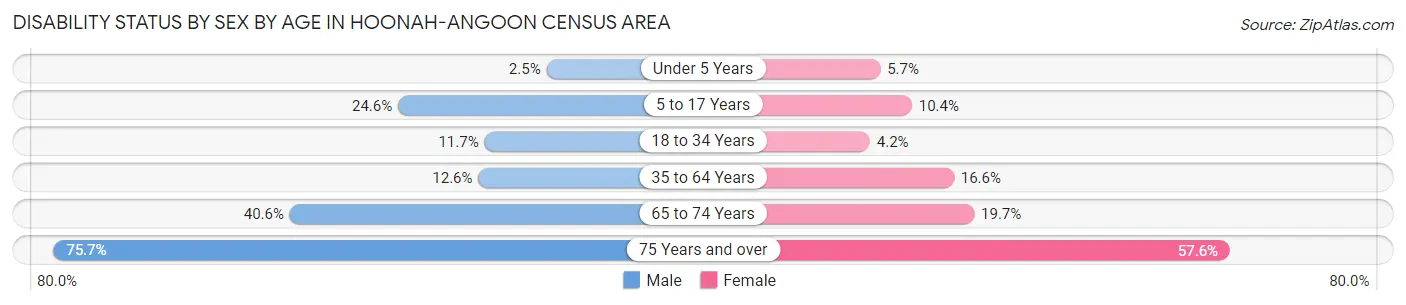
| Age Bracket | Male | Female |
| Under 5 Years | 1 (2.5%) | 2 (5.7%) |
| 5 to 17 Years | 27 (24.5%) | 13 (10.4%) |
| 18 to 34 Years | 37 (11.7%) | 8 (4.2%) |
| 35 to 64 Years | 64 (12.6%) | 74 (16.6%) |
| 65 to 74 Years | 91 (40.6%) | 34 (19.7%) |
| 75 Years and over | 78 (75.7%) | 34 (57.6%) |
Disability Class by Sex by Age in Hoonah-Angoon Census Area
Disability Class: Hearing Difficulty
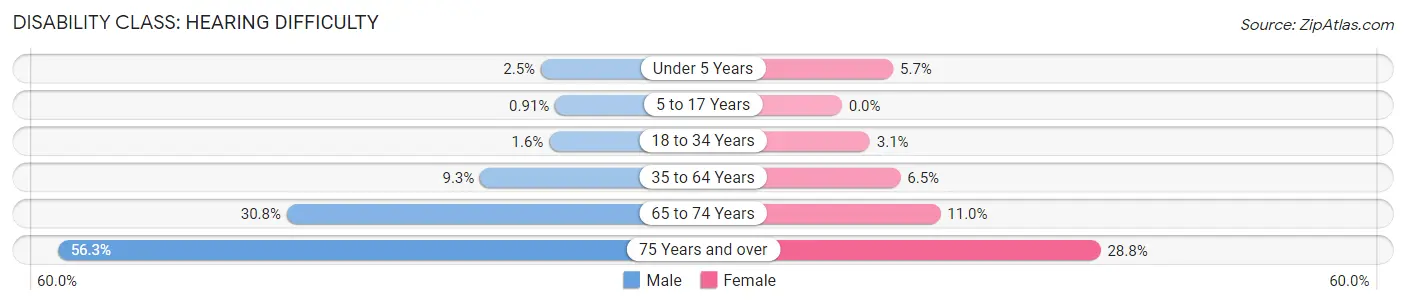
| Age Bracket | Male | Female |
| Under 5 Years | 1 (2.5%) | 2 (5.7%) |
| 5 to 17 Years | 1 (0.9%) | 0 (0.0%) |
| 18 to 34 Years | 5 (1.6%) | 6 (3.1%) |
| 35 to 64 Years | 47 (9.3%) | 29 (6.5%) |
| 65 to 74 Years | 69 (30.8%) | 19 (11.0%) |
| 75 Years and over | 58 (56.3%) | 17 (28.8%) |
Disability Class: Vision Difficulty
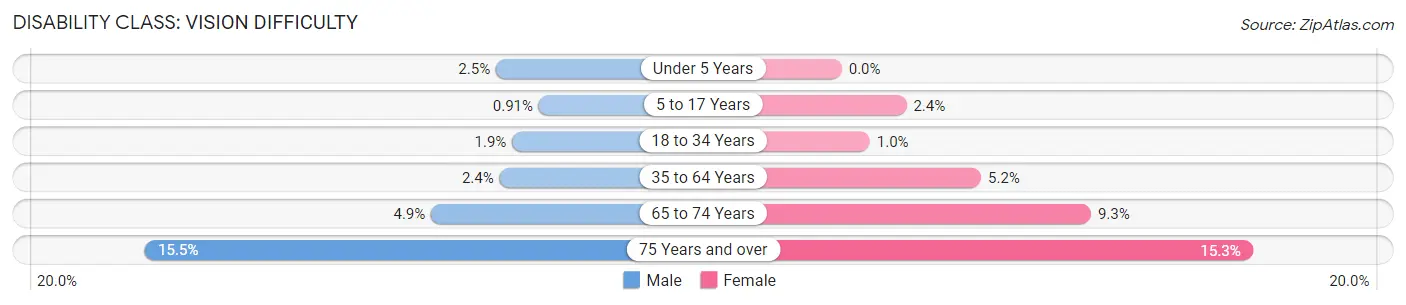
| Age Bracket | Male | Female |
| Under 5 Years | 1 (2.5%) | 0 (0.0%) |
| 5 to 17 Years | 1 (0.9%) | 3 (2.4%) |
| 18 to 34 Years | 6 (1.9%) | 2 (1.0%) |
| 35 to 64 Years | 12 (2.4%) | 23 (5.2%) |
| 65 to 74 Years | 11 (4.9%) | 16 (9.2%) |
| 75 Years and over | 16 (15.5%) | 9 (15.2%) |
Disability Class: Cognitive Difficulty
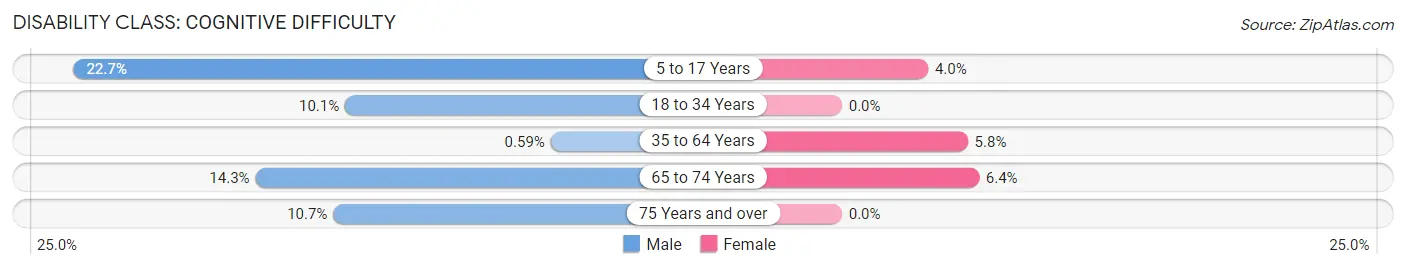
| Age Bracket | Male | Female |
| 5 to 17 Years | 25 (22.7%) | 5 (4.0%) |
| 18 to 34 Years | 32 (10.1%) | 0 (0.0%) |
| 35 to 64 Years | 3 (0.6%) | 26 (5.8%) |
| 65 to 74 Years | 32 (14.3%) | 11 (6.4%) |
| 75 Years and over | 11 (10.7%) | 0 (0.0%) |
Disability Class: Ambulatory Difficulty
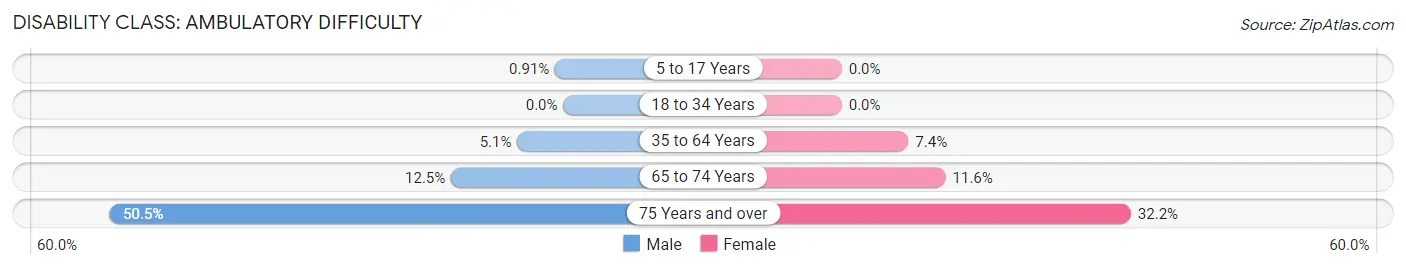
| Age Bracket | Male | Female |
| 5 to 17 Years | 1 (0.9%) | 0 (0.0%) |
| 18 to 34 Years | 0 (0.0%) | 0 (0.0%) |
| 35 to 64 Years | 26 (5.1%) | 33 (7.4%) |
| 65 to 74 Years | 28 (12.5%) | 20 (11.6%) |
| 75 Years and over | 52 (50.5%) | 19 (32.2%) |
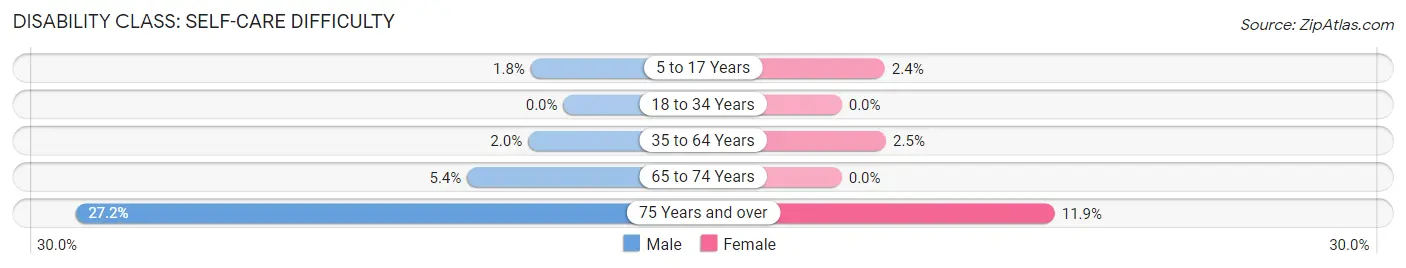
Disability Class: Self-Care Difficulty
| Age Bracket | Male | Female |
| 5 to 17 Years | 2 (1.8%) | 3 (2.4%) |
| 18 to 34 Years | 0 (0.0%) | 0 (0.0%) |
| 35 to 64 Years | 10 (2.0%) | 11 (2.5%) |
| 65 to 74 Years | 12 (5.4%) | 0 (0.0%) |
| 75 Years and over | 28 (27.2%) | 7 (11.9%) |
Technology Access in Hoonah-Angoon Census Area
Computing Device Access in Hoonah-Angoon Census Area
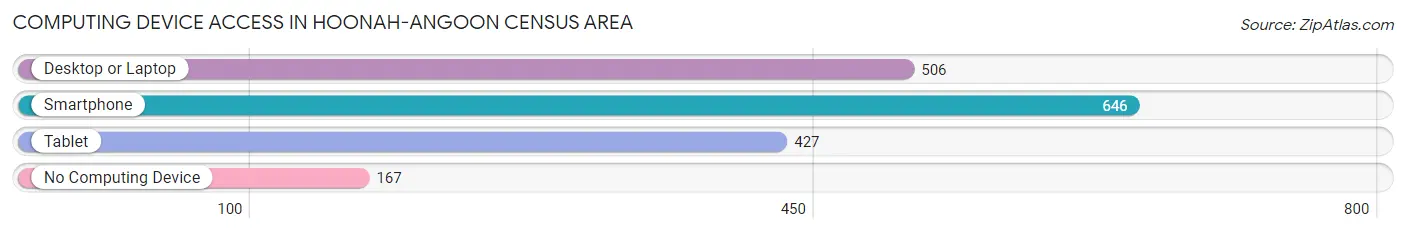
| Device Type | # Households | % Households |
| Desktop or Laptop | 506 | 58.4% |
| Smartphone | 646 | 74.5% |
| Tablet | 427 | 49.2% |
| No Computing Device | 167 | 19.3% |
| Total | 867 | 100.0% |
Internet Access in Hoonah-Angoon Census Area
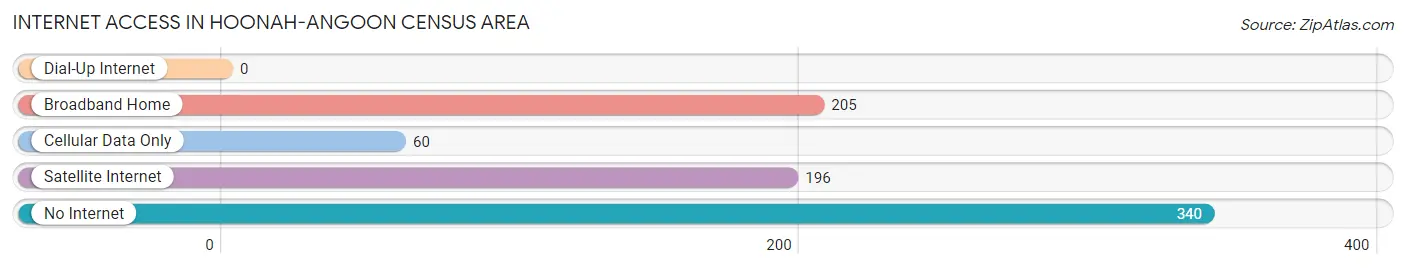
| Internet Type | # Households | % Households |
| Dial-Up Internet | 0 | 0.0% |
| Broadband Home | 205 | 23.6% |
| Cellular Data Only | 60 | 6.9% |
| Satellite Internet | 196 | 22.6% |
| No Internet | 340 | 39.2% |
| Total | 867 | 100.0% |
Hoonah-Angoon Census Area Summary
Hoonah-Angoon Census Area, Alaska is located in the southeastern part of the state, and is part of the Alexander Archipelago. It is bordered by the Gulf of Alaska to the south, the Chatham Strait to the east, and the Inside Passage to the north. The census area is made up of two boroughs, Hoonah and Angoon, and covers an area of 4,711 square miles.
History
The Hoonah-Angoon Census Area has a long and rich history. The area was first inhabited by the Tlingit people, who have lived in the region for thousands of years. The Tlingit were a hunter-gatherer society, and relied on the abundant resources of the area for their subsistence.
The first Europeans to explore the area were Spanish explorers in the late 1700s. They named the area “Isla de los Angeles”, or “Island of the Angels”. In 1867, the United States purchased Alaska from Russia, and the area became part of the newly formed Alaska Territory.
In the late 1800s, the area was heavily logged by the Alaska Pulp Company, which harvested the area’s abundant timber resources. The company built a sawmill in Hoonah, which provided jobs for many of the area’s residents.
In the early 1900s, the area was heavily impacted by the construction of the Alaska Railroad. The railroad brought new settlers to the area, and the population began to grow.
In the 1950s, the area was impacted by the construction of the Alaska-Canada Highway. The highway brought new economic opportunities to the area, and the population continued to grow.
In the 1970s, the area was impacted by the construction of the Alaska Marine Highway System. The ferry system provided a new way for people to travel to and from the area, and the population continued to grow.
In the 1980s, the area was impacted by the construction of the Alaska Pipeline. The pipeline brought new economic opportunities to the area, and the population continued to grow.
In the 1990s, the area was impacted by the construction of the Alaska Native Claims Settlement Act. The act provided land and money to the area’s native population, and the population continued to grow.
Geography
The Hoonah-Angoon Census Area is located in the southeastern part of Alaska, and is part of the Alexander Archipelago. It is bordered by the Gulf of Alaska to the south, the Chatham Strait to the east, and the Inside Passage to the north. The census area is made up of two boroughs, Hoonah and Angoon, and covers an area of 4,711 square miles.
The area is mostly mountainous, with the highest point being Mount Fairweather at 15,325 feet. The area is also home to numerous glaciers, including the Mendenhall Glacier and the Hubbard Glacier. The area is also home to numerous rivers, including the Chilkat River and the Stikine River.
The climate of the area is generally mild, with temperatures ranging from the low 40s in the winter to the mid-60s in the summer. The area receives an average of 40 inches of precipitation per year, with most of it falling in the form of snow.
Economy
The economy of the Hoonah-Angoon Census Area is largely based on fishing, logging, and tourism. Fishing is the primary industry in the area, with salmon, halibut, and crab being the most important species. Logging is also an important industry in the area, with timber being harvested from the area’s abundant forests.
Tourism is also an important part of the economy, with visitors coming to the area to take advantage of its natural beauty and abundant wildlife. The area is home to numerous national parks and monuments, including Glacier Bay National Park and Admiralty Island National Monument.
Demographics
As of the 2010 census, the population of the Hoonah-Angoon Census Area was 2,150. The population is largely Native American, with the Tlingit people making up the majority of the population. The area also has a small population of non-Native Americans, primarily of European descent.
The median household income in the area is $45,000, and the median home value is $150,000. The area has a high rate of poverty, with nearly one-third of the population living below the poverty line.
Conclusion
The Hoonah-Angoon Census Area is a unique and beautiful part of Alaska. It has a long and rich history, and is home to a diverse population. The area’s economy is largely based on fishing, logging, and tourism, and the area is home to numerous national parks and monuments. The area has a high rate of poverty, but is also home to a vibrant and diverse culture.
Common Questions
What is the Total Population of Hoonah-Angoon Census Area?
Total Population of Hoonah-Angoon Census Area is 2,329.
What is the Total Male Population of Hoonah-Angoon Census Area?
Total Male Population of Hoonah-Angoon Census Area is 1,300.
What is the Total Female Population of Hoonah-Angoon Census Area?
Total Female Population of Hoonah-Angoon Census Area is 1,029.
What is the Ratio of Males per 100 Females in Hoonah-Angoon Census Area?
There are 126.34 Males per 100 Females in Hoonah-Angoon Census Area.
What is the Ratio of Females per 100 Males in Hoonah-Angoon Census Area?
There are 79.15 Females per 100 Males in Hoonah-Angoon Census Area.
What is the Median Population Age in Hoonah-Angoon Census Area?
Median Population Age in Hoonah-Angoon Census Area is 50.0 Years.
What is the Average Family Size in Hoonah-Angoon Census Area
Average Family Size in Hoonah-Angoon Census Area is 3.3 People.
What is the Average Household Size in Hoonah-Angoon Census Area
Average Household Size in Hoonah-Angoon Census Area is 2.5 People.
What is Per Capita Income in Hoonah-Angoon Census Area?
Per Capita income in Hoonah-Angoon Census Area is $39,257.
What is the Median Family Income in Hoonah-Angoon Census Area?
Median Family Income in Hoonah-Angoon Census Area is $79,063.
What is the Median Household income in Hoonah-Angoon Census Area?
Median Household Income in Hoonah-Angoon Census Area is $62,344.
What is Income or Wage Gap in Hoonah-Angoon Census Area?
Income or Wage Gap in Hoonah-Angoon Census Area is 34.1%.
Women in Hoonah-Angoon Census Area earn 65.9 cents for every dollar earned by a man.
What is Inequality or Gini Index in Hoonah-Angoon Census Area?
Inequality or Gini Index in Hoonah-Angoon Census Area is 0.47.
How Large is the Labor Force in Hoonah-Angoon Census Area?
There are 1,365 People in the Labor Forcein in Hoonah-Angoon Census Area.
What is the Percentage of People in the Labor Force in Hoonah-Angoon Census Area?
66.8% of People are in the Labor Force in Hoonah-Angoon Census Area.
What is the Unemployment Rate in Hoonah-Angoon Census Area?
Unemployment Rate in Hoonah-Angoon Census Area is 14.0%.