Dillingham Census Area, AK
Dillingham Census Area Map
Dillingham Census Area Overview
4,854
TOTAL POPULATION
2,492
MALE POPULATION
2,362
FEMALE POPULATION
105.50
MALES / 100 FEMALES
94.78
FEMALES / 100 MALES
30.7
MEDIAN AGE
3.7
AVG FAMILY SIZE
3.2
AVG HOUSEHOLD SIZE
$31,948
PER CAPITA INCOME
$72,500
AVG FAMILY INCOME
$69,412
AVG HOUSEHOLD INCOME
24.5%
WAGE / INCOME GAP [ % ]
75.5¢/ $1
WAGE / INCOME GAP [ $ ]
$10,536
FAMILY INCOME DEFICIT
0.41
INEQUALITY / GINI INDEX
2,182
LABOR FORCE [ PEOPLE ]
62.0%
PERCENT IN LABOR FORCE
11.3%
UNEMPLOYMENT RATE
Dillingham Census Area Area Codes
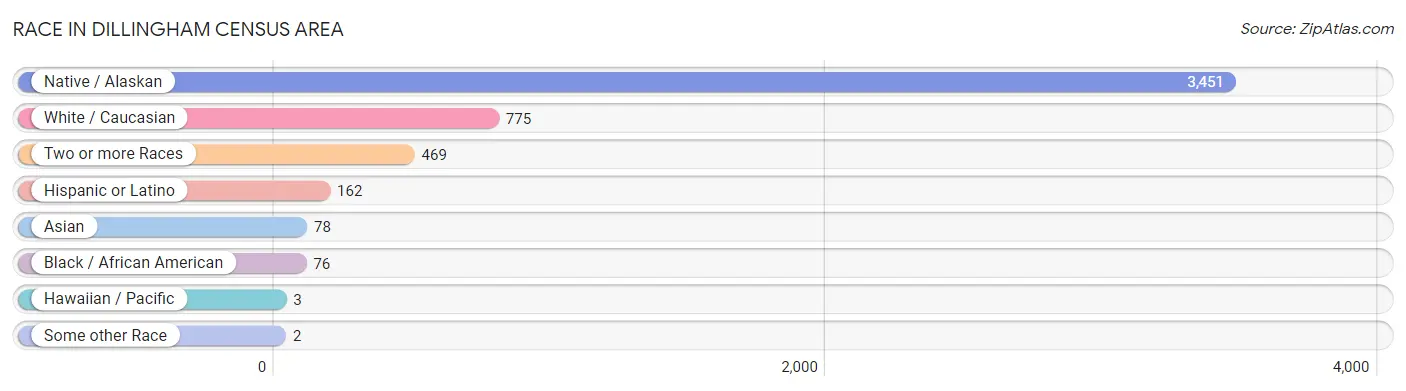
Race in Dillingham Census Area
The most populous races in Dillingham Census Area are Native / Alaskan (3,451 | 71.1%), White / Caucasian (775 | 16.0%), and Two or more Races (469 | 9.7%).
| Race | # Population | % Population |
| Asian | 78 | 1.6% |
| Black / African American | 76 | 1.6% |
| Hawaiian / Pacific | 3 | 0.1% |
| Hispanic or Latino | 162 | 3.3% |
| Native / Alaskan | 3,451 | 71.1% |
| White / Caucasian | 775 | 16.0% |
| Two or more Races | 469 | 9.7% |
| Some other Race | 2 | 0.0% |
| Total | 4,854 | 100.0% |
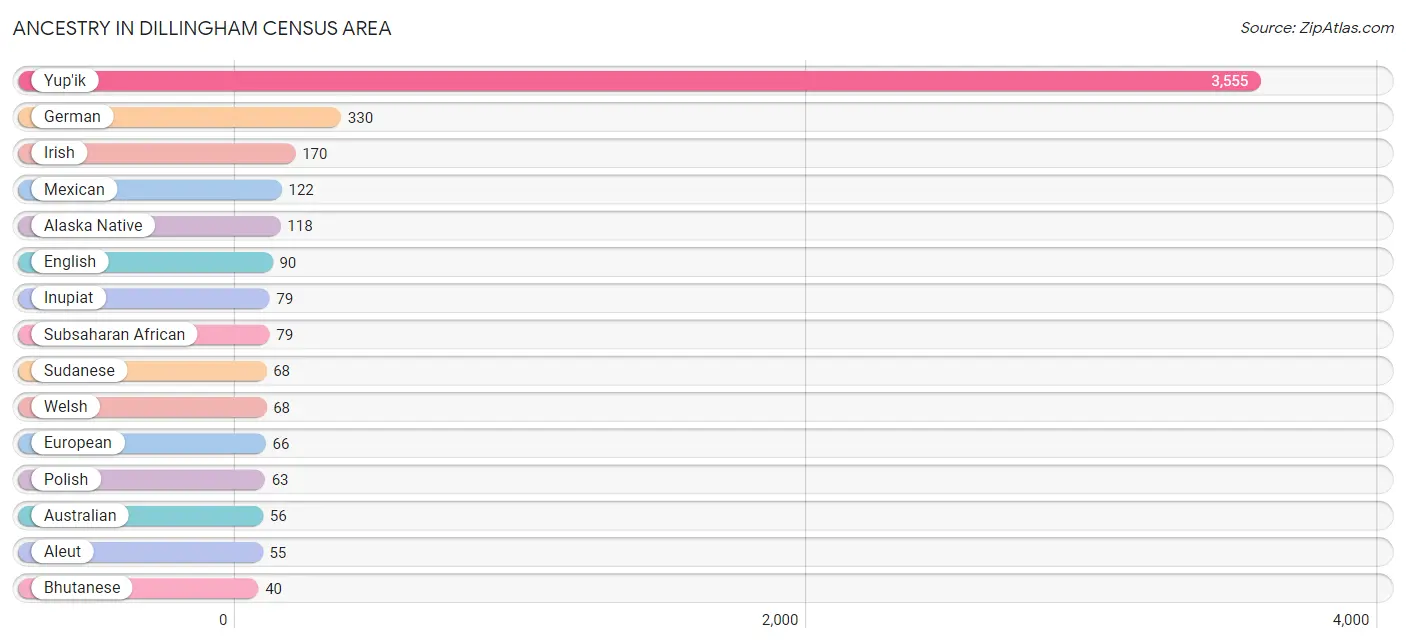
Ancestry in Dillingham Census Area
The most populous ancestries reported in Dillingham Census Area are Yup'ik (3,555 | 73.2%), German (330 | 6.8%), Irish (170 | 3.5%), Mexican (122 | 2.5%), and Alaska Native (118 | 2.4%), together accounting for 88.5% of all Dillingham Census Area residents.
| Ancestry | # Population | % Population |
| African | 4 | 0.1% |
| Alaska Native | 118 | 2.4% |
| Alaskan Athabascan | 22 | 0.4% |
| Aleut | 55 | 1.1% |
| Apache | 4 | 0.1% |
| Arab | 1 | 0.0% |
| Australian | 56 | 1.1% |
| Austrian | 4 | 0.1% |
| Belgian | 2 | 0.0% |
| Bhutanese | 40 | 0.8% |
| Blackfeet | 3 | 0.1% |
| British | 11 | 0.2% |
| Burmese | 7 | 0.1% |
| Canadian | 1 | 0.0% |
| Croatian | 6 | 0.1% |
| Czech | 1 | 0.0% |
| Danish | 21 | 0.4% |
| Dominican | 3 | 0.1% |
| Dutch | 21 | 0.4% |
| Eastern European | 1 | 0.0% |
| English | 90 | 1.8% |
| European | 66 | 1.4% |
| Finnish | 20 | 0.4% |
| French | 17 | 0.4% |
| French Canadian | 9 | 0.2% |
| German | 330 | 6.8% |
| Greek | 2 | 0.0% |
| Houma | 3 | 0.1% |
| Inupiat | 79 | 1.6% |
| Irish | 170 | 3.5% |
| Italian | 37 | 0.8% |
| Jamaican | 6 | 0.1% |
| Korean | 19 | 0.4% |
| Lithuanian | 1 | 0.0% |
| Mexican | 122 | 2.5% |
| Nigerian | 2 | 0.0% |
| Norwegian | 30 | 0.6% |
| Polish | 63 | 1.3% |
| Puerto Rican | 6 | 0.1% |
| Puget Sound Salish | 2 | 0.0% |
| Russian | 8 | 0.2% |
| Samoan | 14 | 0.3% |
| Scandinavian | 5 | 0.1% |
| Scotch-Irish | 4 | 0.1% |
| Scottish | 12 | 0.3% |
| Sioux | 10 | 0.2% |
| Spaniard | 6 | 0.1% |
| Spanish | 25 | 0.5% |
| Sri Lankan | 6 | 0.1% |
| Subsaharan African | 79 | 1.6% |
| Sudanese | 68 | 1.4% |
| Swedish | 32 | 0.7% |
| Swiss | 22 | 0.4% |
| Syrian | 1 | 0.0% |
| Thai | 36 | 0.7% |
| Tlingit-Haida | 4 | 0.1% |
| Ukrainian | 6 | 0.1% |
| Welsh | 68 | 1.4% |
| Yup'ik | 3,555 | 73.2% | View All 59 Rows |
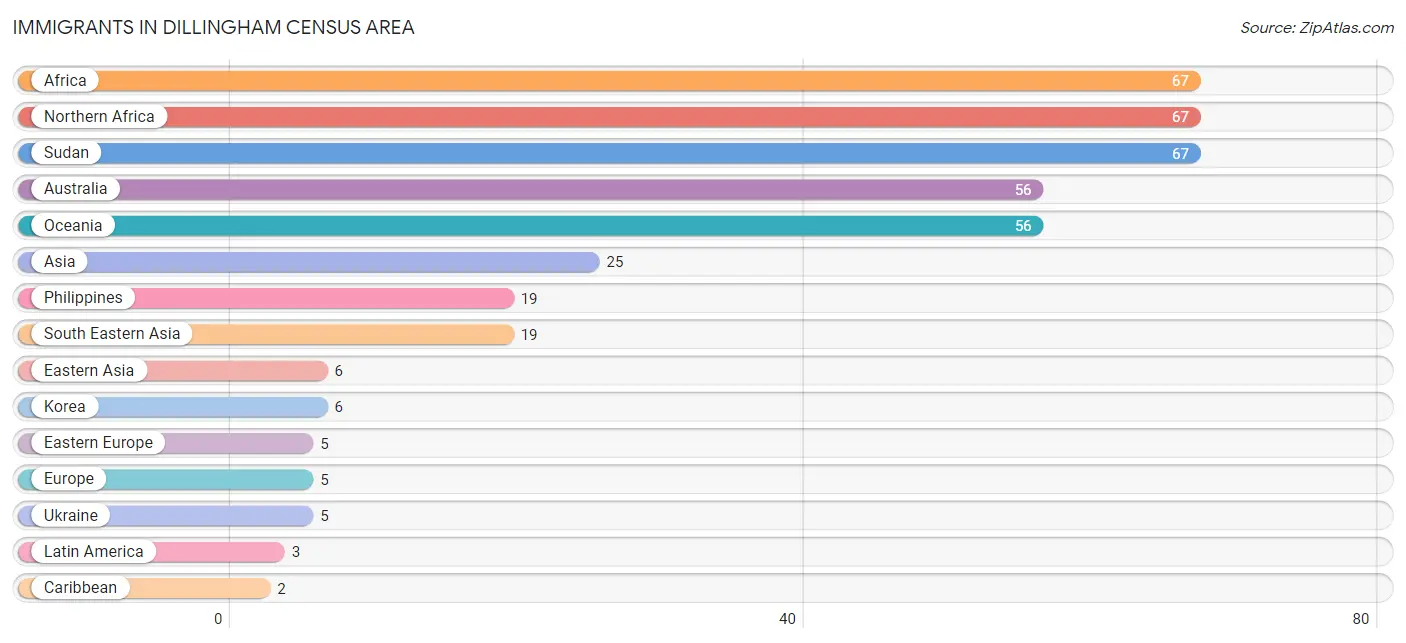
Immigrants in Dillingham Census Area
The most numerous immigrant groups reported in Dillingham Census Area came from Africa (67 | 1.4%), Northern Africa (67 | 1.4%), Sudan (67 | 1.4%), Australia (56 | 1.1%), and Oceania (56 | 1.1%), together accounting for 6.4% of all Dillingham Census Area residents.
| Immigration Origin | # Population | % Population |
| Africa | 67 | 1.4% |
| Asia | 25 | 0.5% |
| Australia | 56 | 1.1% |
| Brazil | 1 | 0.0% |
| Caribbean | 2 | 0.0% |
| Eastern Asia | 6 | 0.1% |
| Eastern Europe | 5 | 0.1% |
| Europe | 5 | 0.1% |
| Jamaica | 2 | 0.0% |
| Korea | 6 | 0.1% |
| Latin America | 3 | 0.1% |
| Northern Africa | 67 | 1.4% |
| Oceania | 56 | 1.1% |
| Philippines | 19 | 0.4% |
| South America | 1 | 0.0% |
| South Eastern Asia | 19 | 0.4% |
| Sudan | 67 | 1.4% |
| Ukraine | 5 | 0.1% | View All 18 Rows |
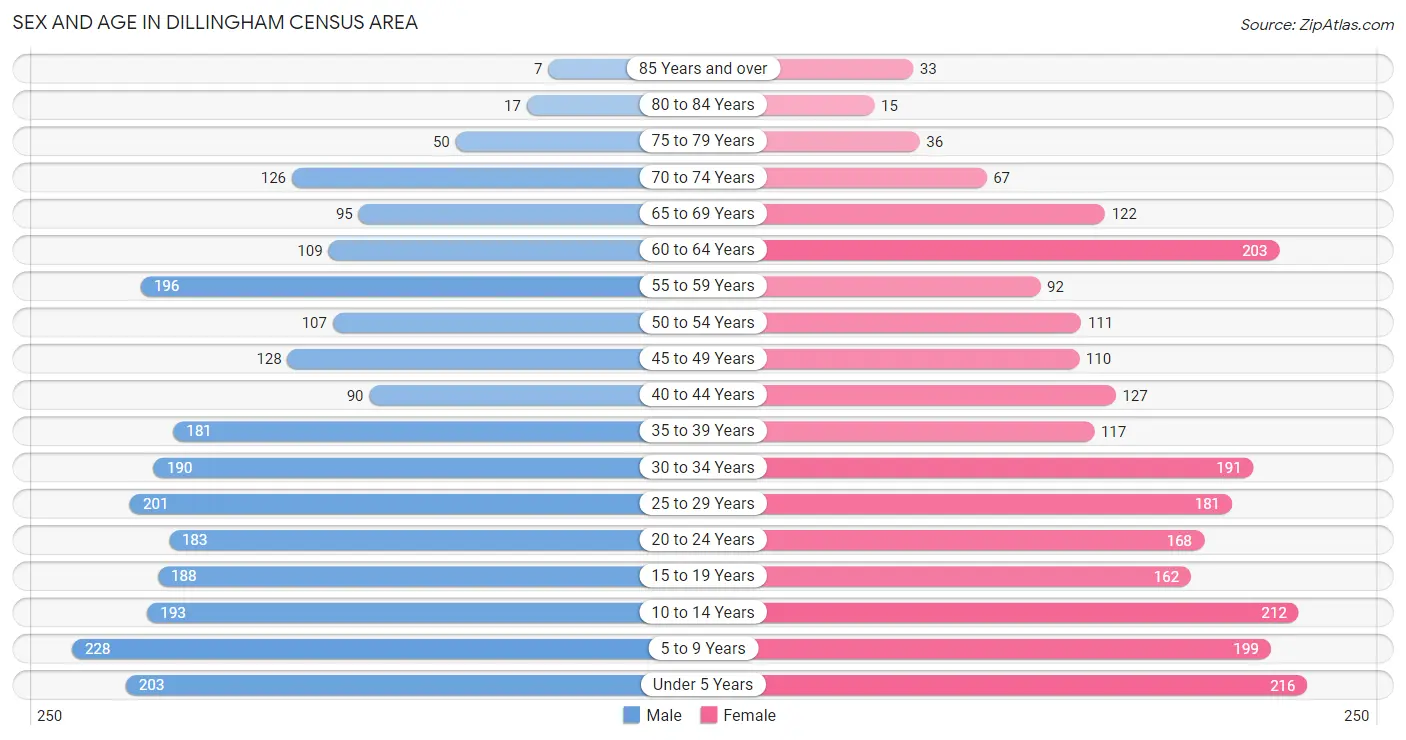
Sex and Age in Dillingham Census Area
Sex and Age in Dillingham Census Area
The most populous age groups in Dillingham Census Area are 5 to 9 Years (228 | 9.1%) for men and Under 5 Years (216 | 9.1%) for women.
| Age Bracket | Male | Female |
| Under 5 Years | 203 (8.2%) | 216 (9.1%) |
| 5 to 9 Years | 228 (9.1%) | 199 (8.4%) |
| 10 to 14 Years | 193 (7.7%) | 212 (9.0%) |
| 15 to 19 Years | 188 (7.5%) | 162 (6.9%) |
| 20 to 24 Years | 183 (7.3%) | 168 (7.1%) |
| 25 to 29 Years | 201 (8.1%) | 181 (7.7%) |
| 30 to 34 Years | 190 (7.6%) | 191 (8.1%) |
| 35 to 39 Years | 181 (7.3%) | 117 (5.0%) |
| 40 to 44 Years | 90 (3.6%) | 127 (5.4%) |
| 45 to 49 Years | 128 (5.1%) | 110 (4.7%) |
| 50 to 54 Years | 107 (4.3%) | 111 (4.7%) |
| 55 to 59 Years | 196 (7.9%) | 92 (3.9%) |
| 60 to 64 Years | 109 (4.4%) | 203 (8.6%) |
| 65 to 69 Years | 95 (3.8%) | 122 (5.2%) |
| 70 to 74 Years | 126 (5.1%) | 67 (2.8%) |
| 75 to 79 Years | 50 (2.0%) | 36 (1.5%) |
| 80 to 84 Years | 17 (0.7%) | 15 (0.6%) |
| 85 Years and over | 7 (0.3%) | 33 (1.4%) |
| Total | 2,492 (100.0%) | 2,362 (100.0%) |
Families and Households in Dillingham Census Area
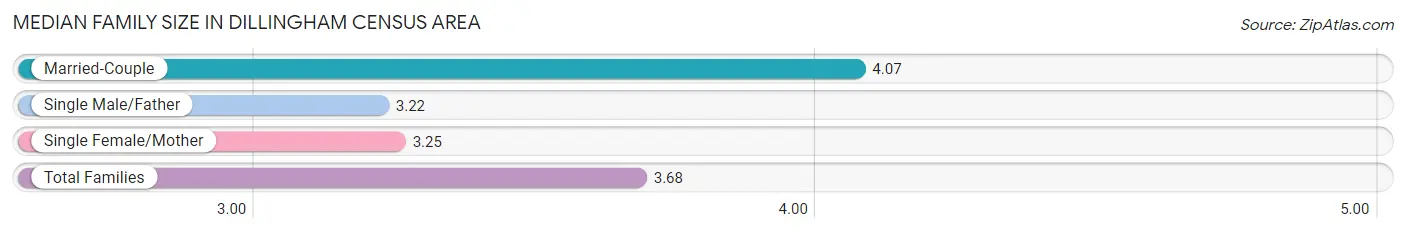
Median Family Size in Dillingham Census Area
The median family size in Dillingham Census Area is 3.68 persons per family, with married-couple families (536 | 52.3%) accounting for the largest median family size of 4.07 persons per family. On the other hand, single male/father families (160 | 15.6%) represent the smallest median family size with 3.22 persons per family.
| Family Type | # Families | Family Size |
| Married-Couple | 536 (52.3%) | 4.07 |
| Single Male/Father | 160 (15.6%) | 3.22 |
| Single Female/Mother | 328 (32.0%) | 3.25 |
| Total Families | 1,024 (100.0%) | 3.68 |
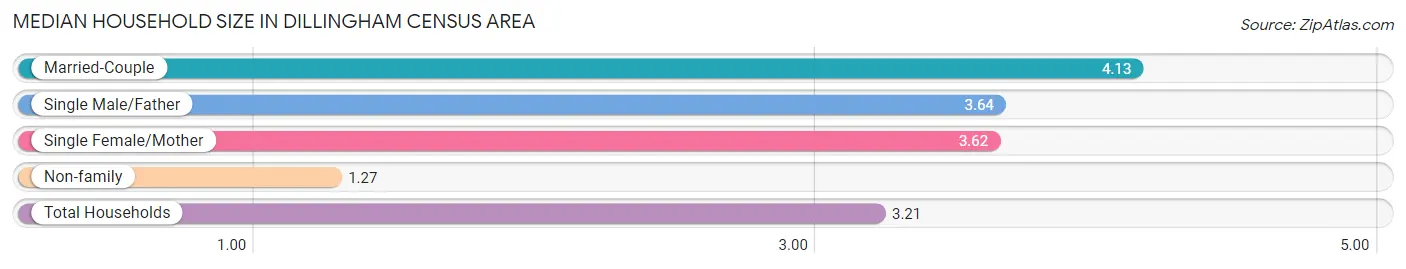
Median Household Size in Dillingham Census Area
The median household size in Dillingham Census Area is 3.21 persons per household, with married-couple households (536 | 38.7%) accounting for the largest median household size of 4.13 persons per household. non-family households (360 | 26.0%) represent the smallest median household size with 1.27 persons per household.
| Household Type | # Households | Household Size |
| Married-Couple | 536 (38.7%) | 4.13 |
| Single Male/Father | 160 (11.6%) | 3.64 |
| Single Female/Mother | 328 (23.7%) | 3.62 |
| Non-family | 360 (26.0%) | 1.27 |
| Total Households | 1,384 (100.0%) | 3.21 |
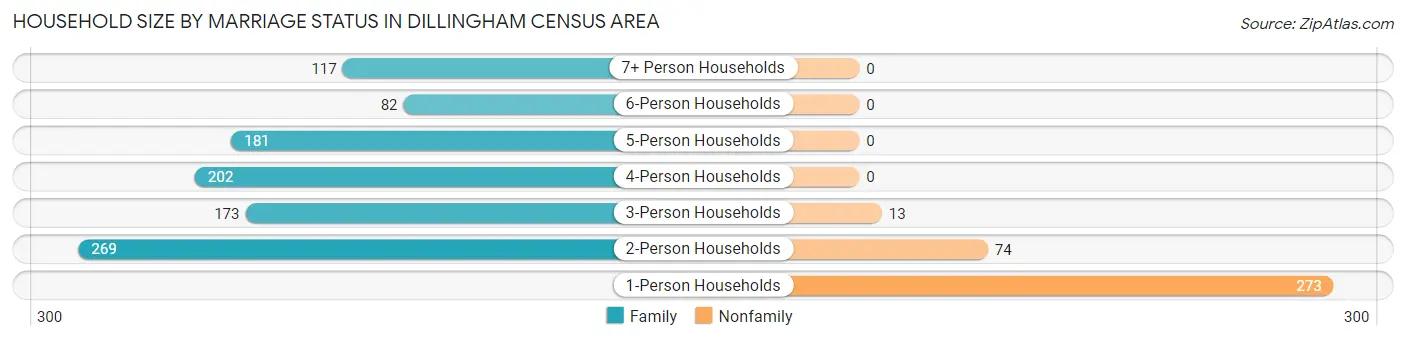
Household Size by Marriage Status in Dillingham Census Area
Out of a total of 1,384 households in Dillingham Census Area, 1,024 (74.0%) are family households, while 360 (26.0%) are nonfamily households. The most numerous type of family households are 2-person households, comprising 269, and the most common type of nonfamily households are 1-person households, comprising 273.
| Household Size | Family Households | Nonfamily Households |
| 1-Person Households | - | 273 (19.7%) |
| 2-Person Households | 269 (19.4%) | 74 (5.3%) |
| 3-Person Households | 173 (12.5%) | 13 (0.9%) |
| 4-Person Households | 202 (14.6%) | 0 (0.0%) |
| 5-Person Households | 181 (13.1%) | 0 (0.0%) |
| 6-Person Households | 82 (5.9%) | 0 (0.0%) |
| 7+ Person Households | 117 (8.5%) | 0 (0.0%) |
| Total | 1,024 (74.0%) | 360 (26.0%) |
Female Fertility in Dillingham Census Area
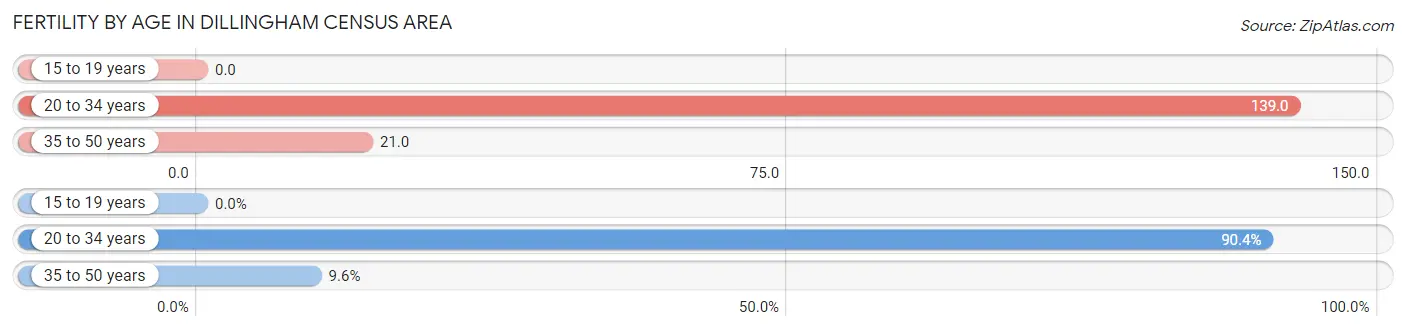
Fertility by Age in Dillingham Census Area
Average fertility rate in Dillingham Census Area is 77.0 births per 1,000 women. Women in the age bracket of 20 to 34 years have the highest fertility rate with 139.0 births per 1,000 women. Women in the age bracket of 20 to 34 years acount for 90.4% of all women with births.
| Age Bracket | Women with Births | Births / 1,000 Women |
| 15 to 19 years | 0 (0.0%) | 0.0 |
| 20 to 34 years | 75 (90.4%) | 139.0 |
| 35 to 50 years | 8 (9.6%) | 21.0 |
| Total | 83 (100.0%) | 77.0 |
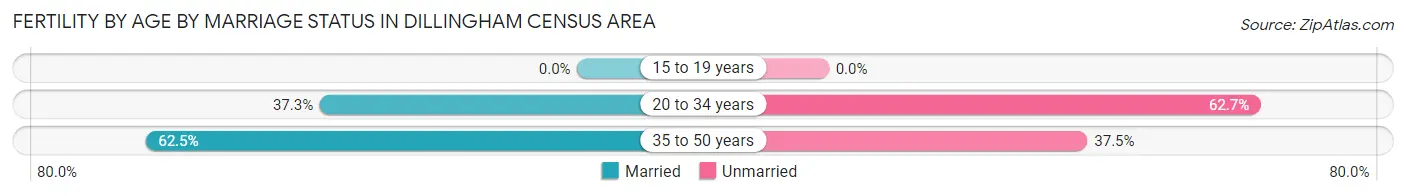
Fertility by Age by Marriage Status in Dillingham Census Area
39.8% of women with births (83) in Dillingham Census Area are married. The highest percentage of unmarried women with births falls into 20 to 34 years age bracket with 62.7% of them unmarried at the time of birth, while the lowest percentage of unmarried women with births belong to 35 to 50 years age bracket with 37.5% of them unmarried.
| Age Bracket | Married | Unmarried |
| 15 to 19 years | 0 (0.0%) | 0 (0.0%) |
| 20 to 34 years | 28 (37.3%) | 47 (62.7%) |
| 35 to 50 years | 5 (62.5%) | 3 (37.5%) |
| Total | 33 (39.8%) | 50 (60.2%) |
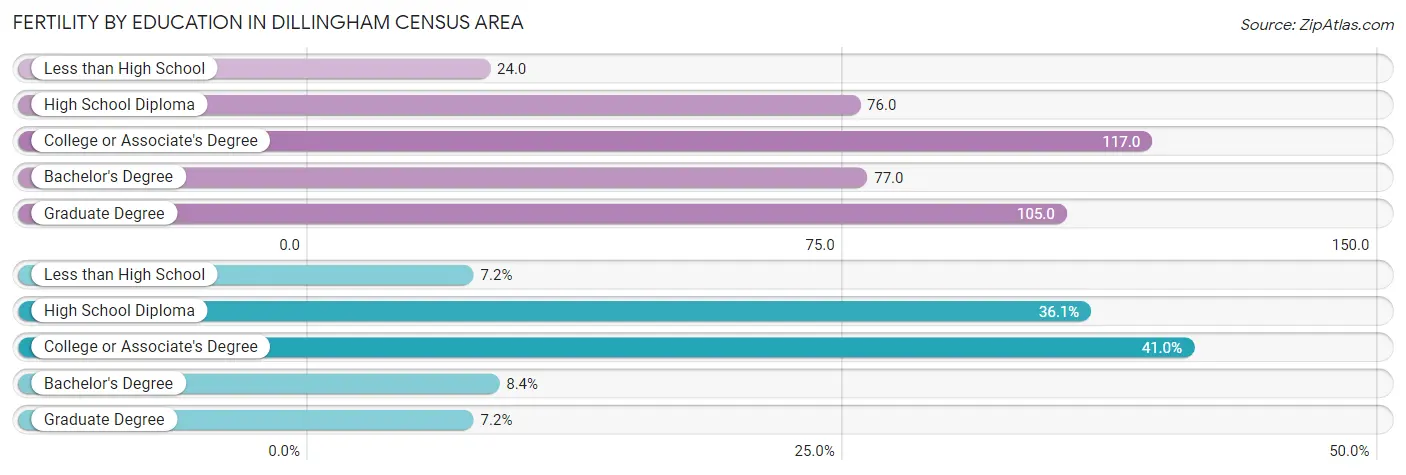
Fertility by Education in Dillingham Census Area
Average fertility rate in Dillingham Census Area is 77.0 births per 1,000 women. Women with the education attainment of college or associate's degree have the highest fertility rate of 117.0 births per 1,000 women, while women with the education attainment of less than high school have the lowest fertility at 24.0 births per 1,000 women. Women with the education attainment of college or associate's degree represent 41.0% of all women with births.
| Educational Attainment | Women with Births | Births / 1,000 Women |
| Less than High School | 6 (7.2%) | 24.0 |
| High School Diploma | 30 (36.1%) | 76.0 |
| College or Associate's Degree | 34 (41.0%) | 117.0 |
| Bachelor's Degree | 7 (8.4%) | 77.0 |
| Graduate Degree | 6 (7.2%) | 105.0 |
| Total | 83 (100.0%) | 77.0 |
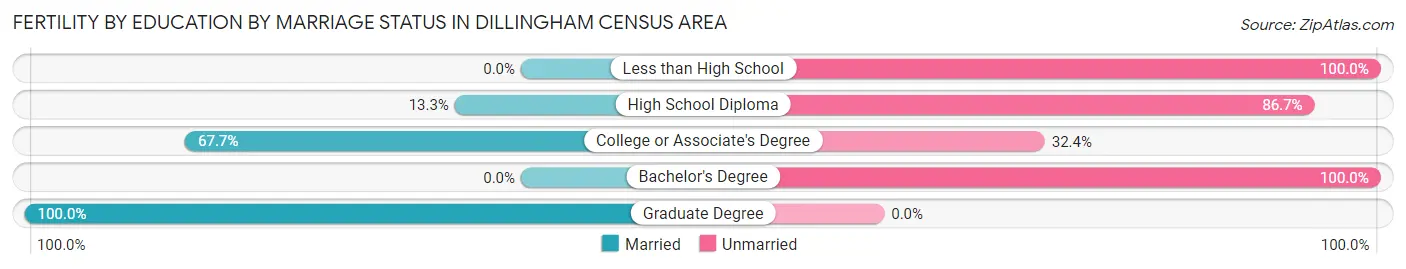
Fertility by Education by Marriage Status in Dillingham Census Area
60.2% of women with births in Dillingham Census Area are unmarried. Women with the educational attainment of graduate degree are most likely to be married with 100.0% of them married at childbirth, while women with the educational attainment of less than high school are least likely to be married with 100.0% of them unmarried at childbirth.
| Educational Attainment | Married | Unmarried |
| Less than High School | 0 (0.0%) | 6 (100.0%) |
| High School Diploma | 4 (13.3%) | 26 (86.7%) |
| College or Associate's Degree | 23 (67.6%) | 11 (32.4%) |
| Bachelor's Degree | 0 (0.0%) | 7 (100.0%) |
| Graduate Degree | 6 (100.0%) | 0 (0.0%) |
| Total | 33 (39.8%) | 50 (60.2%) |
Income in Dillingham Census Area
Income Overview in Dillingham Census Area
Per Capita Income in Dillingham Census Area is $31,948, while median incomes of families and households are $72,500 and $69,412 respectively.
| Characteristic | Number | Measure |
| Per Capita Income | 4,854 | $31,948 |
| Median Family Income | 1,024 | $72,500 |
| Mean Family Income | 1,024 | $86,465 |
| Median Household Income | 1,384 | $69,412 |
| Mean Household Income | 1,384 | $86,298 |
| Income Deficit | 1,024 | $10,536 |
| Wage / Income Gap (%) | 4,854 | 24.47% |
| Wage / Income Gap ($) | 4,854 | 75.53¢ per $1 |
| Gini / Inequality Index | 4,854 | 0.41 |
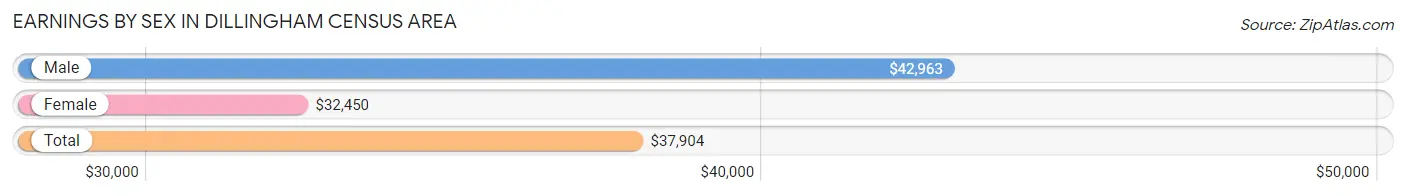
Earnings by Sex in Dillingham Census Area
Average Earnings in Dillingham Census Area are $37,904, $42,963 for men and $32,450 for women, a difference of 24.5%.
| Sex | Number | Average Earnings |
| Male | 1,330 (53.6%) | $42,963 |
| Female | 1,153 (46.4%) | $32,450 |
| Total | 2,483 (100.0%) | $37,904 |
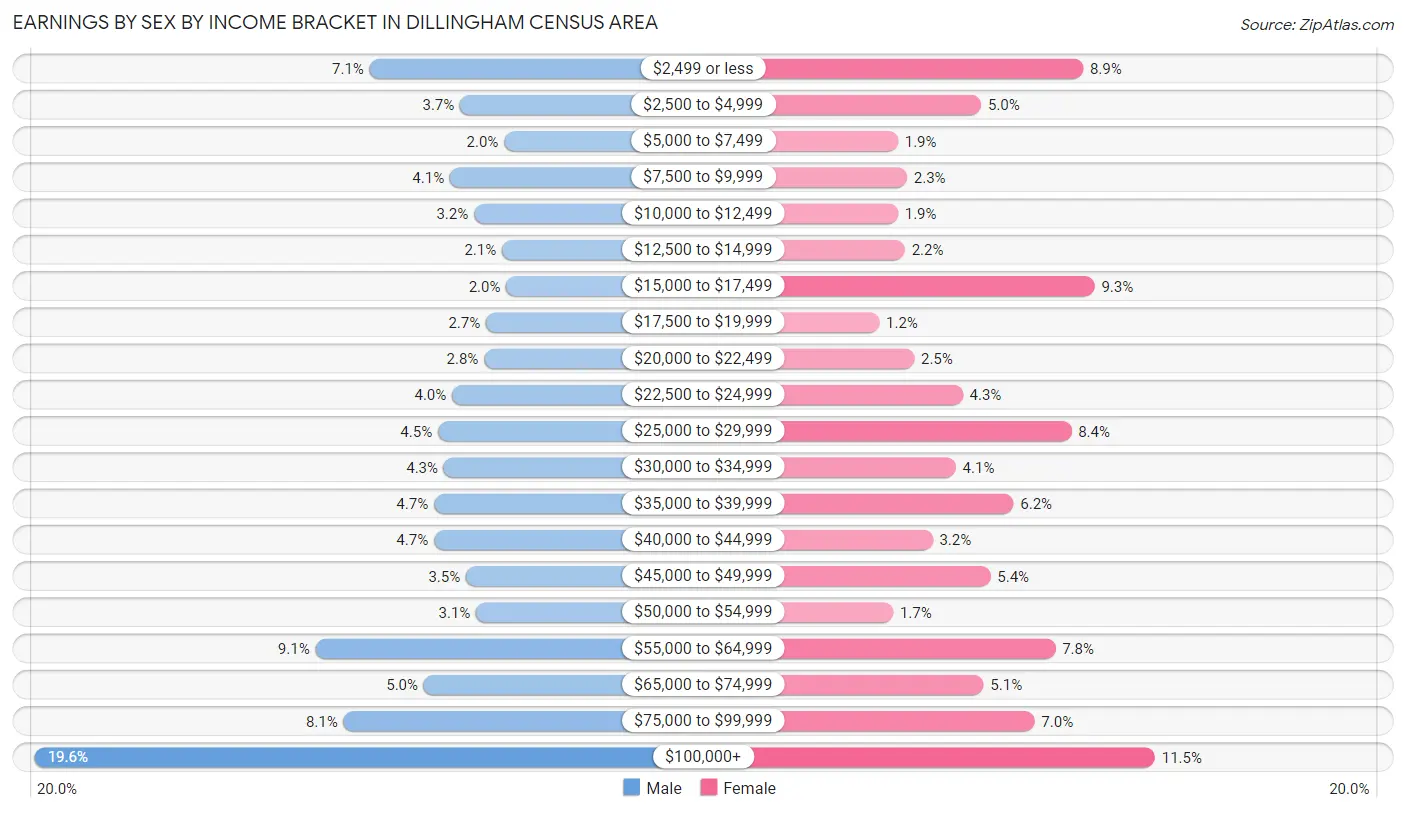
Earnings by Sex by Income Bracket in Dillingham Census Area
The most common earnings brackets in Dillingham Census Area are $100,000+ for men (261 | 19.6%) and $100,000+ for women (133 | 11.5%).
| Income | Male | Female |
| $2,499 or less | 94 (7.1%) | 102 (8.8%) |
| $2,500 to $4,999 | 49 (3.7%) | 58 (5.0%) |
| $5,000 to $7,499 | 27 (2.0%) | 22 (1.9%) |
| $7,500 to $9,999 | 54 (4.1%) | 26 (2.2%) |
| $10,000 to $12,499 | 42 (3.2%) | 22 (1.9%) |
| $12,500 to $14,999 | 28 (2.1%) | 25 (2.2%) |
| $15,000 to $17,499 | 26 (1.9%) | 107 (9.3%) |
| $17,500 to $19,999 | 36 (2.7%) | 14 (1.2%) |
| $20,000 to $22,499 | 37 (2.8%) | 29 (2.5%) |
| $22,500 to $24,999 | 53 (4.0%) | 50 (4.3%) |
| $25,000 to $29,999 | 60 (4.5%) | 97 (8.4%) |
| $30,000 to $34,999 | 57 (4.3%) | 47 (4.1%) |
| $35,000 to $39,999 | 62 (4.7%) | 72 (6.2%) |
| $40,000 to $44,999 | 62 (4.7%) | 37 (3.2%) |
| $45,000 to $49,999 | 46 (3.5%) | 62 (5.4%) |
| $50,000 to $54,999 | 41 (3.1%) | 20 (1.7%) |
| $55,000 to $64,999 | 121 (9.1%) | 90 (7.8%) |
| $65,000 to $74,999 | 67 (5.0%) | 59 (5.1%) |
| $75,000 to $99,999 | 107 (8.1%) | 81 (7.0%) |
| $100,000+ | 261 (19.6%) | 133 (11.5%) |
| Total | 1,330 (100.0%) | 1,153 (100.0%) |
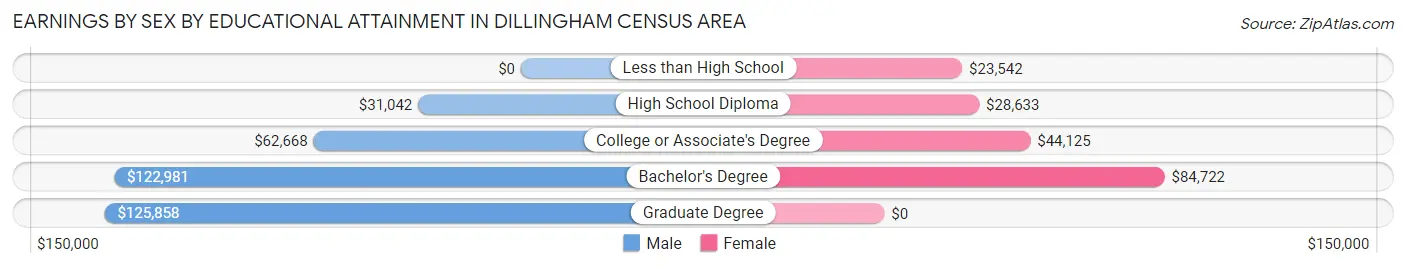
Earnings by Sex by Educational Attainment in Dillingham Census Area
Average earnings in Dillingham Census Area are $49,167 for men and $37,949 for women, a difference of 22.8%. Men with an educational attainment of graduate degree enjoy the highest average annual earnings of $125,858, while those with high school diploma education earn the least with $31,042. Women with an educational attainment of bachelor's degree earn the most with the average annual earnings of $84,722, while those with less than high school education have the smallest earnings of $23,542.
| Educational Attainment | Male Income | Female Income |
| Less than High School | - | - |
| High School Diploma | $31,042 | $28,633 |
| College or Associate's Degree | $62,668 | $44,125 |
| Bachelor's Degree | $122,981 | $84,722 |
| Graduate Degree | $125,858 | $0 |
| Total | $49,167 | $37,949 |
Family Income in Dillingham Census Area
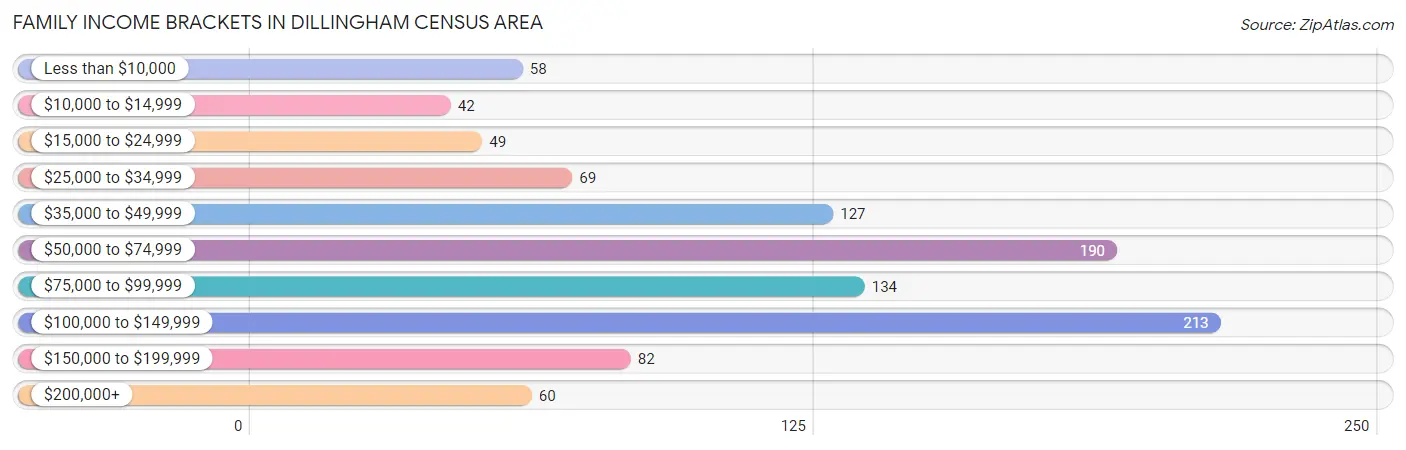
Family Income Brackets in Dillingham Census Area
According to the Dillingham Census Area family income data, there are 213 families falling into the $100,000 to $149,999 income range, which is the most common income bracket and makes up 20.8% of all families. Conversely, the $10,000 to $14,999 income bracket is the least frequent group with only 42 families (4.1%) belonging to this category.
| Income Bracket | # Families | % Families |
| Less than $10,000 | 58 | 5.7% |
| $10,000 to $14,999 | 42 | 4.1% |
| $15,000 to $24,999 | 49 | 4.8% |
| $25,000 to $34,999 | 69 | 6.7% |
| $35,000 to $49,999 | 127 | 12.4% |
| $50,000 to $74,999 | 190 | 18.6% |
| $75,000 to $99,999 | 134 | 13.1% |
| $100,000 to $149,999 | 213 | 20.8% |
| $150,000 to $199,999 | 82 | 8.0% |
| $200,000+ | 60 | 5.9% |
Family Income by Famaliy Size in Dillingham Census Area
5-person families (155 | 15.1%) account for the highest median family income in Dillingham Census Area with $88,958 per family, while 2-person families (322 | 31.5%) have the highest median income of $28,676 per family member.
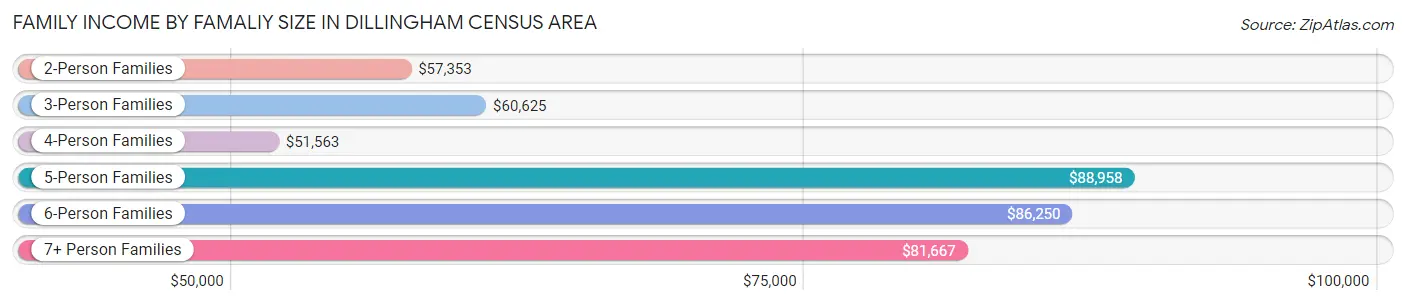
| Income Bracket | # Families | Median Income |
| 2-Person Families | 322 (31.5%) | $57,353 |
| 3-Person Families | 180 (17.6%) | $60,625 |
| 4-Person Families | 193 (18.9%) | $51,563 |
| 5-Person Families | 155 (15.1%) | $88,958 |
| 6-Person Families | 66 (6.5%) | $86,250 |
| 7+ Person Families | 108 (10.5%) | $81,667 |
| Total | 1,024 (100.0%) | $72,500 |
Family Income by Number of Earners in Dillingham Census Area
The median family income in Dillingham Census Area is $72,500, with families comprising 3+ earners (156) having the highest median family income of $117,500, while families with no earners (117) have the lowest median family income of $23,393, accounting for 15.2% and 11.4% of families, respectively.
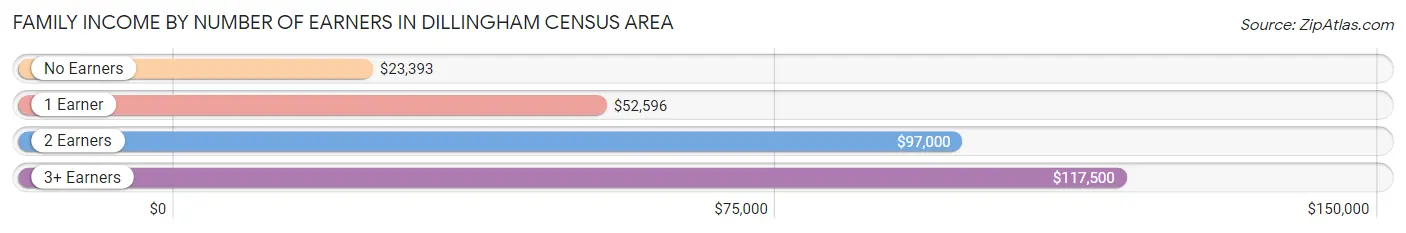
| Number of Earners | # Families | Median Income |
| No Earners | 117 (11.4%) | $23,393 |
| 1 Earner | 399 (39.0%) | $52,596 |
| 2 Earners | 352 (34.4%) | $97,000 |
| 3+ Earners | 156 (15.2%) | $117,500 |
| Total | 1,024 (100.0%) | $72,500 |
Household Income in Dillingham Census Area
Household Income Brackets in Dillingham Census Area
With 233 households falling in the category, the $50,000 to $74,999 income range is the most frequent in Dillingham Census Area, accounting for 16.8% of all households. In contrast, only 51 households (3.7%) fall into the less than $10,000 income bracket, making it the least populous group.
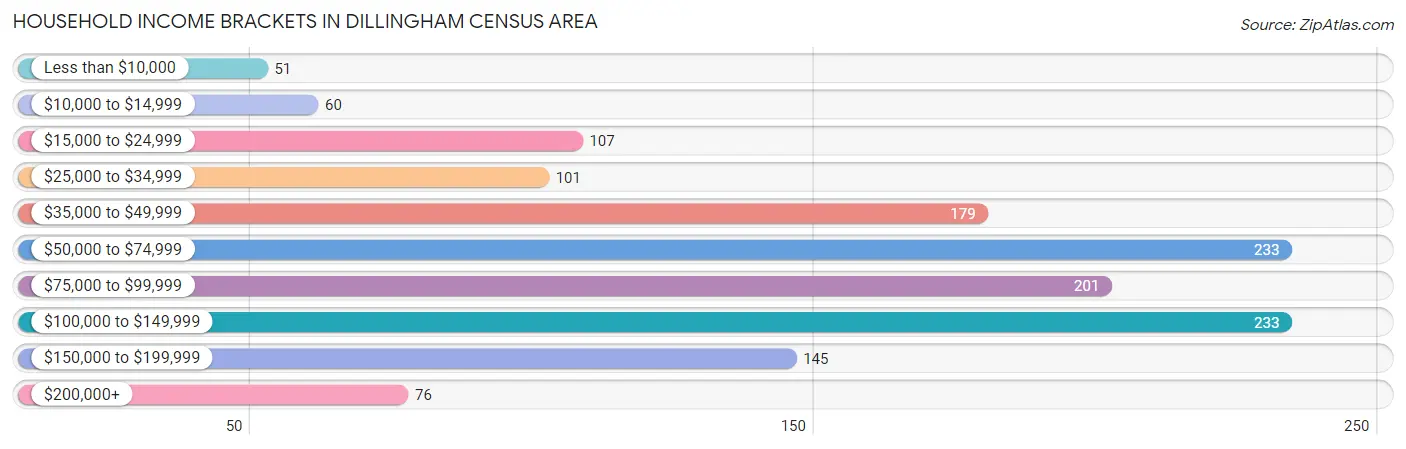
| Income Bracket | # Households | % Households |
| Less than $10,000 | 51 | 3.7% |
| $10,000 to $14,999 | 60 | 4.3% |
| $15,000 to $24,999 | 107 | 7.7% |
| $25,000 to $34,999 | 101 | 7.3% |
| $35,000 to $49,999 | 179 | 12.9% |
| $50,000 to $74,999 | 233 | 16.8% |
| $75,000 to $99,999 | 201 | 14.5% |
| $100,000 to $149,999 | 233 | 16.8% |
| $150,000 to $199,999 | 145 | 10.5% |
| $200,000+ | 76 | 5.5% |
Household Income by Householder Age in Dillingham Census Area
The median household income in Dillingham Census Area is $69,412, with the highest median household income of $82,500 found in the 45 to 64 years age bracket for the primary householder. A total of 508 households (36.7%) fall into this category. Meanwhile, the 15 to 24 years age bracket for the primary householder has the lowest median household income of $51,786, with 46 households (3.3%) in this group.
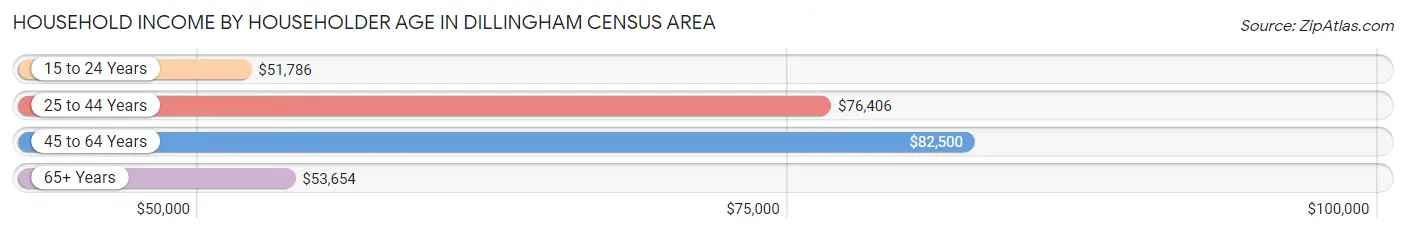
| Income Bracket | # Households | Median Income |
| 15 to 24 Years | 46 (3.3%) | $51,786 |
| 25 to 44 Years | 514 (37.1%) | $76,406 |
| 45 to 64 Years | 508 (36.7%) | $82,500 |
| 65+ Years | 316 (22.8%) | $53,654 |
| Total | 1,384 (100.0%) | $69,412 |
Poverty in Dillingham Census Area
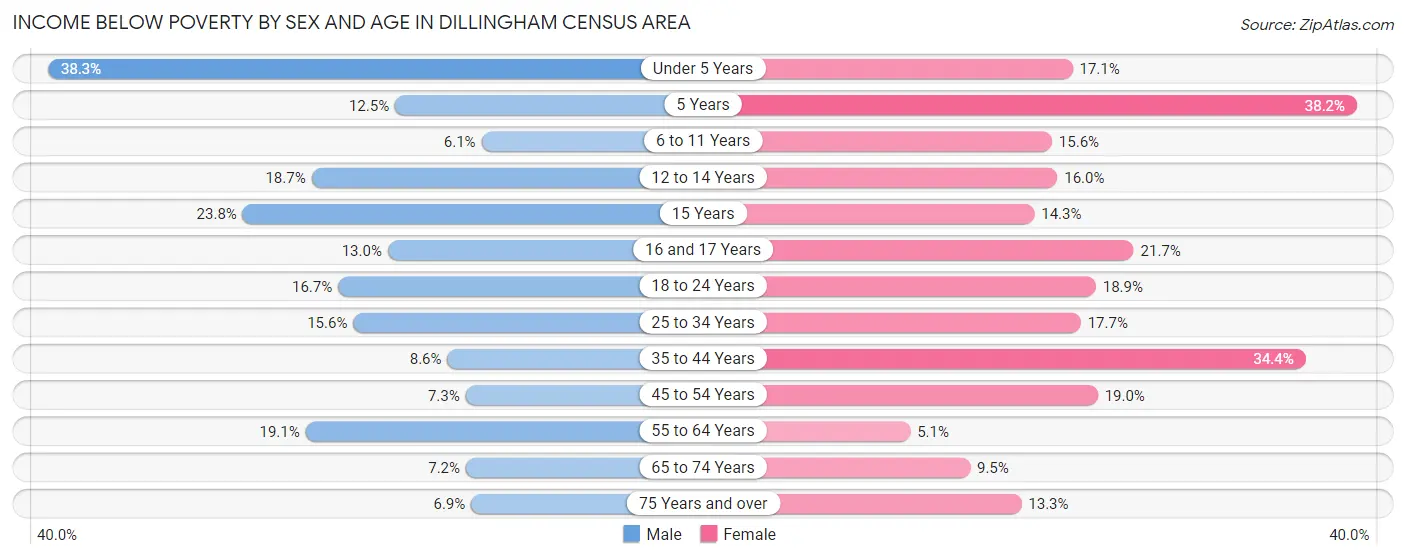
Income Below Poverty by Sex and Age in Dillingham Census Area
With 14.6% poverty level for males and 17.3% for females among the residents of Dillingham Census Area, under 5 year old males and 5 year old females are the most vulnerable to poverty, with 75 males (38.3%) and 13 females (38.2%) in their respective age groups living below the poverty level.
| Age Bracket | Male | Female |
| Under 5 Years | 75 (38.3%) | 37 (17.1%) |
| 5 Years | 3 (12.5%) | 13 (38.2%) |
| 6 to 11 Years | 16 (6.1%) | 39 (15.6%) |
| 12 to 14 Years | 23 (18.7%) | 20 (16.0%) |
| 15 Years | 10 (23.8%) | 6 (14.3%) |
| 16 and 17 Years | 9 (13.0%) | 13 (21.7%) |
| 18 to 24 Years | 43 (16.7%) | 43 (18.9%) |
| 25 to 34 Years | 61 (15.6%) | 66 (17.7%) |
| 35 to 44 Years | 23 (8.6%) | 84 (34.4%) |
| 45 to 54 Years | 17 (7.3%) | 42 (19.0%) |
| 55 to 64 Years | 58 (19.1%) | 15 (5.1%) |
| 65 to 74 Years | 16 (7.2%) | 18 (9.5%) |
| 75 Years and over | 5 (6.9%) | 10 (13.3%) |
| Total | 359 (14.6%) | 406 (17.3%) |
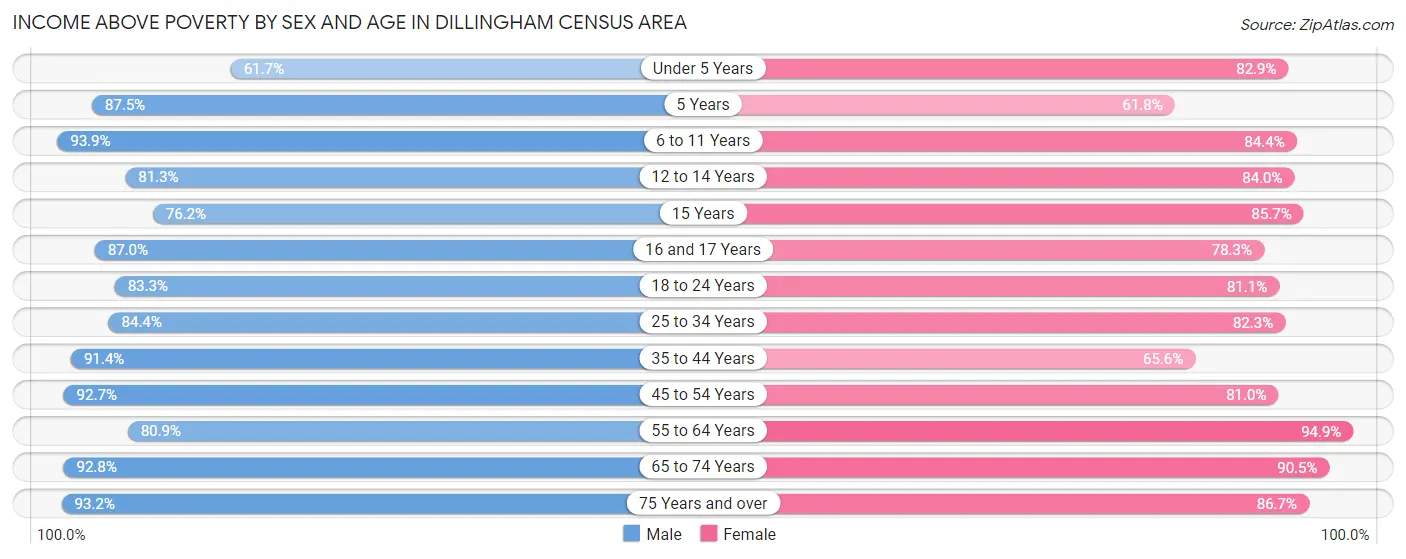
Income Above Poverty by Sex and Age in Dillingham Census Area
According to the poverty statistics in Dillingham Census Area, males aged 6 to 11 years and females aged 55 to 64 years are the age groups that are most secure financially, with 93.9% of males and 94.9% of females in these age groups living above the poverty line.
| Age Bracket | Male | Female |
| Under 5 Years | 121 (61.7%) | 179 (82.9%) |
| 5 Years | 21 (87.5%) | 21 (61.8%) |
| 6 to 11 Years | 247 (93.9%) | 211 (84.4%) |
| 12 to 14 Years | 100 (81.3%) | 105 (84.0%) |
| 15 Years | 32 (76.2%) | 36 (85.7%) |
| 16 and 17 Years | 60 (87.0%) | 47 (78.3%) |
| 18 to 24 Years | 214 (83.3%) | 185 (81.1%) |
| 25 to 34 Years | 330 (84.4%) | 306 (82.3%) |
| 35 to 44 Years | 244 (91.4%) | 160 (65.6%) |
| 45 to 54 Years | 217 (92.7%) | 179 (81.0%) |
| 55 to 64 Years | 245 (80.9%) | 280 (94.9%) |
| 65 to 74 Years | 205 (92.8%) | 171 (90.5%) |
| 75 Years and over | 68 (93.1%) | 65 (86.7%) |
| Total | 2,104 (85.4%) | 1,945 (82.7%) |
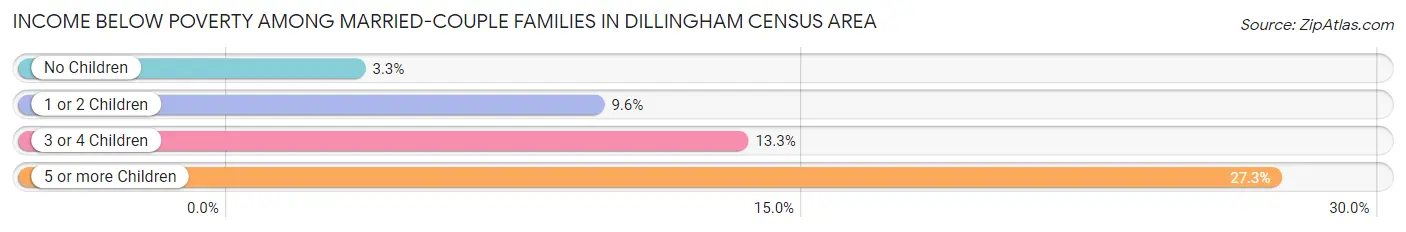
Income Below Poverty Among Married-Couple Families in Dillingham Census Area
The poverty statistics for married-couple families in Dillingham Census Area show that 9.5% or 51 of the total 536 families live below the poverty line. Families with 5 or more children have the highest poverty rate of 27.3%, comprising of 9 families. On the other hand, families with no children have the lowest poverty rate of 3.3%, which includes 6 families.
| Children | Above Poverty | Below Poverty |
| No Children | 174 (96.7%) | 6 (3.3%) |
| 1 or 2 Children | 170 (90.4%) | 18 (9.6%) |
| 3 or 4 Children | 117 (86.7%) | 18 (13.3%) |
| 5 or more Children | 24 (72.7%) | 9 (27.3%) |
| Total | 485 (90.5%) | 51 (9.5%) |
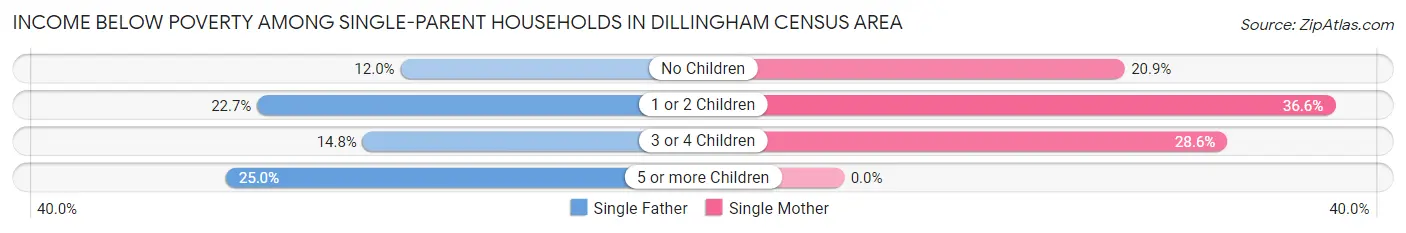
Income Below Poverty Among Single-Parent Households in Dillingham Census Area
According to the poverty data in Dillingham Census Area, 18.1% or 29 single-father households and 30.8% or 101 single-mother households are living below the poverty line. Among single-father households, those with 5 or more children have the highest poverty rate, with 2 households (25.0%) experiencing poverty. Likewise, among single-mother households, those with 1 or 2 children have the highest poverty rate, with 67 households (36.6%) falling below the poverty line.
| Children | Single Father | Single Mother |
| No Children | 6 (12.0%) | 14 (20.9%) |
| 1 or 2 Children | 17 (22.7%) | 67 (36.6%) |
| 3 or 4 Children | 4 (14.8%) | 20 (28.6%) |
| 5 or more Children | 2 (25.0%) | 0 (0.0%) |
| Total | 29 (18.1%) | 101 (30.8%) |
Income Below Poverty Among Married-Couple vs Single-Parent Households in Dillingham Census Area
The poverty data for Dillingham Census Area shows that 51 of the married-couple family households (9.5%) and 130 of the single-parent households (26.6%) are living below the poverty level. Within the married-couple family households, those with 5 or more children have the highest poverty rate, with 9 households (27.3%) falling below the poverty line. Among the single-parent households, those with 1 or 2 children have the highest poverty rate, with 84 household (32.6%) living below poverty.
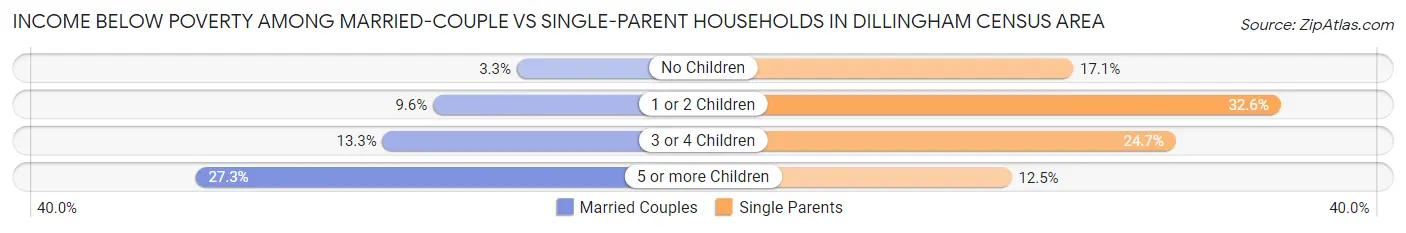
| Children | Married-Couple Families | Single-Parent Households |
| No Children | 6 (3.3%) | 20 (17.1%) |
| 1 or 2 Children | 18 (9.6%) | 84 (32.6%) |
| 3 or 4 Children | 18 (13.3%) | 24 (24.7%) |
| 5 or more Children | 9 (27.3%) | 2 (12.5%) |
| Total | 51 (9.5%) | 130 (26.6%) |
Employment Characteristics in Dillingham Census Area
Employment by Class of Employer in Dillingham Census Area
Among the 1,805 employed individuals in Dillingham Census Area, private company employees (532 | 29.5%), not-for-profit organizations (443 | 24.5%), and local government employees (395 | 21.9%) make up the most common classes of employment.
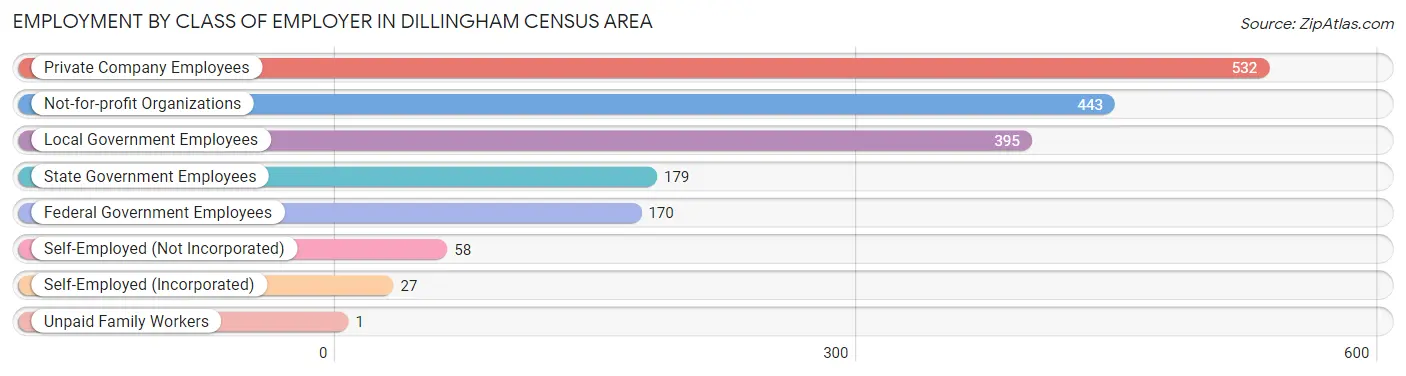
| Employer Class | # Employees | % Employees |
| Private Company Employees | 532 | 29.5% |
| Self-Employed (Incorporated) | 27 | 1.5% |
| Self-Employed (Not Incorporated) | 58 | 3.2% |
| Not-for-profit Organizations | 443 | 24.5% |
| Local Government Employees | 395 | 21.9% |
| State Government Employees | 179 | 9.9% |
| Federal Government Employees | 170 | 9.4% |
| Unpaid Family Workers | 1 | 0.1% |
| Total | 1,805 | 100.0% |
Employment Status by Age in Dillingham Census Area
According to the labor force statistics for Dillingham Census Area, out of the total population over 16 years of age (3,519), 62.0% or 2,182 individuals are in the labor force, with 11.3% or 247 of them unemployed. The age group with the highest labor force participation rate is 25 to 29 years, with 76.4% or 292 individuals in the labor force. Within the labor force, the 16 to 19 years age range has the highest percentage of unemployed individuals, with 21.7% or 15 of them being unemployed.
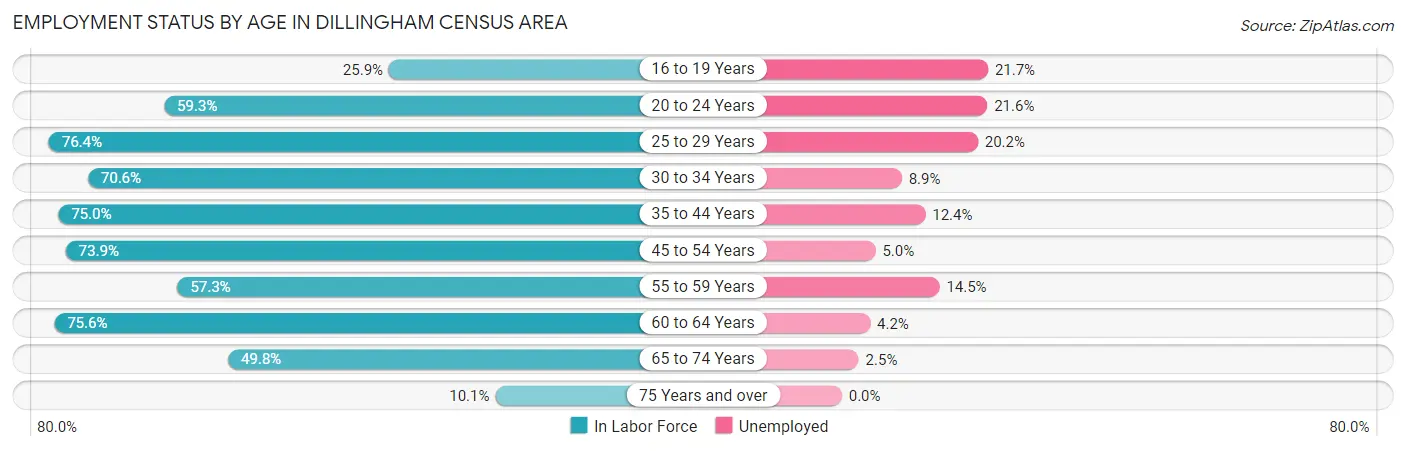
| Age Bracket | In Labor Force | Unemployed |
| 16 to 19 Years | 69 (25.9%) | 15 (21.7%) |
| 20 to 24 Years | 208 (59.3%) | 45 (21.6%) |
| 25 to 29 Years | 292 (76.4%) | 59 (20.2%) |
| 30 to 34 Years | 269 (70.6%) | 24 (8.9%) |
| 35 to 44 Years | 386 (75.0%) | 48 (12.4%) |
| 45 to 54 Years | 337 (73.9%) | 17 (5.0%) |
| 55 to 59 Years | 165 (57.3%) | 24 (14.5%) |
| 60 to 64 Years | 236 (75.6%) | 10 (4.2%) |
| 65 to 74 Years | 204 (49.8%) | 5 (2.5%) |
| 75 Years and over | 16 (10.1%) | 0 (0.0%) |
| Total | 2,182 (62.0%) | 247 (11.3%) |
Employment Status by Educational Attainment in Dillingham Census Area
According to labor force statistics for Dillingham Census Area, 72.2% of individuals (1,685) out of the total population between 25 and 64 years of age (2,334) are in the labor force, with 10.8% or 182 of them being unemployed. The group with the highest labor force participation rate are those with the educational attainment of bachelor's degree or higher, with 93.7% or 415 individuals in the labor force. Within the labor force, individuals with less than high school education have the highest percentage of unemployment, with 32.4% or 22 of them being unemployed.
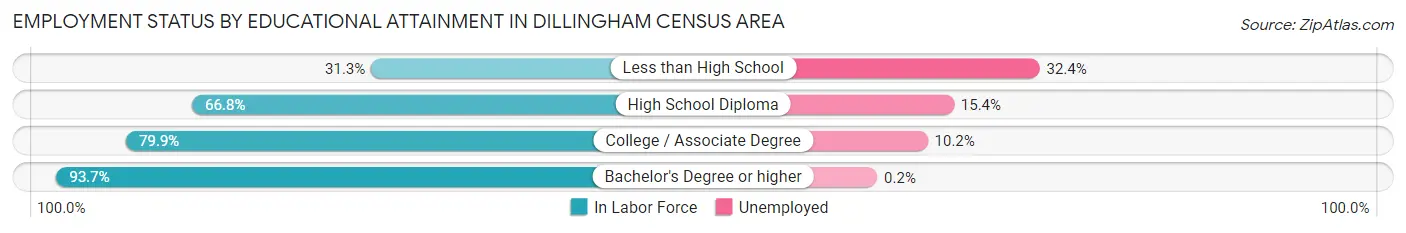
| Educational Attainment | In Labor Force | Unemployed |
| Less than High School | 68 (31.3%) | 70 (32.4%) |
| High School Diploma | 693 (66.8%) | 160 (15.4%) |
| College / Associate Degree | 509 (79.9%) | 65 (10.2%) |
| Bachelor's Degree or higher | 415 (93.7%) | 1 (0.2%) |
| Total | 1,685 (72.2%) | 252 (10.8%) |
Employment Occupations by Sex in Dillingham Census Area
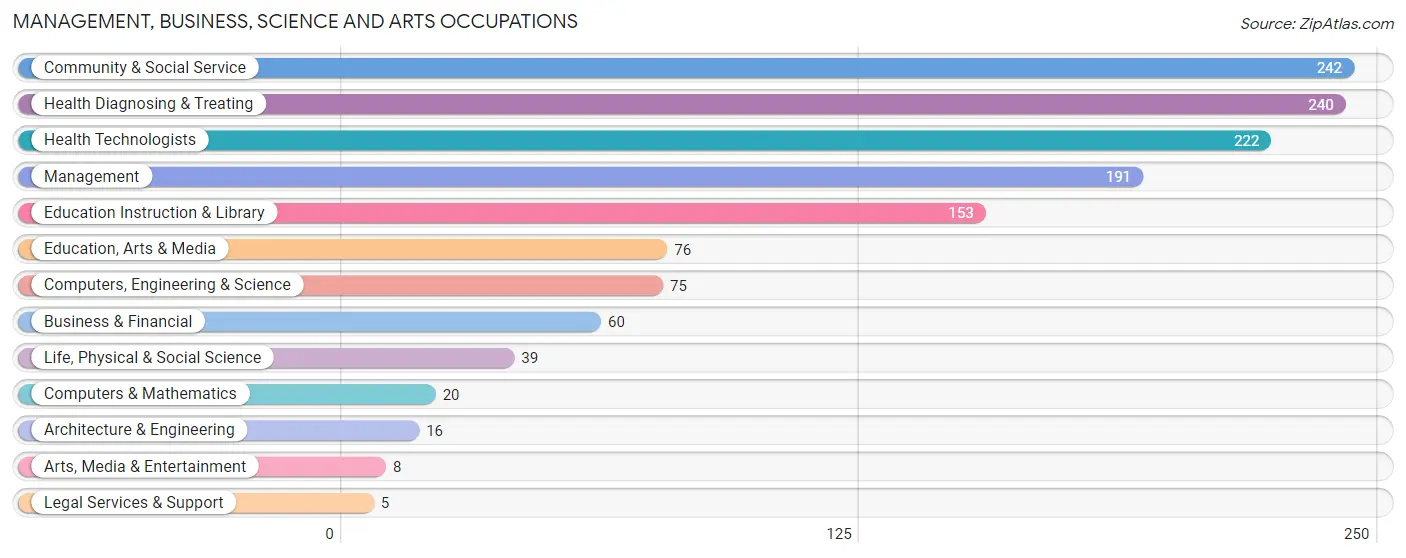
Management, Business, Science and Arts Occupations
The most common Management, Business, Science and Arts occupations in Dillingham Census Area are Community & Social Service (242 | 12.5%), Health Diagnosing & Treating (240 | 12.4%), Health Technologists (222 | 11.5%), Management (191 | 9.9%), and Education Instruction & Library (153 | 7.9%).
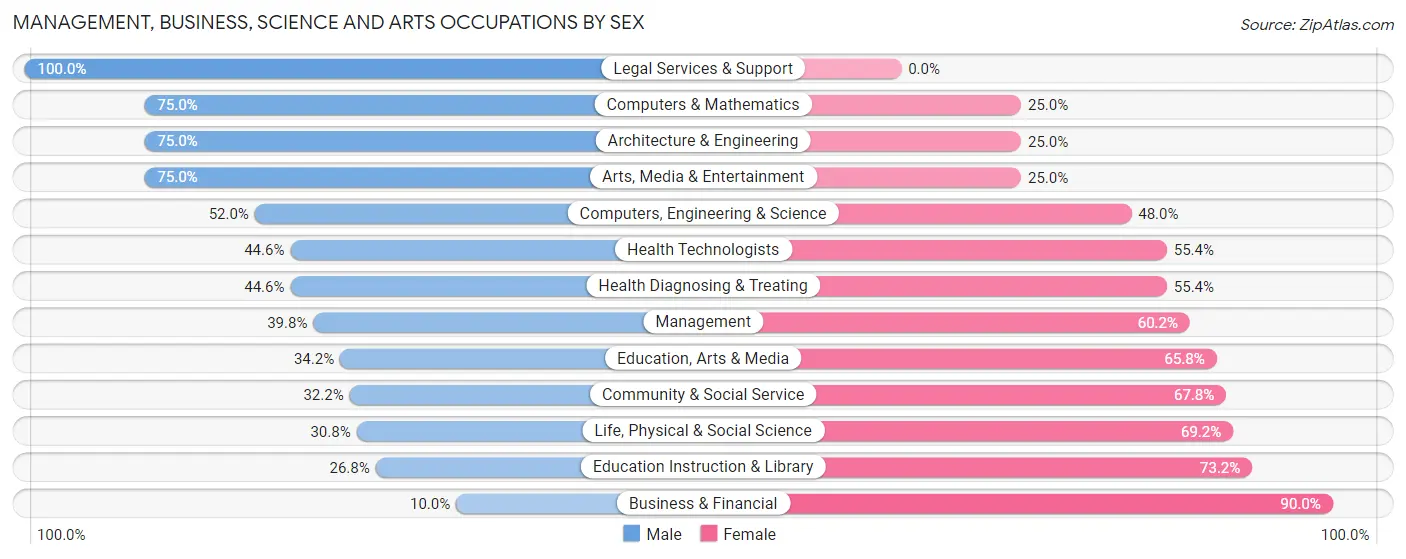
Management, Business, Science and Arts Occupations by Sex
Within the Management, Business, Science and Arts occupations in Dillingham Census Area, the most male-oriented occupations are Legal Services & Support (100.0%), Computers & Mathematics (75.0%), and Architecture & Engineering (75.0%), while the most female-oriented occupations are Business & Financial (90.0%), Education Instruction & Library (73.2%), and Life, Physical & Social Science (69.2%).
| Occupation | Male | Female |
| Management | 76 (39.8%) | 115 (60.2%) |
| Business & Financial | 6 (10.0%) | 54 (90.0%) |
| Computers, Engineering & Science | 39 (52.0%) | 36 (48.0%) |
| Computers & Mathematics | 15 (75.0%) | 5 (25.0%) |
| Architecture & Engineering | 12 (75.0%) | 4 (25.0%) |
| Life, Physical & Social Science | 12 (30.8%) | 27 (69.2%) |
| Community & Social Service | 78 (32.2%) | 164 (67.8%) |
| Education, Arts & Media | 26 (34.2%) | 50 (65.8%) |
| Legal Services & Support | 5 (100.0%) | 0 (0.0%) |
| Education Instruction & Library | 41 (26.8%) | 112 (73.2%) |
| Arts, Media & Entertainment | 6 (75.0%) | 2 (25.0%) |
| Health Diagnosing & Treating | 107 (44.6%) | 133 (55.4%) |
| Health Technologists | 99 (44.6%) | 123 (55.4%) |
| Total (Category) | 306 (37.9%) | 502 (62.1%) |
| Total (Overall) | 995 (51.4%) | 940 (48.6%) |
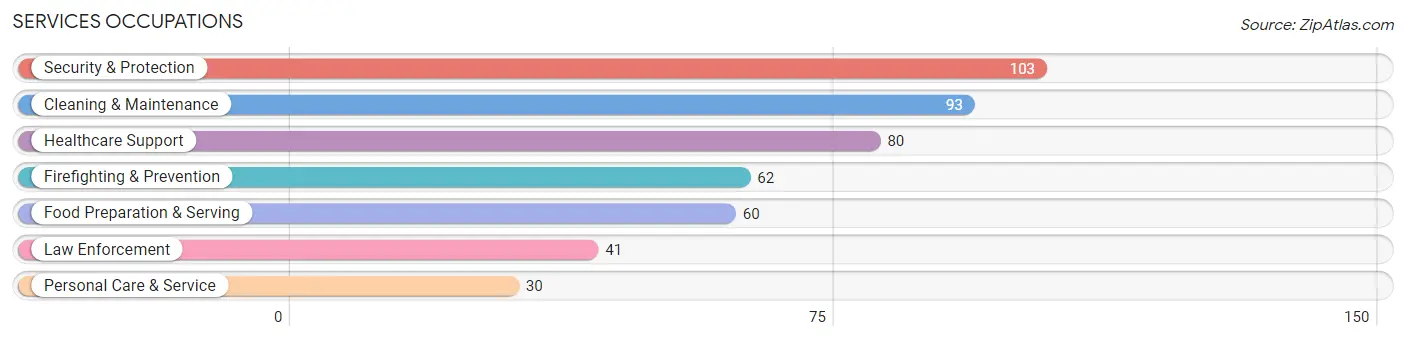
Services Occupations
The most common Services occupations in Dillingham Census Area are Security & Protection (103 | 5.3%), Cleaning & Maintenance (93 | 4.8%), Healthcare Support (80 | 4.1%), Firefighting & Prevention (62 | 3.2%), and Food Preparation & Serving (60 | 3.1%).
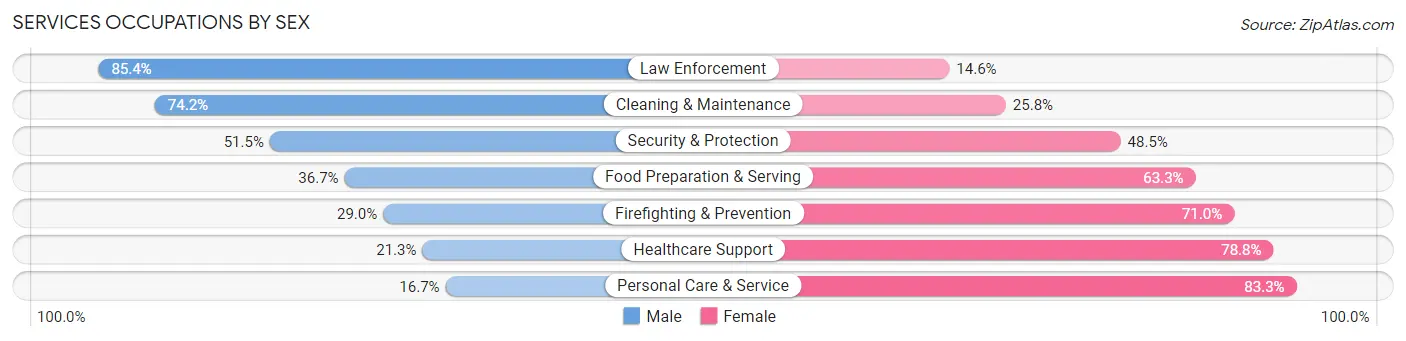
Services Occupations by Sex
Within the Services occupations in Dillingham Census Area, the most male-oriented occupations are Law Enforcement (85.4%), Cleaning & Maintenance (74.2%), and Security & Protection (51.5%), while the most female-oriented occupations are Personal Care & Service (83.3%), Healthcare Support (78.7%), and Firefighting & Prevention (71.0%).
| Occupation | Male | Female |
| Healthcare Support | 17 (21.2%) | 63 (78.7%) |
| Security & Protection | 53 (51.5%) | 50 (48.5%) |
| Firefighting & Prevention | 18 (29.0%) | 44 (71.0%) |
| Law Enforcement | 35 (85.4%) | 6 (14.6%) |
| Food Preparation & Serving | 22 (36.7%) | 38 (63.3%) |
| Cleaning & Maintenance | 69 (74.2%) | 24 (25.8%) |
| Personal Care & Service | 5 (16.7%) | 25 (83.3%) |
| Total (Category) | 166 (45.4%) | 200 (54.6%) |
| Total (Overall) | 995 (51.4%) | 940 (48.6%) |
Sales and Office Occupations
The most common Sales and Office occupations in Dillingham Census Area are Office & Administration (169 | 8.7%), and Sales & Related (98 | 5.1%).
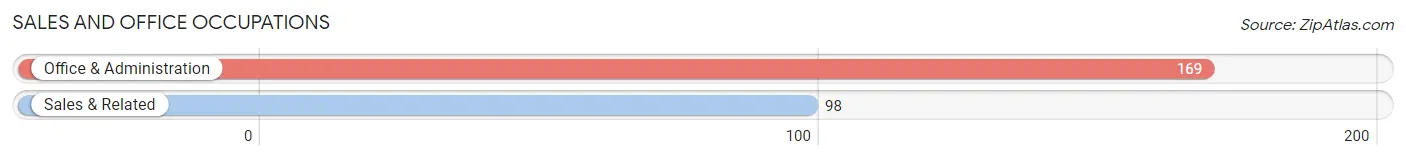
Sales and Office Occupations by Sex
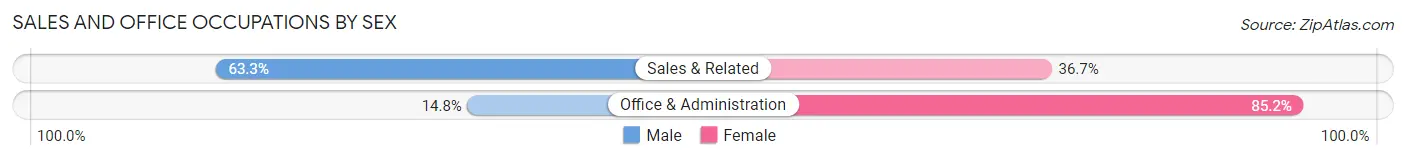
| Occupation | Male | Female |
| Sales & Related | 62 (63.3%) | 36 (36.7%) |
| Office & Administration | 25 (14.8%) | 144 (85.2%) |
| Total (Category) | 87 (32.6%) | 180 (67.4%) |
| Total (Overall) | 995 (51.4%) | 940 (48.6%) |
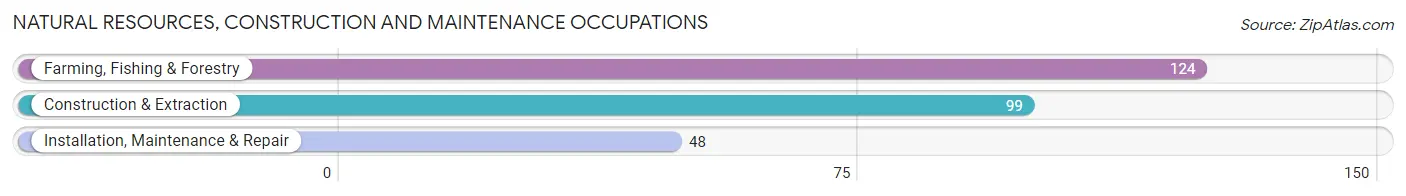
Natural Resources, Construction and Maintenance Occupations
The most common Natural Resources, Construction and Maintenance occupations in Dillingham Census Area are Farming, Fishing & Forestry (124 | 6.4%), Construction & Extraction (99 | 5.1%), and Installation, Maintenance & Repair (48 | 2.5%).
Natural Resources, Construction and Maintenance Occupations by Sex
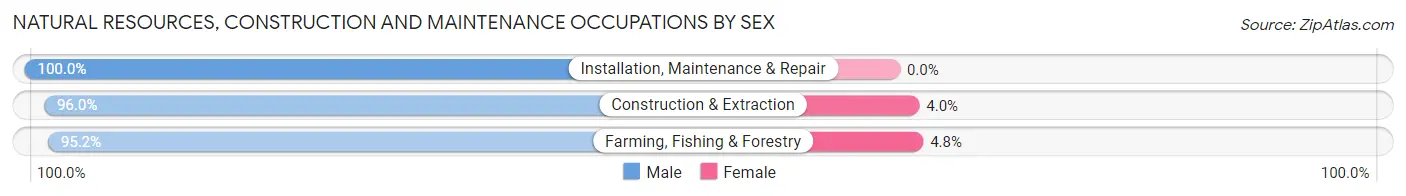
| Occupation | Male | Female |
| Farming, Fishing & Forestry | 118 (95.2%) | 6 (4.8%) |
| Construction & Extraction | 95 (96.0%) | 4 (4.0%) |
| Installation, Maintenance & Repair | 48 (100.0%) | 0 (0.0%) |
| Total (Category) | 261 (96.3%) | 10 (3.7%) |
| Total (Overall) | 995 (51.4%) | 940 (48.6%) |
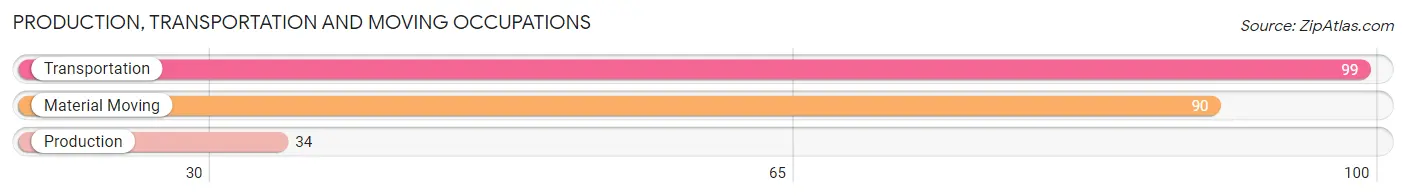
Production, Transportation and Moving Occupations
The most common Production, Transportation and Moving occupations in Dillingham Census Area are Transportation (99 | 5.1%), Material Moving (90 | 4.6%), and Production (34 | 1.8%).
Production, Transportation and Moving Occupations by Sex
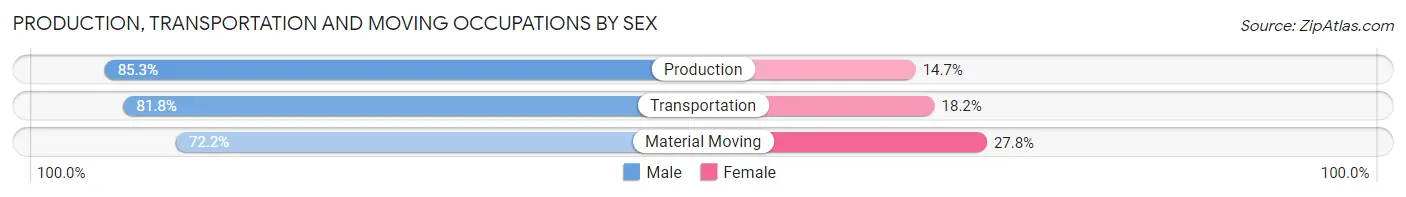
| Occupation | Male | Female |
| Production | 29 (85.3%) | 5 (14.7%) |
| Transportation | 81 (81.8%) | 18 (18.2%) |
| Material Moving | 65 (72.2%) | 25 (27.8%) |
| Total (Category) | 175 (78.5%) | 48 (21.5%) |
| Total (Overall) | 995 (51.4%) | 940 (48.6%) |
Employment Industries by Sex in Dillingham Census Area
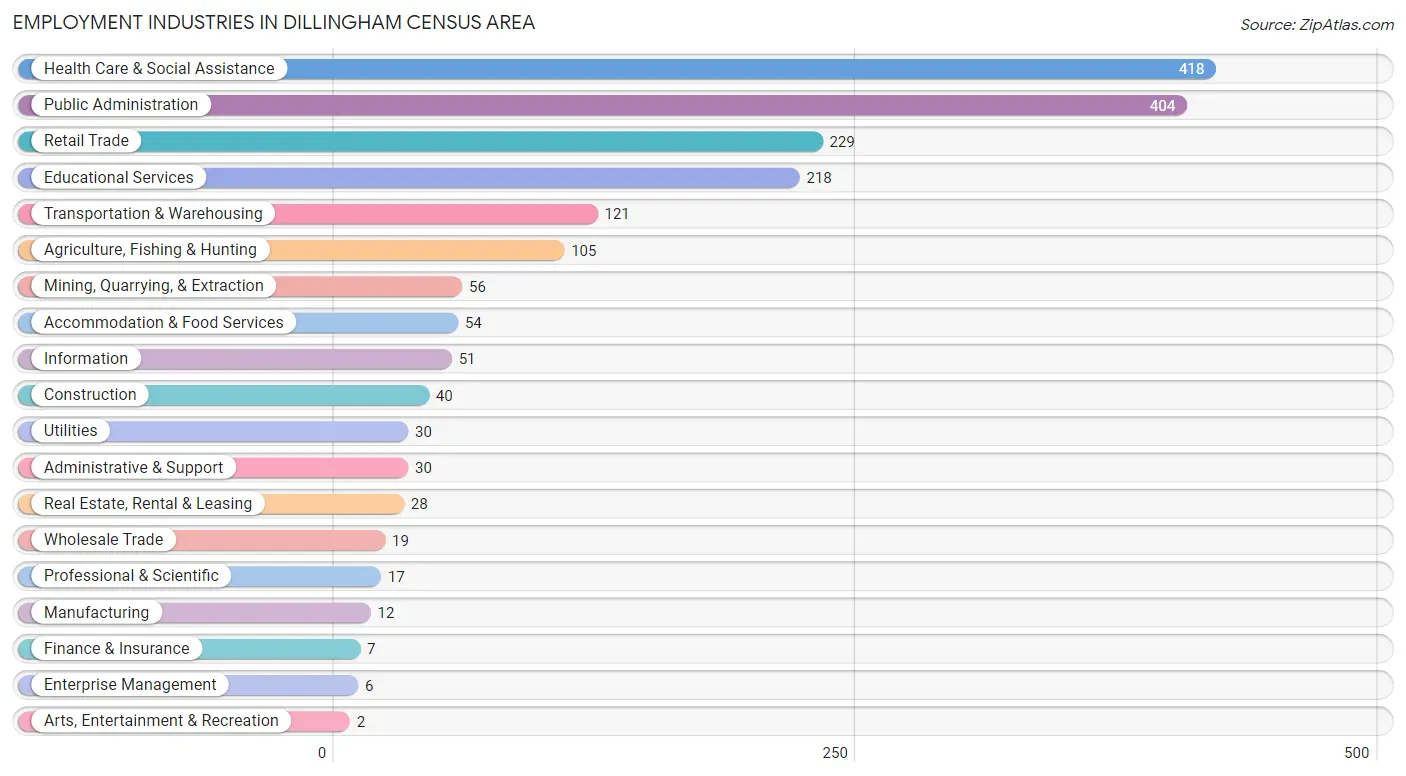
Employment Industries in Dillingham Census Area
The major employment industries in Dillingham Census Area include Health Care & Social Assistance (418 | 21.6%), Public Administration (404 | 20.9%), Retail Trade (229 | 11.8%), Educational Services (218 | 11.3%), and Transportation & Warehousing (121 | 6.2%).
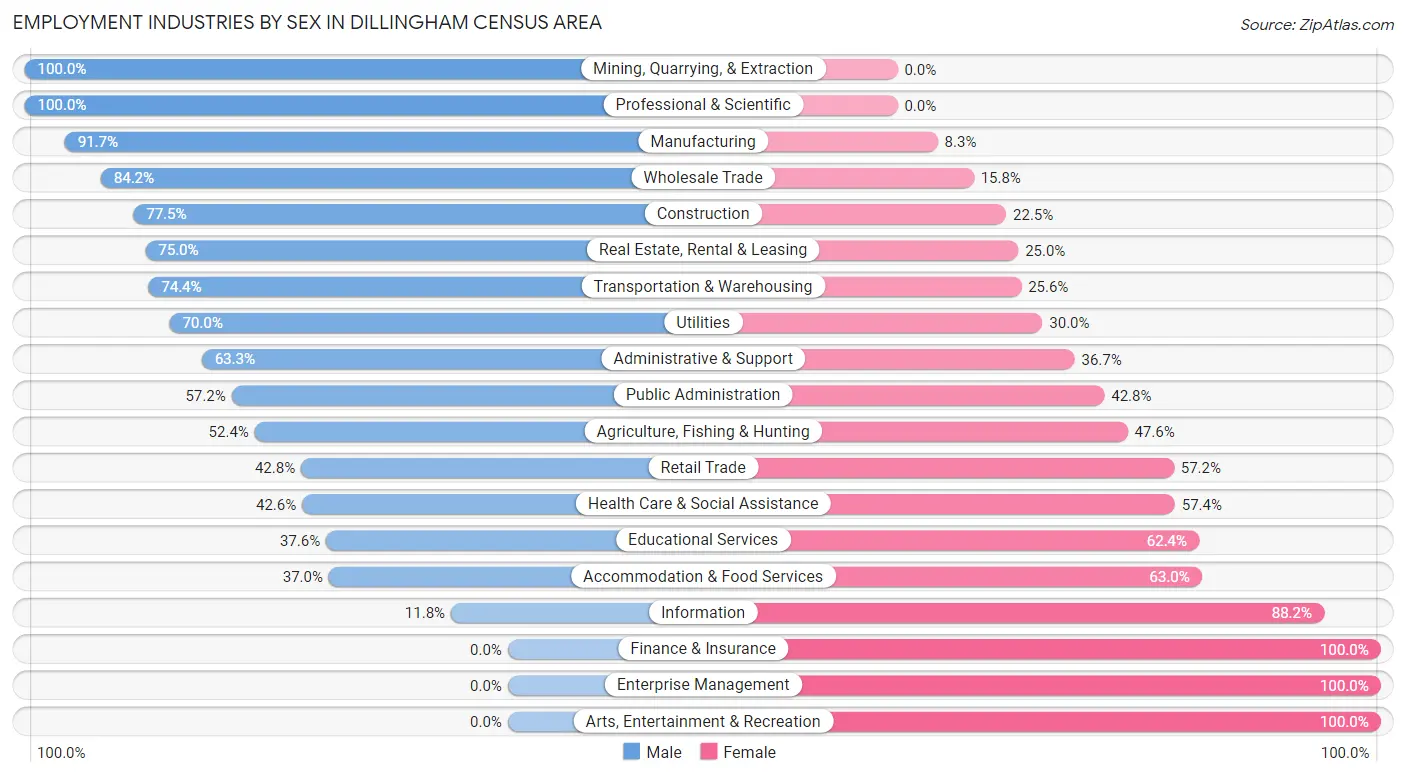
Employment Industries by Sex in Dillingham Census Area
The Dillingham Census Area industries that see more men than women are Mining, Quarrying, & Extraction (100.0%), Professional & Scientific (100.0%), and Manufacturing (91.7%), whereas the industries that tend to have a higher number of women are Finance & Insurance (100.0%), Enterprise Management (100.0%), and Arts, Entertainment & Recreation (100.0%).
| Industry | Male | Female |
| Agriculture, Fishing & Hunting | 55 (52.4%) | 50 (47.6%) |
| Mining, Quarrying, & Extraction | 56 (100.0%) | 0 (0.0%) |
| Construction | 31 (77.5%) | 9 (22.5%) |
| Manufacturing | 11 (91.7%) | 1 (8.3%) |
| Wholesale Trade | 16 (84.2%) | 3 (15.8%) |
| Retail Trade | 98 (42.8%) | 131 (57.2%) |
| Transportation & Warehousing | 90 (74.4%) | 31 (25.6%) |
| Utilities | 21 (70.0%) | 9 (30.0%) |
| Information | 6 (11.8%) | 45 (88.2%) |
| Finance & Insurance | 0 (0.0%) | 7 (100.0%) |
| Real Estate, Rental & Leasing | 21 (75.0%) | 7 (25.0%) |
| Professional & Scientific | 17 (100.0%) | 0 (0.0%) |
| Enterprise Management | 0 (0.0%) | 6 (100.0%) |
| Administrative & Support | 19 (63.3%) | 11 (36.7%) |
| Educational Services | 82 (37.6%) | 136 (62.4%) |
| Health Care & Social Assistance | 178 (42.6%) | 240 (57.4%) |
| Arts, Entertainment & Recreation | 0 (0.0%) | 2 (100.0%) |
| Accommodation & Food Services | 20 (37.0%) | 34 (63.0%) |
| Public Administration | 231 (57.2%) | 173 (42.8%) |
| Total | 995 (51.4%) | 940 (48.6%) |
Education in Dillingham Census Area
School Enrollment in Dillingham Census Area
The most common levels of schooling among the 1,246 students in Dillingham Census Area are elementary school (338 | 27.1%), middle school (324 | 26.0%), and high school (311 | 25.0%).
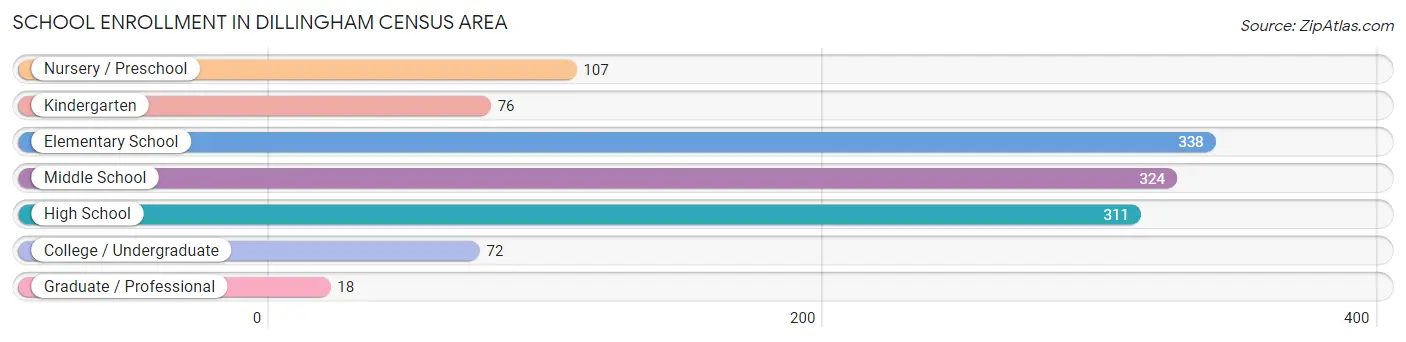
| School Level | # Students | % Students |
| Nursery / Preschool | 107 | 8.6% |
| Kindergarten | 76 | 6.1% |
| Elementary School | 338 | 27.1% |
| Middle School | 324 | 26.0% |
| High School | 311 | 25.0% |
| College / Undergraduate | 72 | 5.8% |
| Graduate / Professional | 18 | 1.4% |
| Total | 1,246 | 100.0% |
School Enrollment by Age by Funding Source in Dillingham Census Area
Out of a total of 1,246 students who are enrolled in schools in Dillingham Census Area, 41 (3.3%) attend a private institution, while the remaining 1,205 (96.7%) are enrolled in public schools. The age group of 20 to 24 year olds has the highest likelihood of being enrolled in private schools, with 7 (26.9% in the age bracket) enrolled. Conversely, the age group of 18 to 19 year olds has the lowest likelihood of being enrolled in a private school, with 69 (100.0% in the age bracket) attending a public institution.
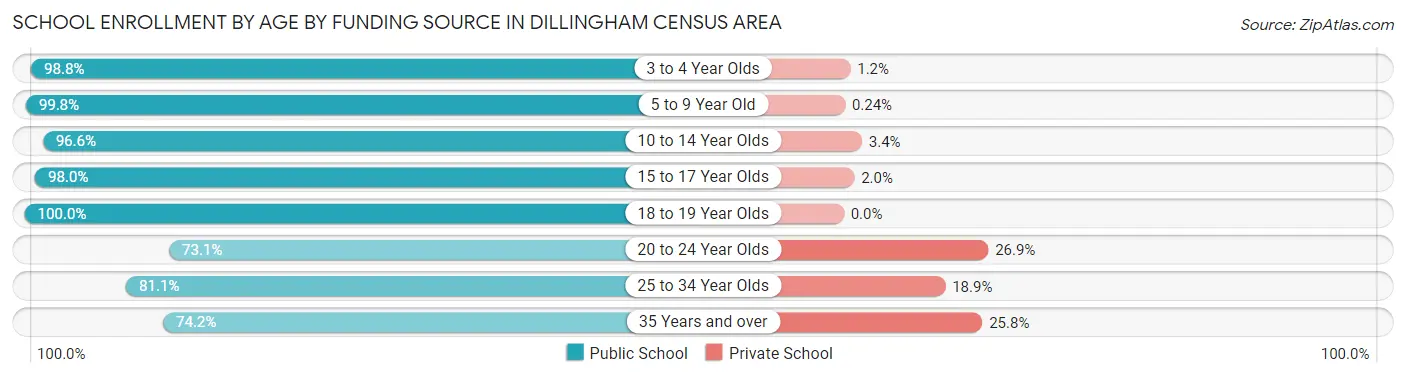
| Age Bracket | Public School | Private School |
| 3 to 4 Year Olds | 80 (98.8%) | 1 (1.2%) |
| 5 to 9 Year Old | 412 (99.8%) | 1 (0.2%) |
| 10 to 14 Year Olds | 372 (96.6%) | 13 (3.4%) |
| 15 to 17 Year Olds | 200 (98.0%) | 4 (2.0%) |
| 18 to 19 Year Olds | 69 (100.0%) | 0 (0.0%) |
| 20 to 24 Year Olds | 19 (73.1%) | 7 (26.9%) |
| 25 to 34 Year Olds | 30 (81.1%) | 7 (18.9%) |
| 35 Years and over | 23 (74.2%) | 8 (25.8%) |
| Total | 1,205 (96.7%) | 41 (3.3%) |
Educational Attainment by Field of Study in Dillingham Census Area
Bio, nature & agricultural (219 | 35.2%), science & technology (129 | 20.7%), education (75 | 12.1%), business (38 | 6.1%), and arts & humanities (37 | 5.9%) are the most common fields of study among 622 individuals in Dillingham Census Area who have obtained a bachelor's degree or higher.
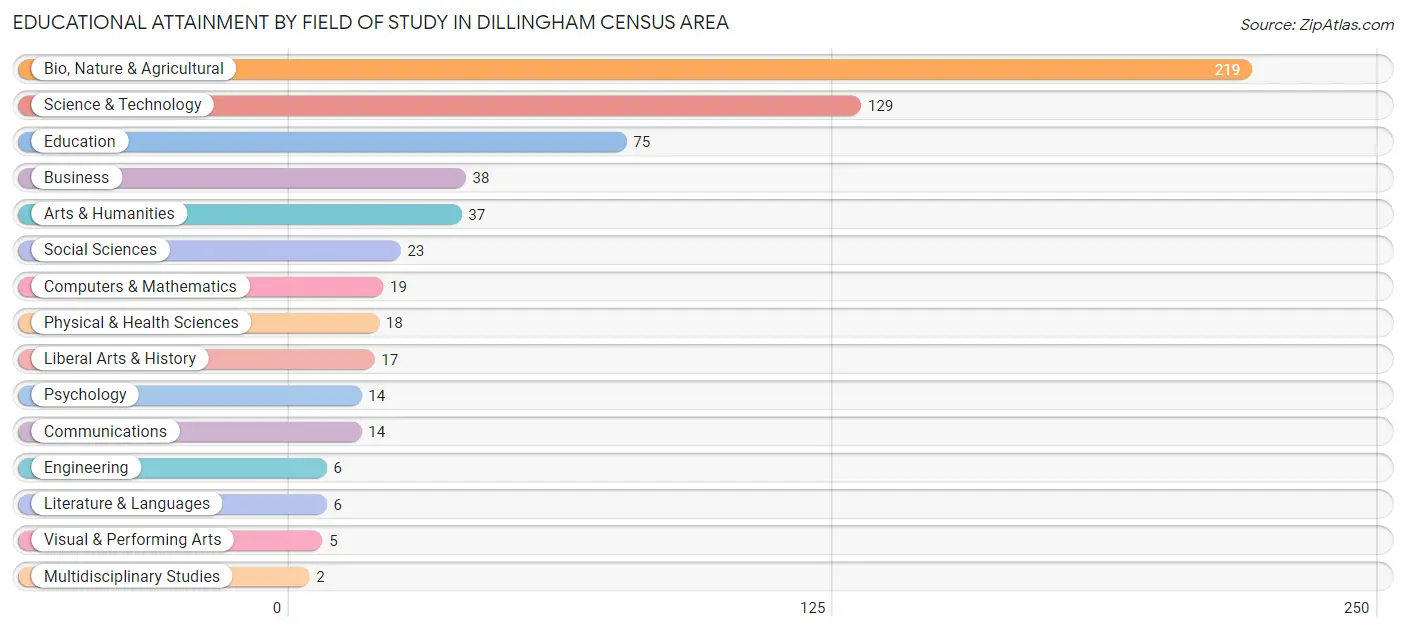
| Field of Study | # Graduates | % Graduates |
| Computers & Mathematics | 19 | 3.0% |
| Bio, Nature & Agricultural | 219 | 35.2% |
| Physical & Health Sciences | 18 | 2.9% |
| Psychology | 14 | 2.2% |
| Social Sciences | 23 | 3.7% |
| Engineering | 6 | 1.0% |
| Multidisciplinary Studies | 2 | 0.3% |
| Science & Technology | 129 | 20.7% |
| Business | 38 | 6.1% |
| Education | 75 | 12.1% |
| Literature & Languages | 6 | 1.0% |
| Liberal Arts & History | 17 | 2.7% |
| Visual & Performing Arts | 5 | 0.8% |
| Communications | 14 | 2.2% |
| Arts & Humanities | 37 | 5.9% |
| Total | 622 | 100.0% |
Transportation & Commute in Dillingham Census Area
Vehicle Availability by Sex in Dillingham Census Area
The most prevalent vehicle ownership categories in Dillingham Census Area are males with 2 vehicles (247, accounting for 32.5%) and females with 2 vehicles (196, making up 33.4%).
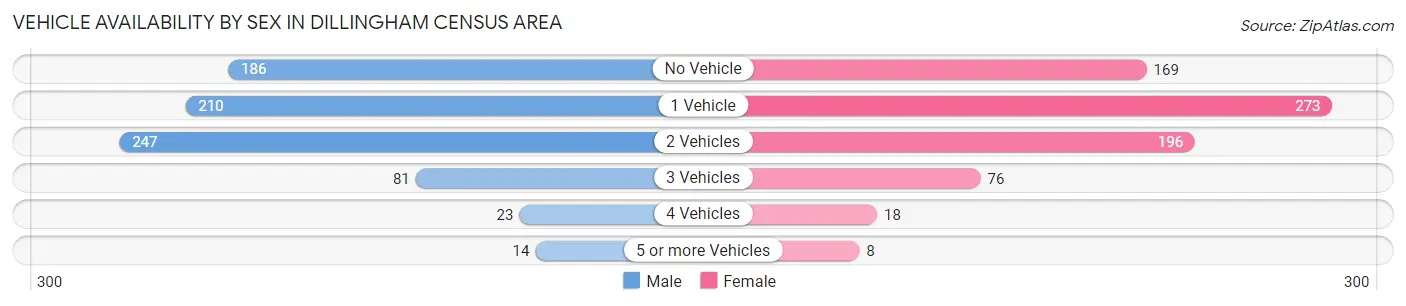
| Vehicles Available | Male | Female |
| No Vehicle | 186 (24.4%) | 169 (22.8%) |
| 1 Vehicle | 210 (27.6%) | 273 (36.9%) |
| 2 Vehicles | 247 (32.5%) | 196 (26.5%) |
| 3 Vehicles | 81 (10.6%) | 76 (10.3%) |
| 4 Vehicles | 23 (3.0%) | 18 (2.4%) |
| 5 or more Vehicles | 14 (1.8%) | 8 (1.1%) |
| Total | 761 (100.0%) | 740 (100.0%) |
Commute Time in Dillingham Census Area
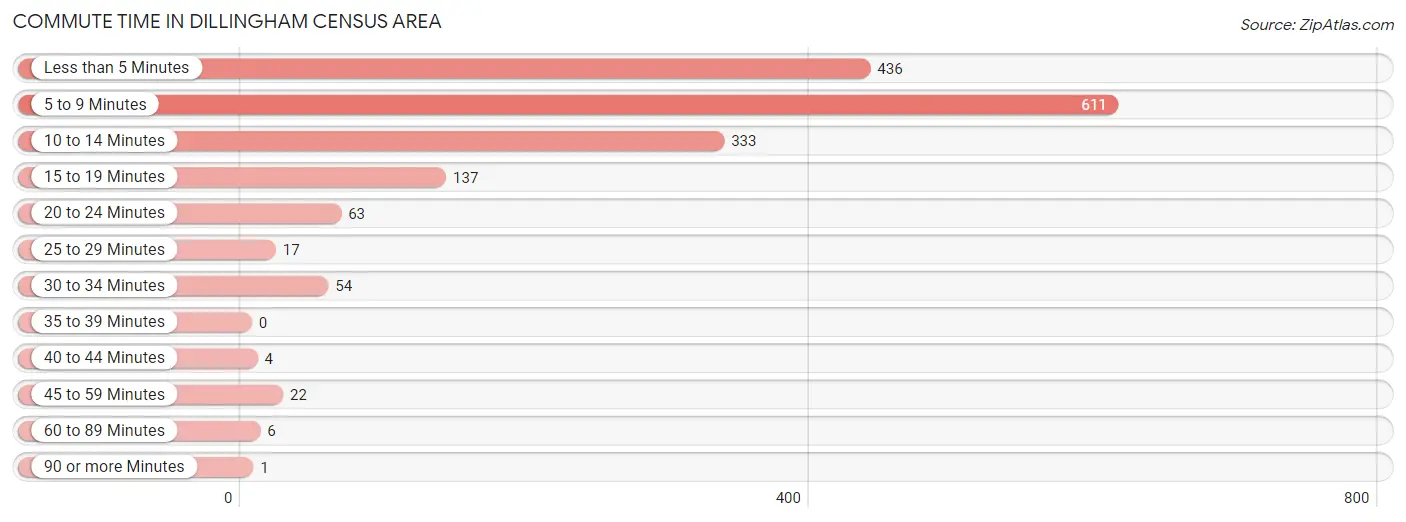
The most frequently occuring commute durations in Dillingham Census Area are 5 to 9 minutes (611 commuters, 36.3%), less than 5 minutes (436 commuters, 25.9%), and 10 to 14 minutes (333 commuters, 19.8%).
| Commute Time | # Commuters | % Commuters |
| Less than 5 Minutes | 436 | 25.9% |
| 5 to 9 Minutes | 611 | 36.3% |
| 10 to 14 Minutes | 333 | 19.8% |
| 15 to 19 Minutes | 137 | 8.1% |
| 20 to 24 Minutes | 63 | 3.7% |
| 25 to 29 Minutes | 17 | 1.0% |
| 30 to 34 Minutes | 54 | 3.2% |
| 35 to 39 Minutes | 0 | 0.0% |
| 40 to 44 Minutes | 4 | 0.2% |
| 45 to 59 Minutes | 22 | 1.3% |
| 60 to 89 Minutes | 6 | 0.4% |
| 90 or more Minutes | 1 | 0.1% |
Commute Time by Sex in Dillingham Census Area
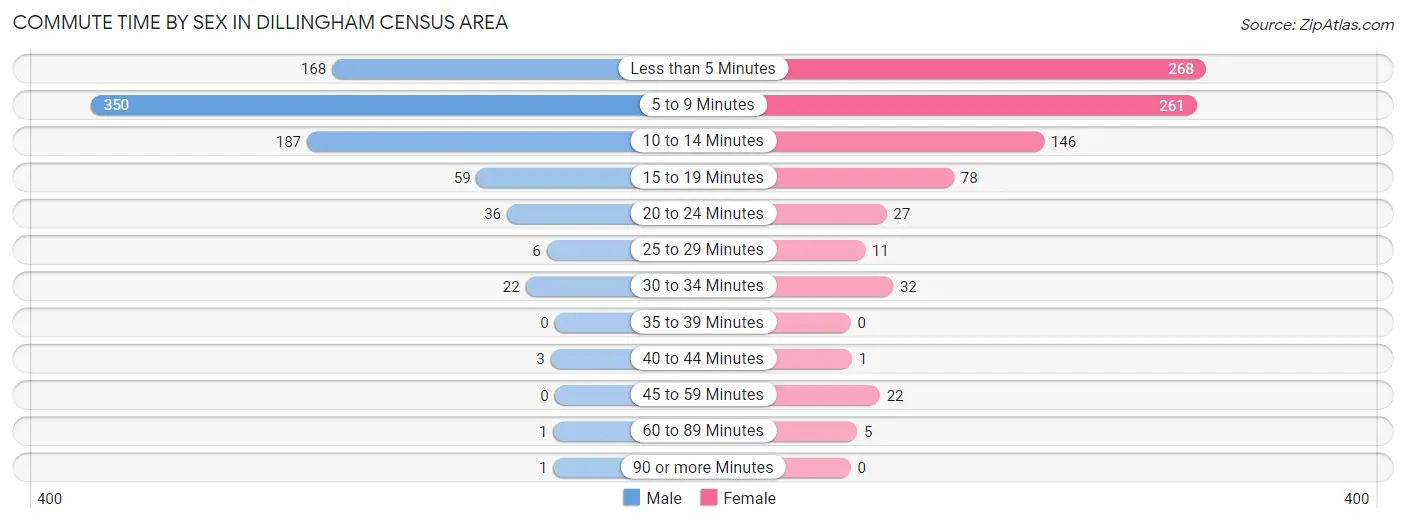
The most common commute times in Dillingham Census Area are 5 to 9 minutes (350 commuters, 42.0%) for males and less than 5 minutes (268 commuters, 31.5%) for females.
| Commute Time | Male | Female |
| Less than 5 Minutes | 168 (20.2%) | 268 (31.5%) |
| 5 to 9 Minutes | 350 (42.0%) | 261 (30.7%) |
| 10 to 14 Minutes | 187 (22.5%) | 146 (17.2%) |
| 15 to 19 Minutes | 59 (7.1%) | 78 (9.2%) |
| 20 to 24 Minutes | 36 (4.3%) | 27 (3.2%) |
| 25 to 29 Minutes | 6 (0.7%) | 11 (1.3%) |
| 30 to 34 Minutes | 22 (2.6%) | 32 (3.8%) |
| 35 to 39 Minutes | 0 (0.0%) | 0 (0.0%) |
| 40 to 44 Minutes | 3 (0.4%) | 1 (0.1%) |
| 45 to 59 Minutes | 0 (0.0%) | 22 (2.6%) |
| 60 to 89 Minutes | 1 (0.1%) | 5 (0.6%) |
| 90 or more Minutes | 1 (0.1%) | 0 (0.0%) |
Time of Departure to Work by Sex in Dillingham Census Area
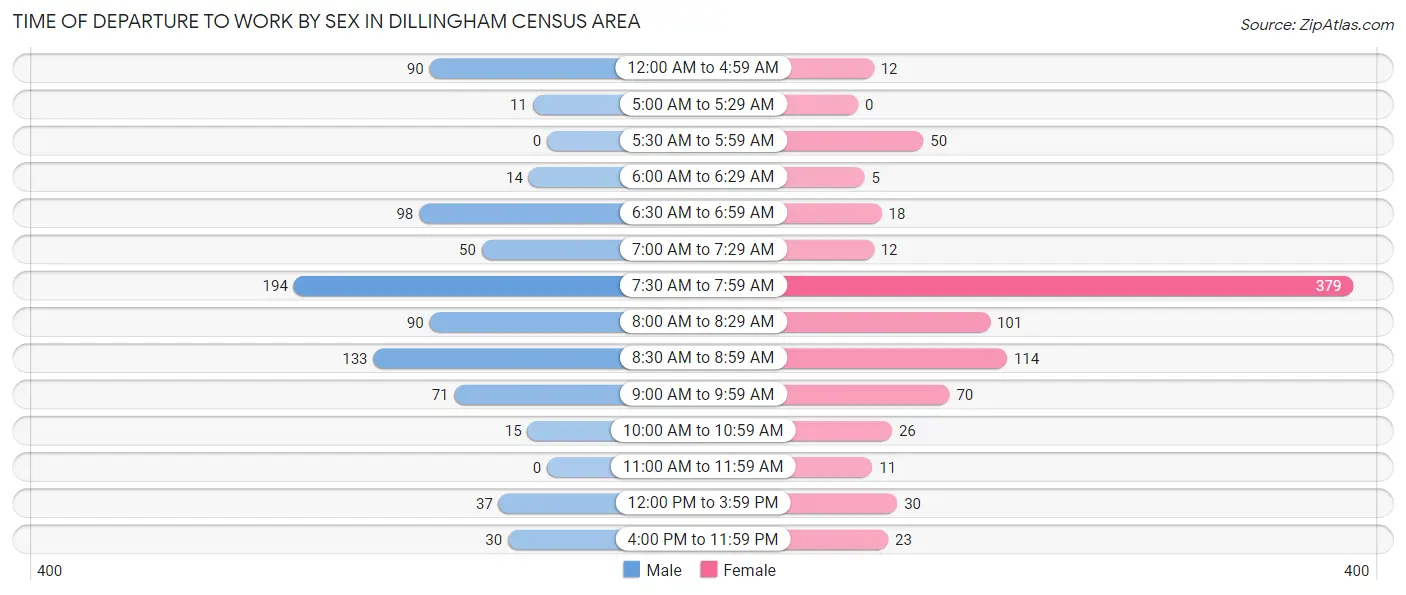
The most frequent times of departure to work in Dillingham Census Area are 7:30 AM to 7:59 AM (194, 23.3%) for males and 7:30 AM to 7:59 AM (379, 44.5%) for females.
| Time of Departure | Male | Female |
| 12:00 AM to 4:59 AM | 90 (10.8%) | 12 (1.4%) |
| 5:00 AM to 5:29 AM | 11 (1.3%) | 0 (0.0%) |
| 5:30 AM to 5:59 AM | 0 (0.0%) | 50 (5.9%) |
| 6:00 AM to 6:29 AM | 14 (1.7%) | 5 (0.6%) |
| 6:30 AM to 6:59 AM | 98 (11.8%) | 18 (2.1%) |
| 7:00 AM to 7:29 AM | 50 (6.0%) | 12 (1.4%) |
| 7:30 AM to 7:59 AM | 194 (23.3%) | 379 (44.5%) |
| 8:00 AM to 8:29 AM | 90 (10.8%) | 101 (11.9%) |
| 8:30 AM to 8:59 AM | 133 (16.0%) | 114 (13.4%) |
| 9:00 AM to 9:59 AM | 71 (8.5%) | 70 (8.2%) |
| 10:00 AM to 10:59 AM | 15 (1.8%) | 26 (3.1%) |
| 11:00 AM to 11:59 AM | 0 (0.0%) | 11 (1.3%) |
| 12:00 PM to 3:59 PM | 37 (4.4%) | 30 (3.5%) |
| 4:00 PM to 11:59 PM | 30 (3.6%) | 23 (2.7%) |
| Total | 833 (100.0%) | 851 (100.0%) |
Housing Occupancy in Dillingham Census Area
Occupancy by Ownership in Dillingham Census Area
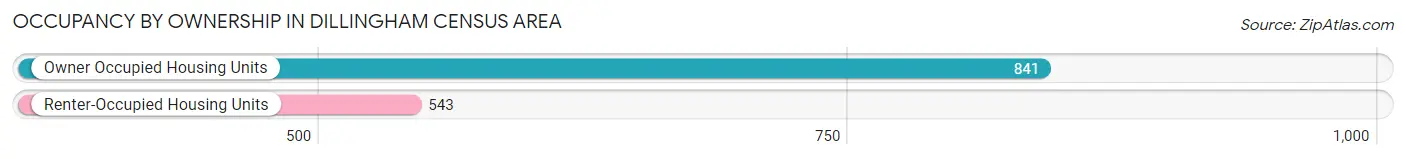
Of the total 1,384 dwellings in Dillingham Census Area, owner-occupied units account for 841 (60.8%), while renter-occupied units make up 543 (39.2%).
| Occupancy | # Housing Units | % Housing Units |
| Owner Occupied Housing Units | 841 | 60.8% |
| Renter-Occupied Housing Units | 543 | 39.2% |
| Total Occupied Housing Units | 1,384 | 100.0% |
Occupancy by Household Size in Dillingham Census Area

| Household Size | # Housing Units | % Housing Units |
| 1-Person Household | 273 | 19.7% |
| 2-Person Household | 343 | 24.8% |
| 3-Person Household | 186 | 13.4% |
| 4+ Person Household | 582 | 42.0% |
| Total Housing Units | 1,384 | 100.0% |
Occupancy by Ownership by Household Size in Dillingham Census Area
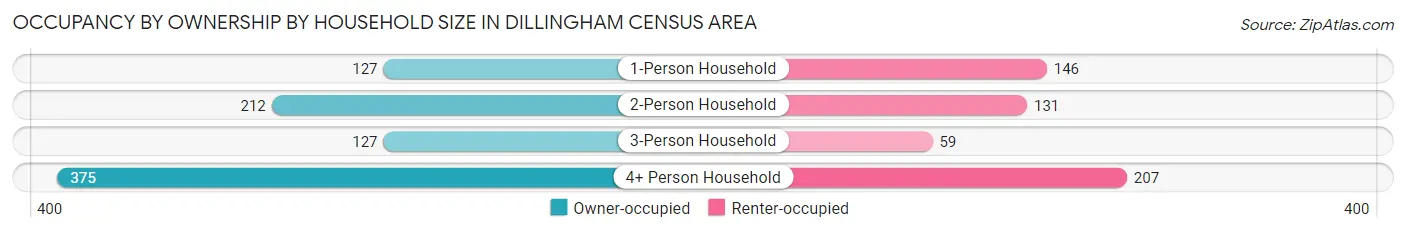
| Household Size | Owner-occupied | Renter-occupied |
| 1-Person Household | 127 (46.5%) | 146 (53.5%) |
| 2-Person Household | 212 (61.8%) | 131 (38.2%) |
| 3-Person Household | 127 (68.3%) | 59 (31.7%) |
| 4+ Person Household | 375 (64.4%) | 207 (35.6%) |
| Total Housing Units | 841 (60.8%) | 543 (39.2%) |
Occupancy by Educational Attainment in Dillingham Census Area
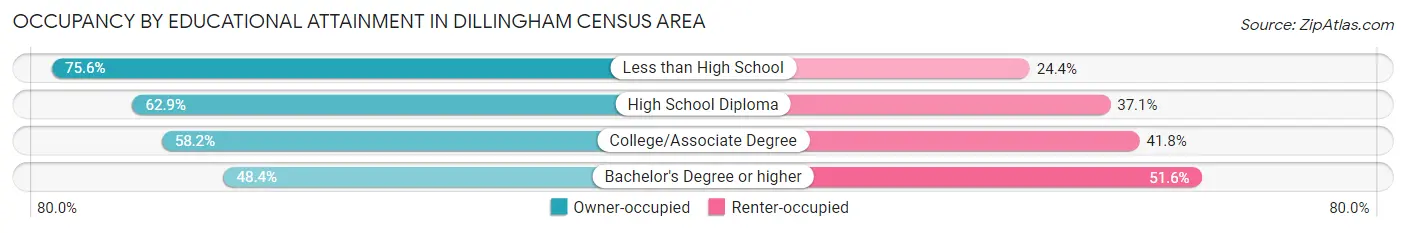
| Household Size | Owner-occupied | Renter-occupied |
| Less than High School | 121 (75.6%) | 39 (24.4%) |
| High School Diploma | 352 (62.9%) | 208 (37.1%) |
| College/Associate Degree | 276 (58.2%) | 198 (41.8%) |
| Bachelor's Degree or higher | 92 (48.4%) | 98 (51.6%) |
Occupancy by Age of Householder in Dillingham Census Area
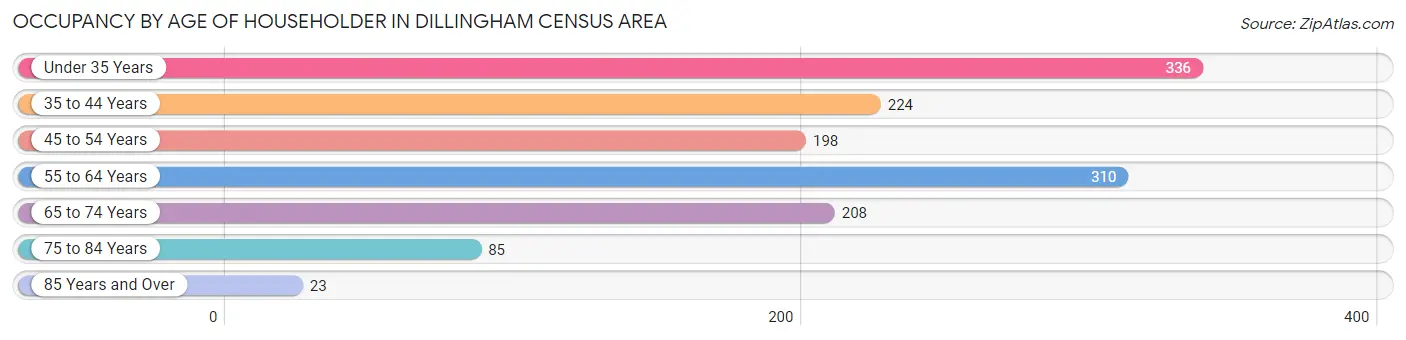
| Age Bracket | # Households | % Households |
| Under 35 Years | 336 | 24.3% |
| 35 to 44 Years | 224 | 16.2% |
| 45 to 54 Years | 198 | 14.3% |
| 55 to 64 Years | 310 | 22.4% |
| 65 to 74 Years | 208 | 15.0% |
| 75 to 84 Years | 85 | 6.1% |
| 85 Years and Over | 23 | 1.7% |
| Total | 1,384 | 100.0% |
Housing Finances in Dillingham Census Area
Median Income by Occupancy in Dillingham Census Area
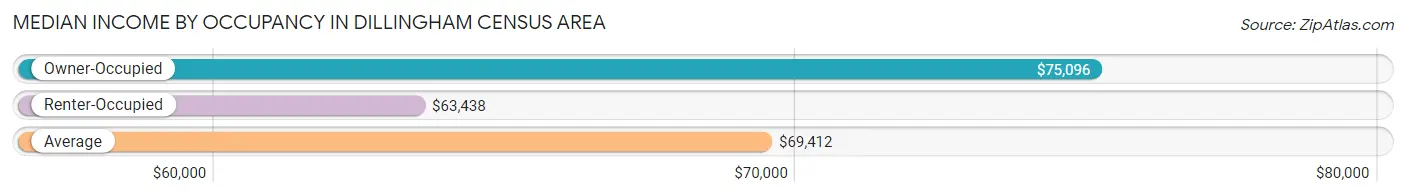
| Occupancy Type | # Households | Median Income |
| Owner-Occupied | 841 (60.8%) | $75,096 |
| Renter-Occupied | 543 (39.2%) | $63,438 |
| Average | 1,384 (100.0%) | $69,412 |
Occupancy by Householder Income Bracket in Dillingham Census Area
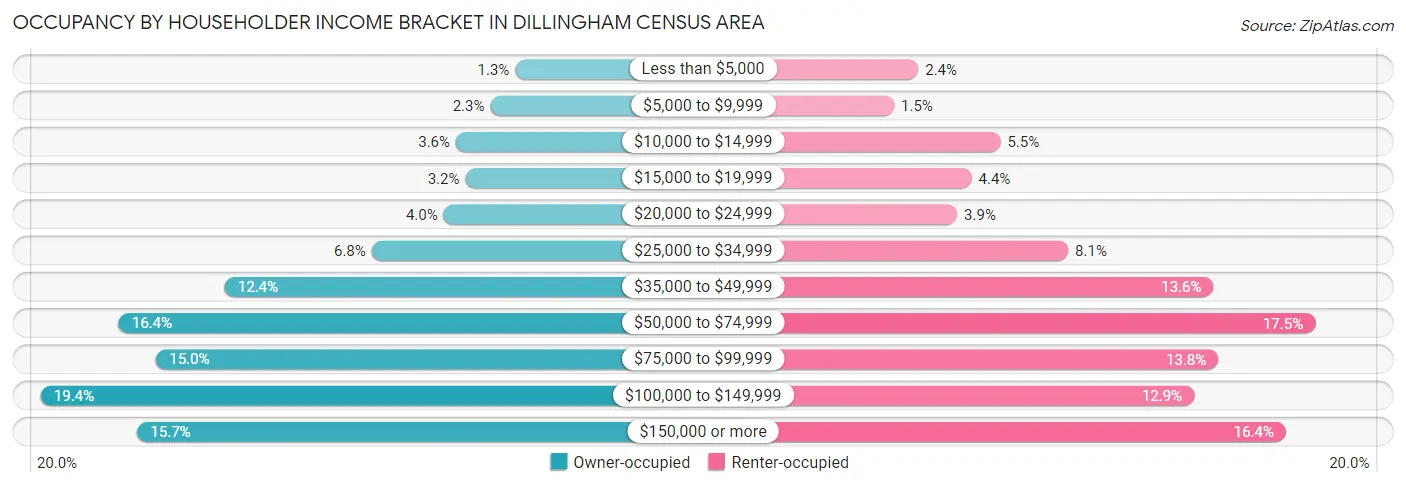
| Income Bracket | Owner-occupied | Renter-occupied |
| Less than $5,000 | 11 (1.3%) | 13 (2.4%) |
| $5,000 to $9,999 | 19 (2.3%) | 8 (1.5%) |
| $10,000 to $14,999 | 30 (3.6%) | 30 (5.5%) |
| $15,000 to $19,999 | 27 (3.2%) | 24 (4.4%) |
| $20,000 to $24,999 | 34 (4.0%) | 21 (3.9%) |
| $25,000 to $34,999 | 57 (6.8%) | 44 (8.1%) |
| $35,000 to $49,999 | 104 (12.4%) | 74 (13.6%) |
| $50,000 to $74,999 | 138 (16.4%) | 95 (17.5%) |
| $75,000 to $99,999 | 126 (15.0%) | 75 (13.8%) |
| $100,000 to $149,999 | 163 (19.4%) | 70 (12.9%) |
| $150,000 or more | 132 (15.7%) | 89 (16.4%) |
| Total | 841 (100.0%) | 543 (100.0%) |
Monthly Housing Cost Tiers in Dillingham Census Area
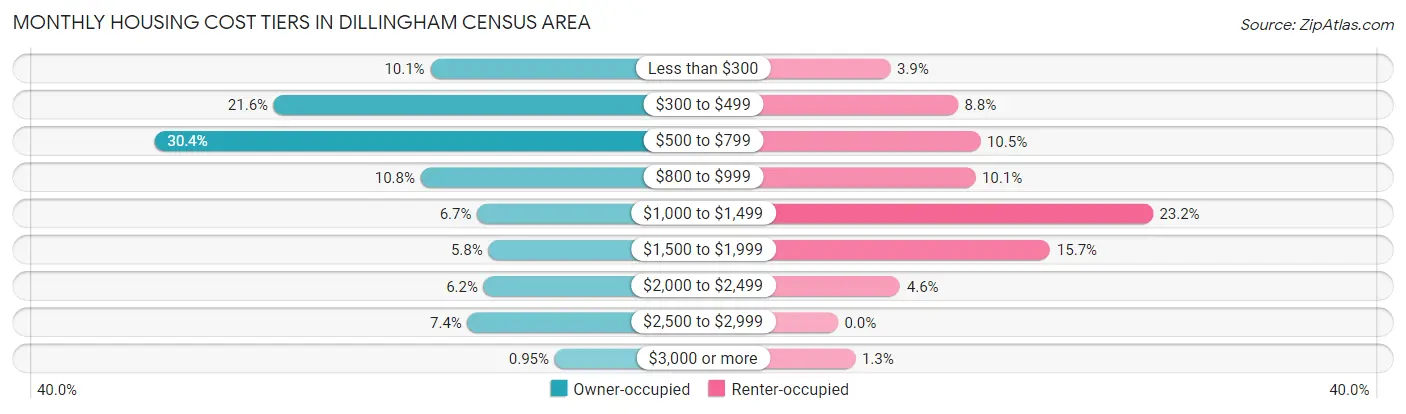
| Monthly Cost | Owner-occupied | Renter-occupied |
| Less than $300 | 85 (10.1%) | 21 (3.9%) |
| $300 to $499 | 182 (21.6%) | 48 (8.8%) |
| $500 to $799 | 256 (30.4%) | 57 (10.5%) |
| $800 to $999 | 91 (10.8%) | 55 (10.1%) |
| $1,000 to $1,499 | 56 (6.7%) | 126 (23.2%) |
| $1,500 to $1,999 | 49 (5.8%) | 85 (15.7%) |
| $2,000 to $2,499 | 52 (6.2%) | 25 (4.6%) |
| $2,500 to $2,999 | 62 (7.4%) | 0 (0.0%) |
| $3,000 or more | 8 (0.9%) | 7 (1.3%) |
| Total | 841 (100.0%) | 543 (100.0%) |
Physical Housing Characteristics in Dillingham Census Area
Housing Structures in Dillingham Census Area
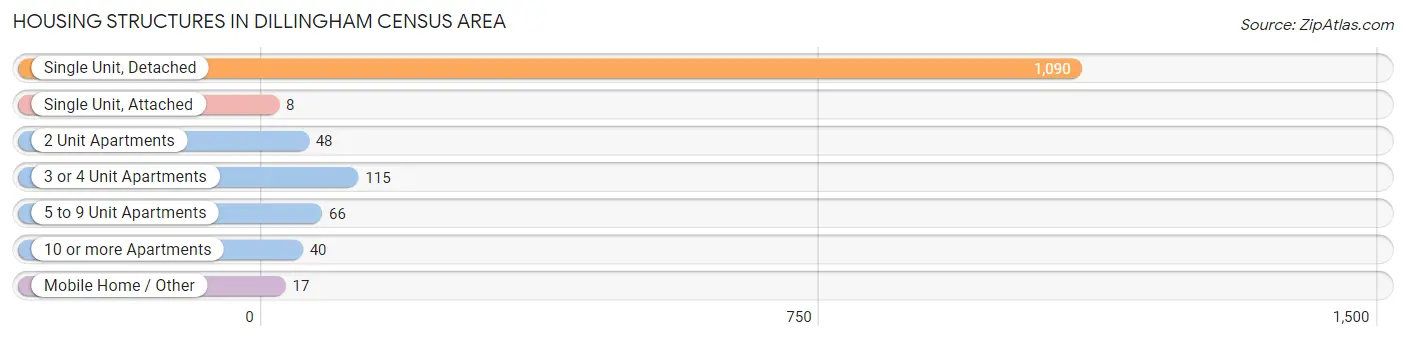
| Structure Type | # Housing Units | % Housing Units |
| Single Unit, Detached | 1,090 | 78.8% |
| Single Unit, Attached | 8 | 0.6% |
| 2 Unit Apartments | 48 | 3.5% |
| 3 or 4 Unit Apartments | 115 | 8.3% |
| 5 to 9 Unit Apartments | 66 | 4.8% |
| 10 or more Apartments | 40 | 2.9% |
| Mobile Home / Other | 17 | 1.2% |
| Total | 1,384 | 100.0% |
Housing Structures by Occupancy in Dillingham Census Area
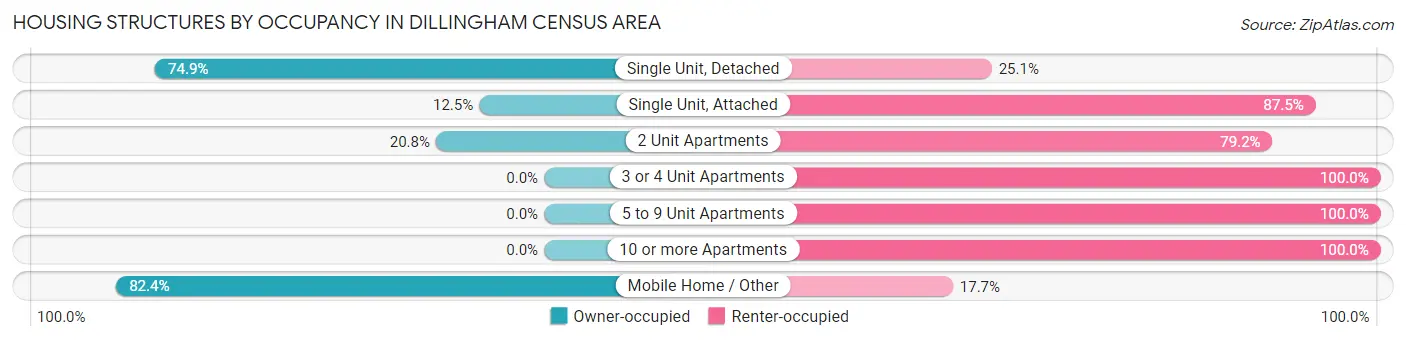
| Structure Type | Owner-occupied | Renter-occupied |
| Single Unit, Detached | 816 (74.9%) | 274 (25.1%) |
| Single Unit, Attached | 1 (12.5%) | 7 (87.5%) |
| 2 Unit Apartments | 10 (20.8%) | 38 (79.2%) |
| 3 or 4 Unit Apartments | 0 (0.0%) | 115 (100.0%) |
| 5 to 9 Unit Apartments | 0 (0.0%) | 66 (100.0%) |
| 10 or more Apartments | 0 (0.0%) | 40 (100.0%) |
| Mobile Home / Other | 14 (82.4%) | 3 (17.6%) |
| Total | 841 (60.8%) | 543 (39.2%) |
Housing Structures by Number of Rooms in Dillingham Census Area
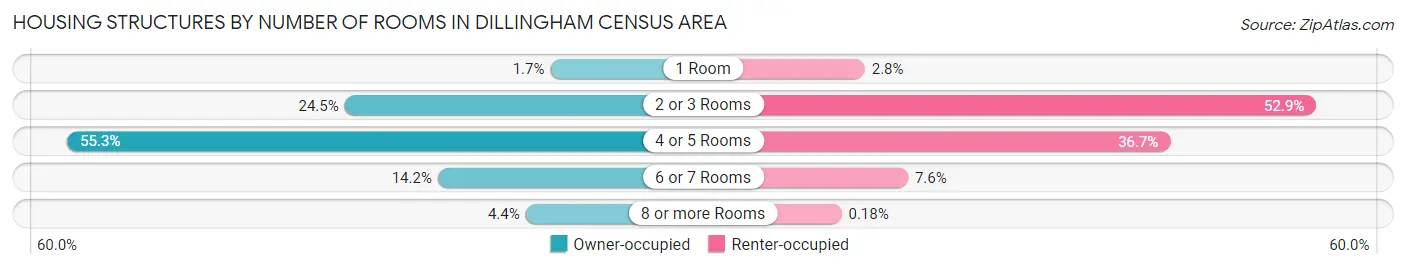
| Number of Rooms | Owner-occupied | Renter-occupied |
| 1 Room | 14 (1.7%) | 15 (2.8%) |
| 2 or 3 Rooms | 206 (24.5%) | 287 (52.8%) |
| 4 or 5 Rooms | 465 (55.3%) | 199 (36.6%) |
| 6 or 7 Rooms | 119 (14.1%) | 41 (7.5%) |
| 8 or more Rooms | 37 (4.4%) | 1 (0.2%) |
| Total | 841 (100.0%) | 543 (100.0%) |
Housing Structure by Heating Type in Dillingham Census Area
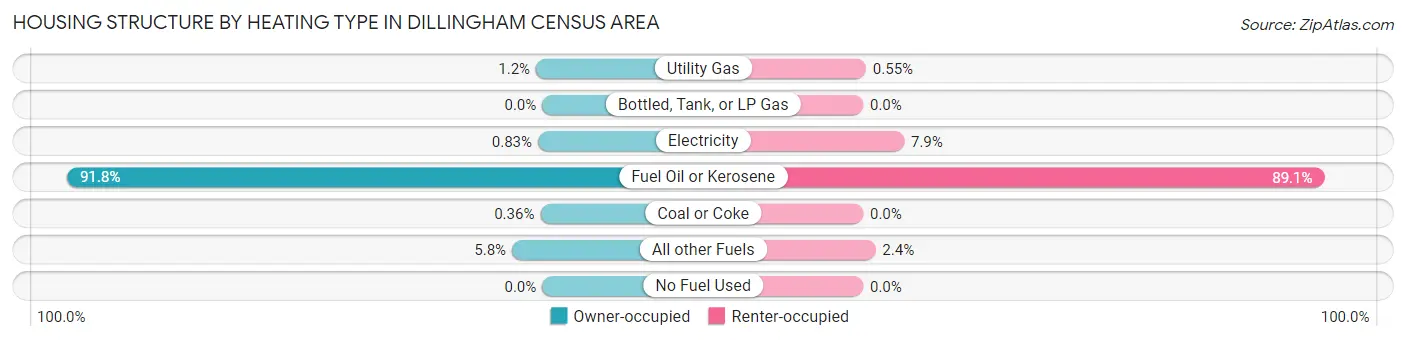
| Heating Type | Owner-occupied | Renter-occupied |
| Utility Gas | 10 (1.2%) | 3 (0.5%) |
| Bottled, Tank, or LP Gas | 0 (0.0%) | 0 (0.0%) |
| Electricity | 7 (0.8%) | 43 (7.9%) |
| Fuel Oil or Kerosene | 772 (91.8%) | 484 (89.1%) |
| Coal or Coke | 3 (0.4%) | 0 (0.0%) |
| All other Fuels | 49 (5.8%) | 13 (2.4%) |
| No Fuel Used | 0 (0.0%) | 0 (0.0%) |
| Total | 841 (100.0%) | 543 (100.0%) |
Household Vehicle Usage in Dillingham Census Area
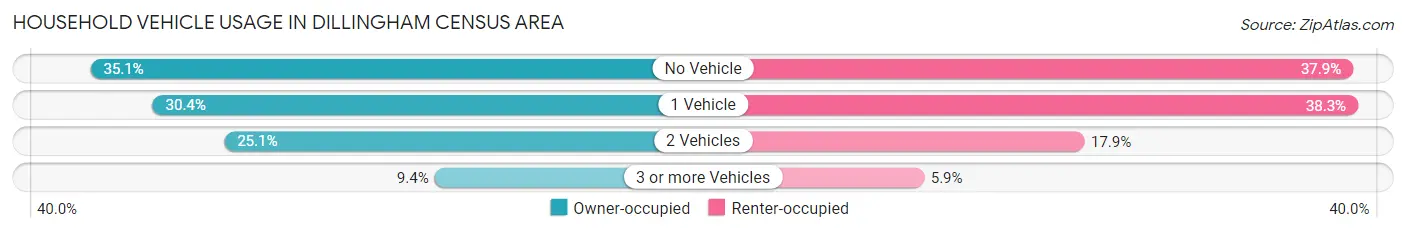
| Vehicles per Household | Owner-occupied | Renter-occupied |
| No Vehicle | 295 (35.1%) | 206 (37.9%) |
| 1 Vehicle | 256 (30.4%) | 208 (38.3%) |
| 2 Vehicles | 211 (25.1%) | 97 (17.9%) |
| 3 or more Vehicles | 79 (9.4%) | 32 (5.9%) |
| Total | 841 (100.0%) | 543 (100.0%) |
Real Estate & Mortgages in Dillingham Census Area
Real Estate and Mortgage Overview in Dillingham Census Area
| Characteristic | Without Mortgage | With Mortgage |
| Housing Units | 641 | 200 |
| Median Property Value | $115,300 | $330,100 |
| Median Household Income | $62,938 | $70 |
| Monthly Housing Costs | $553 | $8 |
| Real Estate Taxes | $1,370 | $55 |
Property Value by Mortgage Status in Dillingham Census Area
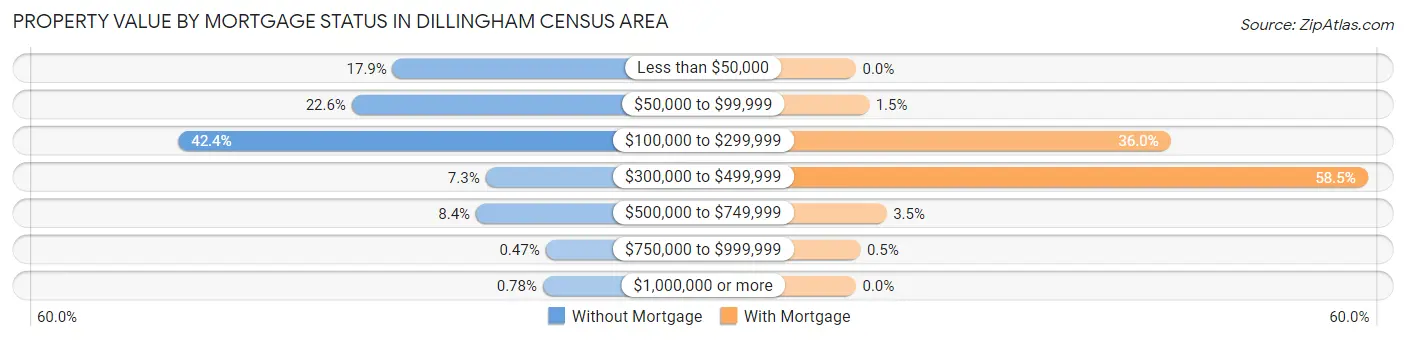
| Property Value | Without Mortgage | With Mortgage |
| Less than $50,000 | 115 (17.9%) | 0 (0.0%) |
| $50,000 to $99,999 | 145 (22.6%) | 3 (1.5%) |
| $100,000 to $299,999 | 272 (42.4%) | 72 (36.0%) |
| $300,000 to $499,999 | 47 (7.3%) | 117 (58.5%) |
| $500,000 to $749,999 | 54 (8.4%) | 7 (3.5%) |
| $750,000 to $999,999 | 3 (0.5%) | 1 (0.5%) |
| $1,000,000 or more | 5 (0.8%) | 0 (0.0%) |
| Total | 641 (100.0%) | 200 (100.0%) |
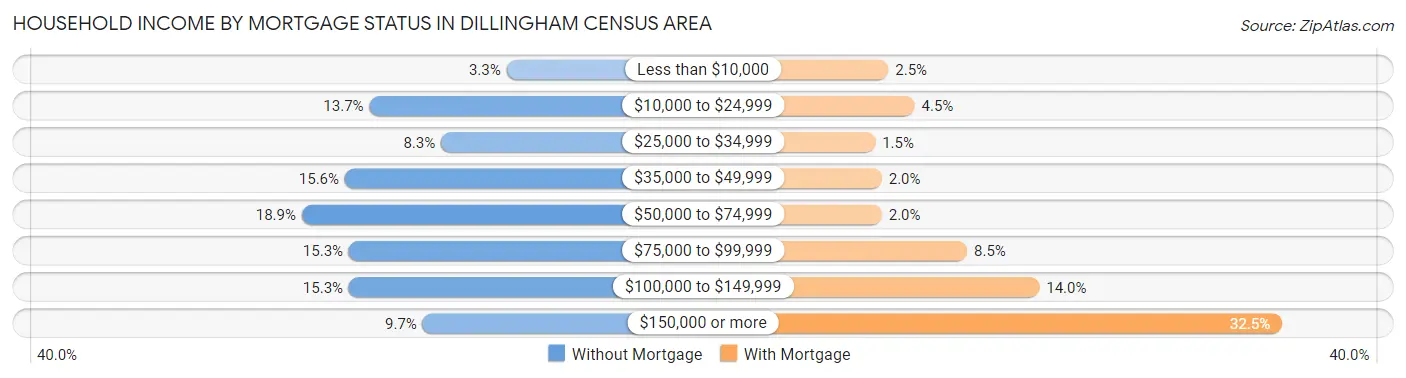
Household Income by Mortgage Status in Dillingham Census Area
| Household Income | Without Mortgage | With Mortgage |
| Less than $10,000 | 21 (3.3%) | 5 (2.5%) |
| $10,000 to $24,999 | 88 (13.7%) | 9 (4.5%) |
| $25,000 to $34,999 | 53 (8.3%) | 3 (1.5%) |
| $35,000 to $49,999 | 100 (15.6%) | 4 (2.0%) |
| $50,000 to $74,999 | 121 (18.9%) | 4 (2.0%) |
| $75,000 to $99,999 | 98 (15.3%) | 17 (8.5%) |
| $100,000 to $149,999 | 98 (15.3%) | 28 (14.0%) |
| $150,000 or more | 62 (9.7%) | 65 (32.5%) |
| Total | 641 (100.0%) | 200 (100.0%) |
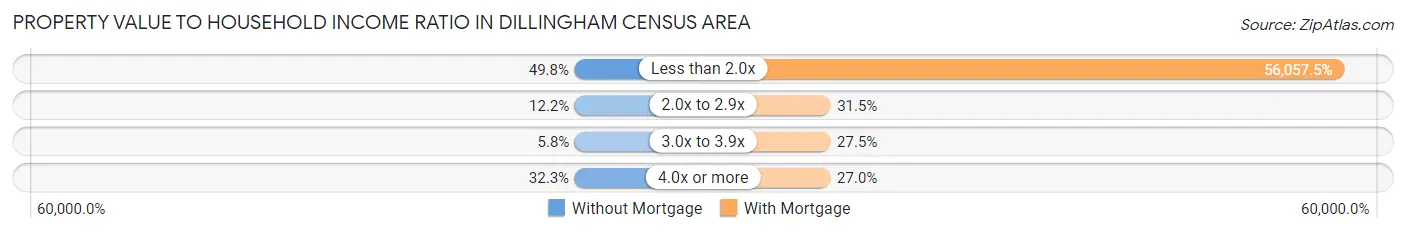
Property Value to Household Income Ratio in Dillingham Census Area
| Value-to-Income Ratio | Without Mortgage | With Mortgage |
| Less than 2.0x | 319 (49.8%) | 112,115 (56,057.5%) |
| 2.0x to 2.9x | 78 (12.2%) | 63 (31.5%) |
| 3.0x to 3.9x | 37 (5.8%) | 55 (27.5%) |
| 4.0x or more | 207 (32.3%) | 54 (27.0%) |
| Total | 641 (100.0%) | 200 (100.0%) |
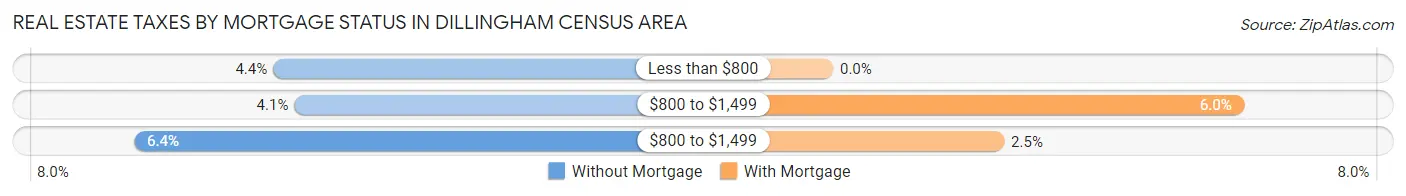
Real Estate Taxes by Mortgage Status in Dillingham Census Area
| Property Taxes | Without Mortgage | With Mortgage |
| Less than $800 | 28 (4.4%) | 0 (0.0%) |
| $800 to $1,499 | 26 (4.1%) | 12 (6.0%) |
| $800 to $1,499 | 41 (6.4%) | 5 (2.5%) |
| Total | 641 (100.0%) | 200 (100.0%) |
Health & Disability in Dillingham Census Area
Health Insurance Coverage by Age in Dillingham Census Area
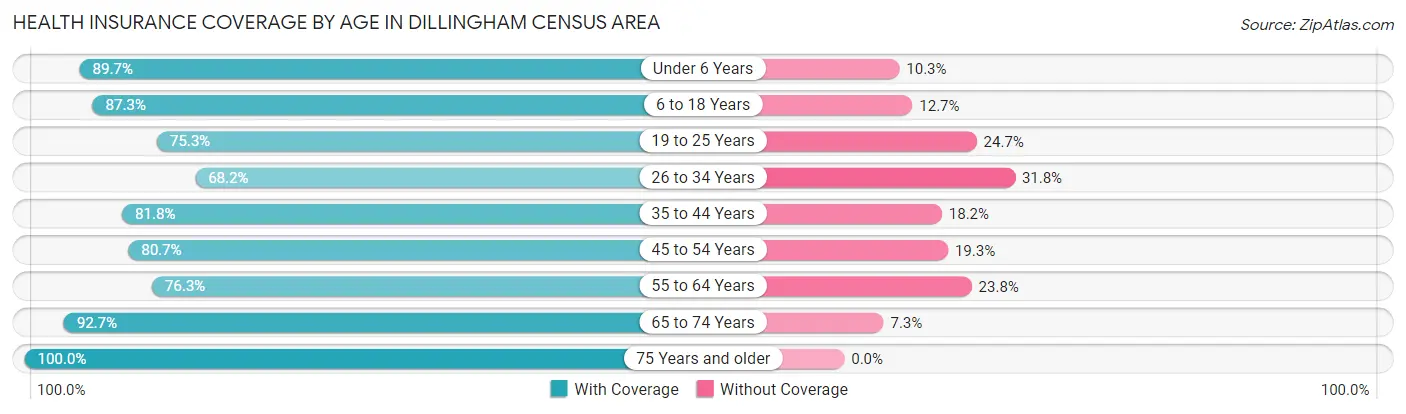
| Age Bracket | With Coverage | Without Coverage |
| Under 6 Years | 428 (89.7%) | 49 (10.3%) |
| 6 to 18 Years | 943 (87.3%) | 137 (12.7%) |
| 19 to 25 Years | 354 (75.3%) | 116 (24.7%) |
| 26 to 34 Years | 467 (68.2%) | 218 (31.8%) |
| 35 to 44 Years | 418 (81.8%) | 93 (18.2%) |
| 45 to 54 Years | 367 (80.7%) | 88 (19.3%) |
| 55 to 64 Years | 456 (76.2%) | 142 (23.7%) |
| 65 to 74 Years | 380 (92.7%) | 30 (7.3%) |
| 75 Years and older | 148 (100.0%) | 0 (0.0%) |
| Total | 3,961 (81.9%) | 873 (18.1%) |
Health Insurance Coverage by Citizenship Status in Dillingham Census Area
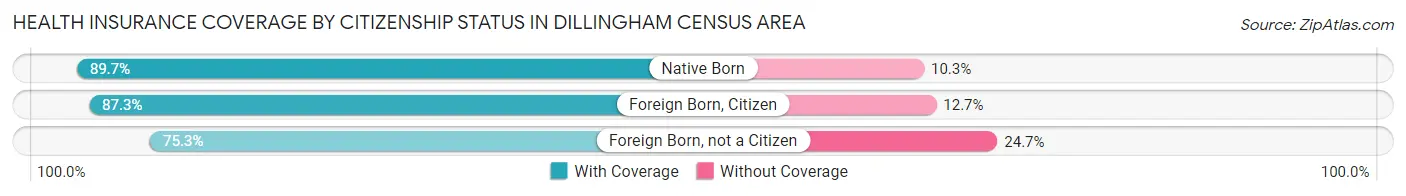
| Citizenship Status | With Coverage | Without Coverage |
| Native Born | 428 (89.7%) | 49 (10.3%) |
| Foreign Born, Citizen | 943 (87.3%) | 137 (12.7%) |
| Foreign Born, not a Citizen | 354 (75.3%) | 116 (24.7%) |
Health Insurance Coverage by Household Income in Dillingham Census Area
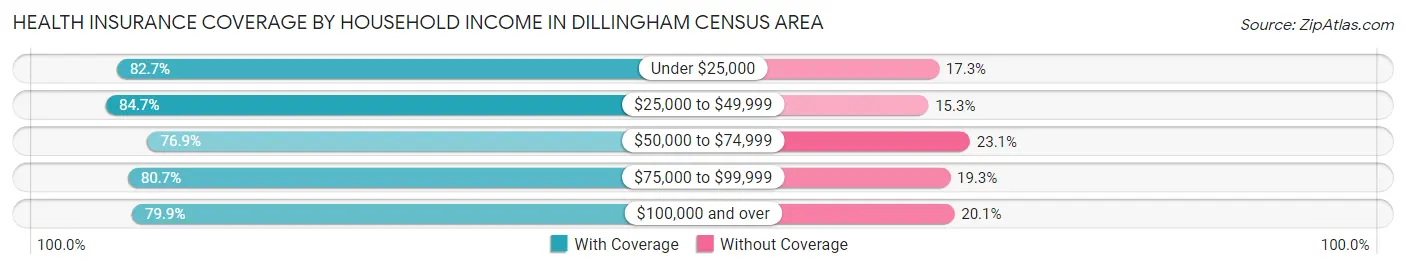
| Household Income | With Coverage | Without Coverage |
| Under $25,000 | 326 (82.7%) | 68 (17.3%) |
| $25,000 to $49,999 | 622 (84.7%) | 112 (15.3%) |
| $50,000 to $74,999 | 594 (76.9%) | 178 (23.1%) |
| $75,000 to $99,999 | 638 (80.7%) | 153 (19.3%) |
| $100,000 and over | 1,396 (79.9%) | 352 (20.1%) |
Public vs Private Health Insurance Coverage by Age in Dillingham Census Area
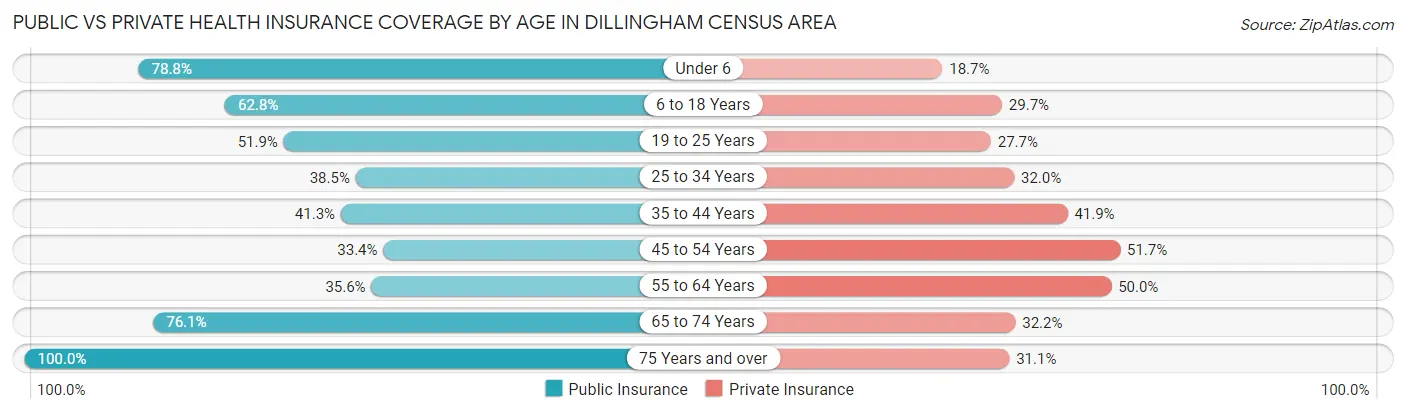
| Age Bracket | Public Insurance | Private Insurance |
| Under 6 | 376 (78.8%) | 89 (18.7%) |
| 6 to 18 Years | 678 (62.8%) | 321 (29.7%) |
| 19 to 25 Years | 244 (51.9%) | 130 (27.7%) |
| 25 to 34 Years | 264 (38.5%) | 219 (32.0%) |
| 35 to 44 Years | 211 (41.3%) | 214 (41.9%) |
| 45 to 54 Years | 152 (33.4%) | 235 (51.6%) |
| 55 to 64 Years | 213 (35.6%) | 299 (50.0%) |
| 65 to 74 Years | 312 (76.1%) | 132 (32.2%) |
| 75 Years and over | 148 (100.0%) | 46 (31.1%) |
| Total | 2,598 (53.7%) | 1,685 (34.9%) |
Disability Status by Sex by Age in Dillingham Census Area
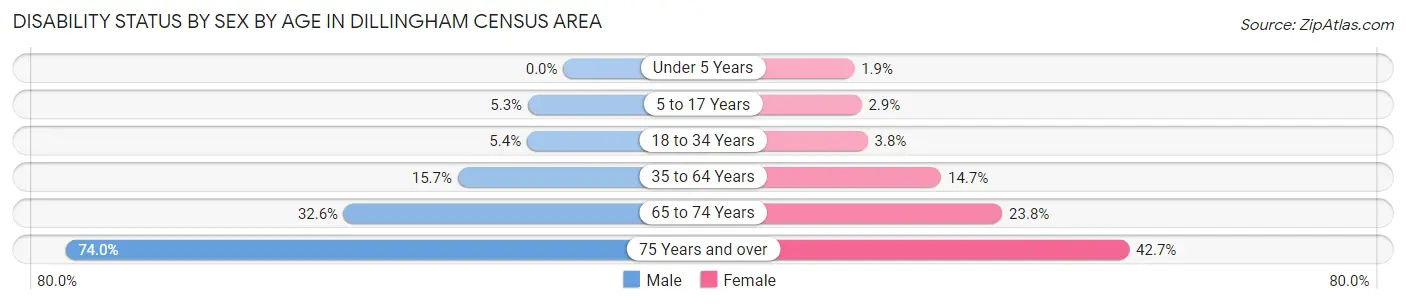
| Age Bracket | Male | Female |
| Under 5 Years | 0 (0.0%) | 4 (1.8%) |
| 5 to 17 Years | 28 (5.3%) | 15 (2.9%) |
| 18 to 34 Years | 35 (5.4%) | 23 (3.8%) |
| 35 to 64 Years | 126 (15.7%) | 112 (14.7%) |
| 65 to 74 Years | 72 (32.6%) | 45 (23.8%) |
| 75 Years and over | 54 (74.0%) | 32 (42.7%) |
Disability Class by Sex by Age in Dillingham Census Area
Disability Class: Hearing Difficulty
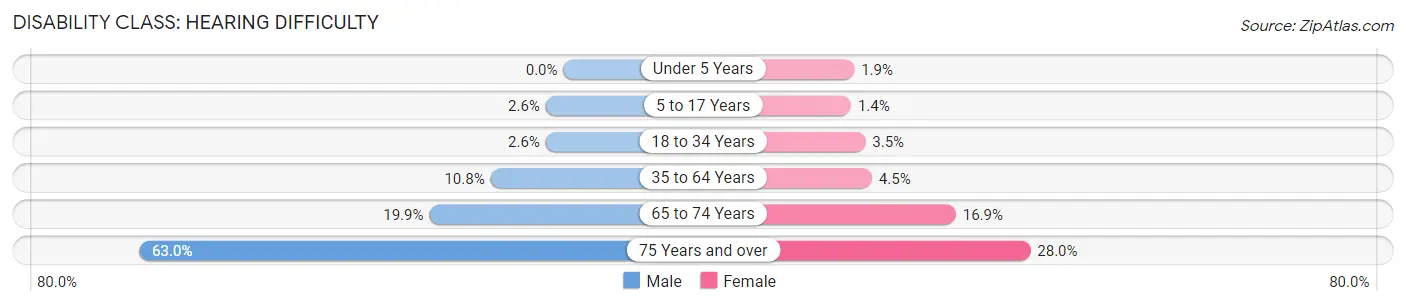
| Age Bracket | Male | Female |
| Under 5 Years | 0 (0.0%) | 4 (1.8%) |
| 5 to 17 Years | 14 (2.6%) | 7 (1.4%) |
| 18 to 34 Years | 17 (2.6%) | 21 (3.5%) |
| 35 to 64 Years | 87 (10.8%) | 34 (4.5%) |
| 65 to 74 Years | 44 (19.9%) | 32 (16.9%) |
| 75 Years and over | 46 (63.0%) | 21 (28.0%) |
Disability Class: Vision Difficulty
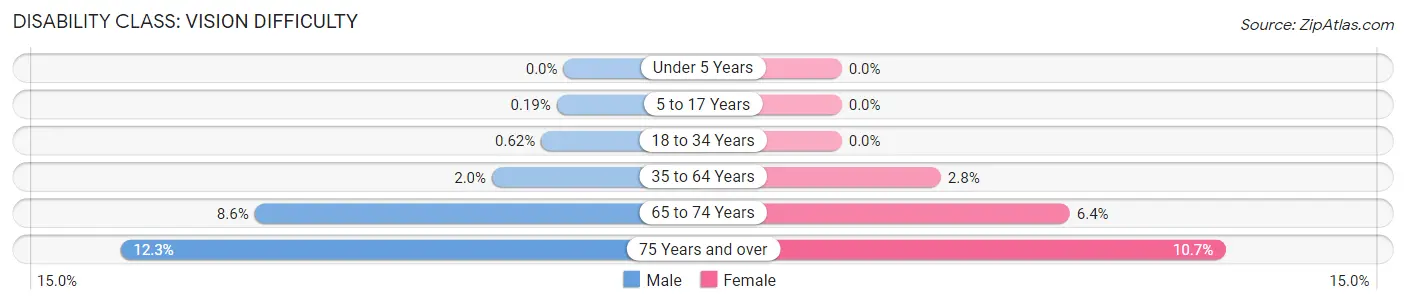
| Age Bracket | Male | Female |
| Under 5 Years | 0 (0.0%) | 0 (0.0%) |
| 5 to 17 Years | 1 (0.2%) | 0 (0.0%) |
| 18 to 34 Years | 4 (0.6%) | 0 (0.0%) |
| 35 to 64 Years | 16 (2.0%) | 21 (2.8%) |
| 65 to 74 Years | 19 (8.6%) | 12 (6.4%) |
| 75 Years and over | 9 (12.3%) | 8 (10.7%) |
Disability Class: Cognitive Difficulty
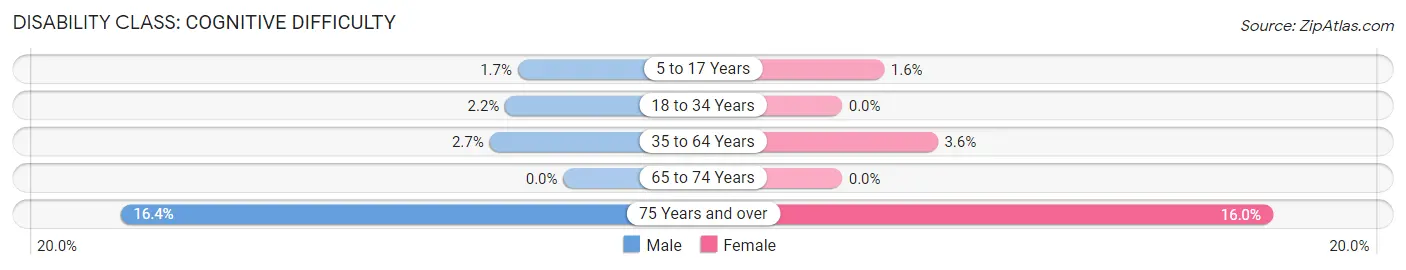
| Age Bracket | Male | Female |
| 5 to 17 Years | 9 (1.7%) | 8 (1.6%) |
| 18 to 34 Years | 14 (2.2%) | 0 (0.0%) |
| 35 to 64 Years | 22 (2.7%) | 27 (3.5%) |
| 65 to 74 Years | 0 (0.0%) | 0 (0.0%) |
| 75 Years and over | 12 (16.4%) | 12 (16.0%) |
Disability Class: Ambulatory Difficulty
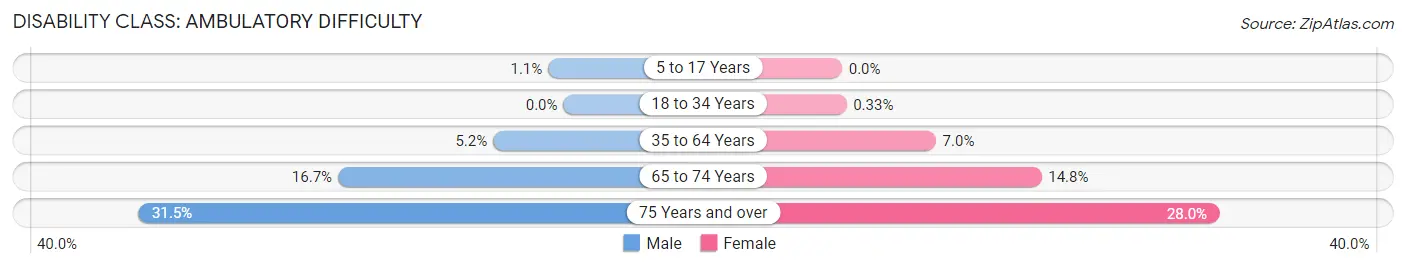
| Age Bracket | Male | Female |
| 5 to 17 Years | 6 (1.1%) | 0 (0.0%) |
| 18 to 34 Years | 0 (0.0%) | 2 (0.3%) |
| 35 to 64 Years | 42 (5.2%) | 53 (7.0%) |
| 65 to 74 Years | 37 (16.7%) | 28 (14.8%) |
| 75 Years and over | 23 (31.5%) | 21 (28.0%) |
Disability Class: Self-Care Difficulty
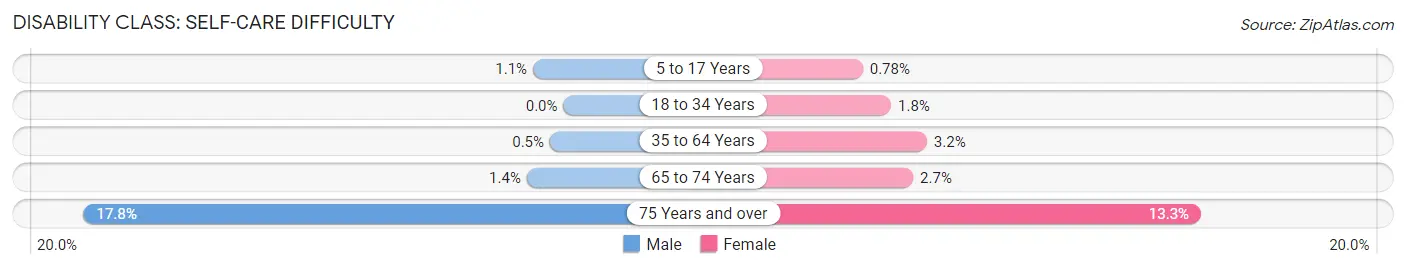
| Age Bracket | Male | Female |
| 5 to 17 Years | 6 (1.1%) | 4 (0.8%) |
| 18 to 34 Years | 0 (0.0%) | 11 (1.8%) |
| 35 to 64 Years | 4 (0.5%) | 24 (3.2%) |
| 65 to 74 Years | 3 (1.4%) | 5 (2.6%) |
| 75 Years and over | 13 (17.8%) | 10 (13.3%) |
Technology Access in Dillingham Census Area
Computing Device Access in Dillingham Census Area
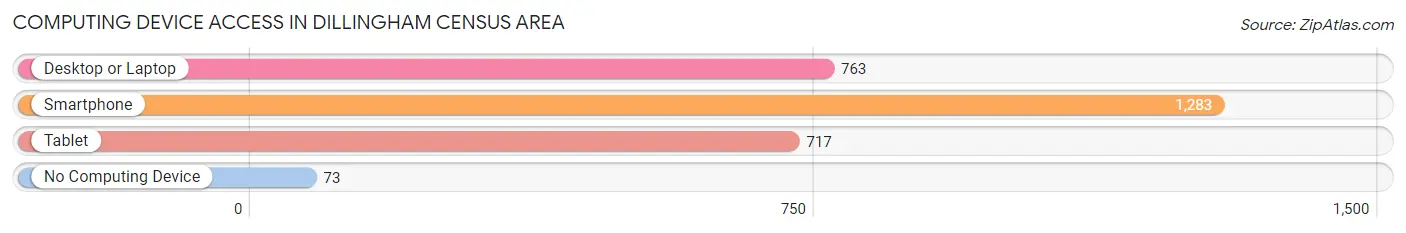
| Device Type | # Households | % Households |
| Desktop or Laptop | 763 | 55.1% |
| Smartphone | 1,283 | 92.7% |
| Tablet | 717 | 51.8% |
| No Computing Device | 73 | 5.3% |
| Total | 1,384 | 100.0% |
Internet Access in Dillingham Census Area
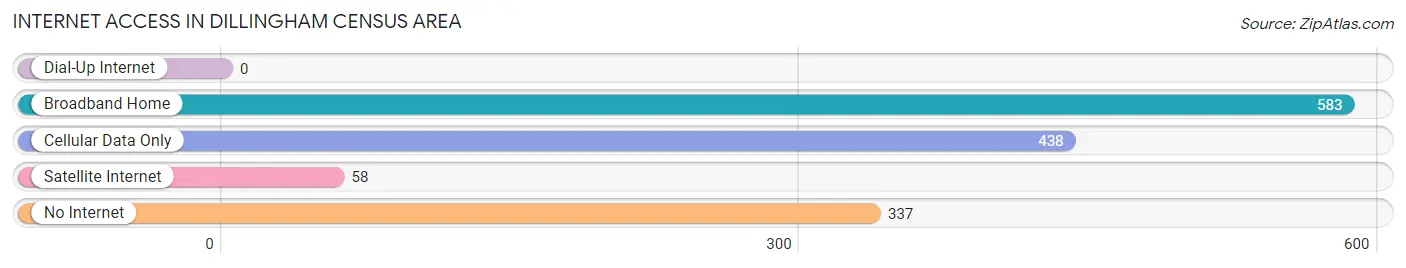
| Internet Type | # Households | % Households |
| Dial-Up Internet | 0 | 0.0% |
| Broadband Home | 583 | 42.1% |
| Cellular Data Only | 438 | 31.7% |
| Satellite Internet | 58 | 4.2% |
| No Internet | 337 | 24.3% |
| Total | 1,384 | 100.0% |
Dillingham Census Area Summary
Dillingham Census Area, Alaska is located in the southwestern part of the state, and is part of the Bristol Bay Borough. It is bordered by the Bering Sea to the west, the Yukon-Kuskokwim Delta to the north, and the Aleutian Range to the south. The area covers an area of 16,843 square miles, making it the second largest census area in the state. It has a population of 4,847 as of the 2010 census.
History
The area now known as Dillingham Census Area has been inhabited by the Yup'ik and Dena'ina people for thousands of years. The area was first explored by Europeans in 1741, when Vitus Bering and his crew sailed through the area. In the late 19th century, the area was explored by gold prospectors, and in the early 20th century, the area was opened up to commercial fishing. The area was officially established as the Dillingham Census Area in 1959, when the Alaska State Legislature passed the Alaska Reorganization Act.
Geography
Dillingham Census Area is located in the southwestern part of Alaska, and is part of the Bristol Bay Borough. It is bordered by the Bering Sea to the west, the Yukon-Kuskokwim Delta to the north, and the Aleutian Range to the south. The area covers an area of 16,843 square miles, making it the second largest census area in the state. The terrain is mostly flat, with some hills and mountains in the northern and southern parts of the area. The climate is subarctic, with cold winters and mild summers.
Economy
The economy of Dillingham Census Area is largely based on fishing and tourism. Commercial fishing is the main industry in the area, with salmon, halibut, and crab being the main catches. Tourism is also an important part of the economy, with visitors coming to the area to fish, hunt, and enjoy the natural beauty of the area. The area is also home to several Native American tribes, and the tribes are involved in subsistence fishing and hunting.
Demographics
As of the 2010 census, the population of Dillingham Census Area was 4,847. The population is mostly Native American, with the majority being Yup'ik and Dena'ina. The area also has a small population of non-Native Americans, mostly of European descent. The median household income in the area is $45,000, and the median age is 33. The area has a high rate of poverty, with nearly one-third of the population living below the poverty line.
Common Questions
What is the Total Population of Dillingham Census Area?
Total Population of Dillingham Census Area is 4,854.
What is the Total Male Population of Dillingham Census Area?
Total Male Population of Dillingham Census Area is 2,492.
What is the Total Female Population of Dillingham Census Area?
Total Female Population of Dillingham Census Area is 2,362.
What is the Ratio of Males per 100 Females in Dillingham Census Area?
There are 105.50 Males per 100 Females in Dillingham Census Area.
What is the Ratio of Females per 100 Males in Dillingham Census Area?
There are 94.78 Females per 100 Males in Dillingham Census Area.
What is the Median Population Age in Dillingham Census Area?
Median Population Age in Dillingham Census Area is 30.7 Years.
What is the Average Family Size in Dillingham Census Area
Average Family Size in Dillingham Census Area is 3.7 People.
What is the Average Household Size in Dillingham Census Area
Average Household Size in Dillingham Census Area is 3.2 People.
What is Per Capita Income in Dillingham Census Area?
Per Capita income in Dillingham Census Area is $31,948.
What is the Median Family Income in Dillingham Census Area?
Median Family Income in Dillingham Census Area is $72,500.
What is the Median Household income in Dillingham Census Area?
Median Household Income in Dillingham Census Area is $69,412.
What is Income or Wage Gap in Dillingham Census Area?
Income or Wage Gap in Dillingham Census Area is 24.5%.
Women in Dillingham Census Area earn 75.5 cents for every dollar earned by a man.
What is Family Income Deficit in Dillingham Census Area?
Family Income Deficit in Dillingham Census Area is $10,536.
Families that are below poverty line in Dillingham Census Area earn $10,536 less on average than the poverty threshold level.
What is Inequality or Gini Index in Dillingham Census Area?
Inequality or Gini Index in Dillingham Census Area is 0.41.
How Large is the Labor Force in Dillingham Census Area?
There are 2,182 People in the Labor Forcein in Dillingham Census Area.
What is the Percentage of People in the Labor Force in Dillingham Census Area?
62.0% of People are in the Labor Force in Dillingham Census Area.
What is the Unemployment Rate in Dillingham Census Area?
Unemployment Rate in Dillingham Census Area is 11.3%.