Denali Borough, AK
Denali Borough Map
Denali Borough Overview
2,101
TOTAL POPULATION
1,417
MALE POPULATION
684
FEMALE POPULATION
207.16
MALES / 100 FEMALES
48.27
FEMALES / 100 MALES
44.4
MEDIAN AGE
3.1
AVG FAMILY SIZE
2.3
AVG HOUSEHOLD SIZE
$73,692
PER CAPITA INCOME
$131,750
AVG FAMILY INCOME
$87,292
AVG HOUSEHOLD INCOME
0.38
INEQUALITY / GINI INDEX
1,418
LABOR FORCE [ PEOPLE ]
75.4%
PERCENT IN LABOR FORCE
1.9%
UNEMPLOYMENT RATE
Denali Borough Area Codes
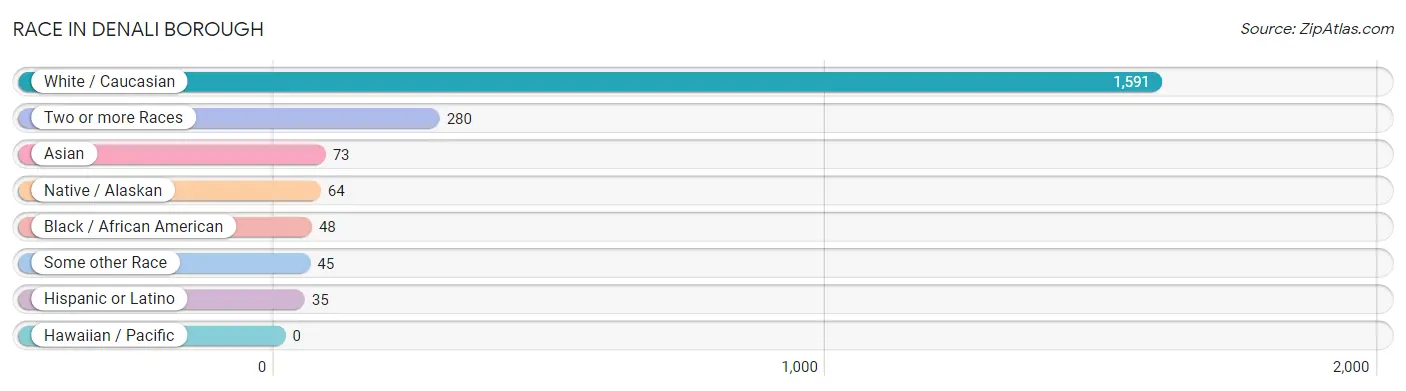
Race in Denali Borough
The most populous races in Denali Borough are White / Caucasian (1,591 | 75.7%), Two or more Races (280 | 13.3%), and Asian (73 | 3.5%).
| Race | # Population | % Population |
| Asian | 73 | 3.5% |
| Black / African American | 48 | 2.3% |
| Hawaiian / Pacific | 0 | 0.0% |
| Hispanic or Latino | 35 | 1.7% |
| Native / Alaskan | 64 | 3.0% |
| White / Caucasian | 1,591 | 75.7% |
| Two or more Races | 280 | 13.3% |
| Some other Race | 45 | 2.1% |
| Total | 2,101 | 100.0% |
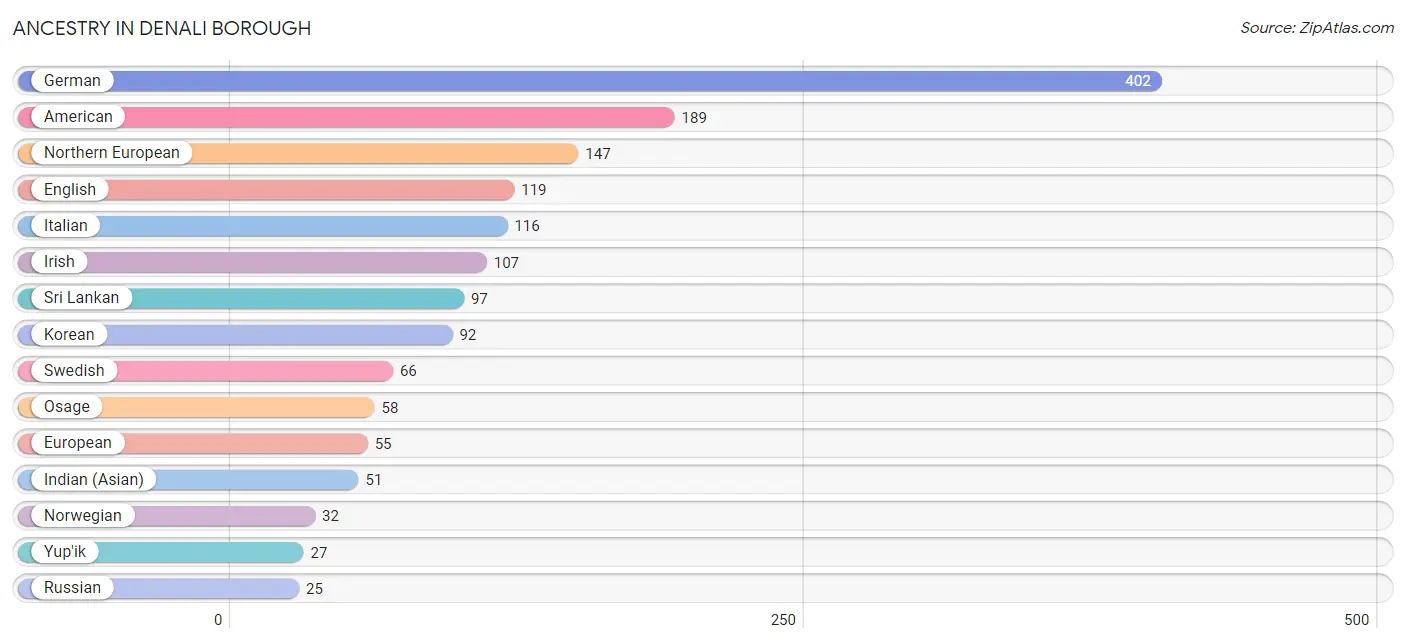
Ancestry in Denali Borough
The most populous ancestries reported in Denali Borough are German (402 | 19.1%), American (189 | 9.0%), Northern European (147 | 7.0%), English (119 | 5.7%), and Italian (116 | 5.5%), together accounting for 46.3% of all Denali Borough residents.
| Ancestry | # Population | % Population |
| Alaska Native | 12 | 0.6% |
| Alaskan Athabascan | 22 | 1.1% |
| Aleut | 11 | 0.5% |
| American | 189 | 9.0% |
| Apache | 2 | 0.1% |
| Arab | 3 | 0.1% |
| Barbadian | 9 | 0.4% |
| Belgian | 5 | 0.2% |
| Canadian | 21 | 1.0% |
| Celtic | 1 | 0.1% |
| Cherokee | 4 | 0.2% |
| Cree | 3 | 0.1% |
| Czech | 22 | 1.1% |
| Danish | 3 | 0.1% |
| Dutch | 9 | 0.4% |
| Eastern European | 6 | 0.3% |
| English | 119 | 5.7% |
| European | 55 | 2.6% |
| French | 18 | 0.9% |
| French Canadian | 13 | 0.6% |
| German | 402 | 19.1% |
| Greek | 2 | 0.1% |
| Hungarian | 3 | 0.1% |
| Indian (Asian) | 51 | 2.4% |
| Inupiat | 17 | 0.8% |
| Irish | 107 | 5.1% |
| Italian | 116 | 5.5% |
| Jamaican | 21 | 1.0% |
| Korean | 92 | 4.4% |
| Lebanese | 3 | 0.1% |
| Lithuanian | 19 | 0.9% |
| Mexican | 15 | 0.7% |
| New Zealander | 7 | 0.3% |
| Northern European | 147 | 7.0% |
| Norwegian | 32 | 1.5% |
| Osage | 58 | 2.8% |
| Paiute | 4 | 0.2% |
| Polish | 7 | 0.3% |
| Pueblo | 5 | 0.2% |
| Russian | 25 | 1.2% |
| Scandinavian | 2 | 0.1% |
| Scotch-Irish | 6 | 0.3% |
| Scottish | 20 | 0.9% |
| Seminole | 2 | 0.1% |
| Spaniard | 10 | 0.5% |
| Spanish | 10 | 0.5% |
| Sri Lankan | 97 | 4.6% |
| Subsaharan African | 9 | 0.4% |
| Swedish | 66 | 3.1% |
| Swiss | 3 | 0.1% |
| Syrian | 3 | 0.1% |
| Ukrainian | 10 | 0.5% |
| Ute | 6 | 0.3% |
| Welsh | 18 | 0.9% |
| Yup'ik | 27 | 1.3% | View All 55 Rows |
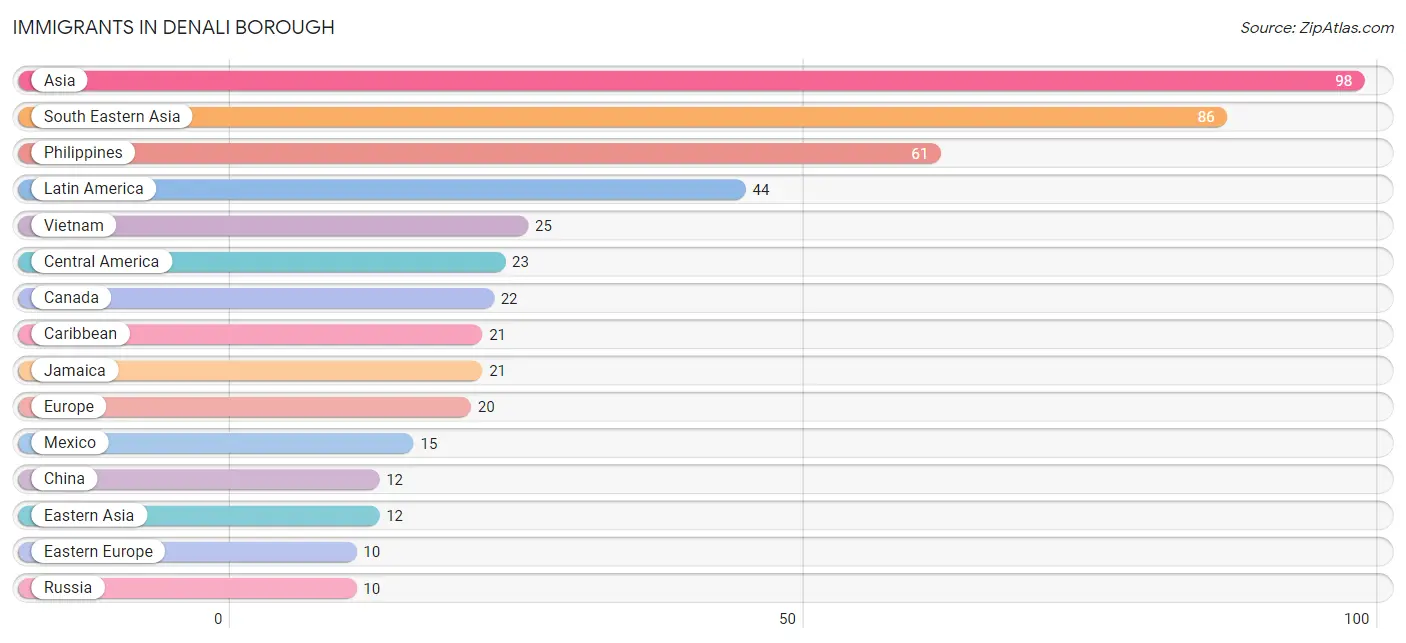
Immigrants in Denali Borough
The most numerous immigrant groups reported in Denali Borough came from Asia (98 | 4.7%), South Eastern Asia (86 | 4.1%), Philippines (61 | 2.9%), Latin America (44 | 2.1%), and Vietnam (25 | 1.2%), together accounting for 14.9% of all Denali Borough residents.
| Immigration Origin | # Population | % Population |
| Africa | 9 | 0.4% |
| Asia | 98 | 4.7% |
| Cameroon | 9 | 0.4% |
| Canada | 22 | 1.1% |
| Caribbean | 21 | 1.0% |
| Central America | 23 | 1.1% |
| China | 12 | 0.6% |
| Eastern Asia | 12 | 0.6% |
| Eastern Europe | 10 | 0.5% |
| Europe | 20 | 0.9% |
| Germany | 2 | 0.1% |
| Jamaica | 21 | 1.0% |
| Latin America | 44 | 2.1% |
| Mexico | 15 | 0.7% |
| Middle Africa | 9 | 0.4% |
| Northern Europe | 8 | 0.4% |
| Oceania | 7 | 0.3% |
| Panama | 8 | 0.4% |
| Philippines | 61 | 2.9% |
| Russia | 10 | 0.5% |
| South Eastern Asia | 86 | 4.1% |
| Vietnam | 25 | 1.2% |
| Western Europe | 2 | 0.1% | View All 23 Rows |
Sex and Age in Denali Borough
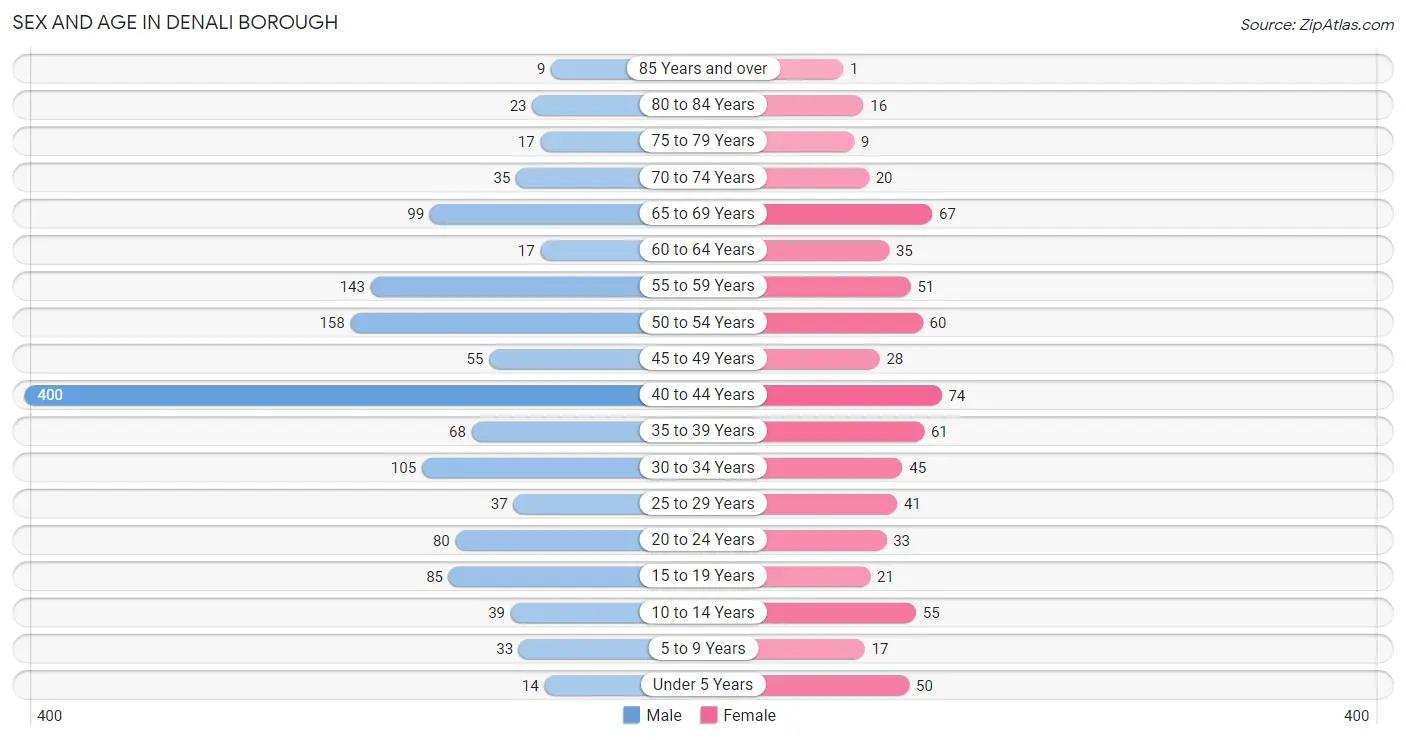
Sex and Age in Denali Borough
The most populous age groups in Denali Borough are 40 to 44 Years (400 | 28.2%) for men and 40 to 44 Years (74 | 10.8%) for women.
| Age Bracket | Male | Female |
| Under 5 Years | 14 (1.0%) | 50 (7.3%) |
| 5 to 9 Years | 33 (2.3%) | 17 (2.5%) |
| 10 to 14 Years | 39 (2.8%) | 55 (8.0%) |
| 15 to 19 Years | 85 (6.0%) | 21 (3.1%) |
| 20 to 24 Years | 80 (5.7%) | 33 (4.8%) |
| 25 to 29 Years | 37 (2.6%) | 41 (6.0%) |
| 30 to 34 Years | 105 (7.4%) | 45 (6.6%) |
| 35 to 39 Years | 68 (4.8%) | 61 (8.9%) |
| 40 to 44 Years | 400 (28.2%) | 74 (10.8%) |
| 45 to 49 Years | 55 (3.9%) | 28 (4.1%) |
| 50 to 54 Years | 158 (11.2%) | 60 (8.8%) |
| 55 to 59 Years | 143 (10.1%) | 51 (7.5%) |
| 60 to 64 Years | 17 (1.2%) | 35 (5.1%) |
| 65 to 69 Years | 99 (7.0%) | 67 (9.8%) |
| 70 to 74 Years | 35 (2.5%) | 20 (2.9%) |
| 75 to 79 Years | 17 (1.2%) | 9 (1.3%) |
| 80 to 84 Years | 23 (1.6%) | 16 (2.3%) |
| 85 Years and over | 9 (0.6%) | 1 (0.2%) |
| Total | 1,417 (100.0%) | 684 (100.0%) |
Families and Households in Denali Borough
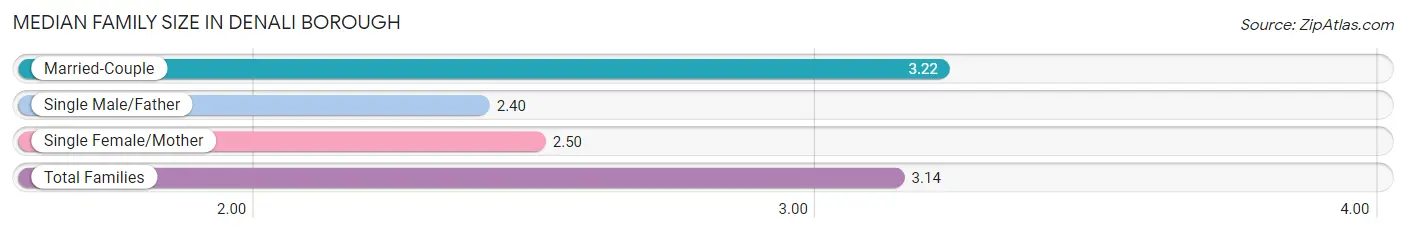
Median Family Size in Denali Borough
The median family size in Denali Borough is 3.14 persons per family, with married-couple families (268 | 88.7%) accounting for the largest median family size of 3.22 persons per family. On the other hand, single male/father families (20 | 6.6%) represent the smallest median family size with 2.40 persons per family.
| Family Type | # Families | Family Size |
| Married-Couple | 268 (88.7%) | 3.22 |
| Single Male/Father | 20 (6.6%) | 2.40 |
| Single Female/Mother | 14 (4.6%) | 2.50 |
| Total Families | 302 (100.0%) | 3.14 |
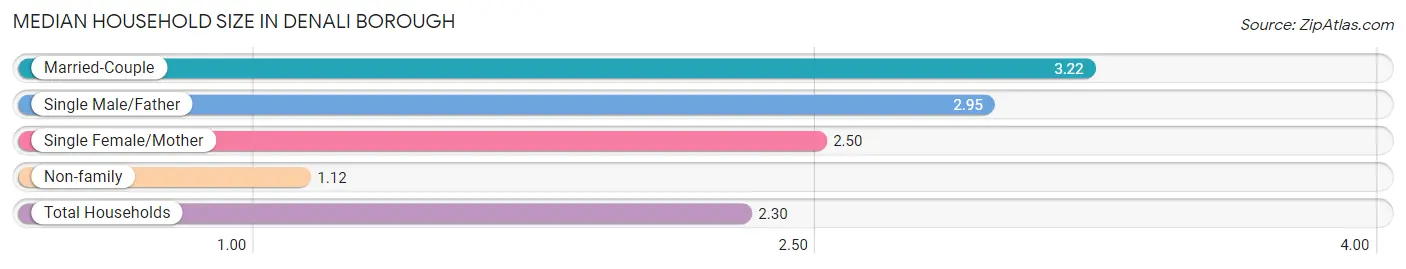
Median Household Size in Denali Borough
The median household size in Denali Borough is 2.30 persons per household, with married-couple households (268 | 51.0%) accounting for the largest median household size of 3.22 persons per household. non-family households (223 | 42.5%) represent the smallest median household size with 1.12 persons per household.
| Household Type | # Households | Household Size |
| Married-Couple | 268 (51.0%) | 3.22 |
| Single Male/Father | 20 (3.8%) | 2.95 |
| Single Female/Mother | 14 (2.7%) | 2.50 |
| Non-family | 223 (42.5%) | 1.12 |
| Total Households | 525 (100.0%) | 2.30 |
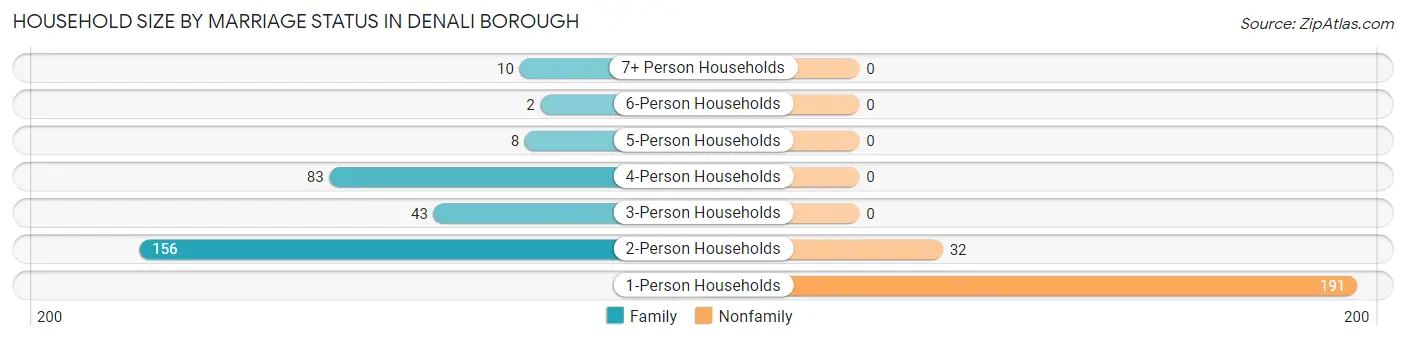
Household Size by Marriage Status in Denali Borough
Out of a total of 525 households in Denali Borough, 302 (57.5%) are family households, while 223 (42.5%) are nonfamily households. The most numerous type of family households are 2-person households, comprising 156, and the most common type of nonfamily households are 1-person households, comprising 191.
| Household Size | Family Households | Nonfamily Households |
| 1-Person Households | - | 191 (36.4%) |
| 2-Person Households | 156 (29.7%) | 32 (6.1%) |
| 3-Person Households | 43 (8.2%) | 0 (0.0%) |
| 4-Person Households | 83 (15.8%) | 0 (0.0%) |
| 5-Person Households | 8 (1.5%) | 0 (0.0%) |
| 6-Person Households | 2 (0.4%) | 0 (0.0%) |
| 7+ Person Households | 10 (1.9%) | 0 (0.0%) |
| Total | 302 (57.5%) | 223 (42.5%) |
Female Fertility in Denali Borough
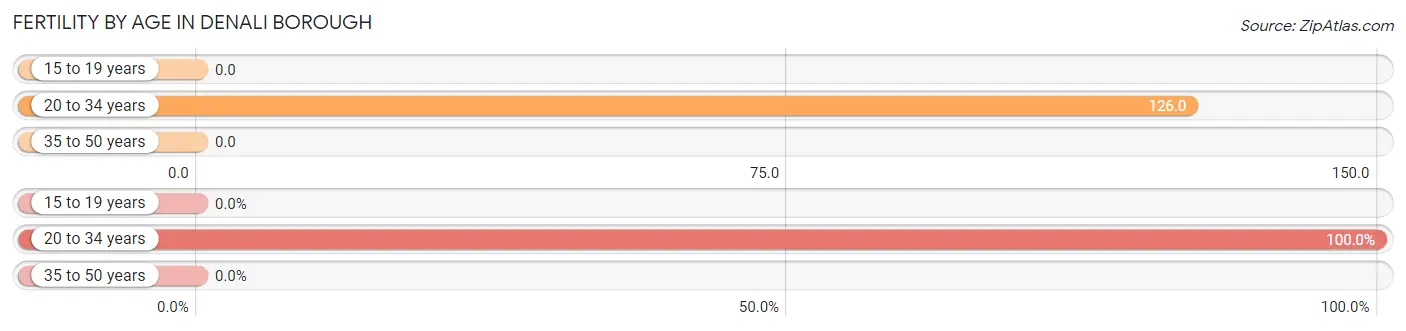
Fertility by Age in Denali Borough
Average fertility rate in Denali Borough is 46.0 births per 1,000 women. Women in the age bracket of 20 to 34 years have the highest fertility rate with 126.0 births per 1,000 women. Women in the age bracket of 20 to 34 years acount for 100.0% of all women with births.
| Age Bracket | Women with Births | Births / 1,000 Women |
| 15 to 19 years | 0 (0.0%) | 0.0 |
| 20 to 34 years | 15 (100.0%) | 126.0 |
| 35 to 50 years | 0 (0.0%) | 0.0 |
| Total | 15 (100.0%) | 46.0 |
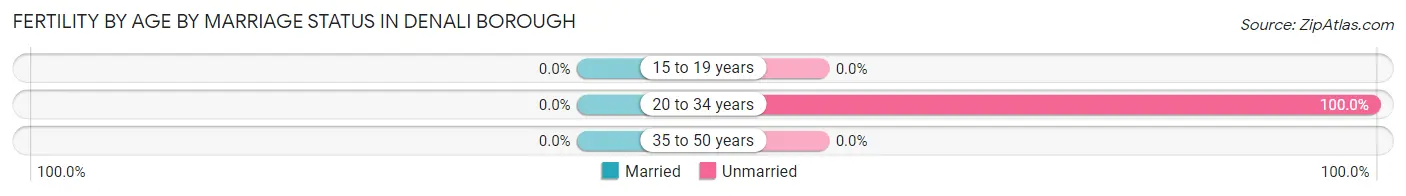
Fertility by Age by Marriage Status in Denali Borough
| Age Bracket | Married | Unmarried |
| 15 to 19 years | 0 (0.0%) | 0 (0.0%) |
| 20 to 34 years | 0 (0.0%) | 15 (100.0%) |
| 35 to 50 years | 0 (0.0%) | 0 (0.0%) |
| Total | 0 (0.0%) | 15 (100.0%) |
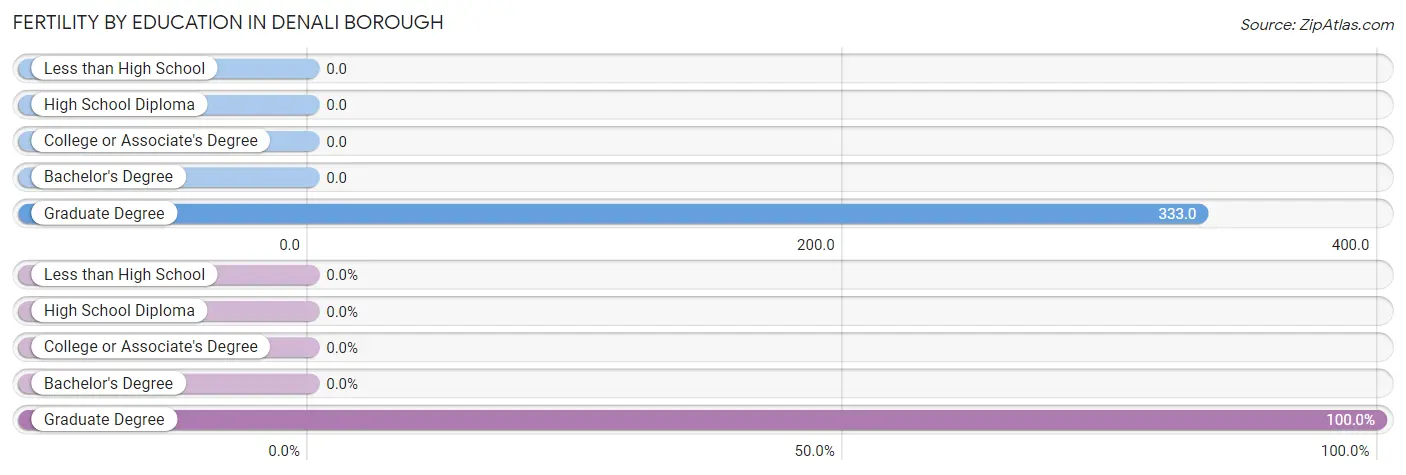
Fertility by Education in Denali Borough
| Educational Attainment | Women with Births | Births / 1,000 Women |
| Less than High School | 0 (0.0%) | 0.0 |
| High School Diploma | 0 (0.0%) | 0.0 |
| College or Associate's Degree | 0 (0.0%) | 0.0 |
| Bachelor's Degree | 0 (0.0%) | 0.0 |
| Graduate Degree | 15 (100.0%) | 333.0 |
| Total | 15 (100.0%) | 46.0 |
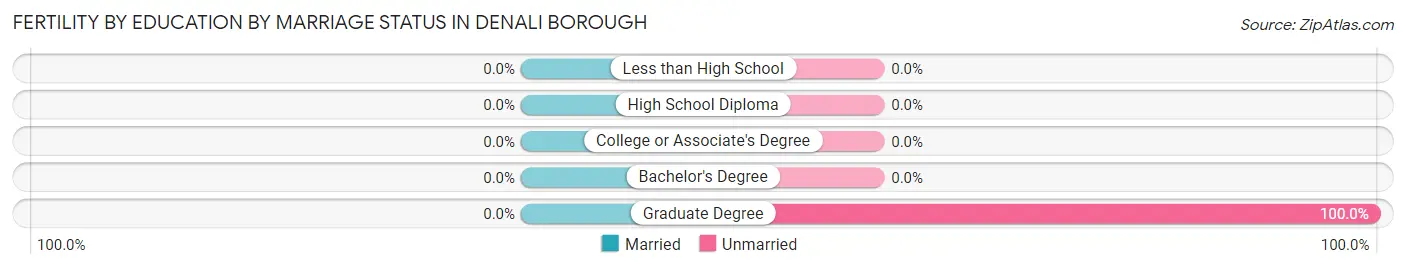
Fertility by Education by Marriage Status in Denali Borough
| Educational Attainment | Married | Unmarried |
| Less than High School | 0 (0.0%) | 0 (0.0%) |
| High School Diploma | 0 (0.0%) | 0 (0.0%) |
| College or Associate's Degree | 0 (0.0%) | 0 (0.0%) |
| Bachelor's Degree | 0 (0.0%) | 0 (0.0%) |
| Graduate Degree | 0 (0.0%) | 15 (100.0%) |
| Total | 0 (0.0%) | 15 (100.0%) |
Income in Denali Borough
Income Overview in Denali Borough
Per Capita Income in Denali Borough is $73,692, while median incomes of families and households are $131,750 and $87,292 respectively.
| Characteristic | Number | Measure |
| Per Capita Income | 2,101 | $73,692 |
| Median Family Income | 302 | $131,750 |
| Mean Family Income | 302 | $133,880 |
| Median Household Income | 525 | $87,292 |
| Mean Household Income | 525 | $98,536 |
| Income Deficit | 302 | $0 |
| Wage / Income Gap (%) | 2,101 | 0.00% |
| Wage / Income Gap ($) | 2,101 | 100.00¢ per $1 |
| Gini / Inequality Index | 2,101 | 0.38 |
Earnings by Sex in Denali Borough
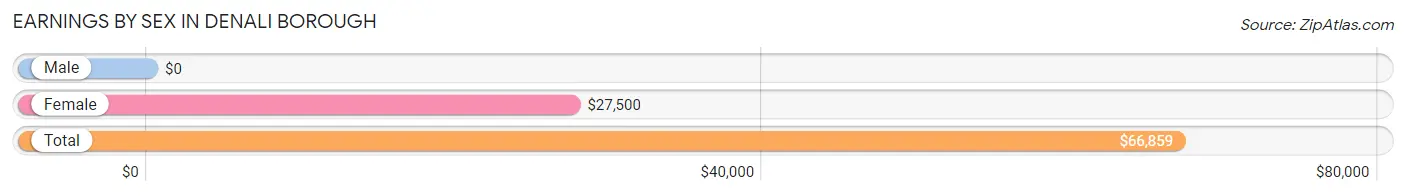
| Sex | Number | Average Earnings |
| Male | 1,132 (73.0%) | $0 |
| Female | 418 (27.0%) | $27,500 |
| Total | 1,550 (100.0%) | $66,859 |
Earnings by Sex by Income Bracket in Denali Borough
The most common earnings brackets in Denali Borough are $100,000+ for men (579 | 51.1%) and $5,000 to $7,499 for women (66 | 15.8%).
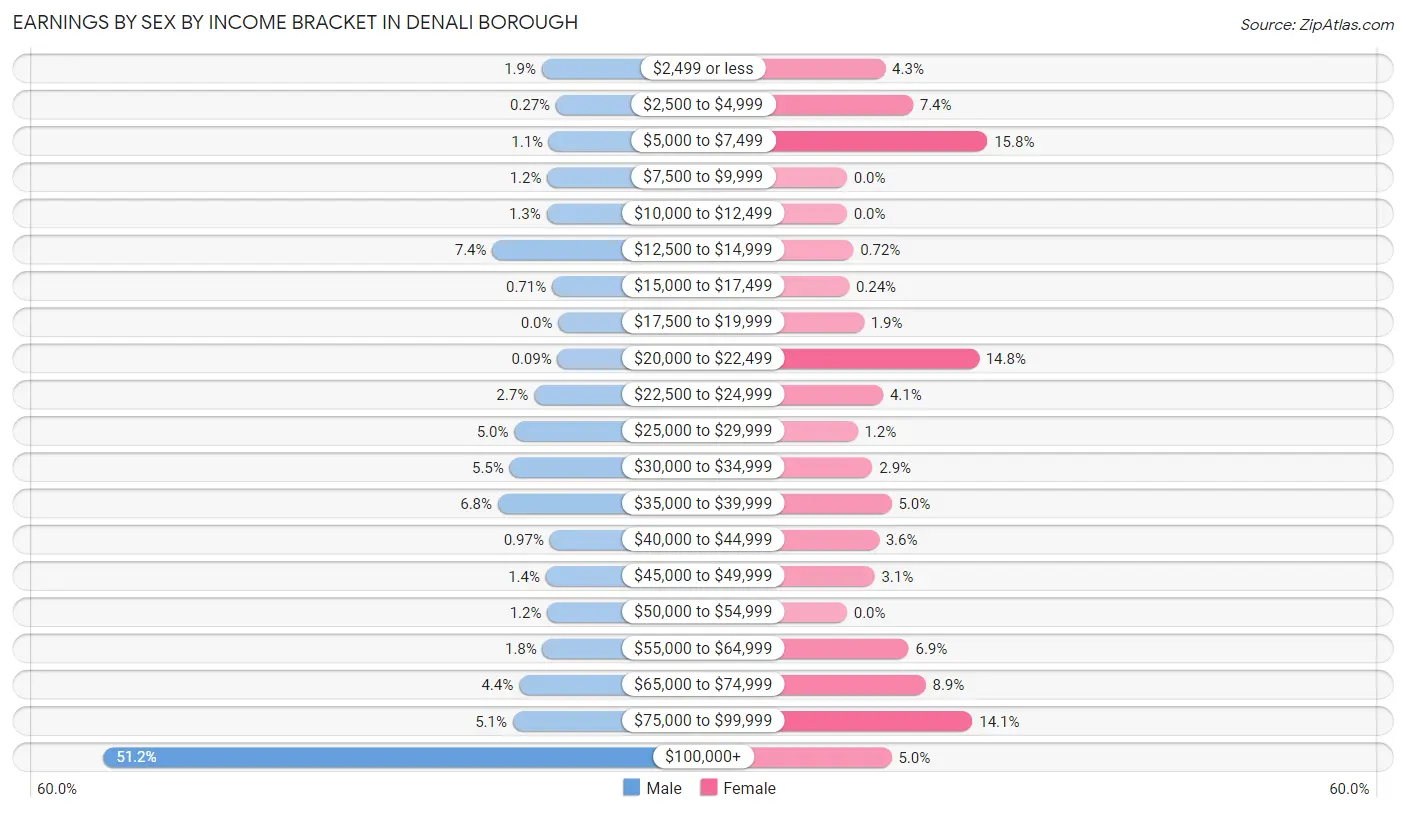
| Income | Male | Female |
| $2,499 or less | 21 (1.9%) | 18 (4.3%) |
| $2,500 to $4,999 | 3 (0.3%) | 31 (7.4%) |
| $5,000 to $7,499 | 12 (1.1%) | 66 (15.8%) |
| $7,500 to $9,999 | 14 (1.2%) | 0 (0.0%) |
| $10,000 to $12,499 | 15 (1.3%) | 0 (0.0%) |
| $12,500 to $14,999 | 84 (7.4%) | 3 (0.7%) |
| $15,000 to $17,499 | 8 (0.7%) | 1 (0.2%) |
| $17,500 to $19,999 | 0 (0.0%) | 8 (1.9%) |
| $20,000 to $22,499 | 1 (0.1%) | 62 (14.8%) |
| $22,500 to $24,999 | 31 (2.7%) | 17 (4.1%) |
| $25,000 to $29,999 | 56 (5.0%) | 5 (1.2%) |
| $30,000 to $34,999 | 62 (5.5%) | 12 (2.9%) |
| $35,000 to $39,999 | 77 (6.8%) | 21 (5.0%) |
| $40,000 to $44,999 | 11 (1.0%) | 15 (3.6%) |
| $45,000 to $49,999 | 16 (1.4%) | 13 (3.1%) |
| $50,000 to $54,999 | 14 (1.2%) | 0 (0.0%) |
| $55,000 to $64,999 | 20 (1.8%) | 29 (6.9%) |
| $65,000 to $74,999 | 50 (4.4%) | 37 (8.8%) |
| $75,000 to $99,999 | 58 (5.1%) | 59 (14.1%) |
| $100,000+ | 579 (51.1%) | 21 (5.0%) |
| Total | 1,132 (100.0%) | 418 (100.0%) |
Earnings by Sex by Educational Attainment in Denali Borough
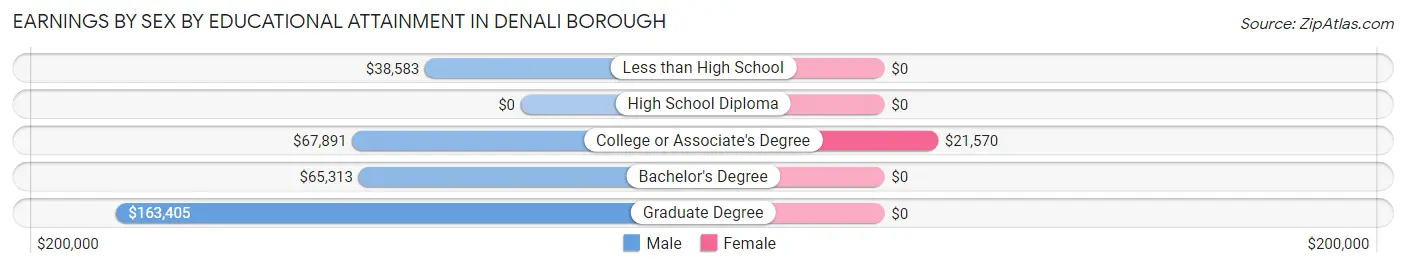
| Educational Attainment | Male Income | Female Income |
| Less than High School | $38,583 | $0 |
| High School Diploma | - | - |
| College or Associate's Degree | $67,891 | $21,570 |
| Bachelor's Degree | $65,313 | $0 |
| Graduate Degree | $163,405 | $0 |
| Total | - | - |
Family Income in Denali Borough
Family Income Brackets in Denali Borough
According to the Denali Borough family income data, there are 99 families falling into the $150,000 to $199,999 income range, which is the most common income bracket and makes up 32.8% of all families.
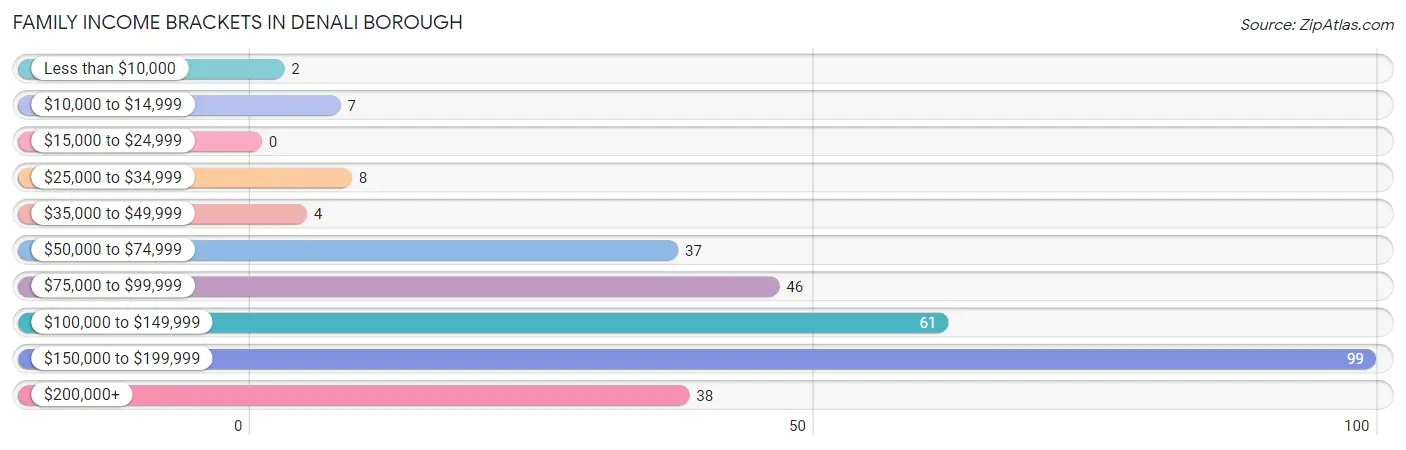
| Income Bracket | # Families | % Families |
| Less than $10,000 | 2 | 0.7% |
| $10,000 to $14,999 | 7 | 2.3% |
| $15,000 to $24,999 | 0 | 0.0% |
| $25,000 to $34,999 | 8 | 2.6% |
| $35,000 to $49,999 | 4 | 1.3% |
| $50,000 to $74,999 | 37 | 12.3% |
| $75,000 to $99,999 | 46 | 15.2% |
| $100,000 to $149,999 | 61 | 20.2% |
| $150,000 to $199,999 | 99 | 32.8% |
| $200,000+ | 38 | 12.6% |
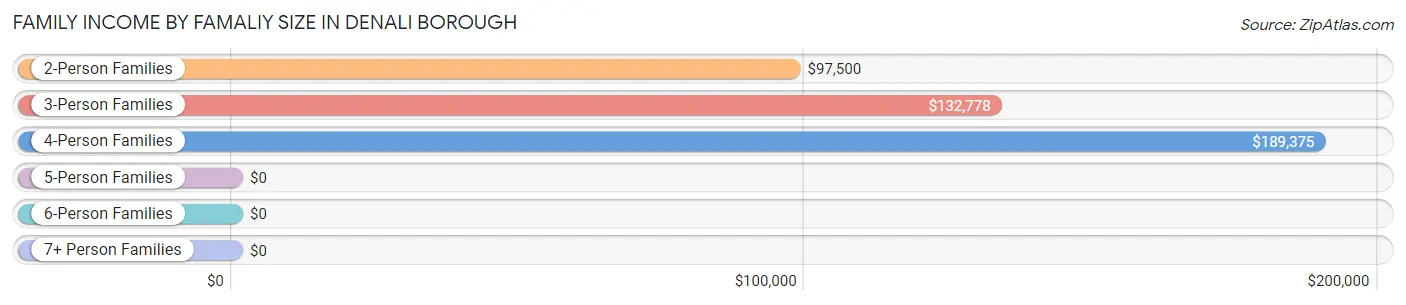
Family Income by Famaliy Size in Denali Borough
4-person families (83 | 27.5%) account for the highest median family income in Denali Borough with $189,375 per family, while 2-person families (156 | 51.7%) have the highest median income of $48,750 per family member.
| Income Bracket | # Families | Median Income |
| 2-Person Families | 156 (51.7%) | $97,500 |
| 3-Person Families | 48 (15.9%) | $132,778 |
| 4-Person Families | 83 (27.5%) | $189,375 |
| 5-Person Families | 3 (1.0%) | $0 |
| 6-Person Families | 2 (0.7%) | $0 |
| 7+ Person Families | 10 (3.3%) | $0 |
| Total | 302 (100.0%) | $131,750 |
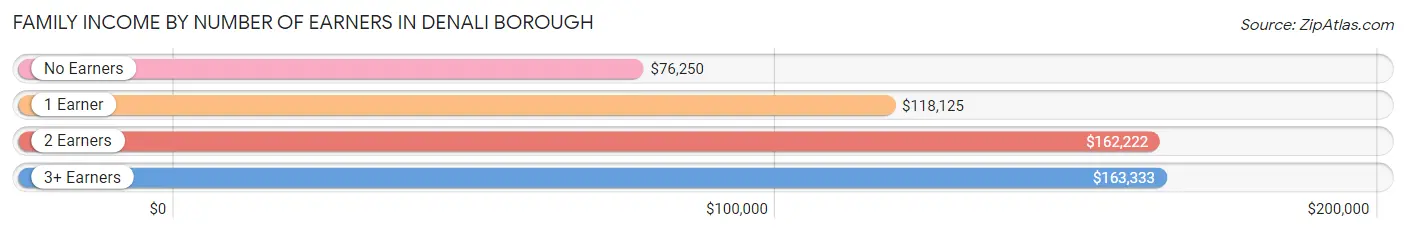
Family Income by Number of Earners in Denali Borough
The median family income in Denali Borough is $131,750, with families comprising 3+ earners (16) having the highest median family income of $163,333, while families with no earners (48) have the lowest median family income of $76,250, accounting for 5.3% and 15.9% of families, respectively.
| Number of Earners | # Families | Median Income |
| No Earners | 48 (15.9%) | $76,250 |
| 1 Earner | 56 (18.5%) | $118,125 |
| 2 Earners | 182 (60.3%) | $162,222 |
| 3+ Earners | 16 (5.3%) | $163,333 |
| Total | 302 (100.0%) | $131,750 |
Household Income in Denali Borough
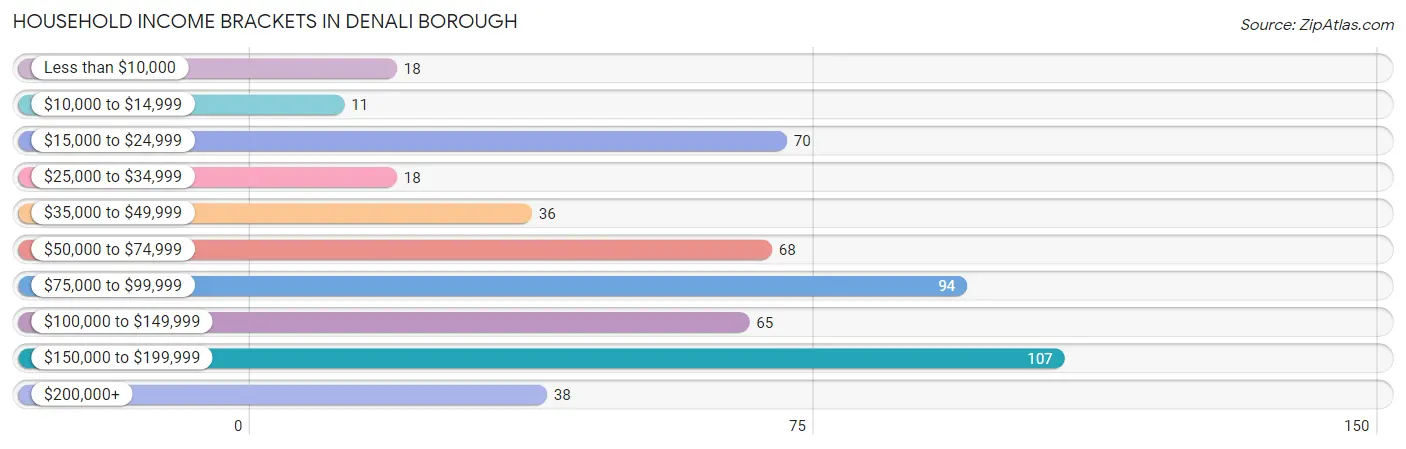
Household Income Brackets in Denali Borough
With 107 households falling in the category, the $150,000 to $199,999 income range is the most frequent in Denali Borough, accounting for 20.4% of all households. In contrast, only 11 households (2.1%) fall into the $10,000 to $14,999 income bracket, making it the least populous group.
| Income Bracket | # Households | % Households |
| Less than $10,000 | 18 | 3.4% |
| $10,000 to $14,999 | 11 | 2.1% |
| $15,000 to $24,999 | 70 | 13.3% |
| $25,000 to $34,999 | 18 | 3.4% |
| $35,000 to $49,999 | 36 | 6.9% |
| $50,000 to $74,999 | 68 | 13.0% |
| $75,000 to $99,999 | 94 | 17.9% |
| $100,000 to $149,999 | 65 | 12.4% |
| $150,000 to $199,999 | 107 | 20.4% |
| $200,000+ | 38 | 7.2% |
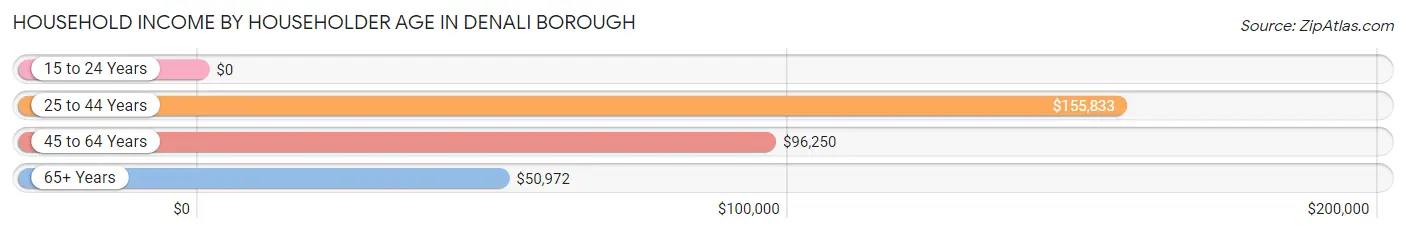
Household Income by Householder Age in Denali Borough
The median household income in Denali Borough is $87,292, with the highest median household income of $155,833 found in the 25 to 44 years age bracket for the primary householder. A total of 126 households (24.0%) fall into this category. Meanwhile, the 15 to 24 years age bracket for the primary householder has the lowest median household income of $0, with 20 households (3.8%) in this group.
| Income Bracket | # Households | Median Income |
| 15 to 24 Years | 20 (3.8%) | $0 |
| 25 to 44 Years | 126 (24.0%) | $155,833 |
| 45 to 64 Years | 188 (35.8%) | $96,250 |
| 65+ Years | 191 (36.4%) | $50,972 |
| Total | 525 (100.0%) | $87,292 |
Poverty in Denali Borough
Income Below Poverty by Sex and Age in Denali Borough
With 5.9% poverty level for males and 10.1% for females among the residents of Denali Borough, under 5 year old males and 5 year old females are the most vulnerable to poverty, with 14 males (100.0%) and 8 females (100.0%) in their respective age groups living below the poverty level.
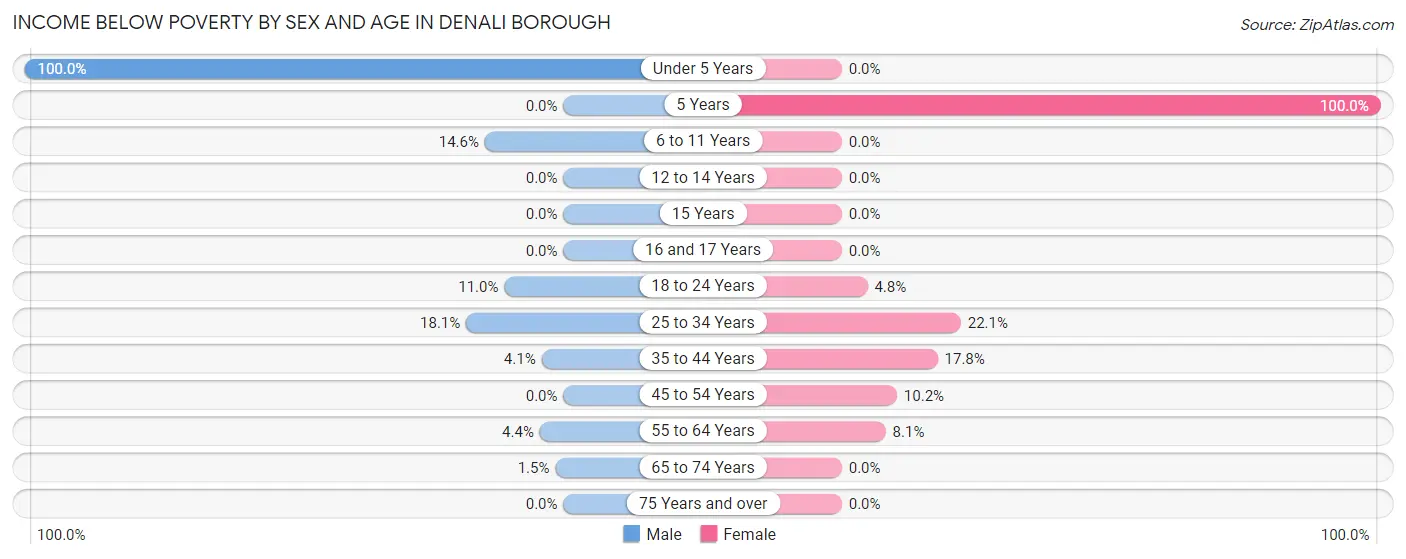
| Age Bracket | Male | Female |
| Under 5 Years | 14 (100.0%) | 0 (0.0%) |
| 5 Years | 0 (0.0%) | 8 (100.0%) |
| 6 to 11 Years | 7 (14.6%) | 0 (0.0%) |
| 12 to 14 Years | 0 (0.0%) | 0 (0.0%) |
| 15 Years | 0 (0.0%) | 0 (0.0%) |
| 16 and 17 Years | 0 (0.0%) | 0 (0.0%) |
| 18 to 24 Years | 8 (11.0%) | 2 (4.8%) |
| 25 to 34 Years | 24 (18.0%) | 19 (22.1%) |
| 35 to 44 Years | 19 (4.1%) | 24 (17.8%) |
| 45 to 54 Years | 0 (0.0%) | 9 (10.2%) |
| 55 to 64 Years | 7 (4.4%) | 7 (8.1%) |
| 65 to 74 Years | 2 (1.5%) | 0 (0.0%) |
| 75 Years and over | 0 (0.0%) | 0 (0.0%) |
| Total | 81 (5.9%) | 69 (10.1%) |
Income Above Poverty by Sex and Age in Denali Borough
According to the poverty statistics in Denali Borough, males aged 5 years and females aged under 5 years are the age groups that are most secure financially, with 100.0% of males and 100.0% of females in these age groups living above the poverty line.
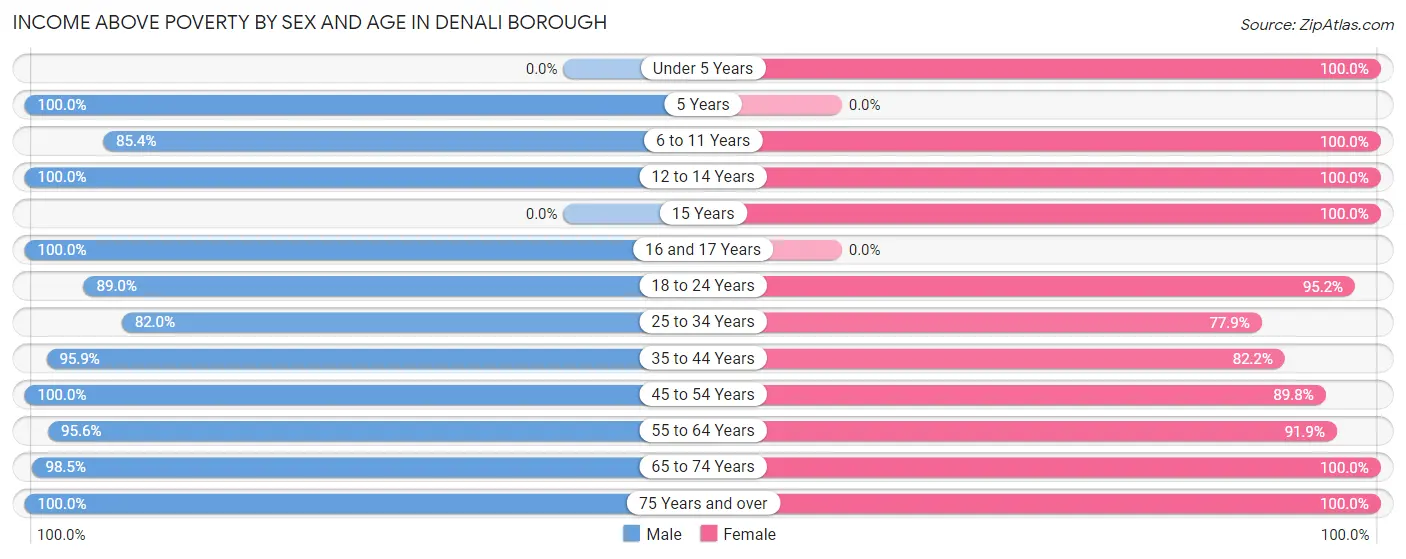
| Age Bracket | Male | Female |
| Under 5 Years | 0 (0.0%) | 50 (100.0%) |
| 5 Years | 9 (100.0%) | 0 (0.0%) |
| 6 to 11 Years | 41 (85.4%) | 29 (100.0%) |
| 12 to 14 Years | 15 (100.0%) | 35 (100.0%) |
| 15 Years | 0 (0.0%) | 12 (100.0%) |
| 16 and 17 Years | 52 (100.0%) | 0 (0.0%) |
| 18 to 24 Years | 65 (89.0%) | 40 (95.2%) |
| 25 to 34 Years | 109 (82.0%) | 67 (77.9%) |
| 35 to 44 Years | 449 (95.9%) | 111 (82.2%) |
| 45 to 54 Years | 213 (100.0%) | 79 (89.8%) |
| 55 to 64 Years | 153 (95.6%) | 79 (91.9%) |
| 65 to 74 Years | 132 (98.5%) | 87 (100.0%) |
| 75 Years and over | 49 (100.0%) | 26 (100.0%) |
| Total | 1,287 (94.1%) | 615 (89.9%) |
Income Below Poverty Among Married-Couple Families in Denali Borough
The poverty statistics for married-couple families in Denali Borough show that 3.0% or 8 of the total 268 families live below the poverty line. Families with 3 or 4 children have the highest poverty rate of 50.0%, comprising of 1 families. On the other hand, families with 1 or 2 children have the lowest poverty rate of 0.0%, which includes 0 families.
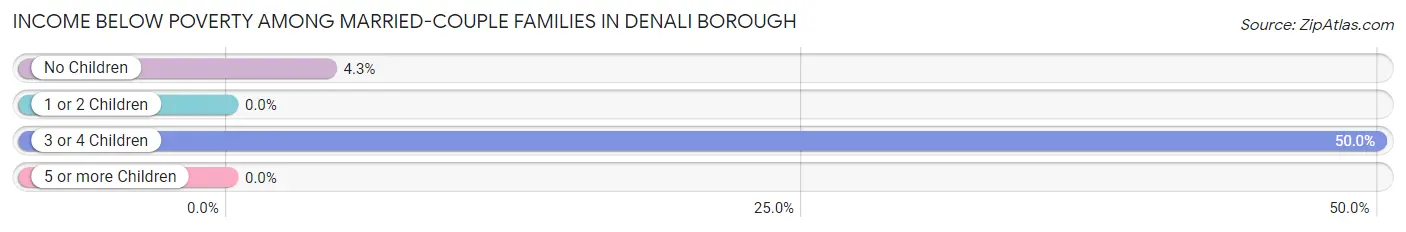
| Children | Above Poverty | Below Poverty |
| No Children | 156 (95.7%) | 7 (4.3%) |
| 1 or 2 Children | 93 (100.0%) | 0 (0.0%) |
| 3 or 4 Children | 1 (50.0%) | 1 (50.0%) |
| 5 or more Children | 10 (100.0%) | 0 (0.0%) |
| Total | 260 (97.0%) | 8 (3.0%) |
Income Below Poverty Among Single-Parent Households in Denali Borough
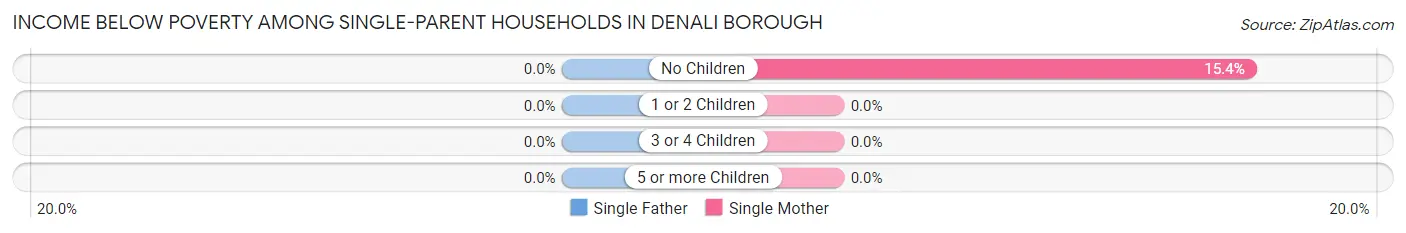
| Children | Single Father | Single Mother |
| No Children | 0 (0.0%) | 2 (15.4%) |
| 1 or 2 Children | 0 (0.0%) | 0 (0.0%) |
| 3 or 4 Children | 0 (0.0%) | 0 (0.0%) |
| 5 or more Children | 0 (0.0%) | 0 (0.0%) |
| Total | 0 (0.0%) | 2 (14.3%) |
Income Below Poverty Among Married-Couple vs Single-Parent Households in Denali Borough
The poverty data for Denali Borough shows that 8 of the married-couple family households (3.0%) and 2 of the single-parent households (5.9%) are living below the poverty level. Within the married-couple family households, those with 3 or 4 children have the highest poverty rate, with 1 households (50.0%) falling below the poverty line. Among the single-parent households, those with no children have the highest poverty rate, with 2 household (7.4%) living below poverty.
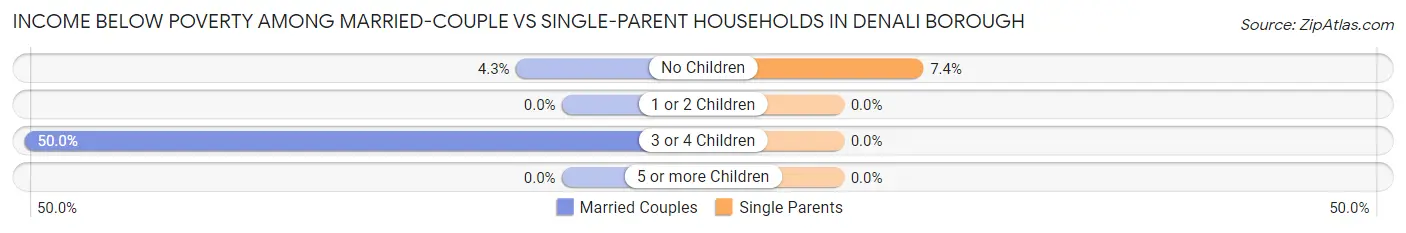
| Children | Married-Couple Families | Single-Parent Households |
| No Children | 7 (4.3%) | 2 (7.4%) |
| 1 or 2 Children | 0 (0.0%) | 0 (0.0%) |
| 3 or 4 Children | 1 (50.0%) | 0 (0.0%) |
| 5 or more Children | 0 (0.0%) | 0 (0.0%) |
| Total | 8 (3.0%) | 2 (5.9%) |
Employment Characteristics in Denali Borough
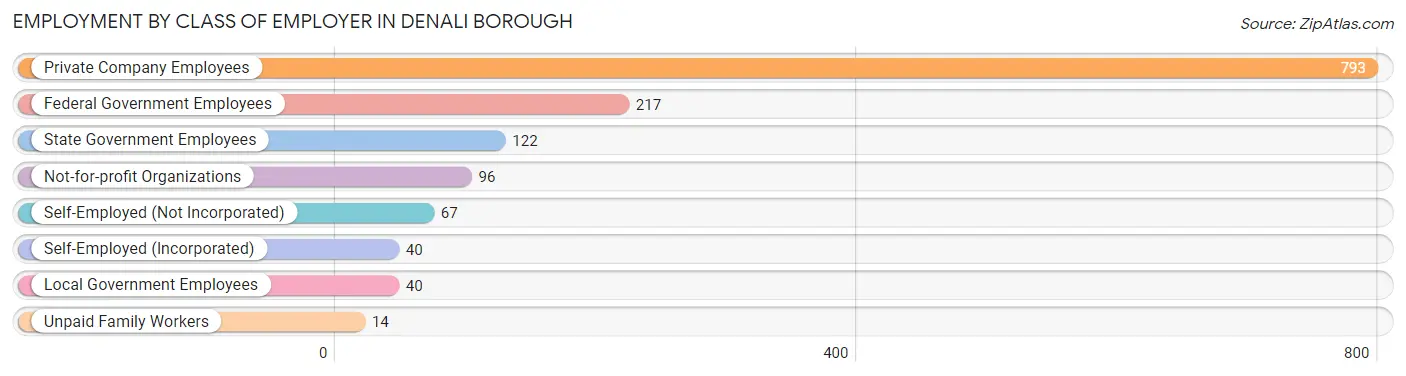
Employment by Class of Employer in Denali Borough
Among the 1,389 employed individuals in Denali Borough, private company employees (793 | 57.1%), federal government employees (217 | 15.6%), and state government employees (122 | 8.8%) make up the most common classes of employment.
| Employer Class | # Employees | % Employees |
| Private Company Employees | 793 | 57.1% |
| Self-Employed (Incorporated) | 40 | 2.9% |
| Self-Employed (Not Incorporated) | 67 | 4.8% |
| Not-for-profit Organizations | 96 | 6.9% |
| Local Government Employees | 40 | 2.9% |
| State Government Employees | 122 | 8.8% |
| Federal Government Employees | 217 | 15.6% |
| Unpaid Family Workers | 14 | 1.0% |
| Total | 1,389 | 100.0% |
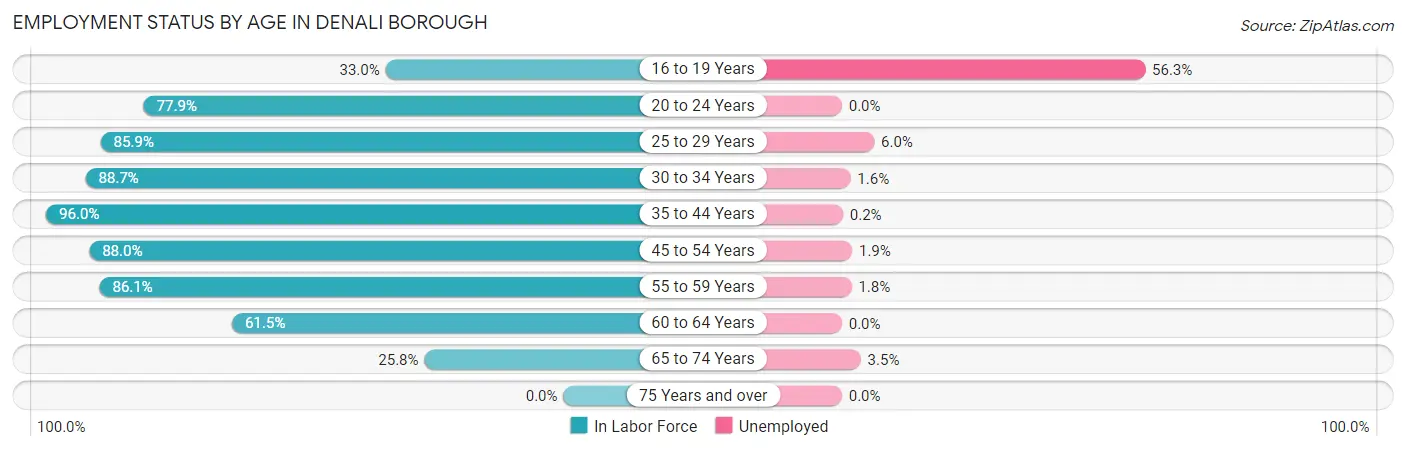
Employment Status by Age in Denali Borough
According to the labor force statistics for Denali Borough, out of the total population over 16 years of age (1,881), 75.4% or 1,418 individuals are in the labor force, with 1.9% or 27 of them unemployed. The age group with the highest labor force participation rate is 35 to 44 years, with 96.0% or 579 individuals in the labor force. Within the labor force, the 16 to 19 years age range has the highest percentage of unemployed individuals, with 56.3% or 17 of them being unemployed.
| Age Bracket | In Labor Force | Unemployed |
| 16 to 19 Years | 31 (33.0%) | 17 (56.3%) |
| 20 to 24 Years | 88 (77.9%) | 0 (0.0%) |
| 25 to 29 Years | 67 (85.9%) | 4 (6.0%) |
| 30 to 34 Years | 133 (88.7%) | 2 (1.6%) |
| 35 to 44 Years | 579 (96.0%) | 1 (0.2%) |
| 45 to 54 Years | 265 (88.0%) | 5 (1.9%) |
| 55 to 59 Years | 167 (86.1%) | 3 (1.8%) |
| 60 to 64 Years | 32 (61.5%) | 0 (0.0%) |
| 65 to 74 Years | 57 (25.8%) | 2 (3.5%) |
| 75 Years and over | 0 (0.0%) | 0 (0.0%) |
| Total | 1,418 (75.4%) | 27 (1.9%) |
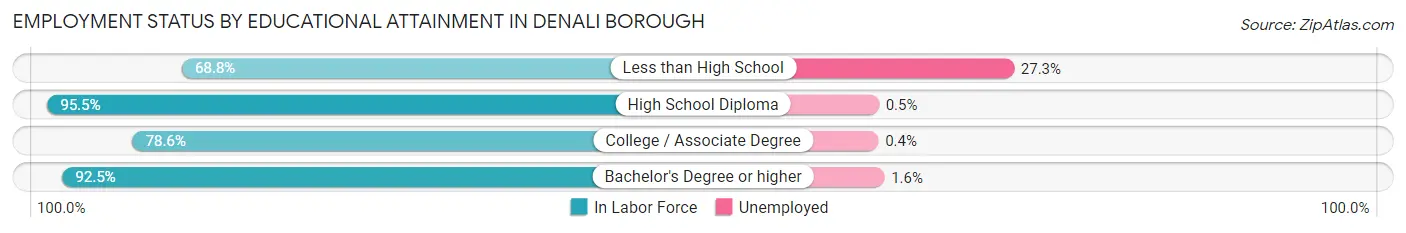
Employment Status by Educational Attainment in Denali Borough
According to labor force statistics for Denali Borough, 90.2% of individuals (1,243) out of the total population between 25 and 64 years of age (1,378) are in the labor force, with 1.2% or 15 of them being unemployed. The group with the highest labor force participation rate are those with the educational attainment of high school diploma, with 95.5% or 659 individuals in the labor force. Within the labor force, individuals with less than high school education have the highest percentage of unemployment, with 27.3% or 6 of them being unemployed.
| Educational Attainment | In Labor Force | Unemployed |
| Less than High School | 22 (68.8%) | 9 (27.3%) |
| High School Diploma | 659 (95.5%) | 3 (0.5%) |
| College / Associate Degree | 253 (78.6%) | 1 (0.4%) |
| Bachelor's Degree or higher | 309 (92.5%) | 5 (1.6%) |
| Total | 1,243 (90.2%) | 17 (1.2%) |
Employment Occupations by Sex in Denali Borough
Management, Business, Science and Arts Occupations
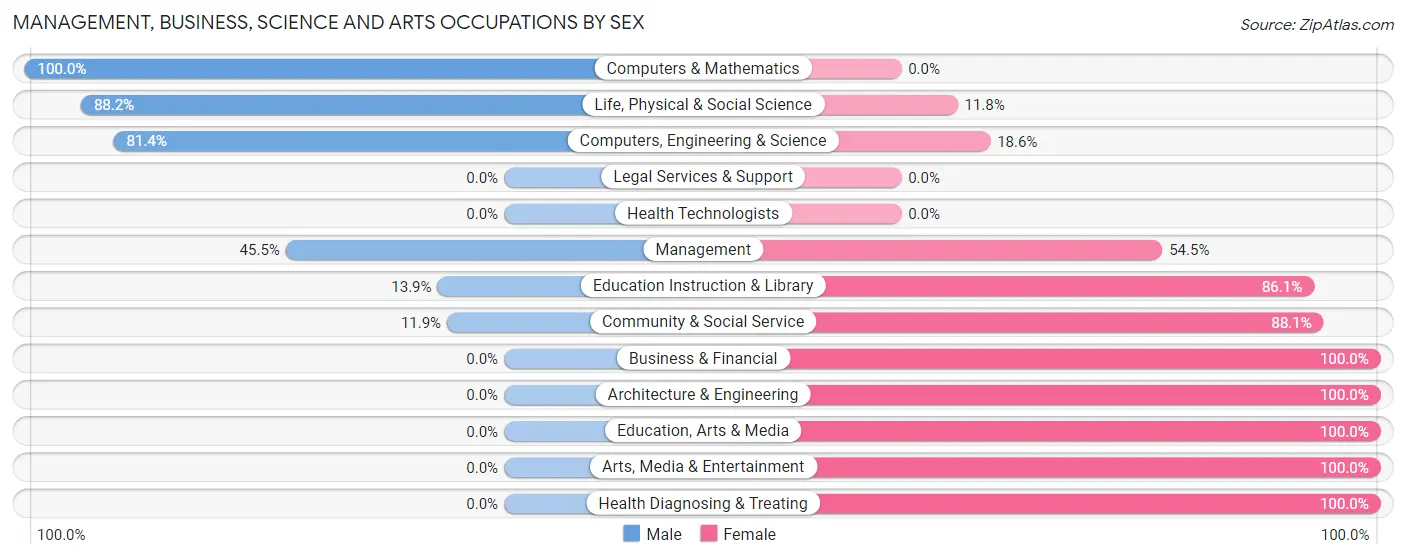
The most common Management, Business, Science and Arts occupations in Denali Borough are Computers, Engineering & Science (140 | 10.4%), Management (101 | 7.5%), Life, Physical & Social Science (85 | 6.3%), Community & Social Service (84 | 6.2%), and Education Instruction & Library (72 | 5.4%).

Management, Business, Science and Arts Occupations by Sex
Within the Management, Business, Science and Arts occupations in Denali Borough, the most male-oriented occupations are Computers & Mathematics (100.0%), Life, Physical & Social Science (88.2%), and Computers, Engineering & Science (81.4%), while the most female-oriented occupations are Business & Financial (100.0%), Architecture & Engineering (100.0%), and Education, Arts & Media (100.0%).
| Occupation | Male | Female |
| Management | 46 (45.5%) | 55 (54.5%) |
| Business & Financial | 0 (0.0%) | 2 (100.0%) |
| Computers, Engineering & Science | 114 (81.4%) | 26 (18.6%) |
| Computers & Mathematics | 39 (100.0%) | 0 (0.0%) |
| Architecture & Engineering | 0 (0.0%) | 16 (100.0%) |
| Life, Physical & Social Science | 75 (88.2%) | 10 (11.8%) |
| Community & Social Service | 10 (11.9%) | 74 (88.1%) |
| Education, Arts & Media | 0 (0.0%) | 8 (100.0%) |
| Legal Services & Support | 0 (0.0%) | 0 (0.0%) |
| Education Instruction & Library | 10 (13.9%) | 62 (86.1%) |
| Arts, Media & Entertainment | 0 (0.0%) | 4 (100.0%) |
| Health Diagnosing & Treating | 0 (0.0%) | 7 (100.0%) |
| Health Technologists | 0 (0.0%) | 0 (0.0%) |
| Total (Category) | 170 (50.9%) | 164 (49.1%) |
| Total (Overall) | 988 (73.5%) | 356 (26.5%) |
Services Occupations
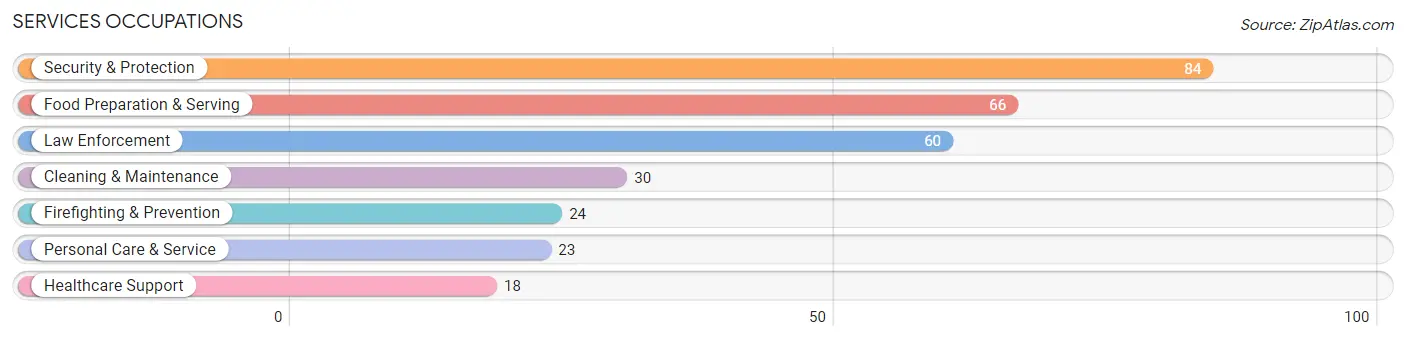
The most common Services occupations in Denali Borough are Security & Protection (84 | 6.2%), Food Preparation & Serving (66 | 4.9%), Law Enforcement (60 | 4.5%), Cleaning & Maintenance (30 | 2.2%), and Firefighting & Prevention (24 | 1.8%).
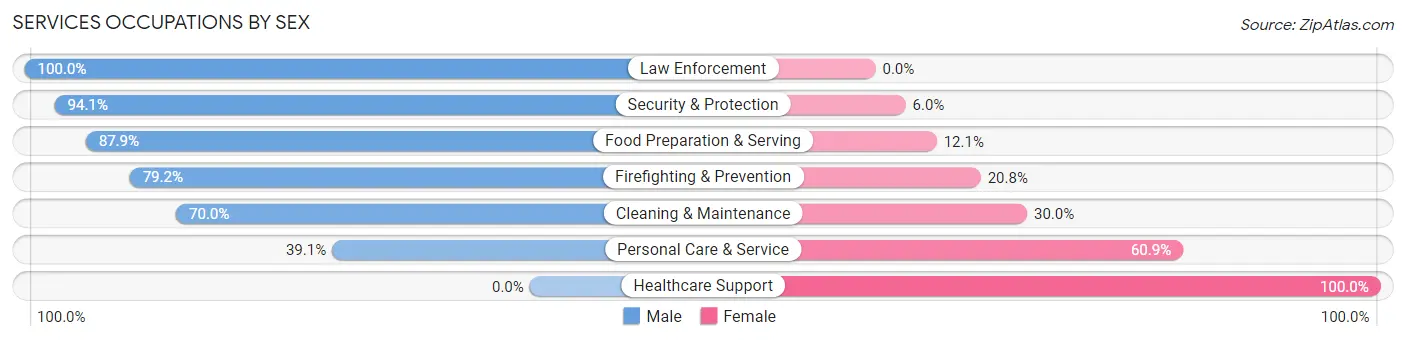
Services Occupations by Sex
Within the Services occupations in Denali Borough, the most male-oriented occupations are Law Enforcement (100.0%), Security & Protection (94.1%), and Food Preparation & Serving (87.9%), while the most female-oriented occupations are Healthcare Support (100.0%), Personal Care & Service (60.9%), and Cleaning & Maintenance (30.0%).
| Occupation | Male | Female |
| Healthcare Support | 0 (0.0%) | 18 (100.0%) |
| Security & Protection | 79 (94.1%) | 5 (5.9%) |
| Firefighting & Prevention | 19 (79.2%) | 5 (20.8%) |
| Law Enforcement | 60 (100.0%) | 0 (0.0%) |
| Food Preparation & Serving | 58 (87.9%) | 8 (12.1%) |
| Cleaning & Maintenance | 21 (70.0%) | 9 (30.0%) |
| Personal Care & Service | 9 (39.1%) | 14 (60.9%) |
| Total (Category) | 167 (75.6%) | 54 (24.4%) |
| Total (Overall) | 988 (73.5%) | 356 (26.5%) |
Sales and Office Occupations
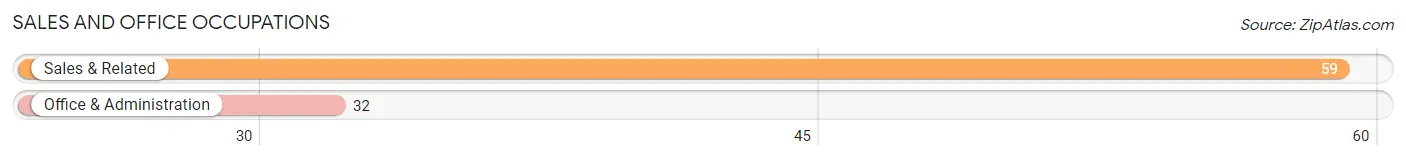
The most common Sales and Office occupations in Denali Borough are Sales & Related (59 | 4.4%), and Office & Administration (32 | 2.4%).
Sales and Office Occupations by Sex
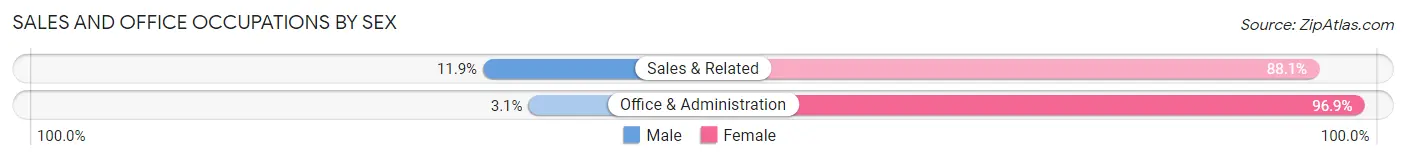
| Occupation | Male | Female |
| Sales & Related | 7 (11.9%) | 52 (88.1%) |
| Office & Administration | 1 (3.1%) | 31 (96.9%) |
| Total (Category) | 8 (8.8%) | 83 (91.2%) |
| Total (Overall) | 988 (73.5%) | 356 (26.5%) |
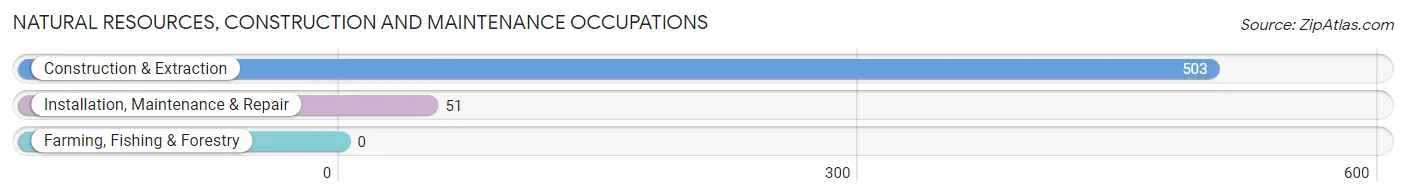
Natural Resources, Construction and Maintenance Occupations
The most common Natural Resources, Construction and Maintenance occupations in Denali Borough are Construction & Extraction (503 | 37.4%), and Installation, Maintenance & Repair (51 | 3.8%).
Natural Resources, Construction and Maintenance Occupations by Sex
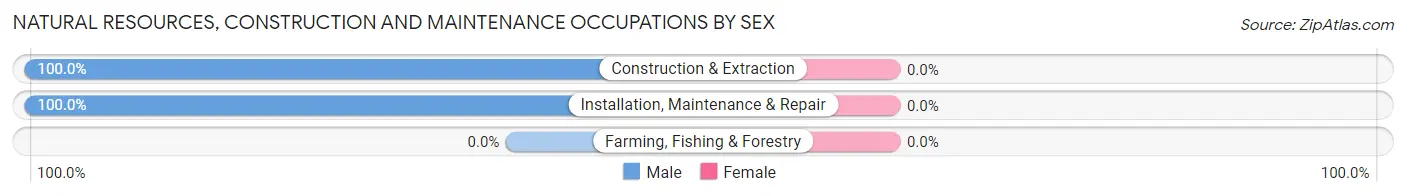
| Occupation | Male | Female |
| Farming, Fishing & Forestry | 0 (0.0%) | 0 (0.0%) |
| Construction & Extraction | 503 (100.0%) | 0 (0.0%) |
| Installation, Maintenance & Repair | 51 (100.0%) | 0 (0.0%) |
| Total (Category) | 554 (100.0%) | 0 (0.0%) |
| Total (Overall) | 988 (73.5%) | 356 (26.5%) |
Production, Transportation and Moving Occupations
The most common Production, Transportation and Moving occupations in Denali Borough are Production (108 | 8.0%), Transportation (28 | 2.1%), and Material Moving (8 | 0.6%).
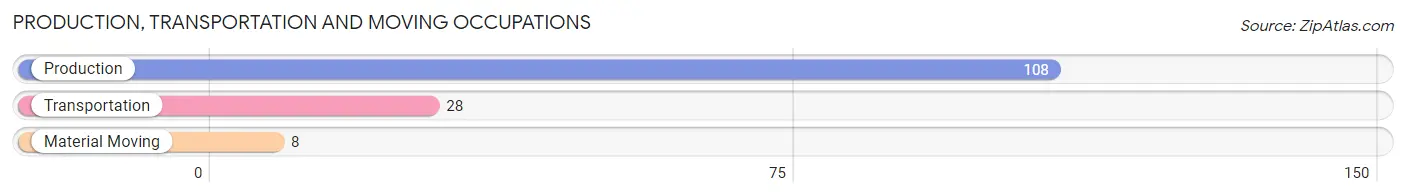
Production, Transportation and Moving Occupations by Sex
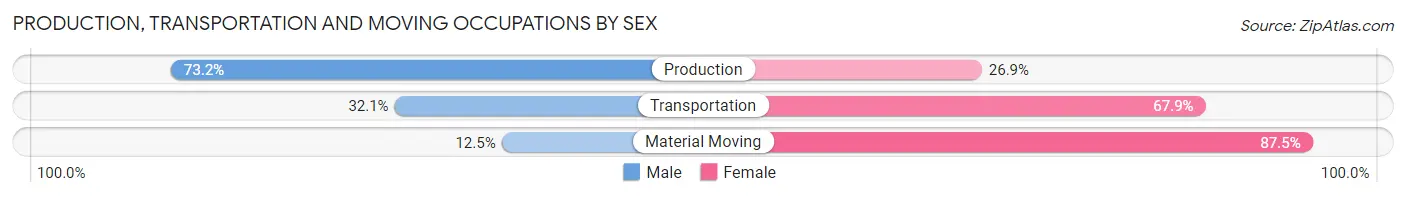
| Occupation | Male | Female |
| Production | 79 (73.2%) | 29 (26.9%) |
| Transportation | 9 (32.1%) | 19 (67.9%) |
| Material Moving | 1 (12.5%) | 7 (87.5%) |
| Total (Category) | 89 (61.8%) | 55 (38.2%) |
| Total (Overall) | 988 (73.5%) | 356 (26.5%) |
Employment Industries by Sex in Denali Borough
Employment Industries in Denali Borough
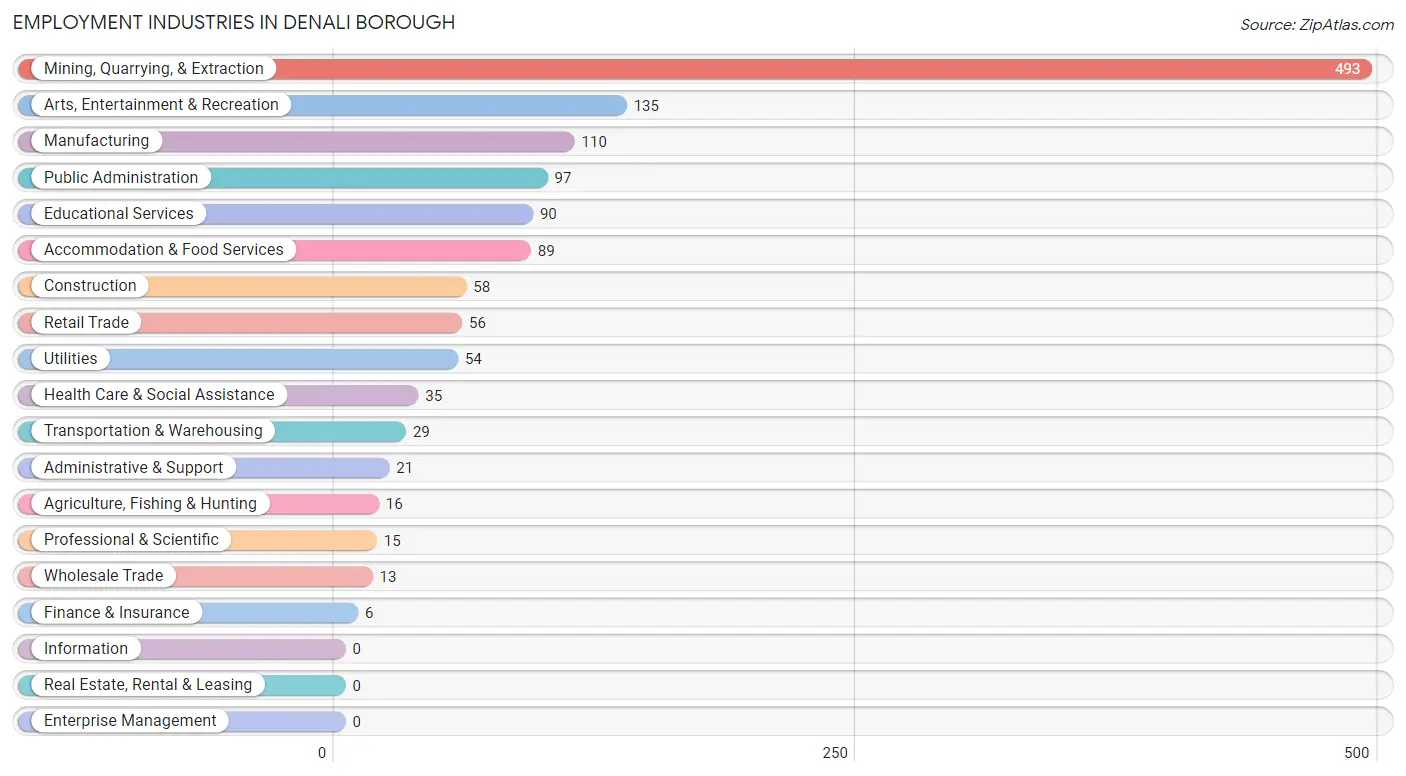
The major employment industries in Denali Borough include Mining, Quarrying, & Extraction (493 | 36.7%), Arts, Entertainment & Recreation (135 | 10.0%), Manufacturing (110 | 8.2%), Public Administration (97 | 7.2%), and Educational Services (90 | 6.7%).
Employment Industries by Sex in Denali Borough
The Denali Borough industries that see more men than women are Agriculture, Fishing & Hunting (100.0%), Utilities (100.0%), and Mining, Quarrying, & Extraction (95.7%), whereas the industries that tend to have a higher number of women are Finance & Insurance (100.0%), Professional & Scientific (100.0%), and Administrative & Support (100.0%).
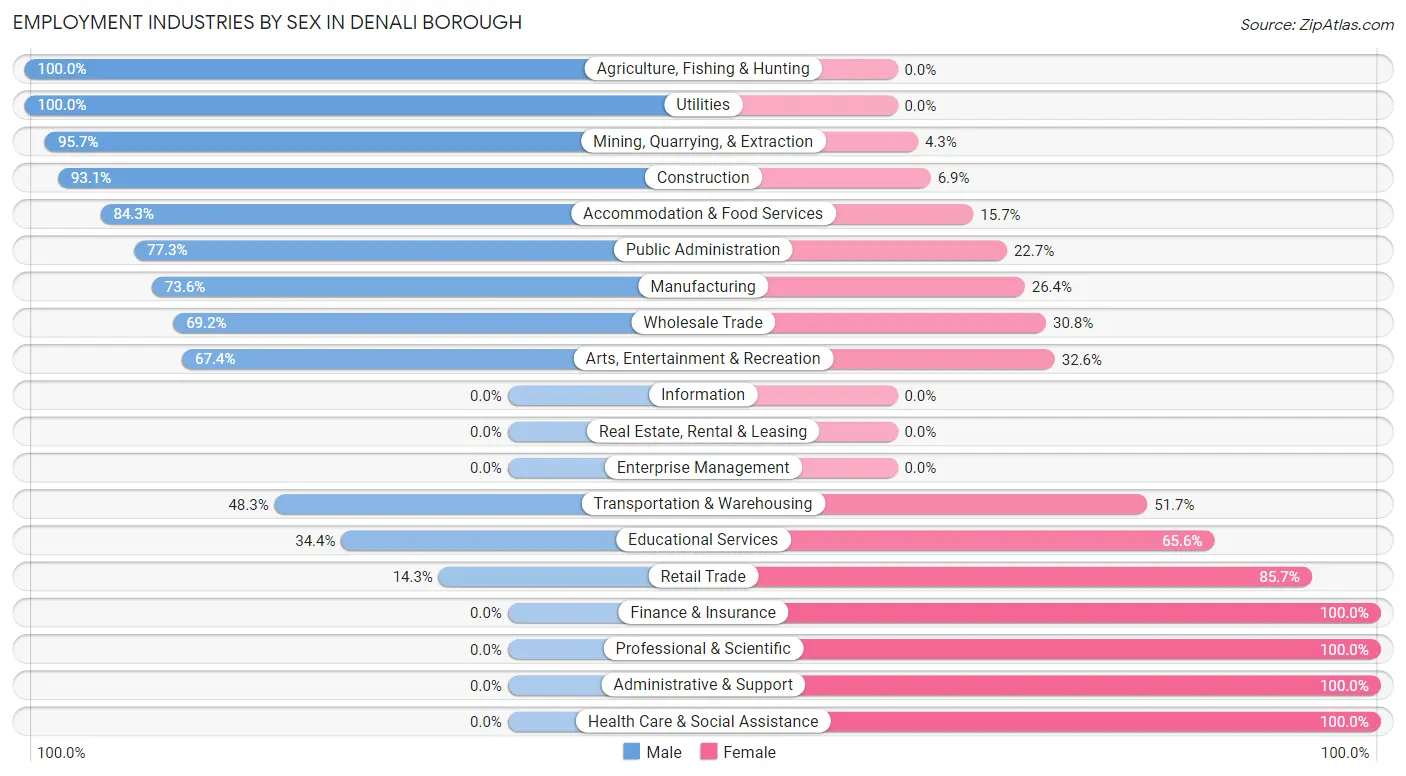
| Industry | Male | Female |
| Agriculture, Fishing & Hunting | 16 (100.0%) | 0 (0.0%) |
| Mining, Quarrying, & Extraction | 472 (95.7%) | 21 (4.3%) |
| Construction | 54 (93.1%) | 4 (6.9%) |
| Manufacturing | 81 (73.6%) | 29 (26.4%) |
| Wholesale Trade | 9 (69.2%) | 4 (30.8%) |
| Retail Trade | 8 (14.3%) | 48 (85.7%) |
| Transportation & Warehousing | 14 (48.3%) | 15 (51.7%) |
| Utilities | 54 (100.0%) | 0 (0.0%) |
| Information | 0 (0.0%) | 0 (0.0%) |
| Finance & Insurance | 0 (0.0%) | 6 (100.0%) |
| Real Estate, Rental & Leasing | 0 (0.0%) | 0 (0.0%) |
| Professional & Scientific | 0 (0.0%) | 15 (100.0%) |
| Enterprise Management | 0 (0.0%) | 0 (0.0%) |
| Administrative & Support | 0 (0.0%) | 21 (100.0%) |
| Educational Services | 31 (34.4%) | 59 (65.6%) |
| Health Care & Social Assistance | 0 (0.0%) | 35 (100.0%) |
| Arts, Entertainment & Recreation | 91 (67.4%) | 44 (32.6%) |
| Accommodation & Food Services | 75 (84.3%) | 14 (15.7%) |
| Public Administration | 75 (77.3%) | 22 (22.7%) |
| Total | 988 (73.5%) | 356 (26.5%) |
Education in Denali Borough
School Enrollment in Denali Borough
The most common levels of schooling among the 334 students in Denali Borough are high school (100 | 29.9%), college / undergraduate (99 | 29.6%), and middle school (49 | 14.7%).
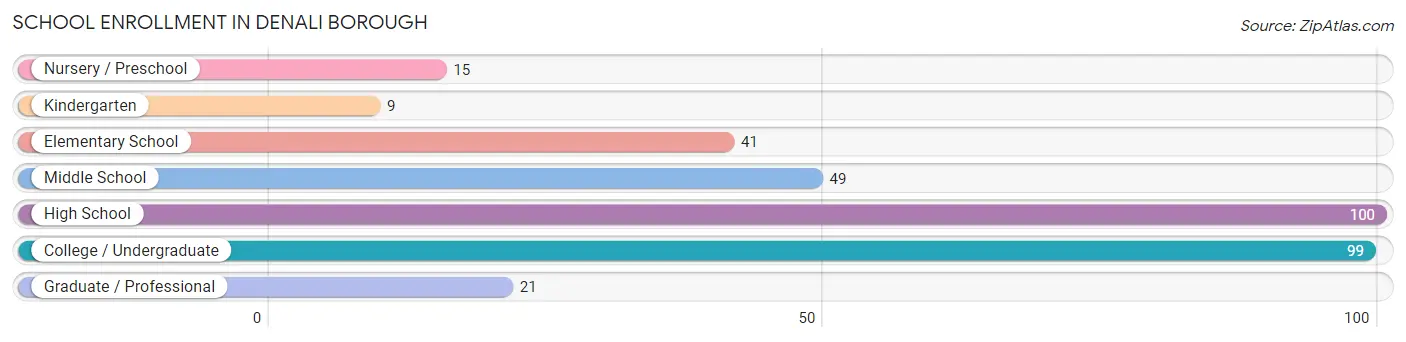
| School Level | # Students | % Students |
| Nursery / Preschool | 15 | 4.5% |
| Kindergarten | 9 | 2.7% |
| Elementary School | 41 | 12.3% |
| Middle School | 49 | 14.7% |
| High School | 100 | 29.9% |
| College / Undergraduate | 99 | 29.6% |
| Graduate / Professional | 21 | 6.3% |
| Total | 334 | 100.0% |
School Enrollment by Age by Funding Source in Denali Borough
Out of a total of 334 students who are enrolled in schools in Denali Borough, 63 (18.9%) attend a private institution, while the remaining 271 (81.1%) are enrolled in public schools. The age group of 3 to 4 year olds has the highest likelihood of being enrolled in private schools, with 15 (100.0% in the age bracket) enrolled. Conversely, the age group of 18 to 19 year olds has the lowest likelihood of being enrolled in a private school, with 24 (100.0% in the age bracket) attending a public institution.
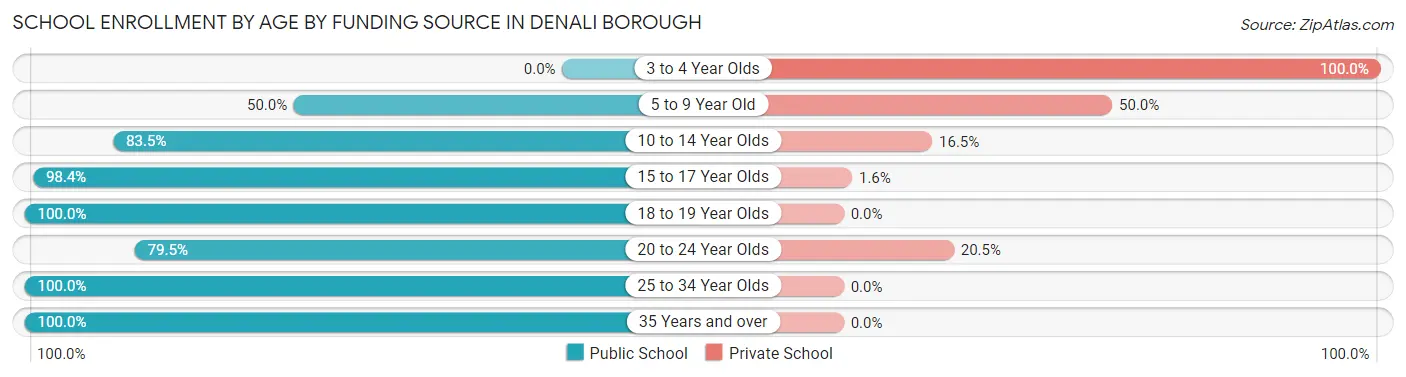
| Age Bracket | Public School | Private School |
| 3 to 4 Year Olds | 0 (0.0%) | 15 (100.0%) |
| 5 to 9 Year Old | 25 (50.0%) | 25 (50.0%) |
| 10 to 14 Year Olds | 71 (83.5%) | 14 (16.5%) |
| 15 to 17 Year Olds | 63 (98.4%) | 1 (1.6%) |
| 18 to 19 Year Olds | 24 (100.0%) | 0 (0.0%) |
| 20 to 24 Year Olds | 31 (79.5%) | 8 (20.5%) |
| 25 to 34 Year Olds | 31 (100.0%) | 0 (0.0%) |
| 35 Years and over | 26 (100.0%) | 0 (0.0%) |
| Total | 271 (81.1%) | 63 (18.9%) |
Educational Attainment by Field of Study in Denali Borough
Social sciences (86 | 19.2%), education (80 | 17.9%), bio, nature & agricultural (73 | 16.3%), arts & humanities (39 | 8.7%), and engineering (31 | 6.9%) are the most common fields of study among 448 individuals in Denali Borough who have obtained a bachelor's degree or higher.
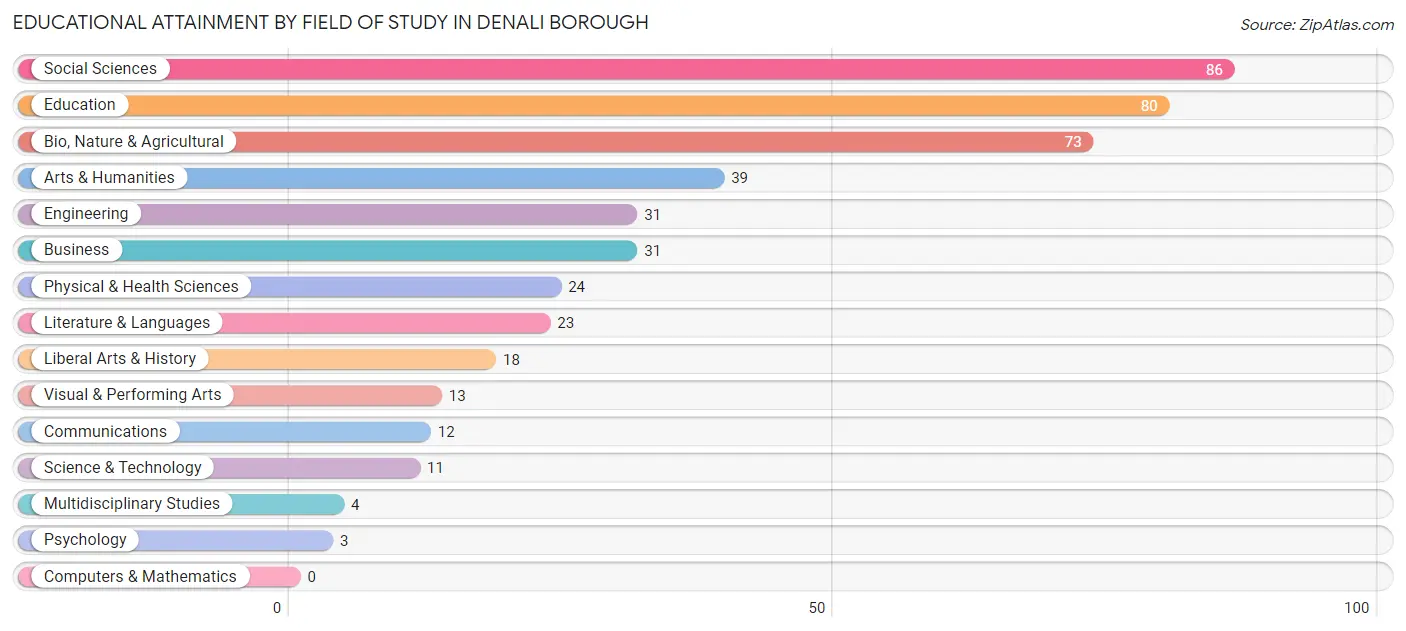
| Field of Study | # Graduates | % Graduates |
| Computers & Mathematics | 0 | 0.0% |
| Bio, Nature & Agricultural | 73 | 16.3% |
| Physical & Health Sciences | 24 | 5.4% |
| Psychology | 3 | 0.7% |
| Social Sciences | 86 | 19.2% |
| Engineering | 31 | 6.9% |
| Multidisciplinary Studies | 4 | 0.9% |
| Science & Technology | 11 | 2.5% |
| Business | 31 | 6.9% |
| Education | 80 | 17.9% |
| Literature & Languages | 23 | 5.1% |
| Liberal Arts & History | 18 | 4.0% |
| Visual & Performing Arts | 13 | 2.9% |
| Communications | 12 | 2.7% |
| Arts & Humanities | 39 | 8.7% |
| Total | 448 | 100.0% |
Transportation & Commute in Denali Borough
Vehicle Availability by Sex in Denali Borough
The most prevalent vehicle ownership categories in Denali Borough are males with 2 vehicles (80, accounting for 33.5%) and females with 2 vehicles (89, making up 31.2%).
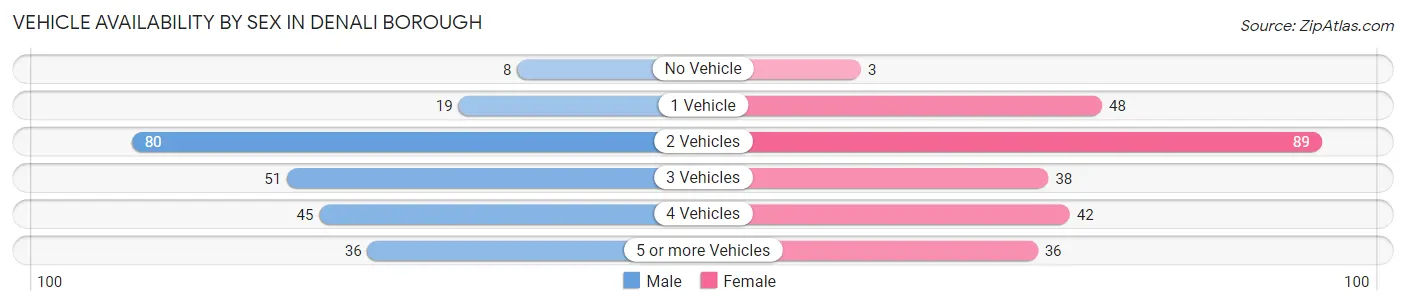
| Vehicles Available | Male | Female |
| No Vehicle | 8 (3.4%) | 3 (1.2%) |
| 1 Vehicle | 19 (8.0%) | 48 (18.8%) |
| 2 Vehicles | 80 (33.5%) | 89 (34.8%) |
| 3 Vehicles | 51 (21.3%) | 38 (14.8%) |
| 4 Vehicles | 45 (18.8%) | 42 (16.4%) |
| 5 or more Vehicles | 36 (15.1%) | 36 (14.1%) |
| Total | 239 (100.0%) | 256 (100.0%) |
Commute Time in Denali Borough
The most frequently occuring commute durations in Denali Borough are 5 to 9 minutes (492 commuters, 37.0%), 20 to 24 minutes (400 commuters, 30.0%), and 10 to 14 minutes (155 commuters, 11.7%).
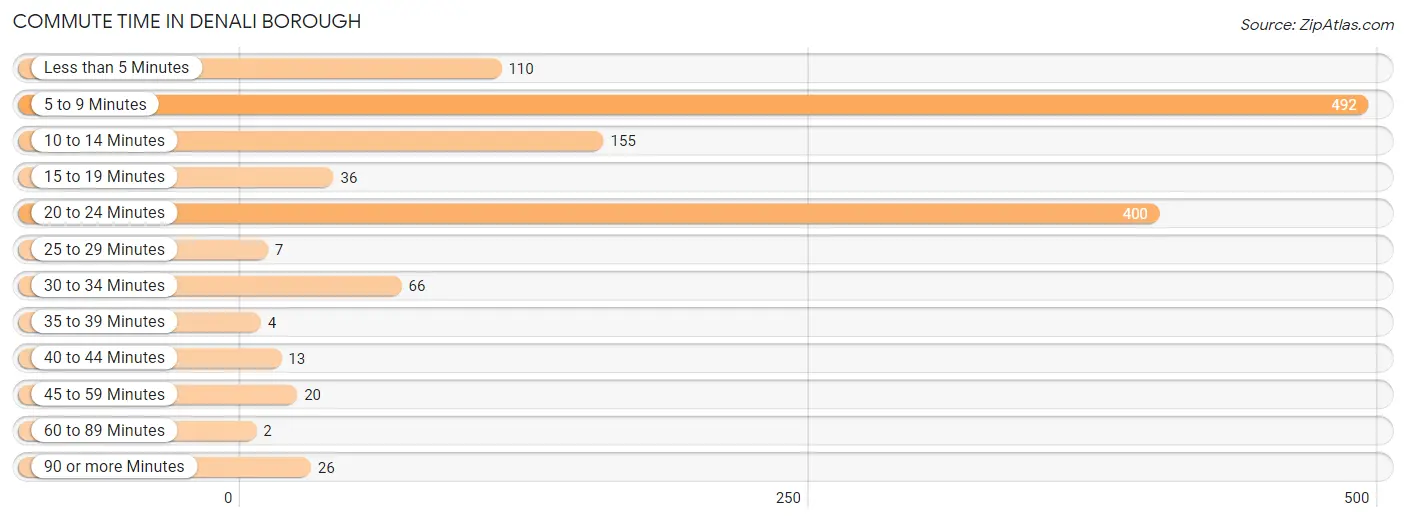
| Commute Time | # Commuters | % Commuters |
| Less than 5 Minutes | 110 | 8.3% |
| 5 to 9 Minutes | 492 | 37.0% |
| 10 to 14 Minutes | 155 | 11.7% |
| 15 to 19 Minutes | 36 | 2.7% |
| 20 to 24 Minutes | 400 | 30.0% |
| 25 to 29 Minutes | 7 | 0.5% |
| 30 to 34 Minutes | 66 | 5.0% |
| 35 to 39 Minutes | 4 | 0.3% |
| 40 to 44 Minutes | 13 | 1.0% |
| 45 to 59 Minutes | 20 | 1.5% |
| 60 to 89 Minutes | 2 | 0.2% |
| 90 or more Minutes | 26 | 1.9% |
Commute Time by Sex in Denali Borough
The most common commute times in Denali Borough are 20 to 24 minutes (383 commuters, 38.1%) for males and 5 to 9 minutes (124 commuters, 38.2%) for females.
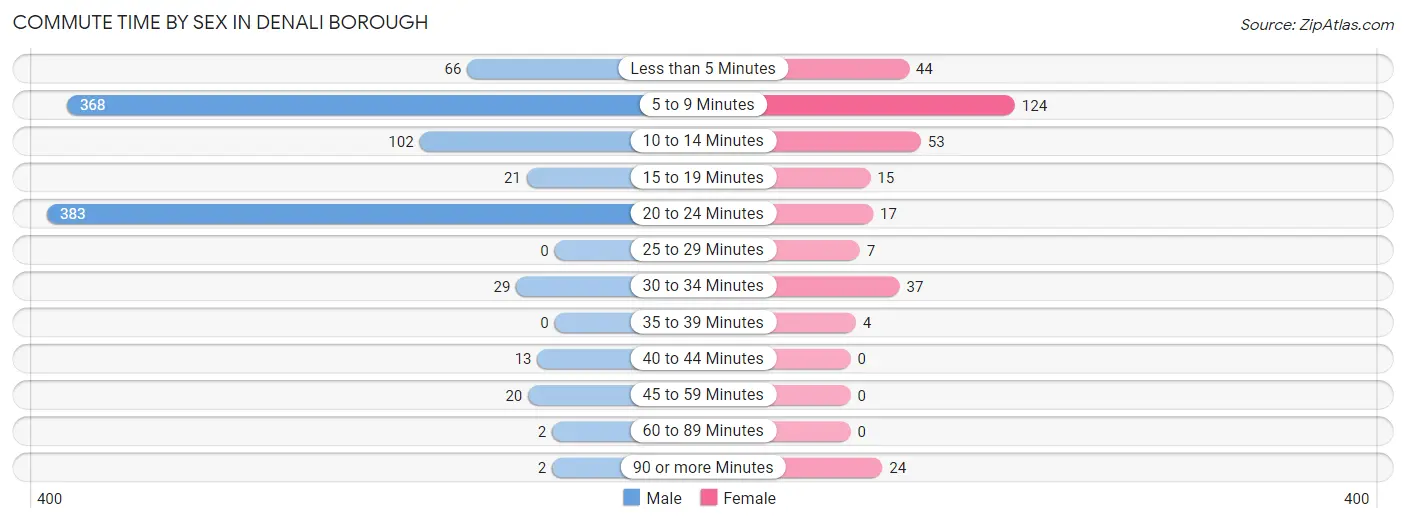
| Commute Time | Male | Female |
| Less than 5 Minutes | 66 (6.6%) | 44 (13.5%) |
| 5 to 9 Minutes | 368 (36.6%) | 124 (38.2%) |
| 10 to 14 Minutes | 102 (10.1%) | 53 (16.3%) |
| 15 to 19 Minutes | 21 (2.1%) | 15 (4.6%) |
| 20 to 24 Minutes | 383 (38.1%) | 17 (5.2%) |
| 25 to 29 Minutes | 0 (0.0%) | 7 (2.1%) |
| 30 to 34 Minutes | 29 (2.9%) | 37 (11.4%) |
| 35 to 39 Minutes | 0 (0.0%) | 4 (1.2%) |
| 40 to 44 Minutes | 13 (1.3%) | 0 (0.0%) |
| 45 to 59 Minutes | 20 (2.0%) | 0 (0.0%) |
| 60 to 89 Minutes | 2 (0.2%) | 0 (0.0%) |
| 90 or more Minutes | 2 (0.2%) | 24 (7.4%) |
Time of Departure to Work by Sex in Denali Borough
The most frequent times of departure to work in Denali Borough are 5:00 AM to 5:29 AM (450, 44.7%) for males and 8:00 AM to 8:29 AM (60, 18.5%) for females.
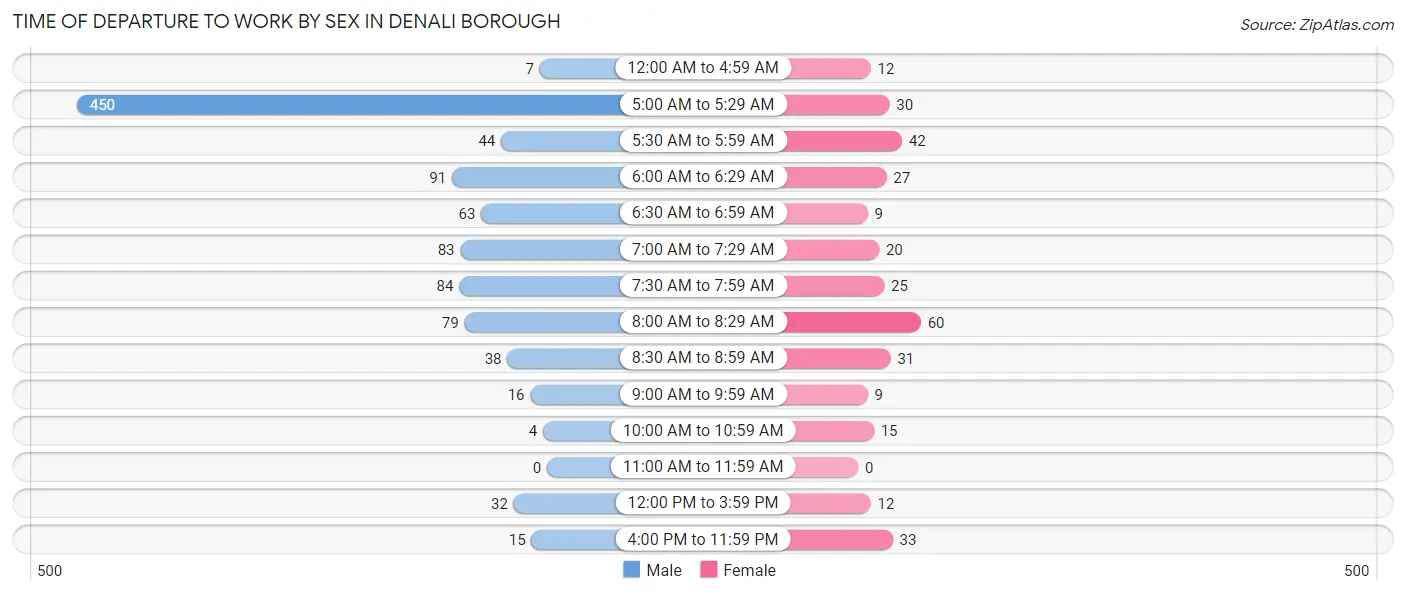
| Time of Departure | Male | Female |
| 12:00 AM to 4:59 AM | 7 (0.7%) | 12 (3.7%) |
| 5:00 AM to 5:29 AM | 450 (44.7%) | 30 (9.2%) |
| 5:30 AM to 5:59 AM | 44 (4.4%) | 42 (12.9%) |
| 6:00 AM to 6:29 AM | 91 (9.0%) | 27 (8.3%) |
| 6:30 AM to 6:59 AM | 63 (6.3%) | 9 (2.8%) |
| 7:00 AM to 7:29 AM | 83 (8.3%) | 20 (6.1%) |
| 7:30 AM to 7:59 AM | 84 (8.4%) | 25 (7.7%) |
| 8:00 AM to 8:29 AM | 79 (7.9%) | 60 (18.5%) |
| 8:30 AM to 8:59 AM | 38 (3.8%) | 31 (9.5%) |
| 9:00 AM to 9:59 AM | 16 (1.6%) | 9 (2.8%) |
| 10:00 AM to 10:59 AM | 4 (0.4%) | 15 (4.6%) |
| 11:00 AM to 11:59 AM | 0 (0.0%) | 0 (0.0%) |
| 12:00 PM to 3:59 PM | 32 (3.2%) | 12 (3.7%) |
| 4:00 PM to 11:59 PM | 15 (1.5%) | 33 (10.2%) |
| Total | 1,006 (100.0%) | 325 (100.0%) |
Housing Occupancy in Denali Borough
Occupancy by Ownership in Denali Borough
Of the total 525 dwellings in Denali Borough, owner-occupied units account for 456 (86.9%), while renter-occupied units make up 69 (13.1%).
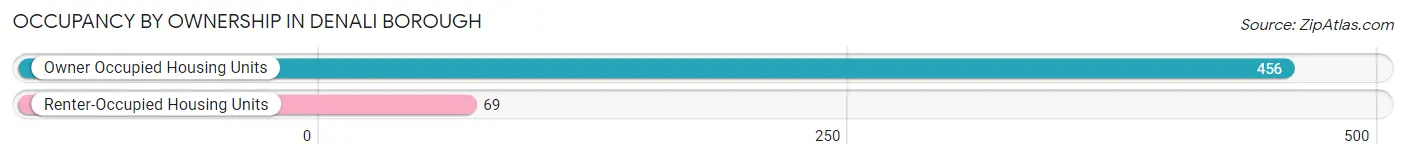
| Occupancy | # Housing Units | % Housing Units |
| Owner Occupied Housing Units | 456 | 86.9% |
| Renter-Occupied Housing Units | 69 | 13.1% |
| Total Occupied Housing Units | 525 | 100.0% |
Occupancy by Household Size in Denali Borough
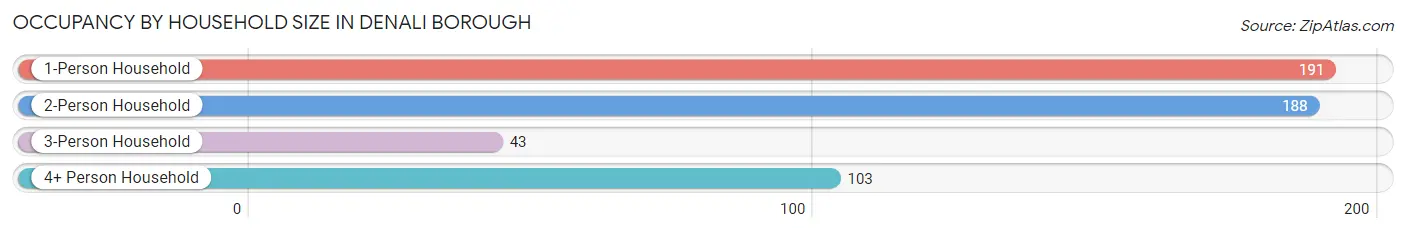
| Household Size | # Housing Units | % Housing Units |
| 1-Person Household | 191 | 36.4% |
| 2-Person Household | 188 | 35.8% |
| 3-Person Household | 43 | 8.2% |
| 4+ Person Household | 103 | 19.6% |
| Total Housing Units | 525 | 100.0% |
Occupancy by Ownership by Household Size in Denali Borough
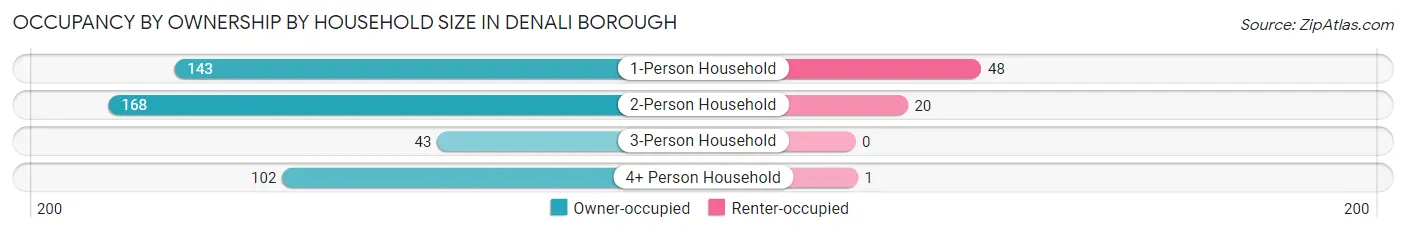
| Household Size | Owner-occupied | Renter-occupied |
| 1-Person Household | 143 (74.9%) | 48 (25.1%) |
| 2-Person Household | 168 (89.4%) | 20 (10.6%) |
| 3-Person Household | 43 (100.0%) | 0 (0.0%) |
| 4+ Person Household | 102 (99.0%) | 1 (1.0%) |
| Total Housing Units | 456 (86.9%) | 69 (13.1%) |
Occupancy by Educational Attainment in Denali Borough
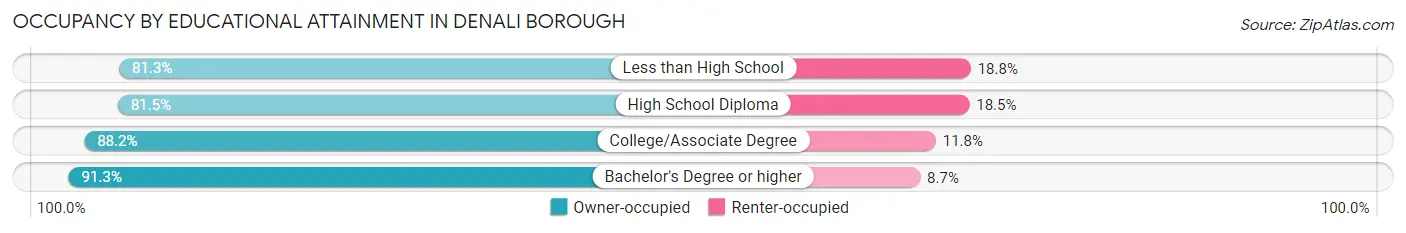
| Household Size | Owner-occupied | Renter-occupied |
| Less than High School | 13 (81.2%) | 3 (18.8%) |
| High School Diploma | 128 (81.5%) | 29 (18.5%) |
| College/Associate Degree | 179 (88.2%) | 24 (11.8%) |
| Bachelor's Degree or higher | 136 (91.3%) | 13 (8.7%) |
Occupancy by Age of Householder in Denali Borough
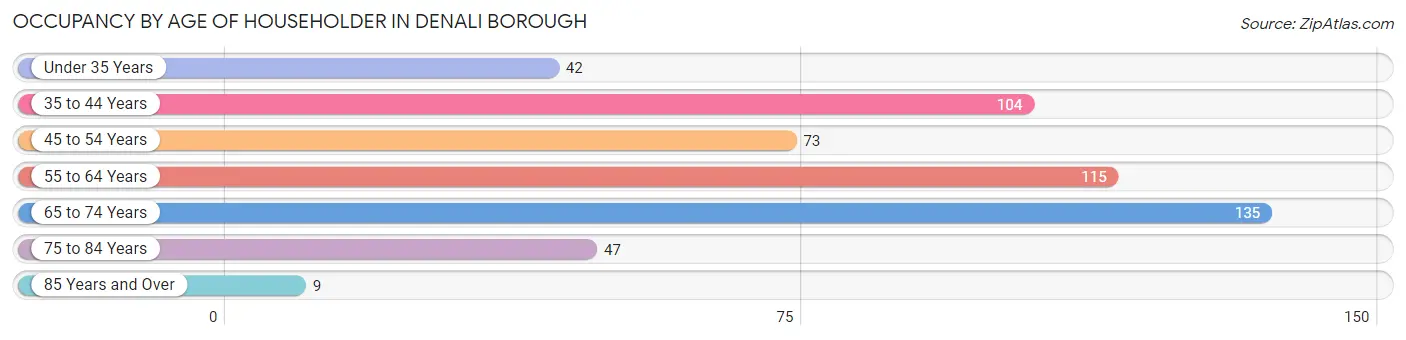
| Age Bracket | # Households | % Households |
| Under 35 Years | 42 | 8.0% |
| 35 to 44 Years | 104 | 19.8% |
| 45 to 54 Years | 73 | 13.9% |
| 55 to 64 Years | 115 | 21.9% |
| 65 to 74 Years | 135 | 25.7% |
| 75 to 84 Years | 47 | 8.9% |
| 85 Years and Over | 9 | 1.7% |
| Total | 525 | 100.0% |
Housing Finances in Denali Borough
Median Income by Occupancy in Denali Borough
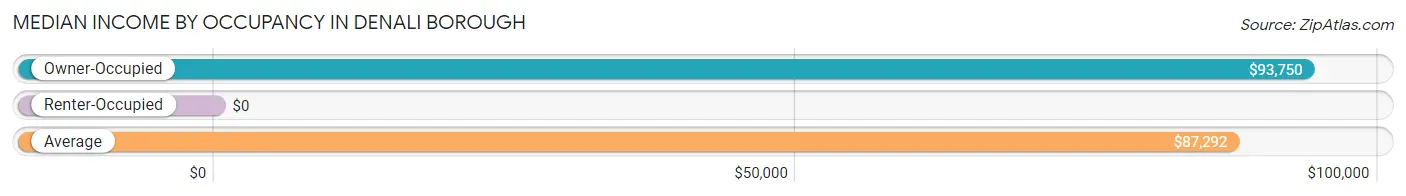
| Occupancy Type | # Households | Median Income |
| Owner-Occupied | 456 (86.9%) | $93,750 |
| Renter-Occupied | 69 (13.1%) | $0 |
| Average | 525 (100.0%) | $87,292 |
Occupancy by Householder Income Bracket in Denali Borough
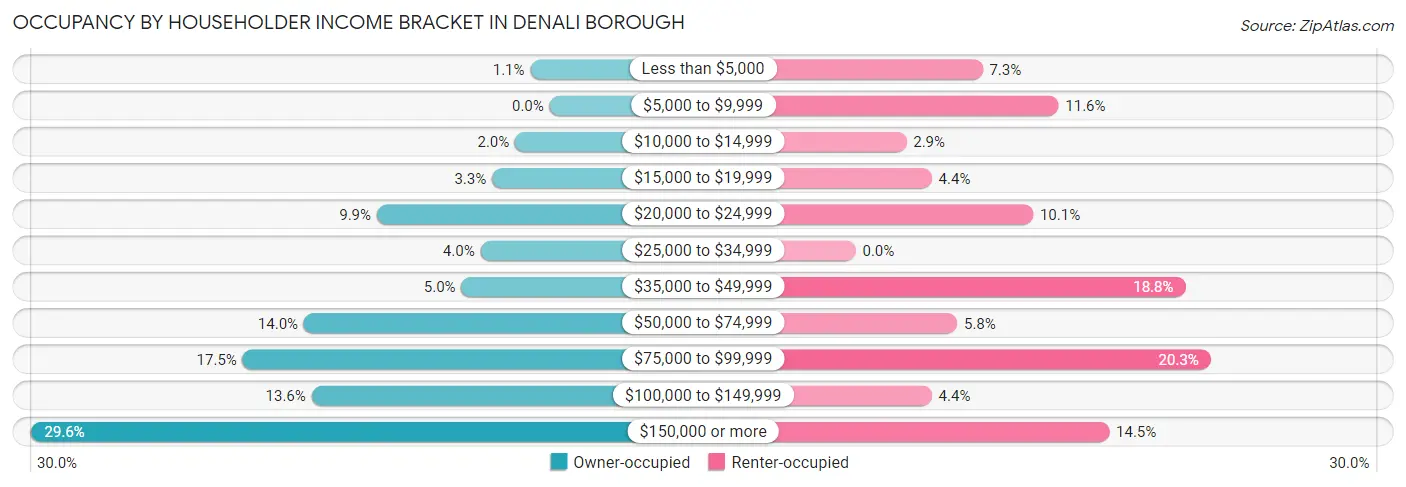
| Income Bracket | Owner-occupied | Renter-occupied |
| Less than $5,000 | 5 (1.1%) | 5 (7.2%) |
| $5,000 to $9,999 | 0 (0.0%) | 8 (11.6%) |
| $10,000 to $14,999 | 9 (2.0%) | 2 (2.9%) |
| $15,000 to $19,999 | 15 (3.3%) | 3 (4.3%) |
| $20,000 to $24,999 | 45 (9.9%) | 7 (10.1%) |
| $25,000 to $34,999 | 18 (4.0%) | 0 (0.0%) |
| $35,000 to $49,999 | 23 (5.0%) | 13 (18.8%) |
| $50,000 to $74,999 | 64 (14.0%) | 4 (5.8%) |
| $75,000 to $99,999 | 80 (17.5%) | 14 (20.3%) |
| $100,000 to $149,999 | 62 (13.6%) | 3 (4.3%) |
| $150,000 or more | 135 (29.6%) | 10 (14.5%) |
| Total | 456 (100.0%) | 69 (100.0%) |
Monthly Housing Cost Tiers in Denali Borough
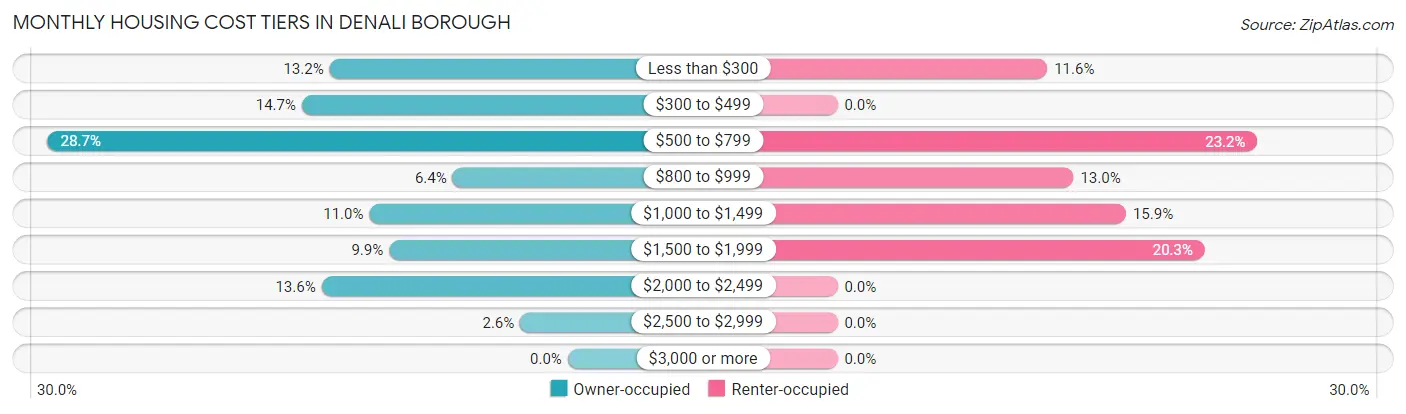
| Monthly Cost | Owner-occupied | Renter-occupied |
| Less than $300 | 60 (13.2%) | 8 (11.6%) |
| $300 to $499 | 67 (14.7%) | 0 (0.0%) |
| $500 to $799 | 131 (28.7%) | 16 (23.2%) |
| $800 to $999 | 29 (6.4%) | 9 (13.0%) |
| $1,000 to $1,499 | 50 (11.0%) | 11 (15.9%) |
| $1,500 to $1,999 | 45 (9.9%) | 14 (20.3%) |
| $2,000 to $2,499 | 62 (13.6%) | 0 (0.0%) |
| $2,500 to $2,999 | 12 (2.6%) | 0 (0.0%) |
| $3,000 or more | 0 (0.0%) | 0 (0.0%) |
| Total | 456 (100.0%) | 69 (100.0%) |
Physical Housing Characteristics in Denali Borough
Housing Structures in Denali Borough
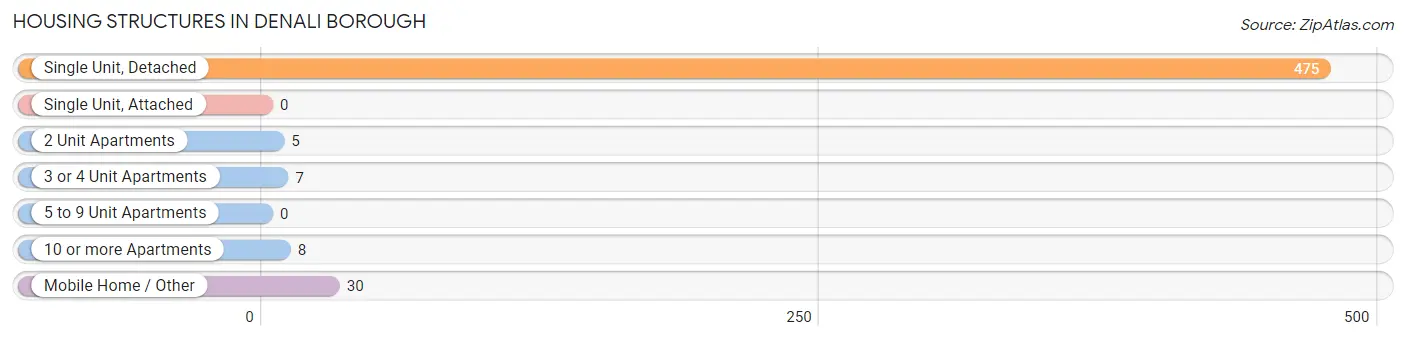
| Structure Type | # Housing Units | % Housing Units |
| Single Unit, Detached | 475 | 90.5% |
| Single Unit, Attached | 0 | 0.0% |
| 2 Unit Apartments | 5 | 0.9% |
| 3 or 4 Unit Apartments | 7 | 1.3% |
| 5 to 9 Unit Apartments | 0 | 0.0% |
| 10 or more Apartments | 8 | 1.5% |
| Mobile Home / Other | 30 | 5.7% |
| Total | 525 | 100.0% |
Housing Structures by Occupancy in Denali Borough
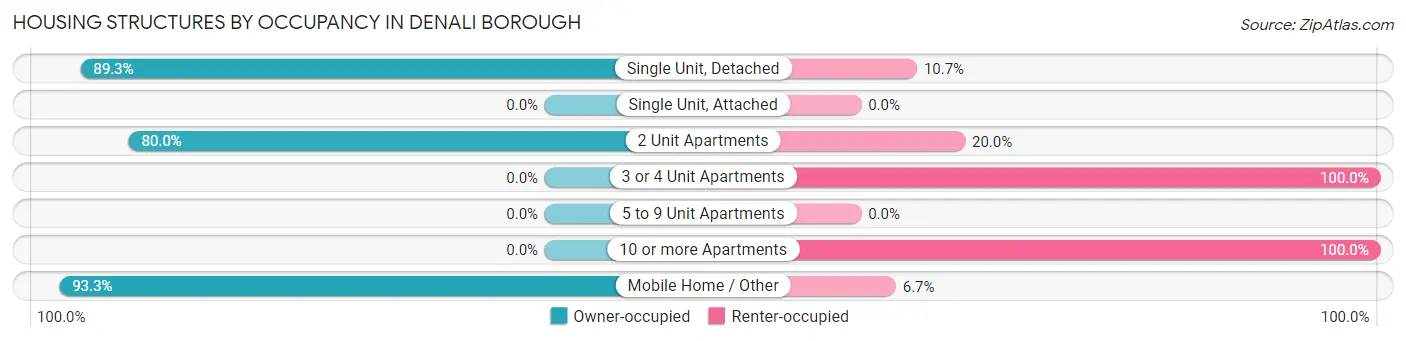
| Structure Type | Owner-occupied | Renter-occupied |
| Single Unit, Detached | 424 (89.3%) | 51 (10.7%) |
| Single Unit, Attached | 0 (0.0%) | 0 (0.0%) |
| 2 Unit Apartments | 4 (80.0%) | 1 (20.0%) |
| 3 or 4 Unit Apartments | 0 (0.0%) | 7 (100.0%) |
| 5 to 9 Unit Apartments | 0 (0.0%) | 0 (0.0%) |
| 10 or more Apartments | 0 (0.0%) | 8 (100.0%) |
| Mobile Home / Other | 28 (93.3%) | 2 (6.7%) |
| Total | 456 (86.9%) | 69 (13.1%) |
Housing Structures by Number of Rooms in Denali Borough
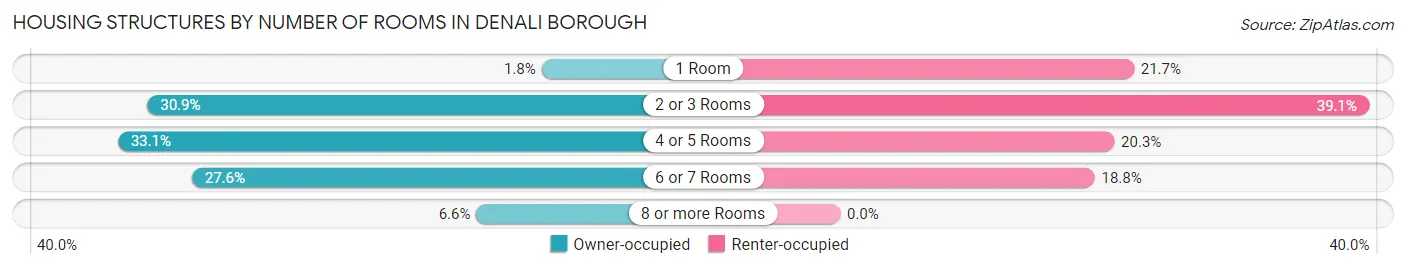
| Number of Rooms | Owner-occupied | Renter-occupied |
| 1 Room | 8 (1.8%) | 15 (21.7%) |
| 2 or 3 Rooms | 141 (30.9%) | 27 (39.1%) |
| 4 or 5 Rooms | 151 (33.1%) | 14 (20.3%) |
| 6 or 7 Rooms | 126 (27.6%) | 13 (18.8%) |
| 8 or more Rooms | 30 (6.6%) | 0 (0.0%) |
| Total | 456 (100.0%) | 69 (100.0%) |
Housing Structure by Heating Type in Denali Borough
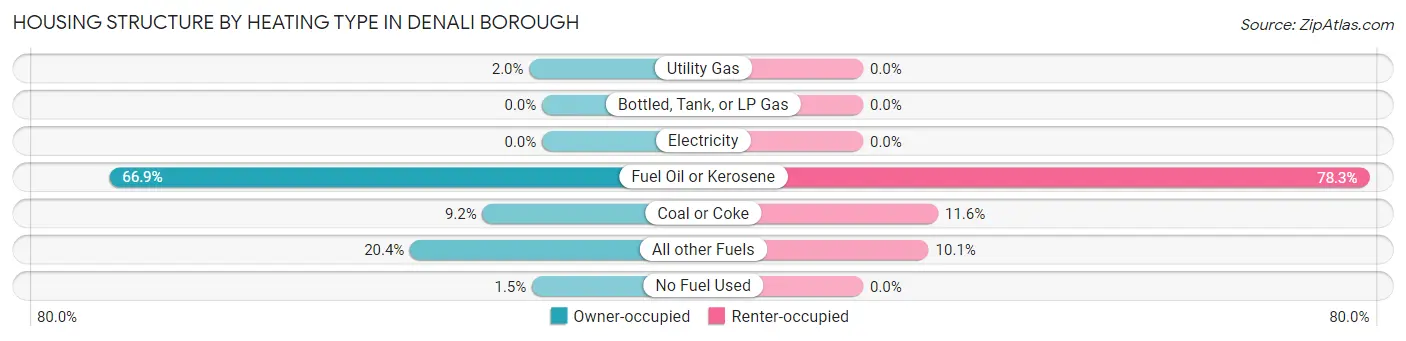
| Heating Type | Owner-occupied | Renter-occupied |
| Utility Gas | 9 (2.0%) | 0 (0.0%) |
| Bottled, Tank, or LP Gas | 0 (0.0%) | 0 (0.0%) |
| Electricity | 0 (0.0%) | 0 (0.0%) |
| Fuel Oil or Kerosene | 305 (66.9%) | 54 (78.3%) |
| Coal or Coke | 42 (9.2%) | 8 (11.6%) |
| All other Fuels | 93 (20.4%) | 7 (10.1%) |
| No Fuel Used | 7 (1.5%) | 0 (0.0%) |
| Total | 456 (100.0%) | 69 (100.0%) |
Household Vehicle Usage in Denali Borough
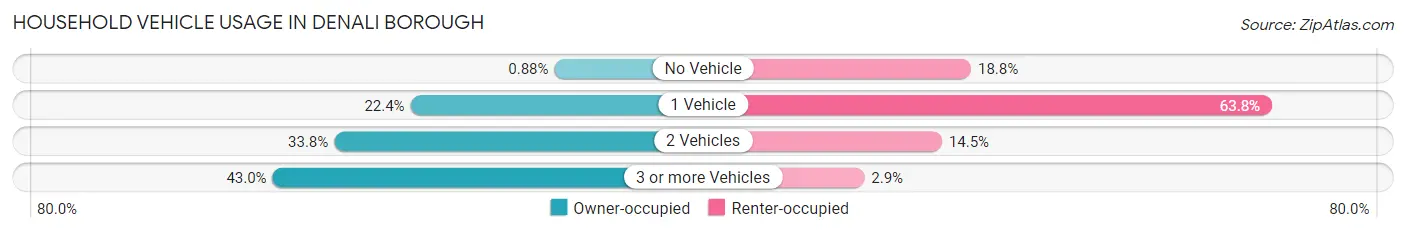
| Vehicles per Household | Owner-occupied | Renter-occupied |
| No Vehicle | 4 (0.9%) | 13 (18.8%) |
| 1 Vehicle | 102 (22.4%) | 44 (63.8%) |
| 2 Vehicles | 154 (33.8%) | 10 (14.5%) |
| 3 or more Vehicles | 196 (43.0%) | 2 (2.9%) |
| Total | 456 (100.0%) | 69 (100.0%) |
Real Estate & Mortgages in Denali Borough
Real Estate and Mortgage Overview in Denali Borough
| Characteristic | Without Mortgage | With Mortgage |
| Housing Units | 284 | 172 |
| Median Property Value | $188,200 | $263,100 |
| Median Household Income | $82,647 | $89 |
| Monthly Housing Costs | $605 | $0 |
| Real Estate Taxes | - | - |
Property Value by Mortgage Status in Denali Borough
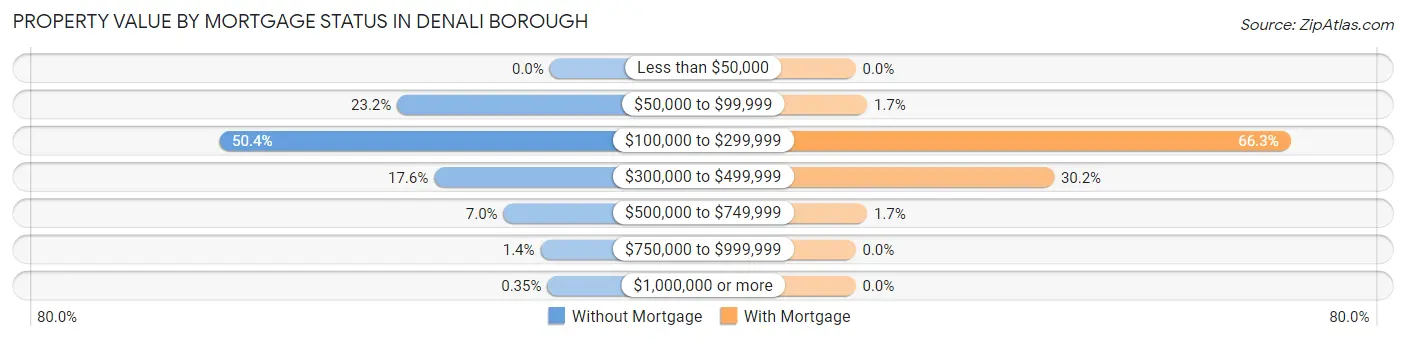
| Property Value | Without Mortgage | With Mortgage |
| Less than $50,000 | 0 (0.0%) | 0 (0.0%) |
| $50,000 to $99,999 | 66 (23.2%) | 3 (1.7%) |
| $100,000 to $299,999 | 143 (50.3%) | 114 (66.3%) |
| $300,000 to $499,999 | 50 (17.6%) | 52 (30.2%) |
| $500,000 to $749,999 | 20 (7.0%) | 3 (1.7%) |
| $750,000 to $999,999 | 4 (1.4%) | 0 (0.0%) |
| $1,000,000 or more | 1 (0.4%) | 0 (0.0%) |
| Total | 284 (100.0%) | 172 (100.0%) |
Household Income by Mortgage Status in Denali Borough
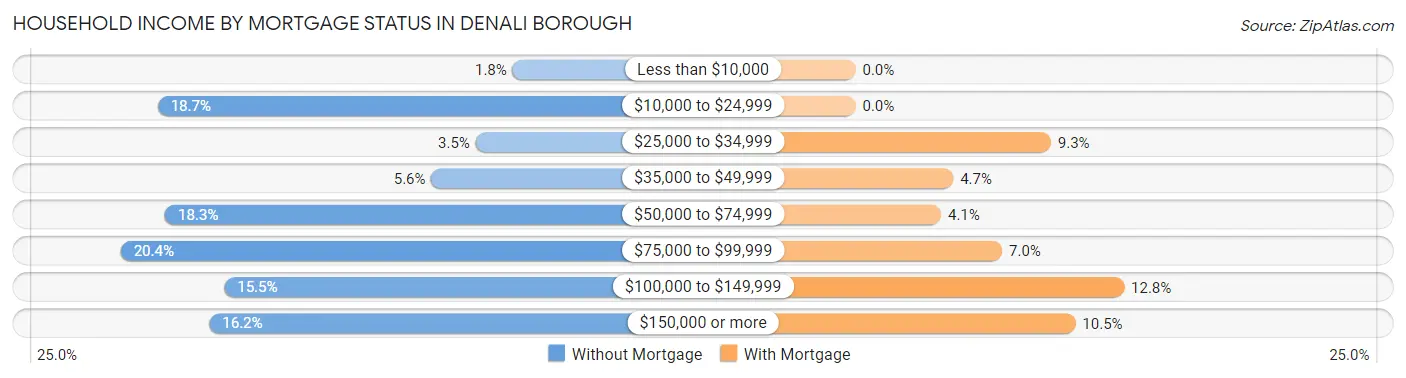
| Household Income | Without Mortgage | With Mortgage |
| Less than $10,000 | 5 (1.8%) | 0 (0.0%) |
| $10,000 to $24,999 | 53 (18.7%) | 0 (0.0%) |
| $25,000 to $34,999 | 10 (3.5%) | 16 (9.3%) |
| $35,000 to $49,999 | 16 (5.6%) | 8 (4.6%) |
| $50,000 to $74,999 | 52 (18.3%) | 7 (4.1%) |
| $75,000 to $99,999 | 58 (20.4%) | 12 (7.0%) |
| $100,000 to $149,999 | 44 (15.5%) | 22 (12.8%) |
| $150,000 or more | 46 (16.2%) | 18 (10.5%) |
| Total | 284 (100.0%) | 172 (100.0%) |
Property Value to Household Income Ratio in Denali Borough
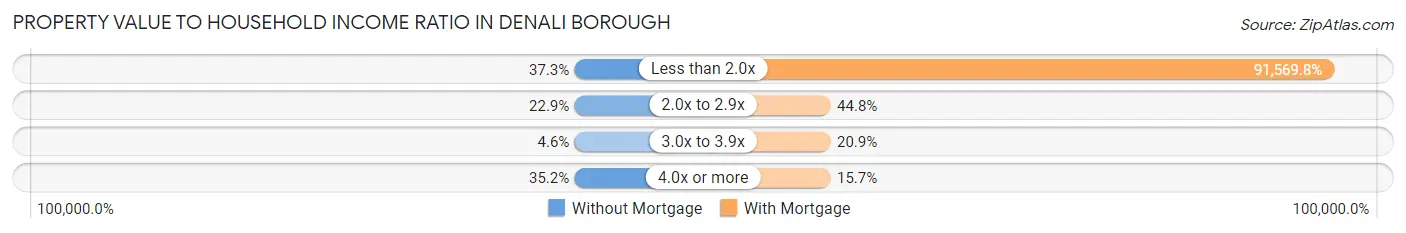
| Value-to-Income Ratio | Without Mortgage | With Mortgage |
| Less than 2.0x | 106 (37.3%) | 157,500 (91,569.8%) |
| 2.0x to 2.9x | 65 (22.9%) | 77 (44.8%) |
| 3.0x to 3.9x | 13 (4.6%) | 36 (20.9%) |
| 4.0x or more | 100 (35.2%) | 27 (15.7%) |
| Total | 284 (100.0%) | 172 (100.0%) |
Real Estate Taxes by Mortgage Status in Denali Borough
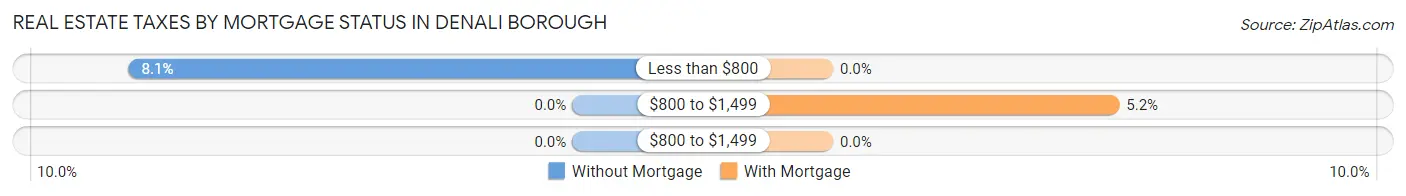
| Property Taxes | Without Mortgage | With Mortgage |
| Less than $800 | 23 (8.1%) | 0 (0.0%) |
| $800 to $1,499 | 0 (0.0%) | 9 (5.2%) |
| $800 to $1,499 | 0 (0.0%) | 0 (0.0%) |
| Total | 284 (100.0%) | 172 (100.0%) |
Health & Disability in Denali Borough
Health Insurance Coverage by Age in Denali Borough
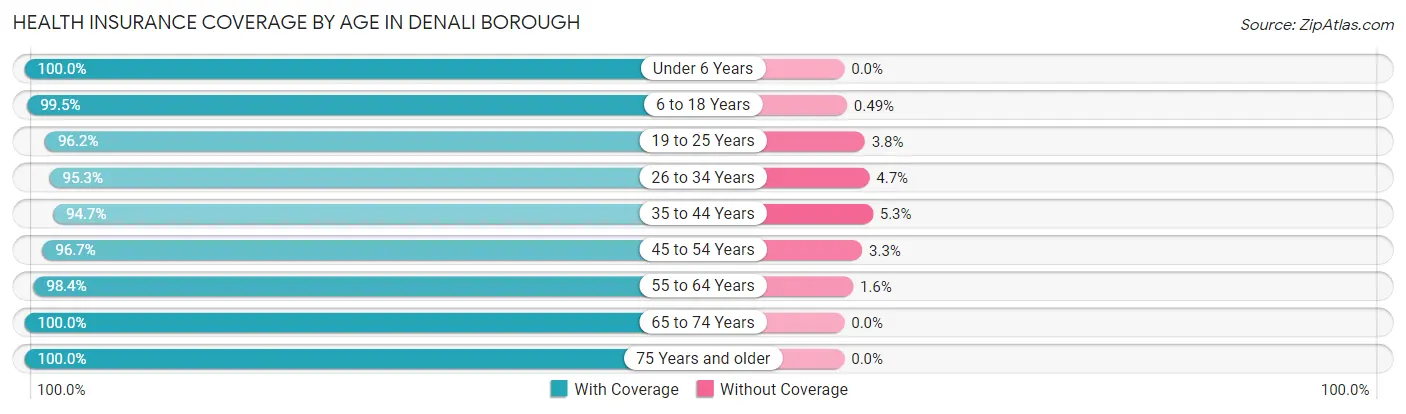
| Age Bracket | With Coverage | Without Coverage |
| Under 6 Years | 81 (100.0%) | 0 (0.0%) |
| 6 to 18 Years | 205 (99.5%) | 1 (0.5%) |
| 19 to 25 Years | 101 (96.2%) | 4 (3.8%) |
| 26 to 34 Years | 204 (95.3%) | 10 (4.7%) |
| 35 to 44 Years | 571 (94.7%) | 32 (5.3%) |
| 45 to 54 Years | 291 (96.7%) | 10 (3.3%) |
| 55 to 64 Years | 242 (98.4%) | 4 (1.6%) |
| 65 to 74 Years | 221 (100.0%) | 0 (0.0%) |
| 75 Years and older | 75 (100.0%) | 0 (0.0%) |
| Total | 1,991 (97.0%) | 61 (3.0%) |
Health Insurance Coverage by Citizenship Status in Denali Borough
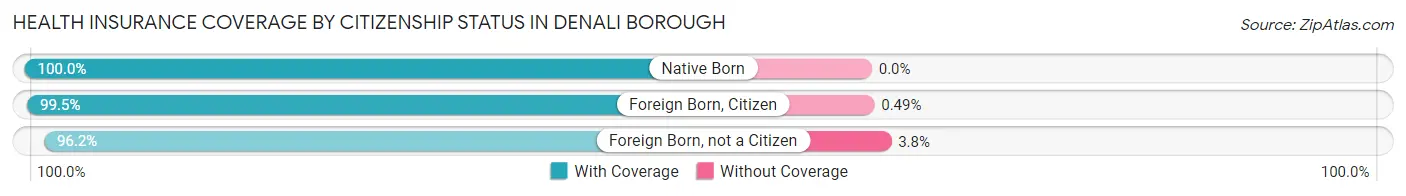
| Citizenship Status | With Coverage | Without Coverage |
| Native Born | 81 (100.0%) | 0 (0.0%) |
| Foreign Born, Citizen | 205 (99.5%) | 1 (0.5%) |
| Foreign Born, not a Citizen | 101 (96.2%) | 4 (3.8%) |
Health Insurance Coverage by Household Income in Denali Borough
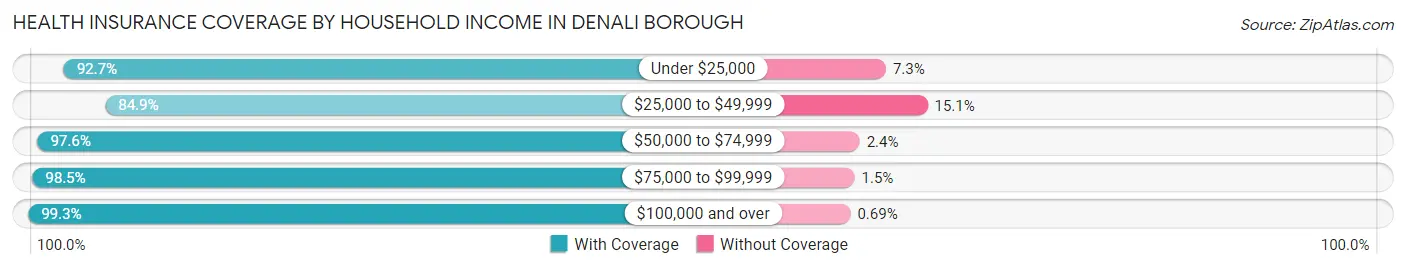
| Household Income | With Coverage | Without Coverage |
| Under $25,000 | 101 (92.7%) | 8 (7.3%) |
| $25,000 to $49,999 | 101 (84.9%) | 18 (15.1%) |
| $50,000 to $74,999 | 121 (97.6%) | 3 (2.4%) |
| $75,000 to $99,999 | 270 (98.5%) | 4 (1.5%) |
| $100,000 and over | 577 (99.3%) | 4 (0.7%) |
Public vs Private Health Insurance Coverage by Age in Denali Borough
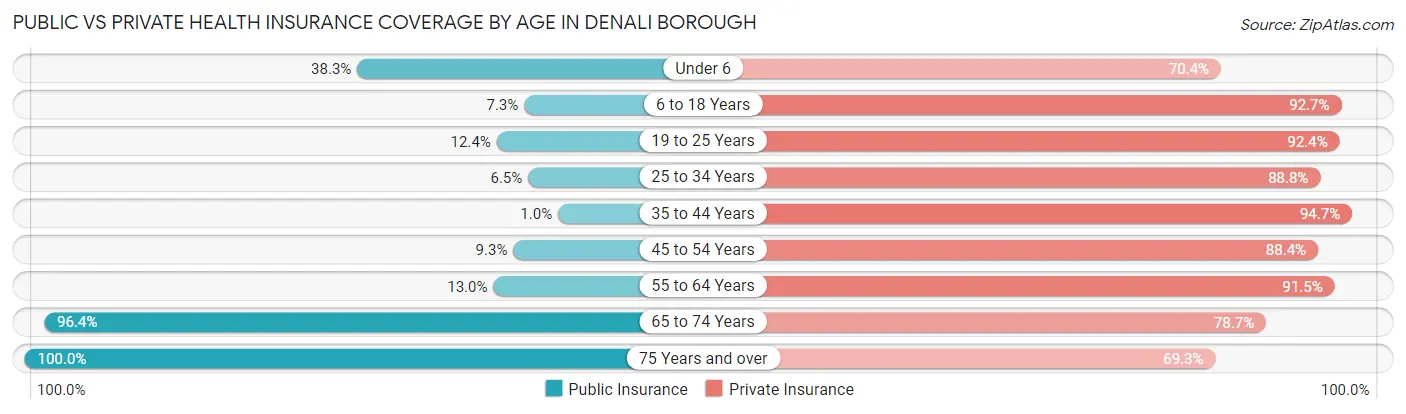
| Age Bracket | Public Insurance | Private Insurance |
| Under 6 | 31 (38.3%) | 57 (70.4%) |
| 6 to 18 Years | 15 (7.3%) | 191 (92.7%) |
| 19 to 25 Years | 13 (12.4%) | 97 (92.4%) |
| 25 to 34 Years | 14 (6.5%) | 190 (88.8%) |
| 35 to 44 Years | 6 (1.0%) | 571 (94.7%) |
| 45 to 54 Years | 28 (9.3%) | 266 (88.4%) |
| 55 to 64 Years | 32 (13.0%) | 225 (91.5%) |
| 65 to 74 Years | 213 (96.4%) | 174 (78.7%) |
| 75 Years and over | 75 (100.0%) | 52 (69.3%) |
| Total | 427 (20.8%) | 1,823 (88.8%) |
Disability Status by Sex by Age in Denali Borough
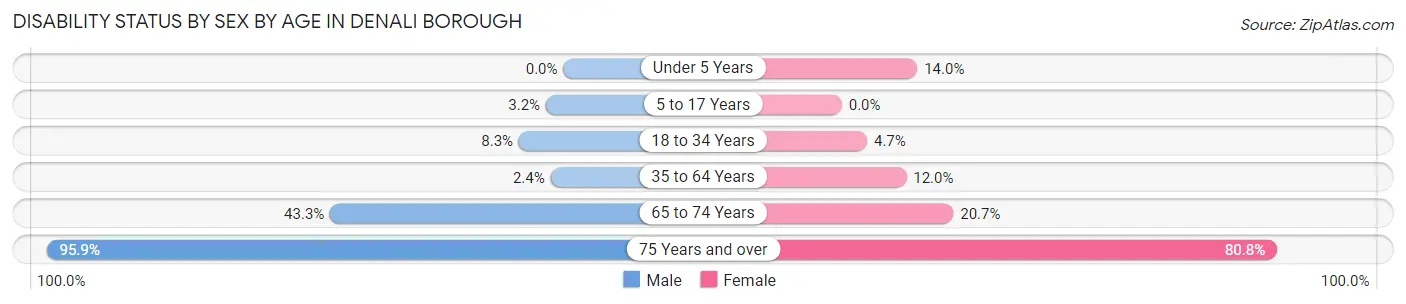
| Age Bracket | Male | Female |
| Under 5 Years | 0 (0.0%) | 7 (14.0%) |
| 5 to 17 Years | 4 (3.2%) | 0 (0.0%) |
| 18 to 34 Years | 17 (8.3%) | 6 (4.7%) |
| 35 to 64 Years | 20 (2.4%) | 37 (12.0%) |
| 65 to 74 Years | 58 (43.3%) | 18 (20.7%) |
| 75 Years and over | 47 (95.9%) | 21 (80.8%) |
Disability Class by Sex by Age in Denali Borough
Disability Class: Hearing Difficulty
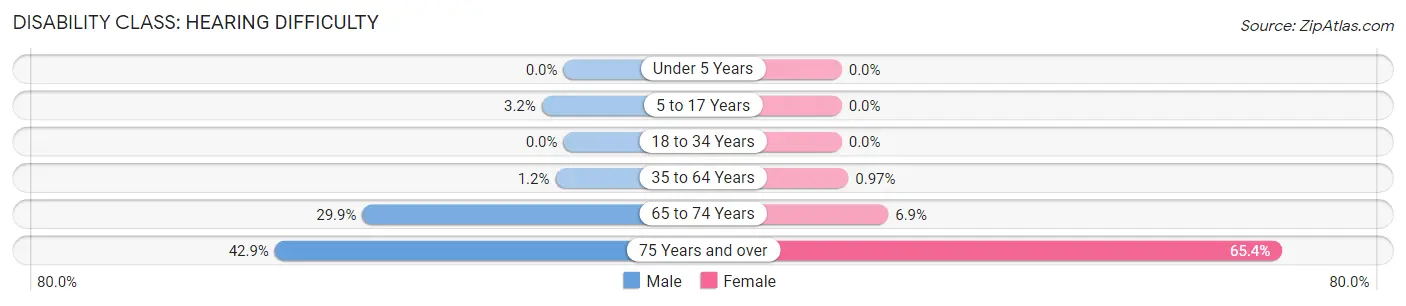
| Age Bracket | Male | Female |
| Under 5 Years | 0 (0.0%) | 0 (0.0%) |
| 5 to 17 Years | 4 (3.2%) | 0 (0.0%) |
| 18 to 34 Years | 0 (0.0%) | 0 (0.0%) |
| 35 to 64 Years | 10 (1.2%) | 3 (1.0%) |
| 65 to 74 Years | 40 (29.8%) | 6 (6.9%) |
| 75 Years and over | 21 (42.9%) | 17 (65.4%) |
Disability Class: Vision Difficulty
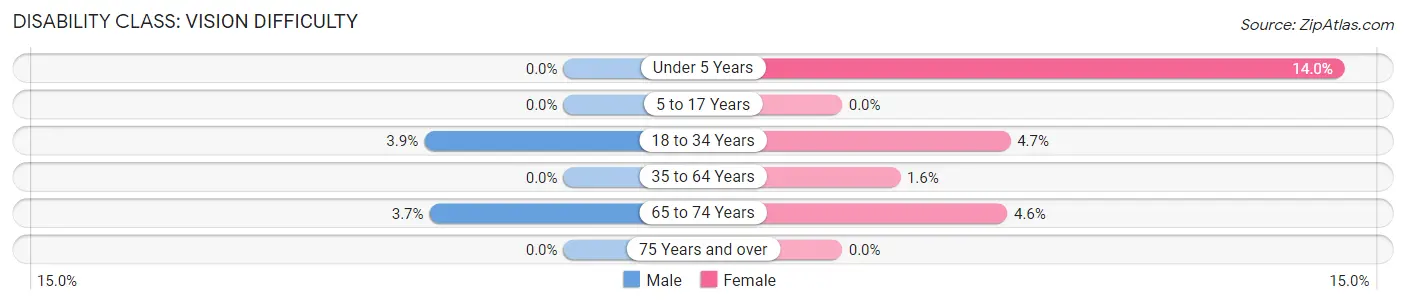
| Age Bracket | Male | Female |
| Under 5 Years | 0 (0.0%) | 7 (14.0%) |
| 5 to 17 Years | 0 (0.0%) | 0 (0.0%) |
| 18 to 34 Years | 8 (3.9%) | 6 (4.7%) |
| 35 to 64 Years | 0 (0.0%) | 5 (1.6%) |
| 65 to 74 Years | 5 (3.7%) | 4 (4.6%) |
| 75 Years and over | 0 (0.0%) | 0 (0.0%) |
Disability Class: Cognitive Difficulty
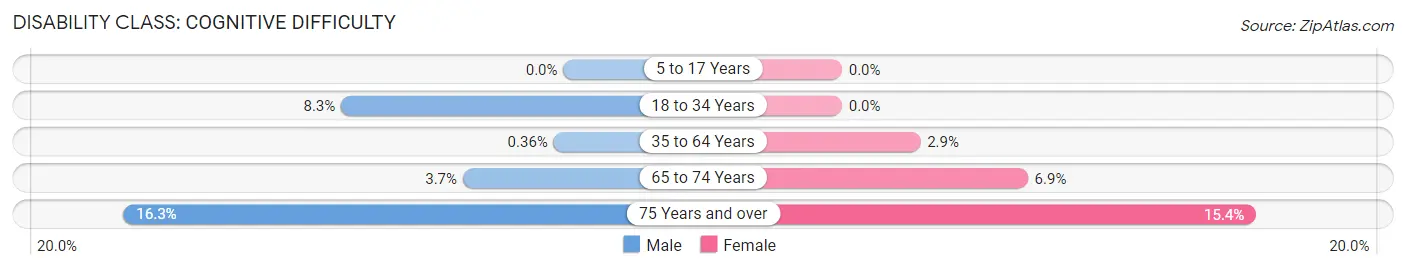
| Age Bracket | Male | Female |
| 5 to 17 Years | 0 (0.0%) | 0 (0.0%) |
| 18 to 34 Years | 17 (8.3%) | 0 (0.0%) |
| 35 to 64 Years | 3 (0.4%) | 9 (2.9%) |
| 65 to 74 Years | 5 (3.7%) | 6 (6.9%) |
| 75 Years and over | 8 (16.3%) | 4 (15.4%) |
Disability Class: Ambulatory Difficulty
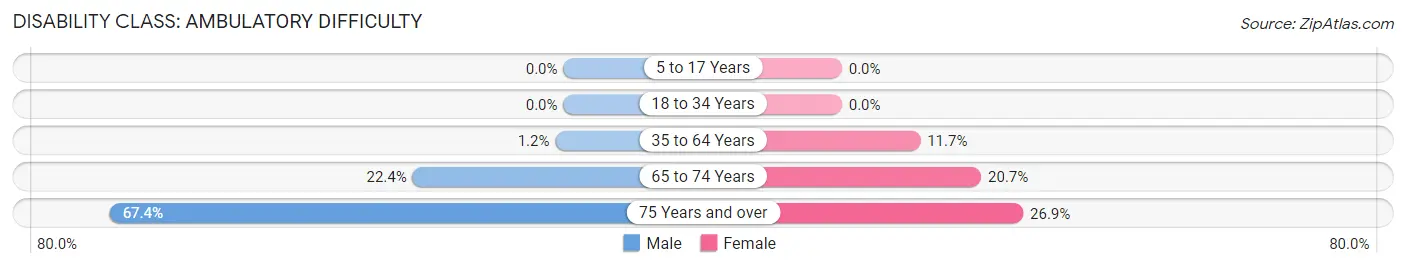
| Age Bracket | Male | Female |
| 5 to 17 Years | 0 (0.0%) | 0 (0.0%) |
| 18 to 34 Years | 0 (0.0%) | 0 (0.0%) |
| 35 to 64 Years | 10 (1.2%) | 36 (11.7%) |
| 65 to 74 Years | 30 (22.4%) | 18 (20.7%) |
| 75 Years and over | 33 (67.3%) | 7 (26.9%) |
Disability Class: Self-Care Difficulty
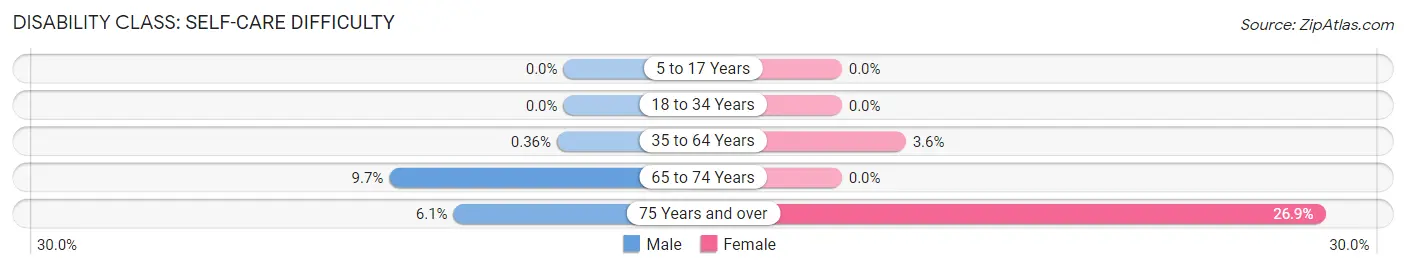
| Age Bracket | Male | Female |
| 5 to 17 Years | 0 (0.0%) | 0 (0.0%) |
| 18 to 34 Years | 0 (0.0%) | 0 (0.0%) |
| 35 to 64 Years | 3 (0.4%) | 11 (3.6%) |
| 65 to 74 Years | 13 (9.7%) | 0 (0.0%) |
| 75 Years and over | 3 (6.1%) | 7 (26.9%) |
Technology Access in Denali Borough
Computing Device Access in Denali Borough
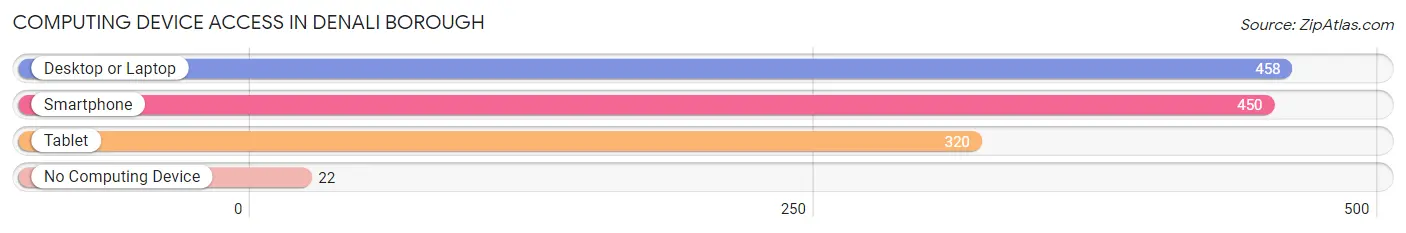
| Device Type | # Households | % Households |
| Desktop or Laptop | 458 | 87.2% |
| Smartphone | 450 | 85.7% |
| Tablet | 320 | 61.0% |
| No Computing Device | 22 | 4.2% |
| Total | 525 | 100.0% |
Internet Access in Denali Borough
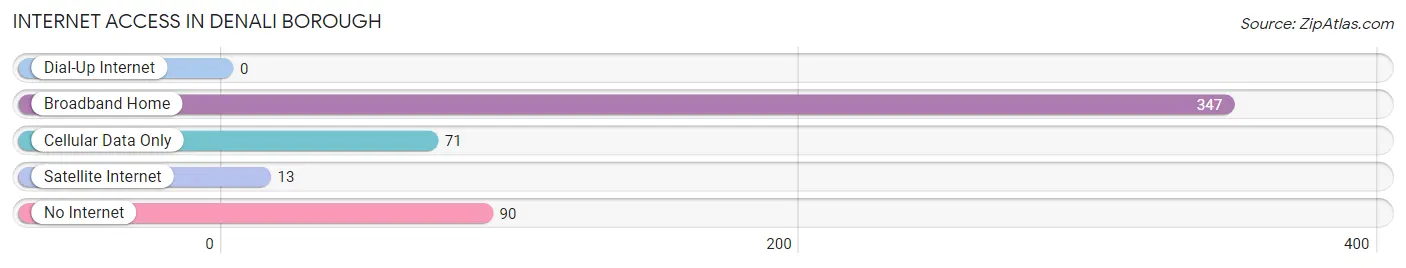
| Internet Type | # Households | % Households |
| Dial-Up Internet | 0 | 0.0% |
| Broadband Home | 347 | 66.1% |
| Cellular Data Only | 71 | 13.5% |
| Satellite Internet | 13 | 2.5% |
| No Internet | 90 | 17.1% |
| Total | 525 | 100.0% |
Denali Borough Summary
Denali Borough is a borough located in the state of Alaska. It is the largest borough in the state, covering an area of 25,256 square miles. The borough is home to the Denali National Park and Preserve, which is the most visited national park in the United States. The borough is also home to the highest mountain in North America, Mount McKinley.
History
The Denali Borough was established in 1988, when the Alaska Legislature passed the Denali Borough Act. The act created the borough from the former Unorganized Borough, which was an area of Alaska that was not part of any organized borough or city. The Denali Borough was created to provide local government services to the area, which had previously been lacking.
The Denali Borough is named after the Denali National Park and Preserve, which was established in 1917. The park was originally known as Mount McKinley National Park, but was renamed in 1980 to honor the Koyukon Athabascan people who have lived in the area for thousands of years.
Geography
The Denali Borough is located in the south-central part of Alaska, and is bordered by the Yukon-Koyukuk Census Area to the west, the Fairbanks North Star Borough to the north, and the Matanuska-Susitna Borough to the east. The borough is home to the Denali National Park and Preserve, which covers an area of 6 million acres. The park is home to Mount McKinley, the highest mountain in North America, which rises to a height of 20,310 feet.
The borough is also home to the Kantishna Hills, a mountain range that is part of the Alaska Range. The Kantishna Hills are home to a variety of wildlife, including grizzly bears, wolves, moose, caribou, and Dall sheep.
Economy
The economy of the Denali Borough is largely based on tourism. The Denali National Park and Preserve is the most visited national park in the United States, and attracts over 1 million visitors each year. The park is home to a variety of activities, including hiking, camping, fishing, and wildlife viewing.
The borough is also home to a variety of mining operations, including gold, silver, and coal. The borough is also home to a number of oil and gas fields, which provide jobs and revenue for the local economy.
Demographics
As of the 2010 census, the population of the Denali Borough was 1,826. The population is largely composed of Native Americans, with the largest group being the Koyukon Athabascan people. The borough also has a small population of non-Native Americans, including those of European, Asian, and Hispanic descent.
The median household income in the Denali Borough is $50,000, which is slightly higher than the median household income for the state of Alaska. The unemployment rate in the borough is 6.2%, which is slightly lower than the state average of 6.7%.
Conclusion
The Denali Borough is a large and diverse borough located in the state of Alaska. The borough is home to the Denali National Park and Preserve, which is the most visited national park in the United States. The borough is also home to a variety of mining operations, oil and gas fields, and other industries that provide jobs and revenue for the local economy. The population of the Denali Borough is largely composed of Native Americans, with the largest group being the Koyukon Athabascan people. The median household income in the borough is slightly higher than the state average, and the unemployment rate is slightly lower.
Common Questions
What is the Total Population of Denali Borough?
Total Population of Denali Borough is 2,101.
What is the Total Male Population of Denali Borough?
Total Male Population of Denali Borough is 1,417.
What is the Total Female Population of Denali Borough?
Total Female Population of Denali Borough is 684.
What is the Ratio of Males per 100 Females in Denali Borough?
There are 207.16 Males per 100 Females in Denali Borough.
What is the Ratio of Females per 100 Males in Denali Borough?
There are 48.27 Females per 100 Males in Denali Borough.
What is the Median Population Age in Denali Borough?
Median Population Age in Denali Borough is 44.4 Years.
What is the Average Family Size in Denali Borough
Average Family Size in Denali Borough is 3.1 People.
What is the Average Household Size in Denali Borough
Average Household Size in Denali Borough is 2.3 People.
What is Per Capita Income in Denali Borough?
Per Capita income in Denali Borough is $73,692.
What is the Median Family Income in Denali Borough?
Median Family Income in Denali Borough is $131,750.
What is the Median Household income in Denali Borough?
Median Household Income in Denali Borough is $87,292.
What is Inequality or Gini Index in Denali Borough?
Inequality or Gini Index in Denali Borough is 0.38.
How Large is the Labor Force in Denali Borough?
There are 1,418 People in the Labor Forcein in Denali Borough.
What is the Percentage of People in the Labor Force in Denali Borough?
75.4% of People are in the Labor Force in Denali Borough.
What is the Unemployment Rate in Denali Borough?
Unemployment Rate in Denali Borough is 1.9%.