Bristol Bay Borough, AK
Bristol Bay Borough Map
Bristol Bay Borough Overview
854
TOTAL POPULATION
489
MALE POPULATION
365
FEMALE POPULATION
133.97
MALES / 100 FEMALES
74.64
FEMALES / 100 MALES
36.4
MEDIAN AGE
3.1
AVG FAMILY SIZE
2.6
AVG HOUSEHOLD SIZE
$45,499
PER CAPITA INCOME
$104,688
AVG FAMILY INCOME
$94,167
AVG HOUSEHOLD INCOME
17.2%
WAGE / INCOME GAP [ % ]
82.8¢/ $1
WAGE / INCOME GAP [ $ ]
0.41
INEQUALITY / GINI INDEX
450
LABOR FORCE [ PEOPLE ]
63.6%
PERCENT IN LABOR FORCE
2.7%
UNEMPLOYMENT RATE
Bristol Bay Borough Area Codes
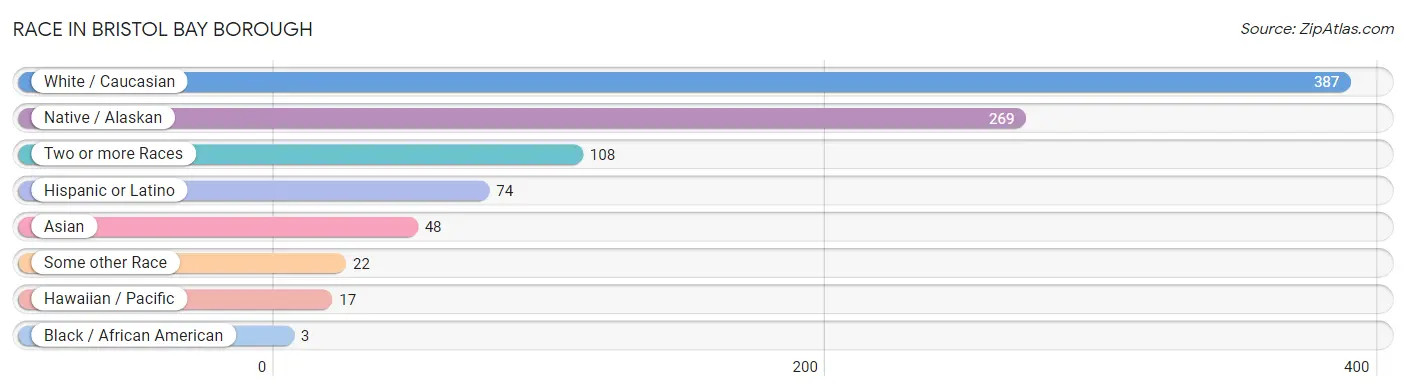
Race in Bristol Bay Borough
The most populous races in Bristol Bay Borough are White / Caucasian (387 | 45.3%), Native / Alaskan (269 | 31.5%), and Two or more Races (108 | 12.7%).
| Race | # Population | % Population |
| Asian | 48 | 5.6% |
| Black / African American | 3 | 0.4% |
| Hawaiian / Pacific | 17 | 2.0% |
| Hispanic or Latino | 74 | 8.7% |
| Native / Alaskan | 269 | 31.5% |
| White / Caucasian | 387 | 45.3% |
| Two or more Races | 108 | 12.7% |
| Some other Race | 22 | 2.6% |
| Total | 854 | 100.0% |
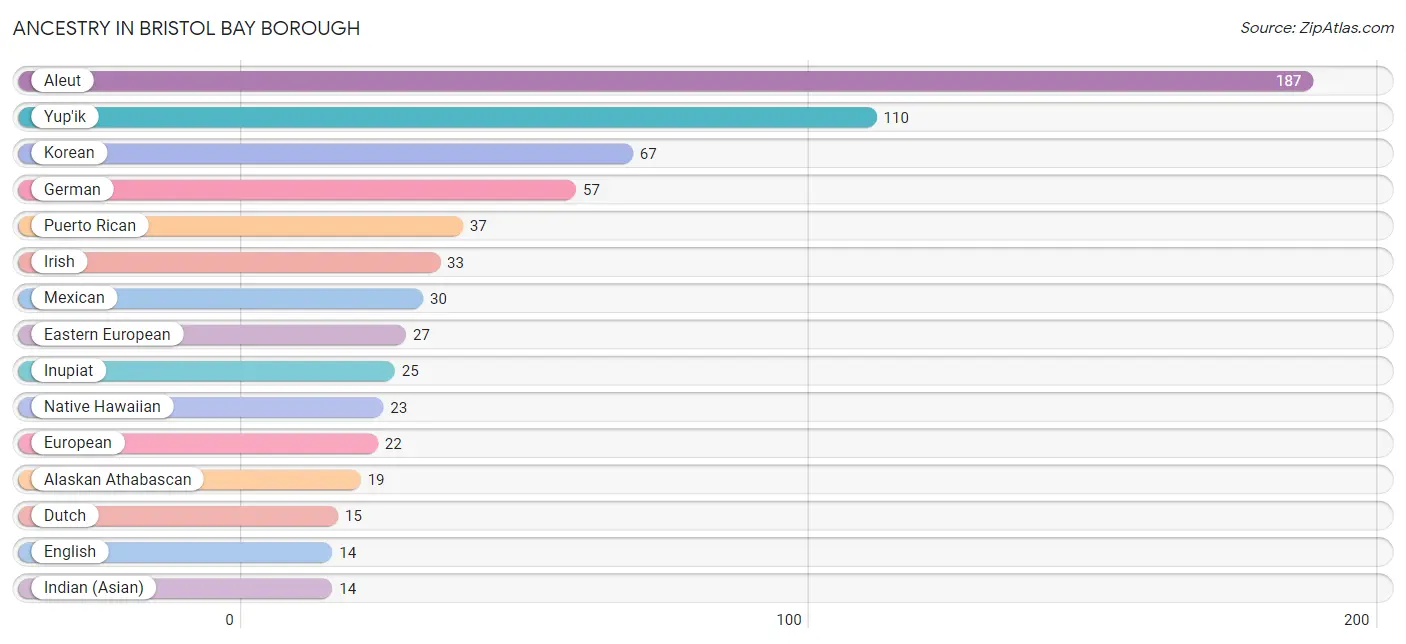
Ancestry in Bristol Bay Borough
The most populous ancestries reported in Bristol Bay Borough are Aleut (187 | 21.9%), Yup'ik (110 | 12.9%), Korean (67 | 7.9%), German (57 | 6.7%), and Puerto Rican (37 | 4.3%), together accounting for 53.6% of all Bristol Bay Borough residents.
| Ancestry | # Population | % Population |
| Alaska Native | 2 | 0.2% |
| Alaskan Athabascan | 19 | 2.2% |
| Aleut | 187 | 21.9% |
| American | 3 | 0.4% |
| Bhutanese | 1 | 0.1% |
| British | 6 | 0.7% |
| Cherokee | 1 | 0.1% |
| Czech | 5 | 0.6% |
| Danish | 4 | 0.5% |
| Dutch | 15 | 1.8% |
| Eastern European | 27 | 3.2% |
| English | 14 | 1.6% |
| European | 22 | 2.6% |
| Finnish | 1 | 0.1% |
| French | 7 | 0.8% |
| French Canadian | 2 | 0.2% |
| German | 57 | 6.7% |
| Indian (Asian) | 14 | 1.6% |
| Inupiat | 25 | 2.9% |
| Irish | 33 | 3.9% |
| Italian | 11 | 1.3% |
| Korean | 67 | 7.9% |
| Mexican | 30 | 3.5% |
| Native Hawaiian | 23 | 2.7% |
| Northern European | 1 | 0.1% |
| Norwegian | 13 | 1.5% |
| Polish | 5 | 0.6% |
| Puerto Rican | 37 | 4.3% |
| Russian | 4 | 0.5% |
| Scandinavian | 13 | 1.5% |
| Scotch-Irish | 1 | 0.1% |
| Scottish | 11 | 1.3% |
| South African | 1 | 0.1% |
| Spaniard | 1 | 0.1% |
| Spanish | 2 | 0.2% |
| Subsaharan African | 1 | 0.1% |
| Swedish | 3 | 0.4% |
| Tlingit-Haida | 1 | 0.1% |
| Welsh | 4 | 0.5% |
| Yugoslavian | 2 | 0.2% |
| Yup'ik | 110 | 12.9% | View All 41 Rows |
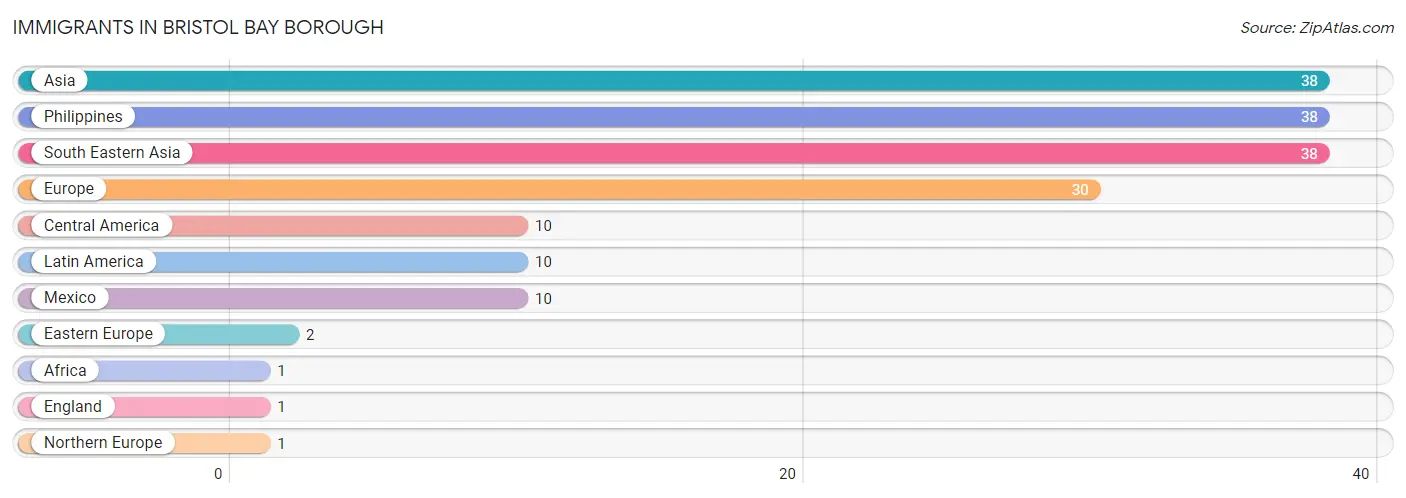
Immigrants in Bristol Bay Borough
The most numerous immigrant groups reported in Bristol Bay Borough came from Asia (38 | 4.4%), Philippines (38 | 4.4%), South Eastern Asia (38 | 4.4%), Europe (30 | 3.5%), and Central America (10 | 1.2%), together accounting for 18.0% of all Bristol Bay Borough residents.
| Immigration Origin | # Population | % Population |
| Africa | 1 | 0.1% |
| Asia | 38 | 4.4% |
| Central America | 10 | 1.2% |
| Eastern Europe | 2 | 0.2% |
| England | 1 | 0.1% |
| Europe | 30 | 3.5% |
| Latin America | 10 | 1.2% |
| Mexico | 10 | 1.2% |
| Northern Europe | 1 | 0.1% |
| Philippines | 38 | 4.4% |
| South Eastern Asia | 38 | 4.4% | View All 11 Rows |
Sex and Age in Bristol Bay Borough
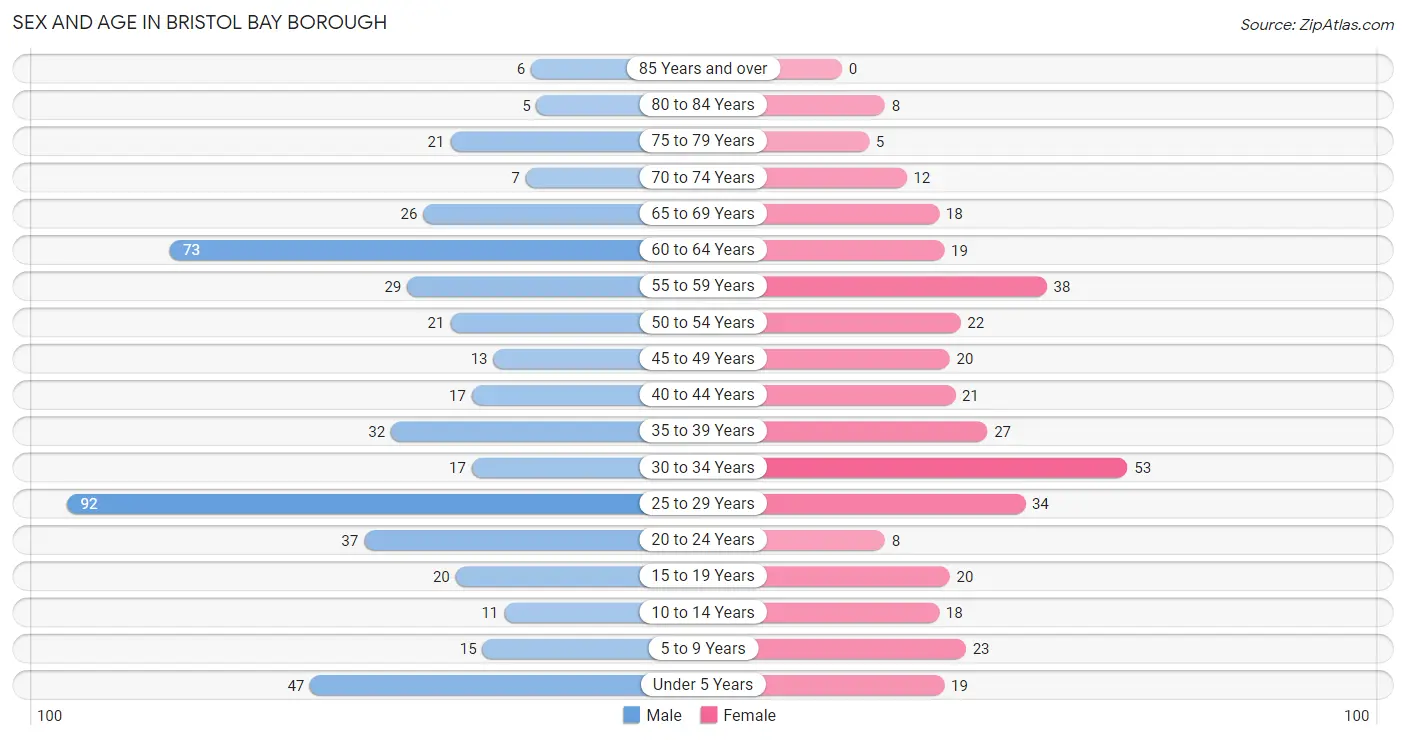
Sex and Age in Bristol Bay Borough
The most populous age groups in Bristol Bay Borough are 25 to 29 Years (92 | 18.8%) for men and 30 to 34 Years (53 | 14.5%) for women.
| Age Bracket | Male | Female |
| Under 5 Years | 47 (9.6%) | 19 (5.2%) |
| 5 to 9 Years | 15 (3.1%) | 23 (6.3%) |
| 10 to 14 Years | 11 (2.2%) | 18 (4.9%) |
| 15 to 19 Years | 20 (4.1%) | 20 (5.5%) |
| 20 to 24 Years | 37 (7.6%) | 8 (2.2%) |
| 25 to 29 Years | 92 (18.8%) | 34 (9.3%) |
| 30 to 34 Years | 17 (3.5%) | 53 (14.5%) |
| 35 to 39 Years | 32 (6.5%) | 27 (7.4%) |
| 40 to 44 Years | 17 (3.5%) | 21 (5.8%) |
| 45 to 49 Years | 13 (2.7%) | 20 (5.5%) |
| 50 to 54 Years | 21 (4.3%) | 22 (6.0%) |
| 55 to 59 Years | 29 (5.9%) | 38 (10.4%) |
| 60 to 64 Years | 73 (14.9%) | 19 (5.2%) |
| 65 to 69 Years | 26 (5.3%) | 18 (4.9%) |
| 70 to 74 Years | 7 (1.4%) | 12 (3.3%) |
| 75 to 79 Years | 21 (4.3%) | 5 (1.4%) |
| 80 to 84 Years | 5 (1.0%) | 8 (2.2%) |
| 85 Years and over | 6 (1.2%) | 0 (0.0%) |
| Total | 489 (100.0%) | 365 (100.0%) |
Families and Households in Bristol Bay Borough
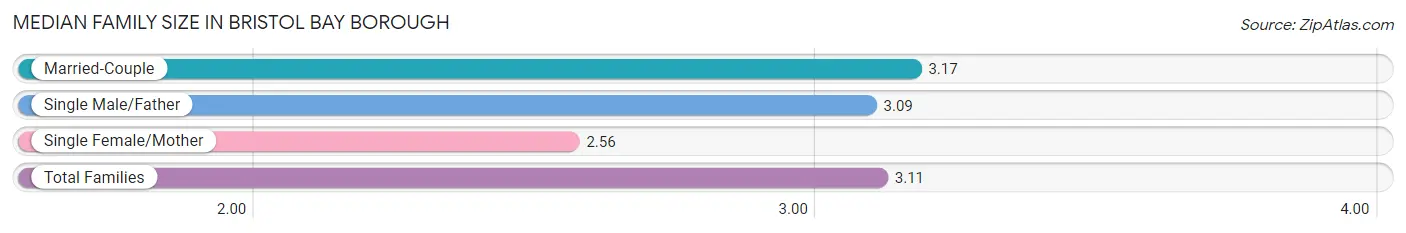
Median Family Size in Bristol Bay Borough
The median family size in Bristol Bay Borough is 3.11 persons per family, with married-couple families (152 | 84.9%) accounting for the largest median family size of 3.17 persons per family. On the other hand, single female/mother families (16 | 8.9%) represent the smallest median family size with 2.56 persons per family.
| Family Type | # Families | Family Size |
| Married-Couple | 152 (84.9%) | 3.17 |
| Single Male/Father | 11 (6.1%) | 3.09 |
| Single Female/Mother | 16 (8.9%) | 2.56 |
| Total Families | 179 (100.0%) | 3.11 |
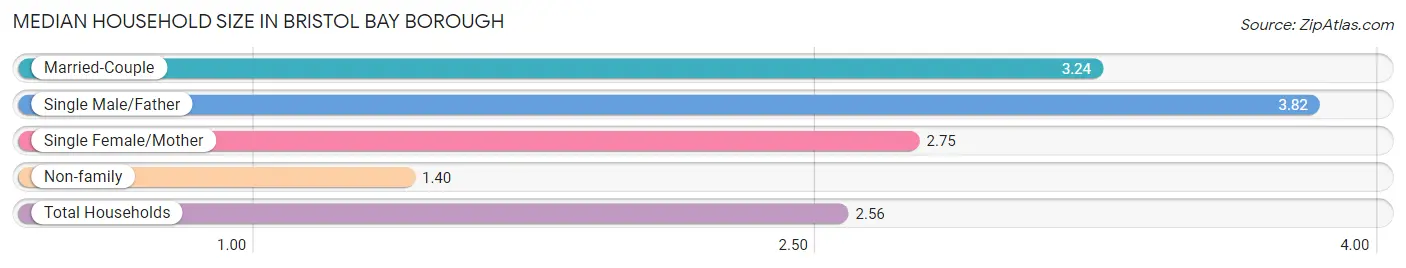
Median Household Size in Bristol Bay Borough
The median household size in Bristol Bay Borough is 2.56 persons per household, with single male/father households (11 | 3.9%) accounting for the largest median household size of 3.82 persons per household. non-family households (105 | 37.0%) represent the smallest median household size with 1.40 persons per household.
| Household Type | # Households | Household Size |
| Married-Couple | 152 (53.5%) | 3.24 |
| Single Male/Father | 11 (3.9%) | 3.82 |
| Single Female/Mother | 16 (5.6%) | 2.75 |
| Non-family | 105 (37.0%) | 1.40 |
| Total Households | 284 (100.0%) | 2.56 |
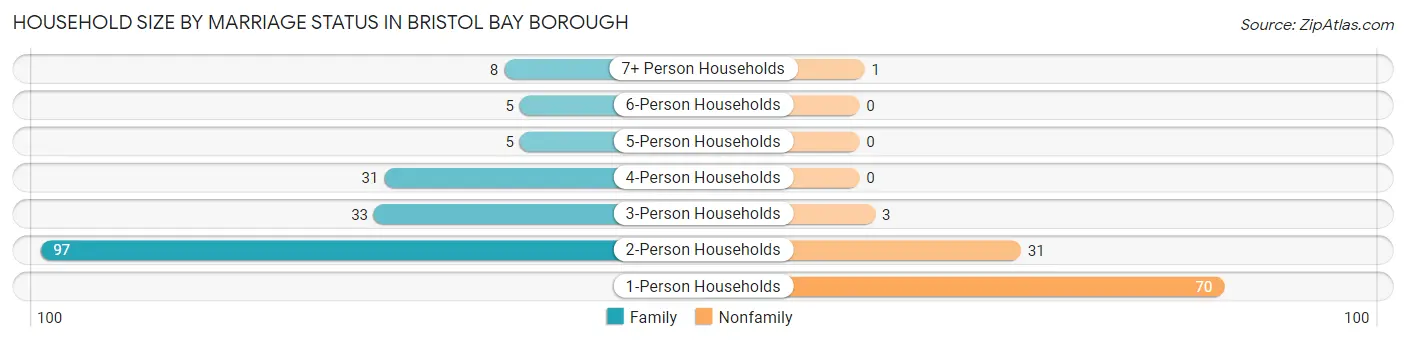
Household Size by Marriage Status in Bristol Bay Borough
Out of a total of 284 households in Bristol Bay Borough, 179 (63.0%) are family households, while 105 (37.0%) are nonfamily households. The most numerous type of family households are 2-person households, comprising 97, and the most common type of nonfamily households are 1-person households, comprising 70.
| Household Size | Family Households | Nonfamily Households |
| 1-Person Households | - | 70 (24.6%) |
| 2-Person Households | 97 (34.2%) | 31 (10.9%) |
| 3-Person Households | 33 (11.6%) | 3 (1.1%) |
| 4-Person Households | 31 (10.9%) | 0 (0.0%) |
| 5-Person Households | 5 (1.8%) | 0 (0.0%) |
| 6-Person Households | 5 (1.8%) | 0 (0.0%) |
| 7+ Person Households | 8 (2.8%) | 1 (0.4%) |
| Total | 179 (63.0%) | 105 (37.0%) |
Female Fertility in Bristol Bay Borough
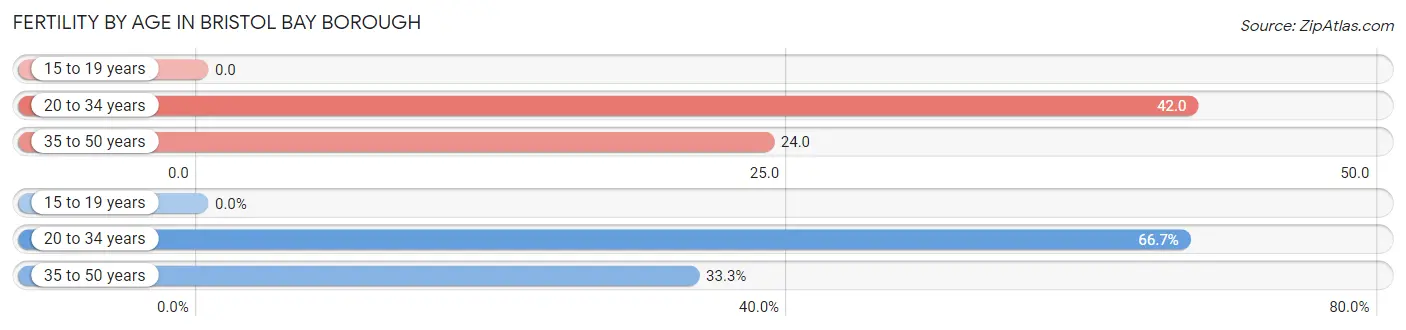
Fertility by Age in Bristol Bay Borough
Average fertility rate in Bristol Bay Borough is 30.0 births per 1,000 women. Women in the age bracket of 20 to 34 years have the highest fertility rate with 42.0 births per 1,000 women. Women in the age bracket of 20 to 34 years acount for 66.7% of all women with births.
| Age Bracket | Women with Births | Births / 1,000 Women |
| 15 to 19 years | 0 (0.0%) | 0.0 |
| 20 to 34 years | 4 (66.7%) | 42.0 |
| 35 to 50 years | 2 (33.3%) | 24.0 |
| Total | 6 (100.0%) | 30.0 |
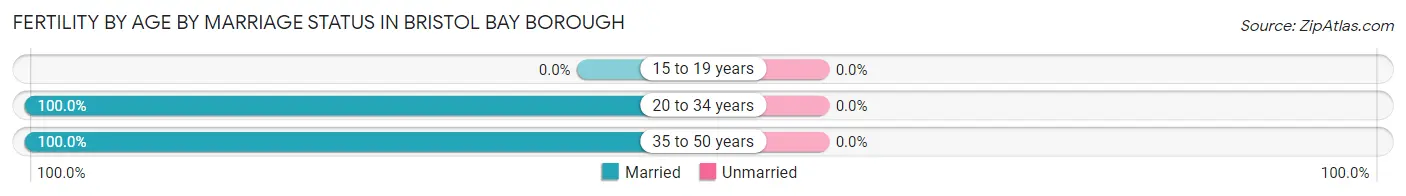
Fertility by Age by Marriage Status in Bristol Bay Borough
| Age Bracket | Married | Unmarried |
| 15 to 19 years | 0 (0.0%) | 0 (0.0%) |
| 20 to 34 years | 4 (100.0%) | 0 (0.0%) |
| 35 to 50 years | 2 (100.0%) | 0 (0.0%) |
| Total | 6 (100.0%) | 0 (0.0%) |
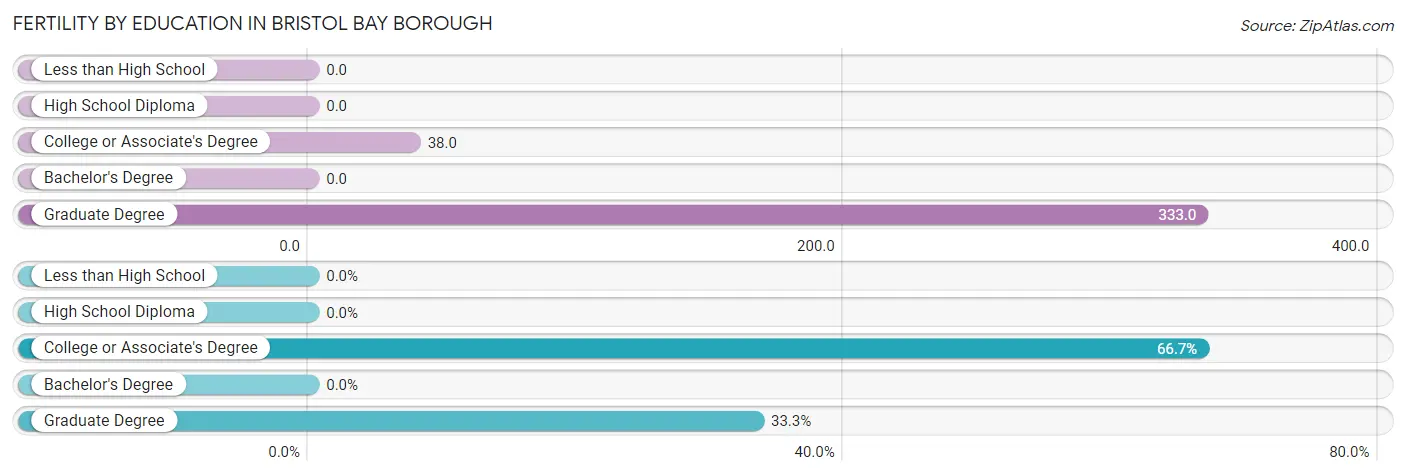
Fertility by Education in Bristol Bay Borough
| Educational Attainment | Women with Births | Births / 1,000 Women |
| Less than High School | 0 (0.0%) | 0.0 |
| High School Diploma | 0 (0.0%) | 0.0 |
| College or Associate's Degree | 4 (66.7%) | 38.0 |
| Bachelor's Degree | 0 (0.0%) | 0.0 |
| Graduate Degree | 2 (33.3%) | 333.0 |
| Total | 6 (100.0%) | 30.0 |
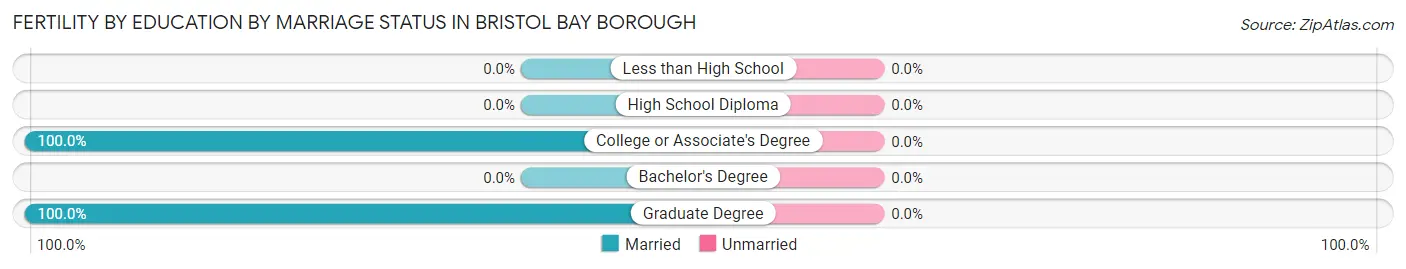
Fertility by Education by Marriage Status in Bristol Bay Borough
| Educational Attainment | Married | Unmarried |
| Less than High School | 0 (0.0%) | 0 (0.0%) |
| High School Diploma | 0 (0.0%) | 0 (0.0%) |
| College or Associate's Degree | 4 (100.0%) | 0 (0.0%) |
| Bachelor's Degree | 0 (0.0%) | 0 (0.0%) |
| Graduate Degree | 2 (100.0%) | 0 (0.0%) |
| Total | 6 (100.0%) | 0 (0.0%) |
Income in Bristol Bay Borough
Income Overview in Bristol Bay Borough
Per Capita Income in Bristol Bay Borough is $45,499, while median incomes of families and households are $104,688 and $94,167 respectively.
| Characteristic | Number | Measure |
| Per Capita Income | 854 | $45,499 |
| Median Family Income | 179 | $104,688 |
| Mean Family Income | 179 | $134,679 |
| Median Household Income | 284 | $94,167 |
| Mean Household Income | 284 | $116,487 |
| Income Deficit | 179 | $0 |
| Wage / Income Gap (%) | 854 | 17.16% |
| Wage / Income Gap ($) | 854 | 82.84¢ per $1 |
| Gini / Inequality Index | 854 | 0.41 |
Earnings by Sex in Bristol Bay Borough
Average Earnings in Bristol Bay Borough are $54,231, $56,528 for men and $46,827 for women, a difference of 17.2%.
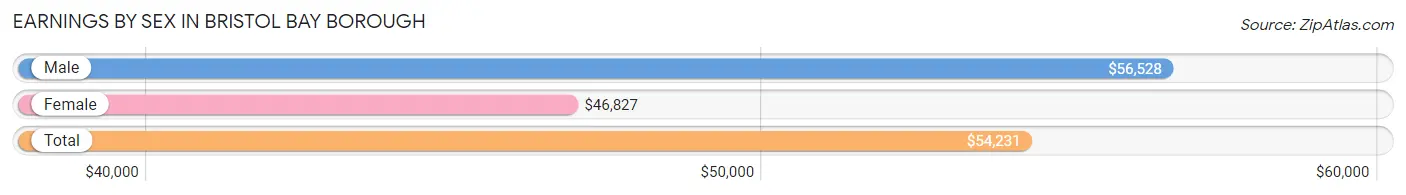
| Sex | Number | Average Earnings |
| Male | 303 (58.5%) | $56,528 |
| Female | 215 (41.5%) | $46,827 |
| Total | 518 (100.0%) | $54,231 |
Earnings by Sex by Income Bracket in Bristol Bay Borough
The most common earnings brackets in Bristol Bay Borough are $100,000+ for men (61 | 20.1%) and $100,000+ for women (35 | 16.3%).
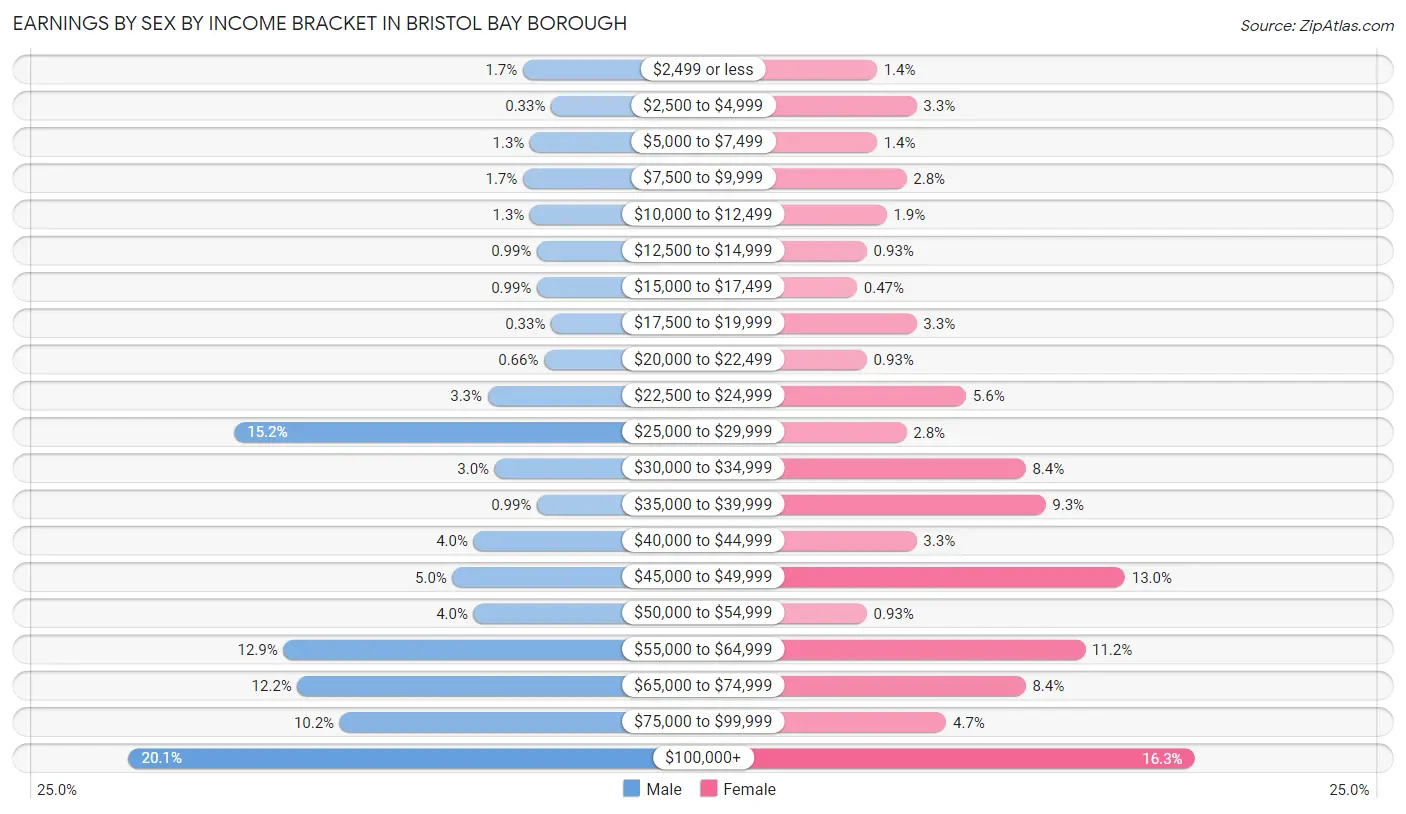
| Income | Male | Female |
| $2,499 or less | 5 (1.7%) | 3 (1.4%) |
| $2,500 to $4,999 | 1 (0.3%) | 7 (3.3%) |
| $5,000 to $7,499 | 4 (1.3%) | 3 (1.4%) |
| $7,500 to $9,999 | 5 (1.7%) | 6 (2.8%) |
| $10,000 to $12,499 | 4 (1.3%) | 4 (1.9%) |
| $12,500 to $14,999 | 3 (1.0%) | 2 (0.9%) |
| $15,000 to $17,499 | 3 (1.0%) | 1 (0.5%) |
| $17,500 to $19,999 | 1 (0.3%) | 7 (3.3%) |
| $20,000 to $22,499 | 2 (0.7%) | 2 (0.9%) |
| $22,500 to $24,999 | 10 (3.3%) | 12 (5.6%) |
| $25,000 to $29,999 | 46 (15.2%) | 6 (2.8%) |
| $30,000 to $34,999 | 9 (3.0%) | 18 (8.4%) |
| $35,000 to $39,999 | 3 (1.0%) | 20 (9.3%) |
| $40,000 to $44,999 | 12 (4.0%) | 7 (3.3%) |
| $45,000 to $49,999 | 15 (5.0%) | 28 (13.0%) |
| $50,000 to $54,999 | 12 (4.0%) | 2 (0.9%) |
| $55,000 to $64,999 | 39 (12.9%) | 24 (11.2%) |
| $65,000 to $74,999 | 37 (12.2%) | 18 (8.4%) |
| $75,000 to $99,999 | 31 (10.2%) | 10 (4.6%) |
| $100,000+ | 61 (20.1%) | 35 (16.3%) |
| Total | 303 (100.0%) | 215 (100.0%) |
Earnings by Sex by Educational Attainment in Bristol Bay Borough
Average earnings in Bristol Bay Borough are $56,296 for men and $48,214 for women, a difference of 14.4%. Men with an educational attainment of bachelor's degree enjoy the highest average annual earnings of $84,000, while those with less than high school education earn the least with $53,625. Women with an educational attainment of graduate degree earn the most with the average annual earnings of $114,063, while those with high school diploma education have the smallest earnings of $26,875.
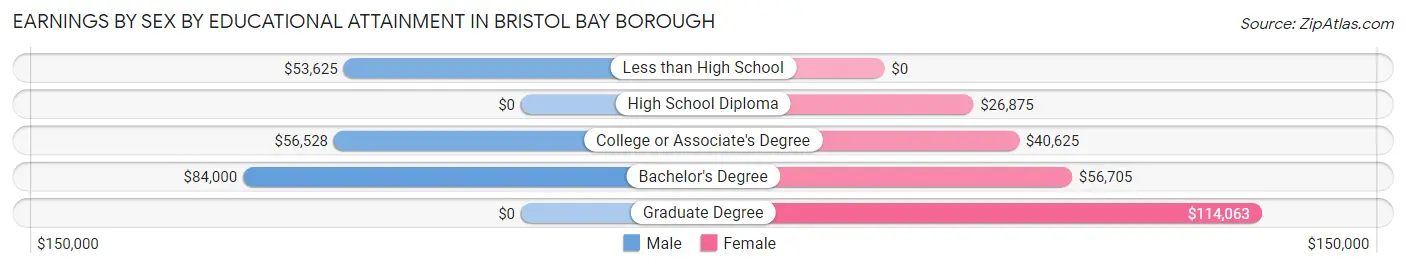
| Educational Attainment | Male Income | Female Income |
| Less than High School | $53,625 | $0 |
| High School Diploma | - | - |
| College or Associate's Degree | $56,528 | $40,625 |
| Bachelor's Degree | $84,000 | $56,705 |
| Graduate Degree | - | - |
| Total | $56,296 | $48,214 |
Family Income in Bristol Bay Borough
Family Income Brackets in Bristol Bay Borough
According to the Bristol Bay Borough family income data, there are 44 families falling into the $100,000 to $149,999 income range, which is the most common income bracket and makes up 24.6% of all families.
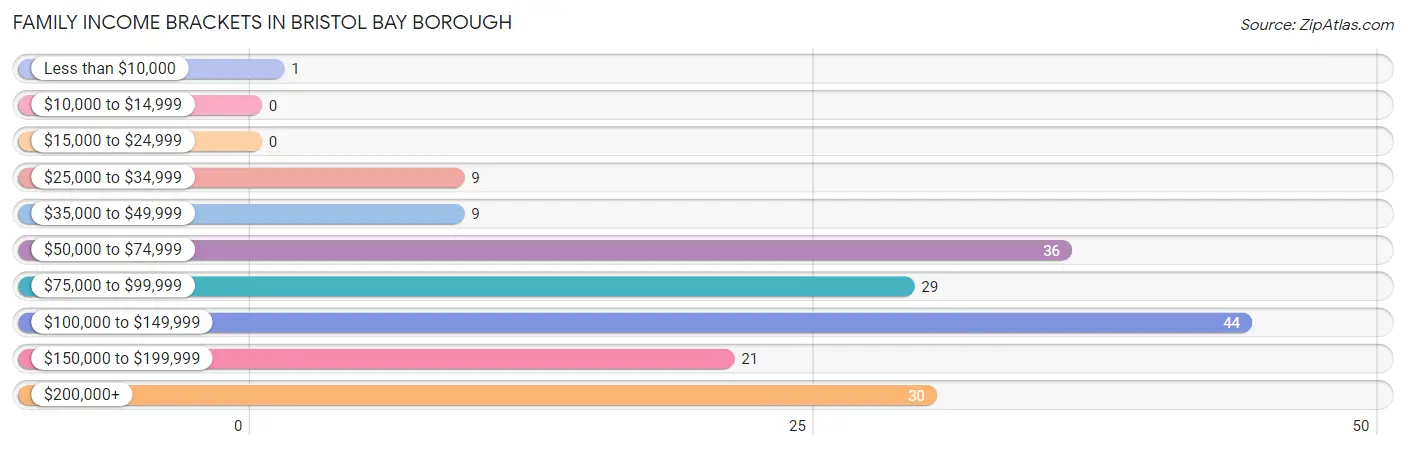
| Income Bracket | # Families | % Families |
| Less than $10,000 | 1 | 0.6% |
| $10,000 to $14,999 | 0 | 0.0% |
| $15,000 to $24,999 | 0 | 0.0% |
| $25,000 to $34,999 | 9 | 5.0% |
| $35,000 to $49,999 | 9 | 5.0% |
| $50,000 to $74,999 | 36 | 20.1% |
| $75,000 to $99,999 | 29 | 16.2% |
| $100,000 to $149,999 | 44 | 24.6% |
| $150,000 to $199,999 | 21 | 11.7% |
| $200,000+ | 30 | 16.8% |
Family Income by Famaliy Size in Bristol Bay Borough
7+ person families (7 | 3.9%) account for the highest median family income in Bristol Bay Borough with $250,001 per family, while 2-person families (110 | 61.5%) have the highest median income of $45,000 per family member.
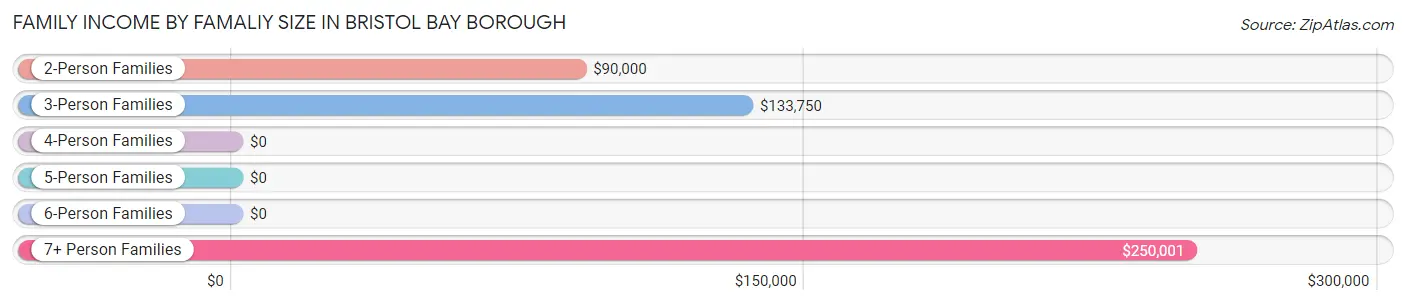
| Income Bracket | # Families | Median Income |
| 2-Person Families | 110 (61.5%) | $90,000 |
| 3-Person Families | 26 (14.5%) | $133,750 |
| 4-Person Families | 26 (14.5%) | $0 |
| 5-Person Families | 6 (3.4%) | $0 |
| 6-Person Families | 4 (2.2%) | $0 |
| 7+ Person Families | 7 (3.9%) | $250,001 |
| Total | 179 (100.0%) | $104,688 |
Family Income by Number of Earners in Bristol Bay Borough
The median family income in Bristol Bay Borough is $104,688, with families comprising 3+ earners (21) having the highest median family income of $250,001, while families with no earners (13) have the lowest median family income of $64,583, accounting for 11.7% and 7.3% of families, respectively.
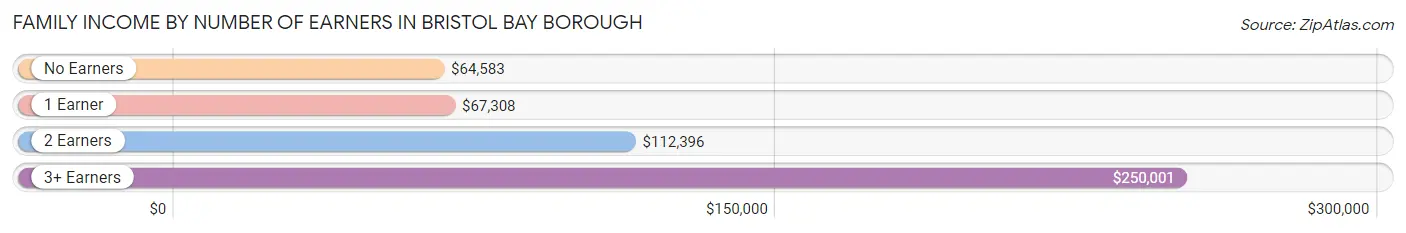
| Number of Earners | # Families | Median Income |
| No Earners | 13 (7.3%) | $64,583 |
| 1 Earner | 58 (32.4%) | $67,308 |
| 2 Earners | 87 (48.6%) | $112,396 |
| 3+ Earners | 21 (11.7%) | $250,001 |
| Total | 179 (100.0%) | $104,688 |
Household Income in Bristol Bay Borough
Household Income Brackets in Bristol Bay Borough
With 61 households falling in the category, the $100,000 to $149,999 income range is the most frequent in Bristol Bay Borough, accounting for 21.5% of all households. In contrast, only 2 households (0.7%) fall into the less than $10,000 income bracket, making it the least populous group.
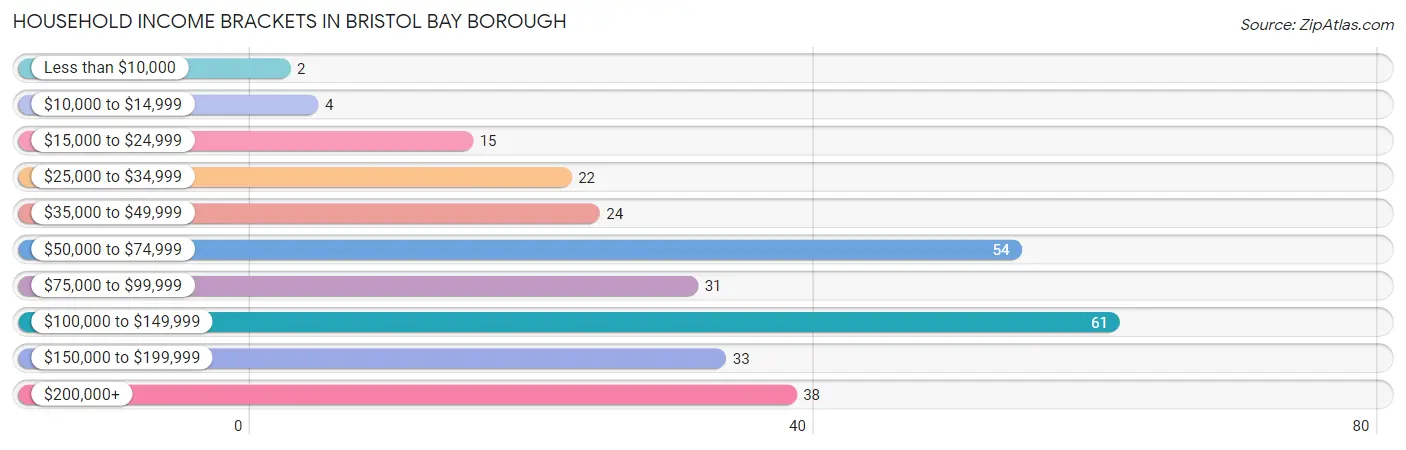
| Income Bracket | # Households | % Households |
| Less than $10,000 | 2 | 0.7% |
| $10,000 to $14,999 | 4 | 1.4% |
| $15,000 to $24,999 | 15 | 5.3% |
| $25,000 to $34,999 | 22 | 7.7% |
| $35,000 to $49,999 | 24 | 8.5% |
| $50,000 to $74,999 | 54 | 19.0% |
| $75,000 to $99,999 | 31 | 10.9% |
| $100,000 to $149,999 | 61 | 21.5% |
| $150,000 to $199,999 | 33 | 11.6% |
| $200,000+ | 38 | 13.4% |
Household Income by Householder Age in Bristol Bay Borough
The median household income in Bristol Bay Borough is $94,167, with the highest median household income of $115,833 found in the 25 to 44 years age bracket for the primary householder. A total of 98 households (34.5%) fall into this category. Meanwhile, the 15 to 24 years age bracket for the primary householder has the lowest median household income of $0, with 4 households (1.4%) in this group.
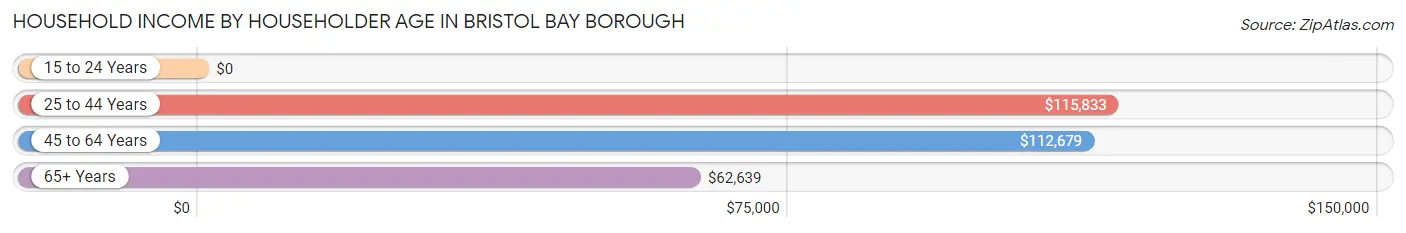
| Income Bracket | # Households | Median Income |
| 15 to 24 Years | 4 (1.4%) | $0 |
| 25 to 44 Years | 98 (34.5%) | $115,833 |
| 45 to 64 Years | 119 (41.9%) | $112,679 |
| 65+ Years | 63 (22.2%) | $62,639 |
| Total | 284 (100.0%) | $94,167 |
Poverty in Bristol Bay Borough
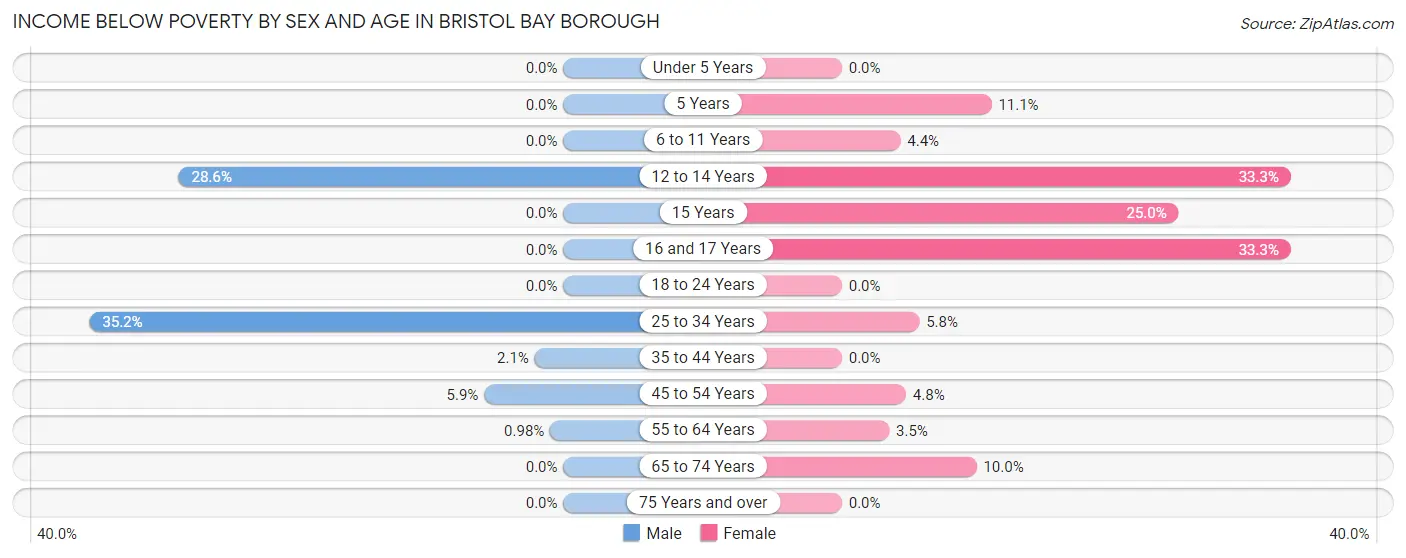
Income Below Poverty by Sex and Age in Bristol Bay Borough
With 9.3% poverty level for males and 6.1% for females among the residents of Bristol Bay Borough, 25 to 34 year old males and 12 to 14 year old females are the most vulnerable to poverty, with 38 males (35.2%) and 3 females (33.3%) in their respective age groups living below the poverty level.
| Age Bracket | Male | Female |
| Under 5 Years | 0 (0.0%) | 0 (0.0%) |
| 5 Years | 0 (0.0%) | 1 (11.1%) |
| 6 to 11 Years | 0 (0.0%) | 1 (4.3%) |
| 12 to 14 Years | 2 (28.6%) | 3 (33.3%) |
| 15 Years | 0 (0.0%) | 1 (25.0%) |
| 16 and 17 Years | 0 (0.0%) | 4 (33.3%) |
| 18 to 24 Years | 0 (0.0%) | 0 (0.0%) |
| 25 to 34 Years | 38 (35.2%) | 5 (5.8%) |
| 35 to 44 Years | 1 (2.1%) | 0 (0.0%) |
| 45 to 54 Years | 2 (5.9%) | 2 (4.8%) |
| 55 to 64 Years | 1 (1.0%) | 2 (3.5%) |
| 65 to 74 Years | 0 (0.0%) | 3 (10.0%) |
| 75 Years and over | 0 (0.0%) | 0 (0.0%) |
| Total | 44 (9.3%) | 22 (6.1%) |
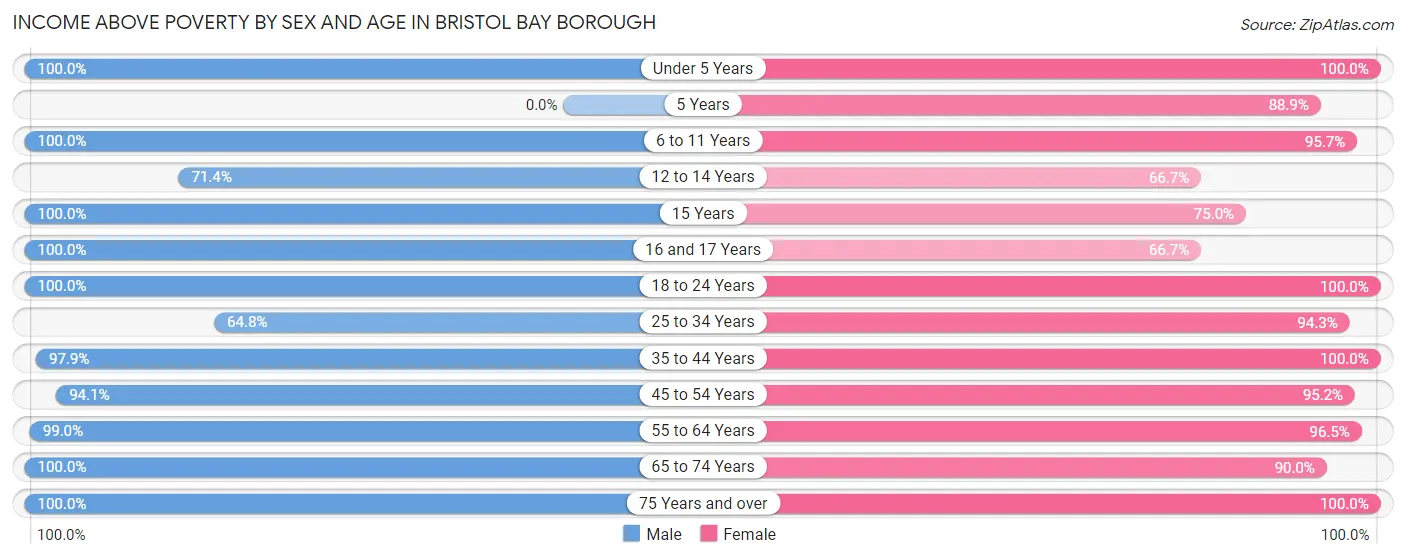
Income Above Poverty by Sex and Age in Bristol Bay Borough
According to the poverty statistics in Bristol Bay Borough, males aged under 5 years and females aged under 5 years are the age groups that are most secure financially, with 100.0% of males and 100.0% of females in these age groups living above the poverty line.
| Age Bracket | Male | Female |
| Under 5 Years | 45 (100.0%) | 18 (100.0%) |
| 5 Years | 0 (0.0%) | 8 (88.9%) |
| 6 to 11 Years | 15 (100.0%) | 22 (95.7%) |
| 12 to 14 Years | 5 (71.4%) | 6 (66.7%) |
| 15 Years | 10 (100.0%) | 3 (75.0%) |
| 16 and 17 Years | 4 (100.0%) | 8 (66.7%) |
| 18 to 24 Years | 37 (100.0%) | 11 (100.0%) |
| 25 to 34 Years | 70 (64.8%) | 82 (94.3%) |
| 35 to 44 Years | 46 (97.9%) | 48 (100.0%) |
| 45 to 54 Years | 32 (94.1%) | 40 (95.2%) |
| 55 to 64 Years | 101 (99.0%) | 55 (96.5%) |
| 65 to 74 Years | 33 (100.0%) | 27 (90.0%) |
| 75 Years and over | 32 (100.0%) | 13 (100.0%) |
| Total | 430 (90.7%) | 341 (93.9%) |
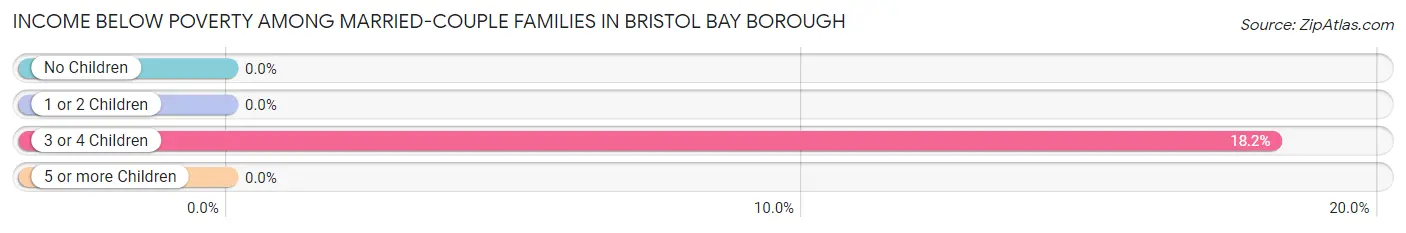
Income Below Poverty Among Married-Couple Families in Bristol Bay Borough
The poverty statistics for married-couple families in Bristol Bay Borough show that 1.3% or 2 of the total 152 families live below the poverty line. Families with 3 or 4 children have the highest poverty rate of 18.2%, comprising of 2 families. On the other hand, families with no children have the lowest poverty rate of 0.0%, which includes 0 families.
| Children | Above Poverty | Below Poverty |
| No Children | 109 (100.0%) | 0 (0.0%) |
| 1 or 2 Children | 27 (100.0%) | 0 (0.0%) |
| 3 or 4 Children | 9 (81.8%) | 2 (18.2%) |
| 5 or more Children | 5 (100.0%) | 0 (0.0%) |
| Total | 150 (98.7%) | 2 (1.3%) |
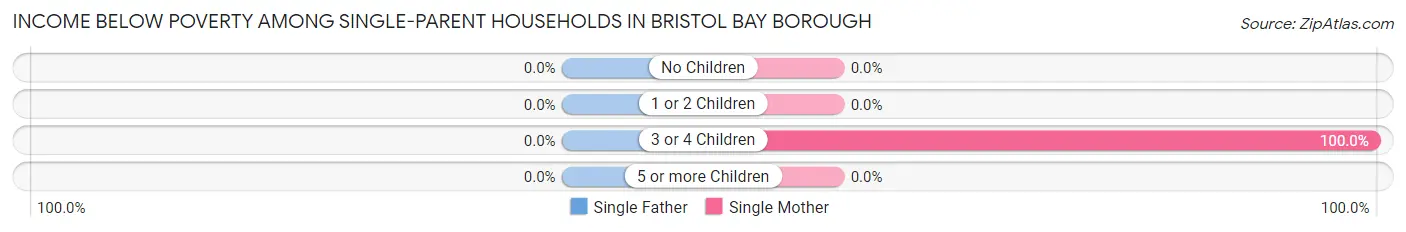
Income Below Poverty Among Single-Parent Households in Bristol Bay Borough
| Children | Single Father | Single Mother |
| No Children | 0 (0.0%) | 0 (0.0%) |
| 1 or 2 Children | 0 (0.0%) | 0 (0.0%) |
| 3 or 4 Children | 0 (0.0%) | 1 (100.0%) |
| 5 or more Children | 0 (0.0%) | 0 (0.0%) |
| Total | 0 (0.0%) | 1 (6.2%) |
Income Below Poverty Among Married-Couple vs Single-Parent Households in Bristol Bay Borough
The poverty data for Bristol Bay Borough shows that 2 of the married-couple family households (1.3%) and 1 of the single-parent households (3.7%) are living below the poverty level. Within the married-couple family households, those with 3 or 4 children have the highest poverty rate, with 2 households (18.2%) falling below the poverty line. Among the single-parent households, those with 3 or 4 children have the highest poverty rate, with 1 household (50.0%) living below poverty.
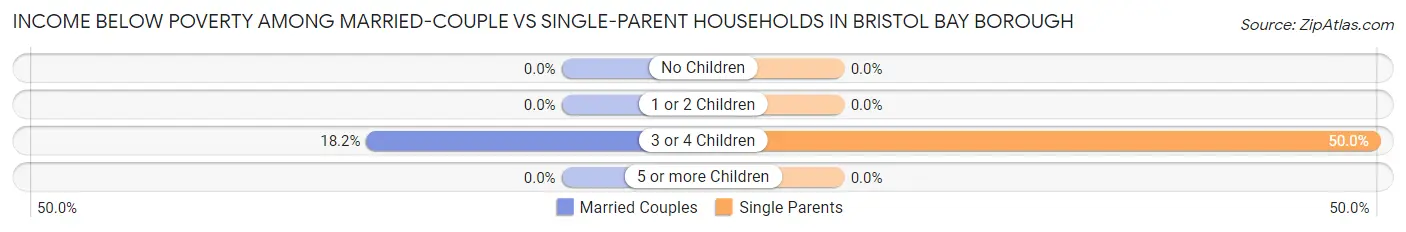
| Children | Married-Couple Families | Single-Parent Households |
| No Children | 0 (0.0%) | 0 (0.0%) |
| 1 or 2 Children | 0 (0.0%) | 0 (0.0%) |
| 3 or 4 Children | 2 (18.2%) | 1 (50.0%) |
| 5 or more Children | 0 (0.0%) | 0 (0.0%) |
| Total | 2 (1.3%) | 1 (3.7%) |
Employment Characteristics in Bristol Bay Borough
Employment by Class of Employer in Bristol Bay Borough
Among the 438 employed individuals in Bristol Bay Borough, private company employees (168 | 38.4%), local government employees (71 | 16.2%), and federal government employees (64 | 14.6%) make up the most common classes of employment.
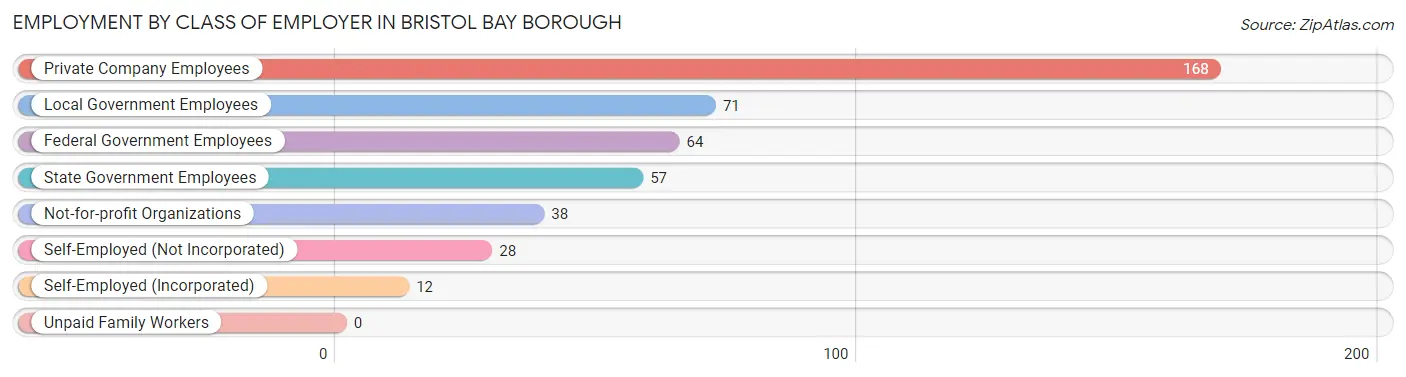
| Employer Class | # Employees | % Employees |
| Private Company Employees | 168 | 38.4% |
| Self-Employed (Incorporated) | 12 | 2.7% |
| Self-Employed (Not Incorporated) | 28 | 6.4% |
| Not-for-profit Organizations | 38 | 8.7% |
| Local Government Employees | 71 | 16.2% |
| State Government Employees | 57 | 13.0% |
| Federal Government Employees | 64 | 14.6% |
| Unpaid Family Workers | 0 | 0.0% |
| Total | 438 | 100.0% |
Employment Status by Age in Bristol Bay Borough
According to the labor force statistics for Bristol Bay Borough, out of the total population over 16 years of age (707), 63.6% or 450 individuals are in the labor force, with 2.7% or 12 of them unemployed. The age group with the highest labor force participation rate is 20 to 24 years, with 95.6% or 43 individuals in the labor force. Within the labor force, the 20 to 24 years age range has the highest percentage of unemployed individuals, with 23.5% or 10 of them being unemployed.
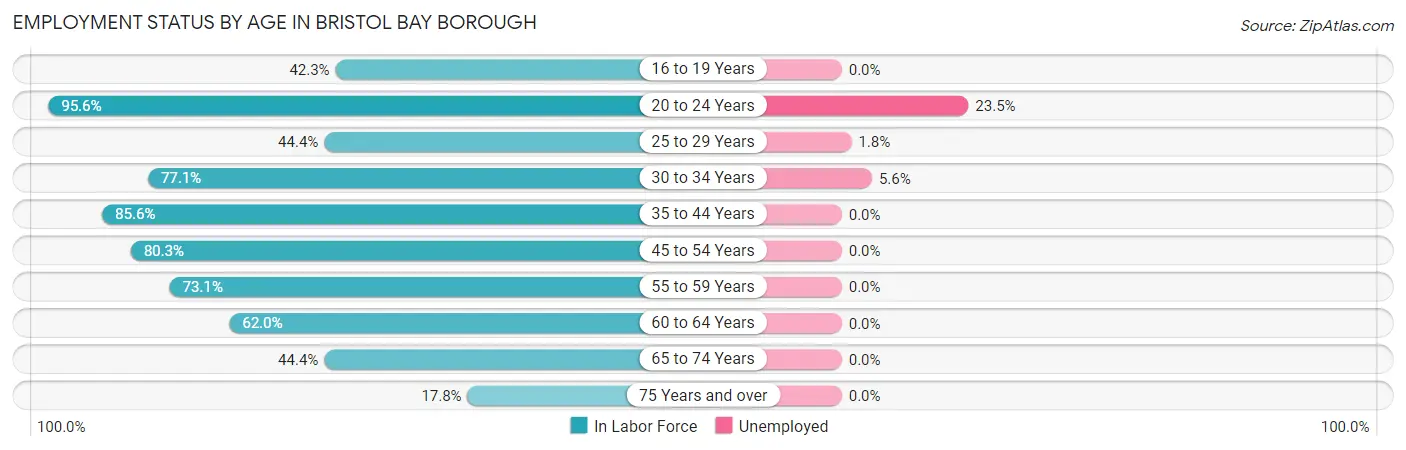
| Age Bracket | In Labor Force | Unemployed |
| 16 to 19 Years | 11 (42.3%) | 0 (0.0%) |
| 20 to 24 Years | 43 (95.6%) | 10 (23.5%) |
| 25 to 29 Years | 56 (44.4%) | 1 (1.8%) |
| 30 to 34 Years | 54 (77.1%) | 3 (5.6%) |
| 35 to 44 Years | 83 (85.6%) | 0 (0.0%) |
| 45 to 54 Years | 61 (80.3%) | 0 (0.0%) |
| 55 to 59 Years | 49 (73.1%) | 0 (0.0%) |
| 60 to 64 Years | 57 (62.0%) | 0 (0.0%) |
| 65 to 74 Years | 28 (44.4%) | 0 (0.0%) |
| 75 Years and over | 8 (17.8%) | 0 (0.0%) |
| Total | 450 (63.6%) | 12 (2.7%) |
Employment Status by Educational Attainment in Bristol Bay Borough
According to labor force statistics for Bristol Bay Borough, 68.2% of individuals (360) out of the total population between 25 and 64 years of age (528) are in the labor force, with 1.1% or 4 of them being unemployed. The group with the highest labor force participation rate are those with the educational attainment of less than high school, with 94.1% or 16 individuals in the labor force. Within the labor force, individuals with college / associate degree education have the highest percentage of unemployment, with 2.4% or 4 of them being unemployed.
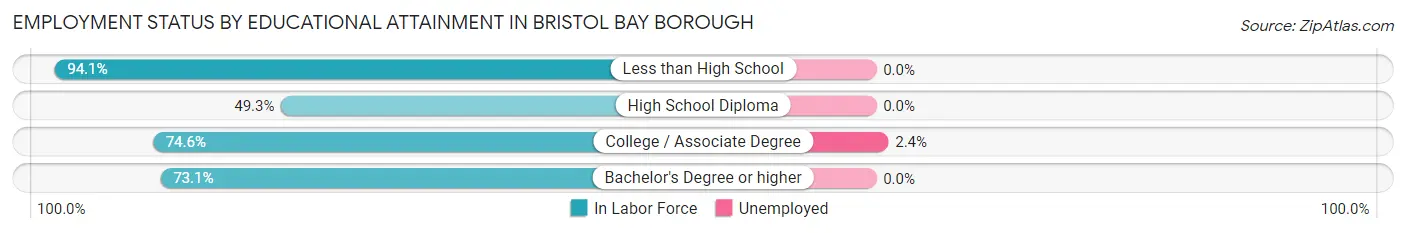
| Educational Attainment | In Labor Force | Unemployed |
| Less than High School | 16 (94.1%) | 0 (0.0%) |
| High School Diploma | 68 (49.3%) | 0 (0.0%) |
| College / Associate Degree | 170 (74.6%) | 5 (2.4%) |
| Bachelor's Degree or higher | 106 (73.1%) | 0 (0.0%) |
| Total | 360 (68.2%) | 6 (1.1%) |
Employment Occupations by Sex in Bristol Bay Borough
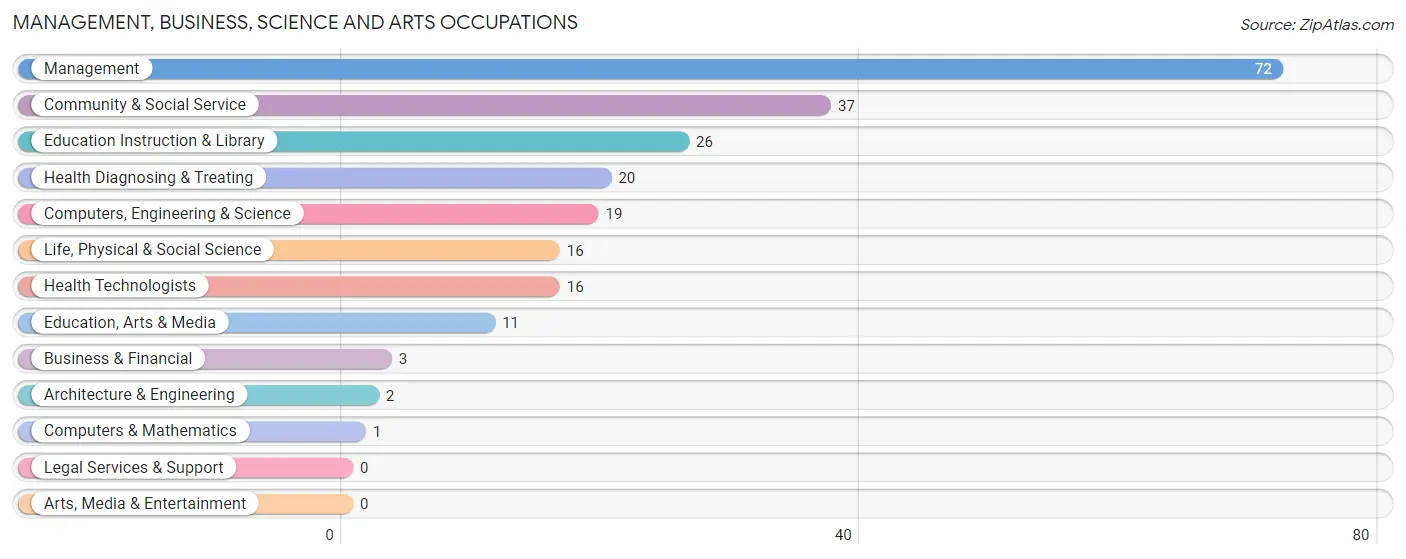
Management, Business, Science and Arts Occupations
The most common Management, Business, Science and Arts occupations in Bristol Bay Borough are Management (72 | 16.9%), Community & Social Service (37 | 8.7%), Education Instruction & Library (26 | 6.1%), Health Diagnosing & Treating (20 | 4.7%), and Computers, Engineering & Science (19 | 4.5%).
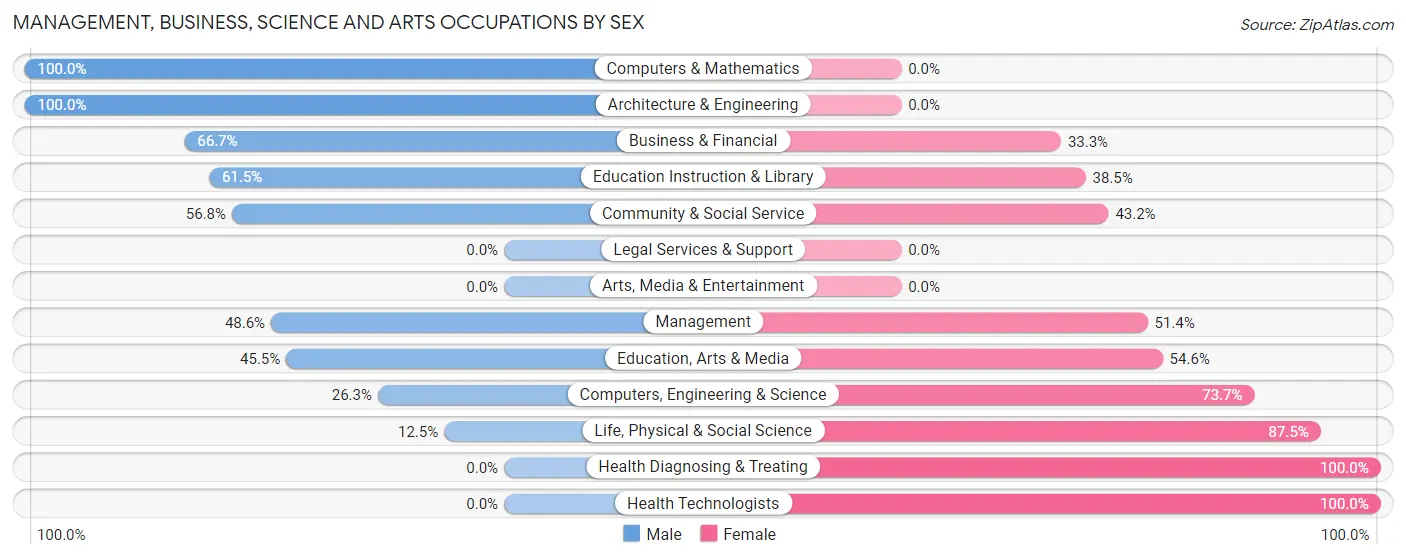
Management, Business, Science and Arts Occupations by Sex
Within the Management, Business, Science and Arts occupations in Bristol Bay Borough, the most male-oriented occupations are Computers & Mathematics (100.0%), Architecture & Engineering (100.0%), and Business & Financial (66.7%), while the most female-oriented occupations are Health Diagnosing & Treating (100.0%), Health Technologists (100.0%), and Life, Physical & Social Science (87.5%).
| Occupation | Male | Female |
| Management | 35 (48.6%) | 37 (51.4%) |
| Business & Financial | 2 (66.7%) | 1 (33.3%) |
| Computers, Engineering & Science | 5 (26.3%) | 14 (73.7%) |
| Computers & Mathematics | 1 (100.0%) | 0 (0.0%) |
| Architecture & Engineering | 2 (100.0%) | 0 (0.0%) |
| Life, Physical & Social Science | 2 (12.5%) | 14 (87.5%) |
| Community & Social Service | 21 (56.8%) | 16 (43.2%) |
| Education, Arts & Media | 5 (45.5%) | 6 (54.5%) |
| Legal Services & Support | 0 (0.0%) | 0 (0.0%) |
| Education Instruction & Library | 16 (61.5%) | 10 (38.5%) |
| Arts, Media & Entertainment | 0 (0.0%) | 0 (0.0%) |
| Health Diagnosing & Treating | 0 (0.0%) | 20 (100.0%) |
| Health Technologists | 0 (0.0%) | 16 (100.0%) |
| Total (Category) | 63 (41.7%) | 88 (58.3%) |
| Total (Overall) | 230 (54.1%) | 195 (45.9%) |
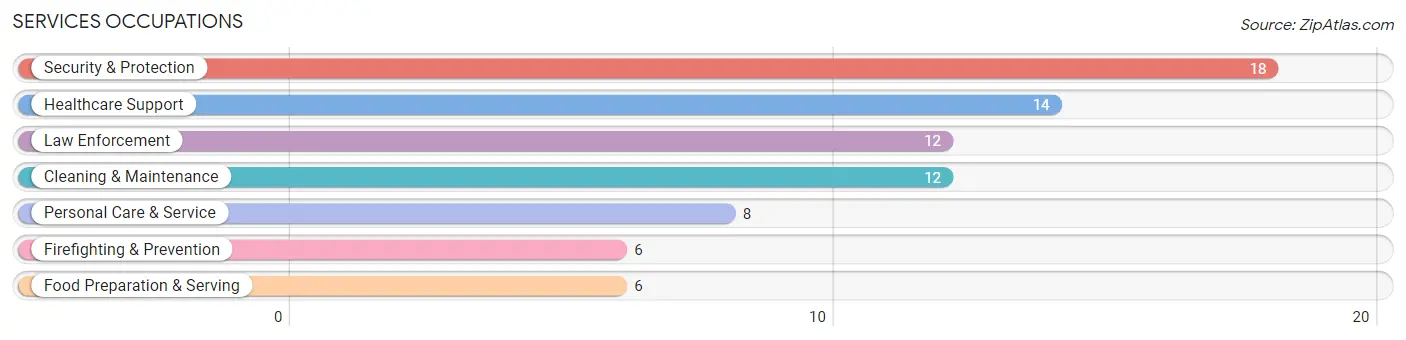
Services Occupations
The most common Services occupations in Bristol Bay Borough are Security & Protection (18 | 4.2%), Healthcare Support (14 | 3.3%), Law Enforcement (12 | 2.8%), Cleaning & Maintenance (12 | 2.8%), and Personal Care & Service (8 | 1.9%).
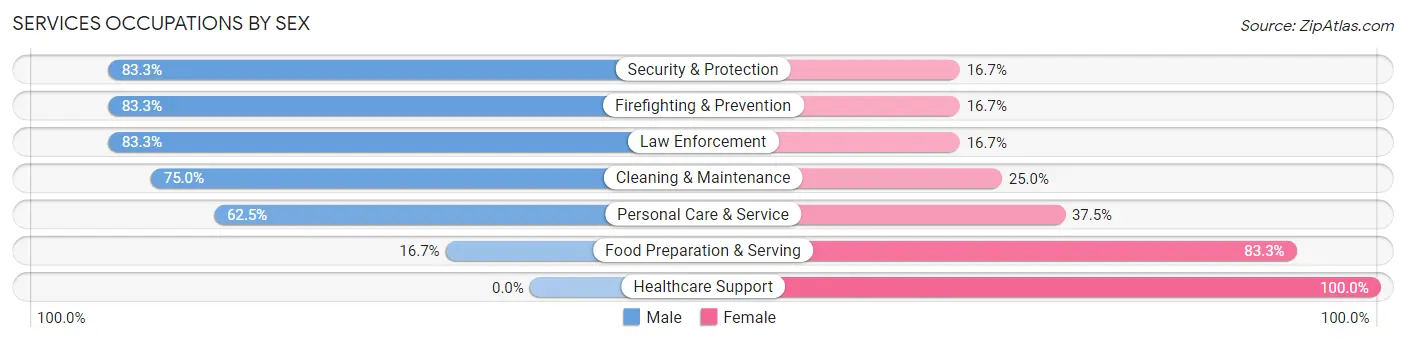
Services Occupations by Sex
Within the Services occupations in Bristol Bay Borough, the most male-oriented occupations are Security & Protection (83.3%), Firefighting & Prevention (83.3%), and Law Enforcement (83.3%), while the most female-oriented occupations are Healthcare Support (100.0%), Food Preparation & Serving (83.3%), and Personal Care & Service (37.5%).
| Occupation | Male | Female |
| Healthcare Support | 0 (0.0%) | 14 (100.0%) |
| Security & Protection | 15 (83.3%) | 3 (16.7%) |
| Firefighting & Prevention | 5 (83.3%) | 1 (16.7%) |
| Law Enforcement | 10 (83.3%) | 2 (16.7%) |
| Food Preparation & Serving | 1 (16.7%) | 5 (83.3%) |
| Cleaning & Maintenance | 9 (75.0%) | 3 (25.0%) |
| Personal Care & Service | 5 (62.5%) | 3 (37.5%) |
| Total (Category) | 30 (51.7%) | 28 (48.3%) |
| Total (Overall) | 230 (54.1%) | 195 (45.9%) |
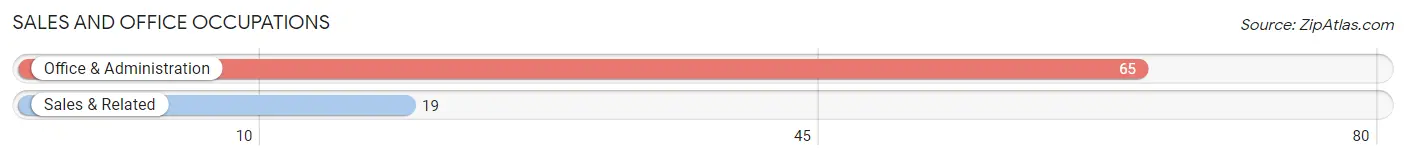
Sales and Office Occupations
The most common Sales and Office occupations in Bristol Bay Borough are Office & Administration (65 | 15.3%), and Sales & Related (19 | 4.5%).
Sales and Office Occupations by Sex
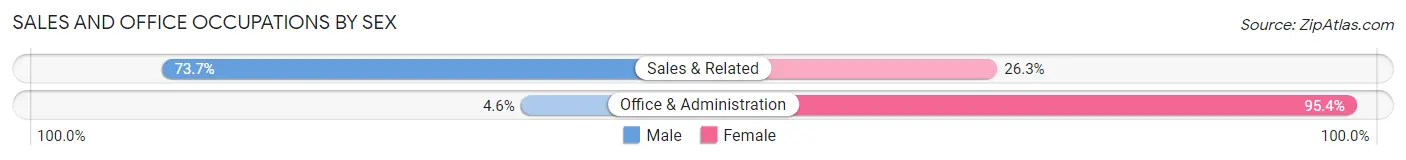
| Occupation | Male | Female |
| Sales & Related | 14 (73.7%) | 5 (26.3%) |
| Office & Administration | 3 (4.6%) | 62 (95.4%) |
| Total (Category) | 17 (20.2%) | 67 (79.8%) |
| Total (Overall) | 230 (54.1%) | 195 (45.9%) |
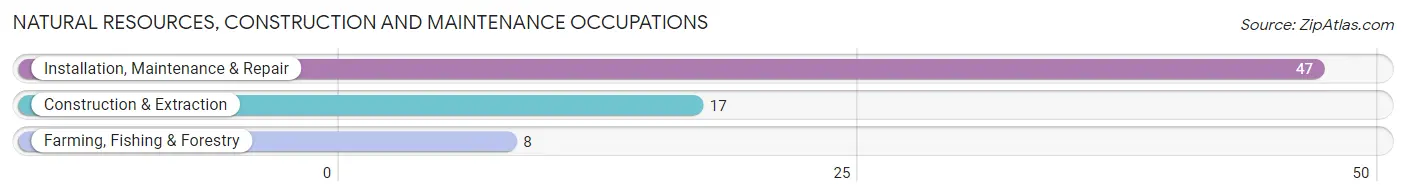
Natural Resources, Construction and Maintenance Occupations
The most common Natural Resources, Construction and Maintenance occupations in Bristol Bay Borough are Installation, Maintenance & Repair (47 | 11.1%), Construction & Extraction (17 | 4.0%), and Farming, Fishing & Forestry (8 | 1.9%).
Natural Resources, Construction and Maintenance Occupations by Sex
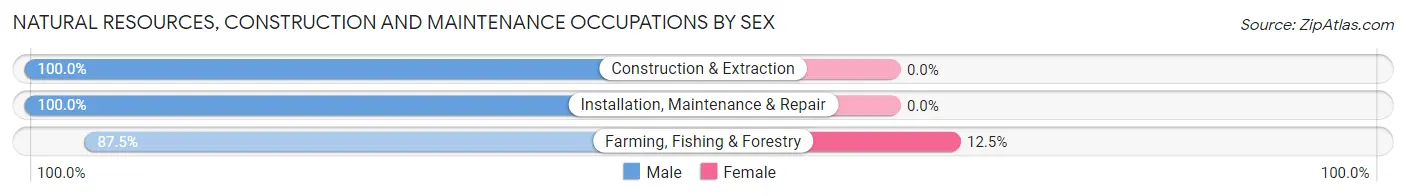
| Occupation | Male | Female |
| Farming, Fishing & Forestry | 7 (87.5%) | 1 (12.5%) |
| Construction & Extraction | 17 (100.0%) | 0 (0.0%) |
| Installation, Maintenance & Repair | 47 (100.0%) | 0 (0.0%) |
| Total (Category) | 71 (98.6%) | 1 (1.4%) |
| Total (Overall) | 230 (54.1%) | 195 (45.9%) |
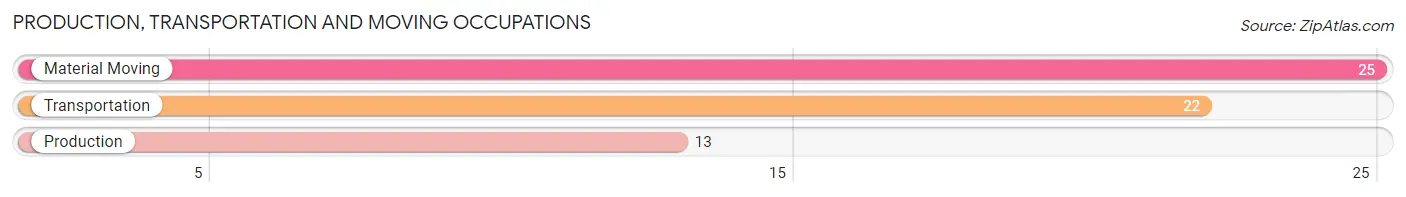
Production, Transportation and Moving Occupations
The most common Production, Transportation and Moving occupations in Bristol Bay Borough are Material Moving (25 | 5.9%), Transportation (22 | 5.2%), and Production (13 | 3.1%).
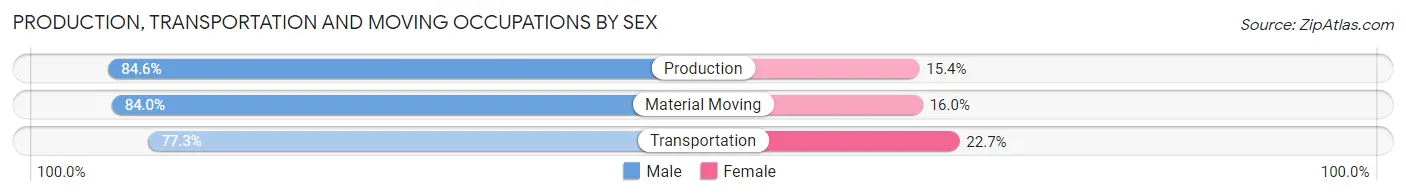
Production, Transportation and Moving Occupations by Sex
| Occupation | Male | Female |
| Production | 11 (84.6%) | 2 (15.4%) |
| Transportation | 17 (77.3%) | 5 (22.7%) |
| Material Moving | 21 (84.0%) | 4 (16.0%) |
| Total (Category) | 49 (81.7%) | 11 (18.3%) |
| Total (Overall) | 230 (54.1%) | 195 (45.9%) |
Employment Industries by Sex in Bristol Bay Borough
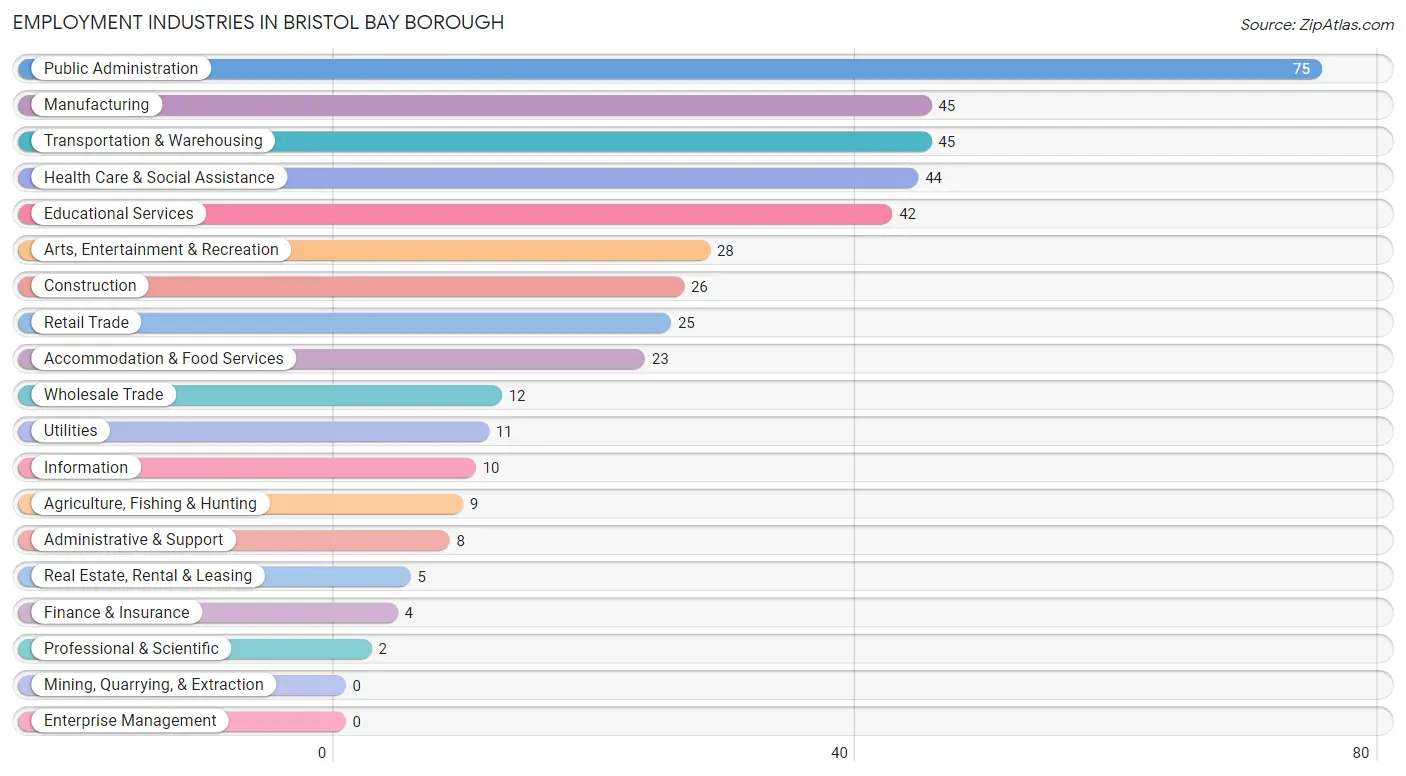
Employment Industries in Bristol Bay Borough
The major employment industries in Bristol Bay Borough include Public Administration (75 | 17.6%), Manufacturing (45 | 10.6%), Transportation & Warehousing (45 | 10.6%), Health Care & Social Assistance (44 | 10.3%), and Educational Services (42 | 9.9%).
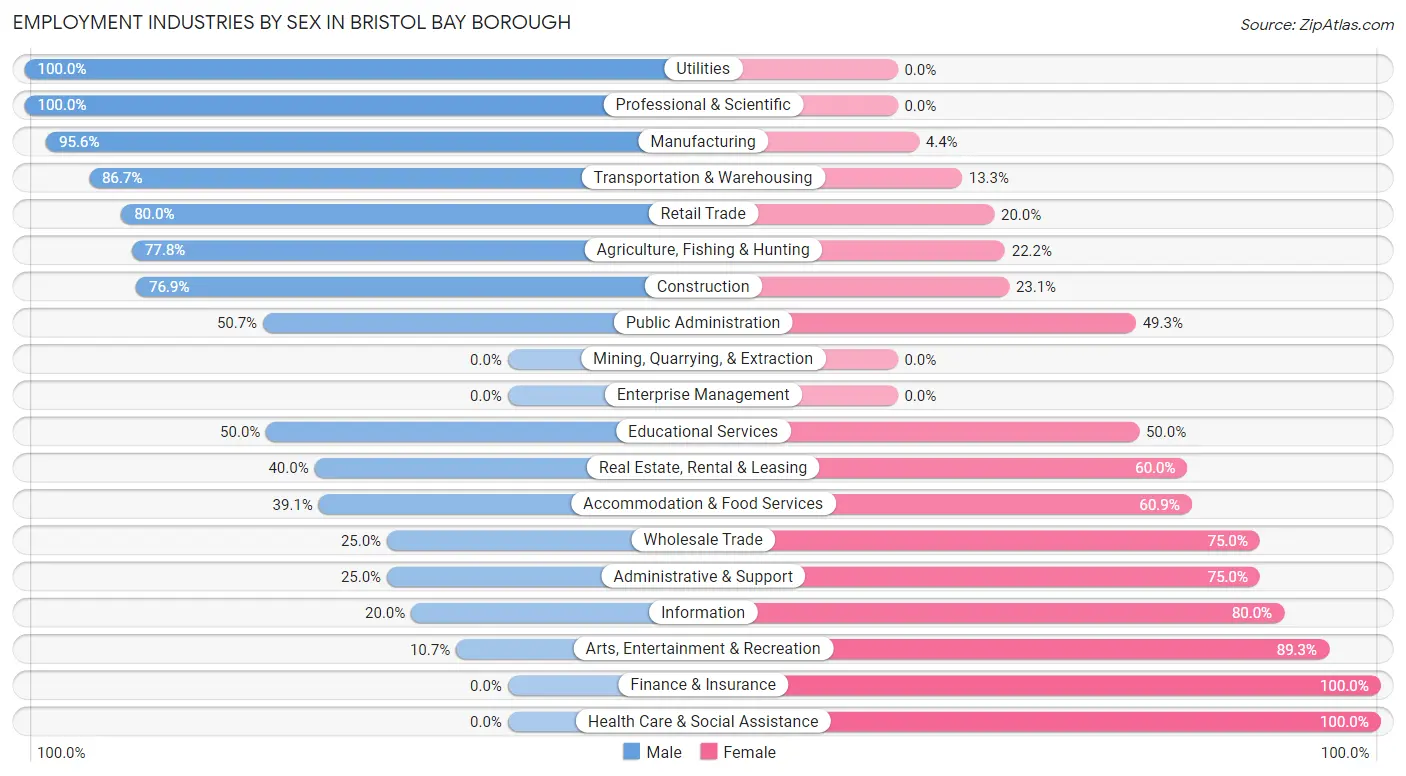
Employment Industries by Sex in Bristol Bay Borough
The Bristol Bay Borough industries that see more men than women are Utilities (100.0%), Professional & Scientific (100.0%), and Manufacturing (95.6%), whereas the industries that tend to have a higher number of women are Finance & Insurance (100.0%), Health Care & Social Assistance (100.0%), and Arts, Entertainment & Recreation (89.3%).
| Industry | Male | Female |
| Agriculture, Fishing & Hunting | 7 (77.8%) | 2 (22.2%) |
| Mining, Quarrying, & Extraction | 0 (0.0%) | 0 (0.0%) |
| Construction | 20 (76.9%) | 6 (23.1%) |
| Manufacturing | 43 (95.6%) | 2 (4.4%) |
| Wholesale Trade | 3 (25.0%) | 9 (75.0%) |
| Retail Trade | 20 (80.0%) | 5 (20.0%) |
| Transportation & Warehousing | 39 (86.7%) | 6 (13.3%) |
| Utilities | 11 (100.0%) | 0 (0.0%) |
| Information | 2 (20.0%) | 8 (80.0%) |
| Finance & Insurance | 0 (0.0%) | 4 (100.0%) |
| Real Estate, Rental & Leasing | 2 (40.0%) | 3 (60.0%) |
| Professional & Scientific | 2 (100.0%) | 0 (0.0%) |
| Enterprise Management | 0 (0.0%) | 0 (0.0%) |
| Administrative & Support | 2 (25.0%) | 6 (75.0%) |
| Educational Services | 21 (50.0%) | 21 (50.0%) |
| Health Care & Social Assistance | 0 (0.0%) | 44 (100.0%) |
| Arts, Entertainment & Recreation | 3 (10.7%) | 25 (89.3%) |
| Accommodation & Food Services | 9 (39.1%) | 14 (60.9%) |
| Public Administration | 38 (50.7%) | 37 (49.3%) |
| Total | 230 (54.1%) | 195 (45.9%) |
Education in Bristol Bay Borough
School Enrollment in Bristol Bay Borough
The most common levels of schooling among the 139 students in Bristol Bay Borough are high school (39 | 28.1%), elementary school (28 | 20.1%), and middle school (23 | 16.6%).
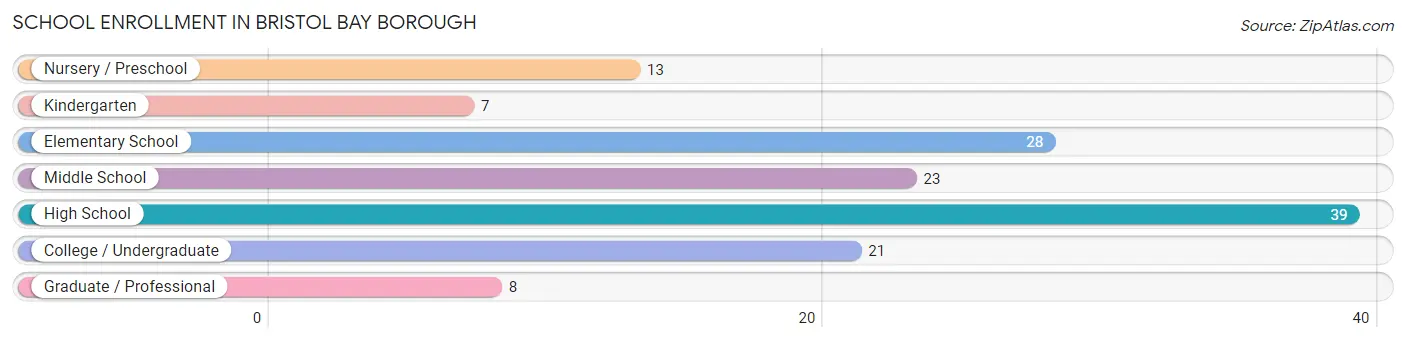
| School Level | # Students | % Students |
| Nursery / Preschool | 13 | 9.3% |
| Kindergarten | 7 | 5.0% |
| Elementary School | 28 | 20.1% |
| Middle School | 23 | 16.6% |
| High School | 39 | 28.1% |
| College / Undergraduate | 21 | 15.1% |
| Graduate / Professional | 8 | 5.8% |
| Total | 139 | 100.0% |
School Enrollment by Age by Funding Source in Bristol Bay Borough
Out of a total of 139 students who are enrolled in schools in Bristol Bay Borough, 20 (14.4%) attend a private institution, while the remaining 119 (85.6%) are enrolled in public schools. The age group of 35 years and over has the highest likelihood of being enrolled in private schools, with 5 (55.6% in the age bracket) enrolled. Conversely, the age group of 3 to 4 year olds has the lowest likelihood of being enrolled in a private school, with 16 (100.0% in the age bracket) attending a public institution.
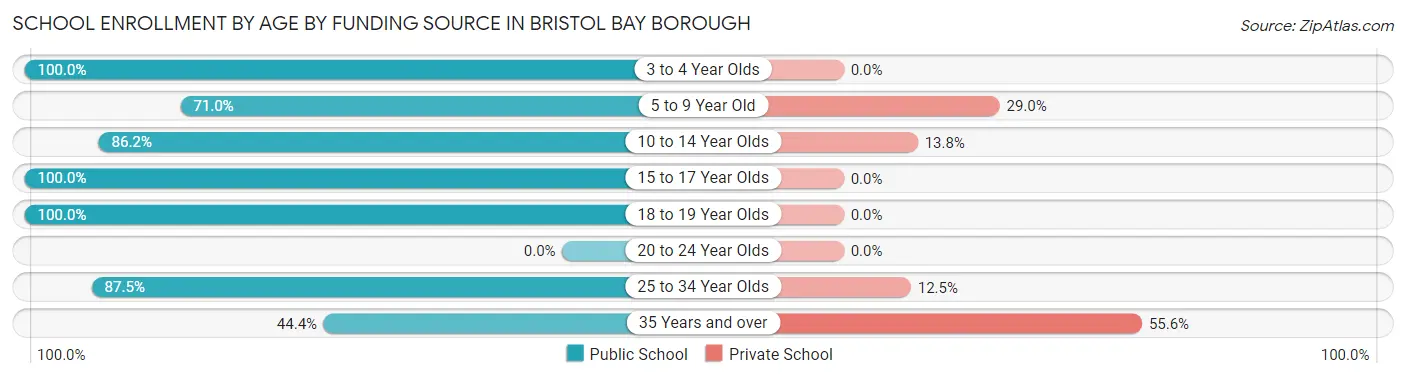
| Age Bracket | Public School | Private School |
| 3 to 4 Year Olds | 16 (100.0%) | 0 (0.0%) |
| 5 to 9 Year Old | 22 (71.0%) | 9 (29.0%) |
| 10 to 14 Year Olds | 25 (86.2%) | 4 (13.8%) |
| 15 to 17 Year Olds | 30 (100.0%) | 0 (0.0%) |
| 18 to 19 Year Olds | 8 (100.0%) | 0 (0.0%) |
| 20 to 24 Year Olds | 0 (0.0%) | 0 (0.0%) |
| 25 to 34 Year Olds | 14 (87.5%) | 2 (12.5%) |
| 35 Years and over | 4 (44.4%) | 5 (55.6%) |
| Total | 119 (85.6%) | 20 (14.4%) |
Educational Attainment by Field of Study in Bristol Bay Borough
Social sciences (54 | 30.2%), bio, nature & agricultural (25 | 14.0%), education (24 | 13.4%), science & technology (18 | 10.1%), and arts & humanities (15 | 8.4%) are the most common fields of study among 179 individuals in Bristol Bay Borough who have obtained a bachelor's degree or higher.
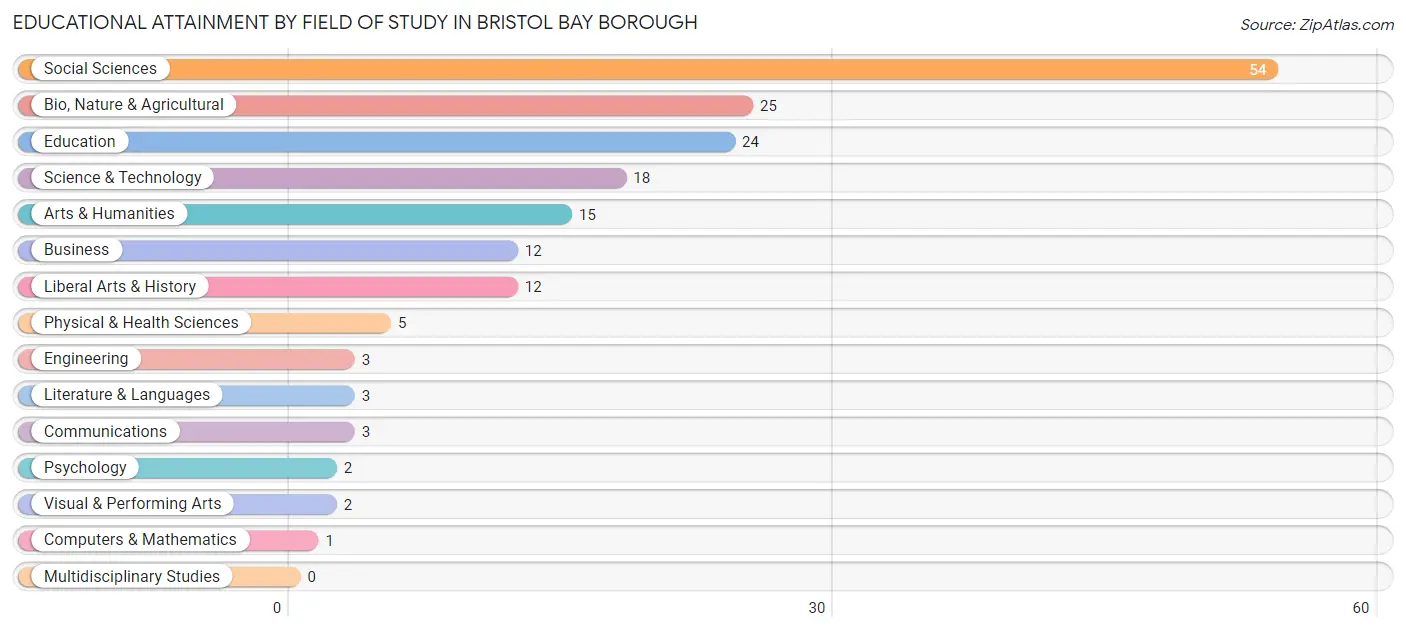
| Field of Study | # Graduates | % Graduates |
| Computers & Mathematics | 1 | 0.6% |
| Bio, Nature & Agricultural | 25 | 14.0% |
| Physical & Health Sciences | 5 | 2.8% |
| Psychology | 2 | 1.1% |
| Social Sciences | 54 | 30.2% |
| Engineering | 3 | 1.7% |
| Multidisciplinary Studies | 0 | 0.0% |
| Science & Technology | 18 | 10.1% |
| Business | 12 | 6.7% |
| Education | 24 | 13.4% |
| Literature & Languages | 3 | 1.7% |
| Liberal Arts & History | 12 | 6.7% |
| Visual & Performing Arts | 2 | 1.1% |
| Communications | 3 | 1.7% |
| Arts & Humanities | 15 | 8.4% |
| Total | 179 | 100.0% |
Transportation & Commute in Bristol Bay Borough
Vehicle Availability by Sex in Bristol Bay Borough
The most prevalent vehicle ownership categories in Bristol Bay Borough are males with 1 vehicle (49, accounting for 27.8%) and females with 1 vehicle (55, making up 25.1%).
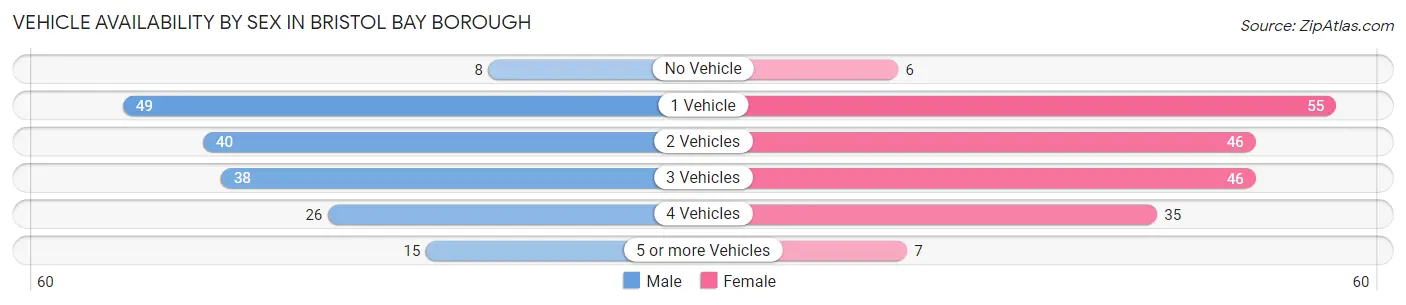
| Vehicles Available | Male | Female |
| No Vehicle | 8 (4.5%) | 6 (3.1%) |
| 1 Vehicle | 49 (27.8%) | 55 (28.2%) |
| 2 Vehicles | 40 (22.7%) | 46 (23.6%) |
| 3 Vehicles | 38 (21.6%) | 46 (23.6%) |
| 4 Vehicles | 26 (14.8%) | 35 (17.9%) |
| 5 or more Vehicles | 15 (8.5%) | 7 (3.6%) |
| Total | 176 (100.0%) | 195 (100.0%) |
Commute Time in Bristol Bay Borough
The most frequently occuring commute durations in Bristol Bay Borough are 5 to 9 minutes (167 commuters, 42.0%), 10 to 14 minutes (87 commuters, 21.9%), and less than 5 minutes (47 commuters, 11.8%).
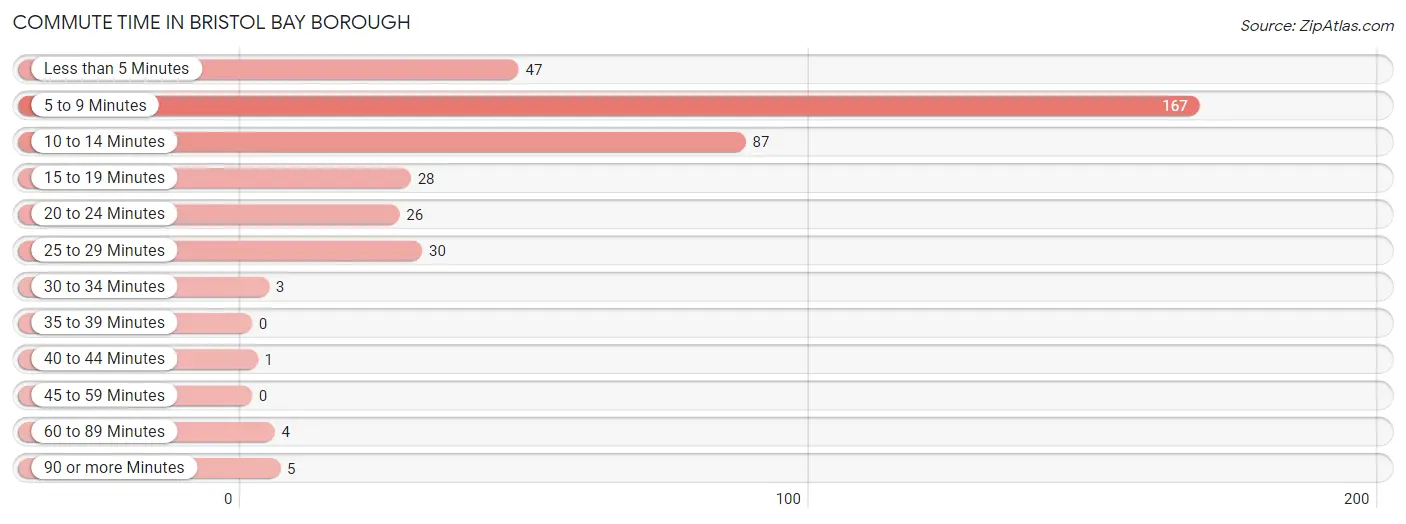
| Commute Time | # Commuters | % Commuters |
| Less than 5 Minutes | 47 | 11.8% |
| 5 to 9 Minutes | 167 | 42.0% |
| 10 to 14 Minutes | 87 | 21.9% |
| 15 to 19 Minutes | 28 | 7.0% |
| 20 to 24 Minutes | 26 | 6.5% |
| 25 to 29 Minutes | 30 | 7.5% |
| 30 to 34 Minutes | 3 | 0.7% |
| 35 to 39 Minutes | 0 | 0.0% |
| 40 to 44 Minutes | 1 | 0.3% |
| 45 to 59 Minutes | 0 | 0.0% |
| 60 to 89 Minutes | 4 | 1.0% |
| 90 or more Minutes | 5 | 1.3% |
Commute Time by Sex in Bristol Bay Borough
The most common commute times in Bristol Bay Borough are 5 to 9 minutes (110 commuters, 49.8%) for males and 5 to 9 minutes (57 commuters, 32.2%) for females.
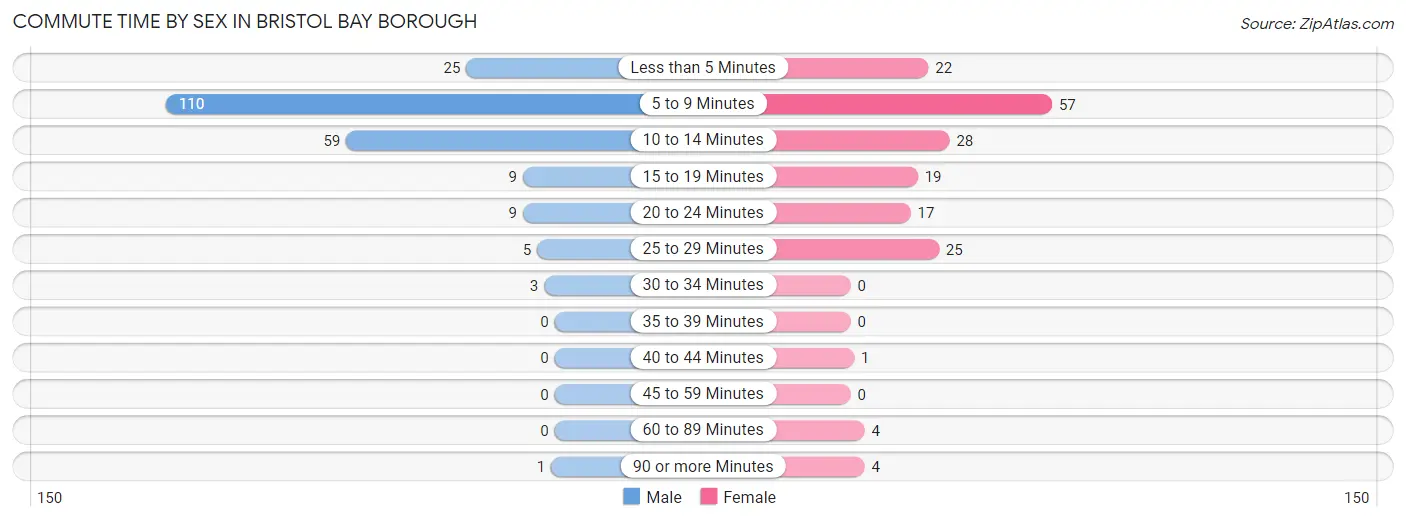
| Commute Time | Male | Female |
| Less than 5 Minutes | 25 (11.3%) | 22 (12.4%) |
| 5 to 9 Minutes | 110 (49.8%) | 57 (32.2%) |
| 10 to 14 Minutes | 59 (26.7%) | 28 (15.8%) |
| 15 to 19 Minutes | 9 (4.1%) | 19 (10.7%) |
| 20 to 24 Minutes | 9 (4.1%) | 17 (9.6%) |
| 25 to 29 Minutes | 5 (2.3%) | 25 (14.1%) |
| 30 to 34 Minutes | 3 (1.4%) | 0 (0.0%) |
| 35 to 39 Minutes | 0 (0.0%) | 0 (0.0%) |
| 40 to 44 Minutes | 0 (0.0%) | 1 (0.6%) |
| 45 to 59 Minutes | 0 (0.0%) | 0 (0.0%) |
| 60 to 89 Minutes | 0 (0.0%) | 4 (2.3%) |
| 90 or more Minutes | 1 (0.4%) | 4 (2.3%) |
Time of Departure to Work by Sex in Bristol Bay Borough
The most frequent times of departure to work in Bristol Bay Borough are 7:30 AM to 7:59 AM (37, 16.7%) for males and 7:30 AM to 7:59 AM (73, 41.2%) for females.
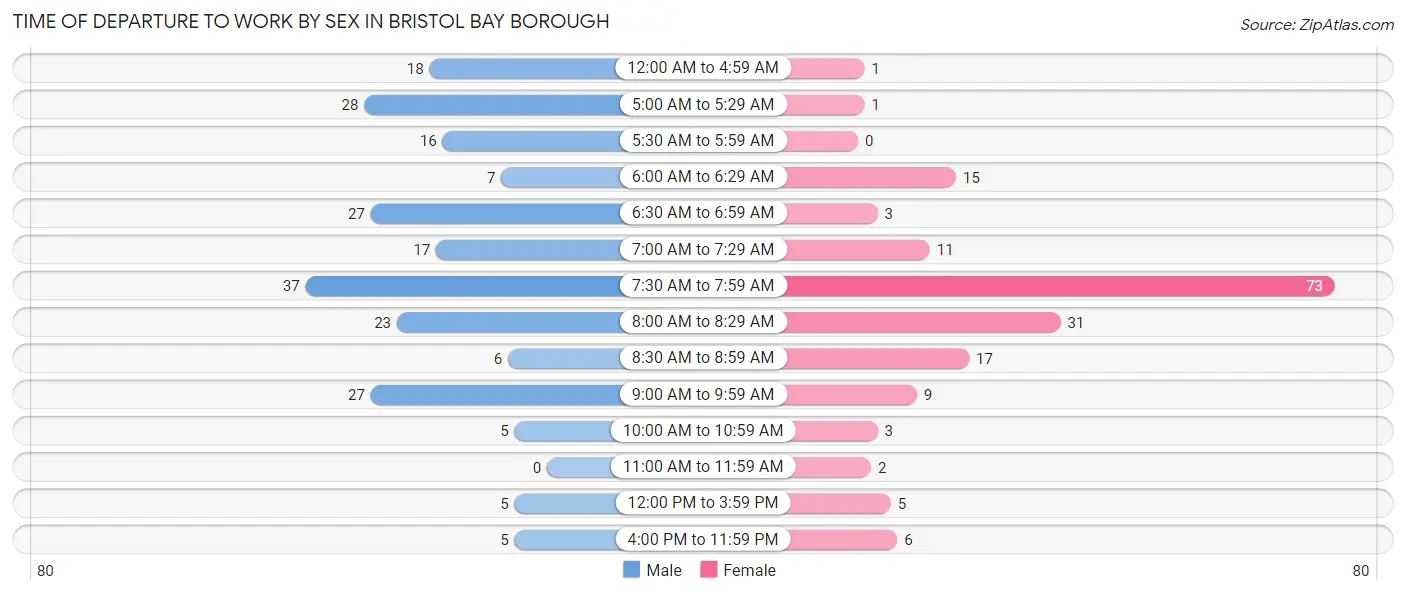
| Time of Departure | Male | Female |
| 12:00 AM to 4:59 AM | 18 (8.1%) | 1 (0.6%) |
| 5:00 AM to 5:29 AM | 28 (12.7%) | 1 (0.6%) |
| 5:30 AM to 5:59 AM | 16 (7.2%) | 0 (0.0%) |
| 6:00 AM to 6:29 AM | 7 (3.2%) | 15 (8.5%) |
| 6:30 AM to 6:59 AM | 27 (12.2%) | 3 (1.7%) |
| 7:00 AM to 7:29 AM | 17 (7.7%) | 11 (6.2%) |
| 7:30 AM to 7:59 AM | 37 (16.7%) | 73 (41.2%) |
| 8:00 AM to 8:29 AM | 23 (10.4%) | 31 (17.5%) |
| 8:30 AM to 8:59 AM | 6 (2.7%) | 17 (9.6%) |
| 9:00 AM to 9:59 AM | 27 (12.2%) | 9 (5.1%) |
| 10:00 AM to 10:59 AM | 5 (2.3%) | 3 (1.7%) |
| 11:00 AM to 11:59 AM | 0 (0.0%) | 2 (1.1%) |
| 12:00 PM to 3:59 PM | 5 (2.3%) | 5 (2.8%) |
| 4:00 PM to 11:59 PM | 5 (2.3%) | 6 (3.4%) |
| Total | 221 (100.0%) | 177 (100.0%) |
Housing Occupancy in Bristol Bay Borough
Occupancy by Ownership in Bristol Bay Borough
Of the total 284 dwellings in Bristol Bay Borough, owner-occupied units account for 144 (50.7%), while renter-occupied units make up 140 (49.3%).
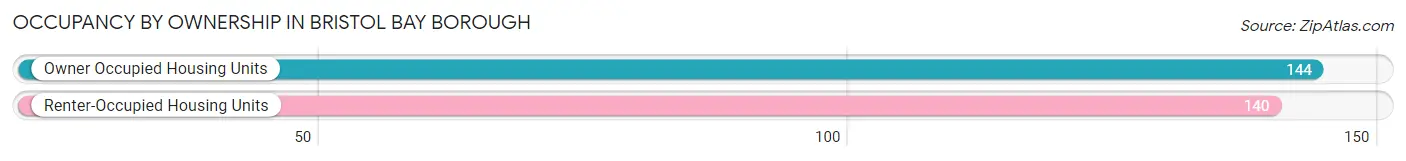
| Occupancy | # Housing Units | % Housing Units |
| Owner Occupied Housing Units | 144 | 50.7% |
| Renter-Occupied Housing Units | 140 | 49.3% |
| Total Occupied Housing Units | 284 | 100.0% |
Occupancy by Household Size in Bristol Bay Borough
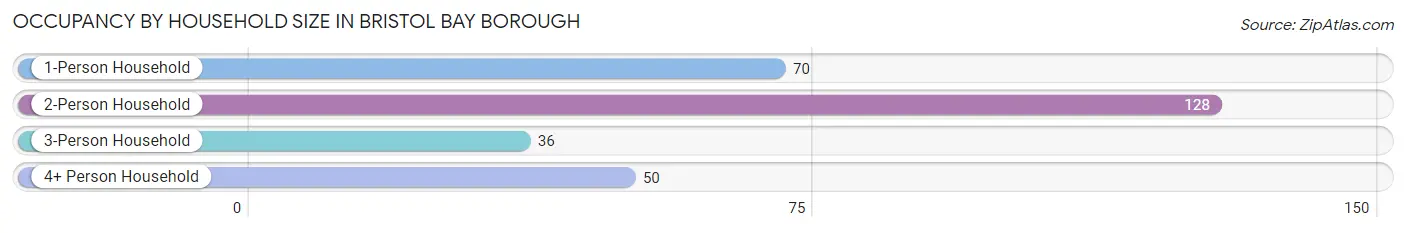
| Household Size | # Housing Units | % Housing Units |
| 1-Person Household | 70 | 24.6% |
| 2-Person Household | 128 | 45.1% |
| 3-Person Household | 36 | 12.7% |
| 4+ Person Household | 50 | 17.6% |
| Total Housing Units | 284 | 100.0% |
Occupancy by Ownership by Household Size in Bristol Bay Borough
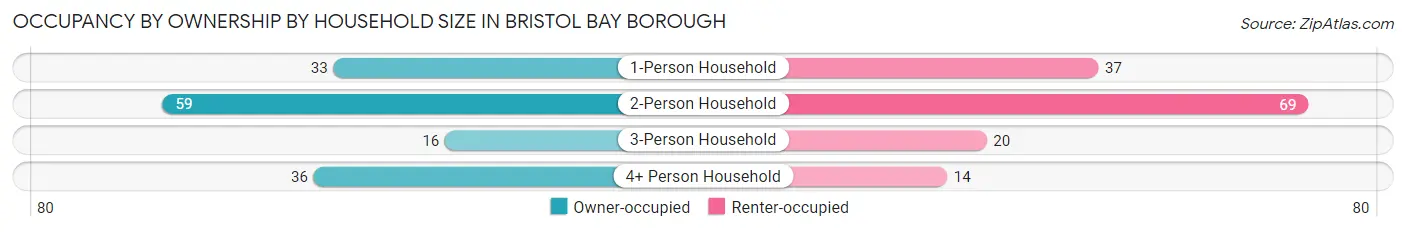
| Household Size | Owner-occupied | Renter-occupied |
| 1-Person Household | 33 (47.1%) | 37 (52.9%) |
| 2-Person Household | 59 (46.1%) | 69 (53.9%) |
| 3-Person Household | 16 (44.4%) | 20 (55.6%) |
| 4+ Person Household | 36 (72.0%) | 14 (28.0%) |
| Total Housing Units | 144 (50.7%) | 140 (49.3%) |
Occupancy by Educational Attainment in Bristol Bay Borough
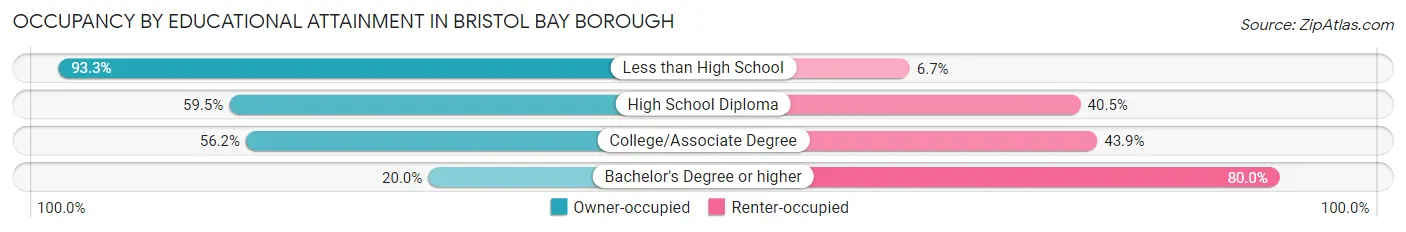
| Household Size | Owner-occupied | Renter-occupied |
| Less than High School | 14 (93.3%) | 1 (6.7%) |
| High School Diploma | 44 (59.5%) | 30 (40.5%) |
| College/Associate Degree | 73 (56.1%) | 57 (43.9%) |
| Bachelor's Degree or higher | 13 (20.0%) | 52 (80.0%) |
Occupancy by Age of Householder in Bristol Bay Borough
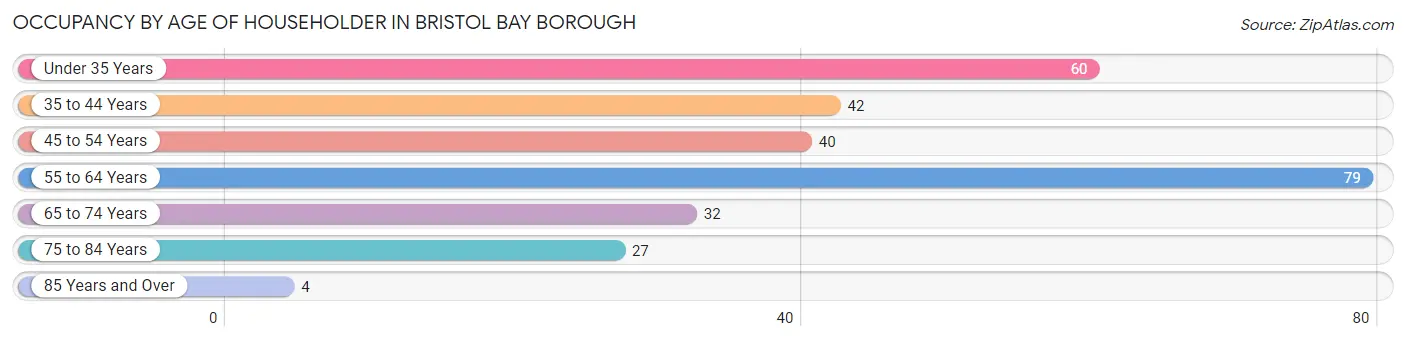
| Age Bracket | # Households | % Households |
| Under 35 Years | 60 | 21.1% |
| 35 to 44 Years | 42 | 14.8% |
| 45 to 54 Years | 40 | 14.1% |
| 55 to 64 Years | 79 | 27.8% |
| 65 to 74 Years | 32 | 11.3% |
| 75 to 84 Years | 27 | 9.5% |
| 85 Years and Over | 4 | 1.4% |
| Total | 284 | 100.0% |
Housing Finances in Bristol Bay Borough
Median Income by Occupancy in Bristol Bay Borough
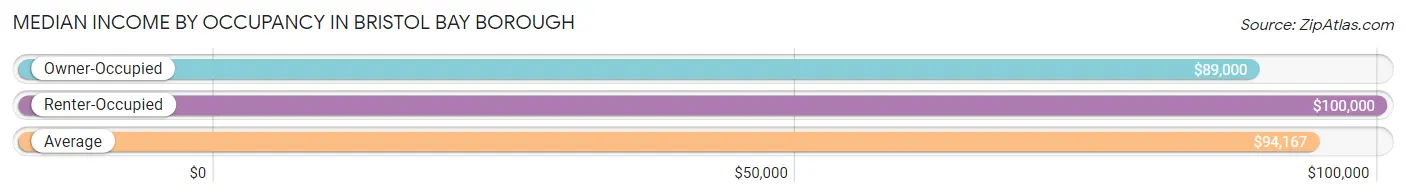
| Occupancy Type | # Households | Median Income |
| Owner-Occupied | 144 (50.7%) | $89,000 |
| Renter-Occupied | 140 (49.3%) | $100,000 |
| Average | 284 (100.0%) | $94,167 |
Occupancy by Householder Income Bracket in Bristol Bay Borough
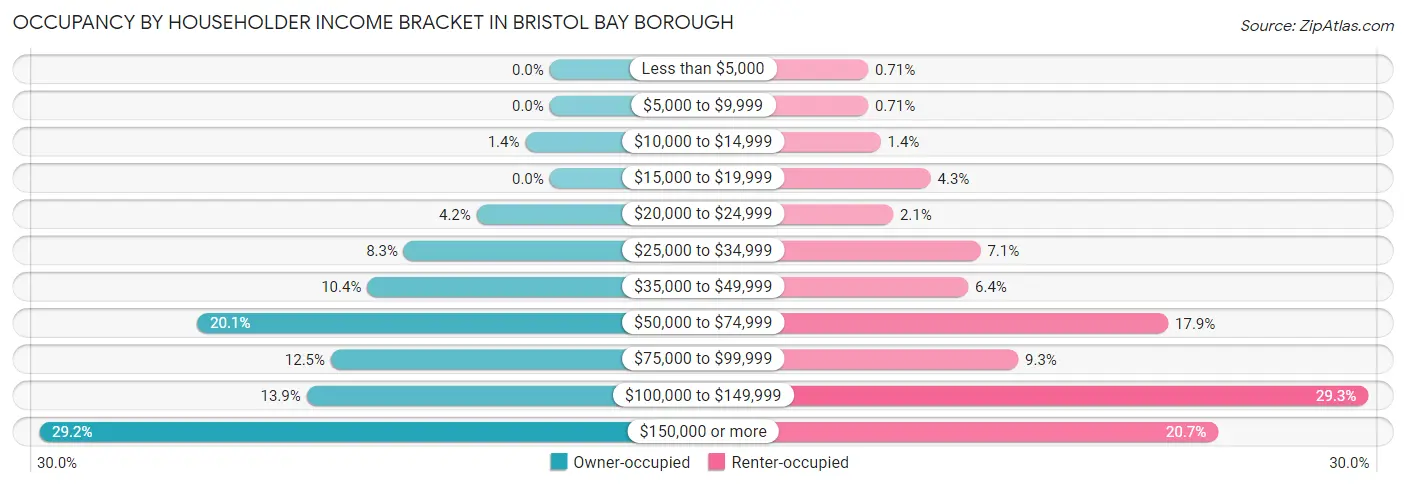
| Income Bracket | Owner-occupied | Renter-occupied |
| Less than $5,000 | 0 (0.0%) | 1 (0.7%) |
| $5,000 to $9,999 | 0 (0.0%) | 1 (0.7%) |
| $10,000 to $14,999 | 2 (1.4%) | 2 (1.4%) |
| $15,000 to $19,999 | 0 (0.0%) | 6 (4.3%) |
| $20,000 to $24,999 | 6 (4.2%) | 3 (2.1%) |
| $25,000 to $34,999 | 12 (8.3%) | 10 (7.1%) |
| $35,000 to $49,999 | 15 (10.4%) | 9 (6.4%) |
| $50,000 to $74,999 | 29 (20.1%) | 25 (17.9%) |
| $75,000 to $99,999 | 18 (12.5%) | 13 (9.3%) |
| $100,000 to $149,999 | 20 (13.9%) | 41 (29.3%) |
| $150,000 or more | 42 (29.2%) | 29 (20.7%) |
| Total | 144 (100.0%) | 140 (100.0%) |
Monthly Housing Cost Tiers in Bristol Bay Borough
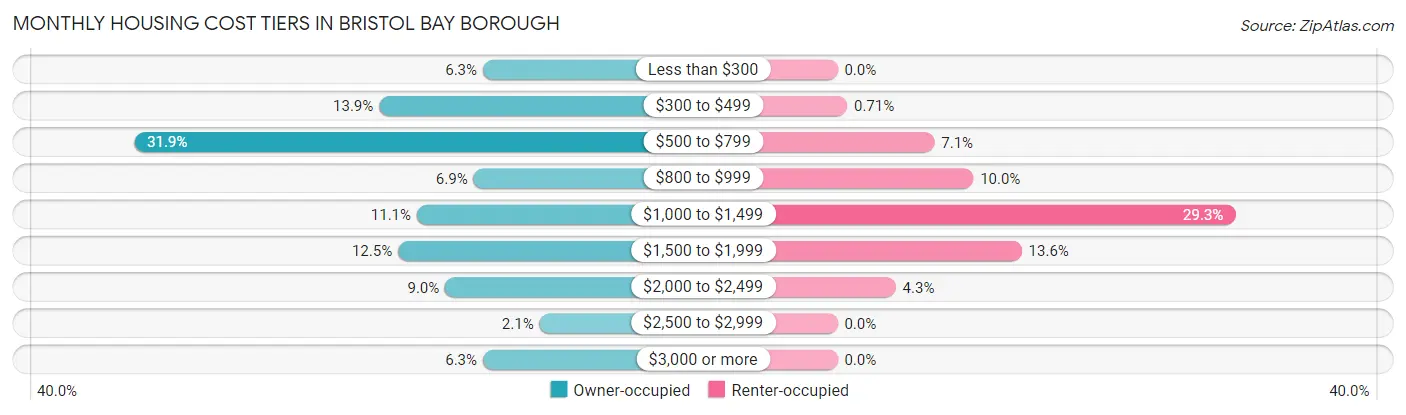
| Monthly Cost | Owner-occupied | Renter-occupied |
| Less than $300 | 9 (6.2%) | 0 (0.0%) |
| $300 to $499 | 20 (13.9%) | 1 (0.7%) |
| $500 to $799 | 46 (31.9%) | 10 (7.1%) |
| $800 to $999 | 10 (6.9%) | 14 (10.0%) |
| $1,000 to $1,499 | 16 (11.1%) | 41 (29.3%) |
| $1,500 to $1,999 | 18 (12.5%) | 19 (13.6%) |
| $2,000 to $2,499 | 13 (9.0%) | 6 (4.3%) |
| $2,500 to $2,999 | 3 (2.1%) | 0 (0.0%) |
| $3,000 or more | 9 (6.2%) | 0 (0.0%) |
| Total | 144 (100.0%) | 140 (100.0%) |
Physical Housing Characteristics in Bristol Bay Borough
Housing Structures in Bristol Bay Borough
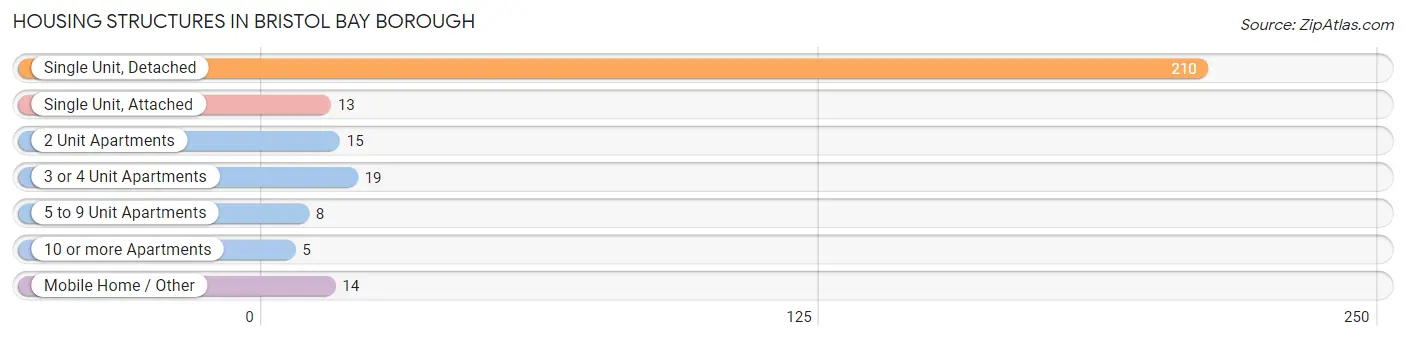
| Structure Type | # Housing Units | % Housing Units |
| Single Unit, Detached | 210 | 73.9% |
| Single Unit, Attached | 13 | 4.6% |
| 2 Unit Apartments | 15 | 5.3% |
| 3 or 4 Unit Apartments | 19 | 6.7% |
| 5 to 9 Unit Apartments | 8 | 2.8% |
| 10 or more Apartments | 5 | 1.8% |
| Mobile Home / Other | 14 | 4.9% |
| Total | 284 | 100.0% |
Housing Structures by Occupancy in Bristol Bay Borough
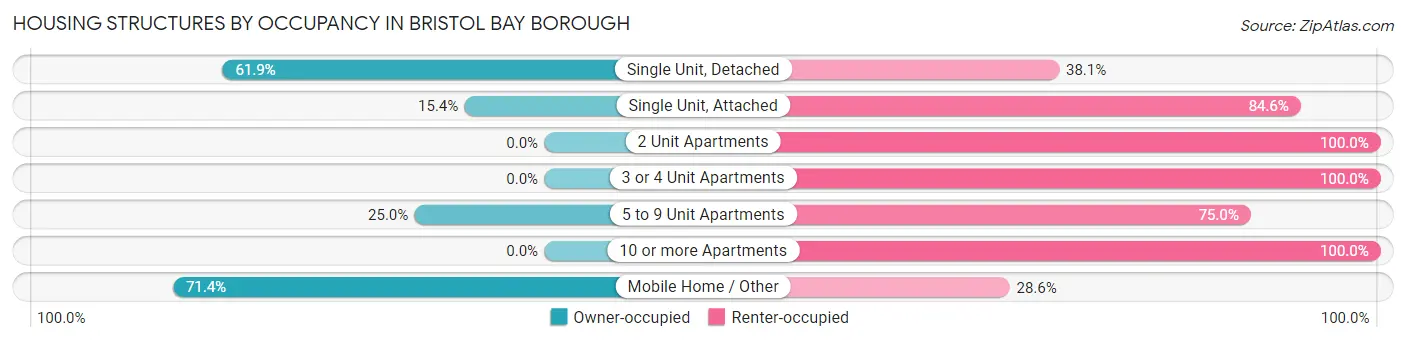
| Structure Type | Owner-occupied | Renter-occupied |
| Single Unit, Detached | 130 (61.9%) | 80 (38.1%) |
| Single Unit, Attached | 2 (15.4%) | 11 (84.6%) |
| 2 Unit Apartments | 0 (0.0%) | 15 (100.0%) |
| 3 or 4 Unit Apartments | 0 (0.0%) | 19 (100.0%) |
| 5 to 9 Unit Apartments | 2 (25.0%) | 6 (75.0%) |
| 10 or more Apartments | 0 (0.0%) | 5 (100.0%) |
| Mobile Home / Other | 10 (71.4%) | 4 (28.6%) |
| Total | 144 (50.7%) | 140 (49.3%) |
Housing Structures by Number of Rooms in Bristol Bay Borough
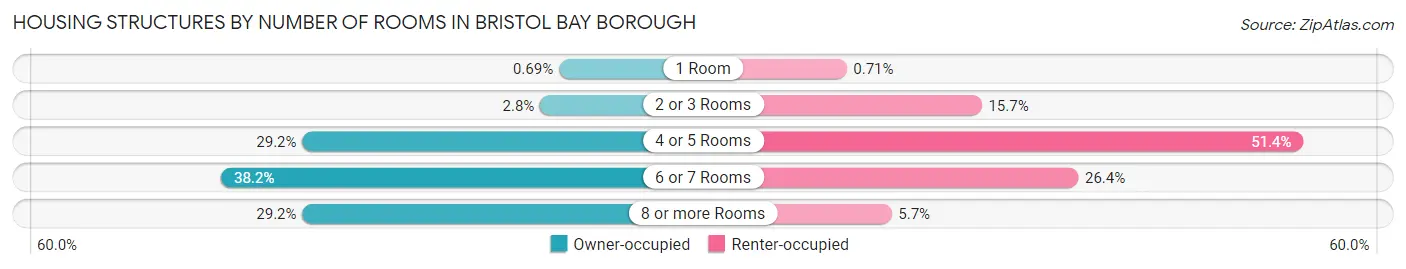
| Number of Rooms | Owner-occupied | Renter-occupied |
| 1 Room | 1 (0.7%) | 1 (0.7%) |
| 2 or 3 Rooms | 4 (2.8%) | 22 (15.7%) |
| 4 or 5 Rooms | 42 (29.2%) | 72 (51.4%) |
| 6 or 7 Rooms | 55 (38.2%) | 37 (26.4%) |
| 8 or more Rooms | 42 (29.2%) | 8 (5.7%) |
| Total | 144 (100.0%) | 140 (100.0%) |
Housing Structure by Heating Type in Bristol Bay Borough
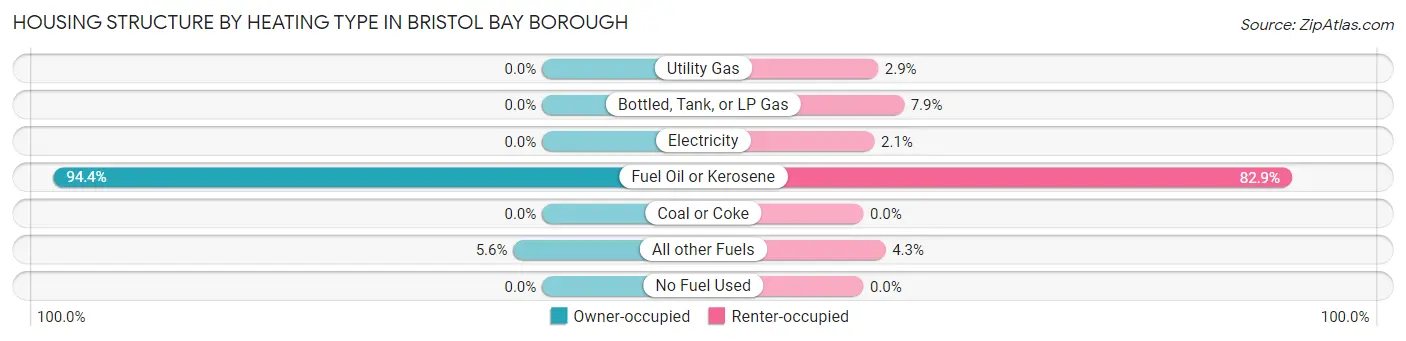
| Heating Type | Owner-occupied | Renter-occupied |
| Utility Gas | 0 (0.0%) | 4 (2.9%) |
| Bottled, Tank, or LP Gas | 0 (0.0%) | 11 (7.9%) |
| Electricity | 0 (0.0%) | 3 (2.1%) |
| Fuel Oil or Kerosene | 136 (94.4%) | 116 (82.9%) |
| Coal or Coke | 0 (0.0%) | 0 (0.0%) |
| All other Fuels | 8 (5.6%) | 6 (4.3%) |
| No Fuel Used | 0 (0.0%) | 0 (0.0%) |
| Total | 144 (100.0%) | 140 (100.0%) |
Household Vehicle Usage in Bristol Bay Borough
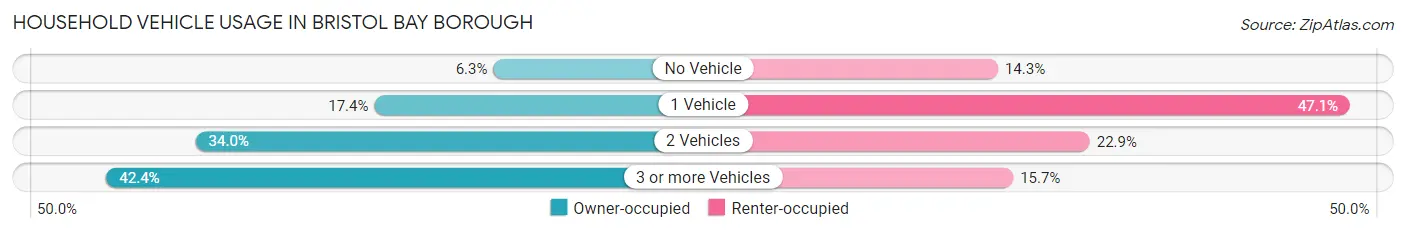
| Vehicles per Household | Owner-occupied | Renter-occupied |
| No Vehicle | 9 (6.2%) | 20 (14.3%) |
| 1 Vehicle | 25 (17.4%) | 66 (47.1%) |
| 2 Vehicles | 49 (34.0%) | 32 (22.9%) |
| 3 or more Vehicles | 61 (42.4%) | 22 (15.7%) |
| Total | 144 (100.0%) | 140 (100.0%) |
Real Estate & Mortgages in Bristol Bay Borough
Real Estate and Mortgage Overview in Bristol Bay Borough
| Characteristic | Without Mortgage | With Mortgage |
| Housing Units | 99 | 45 |
| Median Property Value | $226,800 | $297,200 |
| Median Household Income | $64,271 | $28 |
| Monthly Housing Costs | $576 | $9 |
| Real Estate Taxes | $1,893 | $9 |
Property Value by Mortgage Status in Bristol Bay Borough
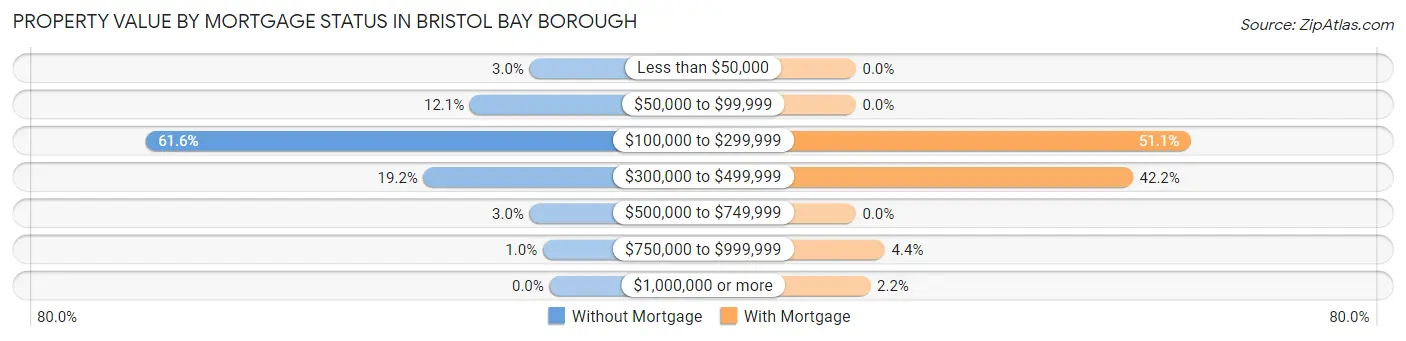
| Property Value | Without Mortgage | With Mortgage |
| Less than $50,000 | 3 (3.0%) | 0 (0.0%) |
| $50,000 to $99,999 | 12 (12.1%) | 0 (0.0%) |
| $100,000 to $299,999 | 61 (61.6%) | 23 (51.1%) |
| $300,000 to $499,999 | 19 (19.2%) | 19 (42.2%) |
| $500,000 to $749,999 | 3 (3.0%) | 0 (0.0%) |
| $750,000 to $999,999 | 1 (1.0%) | 2 (4.4%) |
| $1,000,000 or more | 0 (0.0%) | 1 (2.2%) |
| Total | 99 (100.0%) | 45 (100.0%) |
Household Income by Mortgage Status in Bristol Bay Borough
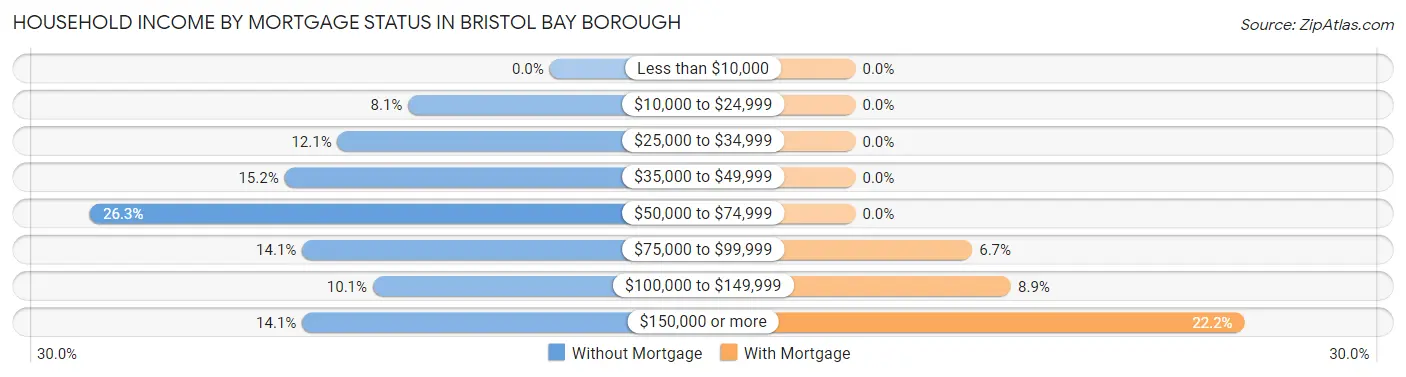
| Household Income | Without Mortgage | With Mortgage |
| Less than $10,000 | 0 (0.0%) | 0 (0.0%) |
| $10,000 to $24,999 | 8 (8.1%) | 0 (0.0%) |
| $25,000 to $34,999 | 12 (12.1%) | 0 (0.0%) |
| $35,000 to $49,999 | 15 (15.1%) | 0 (0.0%) |
| $50,000 to $74,999 | 26 (26.3%) | 0 (0.0%) |
| $75,000 to $99,999 | 14 (14.1%) | 3 (6.7%) |
| $100,000 to $149,999 | 10 (10.1%) | 4 (8.9%) |
| $150,000 or more | 14 (14.1%) | 10 (22.2%) |
| Total | 99 (100.0%) | 45 (100.0%) |
Property Value to Household Income Ratio in Bristol Bay Borough
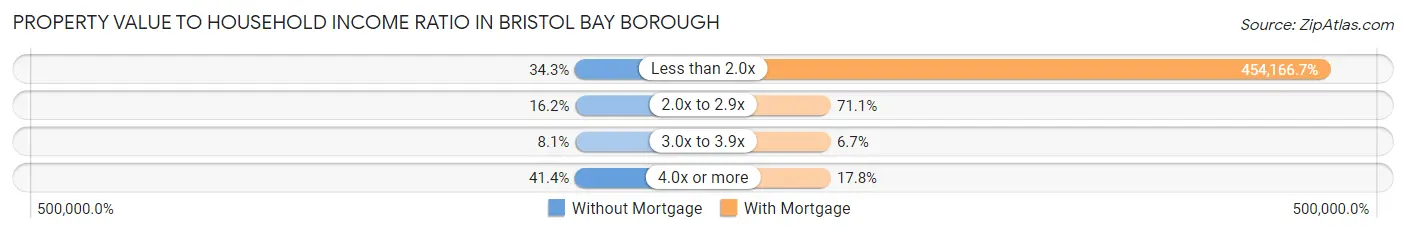
| Value-to-Income Ratio | Without Mortgage | With Mortgage |
| Less than 2.0x | 34 (34.3%) | 204,375 (454,166.7%) |
| 2.0x to 2.9x | 16 (16.2%) | 32 (71.1%) |
| 3.0x to 3.9x | 8 (8.1%) | 3 (6.7%) |
| 4.0x or more | 41 (41.4%) | 8 (17.8%) |
| Total | 99 (100.0%) | 45 (100.0%) |
Real Estate Taxes by Mortgage Status in Bristol Bay Borough
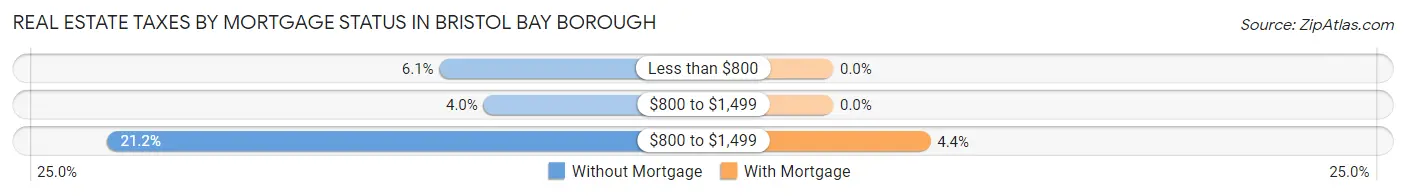
| Property Taxes | Without Mortgage | With Mortgage |
| Less than $800 | 6 (6.1%) | 0 (0.0%) |
| $800 to $1,499 | 4 (4.0%) | 0 (0.0%) |
| $800 to $1,499 | 21 (21.2%) | 2 (4.4%) |
| Total | 99 (100.0%) | 45 (100.0%) |
Health & Disability in Bristol Bay Borough
Health Insurance Coverage by Age in Bristol Bay Borough
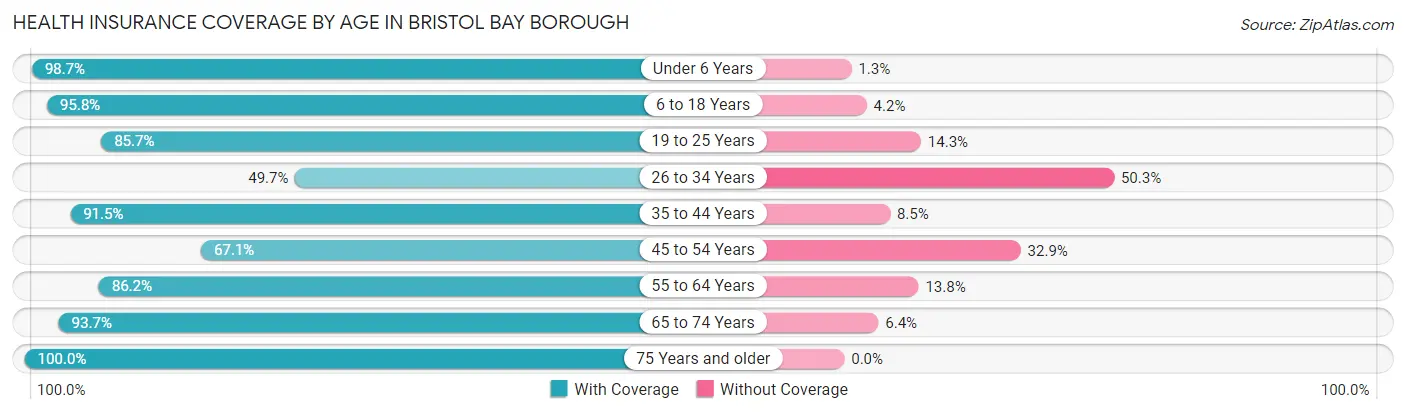
| Age Bracket | With Coverage | Without Coverage |
| Under 6 Years | 74 (98.7%) | 1 (1.3%) |
| 6 to 18 Years | 92 (95.8%) | 4 (4.2%) |
| 19 to 25 Years | 48 (85.7%) | 8 (14.3%) |
| 26 to 34 Years | 87 (49.7%) | 88 (50.3%) |
| 35 to 44 Years | 86 (91.5%) | 8 (8.5%) |
| 45 to 54 Years | 51 (67.1%) | 25 (32.9%) |
| 55 to 64 Years | 137 (86.2%) | 22 (13.8%) |
| 65 to 74 Years | 59 (93.6%) | 4 (6.4%) |
| 75 Years and older | 45 (100.0%) | 0 (0.0%) |
| Total | 679 (80.9%) | 160 (19.1%) |
Health Insurance Coverage by Citizenship Status in Bristol Bay Borough
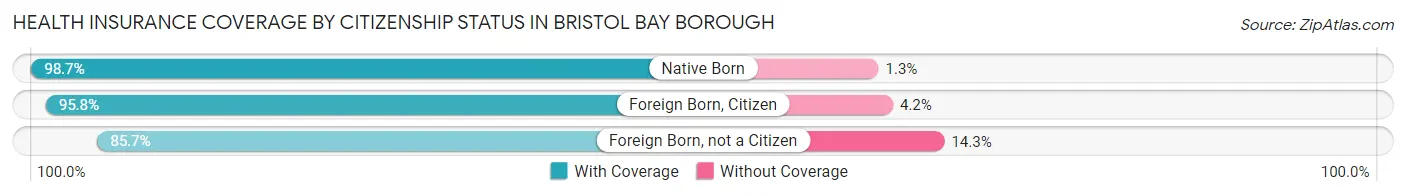
| Citizenship Status | With Coverage | Without Coverage |
| Native Born | 74 (98.7%) | 1 (1.3%) |
| Foreign Born, Citizen | 92 (95.8%) | 4 (4.2%) |
| Foreign Born, not a Citizen | 48 (85.7%) | 8 (14.3%) |
Health Insurance Coverage by Household Income in Bristol Bay Borough
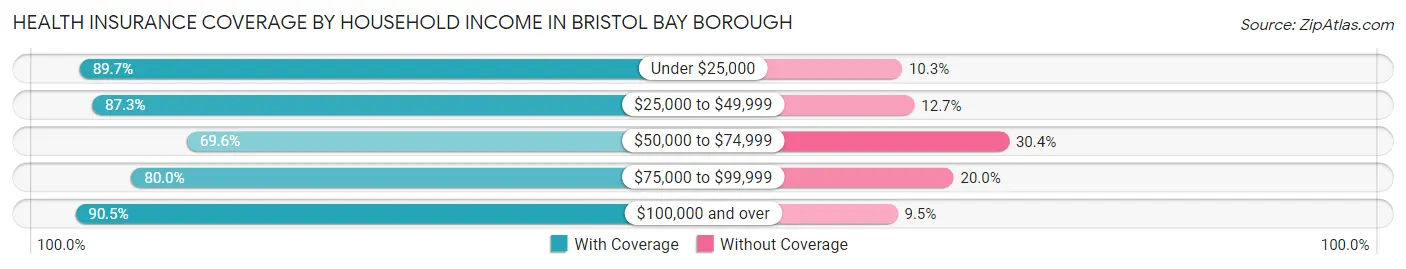
| Household Income | With Coverage | Without Coverage |
| Under $25,000 | 26 (89.7%) | 3 (10.3%) |
| $25,000 to $49,999 | 69 (87.3%) | 10 (12.7%) |
| $50,000 to $74,999 | 71 (69.6%) | 31 (30.4%) |
| $75,000 to $99,999 | 64 (80.0%) | 16 (20.0%) |
| $100,000 and over | 390 (90.5%) | 41 (9.5%) |
Public vs Private Health Insurance Coverage by Age in Bristol Bay Borough
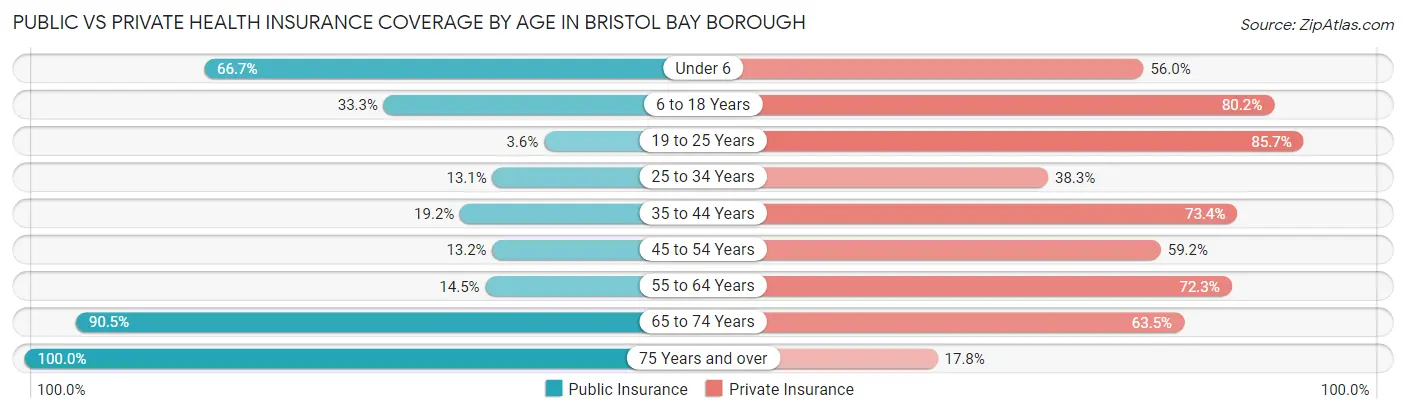
| Age Bracket | Public Insurance | Private Insurance |
| Under 6 | 50 (66.7%) | 42 (56.0%) |
| 6 to 18 Years | 32 (33.3%) | 77 (80.2%) |
| 19 to 25 Years | 2 (3.6%) | 48 (85.7%) |
| 25 to 34 Years | 23 (13.1%) | 67 (38.3%) |
| 35 to 44 Years | 18 (19.2%) | 69 (73.4%) |
| 45 to 54 Years | 10 (13.2%) | 45 (59.2%) |
| 55 to 64 Years | 23 (14.5%) | 115 (72.3%) |
| 65 to 74 Years | 57 (90.5%) | 40 (63.5%) |
| 75 Years and over | 45 (100.0%) | 8 (17.8%) |
| Total | 260 (31.0%) | 511 (60.9%) |
Disability Status by Sex by Age in Bristol Bay Borough
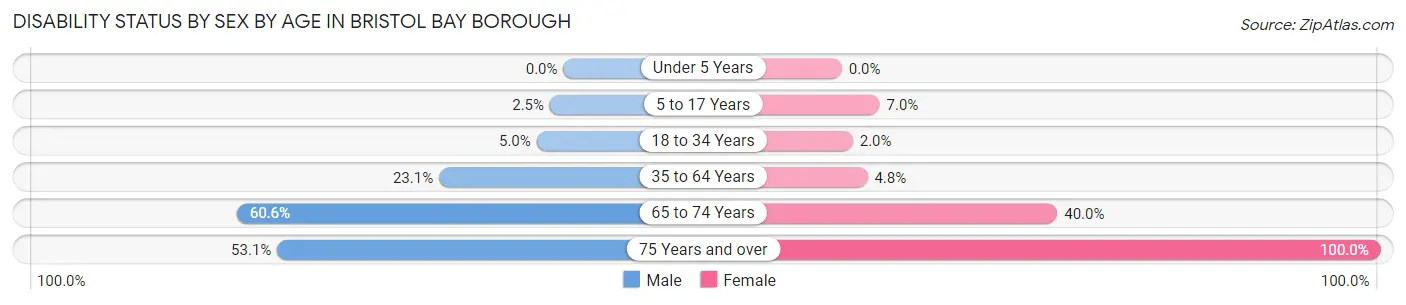
| Age Bracket | Male | Female |
| Under 5 Years | 0 (0.0%) | 0 (0.0%) |
| 5 to 17 Years | 1 (2.5%) | 4 (7.0%) |
| 18 to 34 Years | 7 (5.0%) | 2 (2.0%) |
| 35 to 64 Years | 42 (23.1%) | 7 (4.8%) |
| 65 to 74 Years | 20 (60.6%) | 12 (40.0%) |
| 75 Years and over | 17 (53.1%) | 13 (100.0%) |
Disability Class by Sex by Age in Bristol Bay Borough
Disability Class: Hearing Difficulty
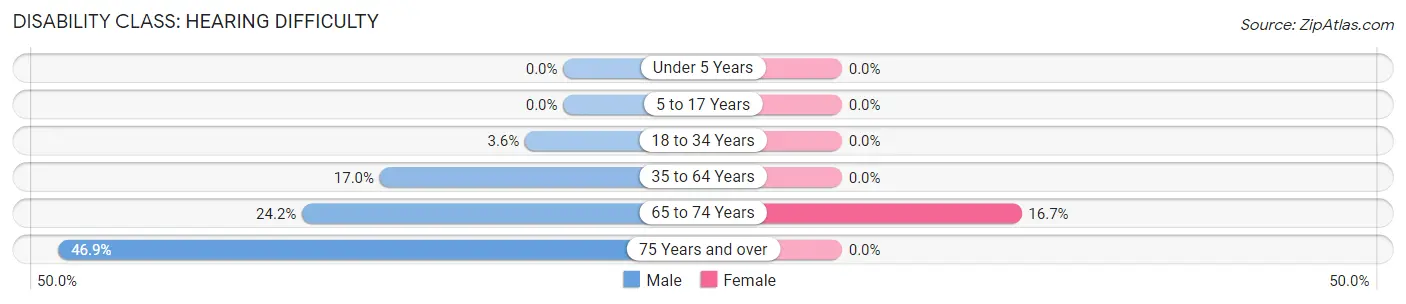
| Age Bracket | Male | Female |
| Under 5 Years | 0 (0.0%) | 0 (0.0%) |
| 5 to 17 Years | 0 (0.0%) | 0 (0.0%) |
| 18 to 34 Years | 5 (3.5%) | 0 (0.0%) |
| 35 to 64 Years | 31 (17.0%) | 0 (0.0%) |
| 65 to 74 Years | 8 (24.2%) | 5 (16.7%) |
| 75 Years and over | 15 (46.9%) | 0 (0.0%) |
Disability Class: Vision Difficulty
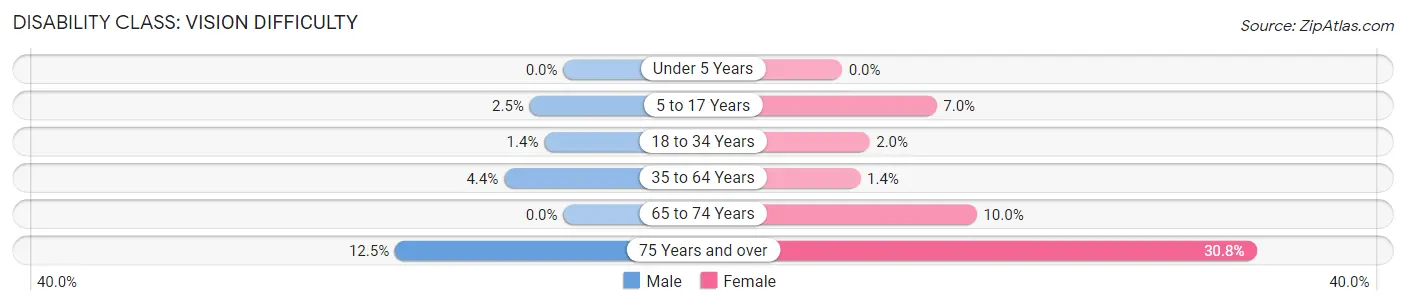
| Age Bracket | Male | Female |
| Under 5 Years | 0 (0.0%) | 0 (0.0%) |
| 5 to 17 Years | 1 (2.5%) | 4 (7.0%) |
| 18 to 34 Years | 2 (1.4%) | 2 (2.0%) |
| 35 to 64 Years | 8 (4.4%) | 2 (1.4%) |
| 65 to 74 Years | 0 (0.0%) | 3 (10.0%) |
| 75 Years and over | 4 (12.5%) | 4 (30.8%) |
Disability Class: Cognitive Difficulty
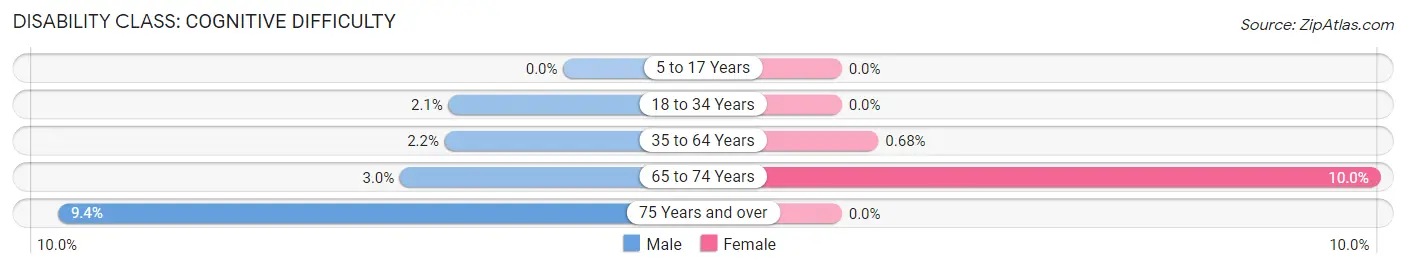
| Age Bracket | Male | Female |
| 5 to 17 Years | 0 (0.0%) | 0 (0.0%) |
| 18 to 34 Years | 3 (2.1%) | 0 (0.0%) |
| 35 to 64 Years | 4 (2.2%) | 1 (0.7%) |
| 65 to 74 Years | 1 (3.0%) | 3 (10.0%) |
| 75 Years and over | 3 (9.4%) | 0 (0.0%) |
Disability Class: Ambulatory Difficulty
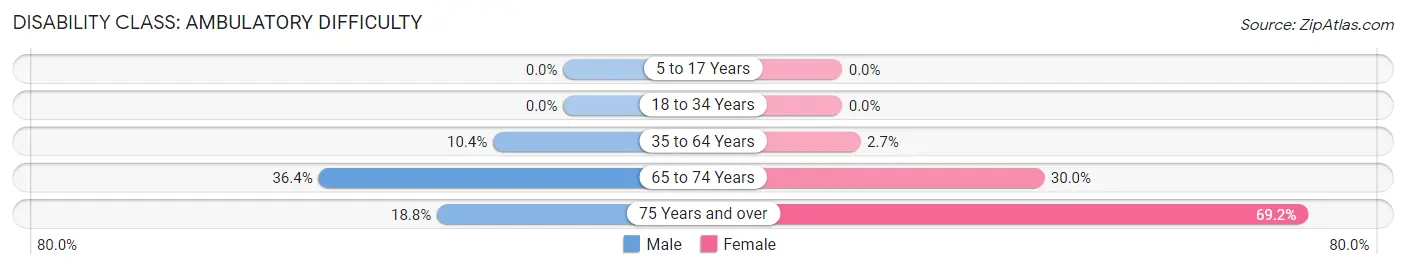
| Age Bracket | Male | Female |
| 5 to 17 Years | 0 (0.0%) | 0 (0.0%) |
| 18 to 34 Years | 0 (0.0%) | 0 (0.0%) |
| 35 to 64 Years | 19 (10.4%) | 4 (2.7%) |
| 65 to 74 Years | 12 (36.4%) | 9 (30.0%) |
| 75 Years and over | 6 (18.8%) | 9 (69.2%) |
Disability Class: Self-Care Difficulty
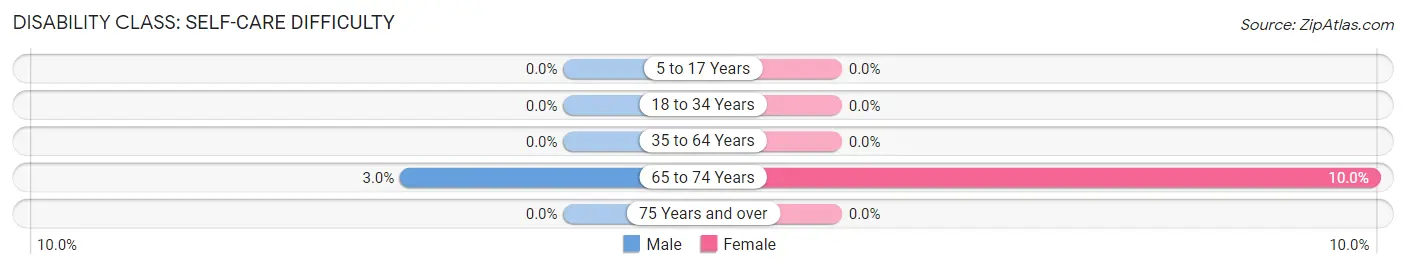
| Age Bracket | Male | Female |
| 5 to 17 Years | 0 (0.0%) | 0 (0.0%) |
| 18 to 34 Years | 0 (0.0%) | 0 (0.0%) |
| 35 to 64 Years | 0 (0.0%) | 0 (0.0%) |
| 65 to 74 Years | 1 (3.0%) | 3 (10.0%) |
| 75 Years and over | 0 (0.0%) | 0 (0.0%) |
Technology Access in Bristol Bay Borough
Computing Device Access in Bristol Bay Borough
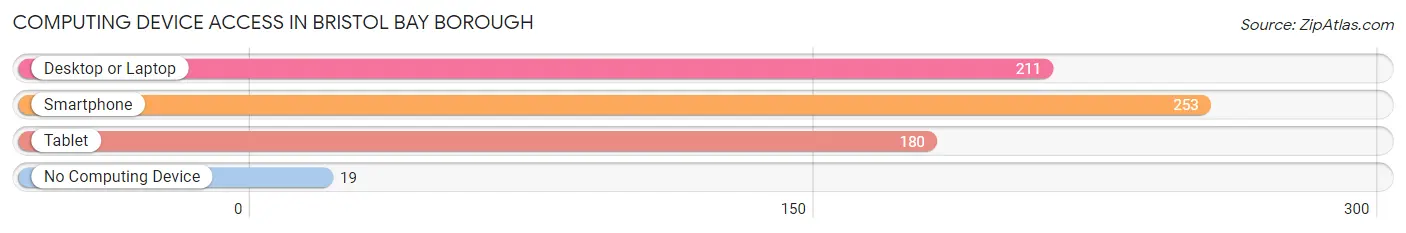
| Device Type | # Households | % Households |
| Desktop or Laptop | 211 | 74.3% |
| Smartphone | 253 | 89.1% |
| Tablet | 180 | 63.4% |
| No Computing Device | 19 | 6.7% |
| Total | 284 | 100.0% |
Internet Access in Bristol Bay Borough
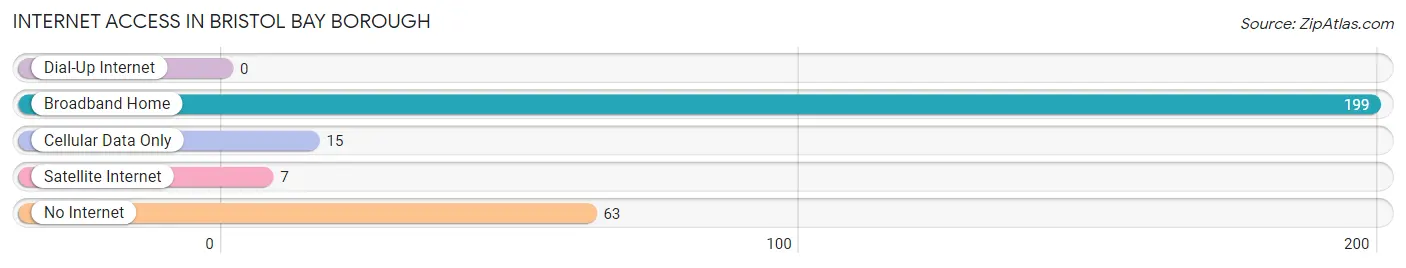
| Internet Type | # Households | % Households |
| Dial-Up Internet | 0 | 0.0% |
| Broadband Home | 199 | 70.1% |
| Cellular Data Only | 15 | 5.3% |
| Satellite Internet | 7 | 2.5% |
| No Internet | 63 | 22.2% |
| Total | 284 | 100.0% |
Bristol Bay Borough Summary
Bristol Bay Borough is a borough located in the southwestern region of the U.S. state of Alaska. It is the second-largest borough in the state, encompassing an area of over 25,000 square miles. The borough is bordered by the Bering Sea to the north, the Yukon-Kuskokwim Delta to the east, the Alaska Peninsula to the south, and the Aleutian Islands to the west. The borough seat is located in the city of Dillingham, which is the largest city in the borough.
History
The area that is now Bristol Bay Borough has been inhabited by indigenous peoples for thousands of years. The Yup'ik, Dena'ina, and Alutiiq peoples have all called the area home. The first Europeans to explore the area were Russian fur traders in the late 18th century. The area was later explored by American whalers and traders in the 19th century.
In 1912, the Alaska Territorial Legislature created the Bristol Bay Borough, which was named after the nearby Bristol Bay. The borough was officially incorporated in 1964.
Geography
Bristol Bay Borough is located in the southwestern region of Alaska. It is bordered by the Bering Sea to the north, the Yukon-Kuskokwim Delta to the east, the Alaska Peninsula to the south, and the Aleutian Islands to the west. The borough encompasses an area of over 25,000 square miles, making it the second-largest borough in the state.
The terrain of the borough is mostly flat, with some rolling hills and mountains in the northern and eastern parts of the borough. The climate of the borough is subarctic, with cold winters and mild summers.
Economy
The economy of Bristol Bay Borough is largely based on fishing and tourism. The borough is home to the world's largest sockeye salmon fishery, which is located in the nearby Bristol Bay. The fishery is the largest employer in the borough, providing jobs for thousands of people.
The borough is also home to several tourist attractions, including the Alaska Peninsula National Wildlife Refuge, the Katmai National Park and Preserve, and the Togiak National Wildlife Refuge. Tourism is an important part of the local economy, providing jobs and revenue for the borough.
Demographics
As of the 2010 census, the population of Bristol Bay Borough was 9,976. The racial makeup of the borough was 75.3% White, 0.7% Black or African American, 16.2% Native American, 0.7% Asian, 0.1% Pacific Islander, and 6.9% from two or more races. The median household income in the borough was $50,945, and the median family income was $58,958.
The largest ancestry groups in the borough were German (25.3%), Irish (17.2%), English (14.2%), and Native American (13.2%). The most commonly spoken language in the borough was English (93.2%), followed by Yup'ik (3.2%), and Spanish (1.2%).
Common Questions
What is the Total Population of Bristol Bay Borough?
Total Population of Bristol Bay Borough is 854.
What is the Total Male Population of Bristol Bay Borough?
Total Male Population of Bristol Bay Borough is 489.
What is the Total Female Population of Bristol Bay Borough?
Total Female Population of Bristol Bay Borough is 365.
What is the Ratio of Males per 100 Females in Bristol Bay Borough?
There are 133.97 Males per 100 Females in Bristol Bay Borough.
What is the Ratio of Females per 100 Males in Bristol Bay Borough?
There are 74.64 Females per 100 Males in Bristol Bay Borough.
What is the Median Population Age in Bristol Bay Borough?
Median Population Age in Bristol Bay Borough is 36.4 Years.
What is the Average Family Size in Bristol Bay Borough
Average Family Size in Bristol Bay Borough is 3.1 People.
What is the Average Household Size in Bristol Bay Borough
Average Household Size in Bristol Bay Borough is 2.6 People.
What is Per Capita Income in Bristol Bay Borough?
Per Capita income in Bristol Bay Borough is $45,499.
What is the Median Family Income in Bristol Bay Borough?
Median Family Income in Bristol Bay Borough is $104,688.
What is the Median Household income in Bristol Bay Borough?
Median Household Income in Bristol Bay Borough is $94,167.
What is Income or Wage Gap in Bristol Bay Borough?
Income or Wage Gap in Bristol Bay Borough is 17.2%.
Women in Bristol Bay Borough earn 82.8 cents for every dollar earned by a man.
What is Inequality or Gini Index in Bristol Bay Borough?
Inequality or Gini Index in Bristol Bay Borough is 0.41.
How Large is the Labor Force in Bristol Bay Borough?
There are 450 People in the Labor Forcein in Bristol Bay Borough.
What is the Percentage of People in the Labor Force in Bristol Bay Borough?
63.6% of People are in the Labor Force in Bristol Bay Borough.
What is the Unemployment Rate in Bristol Bay Borough?
Unemployment Rate in Bristol Bay Borough is 2.7%.