Bethel Census Area, AK
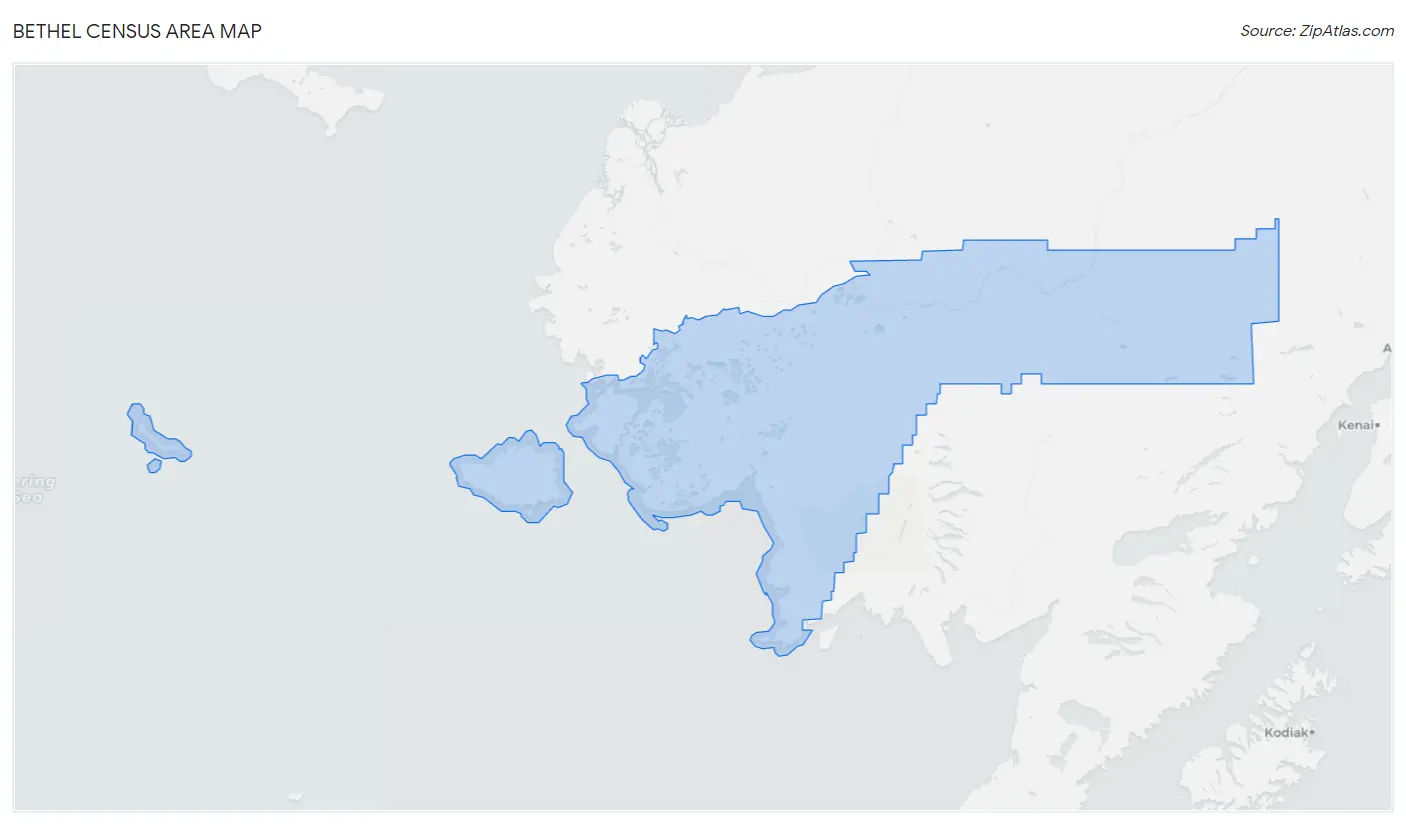
Bethel Census Area Map
Bethel Census Area Overview
18,538
TOTAL POPULATION
9,909
MALE POPULATION
8,629
FEMALE POPULATION
114.83
MALES / 100 FEMALES
87.08
FEMALES / 100 MALES
28.7
MEDIAN AGE
4.5
AVG FAMILY SIZE
3.8
AVG HOUSEHOLD SIZE
$25,859
PER CAPITA INCOME
$67,266
AVG FAMILY INCOME
$64,094
AVG HOUSEHOLD INCOME
2.1%
WAGE / INCOME GAP [ % ]
97.9¢/ $1
WAGE / INCOME GAP [ $ ]
$14,071
FAMILY INCOME DEFICIT
0.46
INEQUALITY / GINI INDEX
7,867
LABOR FORCE [ PEOPLE ]
62.1%
PERCENT IN LABOR FORCE
16.2%
UNEMPLOYMENT RATE
Bethel Census Area Area Codes
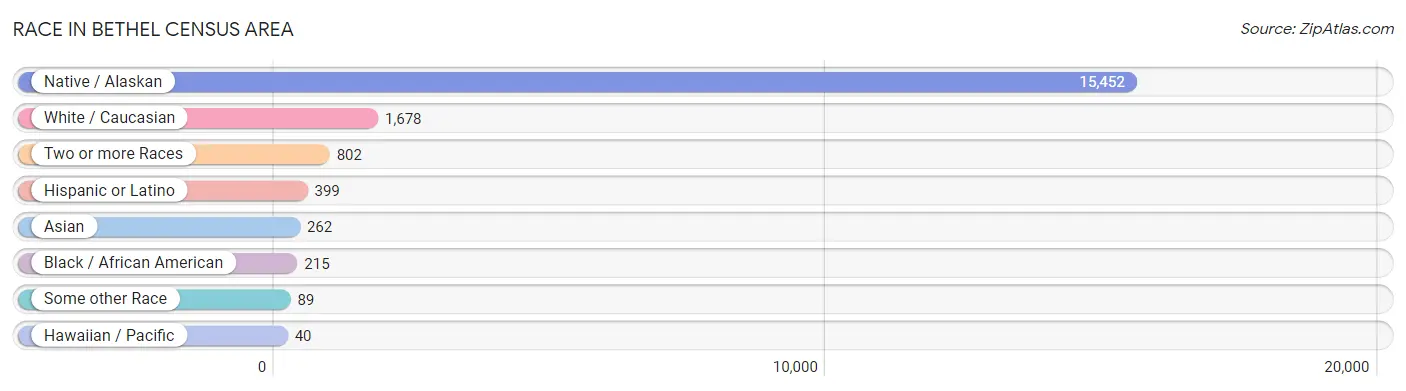
Race in Bethel Census Area
The most populous races in Bethel Census Area are Native / Alaskan (15,452 | 83.4%), White / Caucasian (1,678 | 9.0%), and Two or more Races (802 | 4.3%).
| Race | # Population | % Population |
| Asian | 262 | 1.4% |
| Black / African American | 215 | 1.2% |
| Hawaiian / Pacific | 40 | 0.2% |
| Hispanic or Latino | 399 | 2.1% |
| Native / Alaskan | 15,452 | 83.4% |
| White / Caucasian | 1,678 | 9.0% |
| Two or more Races | 802 | 4.3% |
| Some other Race | 89 | 0.5% |
| Total | 18,538 | 100.0% |
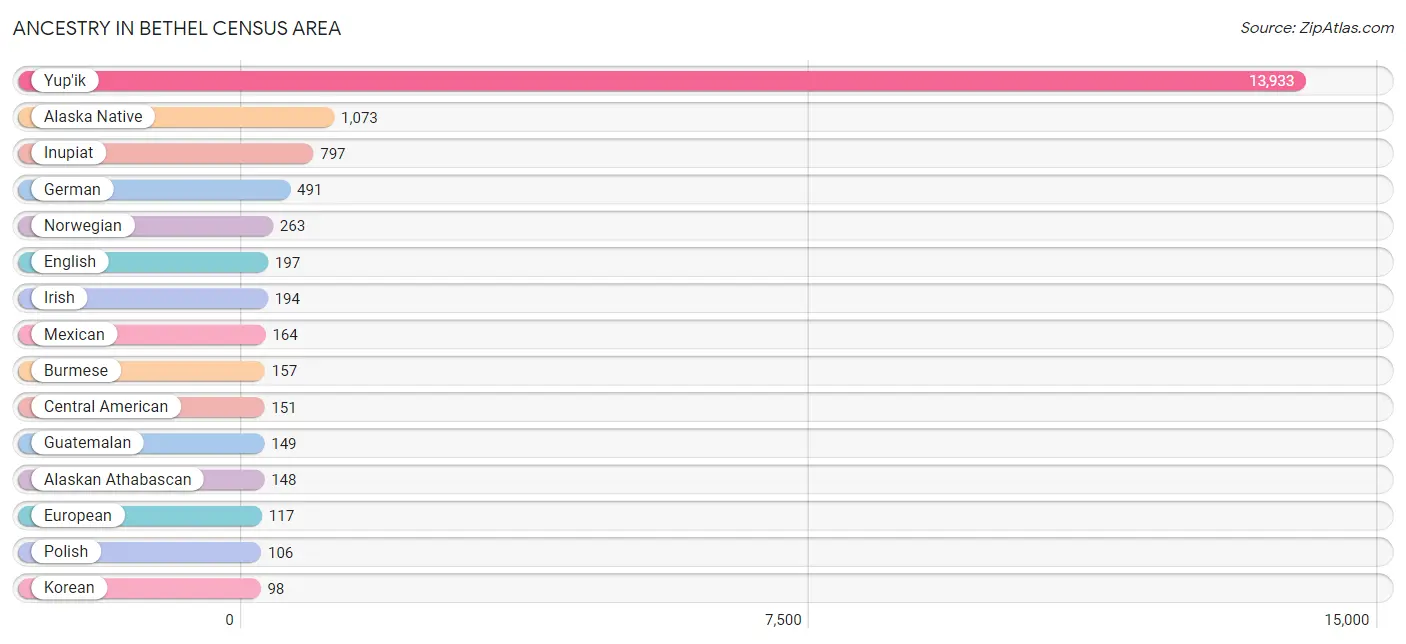
Ancestry in Bethel Census Area
The most populous ancestries reported in Bethel Census Area are Yup'ik (13,933 | 75.2%), Alaska Native (1,073 | 5.8%), Inupiat (797 | 4.3%), German (491 | 2.6%), and Norwegian (263 | 1.4%), together accounting for 89.3% of all Bethel Census Area residents.
| Ancestry | # Population | % Population |
| Alaska Native | 1,073 | 5.8% |
| Alaskan Athabascan | 148 | 0.8% |
| Albanian | 26 | 0.1% |
| Aleut | 23 | 0.1% |
| American | 47 | 0.3% |
| Apache | 10 | 0.1% |
| Armenian | 15 | 0.1% |
| Austrian | 7 | 0.0% |
| Bahamian | 9 | 0.1% |
| Bangladeshi | 4 | 0.0% |
| Belgian | 7 | 0.0% |
| Bhutanese | 8 | 0.0% |
| Blackfeet | 7 | 0.0% |
| British | 18 | 0.1% |
| Burmese | 157 | 0.9% |
| Central American | 151 | 0.8% |
| Cherokee | 41 | 0.2% |
| Chickasaw | 8 | 0.0% |
| Chippewa | 2 | 0.0% |
| Czech | 18 | 0.1% |
| Czechoslovakian | 3 | 0.0% |
| Danish | 20 | 0.1% |
| Dominican | 1 | 0.0% |
| Dutch | 30 | 0.2% |
| Eastern European | 8 | 0.0% |
| English | 197 | 1.1% |
| Ethiopian | 15 | 0.1% |
| European | 117 | 0.6% |
| Fijian | 67 | 0.4% |
| Finnish | 36 | 0.2% |
| French | 77 | 0.4% |
| German | 491 | 2.6% |
| Guatemalan | 149 | 0.8% |
| Haitian | 40 | 0.2% |
| Hungarian | 13 | 0.1% |
| Indian (Asian) | 4 | 0.0% |
| Inupiat | 797 | 4.3% |
| Irish | 194 | 1.1% |
| Israeli | 6 | 0.0% |
| Italian | 45 | 0.2% |
| Jamaican | 25 | 0.1% |
| Korean | 98 | 0.5% |
| Mexican | 164 | 0.9% |
| Native Hawaiian | 17 | 0.1% |
| Nicaraguan | 2 | 0.0% |
| Nigerian | 24 | 0.1% |
| Norwegian | 263 | 1.4% |
| Paiute | 6 | 0.0% |
| Peruvian | 46 | 0.3% |
| Polish | 106 | 0.6% |
| Portuguese | 3 | 0.0% |
| Pueblo | 3 | 0.0% |
| Puerto Rican | 5 | 0.0% |
| Russian | 94 | 0.5% |
| Samoan | 55 | 0.3% |
| Scandinavian | 1 | 0.0% |
| Scotch-Irish | 13 | 0.1% |
| Scottish | 21 | 0.1% |
| Sioux | 3 | 0.0% |
| South American | 46 | 0.3% |
| Spanish | 21 | 0.1% |
| Subsaharan African | 65 | 0.4% |
| Swedish | 44 | 0.2% |
| Thai | 26 | 0.1% |
| Tlingit-Haida | 82 | 0.4% |
| Tongan | 14 | 0.1% |
| Ute | 18 | 0.1% |
| Welsh | 6 | 0.0% |
| Yugoslavian | 11 | 0.1% |
| Yup'ik | 13,933 | 75.2% | View All 70 Rows |
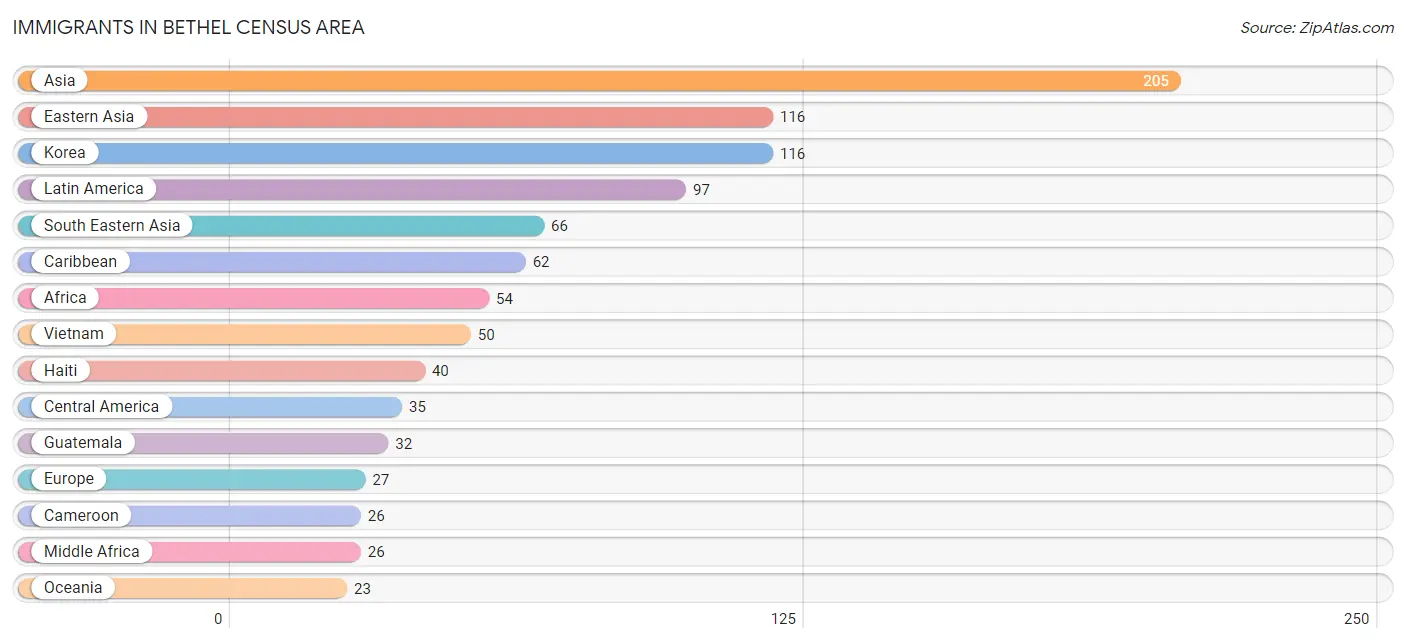
Immigrants in Bethel Census Area
The most numerous immigrant groups reported in Bethel Census Area came from Asia (205 | 1.1%), Eastern Asia (116 | 0.6%), Korea (116 | 0.6%), Latin America (97 | 0.5%), and South Eastern Asia (66 | 0.4%), together accounting for 3.3% of all Bethel Census Area residents.
| Immigration Origin | # Population | % Population |
| Africa | 54 | 0.3% |
| Asia | 205 | 1.1% |
| Cameroon | 26 | 0.1% |
| Canada | 11 | 0.1% |
| Caribbean | 62 | 0.3% |
| Central America | 35 | 0.2% |
| Eastern Africa | 15 | 0.1% |
| Eastern Asia | 116 | 0.6% |
| Eastern Europe | 22 | 0.1% |
| Ethiopia | 15 | 0.1% |
| Europe | 27 | 0.2% |
| Germany | 5 | 0.0% |
| Guatemala | 32 | 0.2% |
| Haiti | 40 | 0.2% |
| India | 17 | 0.1% |
| Israel | 6 | 0.0% |
| Jamaica | 22 | 0.1% |
| Korea | 116 | 0.6% |
| Latin America | 97 | 0.5% |
| Mexico | 3 | 0.0% |
| Middle Africa | 26 | 0.1% |
| Nigeria | 13 | 0.1% |
| North Macedonia | 7 | 0.0% |
| Oceania | 23 | 0.1% |
| Philippines | 16 | 0.1% |
| Poland | 15 | 0.1% |
| South Central Asia | 17 | 0.1% |
| South Eastern Asia | 66 | 0.4% |
| Vietnam | 50 | 0.3% |
| Western Africa | 13 | 0.1% |
| Western Asia | 6 | 0.0% |
| Western Europe | 5 | 0.0% | View All 32 Rows |
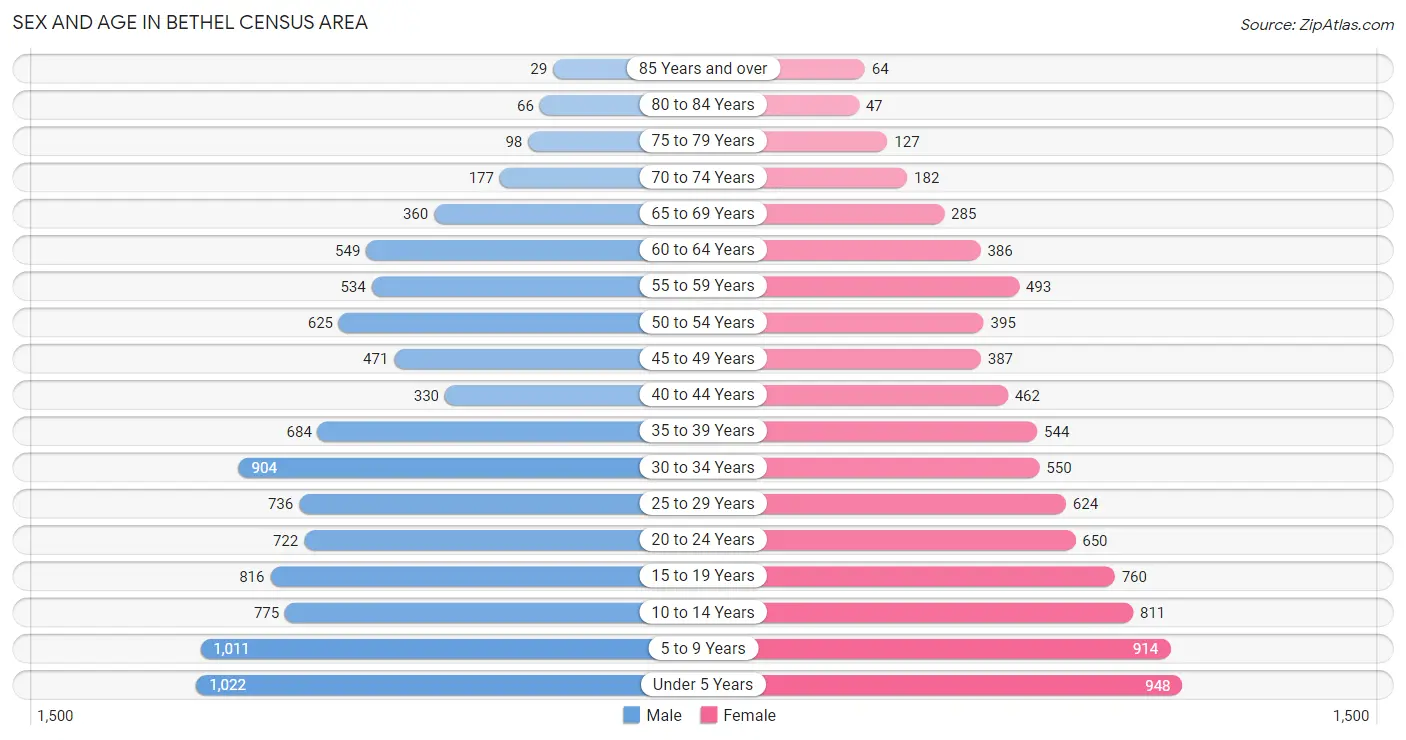
Sex and Age in Bethel Census Area
Sex and Age in Bethel Census Area
The most populous age groups in Bethel Census Area are Under 5 Years (1,022 | 10.3%) for men and Under 5 Years (948 | 11.0%) for women.
| Age Bracket | Male | Female |
| Under 5 Years | 1,022 (10.3%) | 948 (11.0%) |
| 5 to 9 Years | 1,011 (10.2%) | 914 (10.6%) |
| 10 to 14 Years | 775 (7.8%) | 811 (9.4%) |
| 15 to 19 Years | 816 (8.2%) | 760 (8.8%) |
| 20 to 24 Years | 722 (7.3%) | 650 (7.5%) |
| 25 to 29 Years | 736 (7.4%) | 624 (7.2%) |
| 30 to 34 Years | 904 (9.1%) | 550 (6.4%) |
| 35 to 39 Years | 684 (6.9%) | 544 (6.3%) |
| 40 to 44 Years | 330 (3.3%) | 462 (5.3%) |
| 45 to 49 Years | 471 (4.8%) | 387 (4.5%) |
| 50 to 54 Years | 625 (6.3%) | 395 (4.6%) |
| 55 to 59 Years | 534 (5.4%) | 493 (5.7%) |
| 60 to 64 Years | 549 (5.5%) | 386 (4.5%) |
| 65 to 69 Years | 360 (3.6%) | 285 (3.3%) |
| 70 to 74 Years | 177 (1.8%) | 182 (2.1%) |
| 75 to 79 Years | 98 (1.0%) | 127 (1.5%) |
| 80 to 84 Years | 66 (0.7%) | 47 (0.5%) |
| 85 Years and over | 29 (0.3%) | 64 (0.7%) |
| Total | 9,909 (100.0%) | 8,629 (100.0%) |
Families and Households in Bethel Census Area
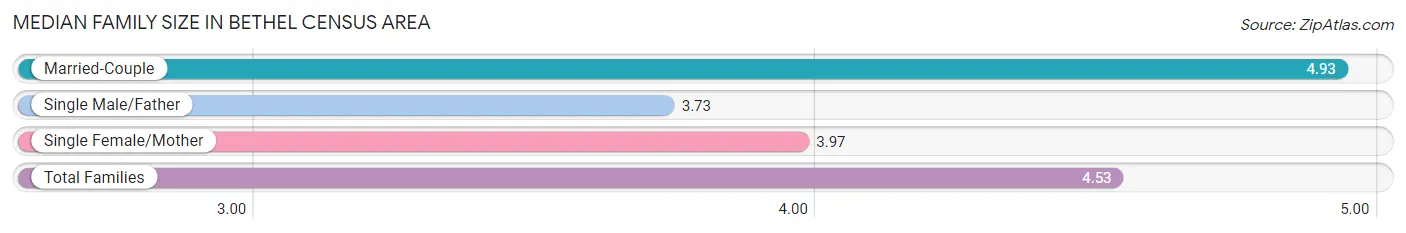
Median Family Size in Bethel Census Area
The median family size in Bethel Census Area is 4.53 persons per family, with married-couple families (2,075 | 60.7%) accounting for the largest median family size of 4.93 persons per family. On the other hand, single male/father families (404 | 11.8%) represent the smallest median family size with 3.73 persons per family.
| Family Type | # Families | Family Size |
| Married-Couple | 2,075 (60.7%) | 4.93 |
| Single Male/Father | 404 (11.8%) | 3.73 |
| Single Female/Mother | 941 (27.5%) | 3.97 |
| Total Families | 3,420 (100.0%) | 4.53 |
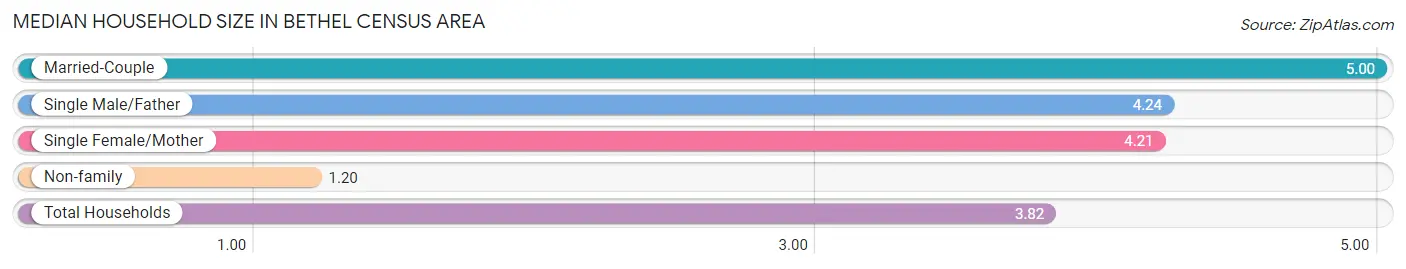
Median Household Size in Bethel Census Area
The median household size in Bethel Census Area is 3.82 persons per household, with married-couple households (2,075 | 45.5%) accounting for the largest median household size of 5 persons per household. non-family households (1,145 | 25.1%) represent the smallest median household size with 1.20 persons per household.
| Household Type | # Households | Household Size |
| Married-Couple | 2,075 (45.5%) | 5.00 |
| Single Male/Father | 404 (8.8%) | 4.24 |
| Single Female/Mother | 941 (20.6%) | 4.21 |
| Non-family | 1,145 (25.1%) | 1.20 |
| Total Households | 4,565 (100.0%) | 3.82 |
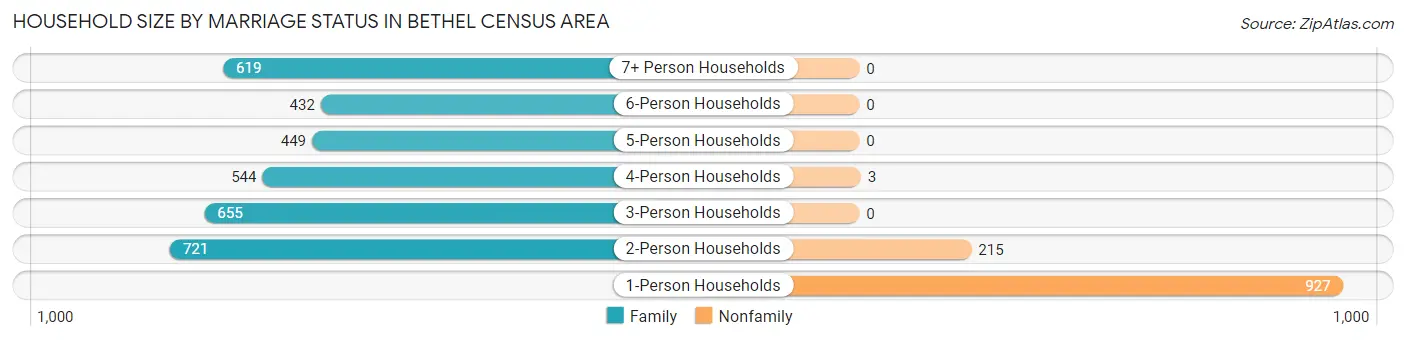
Household Size by Marriage Status in Bethel Census Area
Out of a total of 4,565 households in Bethel Census Area, 3,420 (74.9%) are family households, while 1,145 (25.1%) are nonfamily households. The most numerous type of family households are 2-person households, comprising 721, and the most common type of nonfamily households are 1-person households, comprising 927.
| Household Size | Family Households | Nonfamily Households |
| 1-Person Households | - | 927 (20.3%) |
| 2-Person Households | 721 (15.8%) | 215 (4.7%) |
| 3-Person Households | 655 (14.3%) | 0 (0.0%) |
| 4-Person Households | 544 (11.9%) | 3 (0.1%) |
| 5-Person Households | 449 (9.8%) | 0 (0.0%) |
| 6-Person Households | 432 (9.5%) | 0 (0.0%) |
| 7+ Person Households | 619 (13.6%) | 0 (0.0%) |
| Total | 3,420 (74.9%) | 1,145 (25.1%) |
Female Fertility in Bethel Census Area
Fertility by Age in Bethel Census Area
Average fertility rate in Bethel Census Area is 85.0 births per 1,000 women. Women in the age bracket of 20 to 34 years have the highest fertility rate with 144.0 births per 1,000 women. Women in the age bracket of 20 to 34 years acount for 75.5% of all women with births.
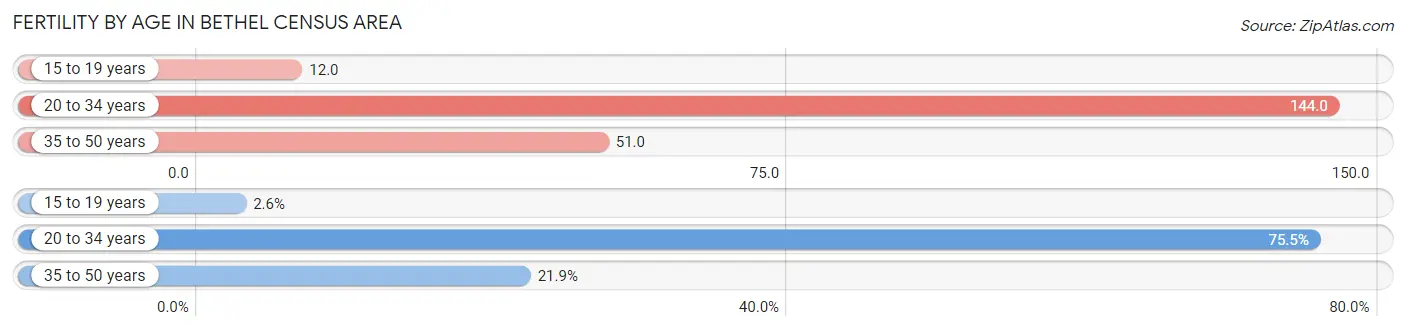
| Age Bracket | Women with Births | Births / 1,000 Women |
| 15 to 19 years | 9 (2.6%) | 12.0 |
| 20 to 34 years | 262 (75.5%) | 144.0 |
| 35 to 50 years | 76 (21.9%) | 51.0 |
| Total | 347 (100.0%) | 85.0 |
Fertility by Age by Marriage Status in Bethel Census Area
40.9% of women with births (347) in Bethel Census Area are married. The highest percentage of unmarried women with births falls into 15 to 19 years age bracket with 100.0% of them unmarried at the time of birth, while the lowest percentage of unmarried women with births belong to 35 to 50 years age bracket with 42.1% of them unmarried.
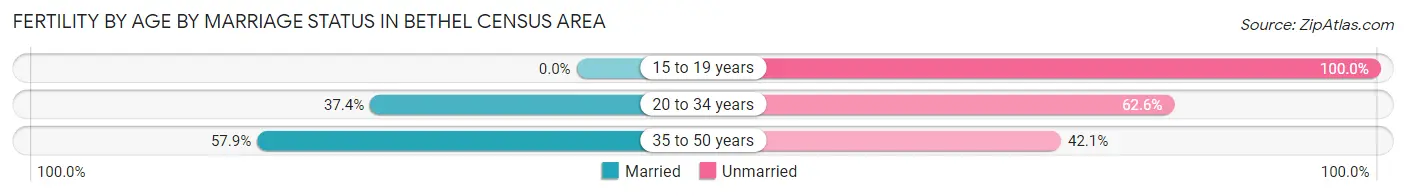
| Age Bracket | Married | Unmarried |
| 15 to 19 years | 0 (0.0%) | 9 (100.0%) |
| 20 to 34 years | 98 (37.4%) | 164 (62.6%) |
| 35 to 50 years | 44 (57.9%) | 32 (42.1%) |
| Total | 142 (40.9%) | 205 (59.1%) |
Fertility by Education in Bethel Census Area
Average fertility rate in Bethel Census Area is 85.0 births per 1,000 women. Women with the education attainment of bachelor's degree have the highest fertility rate of 125.0 births per 1,000 women, while women with the education attainment of graduate degree have the lowest fertility at 52.0 births per 1,000 women. Women with the education attainment of high school diploma represent 57.9% of all women with births.
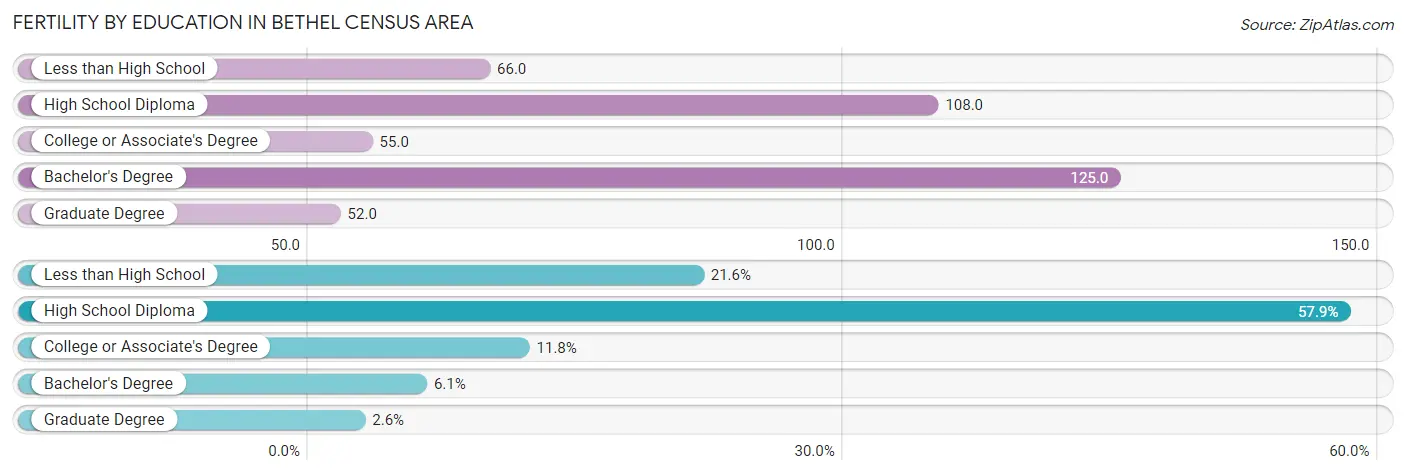
| Educational Attainment | Women with Births | Births / 1,000 Women |
| Less than High School | 75 (21.6%) | 66.0 |
| High School Diploma | 201 (57.9%) | 108.0 |
| College or Associate's Degree | 41 (11.8%) | 55.0 |
| Bachelor's Degree | 21 (6.0%) | 125.0 |
| Graduate Degree | 9 (2.6%) | 52.0 |
| Total | 347 (100.0%) | 85.0 |
Fertility by Education by Marriage Status in Bethel Census Area
59.1% of women with births in Bethel Census Area are unmarried. Women with the educational attainment of bachelor's degree are most likely to be married with 100.0% of them married at childbirth, while women with the educational attainment of high school diploma are least likely to be married with 71.1% of them unmarried at childbirth.
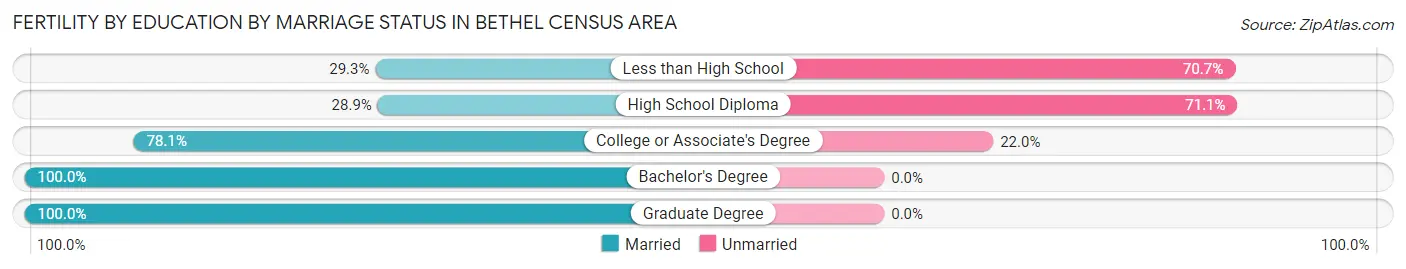
| Educational Attainment | Married | Unmarried |
| Less than High School | 22 (29.3%) | 53 (70.7%) |
| High School Diploma | 58 (28.9%) | 143 (71.1%) |
| College or Associate's Degree | 32 (78.0%) | 9 (22.0%) |
| Bachelor's Degree | 21 (100.0%) | 0 (0.0%) |
| Graduate Degree | 9 (100.0%) | 0 (0.0%) |
| Total | 142 (40.9%) | 205 (59.1%) |
Income in Bethel Census Area
Income Overview in Bethel Census Area
Per Capita Income in Bethel Census Area is $25,859, while median incomes of families and households are $67,266 and $64,094 respectively.
| Characteristic | Number | Measure |
| Per Capita Income | 18,538 | $25,859 |
| Median Family Income | 3,420 | $67,266 |
| Mean Family Income | 3,420 | $88,876 |
| Median Household Income | 4,565 | $64,094 |
| Mean Household Income | 4,565 | $85,288 |
| Income Deficit | 3,420 | $14,071 |
| Wage / Income Gap (%) | 18,538 | 2.06% |
| Wage / Income Gap ($) | 18,538 | 97.94¢ per $1 |
| Gini / Inequality Index | 18,538 | 0.46 |
Earnings by Sex in Bethel Census Area
Average Earnings in Bethel Census Area are $28,682, $28,819 for men and $28,226 for women, a difference of 2.1%.
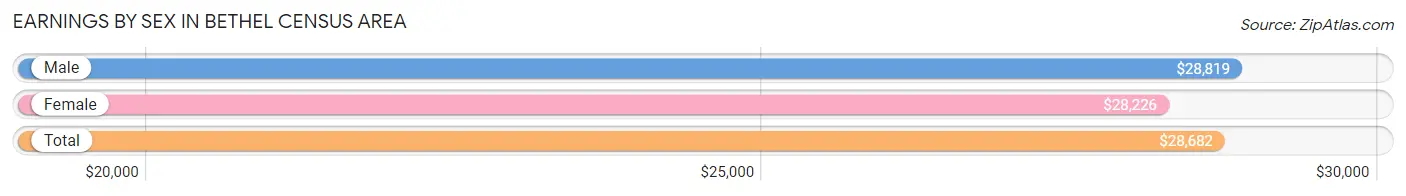
| Sex | Number | Average Earnings |
| Male | 4,801 (56.2%) | $28,819 |
| Female | 3,736 (43.8%) | $28,226 |
| Total | 8,537 (100.0%) | $28,682 |
Earnings by Sex by Income Bracket in Bethel Census Area
The most common earnings brackets in Bethel Census Area are $100,000+ for men (737 | 15.3%) and $2,499 or less for women (488 | 13.1%).
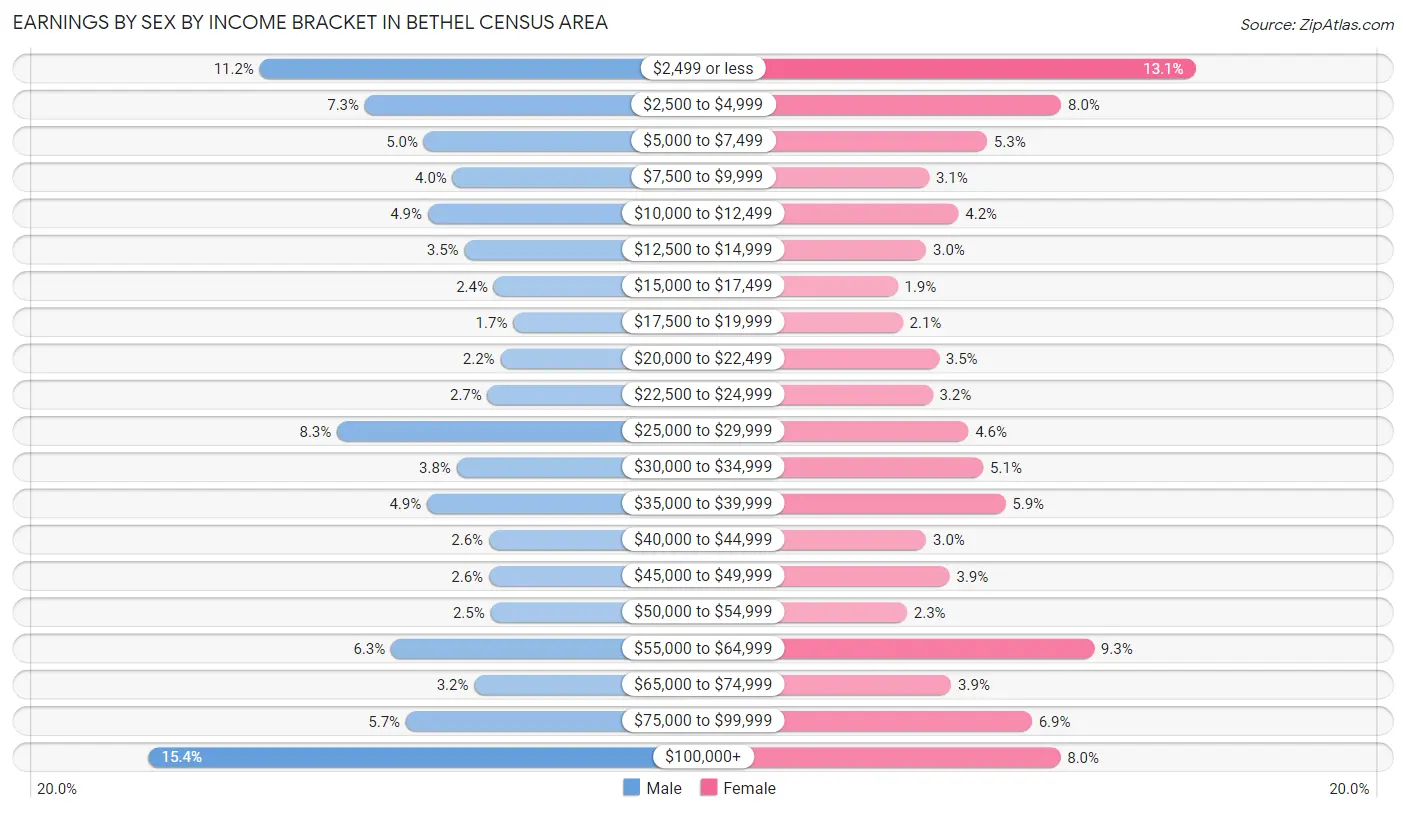
| Income | Male | Female |
| $2,499 or less | 537 (11.2%) | 488 (13.1%) |
| $2,500 to $4,999 | 348 (7.2%) | 300 (8.0%) |
| $5,000 to $7,499 | 242 (5.0%) | 196 (5.2%) |
| $7,500 to $9,999 | 190 (4.0%) | 115 (3.1%) |
| $10,000 to $12,499 | 235 (4.9%) | 156 (4.2%) |
| $12,500 to $14,999 | 169 (3.5%) | 111 (3.0%) |
| $15,000 to $17,499 | 116 (2.4%) | 71 (1.9%) |
| $17,500 to $19,999 | 81 (1.7%) | 78 (2.1%) |
| $20,000 to $22,499 | 104 (2.2%) | 129 (3.5%) |
| $22,500 to $24,999 | 127 (2.6%) | 120 (3.2%) |
| $25,000 to $29,999 | 398 (8.3%) | 170 (4.5%) |
| $30,000 to $34,999 | 183 (3.8%) | 191 (5.1%) |
| $35,000 to $39,999 | 236 (4.9%) | 222 (5.9%) |
| $40,000 to $44,999 | 125 (2.6%) | 111 (3.0%) |
| $45,000 to $49,999 | 125 (2.6%) | 144 (3.8%) |
| $50,000 to $54,999 | 122 (2.5%) | 84 (2.2%) |
| $55,000 to $64,999 | 301 (6.3%) | 346 (9.3%) |
| $65,000 to $74,999 | 151 (3.2%) | 146 (3.9%) |
| $75,000 to $99,999 | 274 (5.7%) | 259 (6.9%) |
| $100,000+ | 737 (15.3%) | 299 (8.0%) |
| Total | 4,801 (100.0%) | 3,736 (100.0%) |
Earnings by Sex by Educational Attainment in Bethel Census Area
Average earnings in Bethel Census Area are $32,813 for men and $35,472 for women, a difference of 7.5%. Men with an educational attainment of graduate degree enjoy the highest average annual earnings of $105,341, while those with less than high school education earn the least with $9,000. Women with an educational attainment of graduate degree earn the most with the average annual earnings of $93,000, while those with less than high school education have the smallest earnings of $11,389.
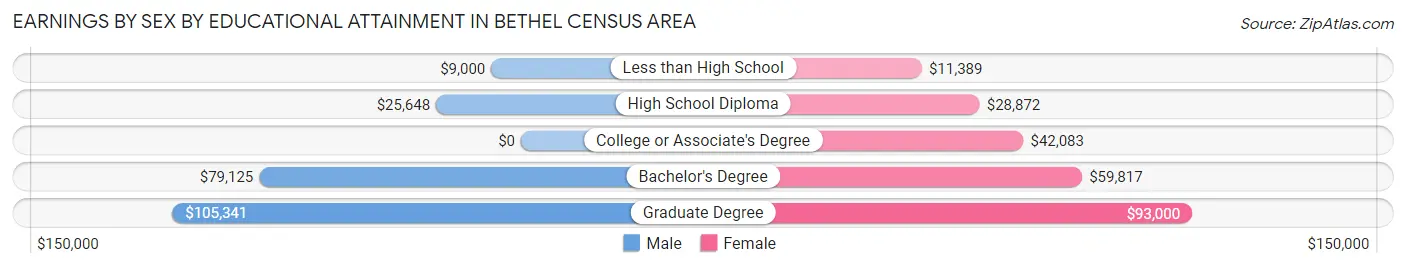
| Educational Attainment | Male Income | Female Income |
| Less than High School | $9,000 | $11,389 |
| High School Diploma | $25,648 | $28,872 |
| College or Associate's Degree | - | - |
| Bachelor's Degree | $79,125 | $59,817 |
| Graduate Degree | $105,341 | $93,000 |
| Total | $32,813 | $35,472 |
Family Income in Bethel Census Area
Family Income Brackets in Bethel Census Area
According to the Bethel Census Area family income data, there are 592 families falling into the $50,000 to $74,999 income range, which is the most common income bracket and makes up 17.3% of all families. Conversely, the $10,000 to $14,999 income bracket is the least frequent group with only 106 families (3.1%) belonging to this category.
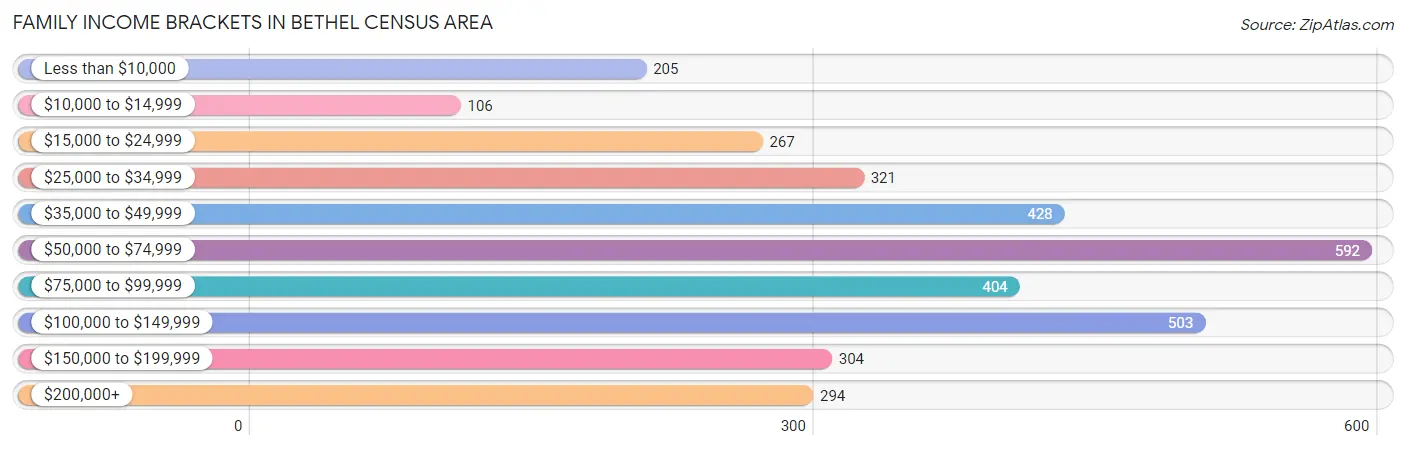
| Income Bracket | # Families | % Families |
| Less than $10,000 | 205 | 6.0% |
| $10,000 to $14,999 | 106 | 3.1% |
| $15,000 to $24,999 | 267 | 7.8% |
| $25,000 to $34,999 | 321 | 9.4% |
| $35,000 to $49,999 | 428 | 12.5% |
| $50,000 to $74,999 | 592 | 17.3% |
| $75,000 to $99,999 | 404 | 11.8% |
| $100,000 to $149,999 | 503 | 14.7% |
| $150,000 to $199,999 | 304 | 8.9% |
| $200,000+ | 294 | 8.6% |
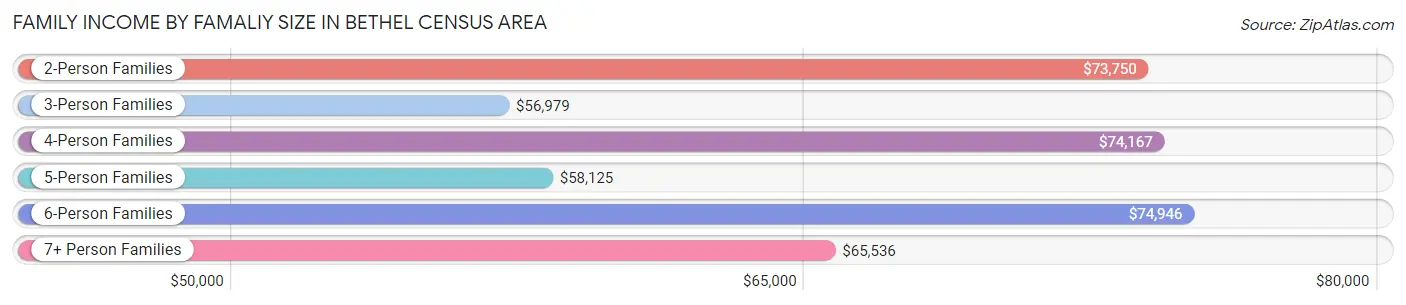
Family Income by Famaliy Size in Bethel Census Area
6-person families (421 | 12.3%) account for the highest median family income in Bethel Census Area with $74,946 per family, while 2-person families (840 | 24.6%) have the highest median income of $36,875 per family member.
| Income Bracket | # Families | Median Income |
| 2-Person Families | 840 (24.6%) | $73,750 |
| 3-Person Families | 623 (18.2%) | $56,979 |
| 4-Person Families | 512 (15.0%) | $74,167 |
| 5-Person Families | 481 (14.1%) | $58,125 |
| 6-Person Families | 421 (12.3%) | $74,946 |
| 7+ Person Families | 543 (15.9%) | $65,536 |
| Total | 3,420 (100.0%) | $67,266 |
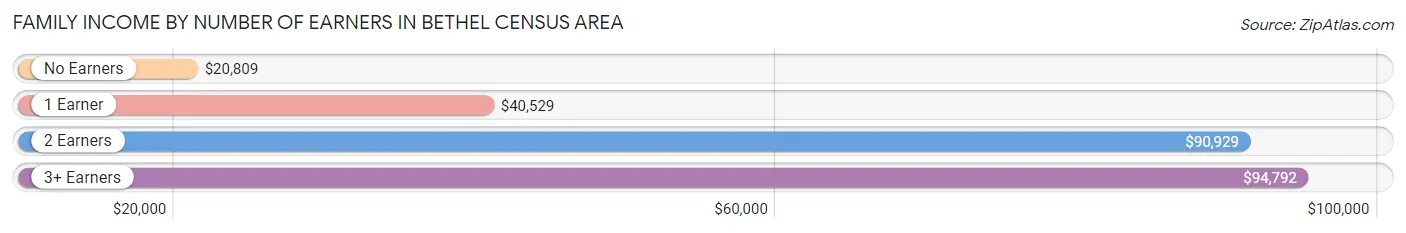
Family Income by Number of Earners in Bethel Census Area
The median family income in Bethel Census Area is $67,266, with families comprising 3+ earners (689) having the highest median family income of $94,792, while families with no earners (377) have the lowest median family income of $20,809, accounting for 20.2% and 11.0% of families, respectively.
| Number of Earners | # Families | Median Income |
| No Earners | 377 (11.0%) | $20,809 |
| 1 Earner | 944 (27.6%) | $40,529 |
| 2 Earners | 1,410 (41.2%) | $90,929 |
| 3+ Earners | 689 (20.2%) | $94,792 |
| Total | 3,420 (100.0%) | $67,266 |
Household Income in Bethel Census Area
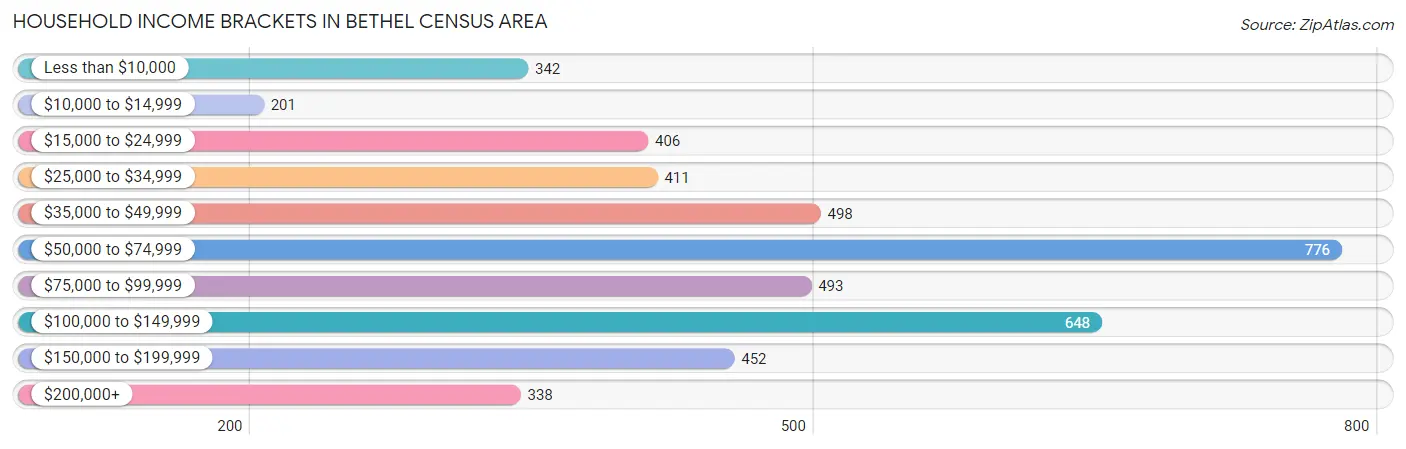
Household Income Brackets in Bethel Census Area
With 776 households falling in the category, the $50,000 to $74,999 income range is the most frequent in Bethel Census Area, accounting for 17.0% of all households. In contrast, only 201 households (4.4%) fall into the $10,000 to $14,999 income bracket, making it the least populous group.
| Income Bracket | # Households | % Households |
| Less than $10,000 | 342 | 7.5% |
| $10,000 to $14,999 | 201 | 4.4% |
| $15,000 to $24,999 | 406 | 8.9% |
| $25,000 to $34,999 | 411 | 9.0% |
| $35,000 to $49,999 | 498 | 10.9% |
| $50,000 to $74,999 | 776 | 17.0% |
| $75,000 to $99,999 | 493 | 10.8% |
| $100,000 to $149,999 | 648 | 14.2% |
| $150,000 to $199,999 | 452 | 9.9% |
| $200,000+ | 338 | 7.4% |
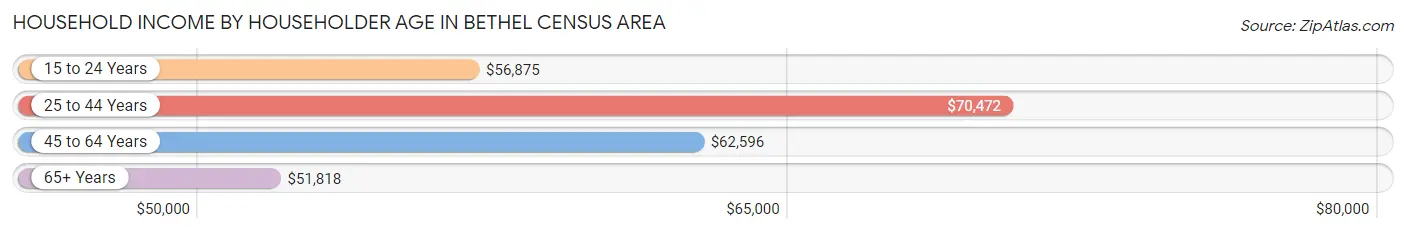
Household Income by Householder Age in Bethel Census Area
The median household income in Bethel Census Area is $64,094, with the highest median household income of $70,472 found in the 25 to 44 years age bracket for the primary householder. A total of 1,461 households (32.0%) fall into this category. Meanwhile, the 65+ years age bracket for the primary householder has the lowest median household income of $51,818, with 898 households (19.7%) in this group.
| Income Bracket | # Households | Median Income |
| 15 to 24 Years | 161 (3.5%) | $56,875 |
| 25 to 44 Years | 1,461 (32.0%) | $70,472 |
| 45 to 64 Years | 2,045 (44.8%) | $62,596 |
| 65+ Years | 898 (19.7%) | $51,818 |
| Total | 4,565 (100.0%) | $64,094 |
Poverty in Bethel Census Area
Income Below Poverty by Sex and Age in Bethel Census Area
With 25.2% poverty level for males and 25.3% for females among the residents of Bethel Census Area, 6 to 11 year old males and 6 to 11 year old females are the most vulnerable to poverty, with 389 males (35.0%) and 327 females (35.2%) in their respective age groups living below the poverty level.
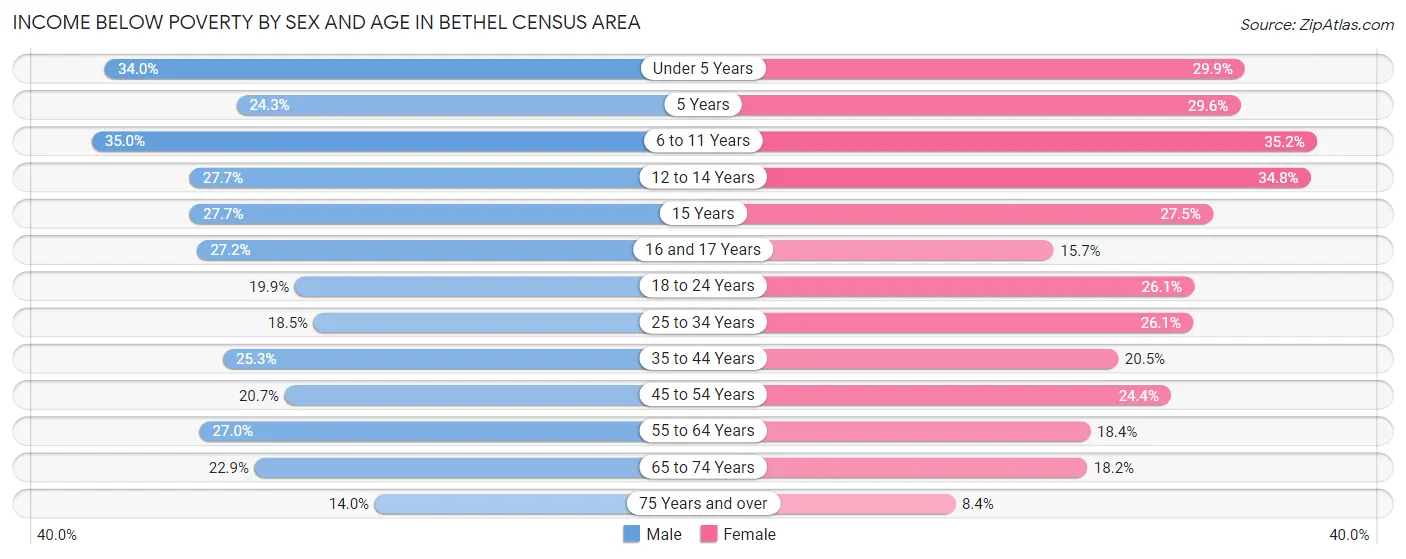
| Age Bracket | Male | Female |
| Under 5 Years | 346 (34.0%) | 283 (29.9%) |
| 5 Years | 50 (24.3%) | 76 (29.6%) |
| 6 to 11 Years | 389 (35.0%) | 327 (35.2%) |
| 12 to 14 Years | 117 (27.7%) | 175 (34.8%) |
| 15 Years | 46 (27.7%) | 60 (27.5%) |
| 16 and 17 Years | 84 (27.2%) | 41 (15.7%) |
| 18 to 24 Years | 198 (19.9%) | 240 (26.1%) |
| 25 to 34 Years | 286 (18.5%) | 306 (26.1%) |
| 35 to 44 Years | 244 (25.3%) | 205 (20.5%) |
| 45 to 54 Years | 222 (20.7%) | 191 (24.4%) |
| 55 to 64 Years | 283 (27.0%) | 162 (18.4%) |
| 65 to 74 Years | 123 (22.9%) | 85 (18.2%) |
| 75 Years and over | 27 (14.0%) | 20 (8.4%) |
| Total | 2,415 (25.2%) | 2,171 (25.3%) |
Income Above Poverty by Sex and Age in Bethel Census Area
According to the poverty statistics in Bethel Census Area, males aged 75 years and over and females aged 75 years and over are the age groups that are most secure financially, with 86.0% of males and 91.6% of females in these age groups living above the poverty line.
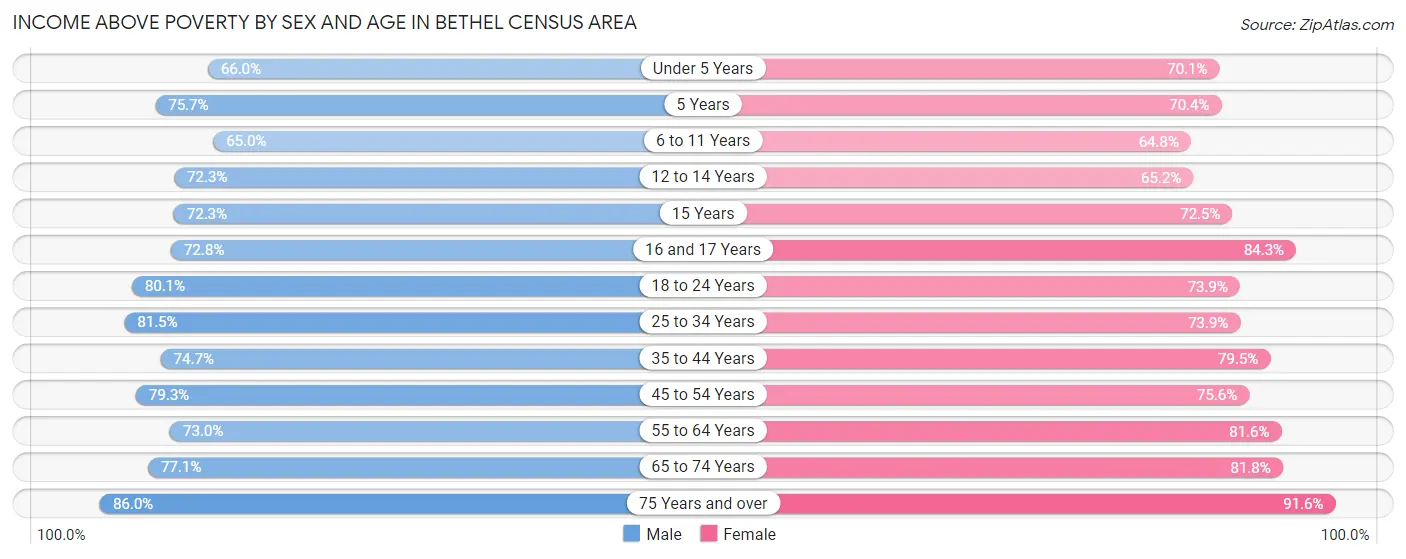
| Age Bracket | Male | Female |
| Under 5 Years | 671 (66.0%) | 663 (70.1%) |
| 5 Years | 156 (75.7%) | 181 (70.4%) |
| 6 to 11 Years | 722 (65.0%) | 601 (64.8%) |
| 12 to 14 Years | 305 (72.3%) | 328 (65.2%) |
| 15 Years | 120 (72.3%) | 158 (72.5%) |
| 16 and 17 Years | 225 (72.8%) | 220 (84.3%) |
| 18 to 24 Years | 796 (80.1%) | 678 (73.9%) |
| 25 to 34 Years | 1,258 (81.5%) | 868 (73.9%) |
| 35 to 44 Years | 722 (74.7%) | 795 (79.5%) |
| 45 to 54 Years | 852 (79.3%) | 591 (75.6%) |
| 55 to 64 Years | 765 (73.0%) | 717 (81.6%) |
| 65 to 74 Years | 414 (77.1%) | 382 (81.8%) |
| 75 Years and over | 166 (86.0%) | 218 (91.6%) |
| Total | 7,172 (74.8%) | 6,400 (74.7%) |
Income Below Poverty Among Married-Couple Families in Bethel Census Area
The poverty statistics for married-couple families in Bethel Census Area show that 18.9% or 393 of the total 2,075 families live below the poverty line. Families with 5 or more children have the highest poverty rate of 48.6%, comprising of 106 families. On the other hand, families with no children have the lowest poverty rate of 5.6%, which includes 37 families.
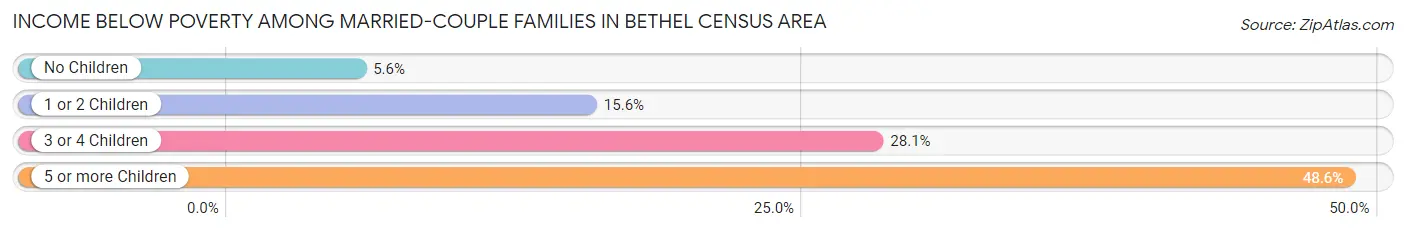
| Children | Above Poverty | Below Poverty |
| No Children | 626 (94.4%) | 37 (5.6%) |
| 1 or 2 Children | 578 (84.4%) | 107 (15.6%) |
| 3 or 4 Children | 366 (71.9%) | 143 (28.1%) |
| 5 or more Children | 112 (51.4%) | 106 (48.6%) |
| Total | 1,682 (81.1%) | 393 (18.9%) |
Income Below Poverty Among Single-Parent Households in Bethel Census Area
According to the poverty data in Bethel Census Area, 43.1% or 174 single-father households and 22.2% or 209 single-mother households are living below the poverty line. Among single-father households, those with 3 or 4 children have the highest poverty rate, with 49 households (71.0%) experiencing poverty. Likewise, among single-mother households, those with 3 or 4 children have the highest poverty rate, with 71 households (53.4%) falling below the poverty line.
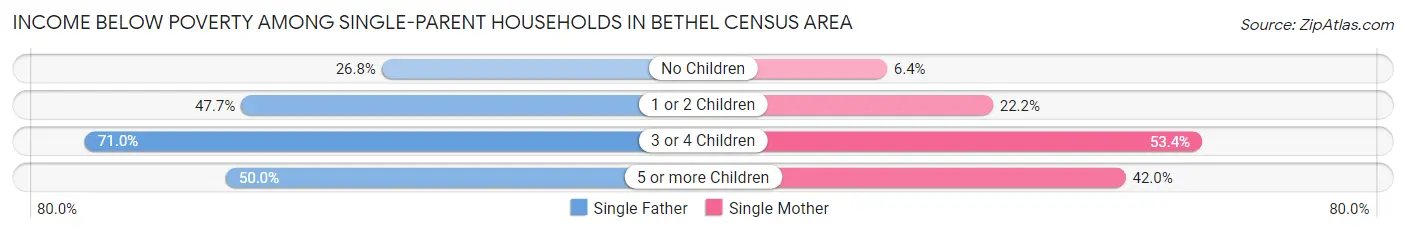
| Children | Single Father | Single Mother |
| No Children | 45 (26.8%) | 21 (6.4%) |
| 1 or 2 Children | 74 (47.7%) | 96 (22.2%) |
| 3 or 4 Children | 49 (71.0%) | 71 (53.4%) |
| 5 or more Children | 6 (50.0%) | 21 (42.0%) |
| Total | 174 (43.1%) | 209 (22.2%) |
Income Below Poverty Among Married-Couple vs Single-Parent Households in Bethel Census Area
The poverty data for Bethel Census Area shows that 393 of the married-couple family households (18.9%) and 383 of the single-parent households (28.5%) are living below the poverty level. Within the married-couple family households, those with 5 or more children have the highest poverty rate, with 106 households (48.6%) falling below the poverty line. Among the single-parent households, those with 3 or 4 children have the highest poverty rate, with 120 household (59.4%) living below poverty.
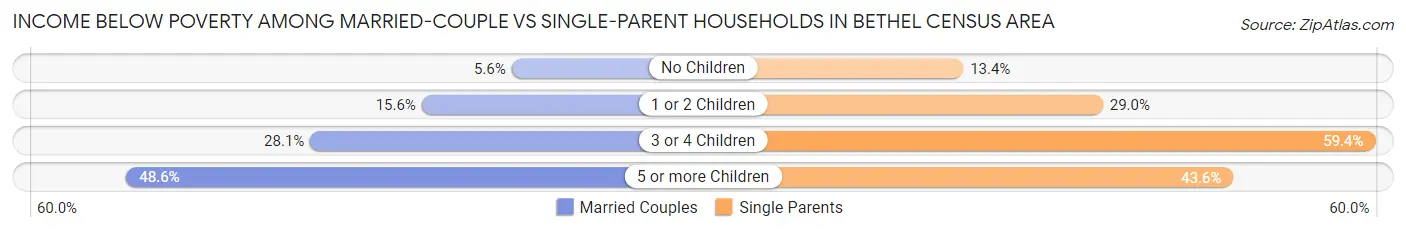
| Children | Married-Couple Families | Single-Parent Households |
| No Children | 37 (5.6%) | 66 (13.4%) |
| 1 or 2 Children | 107 (15.6%) | 170 (29.0%) |
| 3 or 4 Children | 143 (28.1%) | 120 (59.4%) |
| 5 or more Children | 106 (48.6%) | 27 (43.5%) |
| Total | 393 (18.9%) | 383 (28.5%) |
Employment Characteristics in Bethel Census Area
Employment by Class of Employer in Bethel Census Area
Among the 6,444 employed individuals in Bethel Census Area, private company employees (2,022 | 31.4%), local government employees (1,582 | 24.5%), and not-for-profit organizations (1,288 | 20.0%) make up the most common classes of employment.
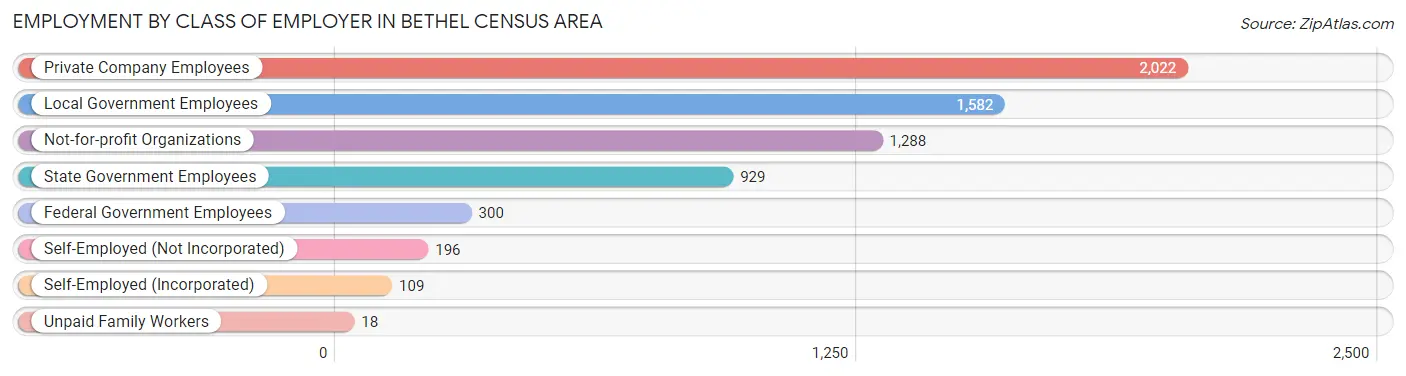
| Employer Class | # Employees | % Employees |
| Private Company Employees | 2,022 | 31.4% |
| Self-Employed (Incorporated) | 109 | 1.7% |
| Self-Employed (Not Incorporated) | 196 | 3.0% |
| Not-for-profit Organizations | 1,288 | 20.0% |
| Local Government Employees | 1,582 | 24.5% |
| State Government Employees | 929 | 14.4% |
| Federal Government Employees | 300 | 4.7% |
| Unpaid Family Workers | 18 | 0.3% |
| Total | 6,444 | 100.0% |
Employment Status by Age in Bethel Census Area
According to the labor force statistics for Bethel Census Area, out of the total population over 16 years of age (12,669), 62.1% or 7,867 individuals are in the labor force, with 16.2% or 1,274 of them unemployed. The age group with the highest labor force participation rate is 45 to 54 years, with 81.9% or 1,538 individuals in the labor force. Within the labor force, the 16 to 19 years age range has the highest percentage of unemployed individuals, with 50.4% or 138 of them being unemployed.
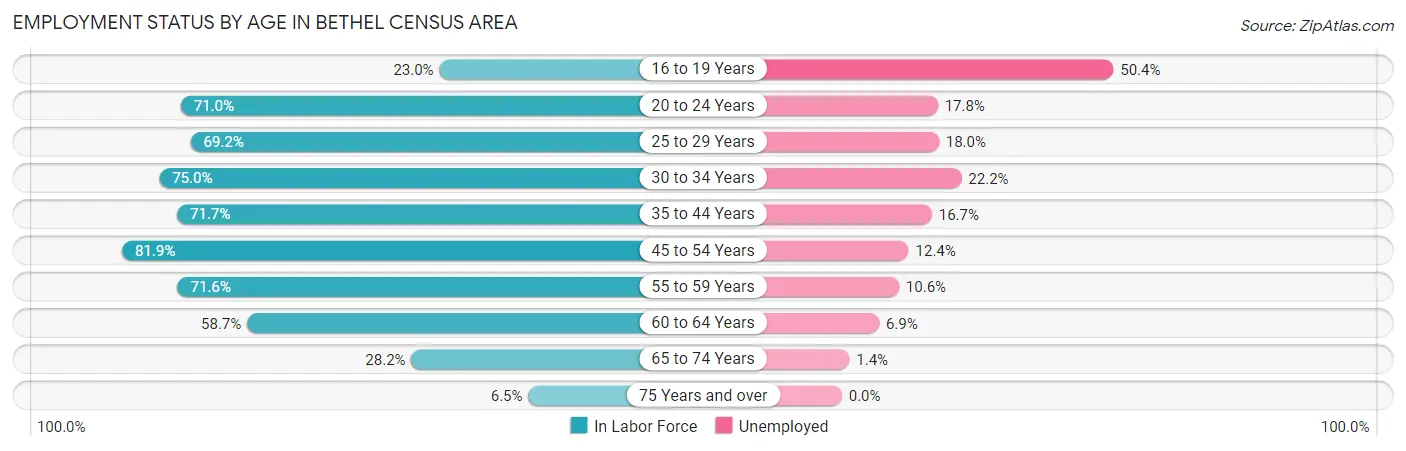
| Age Bracket | In Labor Force | Unemployed |
| 16 to 19 Years | 273 (23.0%) | 138 (50.4%) |
| 20 to 24 Years | 974 (71.0%) | 173 (17.8%) |
| 25 to 29 Years | 941 (69.2%) | 169 (18.0%) |
| 30 to 34 Years | 1,090 (75.0%) | 242 (22.2%) |
| 35 to 44 Years | 1,448 (71.7%) | 242 (16.7%) |
| 45 to 54 Years | 1,538 (81.9%) | 191 (12.4%) |
| 55 to 59 Years | 735 (71.6%) | 78 (10.6%) |
| 60 to 64 Years | 549 (58.7%) | 38 (6.9%) |
| 65 to 74 Years | 283 (28.2%) | 4 (1.4%) |
| 75 Years and over | 28 (6.5%) | 0 (0.0%) |
| Total | 7,867 (62.1%) | 1,274 (16.2%) |
Employment Status by Educational Attainment in Bethel Census Area
According to labor force statistics for Bethel Census Area, 72.7% of individuals (6,306) out of the total population between 25 and 64 years of age (8,674) are in the labor force, with 15.2% or 959 of them being unemployed. The group with the highest labor force participation rate are those with the educational attainment of bachelor's degree or higher, with 90.2% or 727 individuals in the labor force. Within the labor force, individuals with less than high school education have the highest percentage of unemployment, with 38.5% or 227 of them being unemployed.
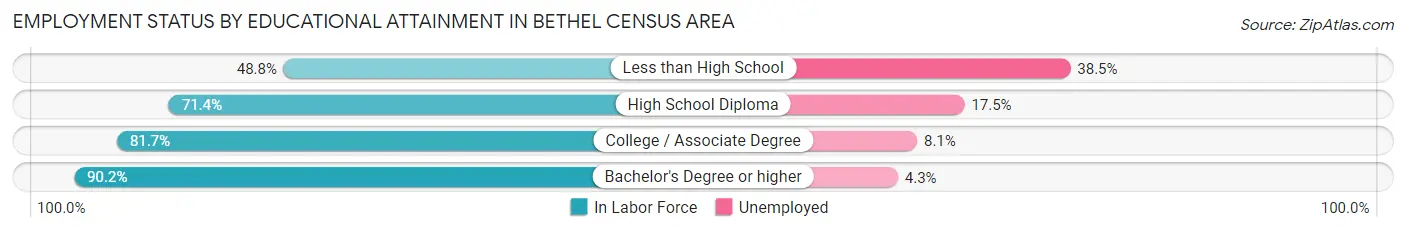
| Educational Attainment | In Labor Force | Unemployed |
| Less than High School | 590 (48.8%) | 465 (38.5%) |
| High School Diploma | 3,138 (71.4%) | 769 (17.5%) |
| College / Associate Degree | 1,851 (81.7%) | 183 (8.1%) |
| Bachelor's Degree or higher | 727 (90.2%) | 35 (4.3%) |
| Total | 6,306 (72.7%) | 1,318 (15.2%) |
Employment Occupations by Sex in Bethel Census Area
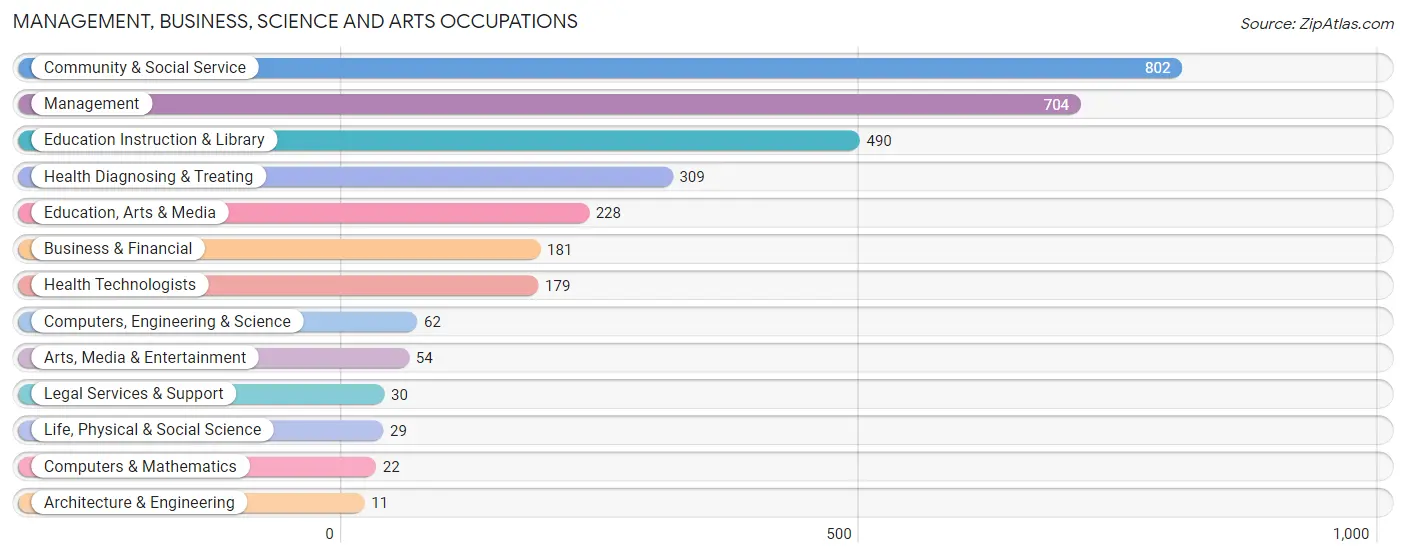
Management, Business, Science and Arts Occupations
The most common Management, Business, Science and Arts occupations in Bethel Census Area are Community & Social Service (802 | 12.2%), Management (704 | 10.7%), Education Instruction & Library (490 | 7.5%), Health Diagnosing & Treating (309 | 4.7%), and Education, Arts & Media (228 | 3.5%).
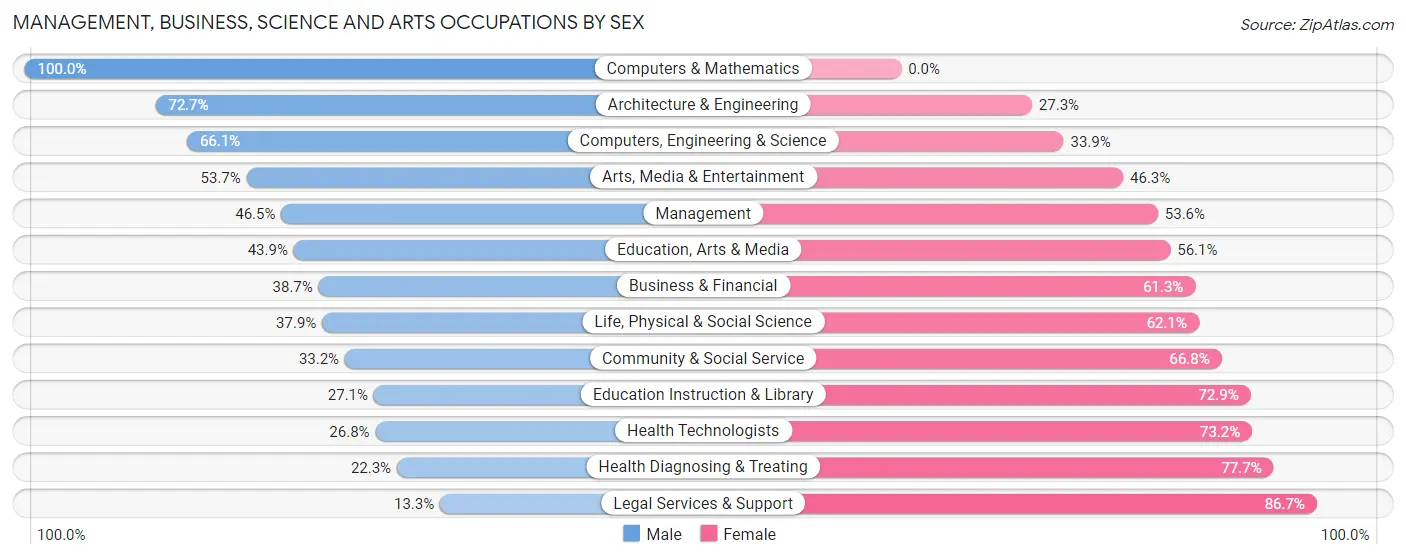
Management, Business, Science and Arts Occupations by Sex
Within the Management, Business, Science and Arts occupations in Bethel Census Area, the most male-oriented occupations are Computers & Mathematics (100.0%), Architecture & Engineering (72.7%), and Computers, Engineering & Science (66.1%), while the most female-oriented occupations are Legal Services & Support (86.7%), Health Diagnosing & Treating (77.7%), and Health Technologists (73.2%).
| Occupation | Male | Female |
| Management | 327 (46.5%) | 377 (53.5%) |
| Business & Financial | 70 (38.7%) | 111 (61.3%) |
| Computers, Engineering & Science | 41 (66.1%) | 21 (33.9%) |
| Computers & Mathematics | 22 (100.0%) | 0 (0.0%) |
| Architecture & Engineering | 8 (72.7%) | 3 (27.3%) |
| Life, Physical & Social Science | 11 (37.9%) | 18 (62.1%) |
| Community & Social Service | 266 (33.2%) | 536 (66.8%) |
| Education, Arts & Media | 100 (43.9%) | 128 (56.1%) |
| Legal Services & Support | 4 (13.3%) | 26 (86.7%) |
| Education Instruction & Library | 133 (27.1%) | 357 (72.9%) |
| Arts, Media & Entertainment | 29 (53.7%) | 25 (46.3%) |
| Health Diagnosing & Treating | 69 (22.3%) | 240 (77.7%) |
| Health Technologists | 48 (26.8%) | 131 (73.2%) |
| Total (Category) | 773 (37.6%) | 1,285 (62.4%) |
| Total (Overall) | 3,548 (54.1%) | 3,014 (45.9%) |
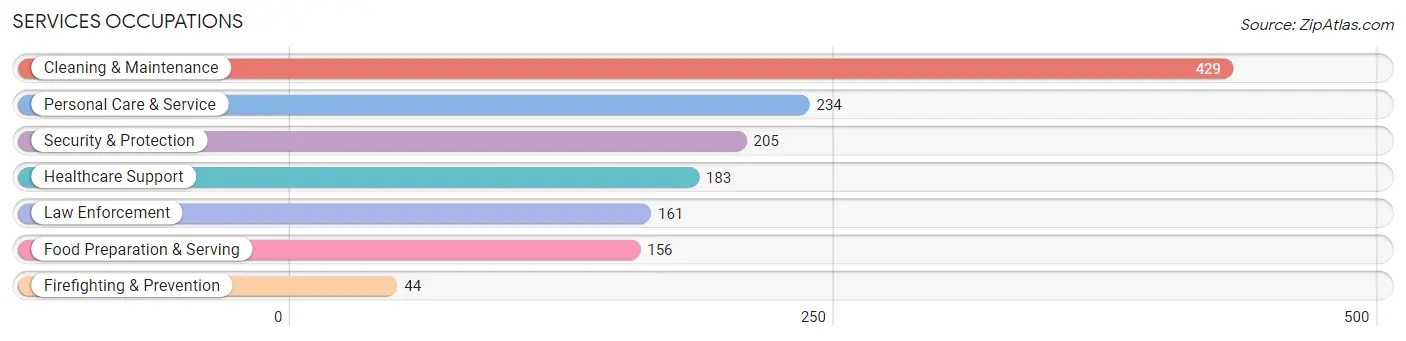
Services Occupations
The most common Services occupations in Bethel Census Area are Cleaning & Maintenance (429 | 6.5%), Personal Care & Service (234 | 3.6%), Security & Protection (205 | 3.1%), Healthcare Support (183 | 2.8%), and Law Enforcement (161 | 2.5%).
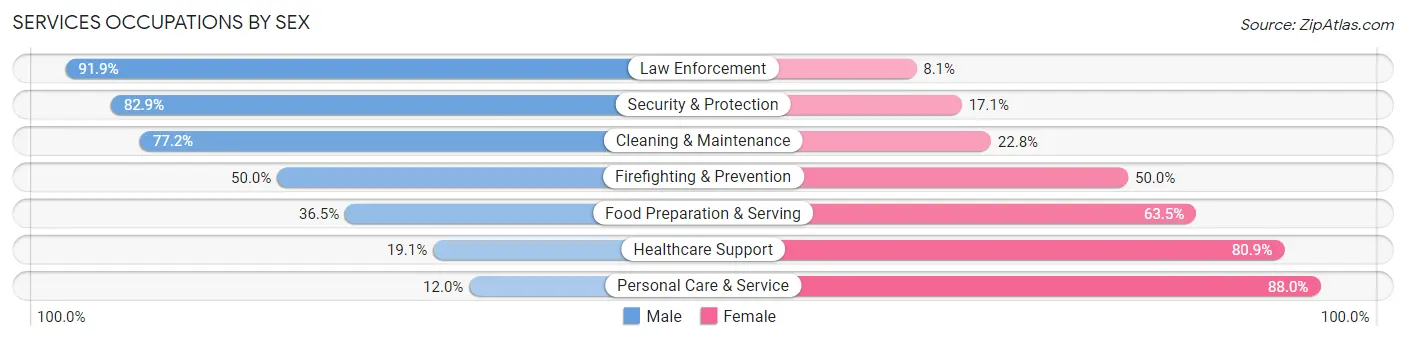
Services Occupations by Sex
Within the Services occupations in Bethel Census Area, the most male-oriented occupations are Law Enforcement (91.9%), Security & Protection (82.9%), and Cleaning & Maintenance (77.2%), while the most female-oriented occupations are Personal Care & Service (88.0%), Healthcare Support (80.9%), and Food Preparation & Serving (63.5%).
| Occupation | Male | Female |
| Healthcare Support | 35 (19.1%) | 148 (80.9%) |
| Security & Protection | 170 (82.9%) | 35 (17.1%) |
| Firefighting & Prevention | 22 (50.0%) | 22 (50.0%) |
| Law Enforcement | 148 (91.9%) | 13 (8.1%) |
| Food Preparation & Serving | 57 (36.5%) | 99 (63.5%) |
| Cleaning & Maintenance | 331 (77.2%) | 98 (22.8%) |
| Personal Care & Service | 28 (12.0%) | 206 (88.0%) |
| Total (Category) | 621 (51.4%) | 586 (48.5%) |
| Total (Overall) | 3,548 (54.1%) | 3,014 (45.9%) |
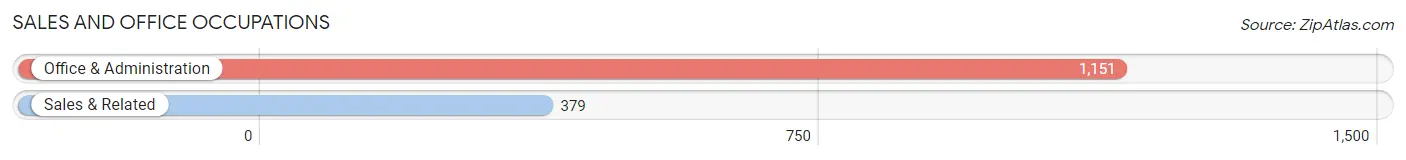
Sales and Office Occupations
The most common Sales and Office occupations in Bethel Census Area are Office & Administration (1,151 | 17.5%), and Sales & Related (379 | 5.8%).
Sales and Office Occupations by Sex
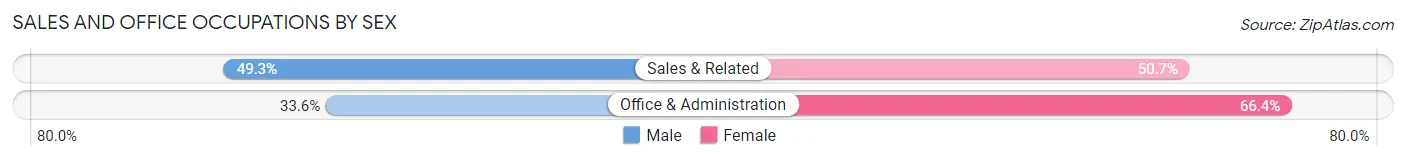
| Occupation | Male | Female |
| Sales & Related | 187 (49.3%) | 192 (50.7%) |
| Office & Administration | 387 (33.6%) | 764 (66.4%) |
| Total (Category) | 574 (37.5%) | 956 (62.5%) |
| Total (Overall) | 3,548 (54.1%) | 3,014 (45.9%) |
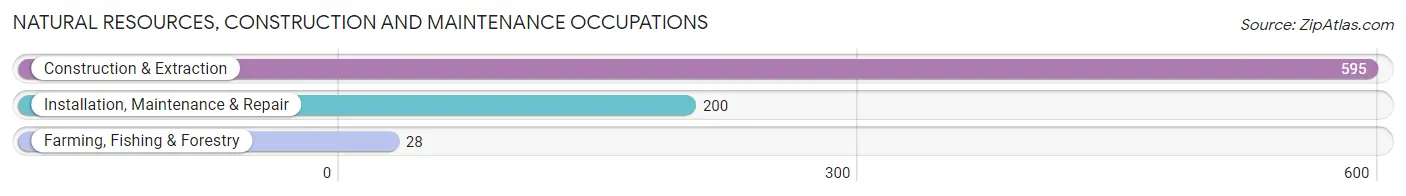
Natural Resources, Construction and Maintenance Occupations
The most common Natural Resources, Construction and Maintenance occupations in Bethel Census Area are Construction & Extraction (595 | 9.1%), Installation, Maintenance & Repair (200 | 3.0%), and Farming, Fishing & Forestry (28 | 0.4%).
Natural Resources, Construction and Maintenance Occupations by Sex
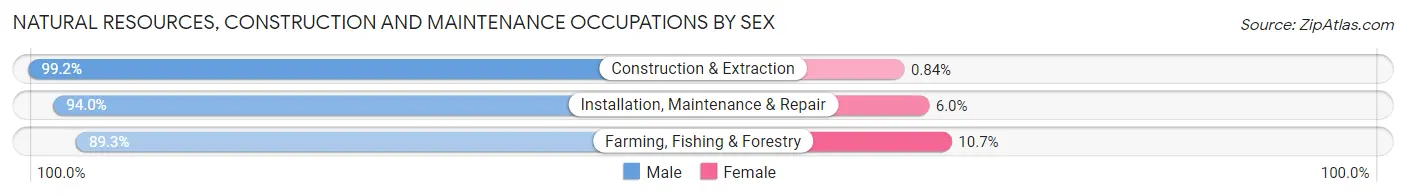
| Occupation | Male | Female |
| Farming, Fishing & Forestry | 25 (89.3%) | 3 (10.7%) |
| Construction & Extraction | 590 (99.2%) | 5 (0.8%) |
| Installation, Maintenance & Repair | 188 (94.0%) | 12 (6.0%) |
| Total (Category) | 803 (97.6%) | 20 (2.4%) |
| Total (Overall) | 3,548 (54.1%) | 3,014 (45.9%) |
Production, Transportation and Moving Occupations
The most common Production, Transportation and Moving occupations in Bethel Census Area are Transportation (360 | 5.5%), Production (297 | 4.5%), and Material Moving (287 | 4.4%).
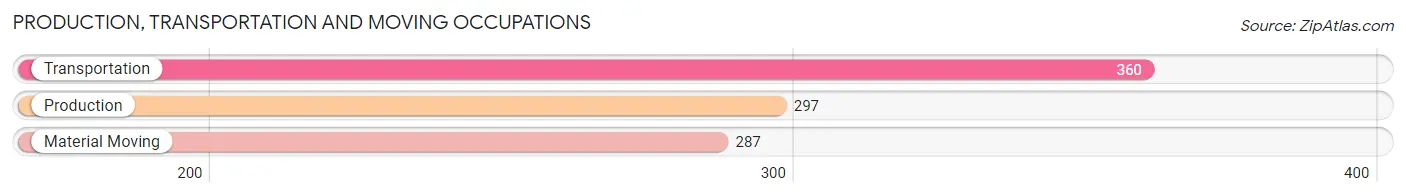
Production, Transportation and Moving Occupations by Sex
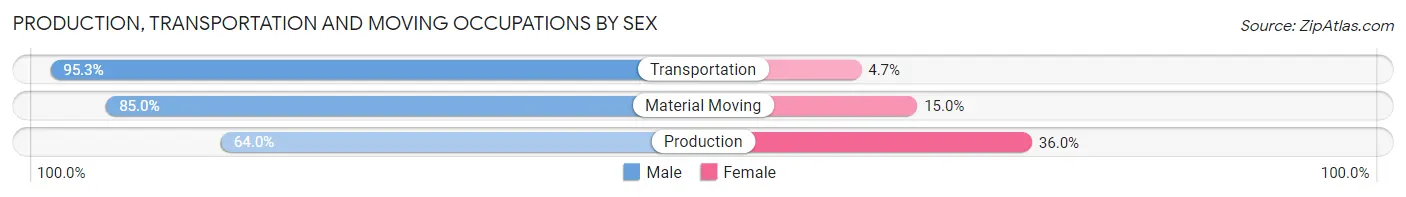
| Occupation | Male | Female |
| Production | 190 (64.0%) | 107 (36.0%) |
| Transportation | 343 (95.3%) | 17 (4.7%) |
| Material Moving | 244 (85.0%) | 43 (15.0%) |
| Total (Category) | 777 (82.3%) | 167 (17.7%) |
| Total (Overall) | 3,548 (54.1%) | 3,014 (45.9%) |
Employment Industries by Sex in Bethel Census Area
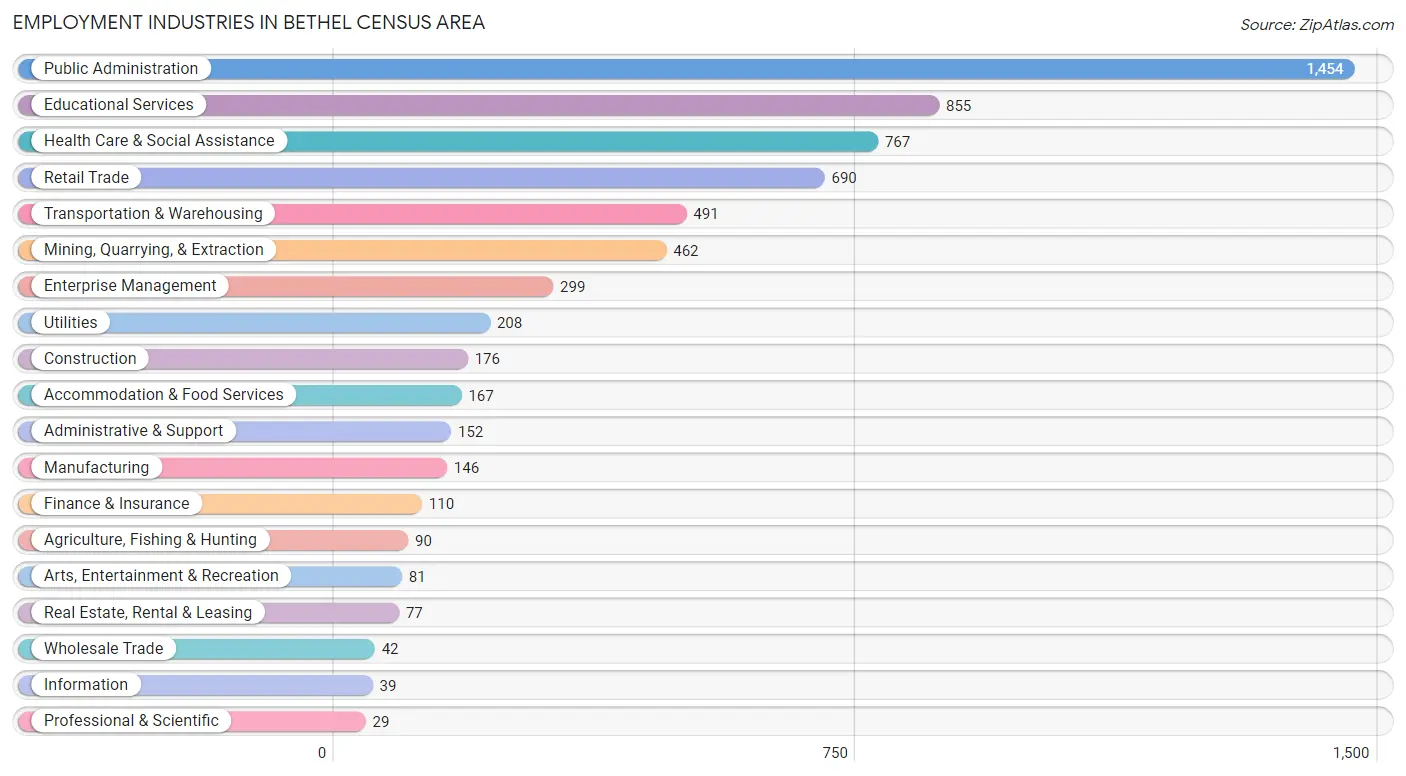
Employment Industries in Bethel Census Area
The major employment industries in Bethel Census Area include Public Administration (1,454 | 22.2%), Educational Services (855 | 13.0%), Health Care & Social Assistance (767 | 11.7%), Retail Trade (690 | 10.5%), and Transportation & Warehousing (491 | 7.5%).
Employment Industries by Sex in Bethel Census Area
The Bethel Census Area industries that see more men than women are Mining, Quarrying, & Extraction (96.8%), Agriculture, Fishing & Hunting (95.6%), and Construction (92.6%), whereas the industries that tend to have a higher number of women are Professional & Scientific (75.9%), Enterprise Management (71.2%), and Health Care & Social Assistance (69.2%).
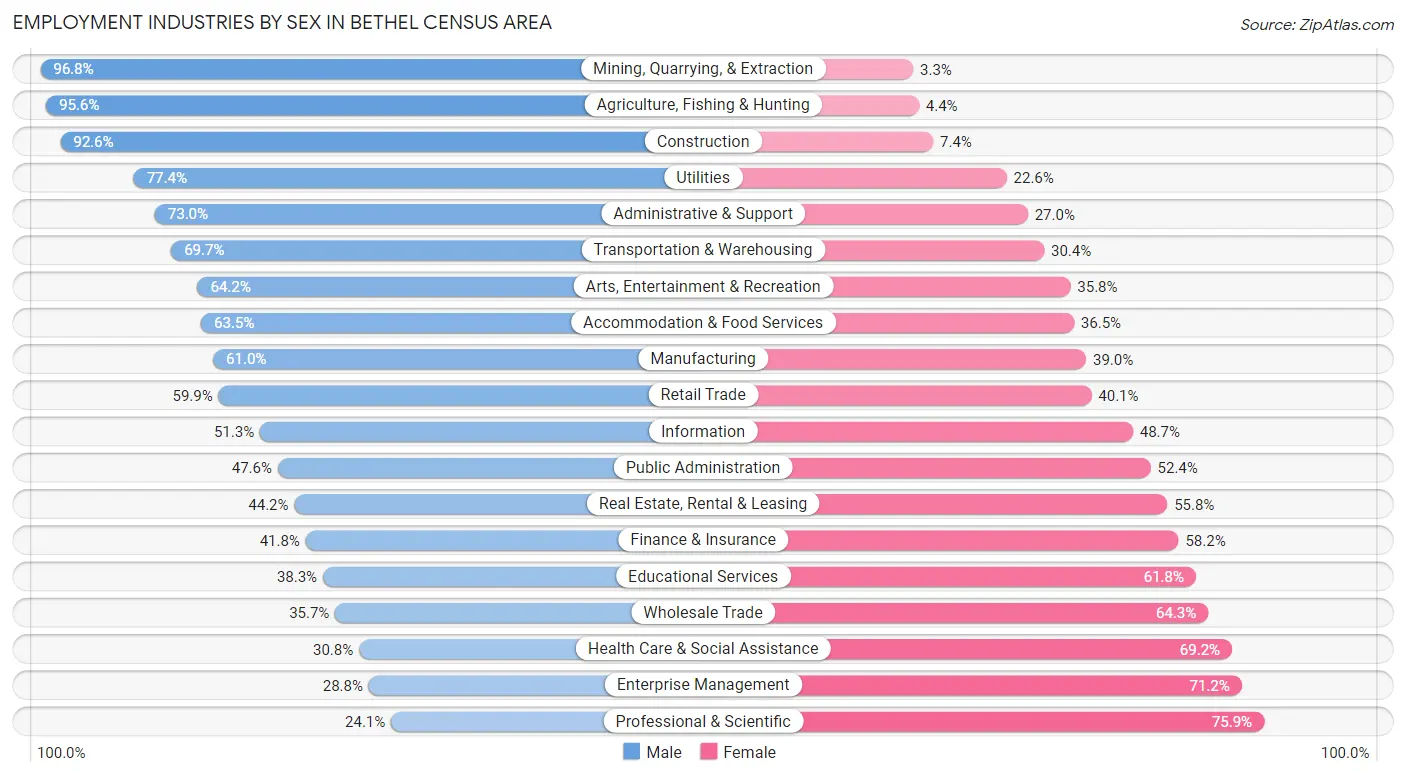
| Industry | Male | Female |
| Agriculture, Fishing & Hunting | 86 (95.6%) | 4 (4.4%) |
| Mining, Quarrying, & Extraction | 447 (96.8%) | 15 (3.3%) |
| Construction | 163 (92.6%) | 13 (7.4%) |
| Manufacturing | 89 (61.0%) | 57 (39.0%) |
| Wholesale Trade | 15 (35.7%) | 27 (64.3%) |
| Retail Trade | 413 (59.9%) | 277 (40.1%) |
| Transportation & Warehousing | 342 (69.7%) | 149 (30.3%) |
| Utilities | 161 (77.4%) | 47 (22.6%) |
| Information | 20 (51.3%) | 19 (48.7%) |
| Finance & Insurance | 46 (41.8%) | 64 (58.2%) |
| Real Estate, Rental & Leasing | 34 (44.2%) | 43 (55.8%) |
| Professional & Scientific | 7 (24.1%) | 22 (75.9%) |
| Enterprise Management | 86 (28.8%) | 213 (71.2%) |
| Administrative & Support | 111 (73.0%) | 41 (27.0%) |
| Educational Services | 327 (38.3%) | 528 (61.8%) |
| Health Care & Social Assistance | 236 (30.8%) | 531 (69.2%) |
| Arts, Entertainment & Recreation | 52 (64.2%) | 29 (35.8%) |
| Accommodation & Food Services | 106 (63.5%) | 61 (36.5%) |
| Public Administration | 692 (47.6%) | 762 (52.4%) |
| Total | 3,548 (54.1%) | 3,014 (45.9%) |
Education in Bethel Census Area
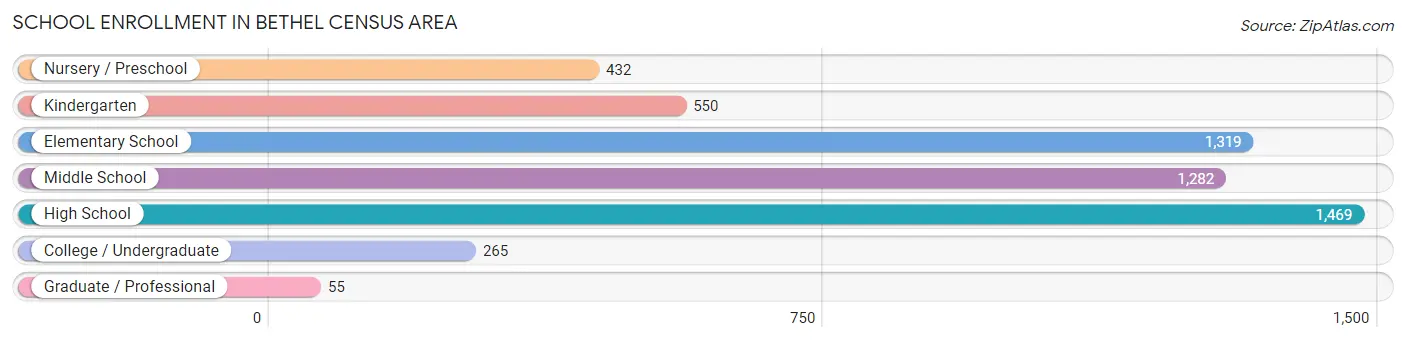
School Enrollment in Bethel Census Area
The most common levels of schooling among the 5,372 students in Bethel Census Area are high school (1,469 | 27.4%), elementary school (1,319 | 24.5%), and middle school (1,282 | 23.9%).
| School Level | # Students | % Students |
| Nursery / Preschool | 432 | 8.0% |
| Kindergarten | 550 | 10.2% |
| Elementary School | 1,319 | 24.5% |
| Middle School | 1,282 | 23.9% |
| High School | 1,469 | 27.4% |
| College / Undergraduate | 265 | 4.9% |
| Graduate / Professional | 55 | 1.0% |
| Total | 5,372 | 100.0% |
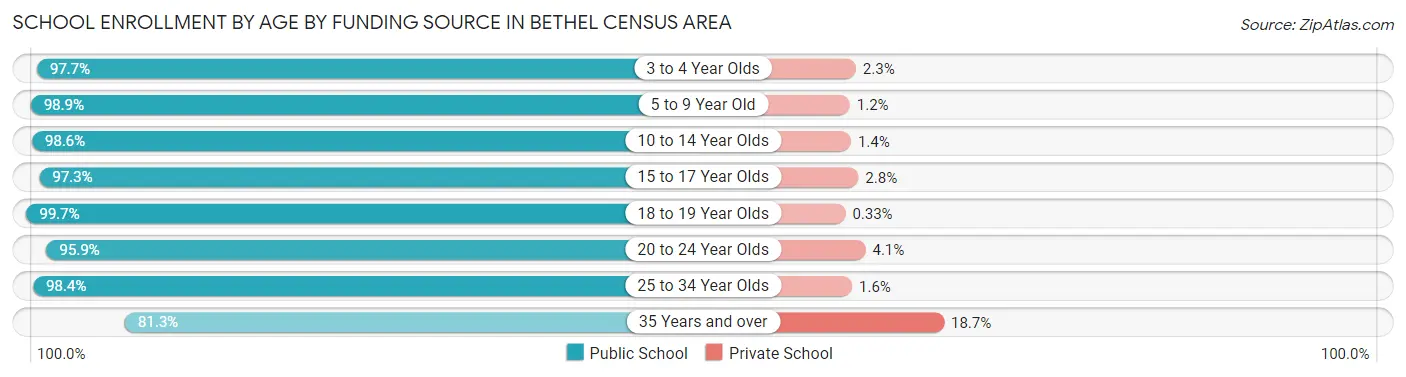
School Enrollment by Age by Funding Source in Bethel Census Area
Out of a total of 5,372 students who are enrolled in schools in Bethel Census Area, 107 (2.0%) attend a private institution, while the remaining 5,265 (98.0%) are enrolled in public schools. The age group of 35 years and over has the highest likelihood of being enrolled in private schools, with 20 (18.7% in the age bracket) enrolled. Conversely, the age group of 18 to 19 year olds has the lowest likelihood of being enrolled in a private school, with 304 (99.7% in the age bracket) attending a public institution.
| Age Bracket | Public School | Private School |
| 3 to 4 Year Olds | 385 (97.7%) | 9 (2.3%) |
| 5 to 9 Year Old | 1,806 (98.9%) | 21 (1.1%) |
| 10 to 14 Year Olds | 1,524 (98.6%) | 21 (1.4%) |
| 15 to 17 Year Olds | 918 (97.3%) | 26 (2.8%) |
| 18 to 19 Year Olds | 304 (99.7%) | 1 (0.3%) |
| 20 to 24 Year Olds | 118 (95.9%) | 5 (4.1%) |
| 25 to 34 Year Olds | 125 (98.4%) | 2 (1.6%) |
| 35 Years and over | 87 (81.3%) | 20 (18.7%) |
| Total | 5,265 (98.0%) | 107 (2.0%) |
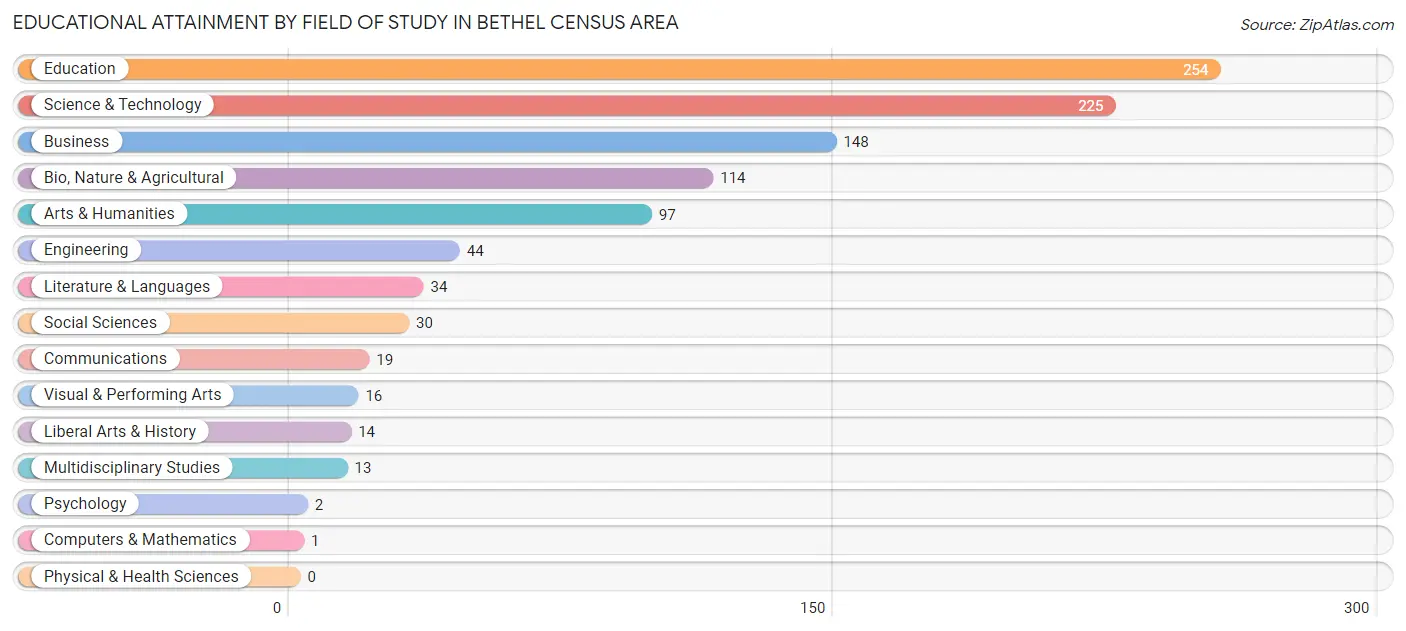
Educational Attainment by Field of Study in Bethel Census Area
Education (254 | 25.1%), science & technology (225 | 22.3%), business (148 | 14.6%), bio, nature & agricultural (114 | 11.3%), and arts & humanities (97 | 9.6%) are the most common fields of study among 1,011 individuals in Bethel Census Area who have obtained a bachelor's degree or higher.
| Field of Study | # Graduates | % Graduates |
| Computers & Mathematics | 1 | 0.1% |
| Bio, Nature & Agricultural | 114 | 11.3% |
| Physical & Health Sciences | 0 | 0.0% |
| Psychology | 2 | 0.2% |
| Social Sciences | 30 | 3.0% |
| Engineering | 44 | 4.3% |
| Multidisciplinary Studies | 13 | 1.3% |
| Science & Technology | 225 | 22.3% |
| Business | 148 | 14.6% |
| Education | 254 | 25.1% |
| Literature & Languages | 34 | 3.4% |
| Liberal Arts & History | 14 | 1.4% |
| Visual & Performing Arts | 16 | 1.6% |
| Communications | 19 | 1.9% |
| Arts & Humanities | 97 | 9.6% |
| Total | 1,011 | 100.0% |
Transportation & Commute in Bethel Census Area
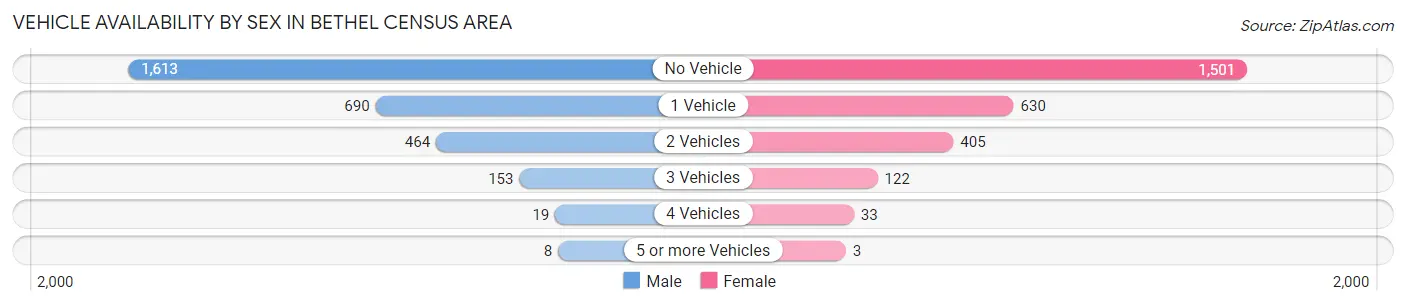
Vehicle Availability by Sex in Bethel Census Area
The most prevalent vehicle ownership categories in Bethel Census Area are males with no vehicle (1,613, accounting for 54.7%) and females with no vehicle (1,501, making up 59.9%).
| Vehicles Available | Male | Female |
| No Vehicle | 1,613 (54.7%) | 1,501 (55.7%) |
| 1 Vehicle | 690 (23.4%) | 630 (23.4%) |
| 2 Vehicles | 464 (15.7%) | 405 (15.0%) |
| 3 Vehicles | 153 (5.2%) | 122 (4.5%) |
| 4 Vehicles | 19 (0.6%) | 33 (1.2%) |
| 5 or more Vehicles | 8 (0.3%) | 3 (0.1%) |
| Total | 2,947 (100.0%) | 2,694 (100.0%) |
Commute Time in Bethel Census Area
The most frequently occuring commute durations in Bethel Census Area are 5 to 9 minutes (2,646 commuters, 43.8%), less than 5 minutes (1,781 commuters, 29.5%), and 10 to 14 minutes (922 commuters, 15.3%).
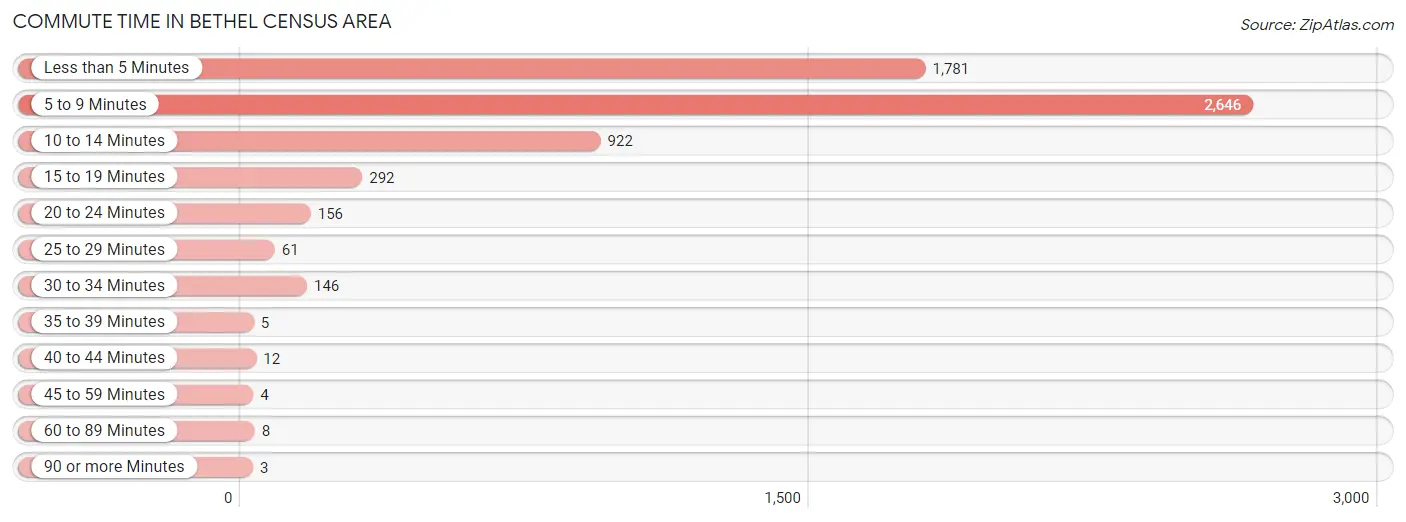
| Commute Time | # Commuters | % Commuters |
| Less than 5 Minutes | 1,781 | 29.5% |
| 5 to 9 Minutes | 2,646 | 43.8% |
| 10 to 14 Minutes | 922 | 15.3% |
| 15 to 19 Minutes | 292 | 4.8% |
| 20 to 24 Minutes | 156 | 2.6% |
| 25 to 29 Minutes | 61 | 1.0% |
| 30 to 34 Minutes | 146 | 2.4% |
| 35 to 39 Minutes | 5 | 0.1% |
| 40 to 44 Minutes | 12 | 0.2% |
| 45 to 59 Minutes | 4 | 0.1% |
| 60 to 89 Minutes | 8 | 0.1% |
| 90 or more Minutes | 3 | 0.1% |
Commute Time by Sex in Bethel Census Area
The most common commute times in Bethel Census Area are 5 to 9 minutes (1,476 commuters, 45.0%) for males and 5 to 9 minutes (1,170 commuters, 42.5%) for females.
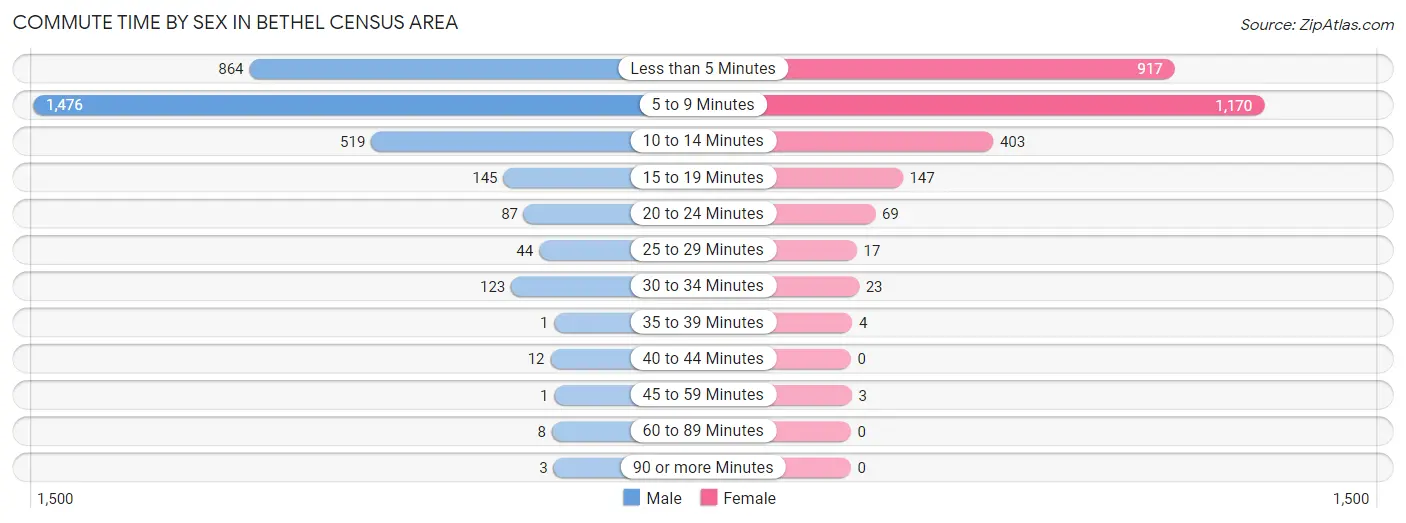
| Commute Time | Male | Female |
| Less than 5 Minutes | 864 (26.3%) | 917 (33.3%) |
| 5 to 9 Minutes | 1,476 (45.0%) | 1,170 (42.5%) |
| 10 to 14 Minutes | 519 (15.8%) | 403 (14.6%) |
| 15 to 19 Minutes | 145 (4.4%) | 147 (5.3%) |
| 20 to 24 Minutes | 87 (2.6%) | 69 (2.5%) |
| 25 to 29 Minutes | 44 (1.3%) | 17 (0.6%) |
| 30 to 34 Minutes | 123 (3.7%) | 23 (0.8%) |
| 35 to 39 Minutes | 1 (0.0%) | 4 (0.2%) |
| 40 to 44 Minutes | 12 (0.4%) | 0 (0.0%) |
| 45 to 59 Minutes | 1 (0.0%) | 3 (0.1%) |
| 60 to 89 Minutes | 8 (0.2%) | 0 (0.0%) |
| 90 or more Minutes | 3 (0.1%) | 0 (0.0%) |
Time of Departure to Work by Sex in Bethel Census Area
The most frequent times of departure to work in Bethel Census Area are 7:30 AM to 7:59 AM (601, 18.3%) for males and 7:30 AM to 7:59 AM (650, 23.6%) for females.
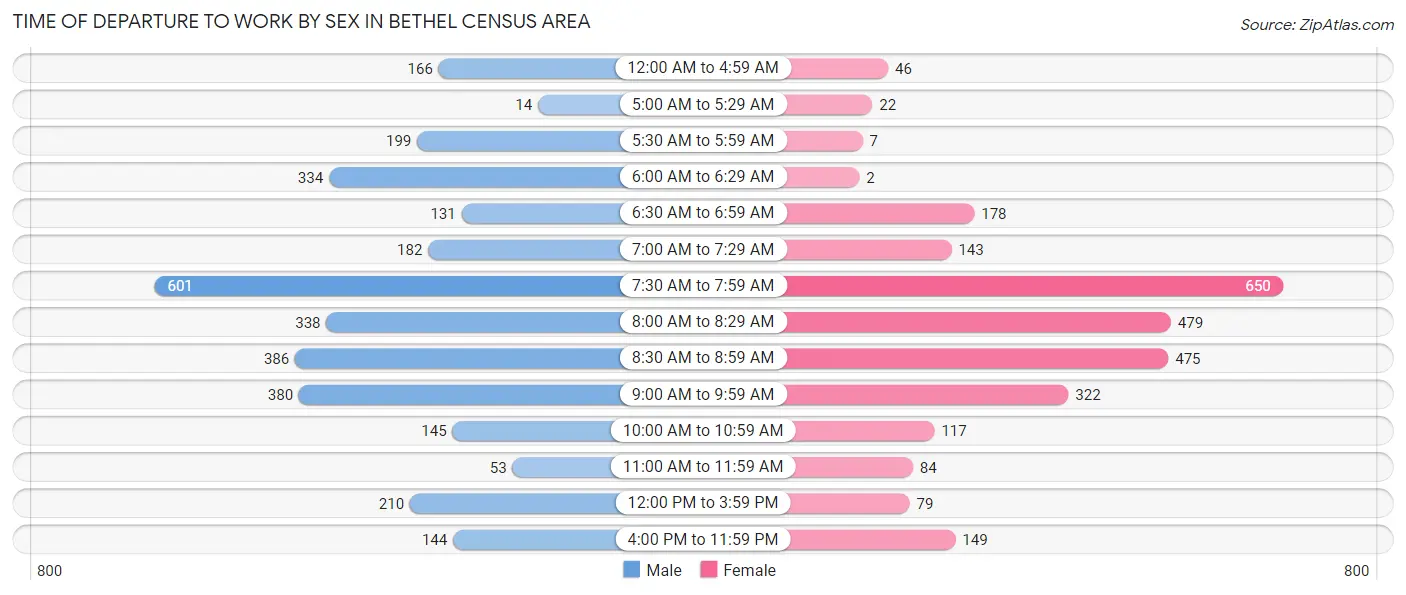
| Time of Departure | Male | Female |
| 12:00 AM to 4:59 AM | 166 (5.1%) | 46 (1.7%) |
| 5:00 AM to 5:29 AM | 14 (0.4%) | 22 (0.8%) |
| 5:30 AM to 5:59 AM | 199 (6.1%) | 7 (0.3%) |
| 6:00 AM to 6:29 AM | 334 (10.2%) | 2 (0.1%) |
| 6:30 AM to 6:59 AM | 131 (4.0%) | 178 (6.5%) |
| 7:00 AM to 7:29 AM | 182 (5.5%) | 143 (5.2%) |
| 7:30 AM to 7:59 AM | 601 (18.3%) | 650 (23.6%) |
| 8:00 AM to 8:29 AM | 338 (10.3%) | 479 (17.4%) |
| 8:30 AM to 8:59 AM | 386 (11.8%) | 475 (17.2%) |
| 9:00 AM to 9:59 AM | 380 (11.6%) | 322 (11.7%) |
| 10:00 AM to 10:59 AM | 145 (4.4%) | 117 (4.3%) |
| 11:00 AM to 11:59 AM | 53 (1.6%) | 84 (3.0%) |
| 12:00 PM to 3:59 PM | 210 (6.4%) | 79 (2.9%) |
| 4:00 PM to 11:59 PM | 144 (4.4%) | 149 (5.4%) |
| Total | 3,283 (100.0%) | 2,753 (100.0%) |
Housing Occupancy in Bethel Census Area
Occupancy by Ownership in Bethel Census Area
Of the total 4,565 dwellings in Bethel Census Area, owner-occupied units account for 2,693 (59.0%), while renter-occupied units make up 1,872 (41.0%).
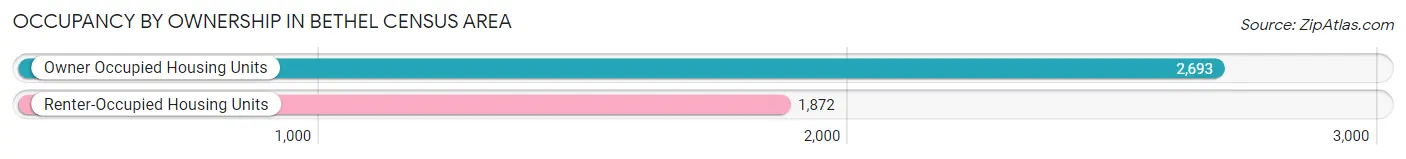
| Occupancy | # Housing Units | % Housing Units |
| Owner Occupied Housing Units | 2,693 | 59.0% |
| Renter-Occupied Housing Units | 1,872 | 41.0% |
| Total Occupied Housing Units | 4,565 | 100.0% |
Occupancy by Household Size in Bethel Census Area
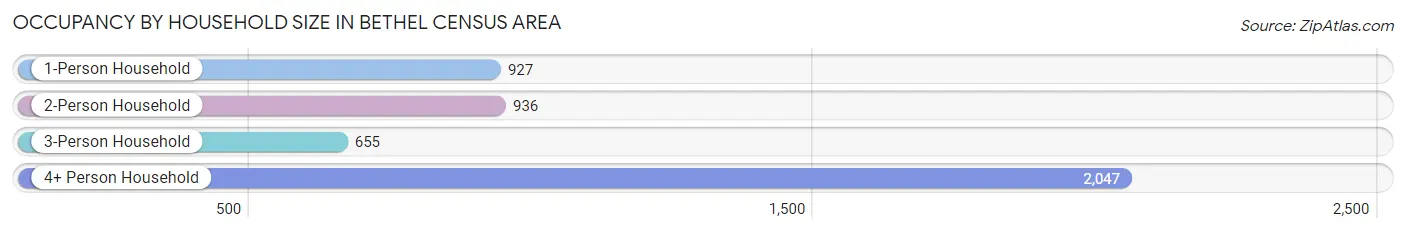
| Household Size | # Housing Units | % Housing Units |
| 1-Person Household | 927 | 20.3% |
| 2-Person Household | 936 | 20.5% |
| 3-Person Household | 655 | 14.3% |
| 4+ Person Household | 2,047 | 44.8% |
| Total Housing Units | 4,565 | 100.0% |
Occupancy by Ownership by Household Size in Bethel Census Area
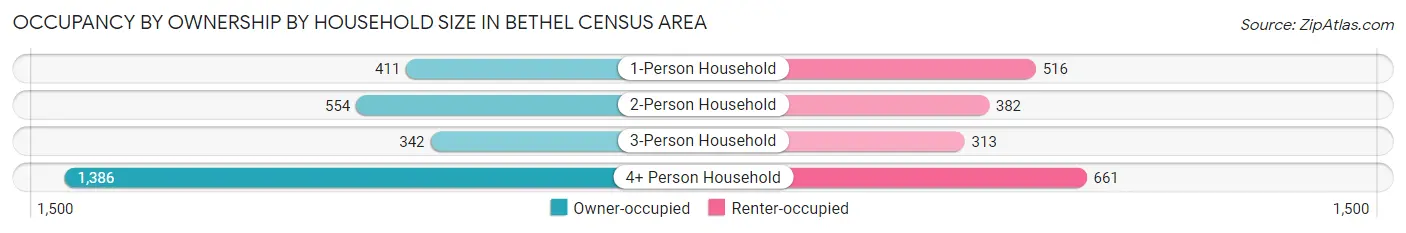
| Household Size | Owner-occupied | Renter-occupied |
| 1-Person Household | 411 (44.3%) | 516 (55.7%) |
| 2-Person Household | 554 (59.2%) | 382 (40.8%) |
| 3-Person Household | 342 (52.2%) | 313 (47.8%) |
| 4+ Person Household | 1,386 (67.7%) | 661 (32.3%) |
| Total Housing Units | 2,693 (59.0%) | 1,872 (41.0%) |
Occupancy by Educational Attainment in Bethel Census Area
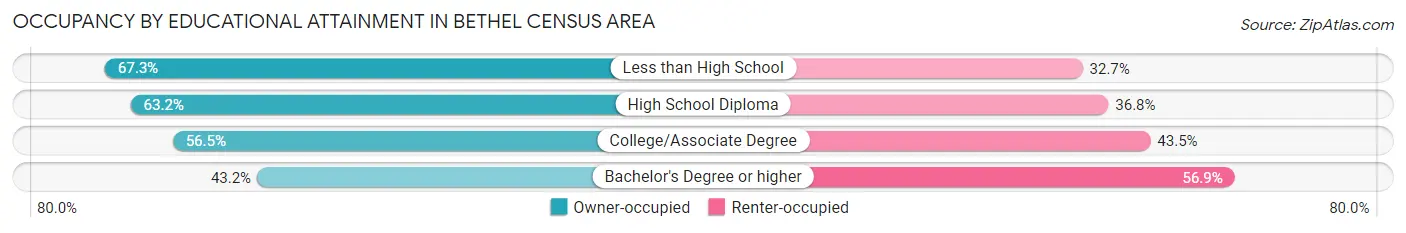
| Household Size | Owner-occupied | Renter-occupied |
| Less than High School | 495 (67.3%) | 241 (32.7%) |
| High School Diploma | 1,194 (63.2%) | 696 (36.8%) |
| College/Associate Degree | 708 (56.5%) | 545 (43.5%) |
| Bachelor's Degree or higher | 296 (43.1%) | 390 (56.9%) |
Occupancy by Age of Householder in Bethel Census Area
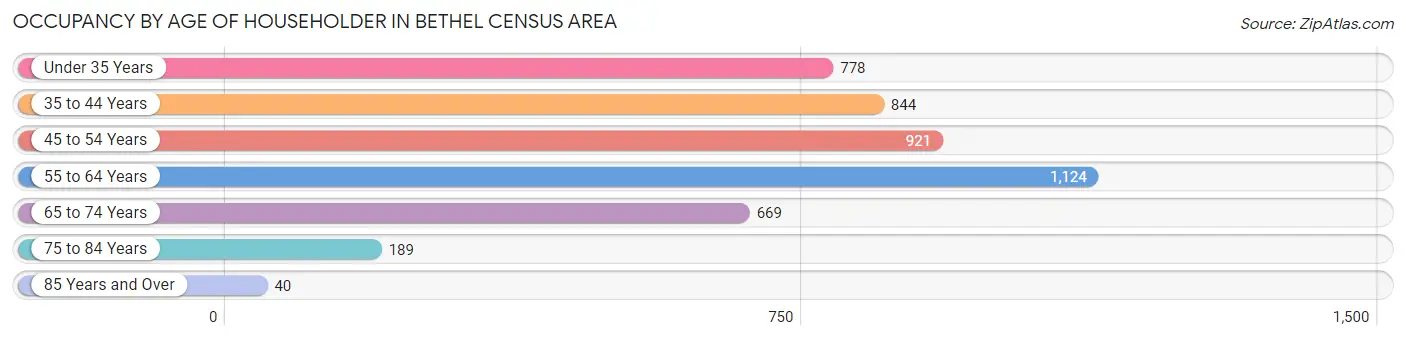
| Age Bracket | # Households | % Households |
| Under 35 Years | 778 | 17.0% |
| 35 to 44 Years | 844 | 18.5% |
| 45 to 54 Years | 921 | 20.2% |
| 55 to 64 Years | 1,124 | 24.6% |
| 65 to 74 Years | 669 | 14.6% |
| 75 to 84 Years | 189 | 4.1% |
| 85 Years and Over | 40 | 0.9% |
| Total | 4,565 | 100.0% |
Housing Finances in Bethel Census Area
Median Income by Occupancy in Bethel Census Area
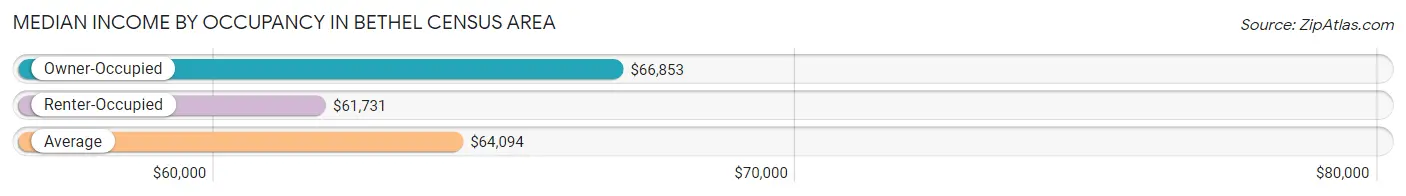
| Occupancy Type | # Households | Median Income |
| Owner-Occupied | 2,693 (59.0%) | $66,853 |
| Renter-Occupied | 1,872 (41.0%) | $61,731 |
| Average | 4,565 (100.0%) | $64,094 |
Occupancy by Householder Income Bracket in Bethel Census Area
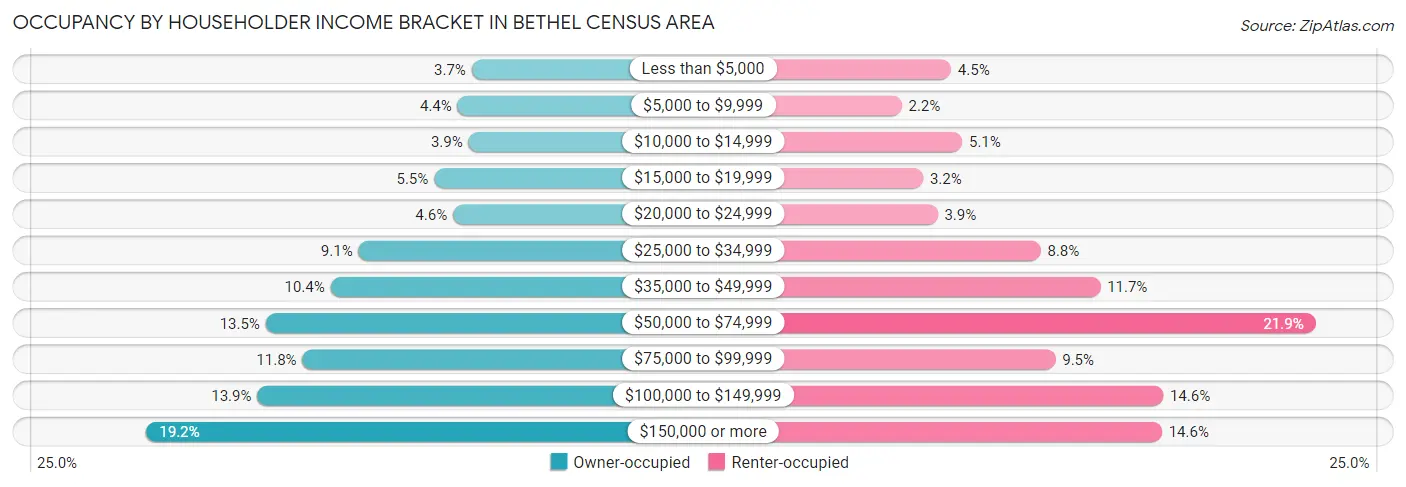
| Income Bracket | Owner-occupied | Renter-occupied |
| Less than $5,000 | 100 (3.7%) | 85 (4.5%) |
| $5,000 to $9,999 | 118 (4.4%) | 41 (2.2%) |
| $10,000 to $14,999 | 104 (3.9%) | 95 (5.1%) |
| $15,000 to $19,999 | 148 (5.5%) | 60 (3.2%) |
| $20,000 to $24,999 | 124 (4.6%) | 73 (3.9%) |
| $25,000 to $34,999 | 245 (9.1%) | 165 (8.8%) |
| $35,000 to $49,999 | 281 (10.4%) | 218 (11.7%) |
| $50,000 to $74,999 | 364 (13.5%) | 410 (21.9%) |
| $75,000 to $99,999 | 317 (11.8%) | 178 (9.5%) |
| $100,000 to $149,999 | 375 (13.9%) | 274 (14.6%) |
| $150,000 or more | 517 (19.2%) | 273 (14.6%) |
| Total | 2,693 (100.0%) | 1,872 (100.0%) |
Monthly Housing Cost Tiers in Bethel Census Area
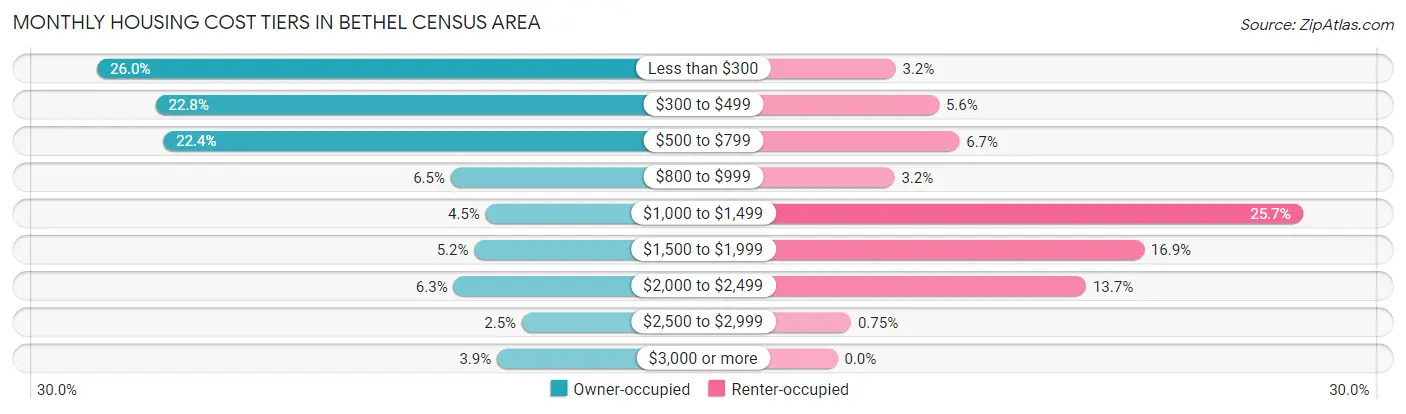
| Monthly Cost | Owner-occupied | Renter-occupied |
| Less than $300 | 700 (26.0%) | 60 (3.2%) |
| $300 to $499 | 613 (22.8%) | 105 (5.6%) |
| $500 to $799 | 602 (22.4%) | 126 (6.7%) |
| $800 to $999 | 174 (6.5%) | 59 (3.2%) |
| $1,000 to $1,499 | 122 (4.5%) | 481 (25.7%) |
| $1,500 to $1,999 | 139 (5.2%) | 317 (16.9%) |
| $2,000 to $2,499 | 170 (6.3%) | 257 (13.7%) |
| $2,500 to $2,999 | 68 (2.5%) | 14 (0.7%) |
| $3,000 or more | 105 (3.9%) | 0 (0.0%) |
| Total | 2,693 (100.0%) | 1,872 (100.0%) |
Physical Housing Characteristics in Bethel Census Area
Housing Structures in Bethel Census Area
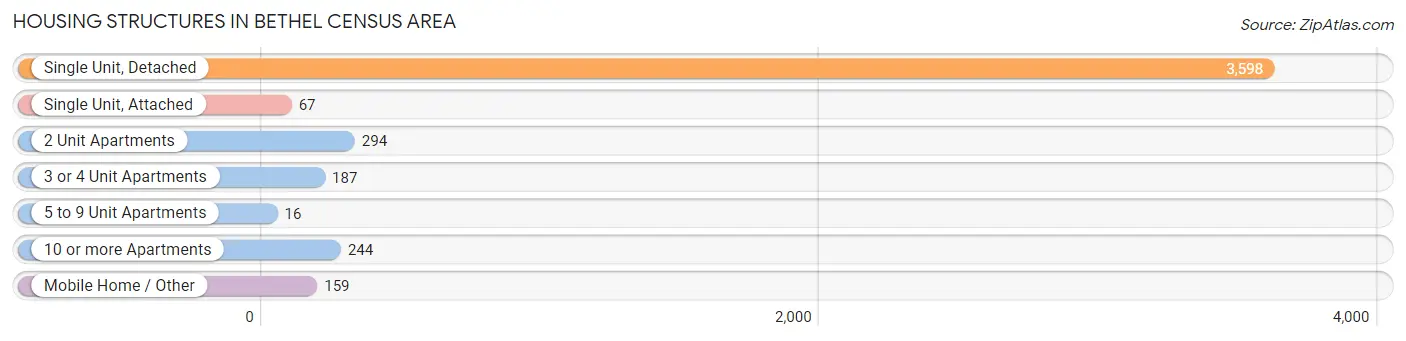
| Structure Type | # Housing Units | % Housing Units |
| Single Unit, Detached | 3,598 | 78.8% |
| Single Unit, Attached | 67 | 1.5% |
| 2 Unit Apartments | 294 | 6.4% |
| 3 or 4 Unit Apartments | 187 | 4.1% |
| 5 to 9 Unit Apartments | 16 | 0.4% |
| 10 or more Apartments | 244 | 5.3% |
| Mobile Home / Other | 159 | 3.5% |
| Total | 4,565 | 100.0% |
Housing Structures by Occupancy in Bethel Census Area
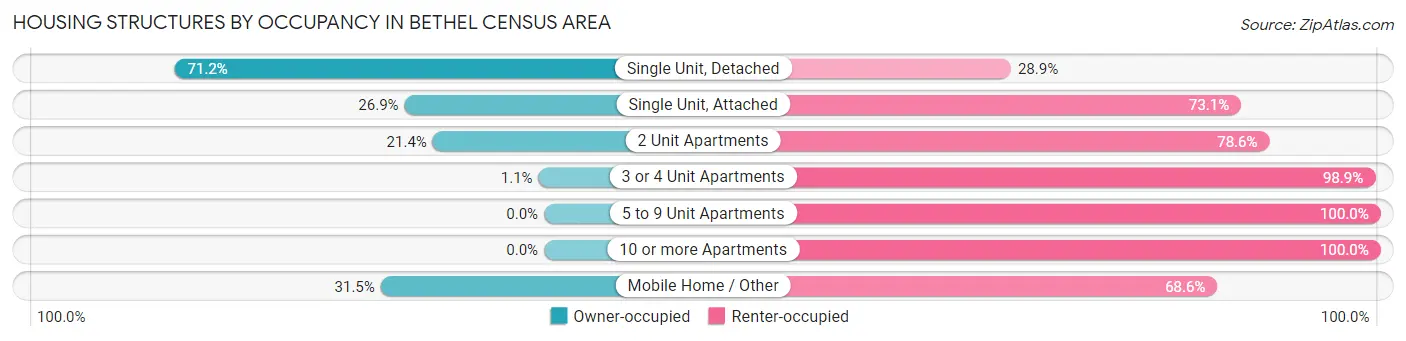
| Structure Type | Owner-occupied | Renter-occupied |
| Single Unit, Detached | 2,560 (71.2%) | 1,038 (28.8%) |
| Single Unit, Attached | 18 (26.9%) | 49 (73.1%) |
| 2 Unit Apartments | 63 (21.4%) | 231 (78.6%) |
| 3 or 4 Unit Apartments | 2 (1.1%) | 185 (98.9%) |
| 5 to 9 Unit Apartments | 0 (0.0%) | 16 (100.0%) |
| 10 or more Apartments | 0 (0.0%) | 244 (100.0%) |
| Mobile Home / Other | 50 (31.5%) | 109 (68.5%) |
| Total | 2,693 (59.0%) | 1,872 (41.0%) |
Housing Structures by Number of Rooms in Bethel Census Area
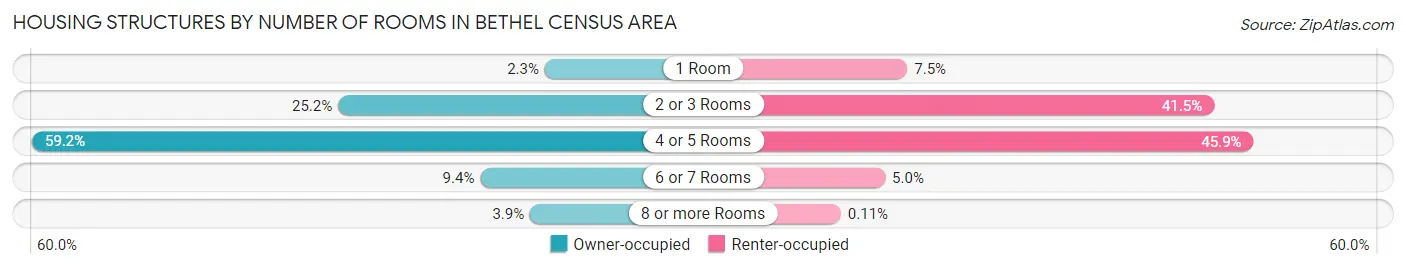
| Number of Rooms | Owner-occupied | Renter-occupied |
| 1 Room | 61 (2.3%) | 140 (7.5%) |
| 2 or 3 Rooms | 679 (25.2%) | 777 (41.5%) |
| 4 or 5 Rooms | 1,594 (59.2%) | 859 (45.9%) |
| 6 or 7 Rooms | 254 (9.4%) | 94 (5.0%) |
| 8 or more Rooms | 105 (3.9%) | 2 (0.1%) |
| Total | 2,693 (100.0%) | 1,872 (100.0%) |
Housing Structure by Heating Type in Bethel Census Area
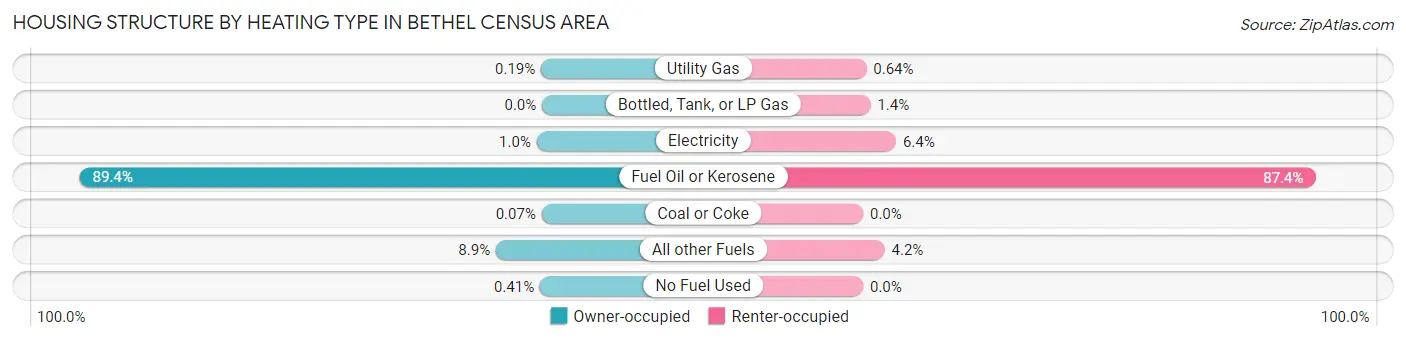
| Heating Type | Owner-occupied | Renter-occupied |
| Utility Gas | 5 (0.2%) | 12 (0.6%) |
| Bottled, Tank, or LP Gas | 0 (0.0%) | 27 (1.4%) |
| Electricity | 28 (1.0%) | 119 (6.4%) |
| Fuel Oil or Kerosene | 2,407 (89.4%) | 1,636 (87.4%) |
| Coal or Coke | 2 (0.1%) | 0 (0.0%) |
| All other Fuels | 240 (8.9%) | 78 (4.2%) |
| No Fuel Used | 11 (0.4%) | 0 (0.0%) |
| Total | 2,693 (100.0%) | 1,872 (100.0%) |
Household Vehicle Usage in Bethel Census Area
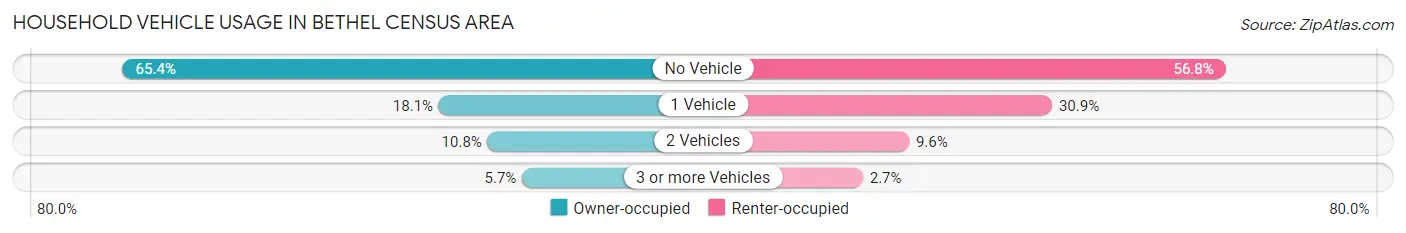
| Vehicles per Household | Owner-occupied | Renter-occupied |
| No Vehicle | 1,760 (65.3%) | 1,064 (56.8%) |
| 1 Vehicle | 488 (18.1%) | 579 (30.9%) |
| 2 Vehicles | 292 (10.8%) | 179 (9.6%) |
| 3 or more Vehicles | 153 (5.7%) | 50 (2.7%) |
| Total | 2,693 (100.0%) | 1,872 (100.0%) |
Real Estate & Mortgages in Bethel Census Area
Real Estate and Mortgage Overview in Bethel Census Area
| Characteristic | Without Mortgage | With Mortgage |
| Housing Units | 1,906 | 787 |
| Median Property Value | $76,700 | $310,400 |
| Median Household Income | $45,741 | $270 |
| Monthly Housing Costs | $398 | $105 |
| Real Estate Taxes | $199 | $766 |
Property Value by Mortgage Status in Bethel Census Area
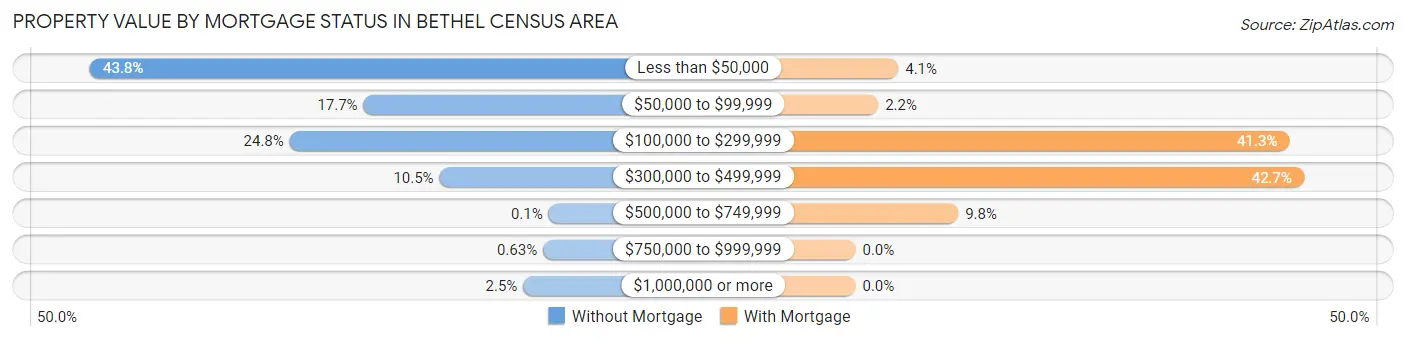
| Property Value | Without Mortgage | With Mortgage |
| Less than $50,000 | 834 (43.8%) | 32 (4.1%) |
| $50,000 to $99,999 | 338 (17.7%) | 17 (2.2%) |
| $100,000 to $299,999 | 472 (24.8%) | 325 (41.3%) |
| $300,000 to $499,999 | 200 (10.5%) | 336 (42.7%) |
| $500,000 to $749,999 | 2 (0.1%) | 77 (9.8%) |
| $750,000 to $999,999 | 12 (0.6%) | 0 (0.0%) |
| $1,000,000 or more | 48 (2.5%) | 0 (0.0%) |
| Total | 1,906 (100.0%) | 787 (100.0%) |
Household Income by Mortgage Status in Bethel Census Area
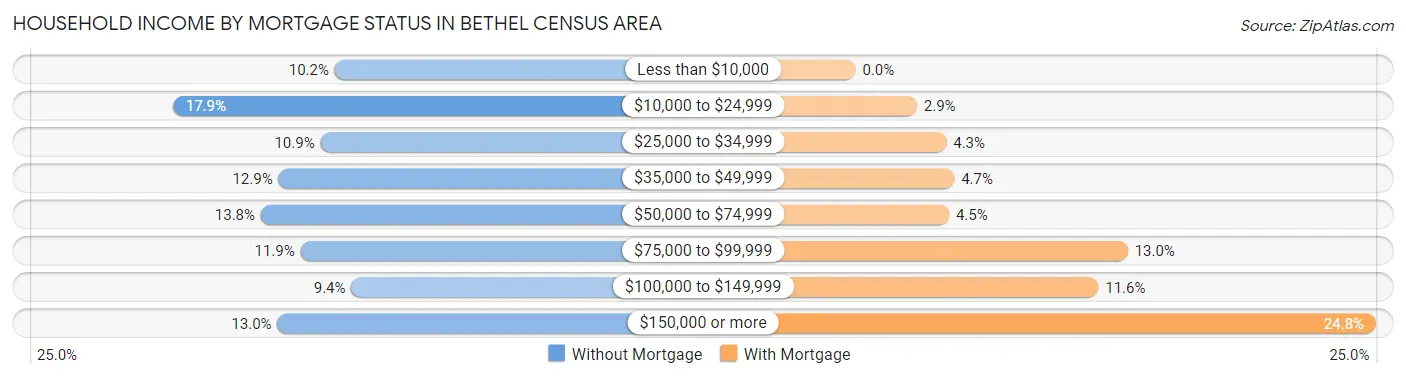
| Household Income | Without Mortgage | With Mortgage |
| Less than $10,000 | 195 (10.2%) | 0 (0.0%) |
| $10,000 to $24,999 | 342 (17.9%) | 23 (2.9%) |
| $25,000 to $34,999 | 208 (10.9%) | 34 (4.3%) |
| $35,000 to $49,999 | 246 (12.9%) | 37 (4.7%) |
| $50,000 to $74,999 | 262 (13.8%) | 35 (4.4%) |
| $75,000 to $99,999 | 226 (11.9%) | 102 (13.0%) |
| $100,000 to $149,999 | 180 (9.4%) | 91 (11.6%) |
| $150,000 or more | 247 (13.0%) | 195 (24.8%) |
| Total | 1,906 (100.0%) | 787 (100.0%) |
Property Value to Household Income Ratio in Bethel Census Area
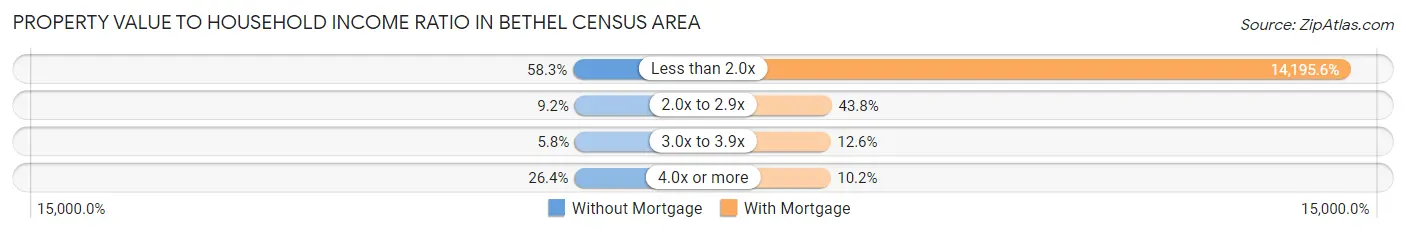
| Value-to-Income Ratio | Without Mortgage | With Mortgage |
| Less than 2.0x | 1,112 (58.3%) | 111,719 (14,195.6%) |
| 2.0x to 2.9x | 176 (9.2%) | 345 (43.8%) |
| 3.0x to 3.9x | 111 (5.8%) | 99 (12.6%) |
| 4.0x or more | 503 (26.4%) | 80 (10.2%) |
| Total | 1,906 (100.0%) | 787 (100.0%) |
Real Estate Taxes by Mortgage Status in Bethel Census Area
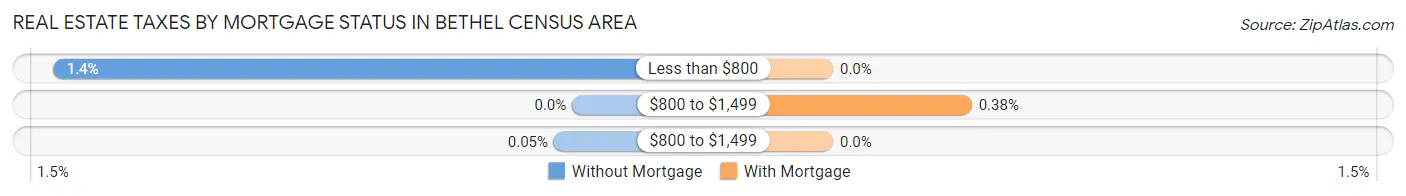
| Property Taxes | Without Mortgage | With Mortgage |
| Less than $800 | 27 (1.4%) | 0 (0.0%) |
| $800 to $1,499 | 0 (0.0%) | 3 (0.4%) |
| $800 to $1,499 | 1 (0.1%) | 0 (0.0%) |
| Total | 1,906 (100.0%) | 787 (100.0%) |
Health & Disability in Bethel Census Area
Health Insurance Coverage by Age in Bethel Census Area
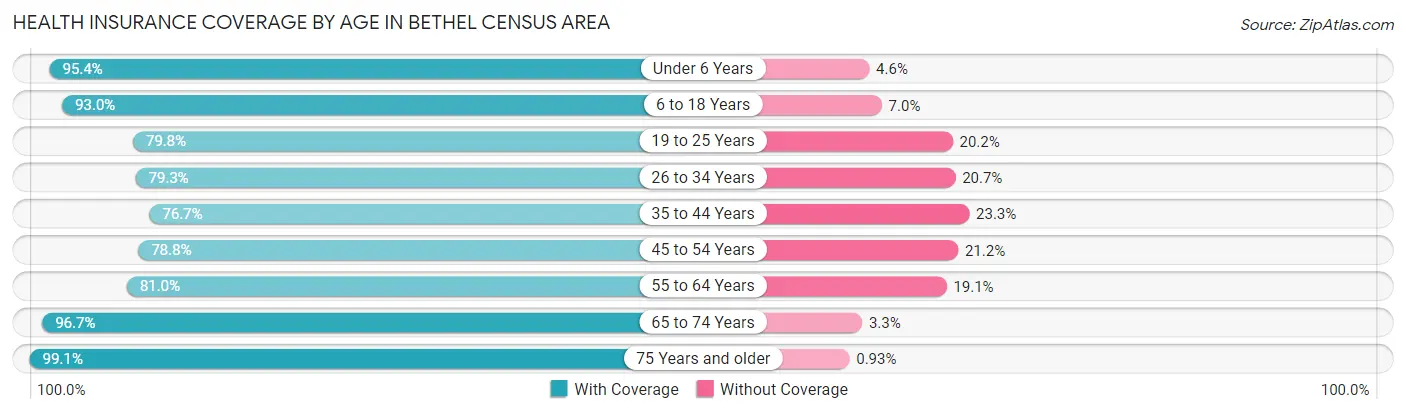
| Age Bracket | With Coverage | Without Coverage |
| Under 6 Years | 2,320 (95.4%) | 113 (4.6%) |
| 6 to 18 Years | 4,042 (93.0%) | 303 (7.0%) |
| 19 to 25 Years | 1,440 (79.8%) | 364 (20.2%) |
| 26 to 34 Years | 1,968 (79.3%) | 513 (20.7%) |
| 35 to 44 Years | 1,507 (76.7%) | 457 (23.3%) |
| 45 to 54 Years | 1,461 (78.8%) | 393 (21.2%) |
| 55 to 64 Years | 1,560 (80.9%) | 367 (19.1%) |
| 65 to 74 Years | 971 (96.7%) | 33 (3.3%) |
| 75 Years and older | 427 (99.1%) | 4 (0.9%) |
| Total | 15,696 (86.0%) | 2,547 (14.0%) |
Health Insurance Coverage by Citizenship Status in Bethel Census Area
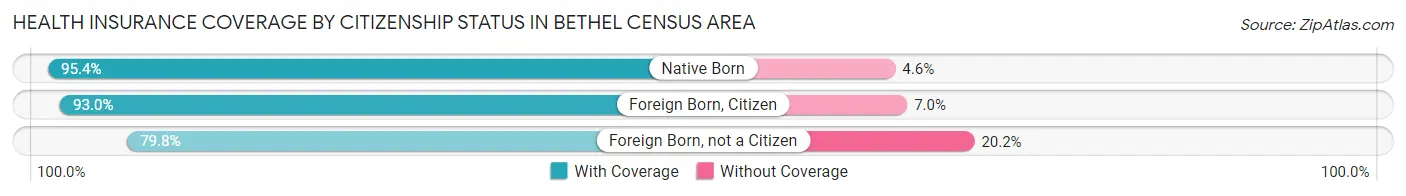
| Citizenship Status | With Coverage | Without Coverage |
| Native Born | 2,320 (95.4%) | 113 (4.6%) |
| Foreign Born, Citizen | 4,042 (93.0%) | 303 (7.0%) |
| Foreign Born, not a Citizen | 1,440 (79.8%) | 364 (20.2%) |
Health Insurance Coverage by Household Income in Bethel Census Area
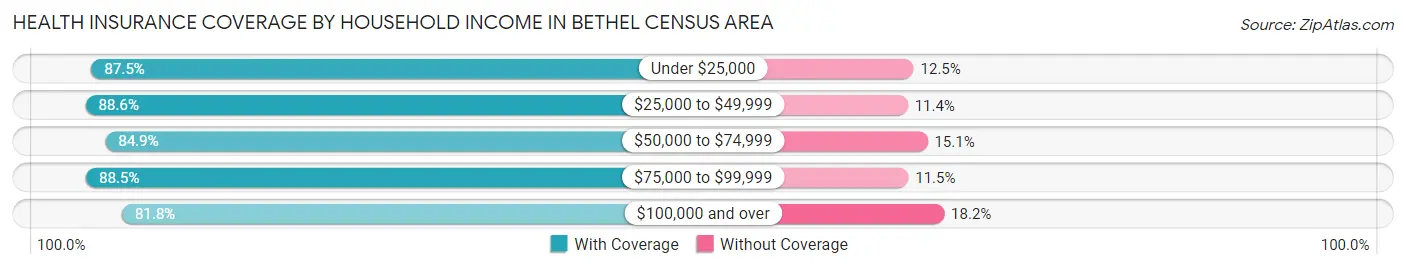
| Household Income | With Coverage | Without Coverage |
| Under $25,000 | 2,278 (87.5%) | 326 (12.5%) |
| $25,000 to $49,999 | 3,207 (88.6%) | 413 (11.4%) |
| $50,000 to $74,999 | 2,751 (84.9%) | 490 (15.1%) |
| $75,000 to $99,999 | 1,982 (88.5%) | 258 (11.5%) |
| $100,000 and over | 4,647 (81.8%) | 1,037 (18.2%) |
Public vs Private Health Insurance Coverage by Age in Bethel Census Area
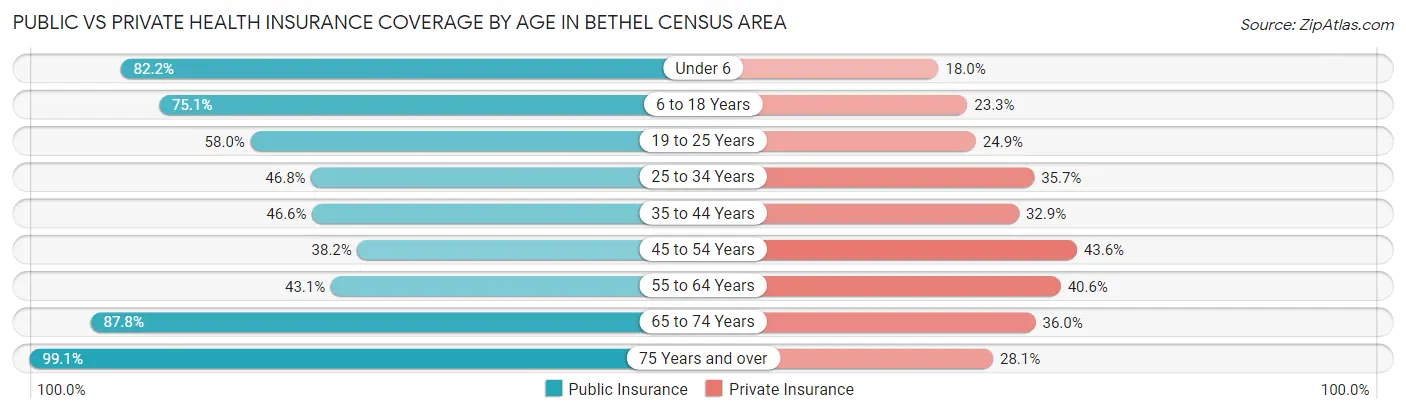
| Age Bracket | Public Insurance | Private Insurance |
| Under 6 | 1,999 (82.2%) | 437 (18.0%) |
| 6 to 18 Years | 3,261 (75.0%) | 1,013 (23.3%) |
| 19 to 25 Years | 1,047 (58.0%) | 449 (24.9%) |
| 25 to 34 Years | 1,160 (46.8%) | 886 (35.7%) |
| 35 to 44 Years | 915 (46.6%) | 646 (32.9%) |
| 45 to 54 Years | 708 (38.2%) | 809 (43.6%) |
| 55 to 64 Years | 831 (43.1%) | 783 (40.6%) |
| 65 to 74 Years | 881 (87.7%) | 361 (36.0%) |
| 75 Years and over | 427 (99.1%) | 121 (28.1%) |
| Total | 11,229 (61.6%) | 5,505 (30.2%) |
Disability Status by Sex by Age in Bethel Census Area
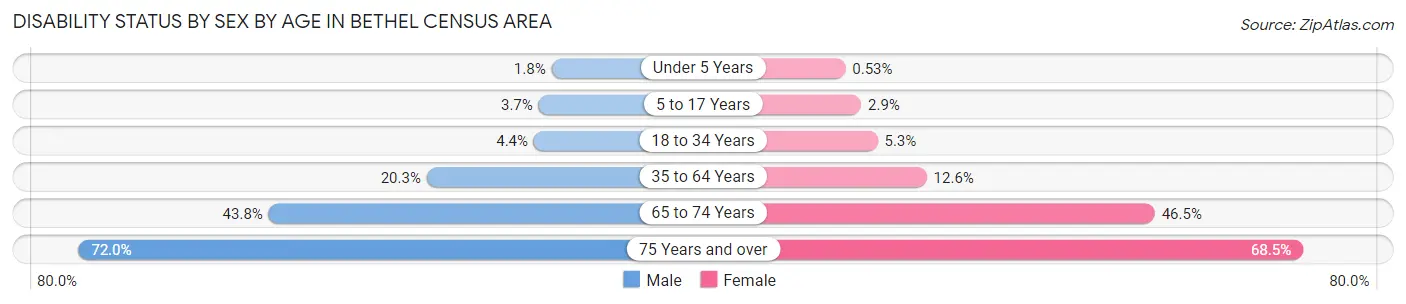
| Age Bracket | Male | Female |
| Under 5 Years | 18 (1.8%) | 5 (0.5%) |
| 5 to 17 Years | 83 (3.7%) | 63 (2.9%) |
| 18 to 34 Years | 111 (4.4%) | 111 (5.3%) |
| 35 to 64 Years | 626 (20.3%) | 335 (12.6%) |
| 65 to 74 Years | 235 (43.8%) | 217 (46.5%) |
| 75 Years and over | 139 (72.0%) | 163 (68.5%) |
Disability Class by Sex by Age in Bethel Census Area
Disability Class: Hearing Difficulty
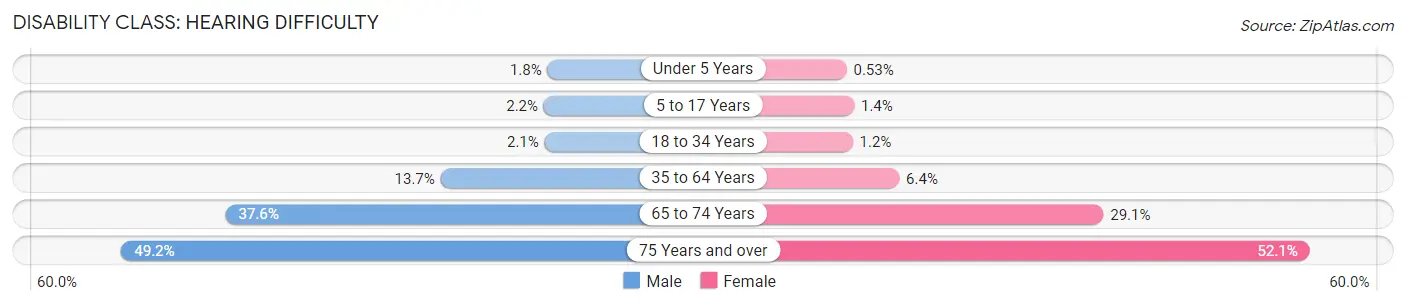
| Age Bracket | Male | Female |
| Under 5 Years | 18 (1.8%) | 5 (0.5%) |
| 5 to 17 Years | 49 (2.2%) | 30 (1.4%) |
| 18 to 34 Years | 53 (2.1%) | 25 (1.2%) |
| 35 to 64 Years | 422 (13.7%) | 170 (6.4%) |
| 65 to 74 Years | 202 (37.6%) | 136 (29.1%) |
| 75 Years and over | 95 (49.2%) | 124 (52.1%) |
Disability Class: Vision Difficulty
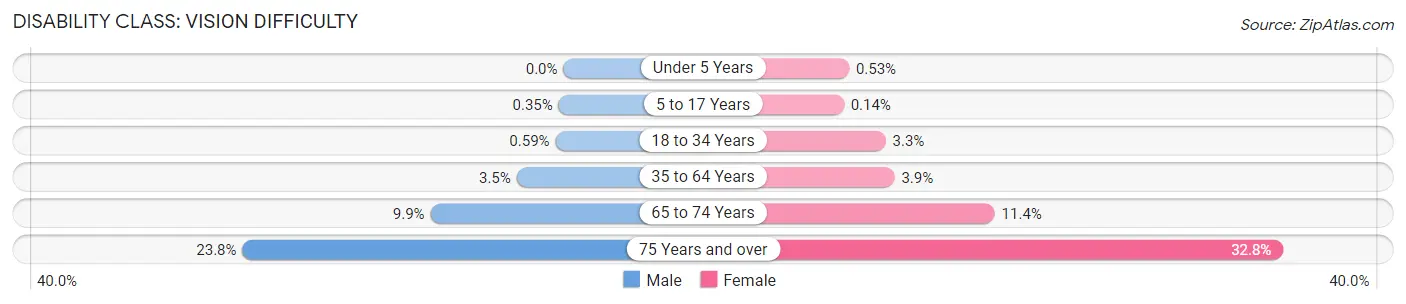
| Age Bracket | Male | Female |
| Under 5 Years | 0 (0.0%) | 5 (0.5%) |
| 5 to 17 Years | 8 (0.4%) | 3 (0.1%) |
| 18 to 34 Years | 15 (0.6%) | 68 (3.3%) |
| 35 to 64 Years | 107 (3.5%) | 104 (3.9%) |
| 65 to 74 Years | 53 (9.9%) | 53 (11.4%) |
| 75 Years and over | 46 (23.8%) | 78 (32.8%) |
Disability Class: Cognitive Difficulty
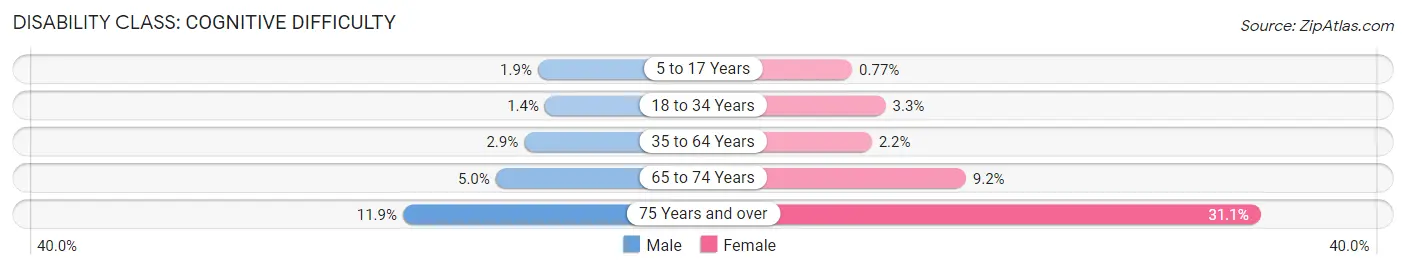
| Age Bracket | Male | Female |
| 5 to 17 Years | 43 (1.9%) | 17 (0.8%) |
| 18 to 34 Years | 35 (1.4%) | 68 (3.3%) |
| 35 to 64 Years | 90 (2.9%) | 59 (2.2%) |
| 65 to 74 Years | 27 (5.0%) | 43 (9.2%) |
| 75 Years and over | 23 (11.9%) | 74 (31.1%) |
Disability Class: Ambulatory Difficulty
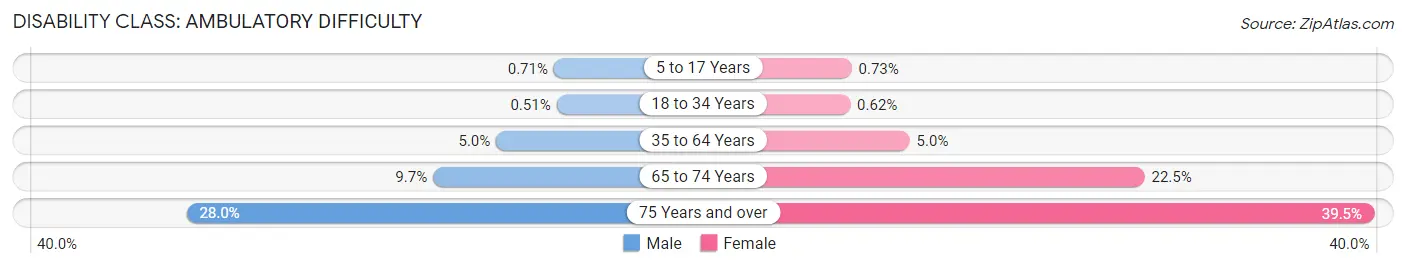
| Age Bracket | Male | Female |
| 5 to 17 Years | 16 (0.7%) | 16 (0.7%) |
| 18 to 34 Years | 13 (0.5%) | 13 (0.6%) |
| 35 to 64 Years | 154 (5.0%) | 134 (5.0%) |
| 65 to 74 Years | 52 (9.7%) | 105 (22.5%) |
| 75 Years and over | 54 (28.0%) | 94 (39.5%) |
Disability Class: Self-Care Difficulty
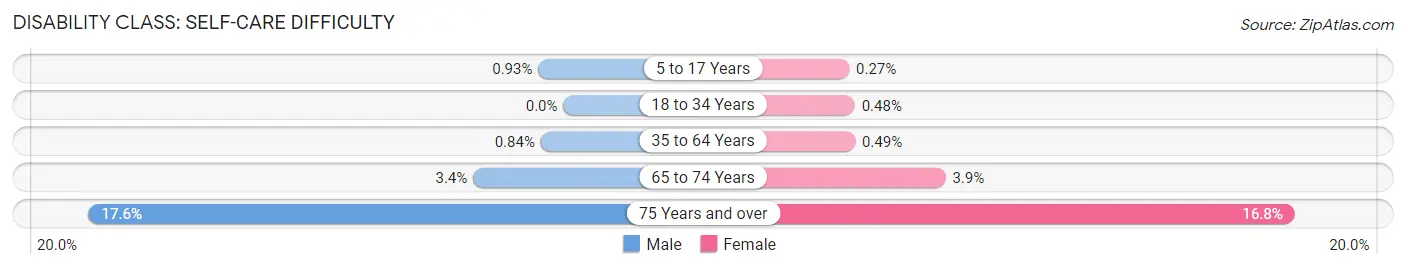
| Age Bracket | Male | Female |
| 5 to 17 Years | 21 (0.9%) | 6 (0.3%) |
| 18 to 34 Years | 0 (0.0%) | 10 (0.5%) |
| 35 to 64 Years | 26 (0.8%) | 13 (0.5%) |
| 65 to 74 Years | 18 (3.4%) | 18 (3.8%) |
| 75 Years and over | 34 (17.6%) | 40 (16.8%) |
Technology Access in Bethel Census Area
Computing Device Access in Bethel Census Area
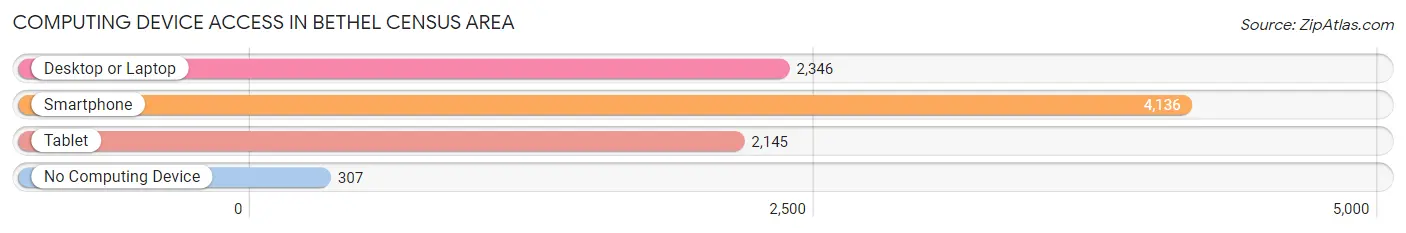
| Device Type | # Households | % Households |
| Desktop or Laptop | 2,346 | 51.4% |
| Smartphone | 4,136 | 90.6% |
| Tablet | 2,145 | 47.0% |
| No Computing Device | 307 | 6.7% |
| Total | 4,565 | 100.0% |
Internet Access in Bethel Census Area
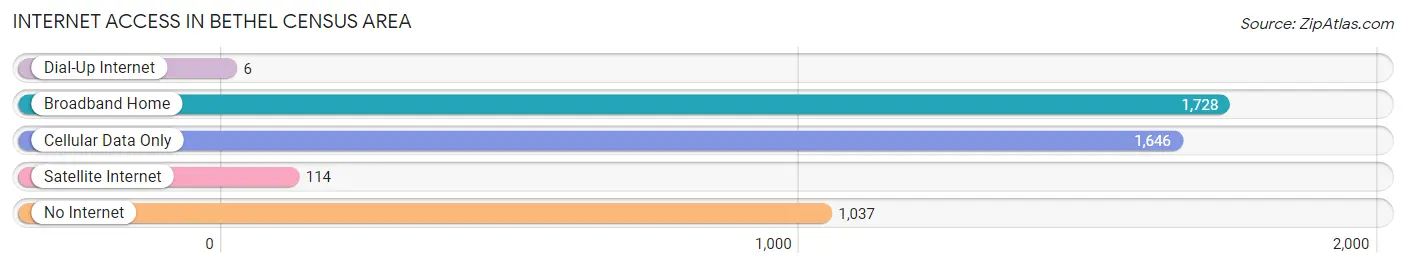
| Internet Type | # Households | % Households |
| Dial-Up Internet | 6 | 0.1% |
| Broadband Home | 1,728 | 37.9% |
| Cellular Data Only | 1,646 | 36.1% |
| Satellite Internet | 114 | 2.5% |
| No Internet | 1,037 | 22.7% |
| Total | 4,565 | 100.0% |
Bethel Census Area Summary
Bethel Census Area is located in the southwestern part of the U.S. state of Alaska. It is part of the Unorganized Borough and is the largest census area in the state. The area is bordered by the Yukon-Kuskokwim Delta to the west, the Kuskokwim River to the north, and the Bering Sea to the south. The population of Bethel Census Area was 17,013 as of the 2010 census, making it the most populous census area in Alaska.
Geography
Bethel Census Area covers an area of approximately 40,000 square miles, making it the largest census area in Alaska. The area is located in the southwestern part of the state, bordered by the Yukon-Kuskokwim Delta to the west, the Kuskokwim River to the north, and the Bering Sea to the south. The terrain is mostly flat, with some hills and mountains in the northern part of the area. The climate is subarctic, with long, cold winters and short, cool summers.
The area is home to several rivers, including the Kuskokwim, the Yukon, and the Aniak. The Kuskokwim is the largest river in the area, and is used for transportation and fishing. The Yukon is the second largest river in the area, and is used for transportation and recreation. The Aniak is the third largest river in the area, and is used for transportation and recreation.
History
The area now known as Bethel Census Area has been inhabited by the Yup'ik people for thousands of years. The area was first explored by Europeans in the late 18th century, and was later claimed by the United States in 1867 as part of the Alaska Purchase. The area was initially part of the Unorganized Borough, but was later organized into the Bethel Census Area in 1959.
Economy
The economy of Bethel Census Area is largely based on subsistence activities, such as fishing, hunting, and gathering. The area is also home to several commercial fishing operations, as well as some tourism and mining. The area is also home to several Native corporations, which provide employment and economic development opportunities.
Demographics
As of the 2010 census, the population of Bethel Census Area was 17,013. The population is largely Native American, with the majority being Yup'ik Eskimos. The area also has a small population of non-Native Americans, primarily of European descent. The median household income in the area is $45,000, and the median age is 28.
Conclusion
Bethel Census Area is a large, sparsely populated area in the southwestern part of Alaska. The area is home to the Yup'ik people, who have lived in the area for thousands of years. The economy of the area is largely based on subsistence activities, such as fishing, hunting, and gathering. The population of the area is largely Native American, with the majority being Yup'ik Eskimos. The median household income in the area is $45,000, and the median age is 28.
Common Questions
What is the Total Population of Bethel Census Area?
Total Population of Bethel Census Area is 18,538.
What is the Total Male Population of Bethel Census Area?
Total Male Population of Bethel Census Area is 9,909.
What is the Total Female Population of Bethel Census Area?
Total Female Population of Bethel Census Area is 8,629.
What is the Ratio of Males per 100 Females in Bethel Census Area?
There are 114.83 Males per 100 Females in Bethel Census Area.
What is the Ratio of Females per 100 Males in Bethel Census Area?
There are 87.08 Females per 100 Males in Bethel Census Area.
What is the Median Population Age in Bethel Census Area?
Median Population Age in Bethel Census Area is 28.7 Years.
What is the Average Family Size in Bethel Census Area
Average Family Size in Bethel Census Area is 4.5 People.
What is the Average Household Size in Bethel Census Area
Average Household Size in Bethel Census Area is 3.8 People.
What is Per Capita Income in Bethel Census Area?
Per Capita income in Bethel Census Area is $25,859.
What is the Median Family Income in Bethel Census Area?
Median Family Income in Bethel Census Area is $67,266.
What is the Median Household income in Bethel Census Area?
Median Household Income in Bethel Census Area is $64,094.
What is Income or Wage Gap in Bethel Census Area?
Income or Wage Gap in Bethel Census Area is 2.1%.
Women in Bethel Census Area earn 97.9 cents for every dollar earned by a man.
What is Family Income Deficit in Bethel Census Area?
Family Income Deficit in Bethel Census Area is $14,071.
Families that are below poverty line in Bethel Census Area earn $14,071 less on average than the poverty threshold level.
What is Inequality or Gini Index in Bethel Census Area?
Inequality or Gini Index in Bethel Census Area is 0.46.
How Large is the Labor Force in Bethel Census Area?
There are 7,867 People in the Labor Forcein in Bethel Census Area.
What is the Percentage of People in the Labor Force in Bethel Census Area?
62.1% of People are in the Labor Force in Bethel Census Area.
What is the Unemployment Rate in Bethel Census Area?
Unemployment Rate in Bethel Census Area is 16.2%.