Buckland, AK
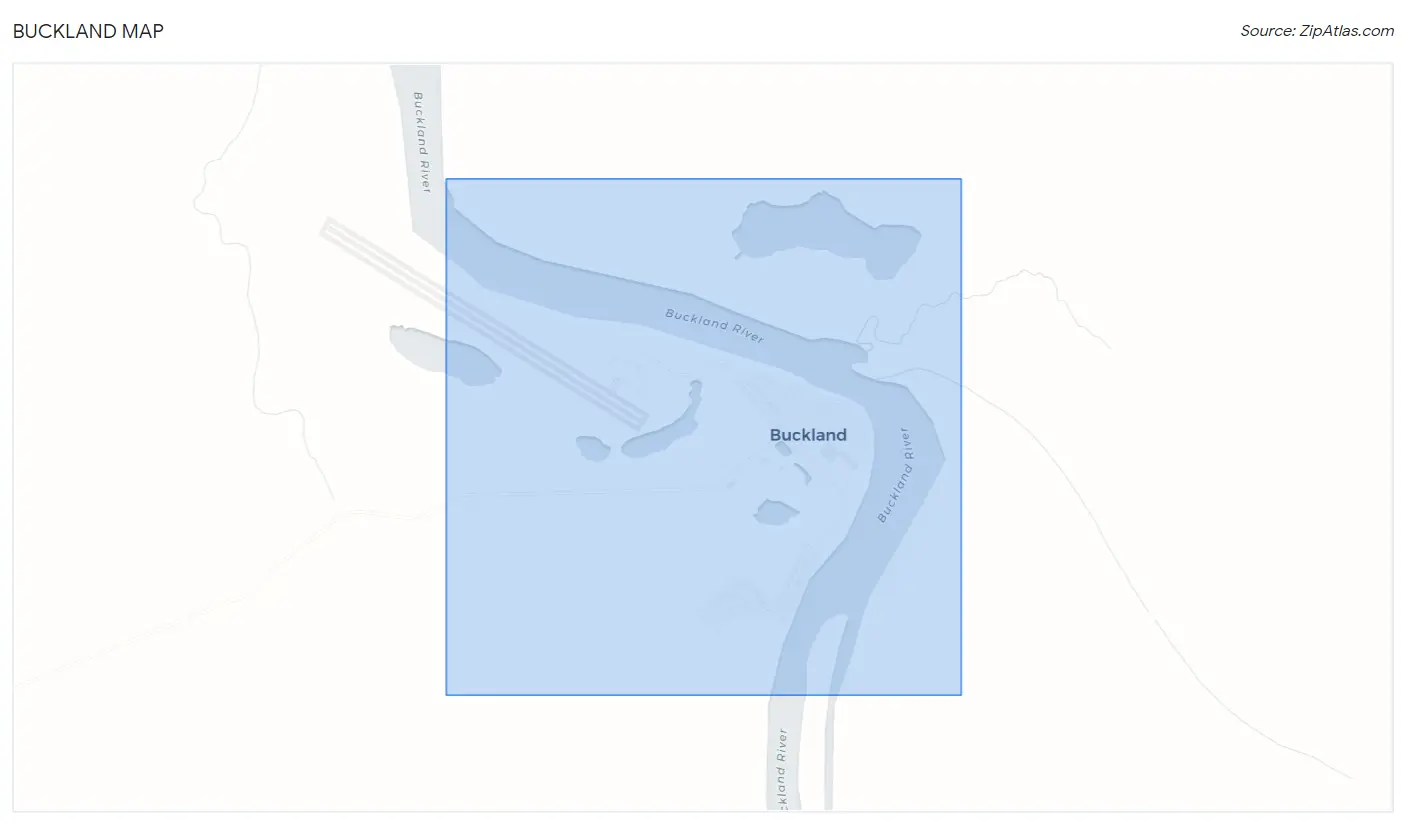
Buckland Map
Buckland Overview
644
TOTAL POPULATION
365
MALE POPULATION
279
FEMALE POPULATION
130.82
MALES / 100 FEMALES
76.44
FEMALES / 100 MALES
22.2
MEDIAN AGE
5.2
AVG FAMILY SIZE
4.8
AVG HOUSEHOLD SIZE
$16,754
PER CAPITA INCOME
$54,444
AVG FAMILY INCOME
$53,819
AVG HOUSEHOLD INCOME
11.9%
WAGE / INCOME GAP [ % ]
88.1¢/ $1
WAGE / INCOME GAP [ $ ]
0.47
INEQUALITY / GINI INDEX
203
LABOR FORCE [ PEOPLE ]
50.9%
PERCENT IN LABOR FORCE
27.1%
UNEMPLOYMENT RATE
Buckland Zip Codes
Buckland Area Codes
Race in Buckland
The most populous races in Buckland are Native / Alaskan (630 | 97.8%), and White / Caucasian (14 | 2.2%).
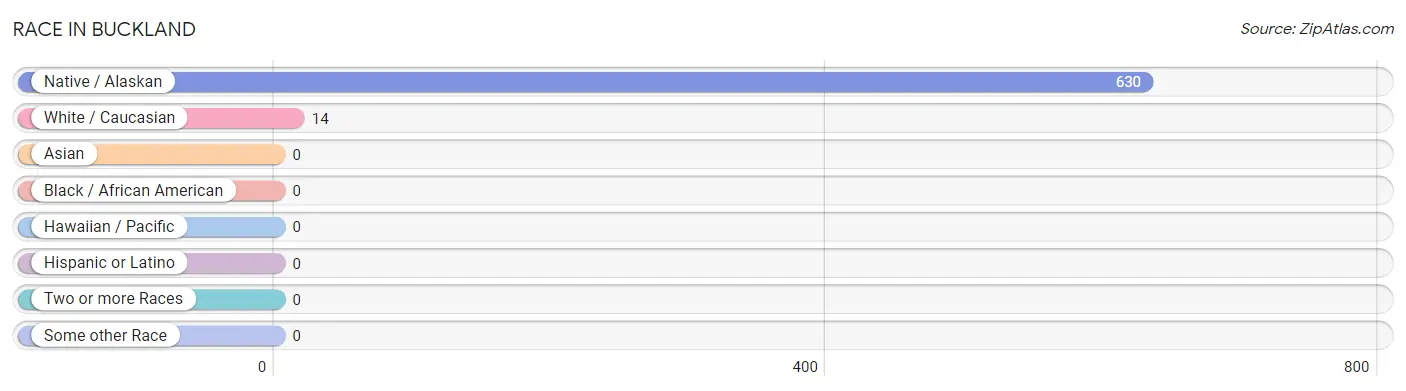
| Race | # Population | % Population |
| Asian | 0 | 0.0% |
| Black / African American | 0 | 0.0% |
| Hawaiian / Pacific | 0 | 0.0% |
| Hispanic or Latino | 0 | 0.0% |
| Native / Alaskan | 630 | 97.8% |
| White / Caucasian | 14 | 2.2% |
| Two or more Races | 0 | 0.0% |
| Some other Race | 0 | 0.0% |
| Total | 644 | 100.0% |
Ancestry in Buckland
The most populous ancestries reported in Buckland are Inupiat (618 | 96.0%), English (13 | 2.0%), Dutch (11 | 1.7%), Alaska Native (8 | 1.2%), and Alaskan Athabascan (4 | 0.6%), together accounting for 101.6% of all Buckland residents.
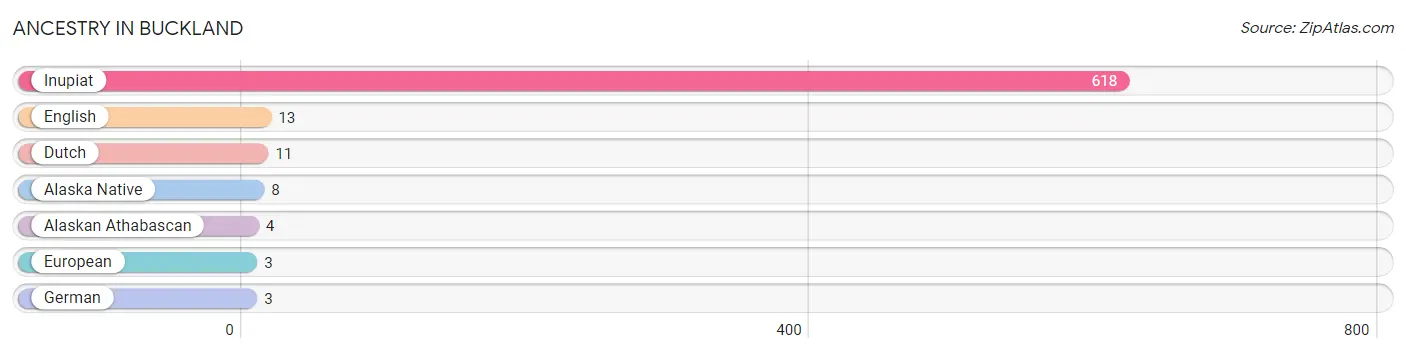
| Ancestry | # Population | % Population |
| Alaska Native | 8 | 1.2% |
| Alaskan Athabascan | 4 | 0.6% |
| Dutch | 11 | 1.7% |
| English | 13 | 2.0% |
| European | 3 | 0.5% |
| German | 3 | 0.5% |
| Inupiat | 618 | 96.0% | View All 7 Rows |
Immigrants in Buckland

| Immigration Origin | # Population | % Population | View All 0 Rows |
Sex and Age in Buckland
Sex and Age in Buckland
The most populous age groups in Buckland are 5 to 9 Years (45 | 12.3%) for men and Under 5 Years (47 | 16.9%) for women.
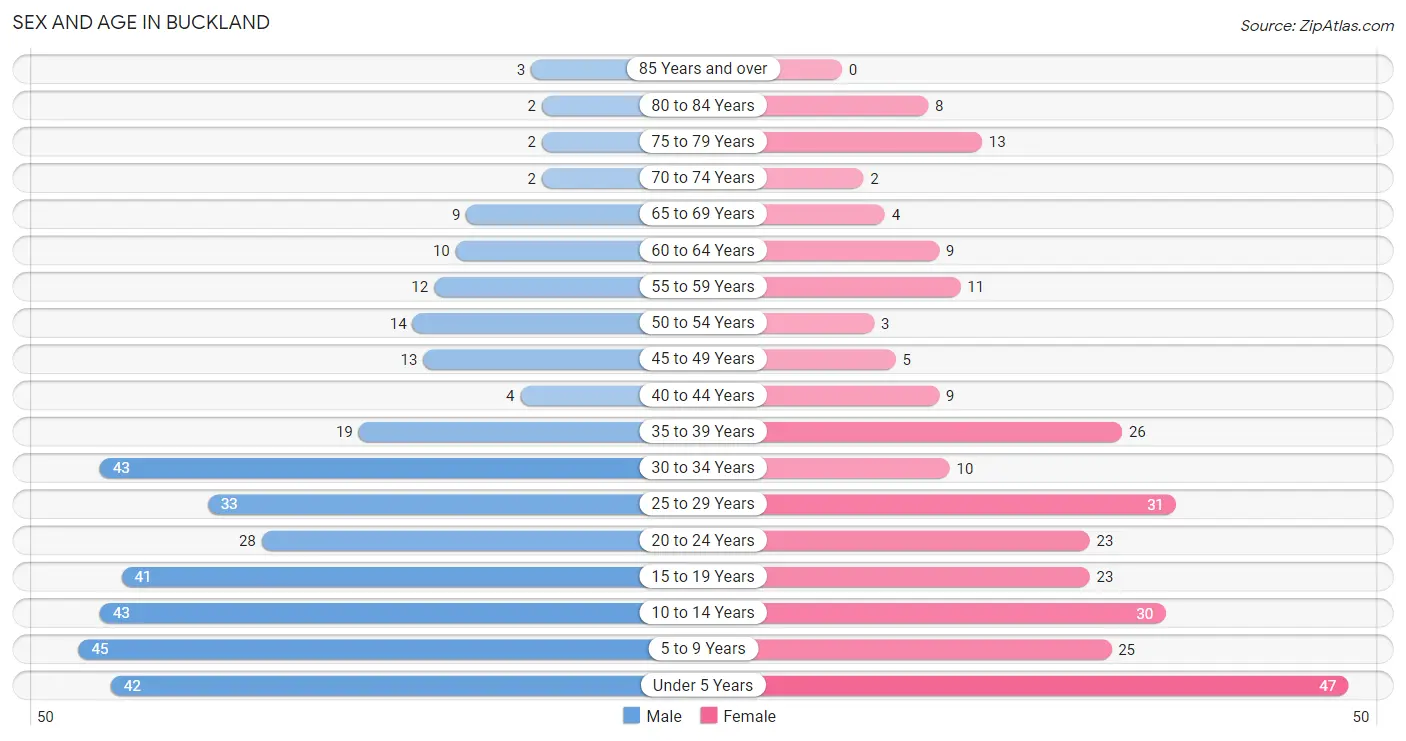
| Age Bracket | Male | Female |
| Under 5 Years | 42 (11.5%) | 47 (16.9%) |
| 5 to 9 Years | 45 (12.3%) | 25 (9.0%) |
| 10 to 14 Years | 43 (11.8%) | 30 (10.7%) |
| 15 to 19 Years | 41 (11.2%) | 23 (8.2%) |
| 20 to 24 Years | 28 (7.7%) | 23 (8.2%) |
| 25 to 29 Years | 33 (9.0%) | 31 (11.1%) |
| 30 to 34 Years | 43 (11.8%) | 10 (3.6%) |
| 35 to 39 Years | 19 (5.2%) | 26 (9.3%) |
| 40 to 44 Years | 4 (1.1%) | 9 (3.2%) |
| 45 to 49 Years | 13 (3.6%) | 5 (1.8%) |
| 50 to 54 Years | 14 (3.8%) | 3 (1.1%) |
| 55 to 59 Years | 12 (3.3%) | 11 (3.9%) |
| 60 to 64 Years | 10 (2.7%) | 9 (3.2%) |
| 65 to 69 Years | 9 (2.5%) | 4 (1.4%) |
| 70 to 74 Years | 2 (0.5%) | 2 (0.7%) |
| 75 to 79 Years | 2 (0.5%) | 13 (4.7%) |
| 80 to 84 Years | 2 (0.5%) | 8 (2.9%) |
| 85 Years and over | 3 (0.8%) | 0 (0.0%) |
| Total | 365 (100.0%) | 279 (100.0%) |
Families and Households in Buckland
Median Family Size in Buckland
The median family size in Buckland is 5.21 persons per family, with married-couple families (66 | 55.9%) accounting for the largest median family size of 5.59 persons per family. On the other hand, single female/mother families (31 | 26.3%) represent the smallest median family size with 4.71 persons per family.
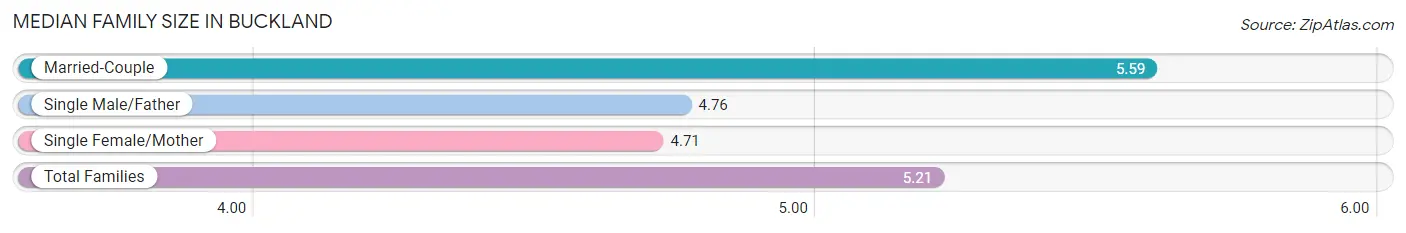
| Family Type | # Families | Family Size |
| Married-Couple | 66 (55.9%) | 5.59 |
| Single Male/Father | 21 (17.8%) | 4.76 |
| Single Female/Mother | 31 (26.3%) | 4.71 |
| Total Families | 118 (100.0%) | 5.21 |
Median Household Size in Buckland
The median household size in Buckland is 4.84 persons per household, with married-couple households (66 | 49.6%) accounting for the largest median household size of 5.73 persons per household. non-family households (15 | 11.3%) represent the smallest median household size with 1.07 persons per household.
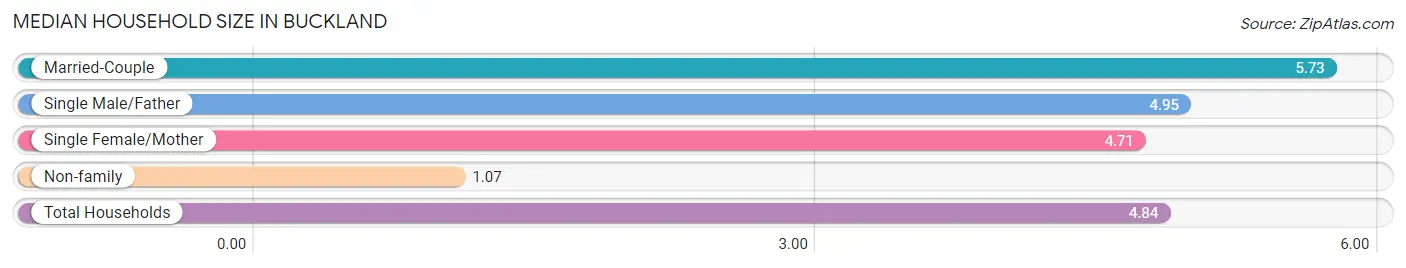
| Household Type | # Households | Household Size |
| Married-Couple | 66 (49.6%) | 5.73 |
| Single Male/Father | 21 (15.8%) | 4.95 |
| Single Female/Mother | 31 (23.3%) | 4.71 |
| Non-family | 15 (11.3%) | 1.07 |
| Total Households | 133 (100.0%) | 4.84 |
Household Size by Marriage Status in Buckland
Out of a total of 133 households in Buckland, 118 (88.7%) are family households, while 15 (11.3%) are nonfamily households. The most numerous type of family households are 6-person households, comprising 35, and the most common type of nonfamily households are 1-person households, comprising 13.
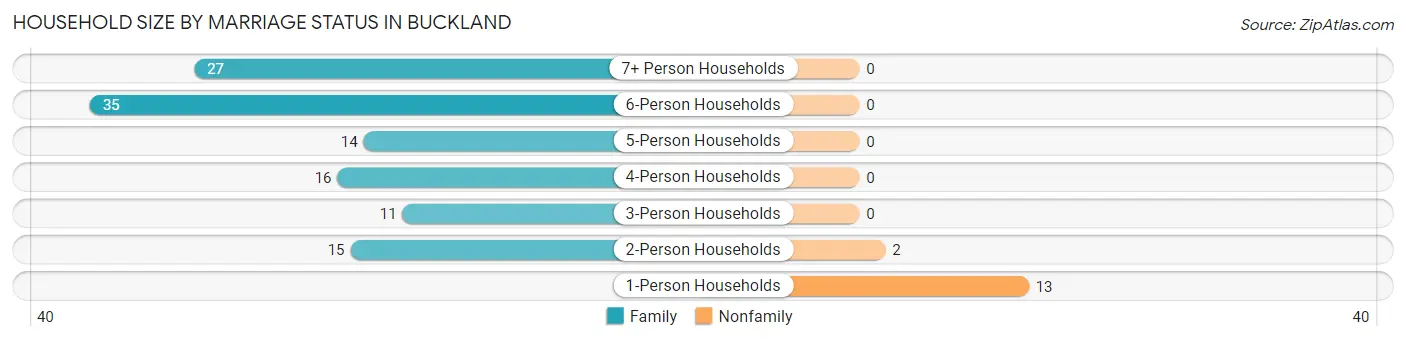
| Household Size | Family Households | Nonfamily Households |
| 1-Person Households | - | 13 (9.8%) |
| 2-Person Households | 15 (11.3%) | 2 (1.5%) |
| 3-Person Households | 11 (8.3%) | 0 (0.0%) |
| 4-Person Households | 16 (12.0%) | 0 (0.0%) |
| 5-Person Households | 14 (10.5%) | 0 (0.0%) |
| 6-Person Households | 35 (26.3%) | 0 (0.0%) |
| 7+ Person Households | 27 (20.3%) | 0 (0.0%) |
| Total | 118 (88.7%) | 15 (11.3%) |
Female Fertility in Buckland
Fertility by Age in Buckland
Average fertility rate in Buckland is 55.0 births per 1,000 women. Women in the age bracket of 15 to 19 years have the highest fertility rate with 174.0 births per 1,000 women. Women in the age bracket of 15 to 19 years acount for 57.1% of all women with births.
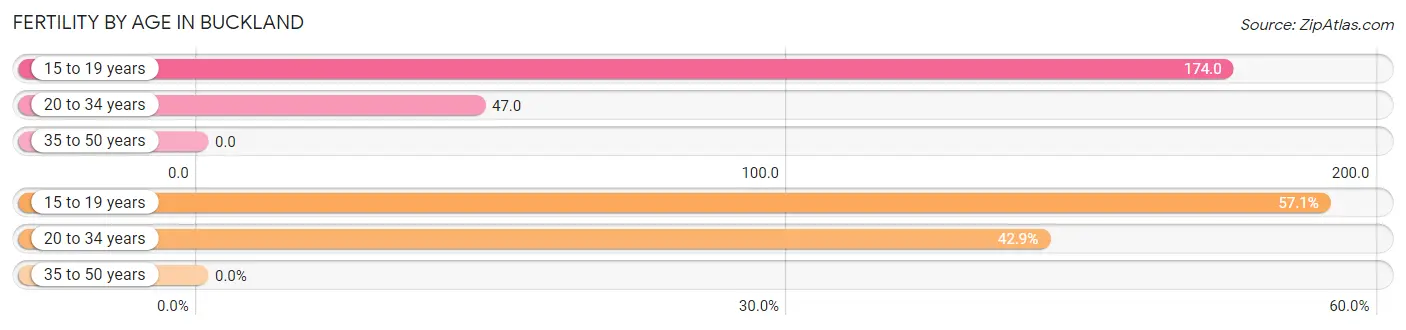
| Age Bracket | Women with Births | Births / 1,000 Women |
| 15 to 19 years | 4 (57.1%) | 174.0 |
| 20 to 34 years | 3 (42.9%) | 47.0 |
| 35 to 50 years | 0 (0.0%) | 0.0 |
| Total | 7 (100.0%) | 55.0 |
Fertility by Age by Marriage Status in Buckland
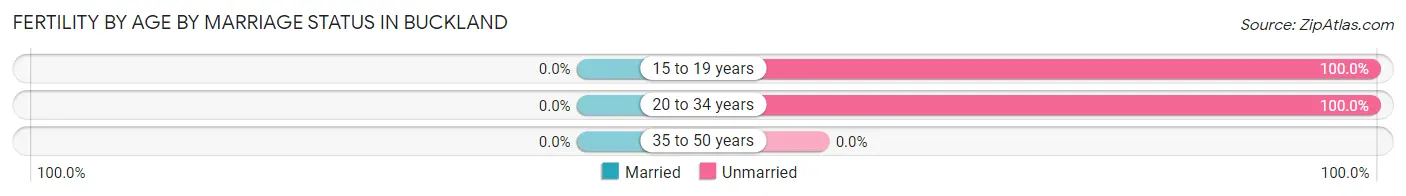
| Age Bracket | Married | Unmarried |
| 15 to 19 years | 0 (0.0%) | 4 (100.0%) |
| 20 to 34 years | 0 (0.0%) | 3 (100.0%) |
| 35 to 50 years | 0 (0.0%) | 0 (0.0%) |
| Total | 0 (0.0%) | 7 (100.0%) |
Fertility by Education in Buckland
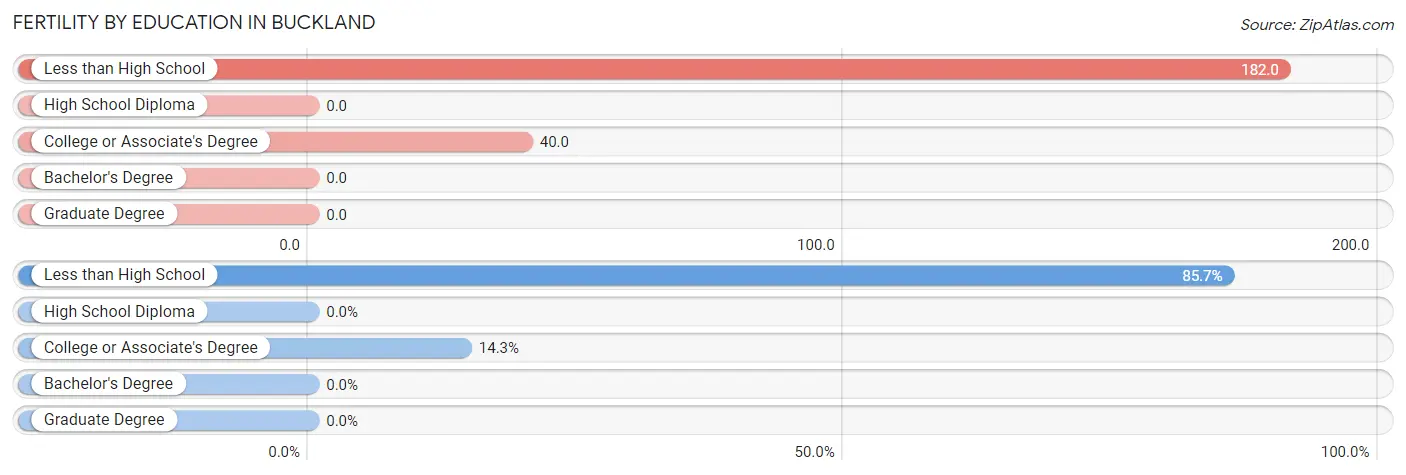
| Educational Attainment | Women with Births | Births / 1,000 Women |
| Less than High School | 6 (85.7%) | 182.0 |
| High School Diploma | 0 (0.0%) | 0.0 |
| College or Associate's Degree | 1 (14.3%) | 40.0 |
| Bachelor's Degree | 0 (0.0%) | 0.0 |
| Graduate Degree | 0 (0.0%) | 0.0 |
| Total | 7 (100.0%) | 55.0 |
Fertility by Education by Marriage Status in Buckland
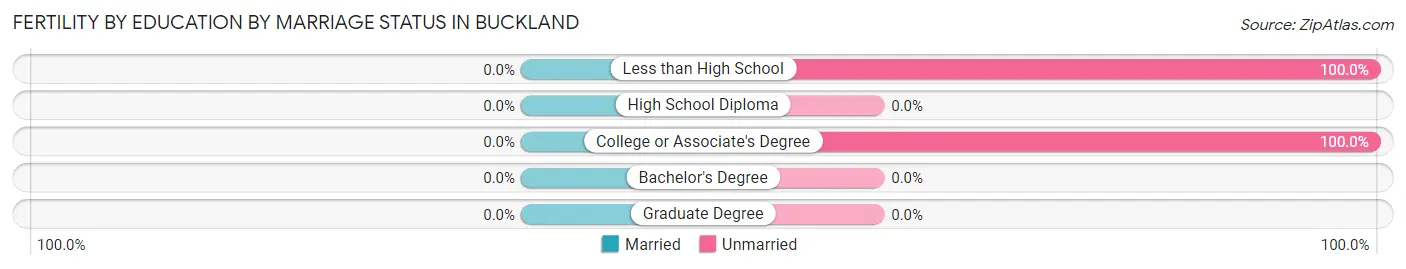
| Educational Attainment | Married | Unmarried |
| Less than High School | 0 (0.0%) | 6 (100.0%) |
| High School Diploma | 0 (0.0%) | 0 (0.0%) |
| College or Associate's Degree | 0 (0.0%) | 1 (100.0%) |
| Bachelor's Degree | 0 (0.0%) | 0 (0.0%) |
| Graduate Degree | 0 (0.0%) | 0 (0.0%) |
| Total | 0 (0.0%) | 7 (100.0%) |
Income in Buckland
Income Overview in Buckland
Per Capita Income in Buckland is $16,754, while median incomes of families and households are $54,444 and $53,819 respectively.
| Characteristic | Number | Measure |
| Per Capita Income | 644 | $16,754 |
| Median Family Income | 118 | $54,444 |
| Mean Family Income | 118 | $90,492 |
| Median Household Income | 133 | $53,819 |
| Mean Household Income | 133 | $83,910 |
| Income Deficit | 118 | $0 |
| Wage / Income Gap (%) | 644 | 11.87% |
| Wage / Income Gap ($) | 644 | 88.13¢ per $1 |
| Gini / Inequality Index | 644 | 0.47 |
Earnings by Sex in Buckland
Average Earnings in Buckland are $23,611, $24,821 for men and $21,875 for women, a difference of 11.9%.
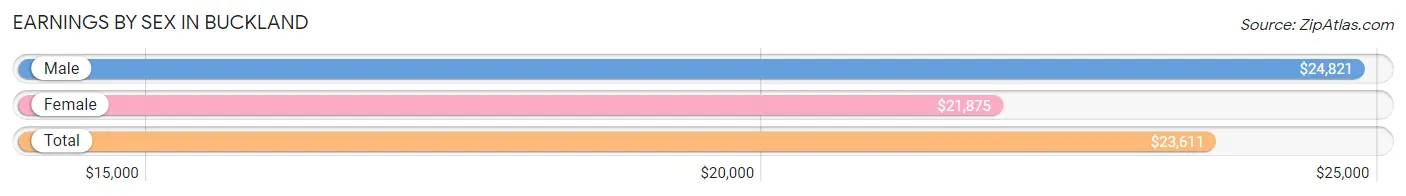
| Sex | Number | Average Earnings |
| Male | 125 (56.3%) | $24,821 |
| Female | 97 (43.7%) | $21,875 |
| Total | 222 (100.0%) | $23,611 |
Earnings by Sex by Income Bracket in Buckland
The most common earnings brackets in Buckland are $100,000+ for men (20 | 16.0%) and $5,000 to $7,499 for women (12 | 12.4%).
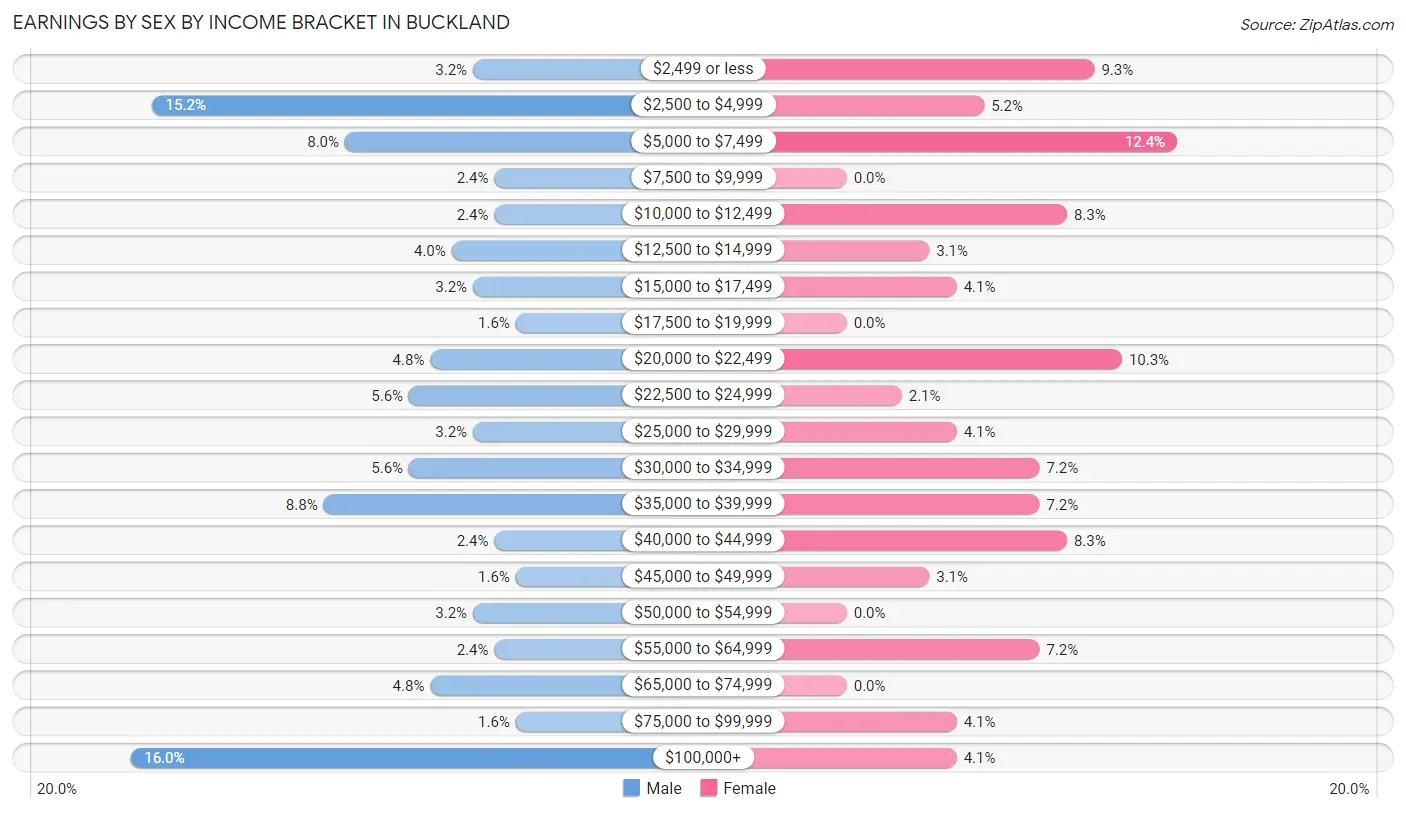
| Income | Male | Female |
| $2,499 or less | 4 (3.2%) | 9 (9.3%) |
| $2,500 to $4,999 | 19 (15.2%) | 5 (5.1%) |
| $5,000 to $7,499 | 10 (8.0%) | 12 (12.4%) |
| $7,500 to $9,999 | 3 (2.4%) | 0 (0.0%) |
| $10,000 to $12,499 | 3 (2.4%) | 8 (8.3%) |
| $12,500 to $14,999 | 5 (4.0%) | 3 (3.1%) |
| $15,000 to $17,499 | 4 (3.2%) | 4 (4.1%) |
| $17,500 to $19,999 | 2 (1.6%) | 0 (0.0%) |
| $20,000 to $22,499 | 6 (4.8%) | 10 (10.3%) |
| $22,500 to $24,999 | 7 (5.6%) | 2 (2.1%) |
| $25,000 to $29,999 | 4 (3.2%) | 4 (4.1%) |
| $30,000 to $34,999 | 7 (5.6%) | 7 (7.2%) |
| $35,000 to $39,999 | 11 (8.8%) | 7 (7.2%) |
| $40,000 to $44,999 | 3 (2.4%) | 8 (8.3%) |
| $45,000 to $49,999 | 2 (1.6%) | 3 (3.1%) |
| $50,000 to $54,999 | 4 (3.2%) | 0 (0.0%) |
| $55,000 to $64,999 | 3 (2.4%) | 7 (7.2%) |
| $65,000 to $74,999 | 6 (4.8%) | 0 (0.0%) |
| $75,000 to $99,999 | 2 (1.6%) | 4 (4.1%) |
| $100,000+ | 20 (16.0%) | 4 (4.1%) |
| Total | 125 (100.0%) | 97 (100.0%) |
Earnings by Sex by Educational Attainment in Buckland
Average earnings in Buckland are $28,750 for men and $31,667 for women, a difference of 9.2%. Men with an educational attainment of high school diploma enjoy the highest average annual earnings of $32,083, while those with less than high school education earn the least with $11,667. Women with an educational attainment of college or associate's degree earn the most with the average annual earnings of $46,250, while those with high school diploma education have the smallest earnings of $27,500.
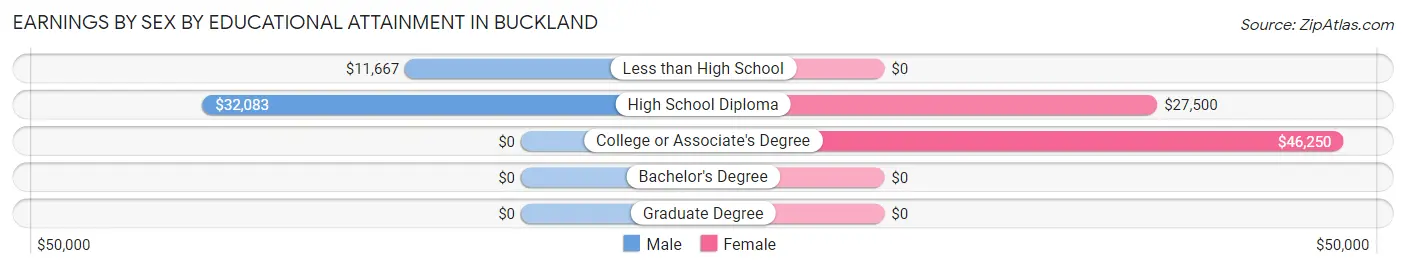
| Educational Attainment | Male Income | Female Income |
| Less than High School | $11,667 | $0 |
| High School Diploma | $32,083 | $27,500 |
| College or Associate's Degree | - | - |
| Bachelor's Degree | - | - |
| Graduate Degree | - | - |
| Total | $28,750 | $31,667 |
Family Income in Buckland
Family Income Brackets in Buckland
According to the Buckland family income data, there are 36 families falling into the $50,000 to $74,999 income range, which is the most common income bracket and makes up 30.5% of all families. Conversely, the less than $10,000 income bracket is the least frequent group with only 2 families (1.7%) belonging to this category.
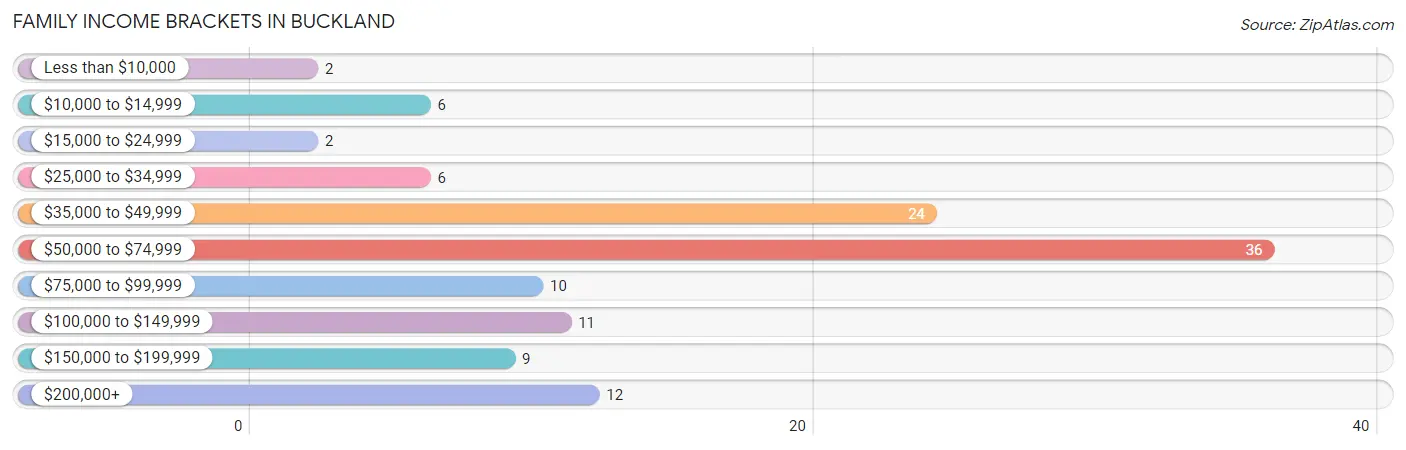
| Income Bracket | # Families | % Families |
| Less than $10,000 | 2 | 1.7% |
| $10,000 to $14,999 | 6 | 5.1% |
| $15,000 to $24,999 | 2 | 1.7% |
| $25,000 to $34,999 | 6 | 5.1% |
| $35,000 to $49,999 | 24 | 20.3% |
| $50,000 to $74,999 | 36 | 30.5% |
| $75,000 to $99,999 | 10 | 8.5% |
| $100,000 to $149,999 | 11 | 9.3% |
| $150,000 to $199,999 | 9 | 7.6% |
| $200,000+ | 12 | 10.2% |
Family Income by Famaliy Size in Buckland
7+ person families (23 | 19.5%) account for the highest median family income in Buckland with $118,125 per family, while 2-person families (15 | 12.7%) have the highest median income of $17,875 per family member.
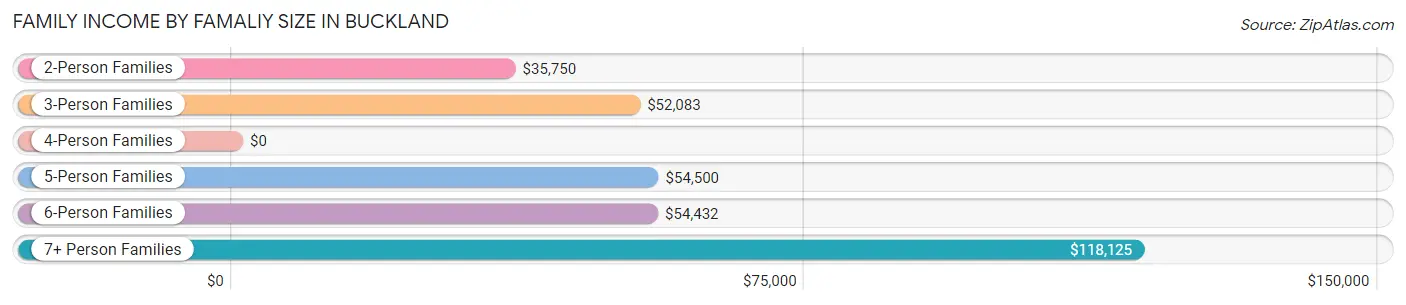
| Income Bracket | # Families | Median Income |
| 2-Person Families | 15 (12.7%) | $35,750 |
| 3-Person Families | 11 (9.3%) | $52,083 |
| 4-Person Families | 18 (15.2%) | $0 |
| 5-Person Families | 14 (11.9%) | $54,500 |
| 6-Person Families | 37 (31.4%) | $54,432 |
| 7+ Person Families | 23 (19.5%) | $118,125 |
| Total | 118 (100.0%) | $54,444 |
Family Income by Number of Earners in Buckland
The median family income in Buckland is $54,444, with families comprising 3+ earners (29) having the highest median family income of $146,250, while families with no earners (13) have the lowest median family income of $35,250, accounting for 24.6% and 11.0% of families, respectively.
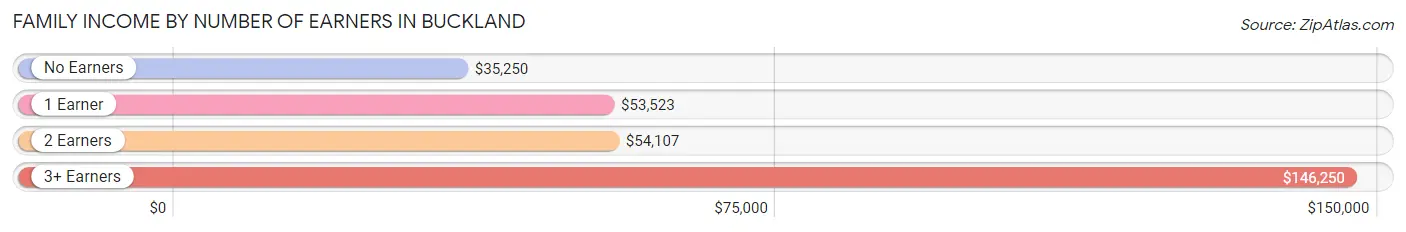
| Number of Earners | # Families | Median Income |
| No Earners | 13 (11.0%) | $35,250 |
| 1 Earner | 39 (33.1%) | $53,523 |
| 2 Earners | 37 (31.4%) | $54,107 |
| 3+ Earners | 29 (24.6%) | $146,250 |
| Total | 118 (100.0%) | $54,444 |
Household Income in Buckland
Household Income Brackets in Buckland
With 38 households falling in the category, the $50,000 to $74,999 income range is the most frequent in Buckland, accounting for 28.6% of all households. In contrast, only 4 households (3.0%) fall into the $15,000 to $24,999 income bracket, making it the least populous group.
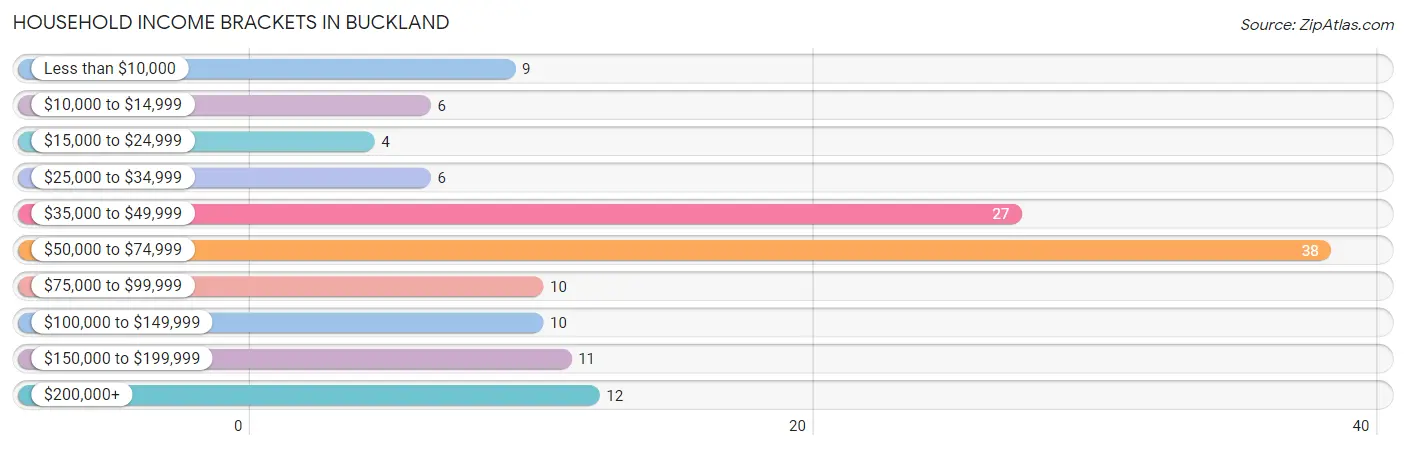
| Income Bracket | # Households | % Households |
| Less than $10,000 | 9 | 6.8% |
| $10,000 to $14,999 | 6 | 4.5% |
| $15,000 to $24,999 | 4 | 3.0% |
| $25,000 to $34,999 | 6 | 4.5% |
| $35,000 to $49,999 | 27 | 20.3% |
| $50,000 to $74,999 | 38 | 28.6% |
| $75,000 to $99,999 | 10 | 7.5% |
| $100,000 to $149,999 | 10 | 7.5% |
| $150,000 to $199,999 | 11 | 8.3% |
| $200,000+ | 12 | 9.0% |
Household Income by Householder Age in Buckland
The median household income in Buckland is $53,819, with the highest median household income of $71,250 found in the 45 to 64 years age bracket for the primary householder. A total of 51 households (38.4%) fall into this category. Meanwhile, the 15 to 24 years age bracket for the primary householder has the lowest median household income of $0, with 2 households (1.5%) in this group.
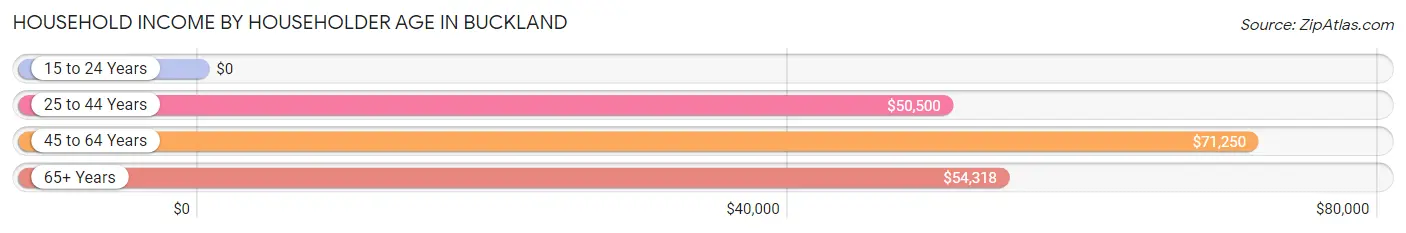
| Income Bracket | # Households | Median Income |
| 15 to 24 Years | 2 (1.5%) | $0 |
| 25 to 44 Years | 44 (33.1%) | $50,500 |
| 45 to 64 Years | 51 (38.4%) | $71,250 |
| 65+ Years | 36 (27.1%) | $54,318 |
| Total | 133 (100.0%) | $53,819 |
Poverty in Buckland
Income Below Poverty by Sex and Age in Buckland
With 13.4% poverty level for males and 18.3% for females among the residents of Buckland, 35 to 44 year old males and 6 to 11 year old females are the most vulnerable to poverty, with 6 males (26.1%) and 12 females (33.3%) in their respective age groups living below the poverty level.
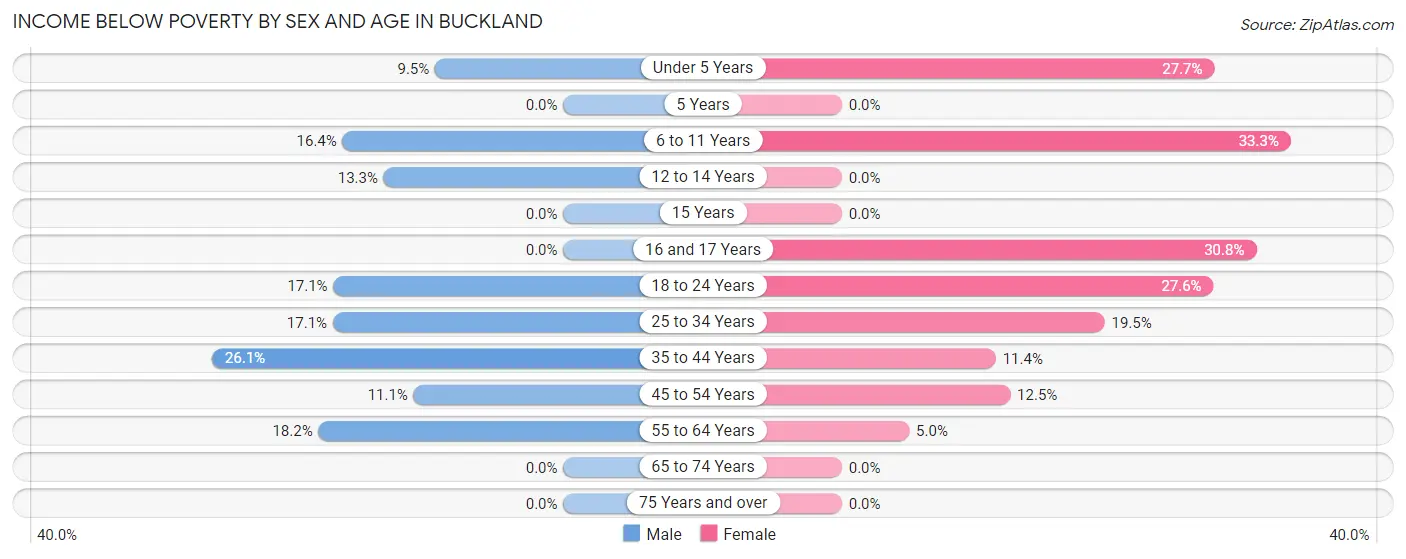
| Age Bracket | Male | Female |
| Under 5 Years | 4 (9.5%) | 13 (27.7%) |
| 5 Years | 0 (0.0%) | 0 (0.0%) |
| 6 to 11 Years | 10 (16.4%) | 12 (33.3%) |
| 12 to 14 Years | 2 (13.3%) | 0 (0.0%) |
| 15 Years | 0 (0.0%) | 0 (0.0%) |
| 16 and 17 Years | 0 (0.0%) | 4 (30.8%) |
| 18 to 24 Years | 7 (17.1%) | 8 (27.6%) |
| 25 to 34 Years | 13 (17.1%) | 8 (19.5%) |
| 35 to 44 Years | 6 (26.1%) | 4 (11.4%) |
| 45 to 54 Years | 3 (11.1%) | 1 (12.5%) |
| 55 to 64 Years | 4 (18.2%) | 1 (5.0%) |
| 65 to 74 Years | 0 (0.0%) | 0 (0.0%) |
| 75 Years and over | 0 (0.0%) | 0 (0.0%) |
| Total | 49 (13.4%) | 51 (18.3%) |
Income Above Poverty by Sex and Age in Buckland
According to the poverty statistics in Buckland, males aged 5 years and females aged 5 years are the age groups that are most secure financially, with 100.0% of males and 100.0% of females in these age groups living above the poverty line.
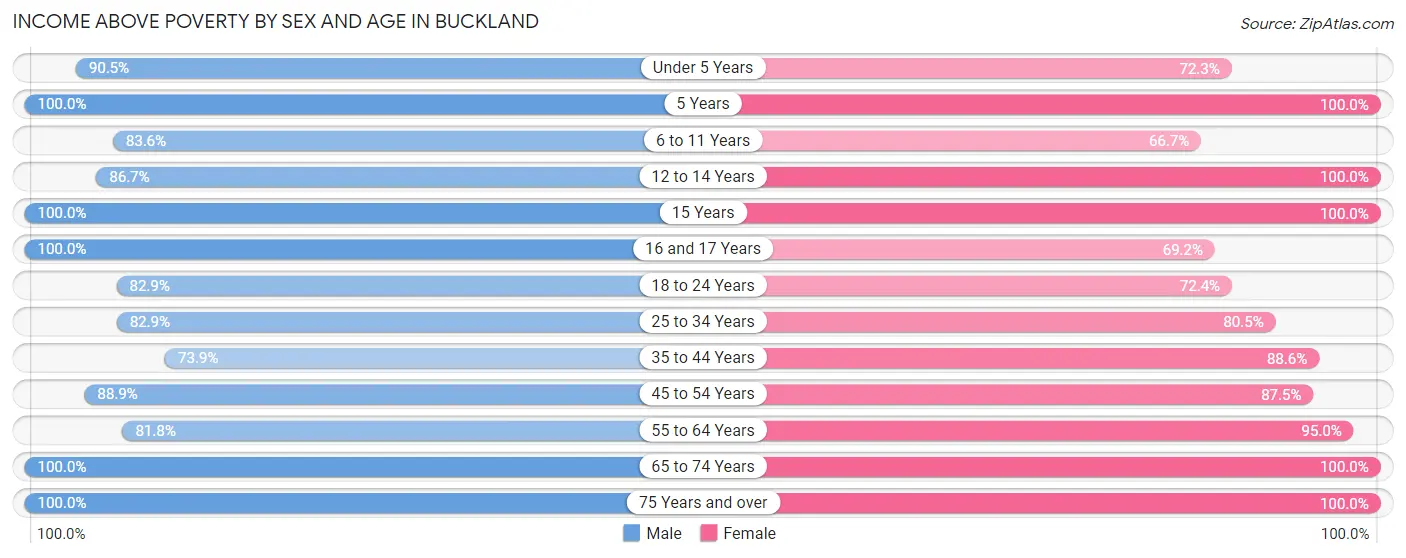
| Age Bracket | Male | Female |
| Under 5 Years | 38 (90.5%) | 34 (72.3%) |
| 5 Years | 12 (100.0%) | 7 (100.0%) |
| 6 to 11 Years | 51 (83.6%) | 24 (66.7%) |
| 12 to 14 Years | 13 (86.7%) | 11 (100.0%) |
| 15 Years | 9 (100.0%) | 4 (100.0%) |
| 16 and 17 Years | 19 (100.0%) | 9 (69.2%) |
| 18 to 24 Years | 34 (82.9%) | 21 (72.4%) |
| 25 to 34 Years | 63 (82.9%) | 33 (80.5%) |
| 35 to 44 Years | 17 (73.9%) | 31 (88.6%) |
| 45 to 54 Years | 24 (88.9%) | 7 (87.5%) |
| 55 to 64 Years | 18 (81.8%) | 19 (95.0%) |
| 65 to 74 Years | 11 (100.0%) | 6 (100.0%) |
| 75 Years and over | 7 (100.0%) | 21 (100.0%) |
| Total | 316 (86.6%) | 227 (81.7%) |
Income Below Poverty Among Married-Couple Families in Buckland
The poverty statistics for married-couple families in Buckland show that 12.1% or 8 of the total 66 families live below the poverty line. Families with 3 or 4 children have the highest poverty rate of 20.0%, comprising of 5 families. On the other hand, families with no children have the lowest poverty rate of 0.0%, which includes 0 families.
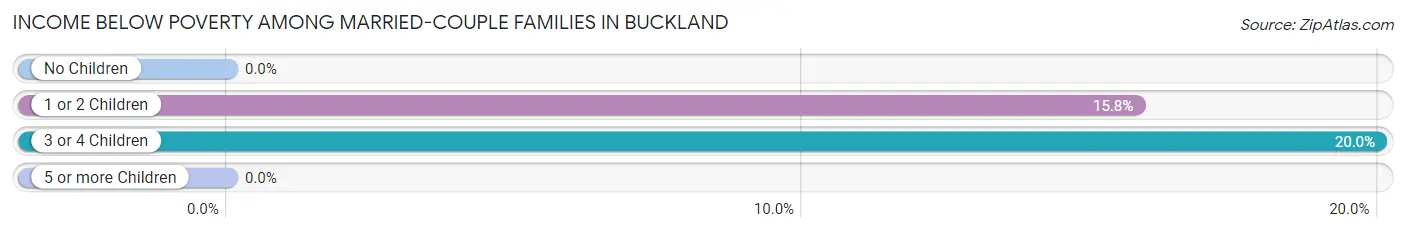
| Children | Above Poverty | Below Poverty |
| No Children | 12 (100.0%) | 0 (0.0%) |
| 1 or 2 Children | 16 (84.2%) | 3 (15.8%) |
| 3 or 4 Children | 20 (80.0%) | 5 (20.0%) |
| 5 or more Children | 10 (100.0%) | 0 (0.0%) |
| Total | 58 (87.9%) | 8 (12.1%) |
Income Below Poverty Among Single-Parent Households in Buckland
According to the poverty data in Buckland, 19.1% or 4 single-father households and 9.7% or 3 single-mother households are living below the poverty line. Among single-father households, those with no children have the highest poverty rate, with 2 households (100.0%) experiencing poverty. Likewise, among single-mother households, those with 3 or 4 children have the highest poverty rate, with 2 households (11.1%) falling below the poverty line.
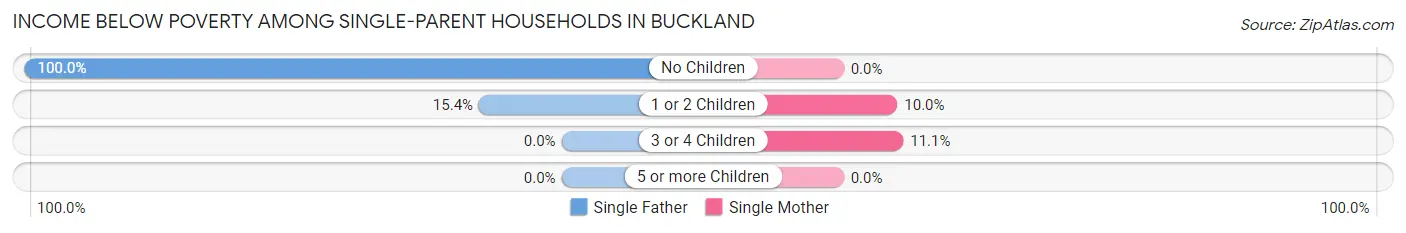
| Children | Single Father | Single Mother |
| No Children | 2 (100.0%) | 0 (0.0%) |
| 1 or 2 Children | 2 (15.4%) | 1 (10.0%) |
| 3 or 4 Children | 0 (0.0%) | 2 (11.1%) |
| 5 or more Children | 0 (0.0%) | 0 (0.0%) |
| Total | 4 (19.1%) | 3 (9.7%) |
Income Below Poverty Among Married-Couple vs Single-Parent Households in Buckland
The poverty data for Buckland shows that 8 of the married-couple family households (12.1%) and 7 of the single-parent households (13.5%) are living below the poverty level. Within the married-couple family households, those with 3 or 4 children have the highest poverty rate, with 5 households (20.0%) falling below the poverty line. Among the single-parent households, those with no children have the highest poverty rate, with 2 household (40.0%) living below poverty.
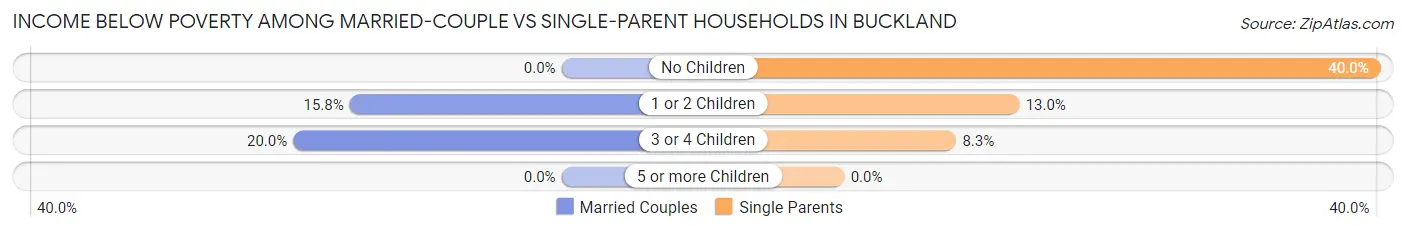
| Children | Married-Couple Families | Single-Parent Households |
| No Children | 0 (0.0%) | 2 (40.0%) |
| 1 or 2 Children | 3 (15.8%) | 3 (13.0%) |
| 3 or 4 Children | 5 (20.0%) | 2 (8.3%) |
| 5 or more Children | 0 (0.0%) | 0 (0.0%) |
| Total | 8 (12.1%) | 7 (13.5%) |
Employment Characteristics in Buckland
Employment by Class of Employer in Buckland
Among the 138 employed individuals in Buckland, local government employees (88 | 63.8%), private company employees (33 | 23.9%), and not-for-profit organizations (15 | 10.9%) make up the most common classes of employment.
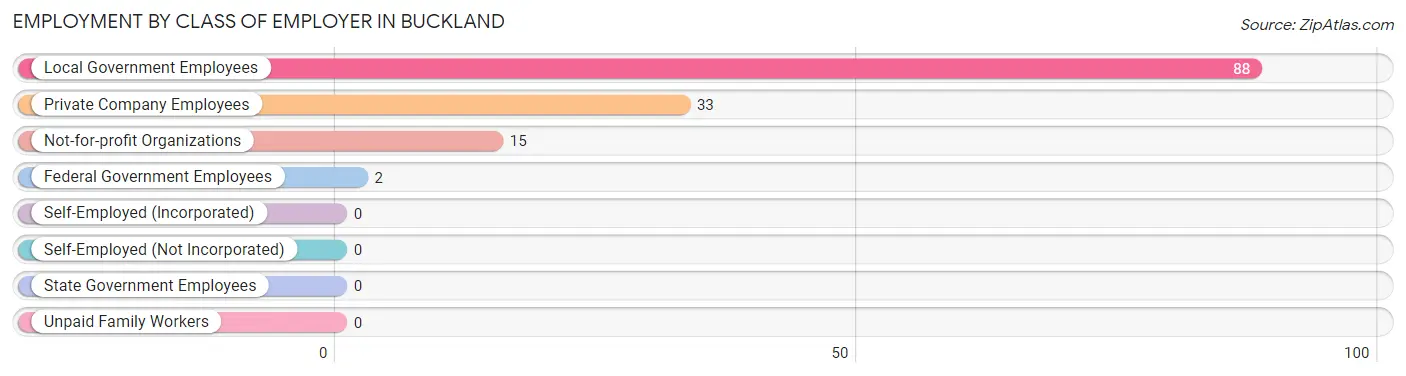
| Employer Class | # Employees | % Employees |
| Private Company Employees | 33 | 23.9% |
| Self-Employed (Incorporated) | 0 | 0.0% |
| Self-Employed (Not Incorporated) | 0 | 0.0% |
| Not-for-profit Organizations | 15 | 10.9% |
| Local Government Employees | 88 | 63.8% |
| State Government Employees | 0 | 0.0% |
| Federal Government Employees | 2 | 1.5% |
| Unpaid Family Workers | 0 | 0.0% |
| Total | 138 | 100.0% |
Employment Status by Age in Buckland
According to the labor force statistics for Buckland, out of the total population over 16 years of age (399), 50.9% or 203 individuals are in the labor force, with 27.1% or 55 of them unemployed. The age group with the highest labor force participation rate is 35 to 44 years, with 79.3% or 46 individuals in the labor force. Within the labor force, the 16 to 19 years age range has the highest percentage of unemployed individuals, with 60.0% or 3 of them being unemployed.
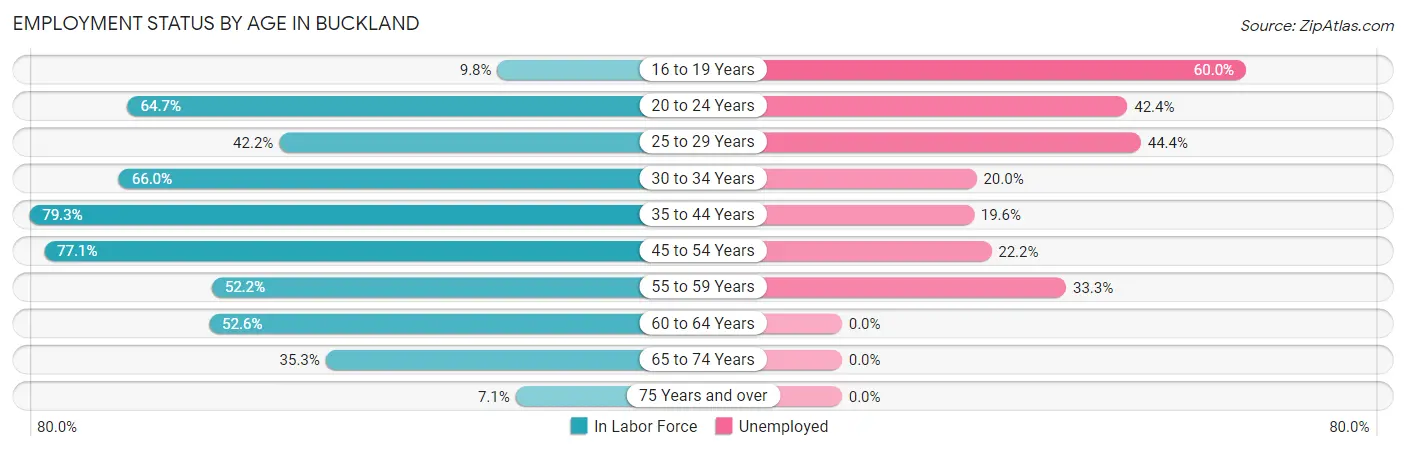
| Age Bracket | In Labor Force | Unemployed |
| 16 to 19 Years | 5 (9.8%) | 3 (60.0%) |
| 20 to 24 Years | 33 (64.7%) | 14 (42.4%) |
| 25 to 29 Years | 27 (42.2%) | 12 (44.4%) |
| 30 to 34 Years | 35 (66.0%) | 7 (20.0%) |
| 35 to 44 Years | 46 (79.3%) | 9 (19.6%) |
| 45 to 54 Years | 27 (77.1%) | 6 (22.2%) |
| 55 to 59 Years | 12 (52.2%) | 4 (33.3%) |
| 60 to 64 Years | 10 (52.6%) | 0 (0.0%) |
| 65 to 74 Years | 6 (35.3%) | 0 (0.0%) |
| 75 Years and over | 2 (7.1%) | 0 (0.0%) |
| Total | 203 (50.9%) | 55 (27.1%) |
Employment Status by Educational Attainment in Buckland
According to labor force statistics for Buckland, 62.3% of individuals (157) out of the total population between 25 and 64 years of age (252) are in the labor force, with 24.2% or 38 of them being unemployed. The group with the highest labor force participation rate are those with the educational attainment of high school diploma, with 68.2% or 122 individuals in the labor force. Within the labor force, individuals with less than high school education have the highest percentage of unemployment, with 33.3% or 4 of them being unemployed.
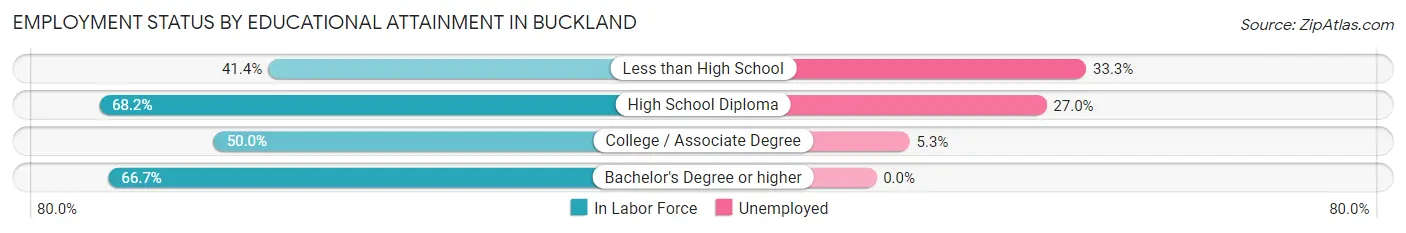
| Educational Attainment | In Labor Force | Unemployed |
| Less than High School | 12 (41.4%) | 10 (33.3%) |
| High School Diploma | 122 (68.2%) | 48 (27.0%) |
| College / Associate Degree | 19 (50.0%) | 2 (5.3%) |
| Bachelor's Degree or higher | 4 (66.7%) | 0 (0.0%) |
| Total | 157 (62.3%) | 61 (24.2%) |
Employment Occupations by Sex in Buckland
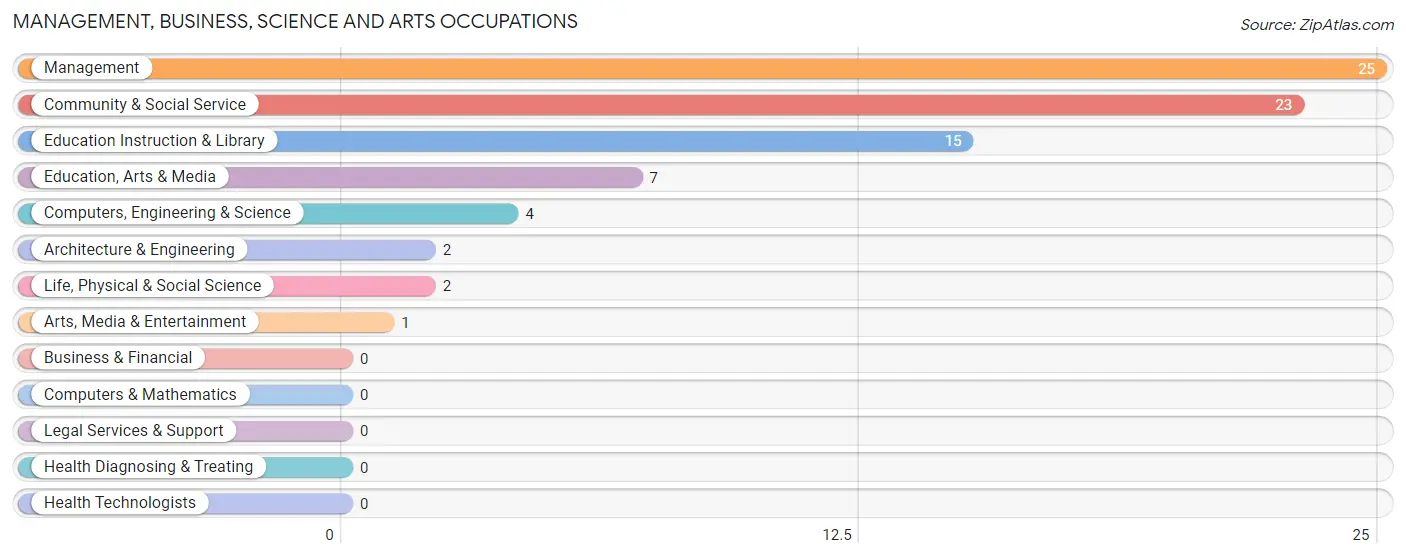
Management, Business, Science and Arts Occupations
The most common Management, Business, Science and Arts occupations in Buckland are Management (25 | 16.9%), Community & Social Service (23 | 15.5%), Education Instruction & Library (15 | 10.1%), Education, Arts & Media (7 | 4.7%), and Computers, Engineering & Science (4 | 2.7%).
Management, Business, Science and Arts Occupations by Sex
Within the Management, Business, Science and Arts occupations in Buckland, the most male-oriented occupations are Education, Arts & Media (71.4%), Management (48.0%), and Community & Social Service (39.1%), while the most female-oriented occupations are Computers, Engineering & Science (100.0%), Architecture & Engineering (100.0%), and Life, Physical & Social Science (100.0%).
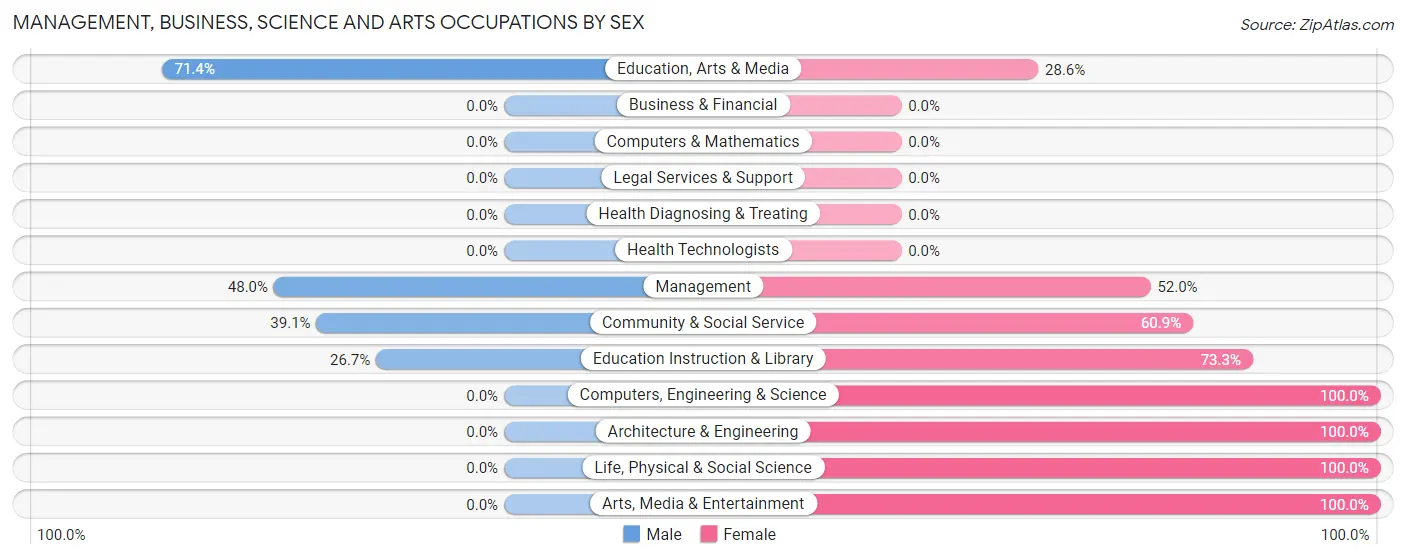
| Occupation | Male | Female |
| Management | 12 (48.0%) | 13 (52.0%) |
| Business & Financial | 0 (0.0%) | 0 (0.0%) |
| Computers, Engineering & Science | 0 (0.0%) | 4 (100.0%) |
| Computers & Mathematics | 0 (0.0%) | 0 (0.0%) |
| Architecture & Engineering | 0 (0.0%) | 2 (100.0%) |
| Life, Physical & Social Science | 0 (0.0%) | 2 (100.0%) |
| Community & Social Service | 9 (39.1%) | 14 (60.9%) |
| Education, Arts & Media | 5 (71.4%) | 2 (28.6%) |
| Legal Services & Support | 0 (0.0%) | 0 (0.0%) |
| Education Instruction & Library | 4 (26.7%) | 11 (73.3%) |
| Arts, Media & Entertainment | 0 (0.0%) | 1 (100.0%) |
| Health Diagnosing & Treating | 0 (0.0%) | 0 (0.0%) |
| Health Technologists | 0 (0.0%) | 0 (0.0%) |
| Total (Category) | 21 (40.4%) | 31 (59.6%) |
| Total (Overall) | 83 (56.1%) | 65 (43.9%) |
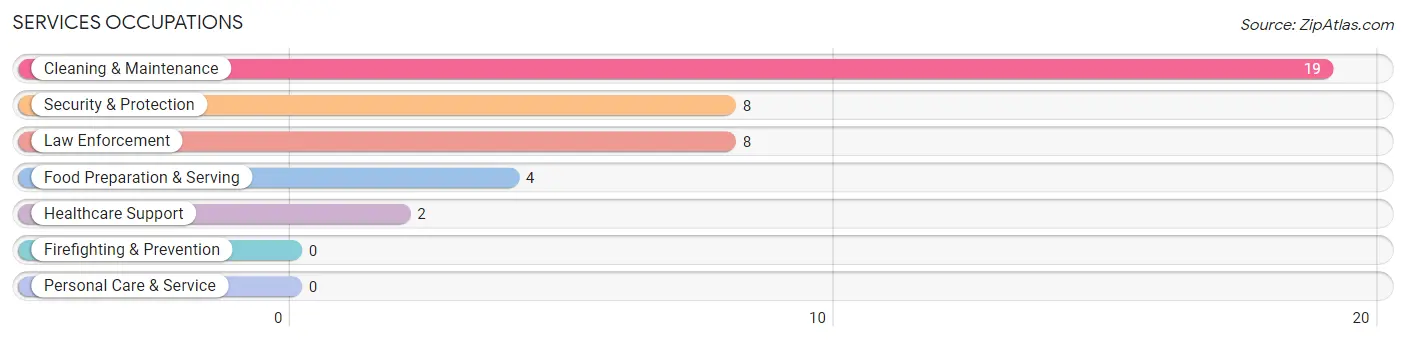
Services Occupations
The most common Services occupations in Buckland are Cleaning & Maintenance (19 | 12.8%), Security & Protection (8 | 5.4%), Law Enforcement (8 | 5.4%), Food Preparation & Serving (4 | 2.7%), and Healthcare Support (2 | 1.3%).
Services Occupations by Sex
Within the Services occupations in Buckland, the most male-oriented occupations are Security & Protection (100.0%), Law Enforcement (100.0%), and Food Preparation & Serving (50.0%), while the most female-oriented occupations are Healthcare Support (100.0%), Cleaning & Maintenance (57.9%), and Food Preparation & Serving (50.0%).
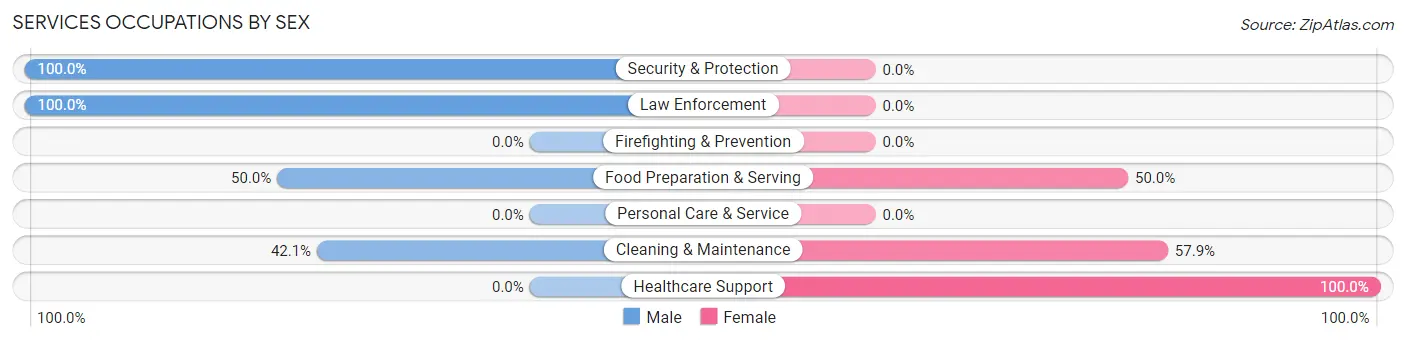
| Occupation | Male | Female |
| Healthcare Support | 0 (0.0%) | 2 (100.0%) |
| Security & Protection | 8 (100.0%) | 0 (0.0%) |
| Firefighting & Prevention | 0 (0.0%) | 0 (0.0%) |
| Law Enforcement | 8 (100.0%) | 0 (0.0%) |
| Food Preparation & Serving | 2 (50.0%) | 2 (50.0%) |
| Cleaning & Maintenance | 8 (42.1%) | 11 (57.9%) |
| Personal Care & Service | 0 (0.0%) | 0 (0.0%) |
| Total (Category) | 18 (54.5%) | 15 (45.5%) |
| Total (Overall) | 83 (56.1%) | 65 (43.9%) |
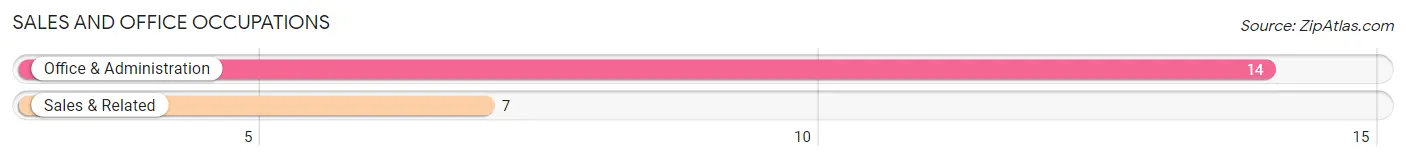
Sales and Office Occupations
The most common Sales and Office occupations in Buckland are Office & Administration (14 | 9.5%), and Sales & Related (7 | 4.7%).
Sales and Office Occupations by Sex
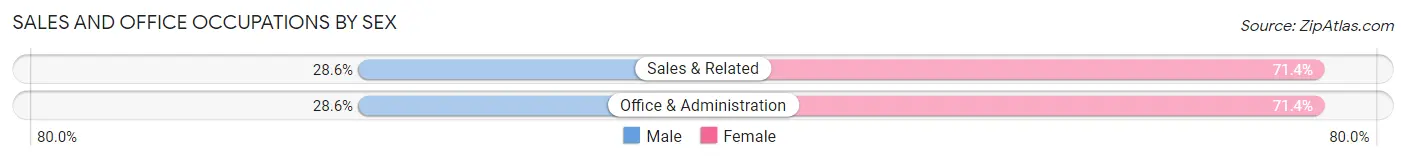
| Occupation | Male | Female |
| Sales & Related | 2 (28.6%) | 5 (71.4%) |
| Office & Administration | 4 (28.6%) | 10 (71.4%) |
| Total (Category) | 6 (28.6%) | 15 (71.4%) |
| Total (Overall) | 83 (56.1%) | 65 (43.9%) |
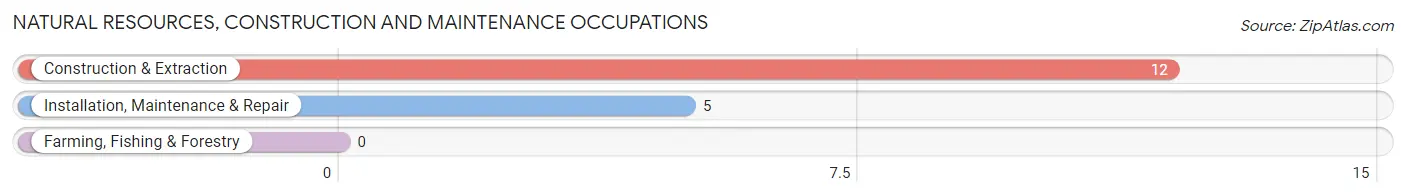
Natural Resources, Construction and Maintenance Occupations
The most common Natural Resources, Construction and Maintenance occupations in Buckland are Construction & Extraction (12 | 8.1%), and Installation, Maintenance & Repair (5 | 3.4%).
Natural Resources, Construction and Maintenance Occupations by Sex
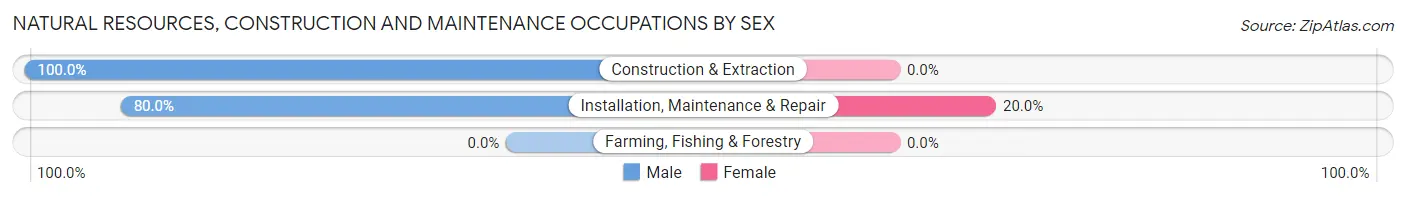
| Occupation | Male | Female |
| Farming, Fishing & Forestry | 0 (0.0%) | 0 (0.0%) |
| Construction & Extraction | 12 (100.0%) | 0 (0.0%) |
| Installation, Maintenance & Repair | 4 (80.0%) | 1 (20.0%) |
| Total (Category) | 16 (94.1%) | 1 (5.9%) |
| Total (Overall) | 83 (56.1%) | 65 (43.9%) |
Production, Transportation and Moving Occupations
The most common Production, Transportation and Moving occupations in Buckland are Transportation (9 | 6.1%), Production (8 | 5.4%), and Material Moving (8 | 5.4%).
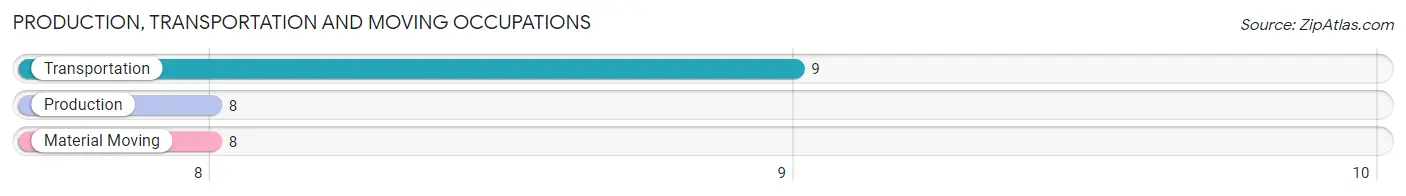
Production, Transportation and Moving Occupations by Sex
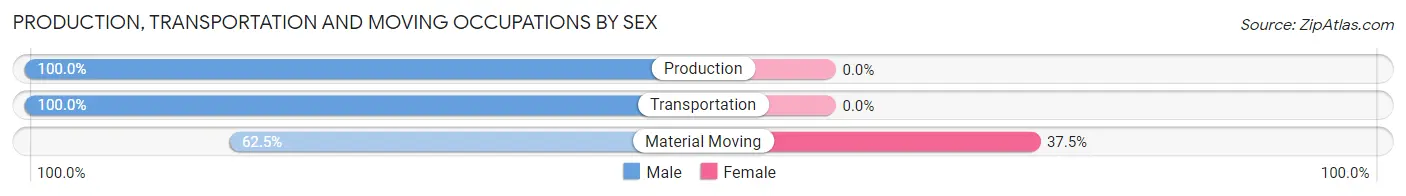
| Occupation | Male | Female |
| Production | 8 (100.0%) | 0 (0.0%) |
| Transportation | 9 (100.0%) | 0 (0.0%) |
| Material Moving | 5 (62.5%) | 3 (37.5%) |
| Total (Category) | 22 (88.0%) | 3 (12.0%) |
| Total (Overall) | 83 (56.1%) | 65 (43.9%) |
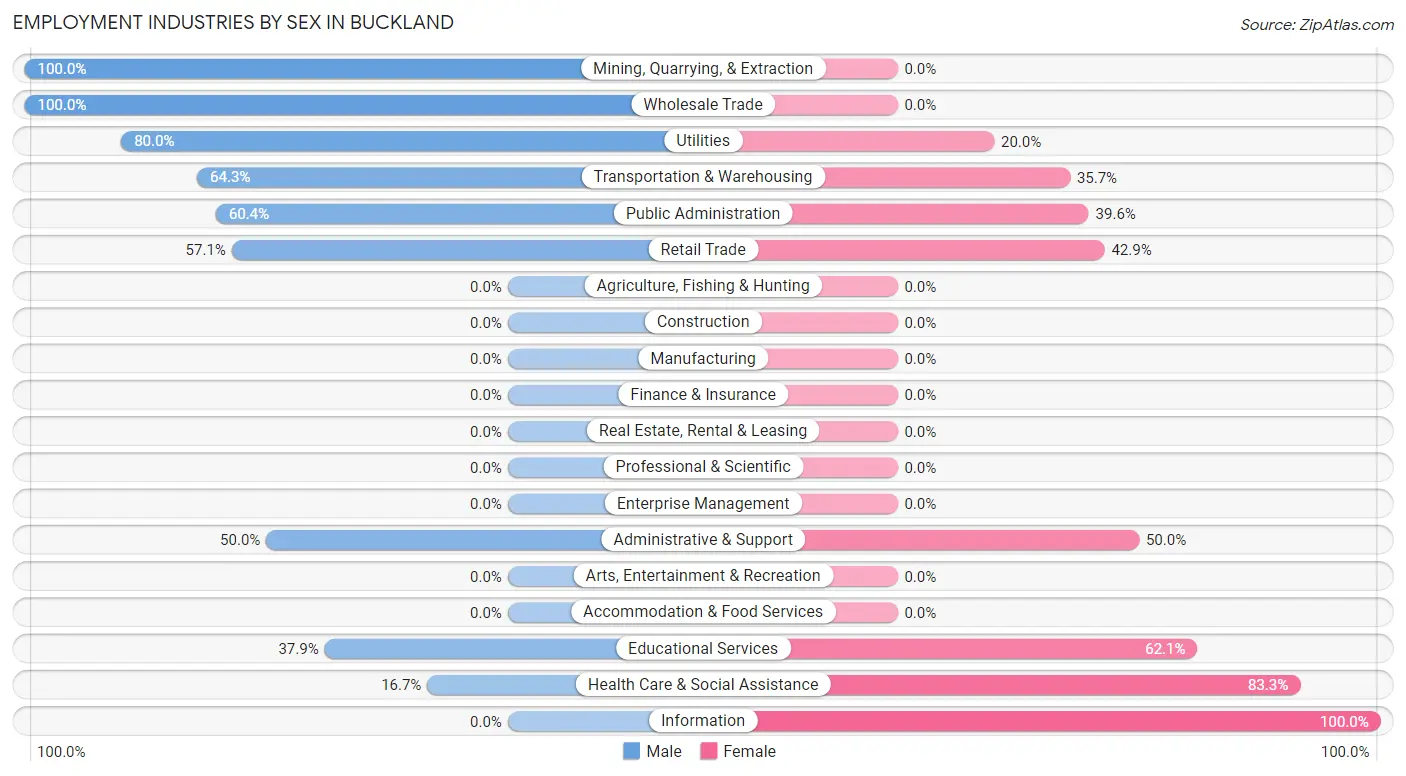
Employment Industries by Sex in Buckland
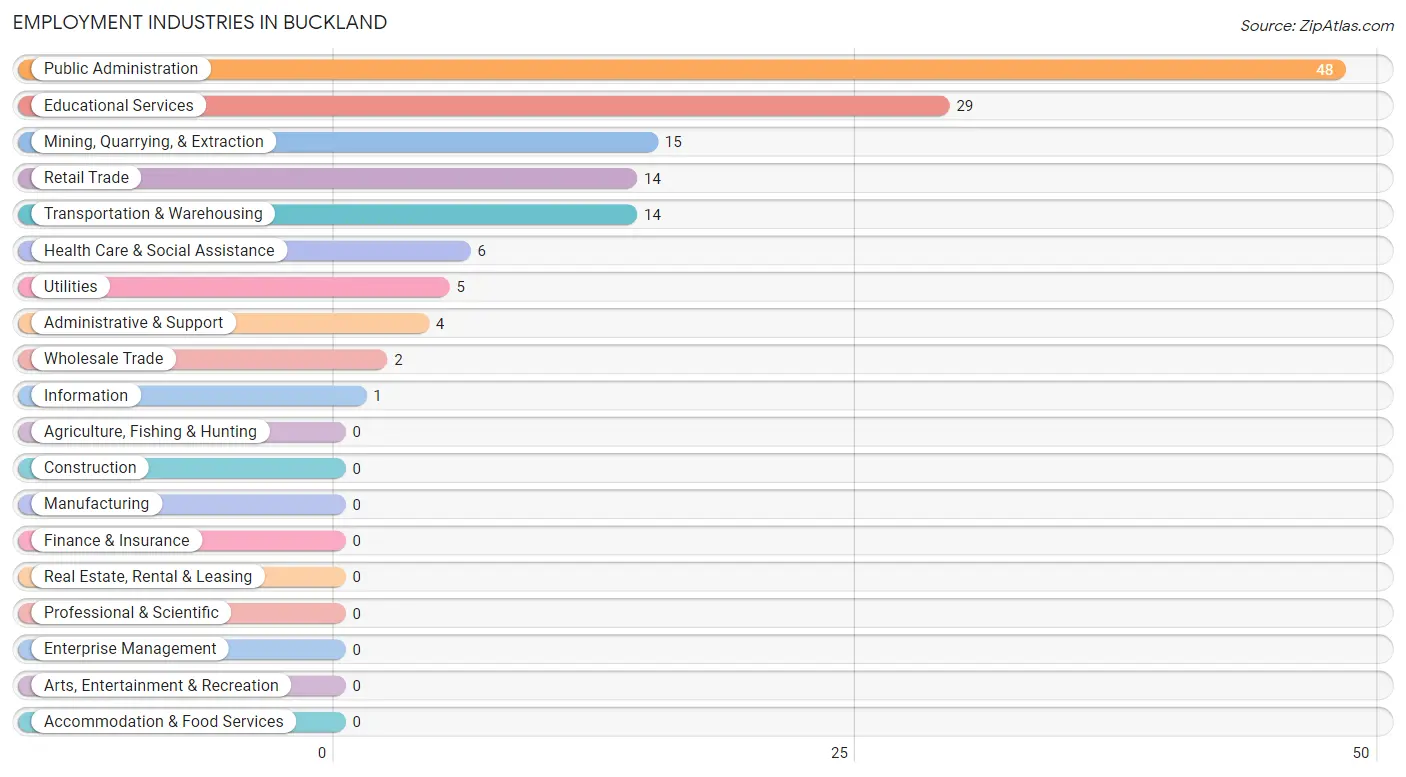
Employment Industries in Buckland
The major employment industries in Buckland include Public Administration (48 | 32.4%), Educational Services (29 | 19.6%), Mining, Quarrying, & Extraction (15 | 10.1%), Retail Trade (14 | 9.5%), and Transportation & Warehousing (14 | 9.5%).
Employment Industries by Sex in Buckland
The Buckland industries that see more men than women are Mining, Quarrying, & Extraction (100.0%), Wholesale Trade (100.0%), and Utilities (80.0%), whereas the industries that tend to have a higher number of women are Information (100.0%), Health Care & Social Assistance (83.3%), and Educational Services (62.1%).
| Industry | Male | Female |
| Agriculture, Fishing & Hunting | 0 (0.0%) | 0 (0.0%) |
| Mining, Quarrying, & Extraction | 15 (100.0%) | 0 (0.0%) |
| Construction | 0 (0.0%) | 0 (0.0%) |
| Manufacturing | 0 (0.0%) | 0 (0.0%) |
| Wholesale Trade | 2 (100.0%) | 0 (0.0%) |
| Retail Trade | 8 (57.1%) | 6 (42.9%) |
| Transportation & Warehousing | 9 (64.3%) | 5 (35.7%) |
| Utilities | 4 (80.0%) | 1 (20.0%) |
| Information | 0 (0.0%) | 1 (100.0%) |
| Finance & Insurance | 0 (0.0%) | 0 (0.0%) |
| Real Estate, Rental & Leasing | 0 (0.0%) | 0 (0.0%) |
| Professional & Scientific | 0 (0.0%) | 0 (0.0%) |
| Enterprise Management | 0 (0.0%) | 0 (0.0%) |
| Administrative & Support | 2 (50.0%) | 2 (50.0%) |
| Educational Services | 11 (37.9%) | 18 (62.1%) |
| Health Care & Social Assistance | 1 (16.7%) | 5 (83.3%) |
| Arts, Entertainment & Recreation | 0 (0.0%) | 0 (0.0%) |
| Accommodation & Food Services | 0 (0.0%) | 0 (0.0%) |
| Public Administration | 29 (60.4%) | 19 (39.6%) |
| Total | 83 (56.1%) | 65 (43.9%) |
Education in Buckland
School Enrollment in Buckland
The most common levels of schooling among the 203 students in Buckland are elementary school (60 | 29.6%), middle school (58 | 28.6%), and high school (56 | 27.6%).
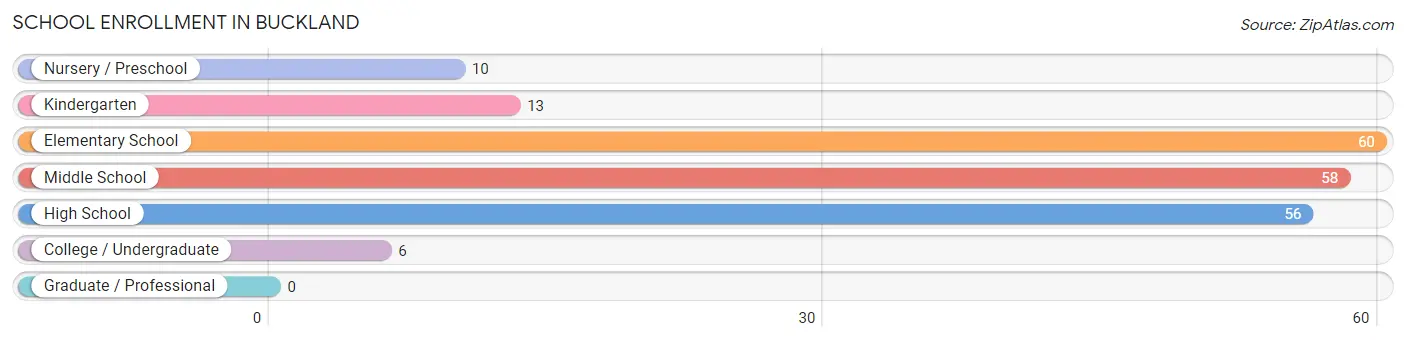
| School Level | # Students | % Students |
| Nursery / Preschool | 10 | 4.9% |
| Kindergarten | 13 | 6.4% |
| Elementary School | 60 | 29.6% |
| Middle School | 58 | 28.6% |
| High School | 56 | 27.6% |
| College / Undergraduate | 6 | 3.0% |
| Graduate / Professional | 0 | 0.0% |
| Total | 203 | 100.0% |
School Enrollment by Age by Funding Source in Buckland
Out of a total of 203 students who are enrolled in schools in Buckland, 2 (1.0%) attend a private institution, while the remaining 201 (99.0%) are enrolled in public schools. The age group of 15 to 17 year olds has the highest likelihood of being enrolled in private schools, with 2 (4.9% in the age bracket) enrolled. Conversely, the age group of 3 to 4 year olds has the lowest likelihood of being enrolled in a private school, with 5 (100.0% in the age bracket) attending a public institution.
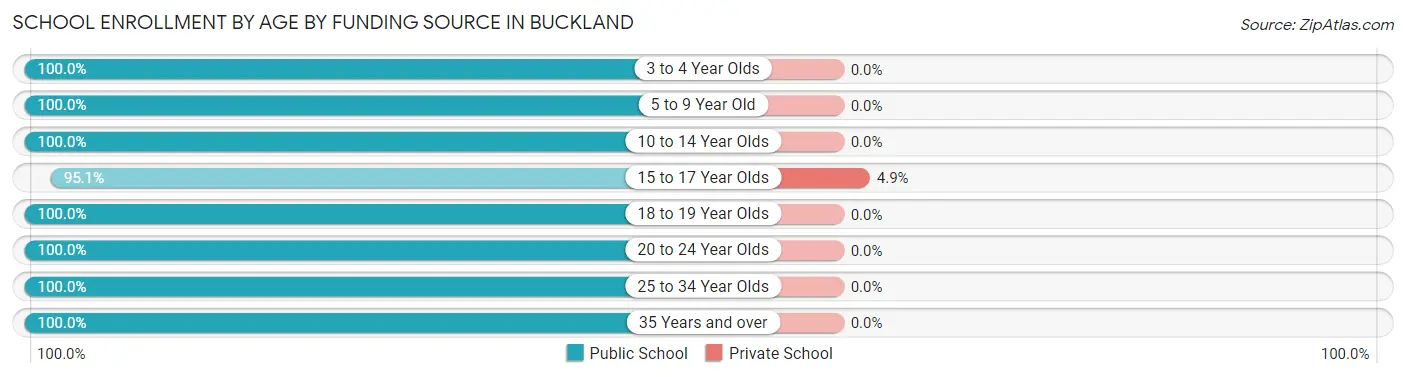
| Age Bracket | Public School | Private School |
| 3 to 4 Year Olds | 5 (100.0%) | 0 (0.0%) |
| 5 to 9 Year Old | 67 (100.0%) | 0 (0.0%) |
| 10 to 14 Year Olds | 71 (100.0%) | 0 (0.0%) |
| 15 to 17 Year Olds | 39 (95.1%) | 2 (4.9%) |
| 18 to 19 Year Olds | 11 (100.0%) | 0 (0.0%) |
| 20 to 24 Year Olds | 5 (100.0%) | 0 (0.0%) |
| 25 to 34 Year Olds | 1 (100.0%) | 0 (0.0%) |
| 35 Years and over | 2 (100.0%) | 0 (0.0%) |
| Total | 201 (99.0%) | 2 (1.0%) |
Educational Attainment by Field of Study in Buckland
Education (5 | 83.3%), and computers & mathematics (1 | 16.7%) are the most common fields of study among 6 individuals in Buckland who have obtained a bachelor's degree or higher.
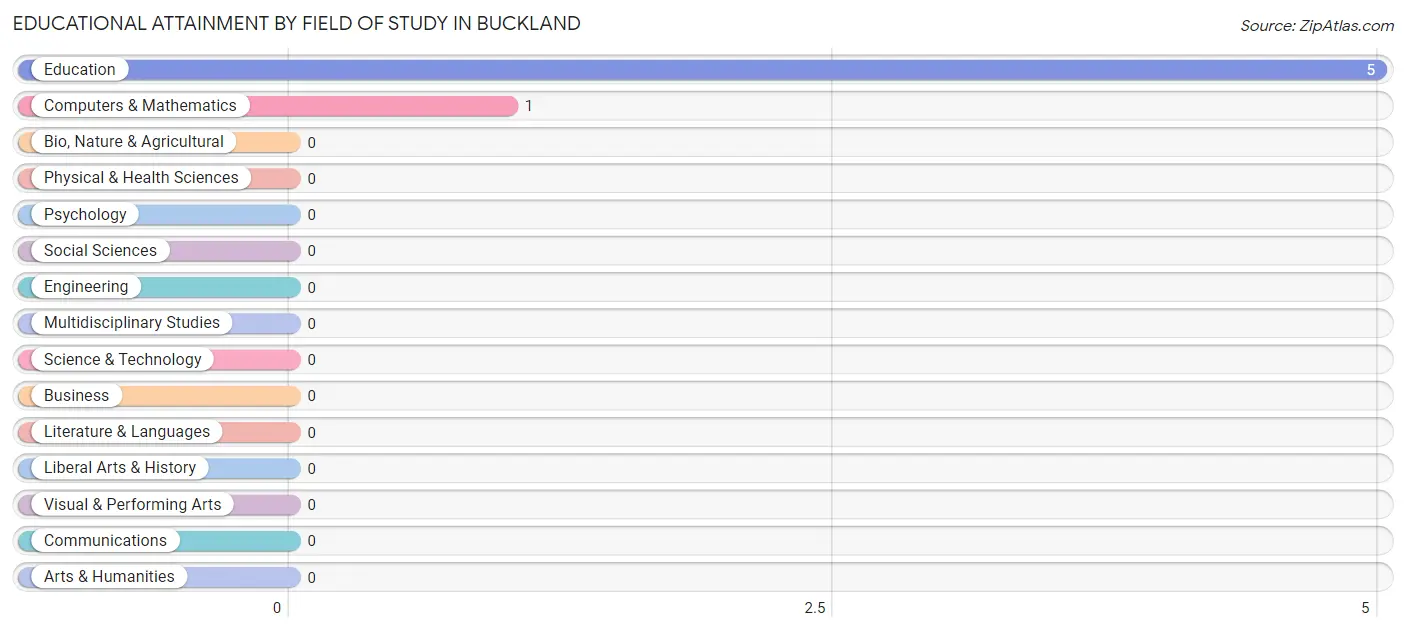
| Field of Study | # Graduates | % Graduates |
| Computers & Mathematics | 1 | 16.7% |
| Bio, Nature & Agricultural | 0 | 0.0% |
| Physical & Health Sciences | 0 | 0.0% |
| Psychology | 0 | 0.0% |
| Social Sciences | 0 | 0.0% |
| Engineering | 0 | 0.0% |
| Multidisciplinary Studies | 0 | 0.0% |
| Science & Technology | 0 | 0.0% |
| Business | 0 | 0.0% |
| Education | 5 | 83.3% |
| Literature & Languages | 0 | 0.0% |
| Liberal Arts & History | 0 | 0.0% |
| Visual & Performing Arts | 0 | 0.0% |
| Communications | 0 | 0.0% |
| Arts & Humanities | 0 | 0.0% |
| Total | 6 | 100.0% |
Transportation & Commute in Buckland
Vehicle Availability by Sex in Buckland
The most prevalent vehicle ownership categories in Buckland are males with no vehicle (54, accounting for 71.1%) and females with no vehicle (42, making up 87.1%).
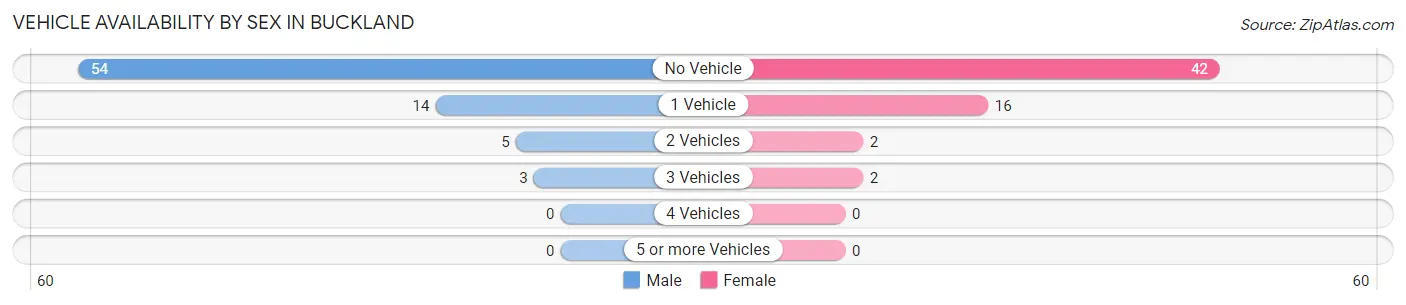
| Vehicles Available | Male | Female |
| No Vehicle | 54 (71.1%) | 42 (67.7%) |
| 1 Vehicle | 14 (18.4%) | 16 (25.8%) |
| 2 Vehicles | 5 (6.6%) | 2 (3.2%) |
| 3 Vehicles | 3 (4.0%) | 2 (3.2%) |
| 4 Vehicles | 0 (0.0%) | 0 (0.0%) |
| 5 or more Vehicles | 0 (0.0%) | 0 (0.0%) |
| Total | 76 (100.0%) | 62 (100.0%) |
Commute Time in Buckland
The most frequently occuring commute durations in Buckland are 5 to 9 minutes (65 commuters, 52.0%), less than 5 minutes (53 commuters, 42.4%), and 90 or more minutes (3 commuters, 2.4%).
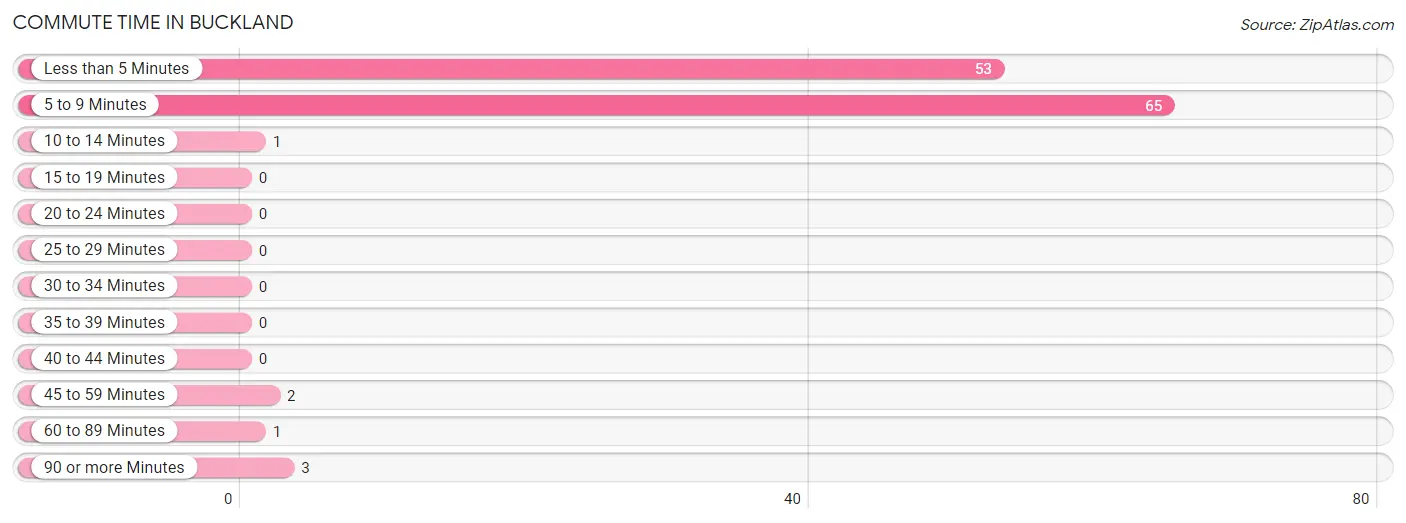
| Commute Time | # Commuters | % Commuters |
| Less than 5 Minutes | 53 | 42.4% |
| 5 to 9 Minutes | 65 | 52.0% |
| 10 to 14 Minutes | 1 | 0.8% |
| 15 to 19 Minutes | 0 | 0.0% |
| 20 to 24 Minutes | 0 | 0.0% |
| 25 to 29 Minutes | 0 | 0.0% |
| 30 to 34 Minutes | 0 | 0.0% |
| 35 to 39 Minutes | 0 | 0.0% |
| 40 to 44 Minutes | 0 | 0.0% |
| 45 to 59 Minutes | 2 | 1.6% |
| 60 to 89 Minutes | 1 | 0.8% |
| 90 or more Minutes | 3 | 2.4% |
Commute Time by Sex in Buckland
The most common commute times in Buckland are less than 5 minutes (34 commuters, 50.7%) for males and 5 to 9 minutes (37 commuters, 63.8%) for females.
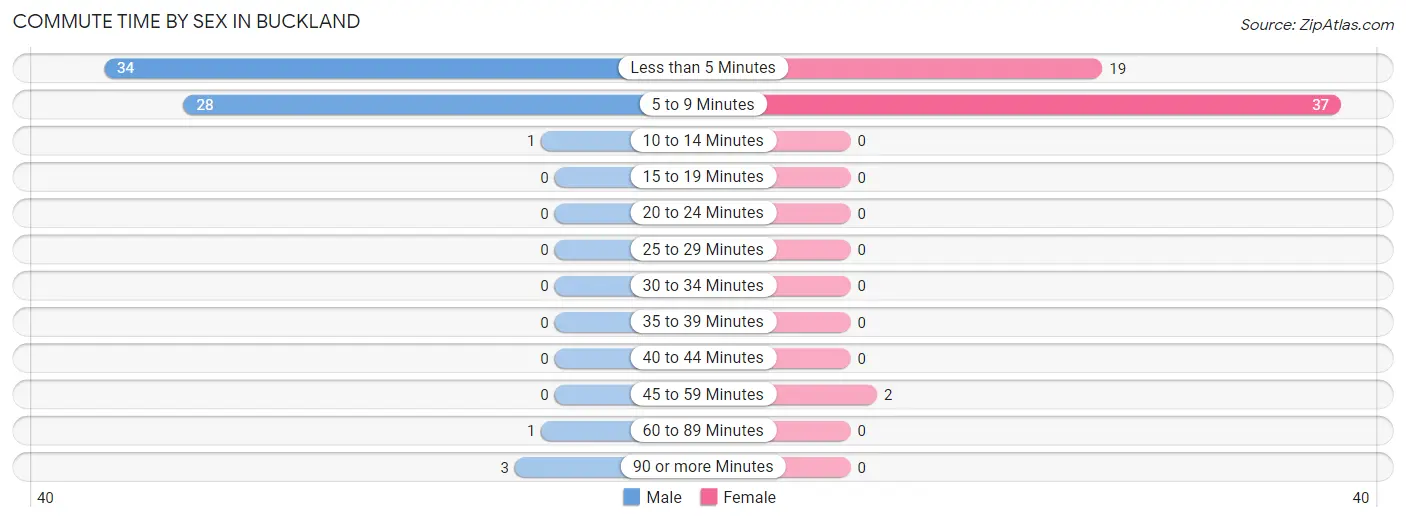
| Commute Time | Male | Female |
| Less than 5 Minutes | 34 (50.7%) | 19 (32.8%) |
| 5 to 9 Minutes | 28 (41.8%) | 37 (63.8%) |
| 10 to 14 Minutes | 1 (1.5%) | 0 (0.0%) |
| 15 to 19 Minutes | 0 (0.0%) | 0 (0.0%) |
| 20 to 24 Minutes | 0 (0.0%) | 0 (0.0%) |
| 25 to 29 Minutes | 0 (0.0%) | 0 (0.0%) |
| 30 to 34 Minutes | 0 (0.0%) | 0 (0.0%) |
| 35 to 39 Minutes | 0 (0.0%) | 0 (0.0%) |
| 40 to 44 Minutes | 0 (0.0%) | 0 (0.0%) |
| 45 to 59 Minutes | 0 (0.0%) | 2 (3.5%) |
| 60 to 89 Minutes | 1 (1.5%) | 0 (0.0%) |
| 90 or more Minutes | 3 (4.5%) | 0 (0.0%) |
Time of Departure to Work by Sex in Buckland
The most frequent times of departure to work in Buckland are 8:00 AM to 8:29 AM (17, 25.4%) for males and 7:30 AM to 7:59 AM (21, 36.2%) for females.
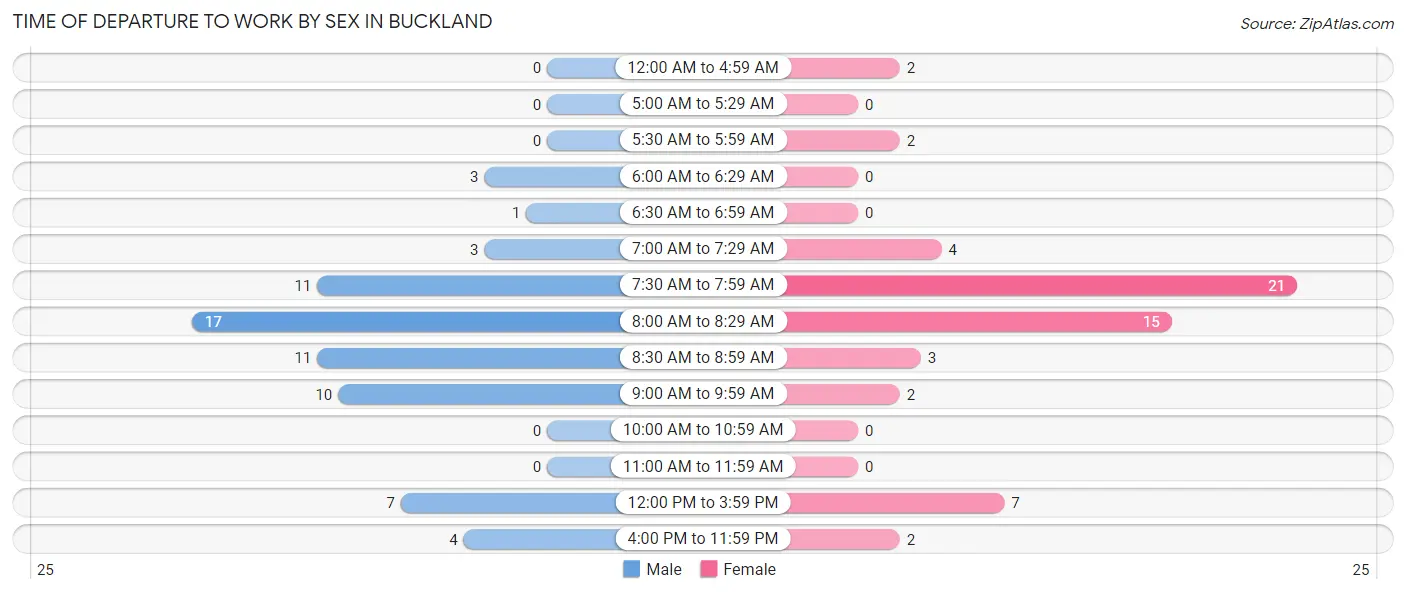
| Time of Departure | Male | Female |
| 12:00 AM to 4:59 AM | 0 (0.0%) | 2 (3.5%) |
| 5:00 AM to 5:29 AM | 0 (0.0%) | 0 (0.0%) |
| 5:30 AM to 5:59 AM | 0 (0.0%) | 2 (3.5%) |
| 6:00 AM to 6:29 AM | 3 (4.5%) | 0 (0.0%) |
| 6:30 AM to 6:59 AM | 1 (1.5%) | 0 (0.0%) |
| 7:00 AM to 7:29 AM | 3 (4.5%) | 4 (6.9%) |
| 7:30 AM to 7:59 AM | 11 (16.4%) | 21 (36.2%) |
| 8:00 AM to 8:29 AM | 17 (25.4%) | 15 (25.9%) |
| 8:30 AM to 8:59 AM | 11 (16.4%) | 3 (5.2%) |
| 9:00 AM to 9:59 AM | 10 (14.9%) | 2 (3.5%) |
| 10:00 AM to 10:59 AM | 0 (0.0%) | 0 (0.0%) |
| 11:00 AM to 11:59 AM | 0 (0.0%) | 0 (0.0%) |
| 12:00 PM to 3:59 PM | 7 (10.4%) | 7 (12.1%) |
| 4:00 PM to 11:59 PM | 4 (6.0%) | 2 (3.5%) |
| Total | 67 (100.0%) | 58 (100.0%) |
Housing Occupancy in Buckland
Occupancy by Ownership in Buckland
Of the total 133 dwellings in Buckland, owner-occupied units account for 110 (82.7%), while renter-occupied units make up 23 (17.3%).
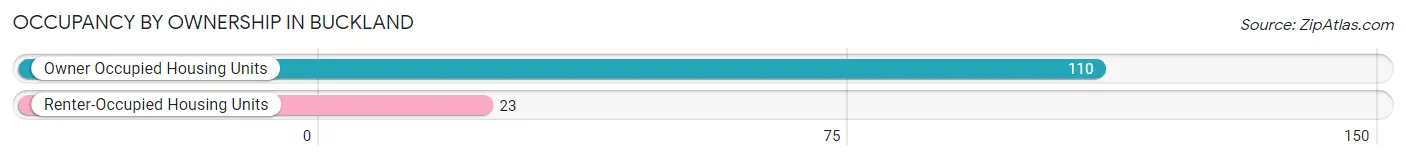
| Occupancy | # Housing Units | % Housing Units |
| Owner Occupied Housing Units | 110 | 82.7% |
| Renter-Occupied Housing Units | 23 | 17.3% |
| Total Occupied Housing Units | 133 | 100.0% |
Occupancy by Household Size in Buckland
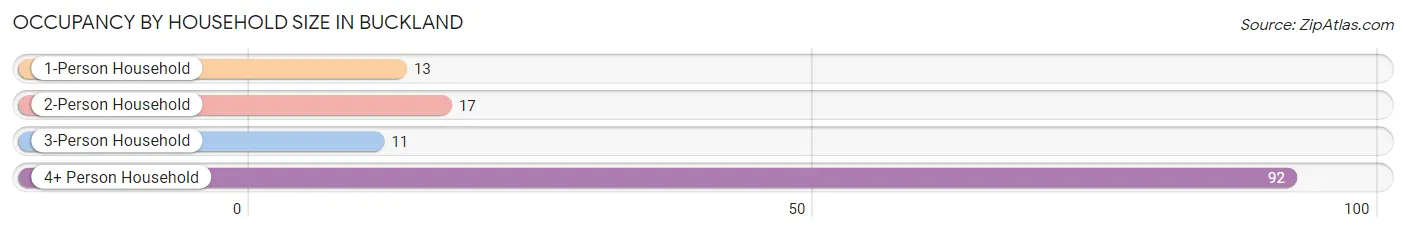
| Household Size | # Housing Units | % Housing Units |
| 1-Person Household | 13 | 9.8% |
| 2-Person Household | 17 | 12.8% |
| 3-Person Household | 11 | 8.3% |
| 4+ Person Household | 92 | 69.2% |
| Total Housing Units | 133 | 100.0% |
Occupancy by Ownership by Household Size in Buckland
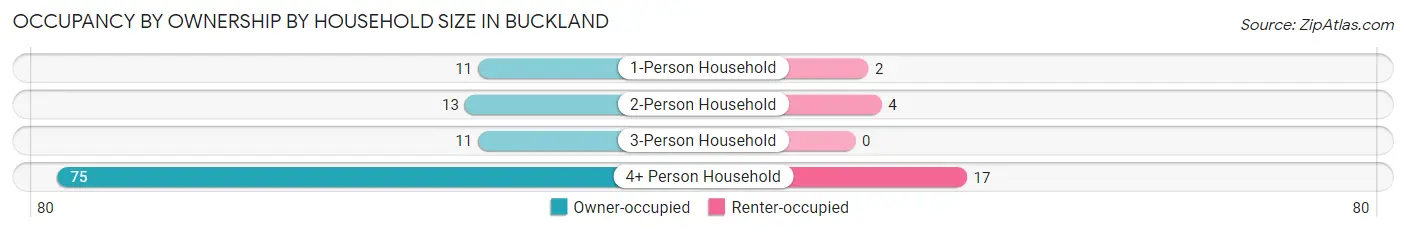
| Household Size | Owner-occupied | Renter-occupied |
| 1-Person Household | 11 (84.6%) | 2 (15.4%) |
| 2-Person Household | 13 (76.5%) | 4 (23.5%) |
| 3-Person Household | 11 (100.0%) | 0 (0.0%) |
| 4+ Person Household | 75 (81.5%) | 17 (18.5%) |
| Total Housing Units | 110 (82.7%) | 23 (17.3%) |
Occupancy by Educational Attainment in Buckland
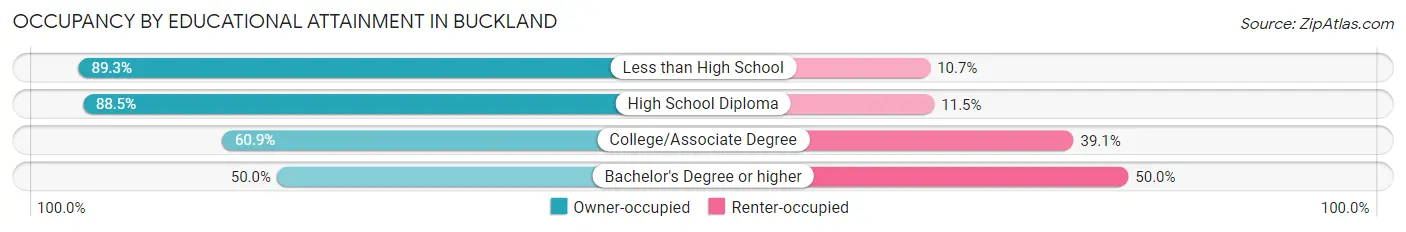
| Household Size | Owner-occupied | Renter-occupied |
| Less than High School | 25 (89.3%) | 3 (10.7%) |
| High School Diploma | 69 (88.5%) | 9 (11.5%) |
| College/Associate Degree | 14 (60.9%) | 9 (39.1%) |
| Bachelor's Degree or higher | 2 (50.0%) | 2 (50.0%) |
Occupancy by Age of Householder in Buckland
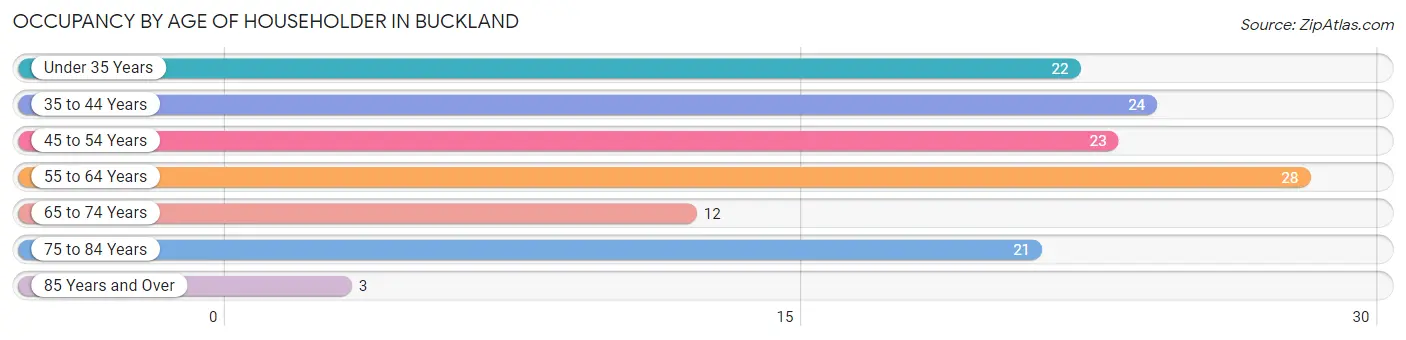
| Age Bracket | # Households | % Households |
| Under 35 Years | 22 | 16.5% |
| 35 to 44 Years | 24 | 18.0% |
| 45 to 54 Years | 23 | 17.3% |
| 55 to 64 Years | 28 | 21.0% |
| 65 to 74 Years | 12 | 9.0% |
| 75 to 84 Years | 21 | 15.8% |
| 85 Years and Over | 3 | 2.3% |
| Total | 133 | 100.0% |
Housing Finances in Buckland
Median Income by Occupancy in Buckland
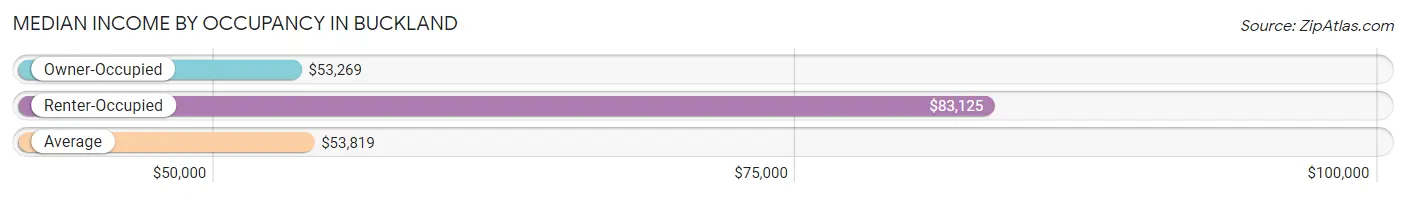
| Occupancy Type | # Households | Median Income |
| Owner-Occupied | 110 (82.7%) | $53,269 |
| Renter-Occupied | 23 (17.3%) | $83,125 |
| Average | 133 (100.0%) | $53,819 |
Occupancy by Householder Income Bracket in Buckland
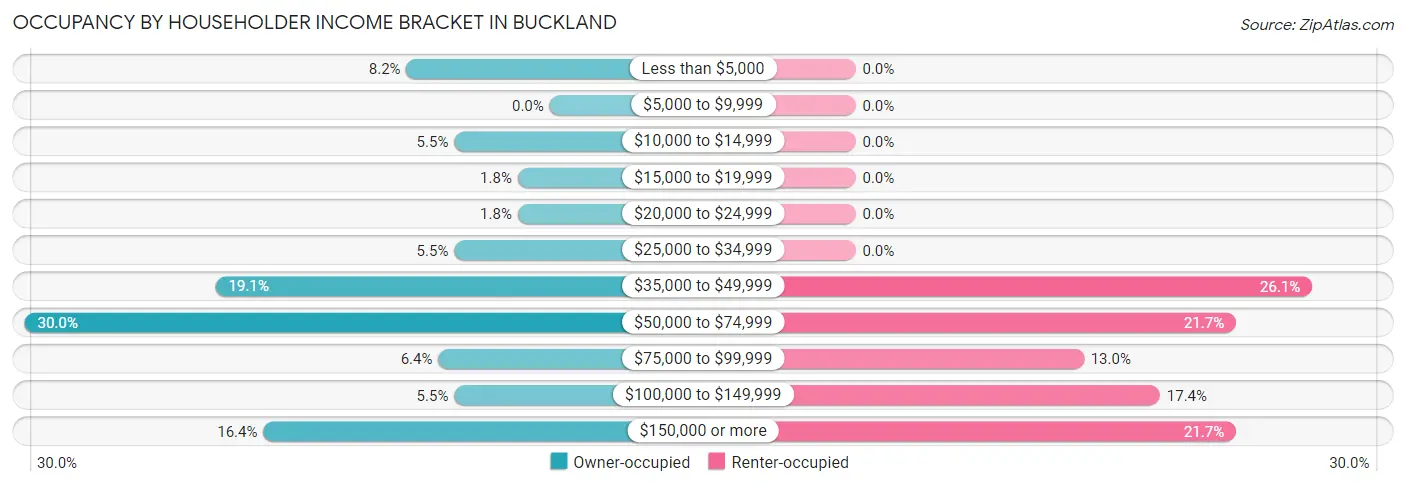
| Income Bracket | Owner-occupied | Renter-occupied |
| Less than $5,000 | 9 (8.2%) | 0 (0.0%) |
| $5,000 to $9,999 | 0 (0.0%) | 0 (0.0%) |
| $10,000 to $14,999 | 6 (5.4%) | 0 (0.0%) |
| $15,000 to $19,999 | 2 (1.8%) | 0 (0.0%) |
| $20,000 to $24,999 | 2 (1.8%) | 0 (0.0%) |
| $25,000 to $34,999 | 6 (5.4%) | 0 (0.0%) |
| $35,000 to $49,999 | 21 (19.1%) | 6 (26.1%) |
| $50,000 to $74,999 | 33 (30.0%) | 5 (21.7%) |
| $75,000 to $99,999 | 7 (6.4%) | 3 (13.0%) |
| $100,000 to $149,999 | 6 (5.4%) | 4 (17.4%) |
| $150,000 or more | 18 (16.4%) | 5 (21.7%) |
| Total | 110 (100.0%) | 23 (100.0%) |
Monthly Housing Cost Tiers in Buckland
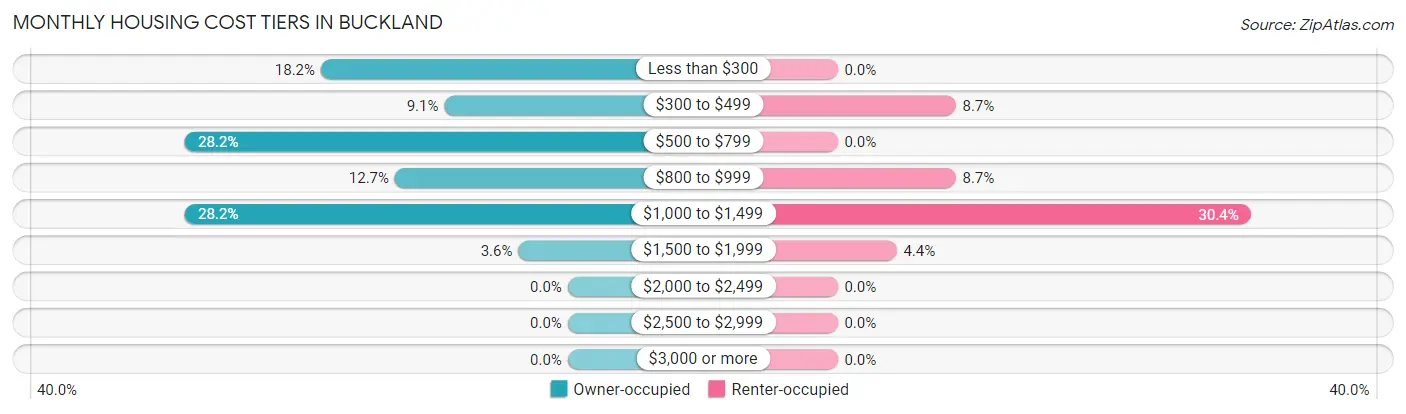
| Monthly Cost | Owner-occupied | Renter-occupied |
| Less than $300 | 20 (18.2%) | 0 (0.0%) |
| $300 to $499 | 10 (9.1%) | 2 (8.7%) |
| $500 to $799 | 31 (28.2%) | 0 (0.0%) |
| $800 to $999 | 14 (12.7%) | 2 (8.7%) |
| $1,000 to $1,499 | 31 (28.2%) | 7 (30.4%) |
| $1,500 to $1,999 | 4 (3.6%) | 1 (4.3%) |
| $2,000 to $2,499 | 0 (0.0%) | 0 (0.0%) |
| $2,500 to $2,999 | 0 (0.0%) | 0 (0.0%) |
| $3,000 or more | 0 (0.0%) | 0 (0.0%) |
| Total | 110 (100.0%) | 23 (100.0%) |
Physical Housing Characteristics in Buckland
Housing Structures in Buckland
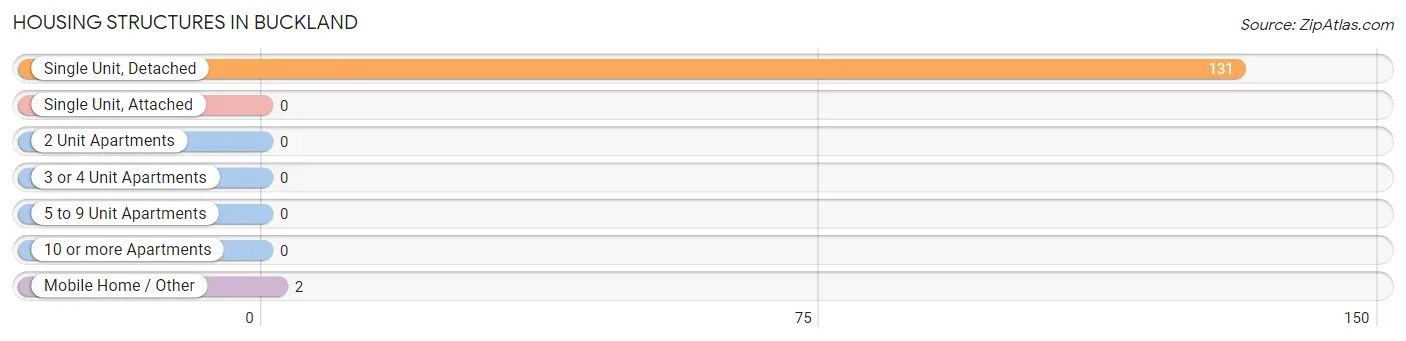
| Structure Type | # Housing Units | % Housing Units |
| Single Unit, Detached | 131 | 98.5% |
| Single Unit, Attached | 0 | 0.0% |
| 2 Unit Apartments | 0 | 0.0% |
| 3 or 4 Unit Apartments | 0 | 0.0% |
| 5 to 9 Unit Apartments | 0 | 0.0% |
| 10 or more Apartments | 0 | 0.0% |
| Mobile Home / Other | 2 | 1.5% |
| Total | 133 | 100.0% |
Housing Structures by Occupancy in Buckland
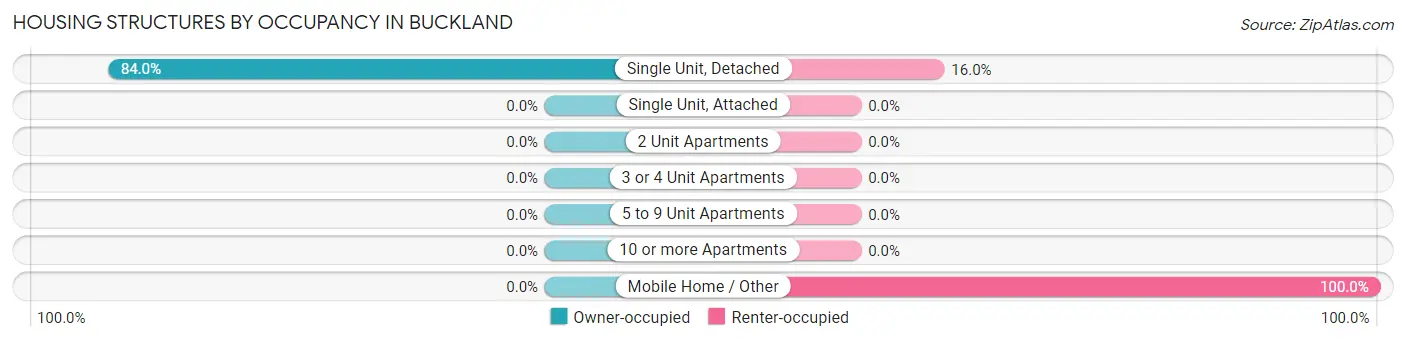
| Structure Type | Owner-occupied | Renter-occupied |
| Single Unit, Detached | 110 (84.0%) | 21 (16.0%) |
| Single Unit, Attached | 0 (0.0%) | 0 (0.0%) |
| 2 Unit Apartments | 0 (0.0%) | 0 (0.0%) |
| 3 or 4 Unit Apartments | 0 (0.0%) | 0 (0.0%) |
| 5 to 9 Unit Apartments | 0 (0.0%) | 0 (0.0%) |
| 10 or more Apartments | 0 (0.0%) | 0 (0.0%) |
| Mobile Home / Other | 0 (0.0%) | 2 (100.0%) |
| Total | 110 (82.7%) | 23 (17.3%) |
Housing Structures by Number of Rooms in Buckland
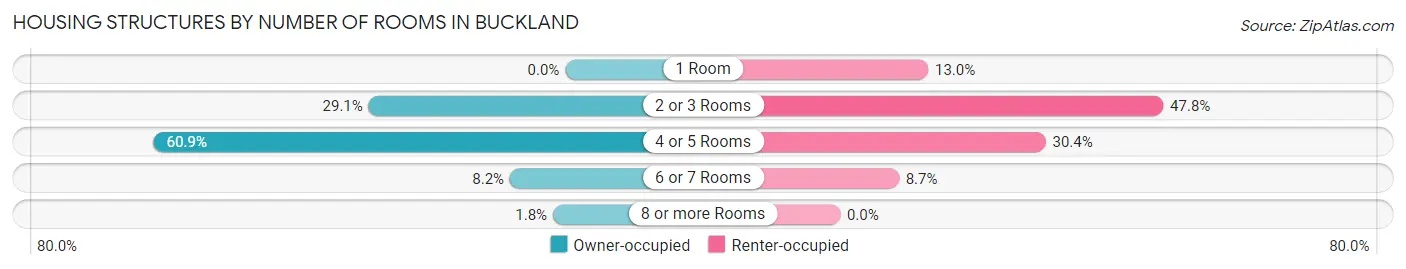
| Number of Rooms | Owner-occupied | Renter-occupied |
| 1 Room | 0 (0.0%) | 3 (13.0%) |
| 2 or 3 Rooms | 32 (29.1%) | 11 (47.8%) |
| 4 or 5 Rooms | 67 (60.9%) | 7 (30.4%) |
| 6 or 7 Rooms | 9 (8.2%) | 2 (8.7%) |
| 8 or more Rooms | 2 (1.8%) | 0 (0.0%) |
| Total | 110 (100.0%) | 23 (100.0%) |
Housing Structure by Heating Type in Buckland
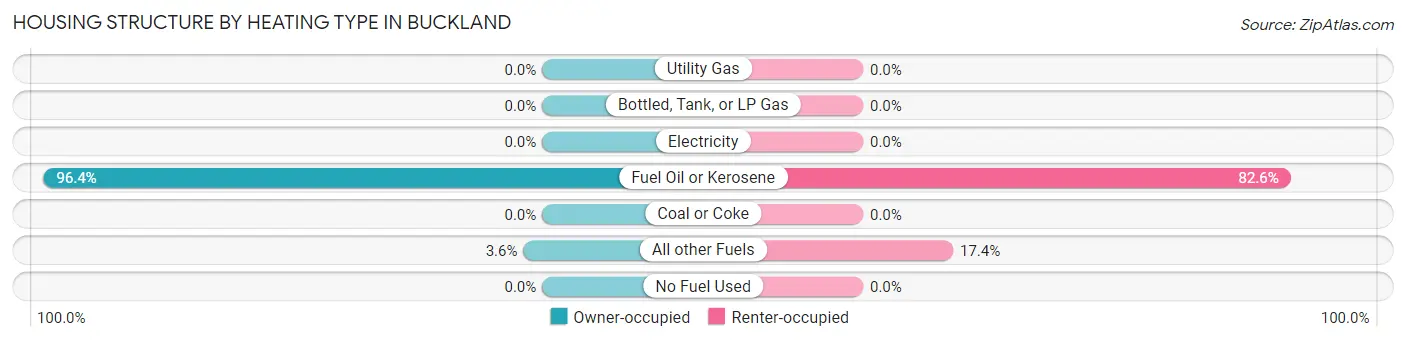
| Heating Type | Owner-occupied | Renter-occupied |
| Utility Gas | 0 (0.0%) | 0 (0.0%) |
| Bottled, Tank, or LP Gas | 0 (0.0%) | 0 (0.0%) |
| Electricity | 0 (0.0%) | 0 (0.0%) |
| Fuel Oil or Kerosene | 106 (96.4%) | 19 (82.6%) |
| Coal or Coke | 0 (0.0%) | 0 (0.0%) |
| All other Fuels | 4 (3.6%) | 4 (17.4%) |
| No Fuel Used | 0 (0.0%) | 0 (0.0%) |
| Total | 110 (100.0%) | 23 (100.0%) |
Household Vehicle Usage in Buckland
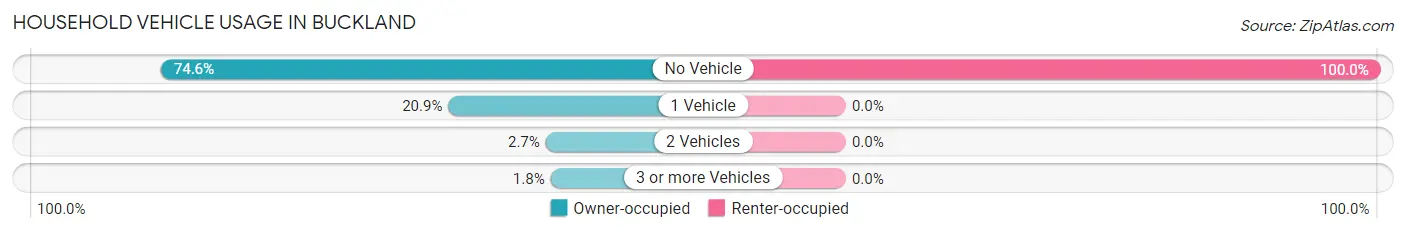
| Vehicles per Household | Owner-occupied | Renter-occupied |
| No Vehicle | 82 (74.6%) | 23 (100.0%) |
| 1 Vehicle | 23 (20.9%) | 0 (0.0%) |
| 2 Vehicles | 3 (2.7%) | 0 (0.0%) |
| 3 or more Vehicles | 2 (1.8%) | 0 (0.0%) |
| Total | 110 (100.0%) | 23 (100.0%) |
Real Estate & Mortgages in Buckland
Real Estate and Mortgage Overview in Buckland
| Characteristic | Without Mortgage | With Mortgage |
| Housing Units | 95 | 15 |
| Median Property Value | $73,900 | $0 |
| Median Household Income | $52,981 | $2 |
| Monthly Housing Costs | $747 | $0 |
| Real Estate Taxes | - | - |
Property Value by Mortgage Status in Buckland
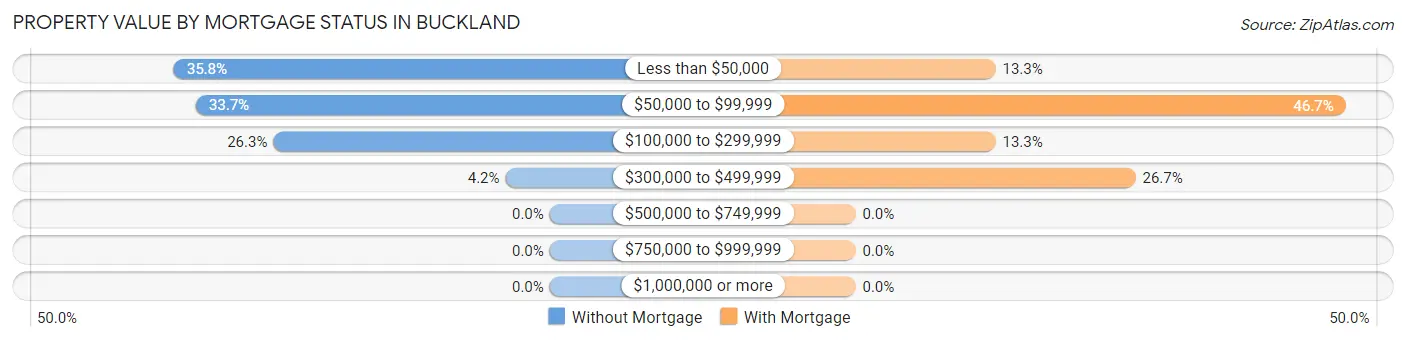
| Property Value | Without Mortgage | With Mortgage |
| Less than $50,000 | 34 (35.8%) | 2 (13.3%) |
| $50,000 to $99,999 | 32 (33.7%) | 7 (46.7%) |
| $100,000 to $299,999 | 25 (26.3%) | 2 (13.3%) |
| $300,000 to $499,999 | 4 (4.2%) | 4 (26.7%) |
| $500,000 to $749,999 | 0 (0.0%) | 0 (0.0%) |
| $750,000 to $999,999 | 0 (0.0%) | 0 (0.0%) |
| $1,000,000 or more | 0 (0.0%) | 0 (0.0%) |
| Total | 95 (100.0%) | 15 (100.0%) |
Household Income by Mortgage Status in Buckland
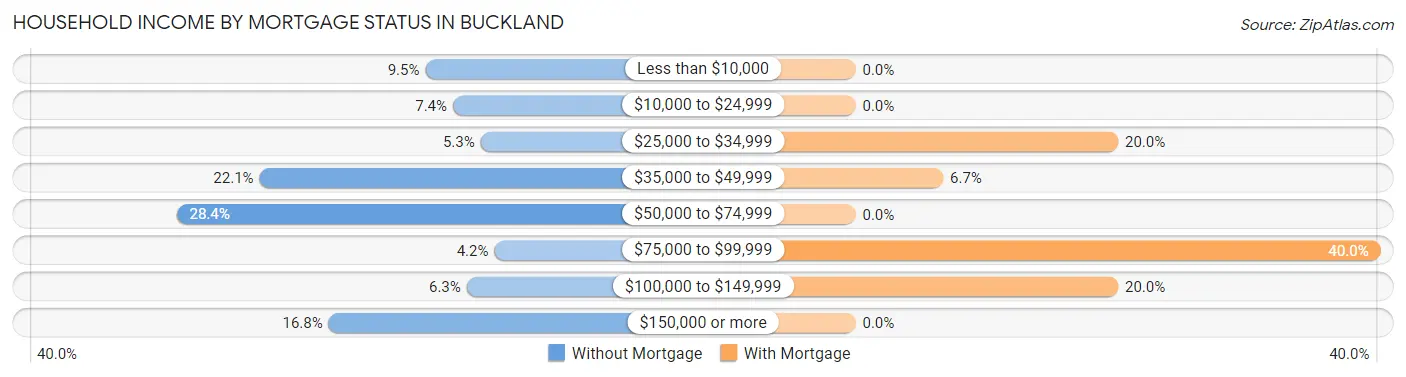
| Household Income | Without Mortgage | With Mortgage |
| Less than $10,000 | 9 (9.5%) | 0 (0.0%) |
| $10,000 to $24,999 | 7 (7.4%) | 0 (0.0%) |
| $25,000 to $34,999 | 5 (5.3%) | 3 (20.0%) |
| $35,000 to $49,999 | 21 (22.1%) | 1 (6.7%) |
| $50,000 to $74,999 | 27 (28.4%) | 0 (0.0%) |
| $75,000 to $99,999 | 4 (4.2%) | 6 (40.0%) |
| $100,000 to $149,999 | 6 (6.3%) | 3 (20.0%) |
| $150,000 or more | 16 (16.8%) | 0 (0.0%) |
| Total | 95 (100.0%) | 15 (100.0%) |
Property Value to Household Income Ratio in Buckland
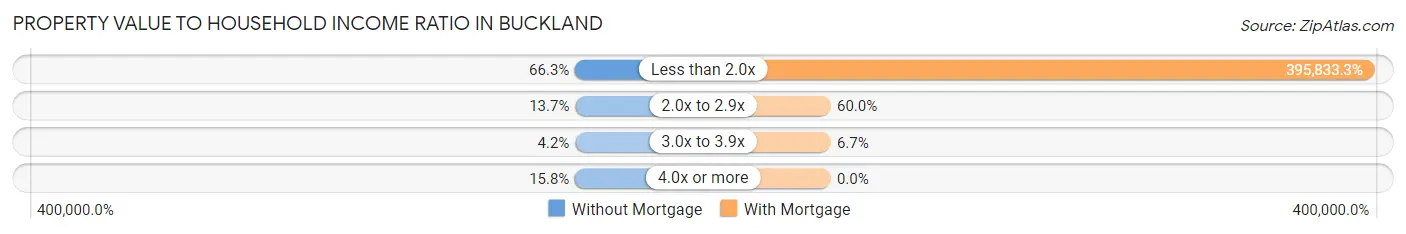
| Value-to-Income Ratio | Without Mortgage | With Mortgage |
| Less than 2.0x | 63 (66.3%) | 59,375 (395,833.3%) |
| 2.0x to 2.9x | 13 (13.7%) | 9 (60.0%) |
| 3.0x to 3.9x | 4 (4.2%) | 1 (6.7%) |
| 4.0x or more | 15 (15.8%) | 0 (0.0%) |
| Total | 95 (100.0%) | 15 (100.0%) |
Real Estate Taxes by Mortgage Status in Buckland
| Property Taxes | Without Mortgage | With Mortgage |
| Less than $800 | 0 (0.0%) | 0 (0.0%) |
| $800 to $1,499 | 0 (0.0%) | 0 (0.0%) |
| $800 to $1,499 | 0 (0.0%) | 0 (0.0%) |
| Total | 95 (100.0%) | 15 (100.0%) |
Health & Disability in Buckland
Health Insurance Coverage by Age in Buckland
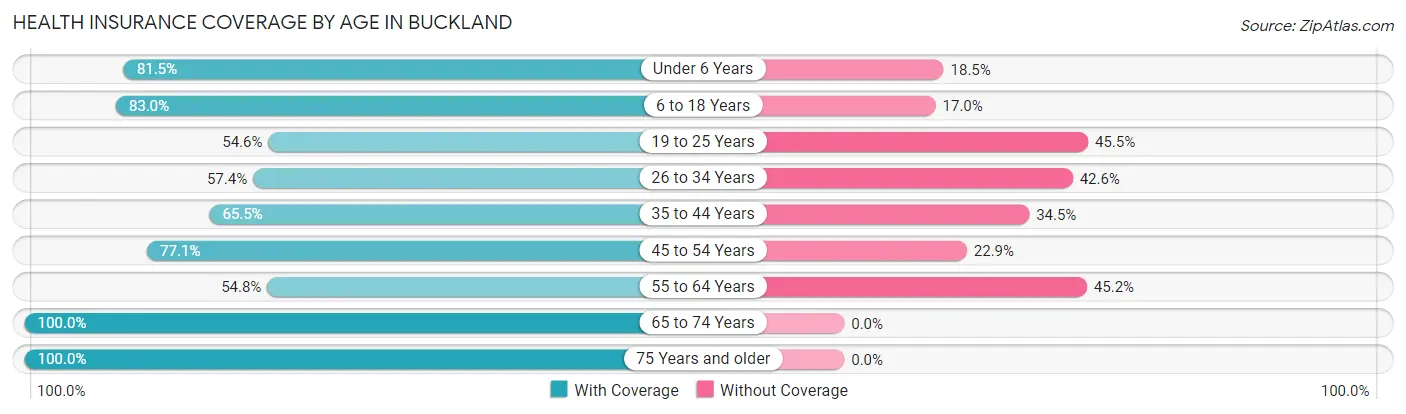
| Age Bracket | With Coverage | Without Coverage |
| Under 6 Years | 88 (81.5%) | 20 (18.5%) |
| 6 to 18 Years | 151 (83.0%) | 31 (17.0%) |
| 19 to 25 Years | 36 (54.5%) | 30 (45.5%) |
| 26 to 34 Years | 62 (57.4%) | 46 (42.6%) |
| 35 to 44 Years | 38 (65.5%) | 20 (34.5%) |
| 45 to 54 Years | 27 (77.1%) | 8 (22.9%) |
| 55 to 64 Years | 23 (54.8%) | 19 (45.2%) |
| 65 to 74 Years | 17 (100.0%) | 0 (0.0%) |
| 75 Years and older | 28 (100.0%) | 0 (0.0%) |
| Total | 470 (73.0%) | 174 (27.0%) |
Health Insurance Coverage by Citizenship Status in Buckland
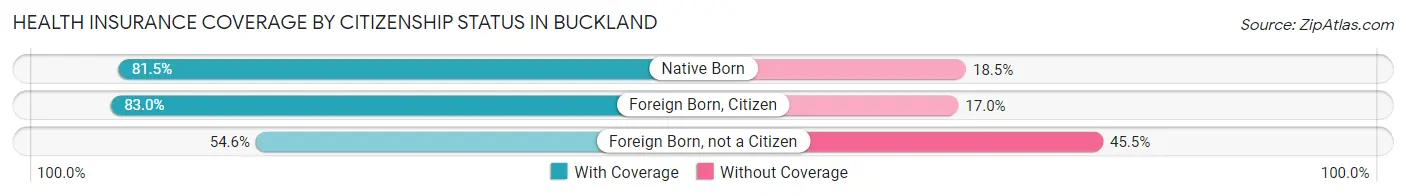
| Citizenship Status | With Coverage | Without Coverage |
| Native Born | 88 (81.5%) | 20 (18.5%) |
| Foreign Born, Citizen | 151 (83.0%) | 31 (17.0%) |
| Foreign Born, not a Citizen | 36 (54.5%) | 30 (45.5%) |
Health Insurance Coverage by Household Income in Buckland
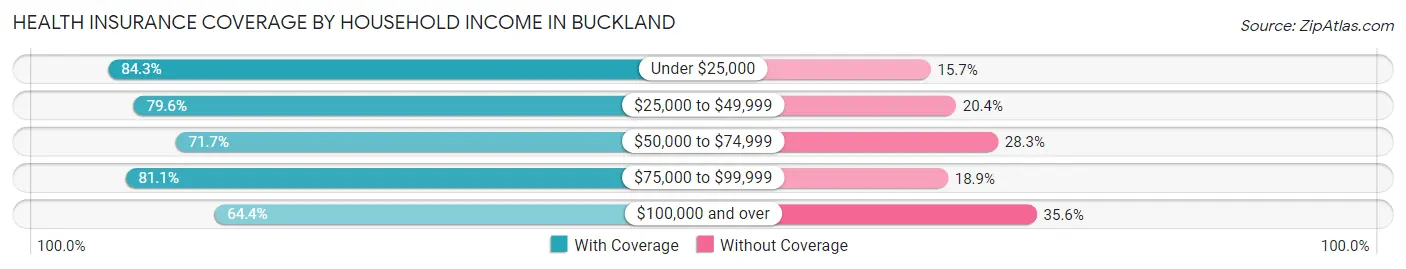
| Household Income | With Coverage | Without Coverage |
| Under $25,000 | 43 (84.3%) | 8 (15.7%) |
| $25,000 to $49,999 | 113 (79.6%) | 29 (20.4%) |
| $50,000 to $74,999 | 109 (71.7%) | 43 (28.3%) |
| $75,000 to $99,999 | 60 (81.1%) | 14 (18.9%) |
| $100,000 and over | 145 (64.4%) | 80 (35.6%) |
Public vs Private Health Insurance Coverage by Age in Buckland
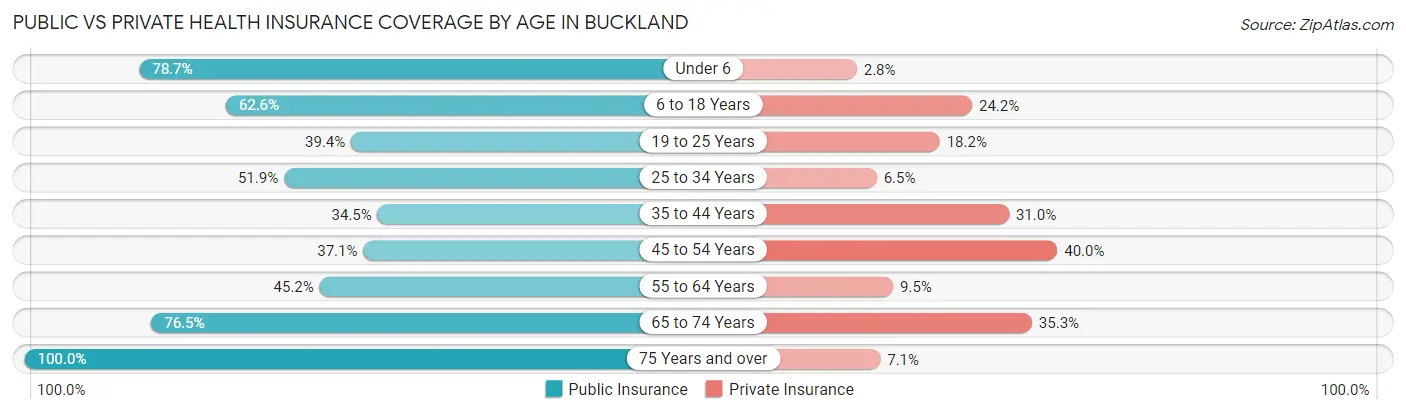
| Age Bracket | Public Insurance | Private Insurance |
| Under 6 | 85 (78.7%) | 3 (2.8%) |
| 6 to 18 Years | 114 (62.6%) | 44 (24.2%) |
| 19 to 25 Years | 26 (39.4%) | 12 (18.2%) |
| 25 to 34 Years | 56 (51.8%) | 7 (6.5%) |
| 35 to 44 Years | 20 (34.5%) | 18 (31.0%) |
| 45 to 54 Years | 13 (37.1%) | 14 (40.0%) |
| 55 to 64 Years | 19 (45.2%) | 4 (9.5%) |
| 65 to 74 Years | 13 (76.5%) | 6 (35.3%) |
| 75 Years and over | 28 (100.0%) | 2 (7.1%) |
| Total | 374 (58.1%) | 110 (17.1%) |
Disability Status by Sex by Age in Buckland
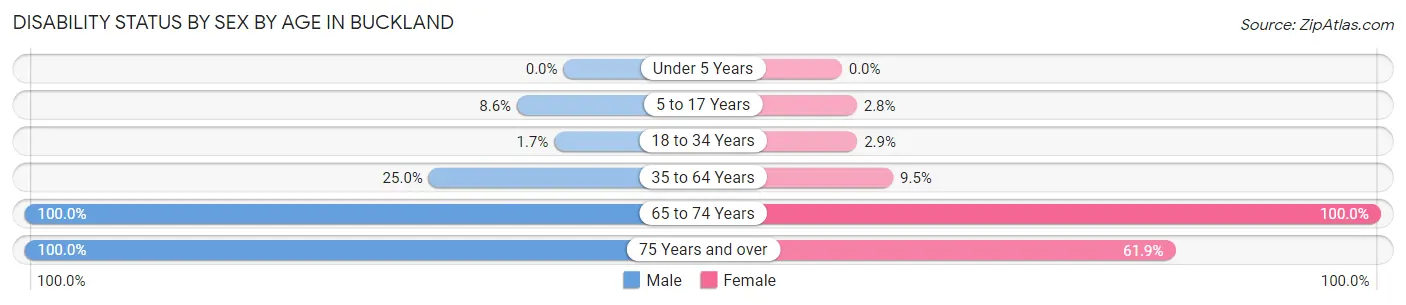
| Age Bracket | Male | Female |
| Under 5 Years | 0 (0.0%) | 0 (0.0%) |
| 5 to 17 Years | 10 (8.6%) | 2 (2.8%) |
| 18 to 34 Years | 2 (1.7%) | 2 (2.9%) |
| 35 to 64 Years | 18 (25.0%) | 6 (9.5%) |
| 65 to 74 Years | 11 (100.0%) | 6 (100.0%) |
| 75 Years and over | 7 (100.0%) | 13 (61.9%) |
Disability Class by Sex by Age in Buckland
Disability Class: Hearing Difficulty
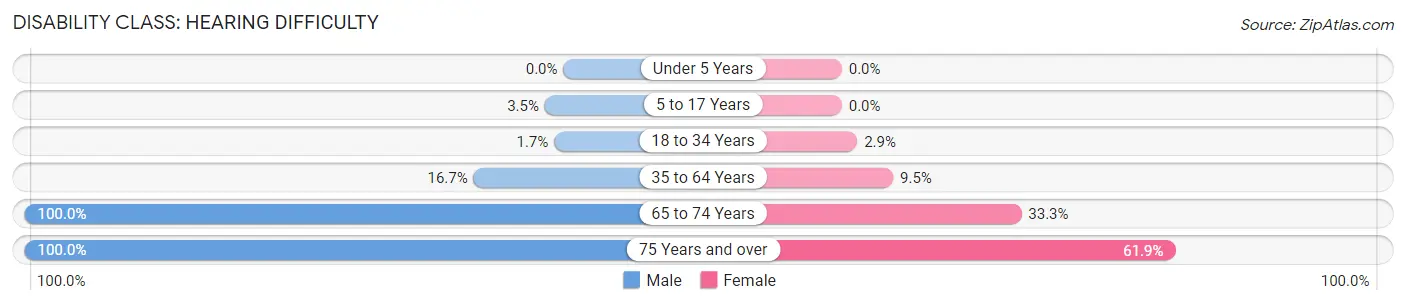
| Age Bracket | Male | Female |
| Under 5 Years | 0 (0.0%) | 0 (0.0%) |
| 5 to 17 Years | 4 (3.5%) | 0 (0.0%) |
| 18 to 34 Years | 2 (1.7%) | 2 (2.9%) |
| 35 to 64 Years | 12 (16.7%) | 6 (9.5%) |
| 65 to 74 Years | 11 (100.0%) | 2 (33.3%) |
| 75 Years and over | 7 (100.0%) | 13 (61.9%) |
Disability Class: Vision Difficulty
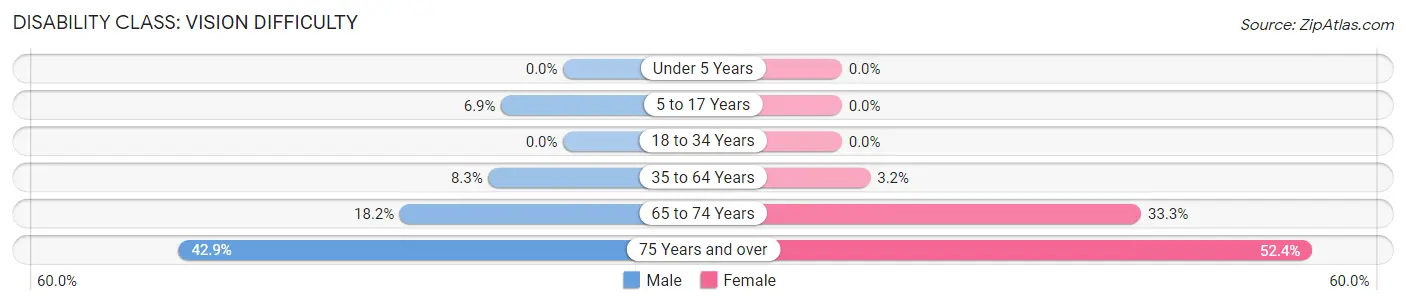
| Age Bracket | Male | Female |
| Under 5 Years | 0 (0.0%) | 0 (0.0%) |
| 5 to 17 Years | 8 (6.9%) | 0 (0.0%) |
| 18 to 34 Years | 0 (0.0%) | 0 (0.0%) |
| 35 to 64 Years | 6 (8.3%) | 2 (3.2%) |
| 65 to 74 Years | 2 (18.2%) | 2 (33.3%) |
| 75 Years and over | 3 (42.9%) | 11 (52.4%) |
Disability Class: Cognitive Difficulty
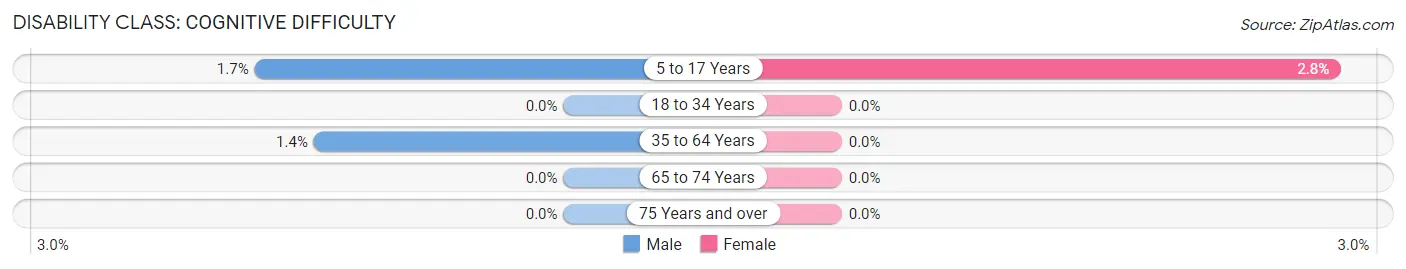
| Age Bracket | Male | Female |
| 5 to 17 Years | 2 (1.7%) | 2 (2.8%) |
| 18 to 34 Years | 0 (0.0%) | 0 (0.0%) |
| 35 to 64 Years | 1 (1.4%) | 0 (0.0%) |
| 65 to 74 Years | 0 (0.0%) | 0 (0.0%) |
| 75 Years and over | 0 (0.0%) | 0 (0.0%) |
Disability Class: Ambulatory Difficulty
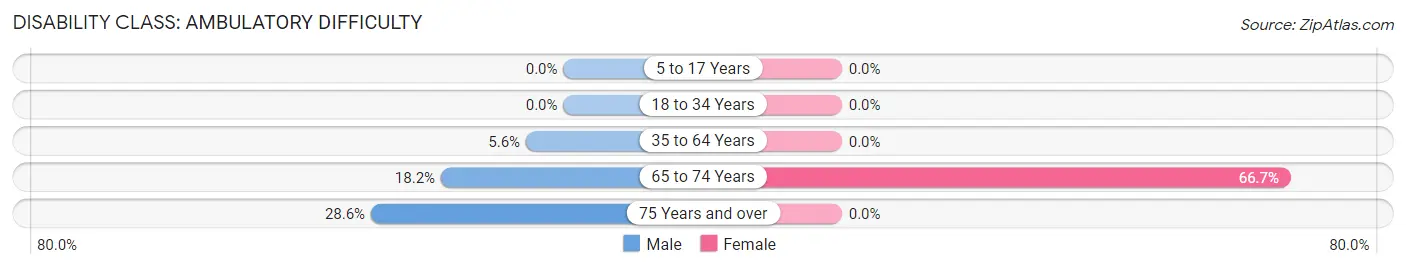
| Age Bracket | Male | Female |
| 5 to 17 Years | 0 (0.0%) | 0 (0.0%) |
| 18 to 34 Years | 0 (0.0%) | 0 (0.0%) |
| 35 to 64 Years | 4 (5.6%) | 0 (0.0%) |
| 65 to 74 Years | 2 (18.2%) | 4 (66.7%) |
| 75 Years and over | 2 (28.6%) | 0 (0.0%) |
Disability Class: Self-Care Difficulty
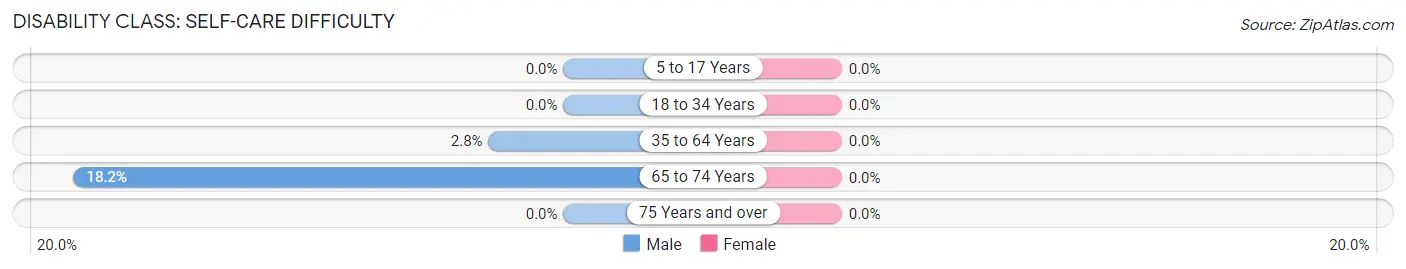
| Age Bracket | Male | Female |
| 5 to 17 Years | 0 (0.0%) | 0 (0.0%) |
| 18 to 34 Years | 0 (0.0%) | 0 (0.0%) |
| 35 to 64 Years | 2 (2.8%) | 0 (0.0%) |
| 65 to 74 Years | 2 (18.2%) | 0 (0.0%) |
| 75 Years and over | 0 (0.0%) | 0 (0.0%) |
Technology Access in Buckland
Computing Device Access in Buckland
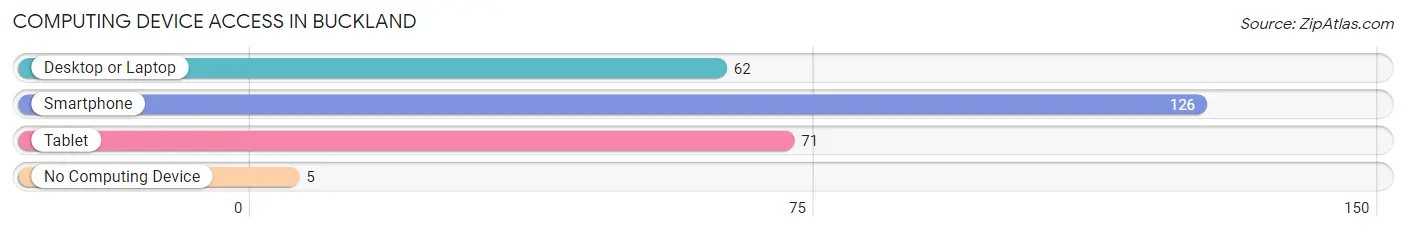
| Device Type | # Households | % Households |
| Desktop or Laptop | 62 | 46.6% |
| Smartphone | 126 | 94.7% |
| Tablet | 71 | 53.4% |
| No Computing Device | 5 | 3.8% |
| Total | 133 | 100.0% |
Internet Access in Buckland
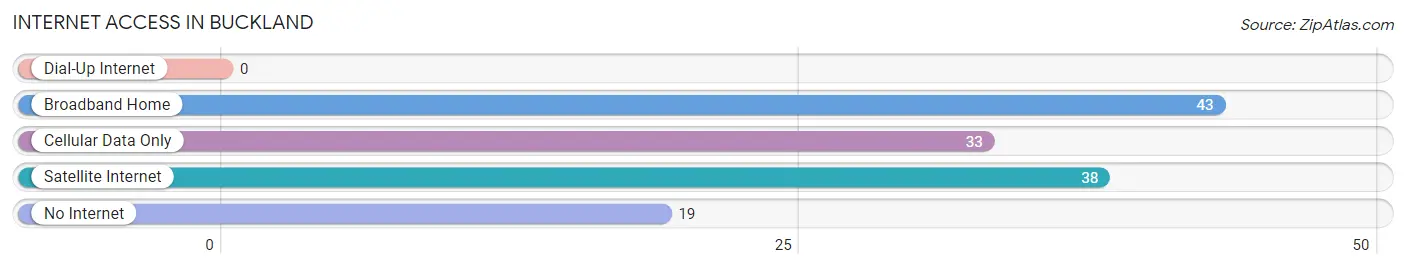
| Internet Type | # Households | % Households |
| Dial-Up Internet | 0 | 0.0% |
| Broadband Home | 43 | 32.3% |
| Cellular Data Only | 33 | 24.8% |
| Satellite Internet | 38 | 28.6% |
| No Internet | 19 | 14.3% |
| Total | 133 | 100.0% |
Buckland Summary
Buckland is a city located in the Northwest Arctic Borough of Alaska. It is situated on the south bank of the Kobuk River, approximately 40 miles east of Kotzebue. Buckland is a small city with a population of just over 500 people, according to the 2010 census. The city is home to the Inupiat people, who have lived in the area for centuries.
Geography
Buckland is located in the Northwest Arctic Borough of Alaska, on the south bank of the Kobuk River. The city is situated approximately 40 miles east of Kotzebue, and is surrounded by the Kobuk Valley National Wildlife Refuge. The city is located in a tundra climate, with cold winters and mild summers. The average temperature in the summer is around 50°F, while the average temperature in the winter is around -20°F. The city receives an average of 16 inches of precipitation per year, with most of it falling in the form of snow.
Economy
The economy of Buckland is largely based on subsistence hunting and fishing. The city is home to a number of small businesses, including a grocery store, a hardware store, and a restaurant. The city also has a small airport, which serves as a hub for air travel to and from the region. The city is also home to a number of government offices, including the Northwest Arctic Borough School District, the Alaska Department of Fish and Game, and the Alaska State Troopers.
Demographics
According to the 2010 census, Buckland had a population of 514 people. The racial makeup of the city was 95.3% Native American, 2.7% White, 0.2% Asian, and 1.8% from other races. The median household income in the city was $37,500, and the median age was 28. The city is home to a number of Inupiat people, who have lived in the area for centuries.
Conclusion
Buckland is a small city located in the Northwest Arctic Borough of Alaska. It is situated on the south bank of the Kobuk River, approximately 40 miles east of Kotzebue. The city is home to the Inupiat people, who have lived in the area for centuries. The economy of Buckland is largely based on subsistence hunting and fishing, and the city is home to a number of small businesses. According to the 2010 census, Buckland had a population of 514 people, with the majority of them being Native American.
Common Questions
What is the Total Population of Buckland?
Total Population of Buckland is 644.
What is the Total Male Population of Buckland?
Total Male Population of Buckland is 365.
What is the Total Female Population of Buckland?
Total Female Population of Buckland is 279.
What is the Ratio of Males per 100 Females in Buckland?
There are 130.82 Males per 100 Females in Buckland.
What is the Ratio of Females per 100 Males in Buckland?
There are 76.44 Females per 100 Males in Buckland.
What is the Median Population Age in Buckland?
Median Population Age in Buckland is 22.2 Years.
What is the Average Family Size in Buckland
Average Family Size in Buckland is 5.2 People.
What is the Average Household Size in Buckland
Average Household Size in Buckland is 4.8 People.
What is Per Capita Income in Buckland?
Per Capita income in Buckland is $16,754.
What is the Median Family Income in Buckland?
Median Family Income in Buckland is $54,444.
What is the Median Household income in Buckland?
Median Household Income in Buckland is $53,819.
What is Income or Wage Gap in Buckland?
Income or Wage Gap in Buckland is 11.9%.
Women in Buckland earn 88.1 cents for every dollar earned by a man.
What is Inequality or Gini Index in Buckland?
Inequality or Gini Index in Buckland is 0.47.
How Large is the Labor Force in Buckland?
There are 203 People in the Labor Forcein in Buckland.
What is the Percentage of People in the Labor Force in Buckland?
50.9% of People are in the Labor Force in Buckland.
What is the Unemployment Rate in Buckland?
Unemployment Rate in Buckland is 27.1%.