Wamsutter, WY
Wamsutter Map
Wamsutter Overview
251
TOTAL POPULATION
171
MALE POPULATION
80
FEMALE POPULATION
213.75
MALES / 100 FEMALES
46.78
FEMALES / 100 MALES
58.1
MEDIAN AGE
2.5
AVG FAMILY SIZE
2.8
AVG HOUSEHOLD SIZE
$29,453
PER CAPITA INCOME
$76,250
AVG FAMILY INCOME
$65,625
AVG HOUSEHOLD INCOME
0.17
INEQUALITY / GINI INDEX
174
LABOR FORCE [ PEOPLE ]
80.2%
PERCENT IN LABOR FORCE
6.9%
UNEMPLOYMENT RATE
Wamsutter Zip Codes
Wamsutter Area Codes
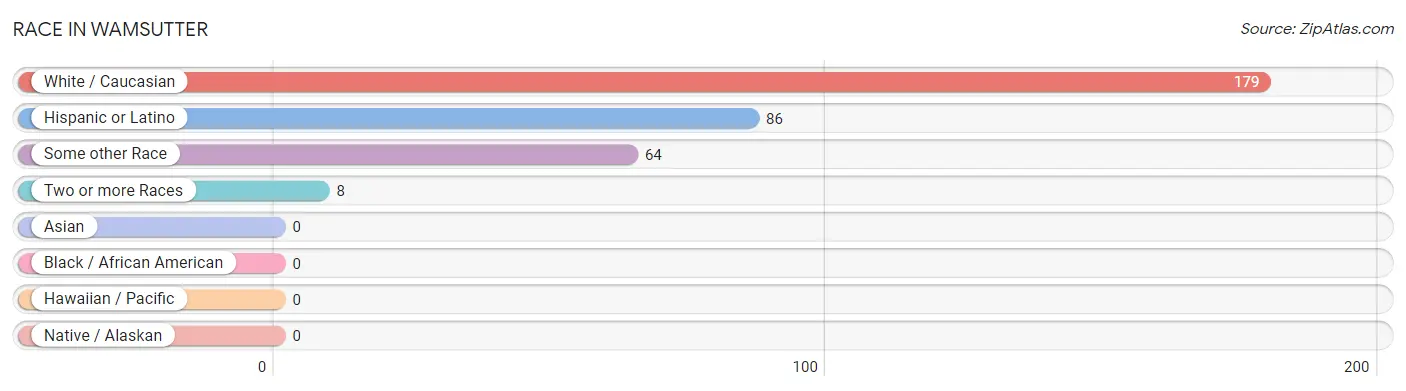
Race in Wamsutter
The most populous races in Wamsutter are White / Caucasian (179 | 71.3%), Hispanic or Latino (86 | 34.3%), and Some other Race (64 | 25.5%).
| Race | # Population | % Population |
| Asian | 0 | 0.0% |
| Black / African American | 0 | 0.0% |
| Hawaiian / Pacific | 0 | 0.0% |
| Hispanic or Latino | 86 | 34.3% |
| Native / Alaskan | 0 | 0.0% |
| White / Caucasian | 179 | 71.3% |
| Two or more Races | 8 | 3.2% |
| Some other Race | 64 | 25.5% |
| Total | 251 | 100.0% |
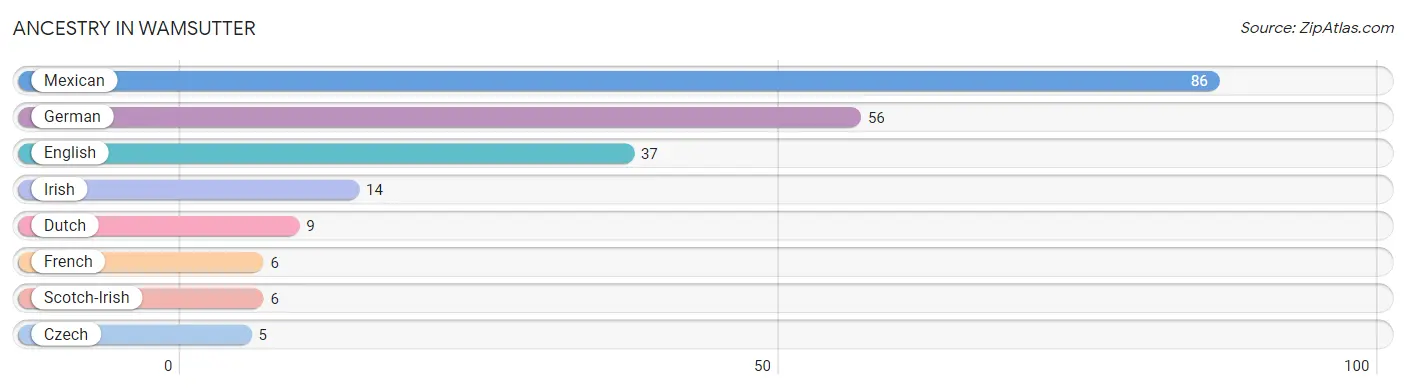
Ancestry in Wamsutter
The most populous ancestries reported in Wamsutter are Mexican (86 | 34.3%), German (56 | 22.3%), English (37 | 14.7%), Irish (14 | 5.6%), and Dutch (9 | 3.6%), together accounting for 80.5% of all Wamsutter residents.
| Ancestry | # Population | % Population |
| Czech | 5 | 2.0% |
| Dutch | 9 | 3.6% |
| English | 37 | 14.7% |
| French | 6 | 2.4% |
| German | 56 | 22.3% |
| Irish | 14 | 5.6% |
| Mexican | 86 | 34.3% |
| Scotch-Irish | 6 | 2.4% | View All 8 Rows |
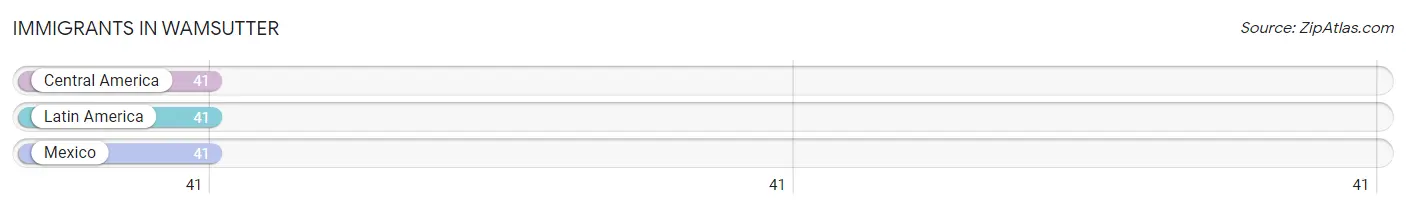
Immigrants in Wamsutter
The most numerous immigrant groups reported in Wamsutter came from Central America (41 | 16.3%), Latin America (41 | 16.3%), and Mexico (41 | 16.3%), together accounting for 49.0% of all Wamsutter residents.
| Immigration Origin | # Population | % Population |
| Central America | 41 | 16.3% |
| Latin America | 41 | 16.3% |
| Mexico | 41 | 16.3% | View All 3 Rows |
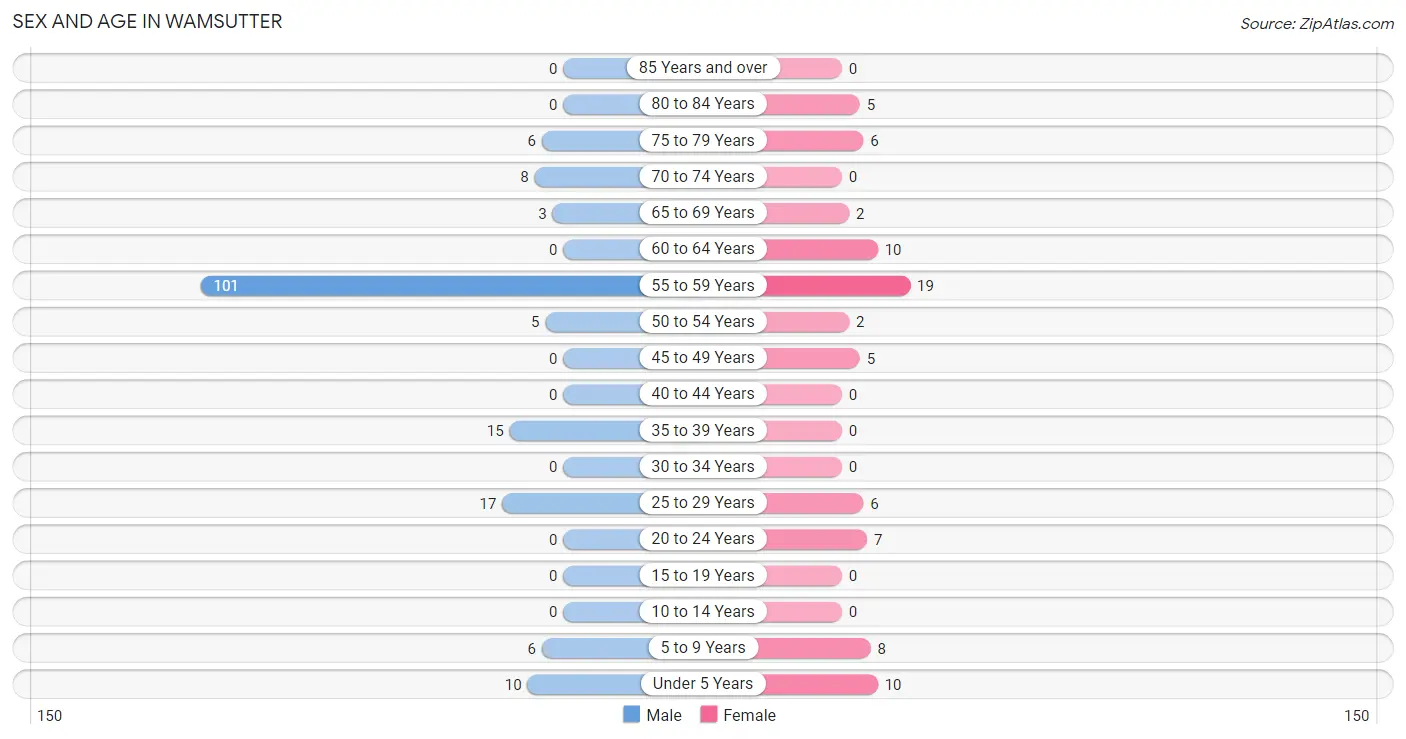
Sex and Age in Wamsutter
Sex and Age in Wamsutter
The most populous age groups in Wamsutter are 55 to 59 Years (101 | 59.1%) for men and 55 to 59 Years (19 | 23.7%) for women.
| Age Bracket | Male | Female |
| Under 5 Years | 10 (5.9%) | 10 (12.5%) |
| 5 to 9 Years | 6 (3.5%) | 8 (10.0%) |
| 10 to 14 Years | 0 (0.0%) | 0 (0.0%) |
| 15 to 19 Years | 0 (0.0%) | 0 (0.0%) |
| 20 to 24 Years | 0 (0.0%) | 7 (8.7%) |
| 25 to 29 Years | 17 (9.9%) | 6 (7.5%) |
| 30 to 34 Years | 0 (0.0%) | 0 (0.0%) |
| 35 to 39 Years | 15 (8.8%) | 0 (0.0%) |
| 40 to 44 Years | 0 (0.0%) | 0 (0.0%) |
| 45 to 49 Years | 0 (0.0%) | 5 (6.2%) |
| 50 to 54 Years | 5 (2.9%) | 2 (2.5%) |
| 55 to 59 Years | 101 (59.1%) | 19 (23.7%) |
| 60 to 64 Years | 0 (0.0%) | 10 (12.5%) |
| 65 to 69 Years | 3 (1.8%) | 2 (2.5%) |
| 70 to 74 Years | 8 (4.7%) | 0 (0.0%) |
| 75 to 79 Years | 6 (3.5%) | 6 (7.5%) |
| 80 to 84 Years | 0 (0.0%) | 5 (6.2%) |
| 85 Years and over | 0 (0.0%) | 0 (0.0%) |
| Total | 171 (100.0%) | 80 (100.0%) |
Families and Households in Wamsutter
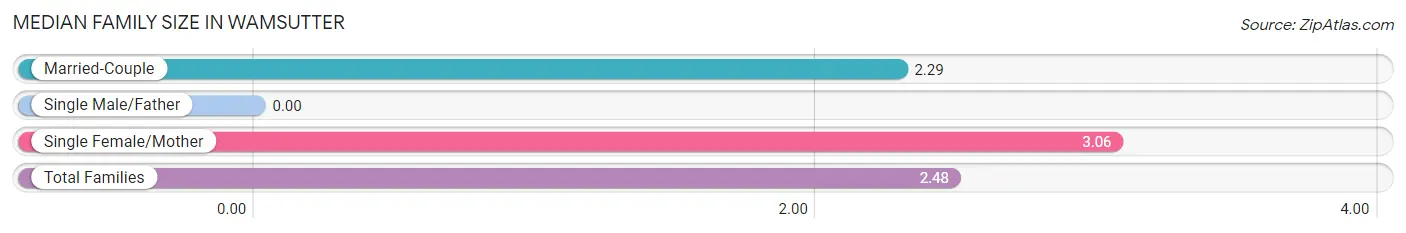
Median Family Size in Wamsutter
| Family Type | # Families | Family Size |
| Married-Couple | 48 (75.0%) | 2.29 |
| Single Male/Father | 0 (0.0%) | - |
| Single Female/Mother | 16 (25.0%) | 3.06 |
| Total Families | 64 (100.0%) | 2.48 |
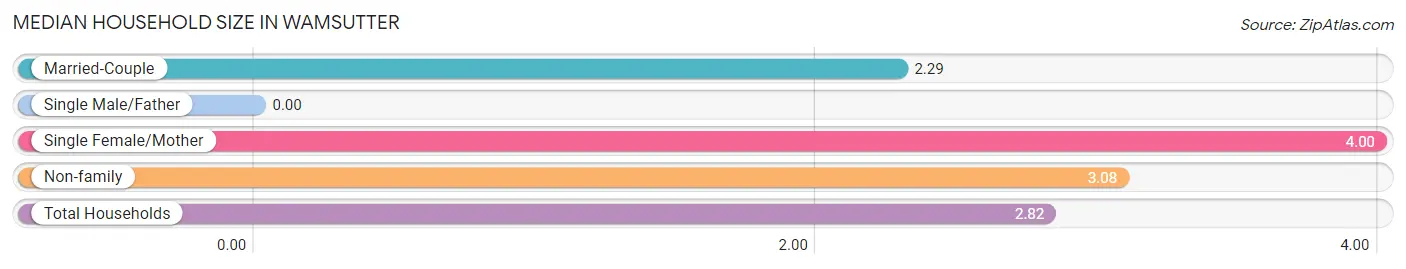
Median Household Size in Wamsutter
| Household Type | # Households | Household Size |
| Married-Couple | 48 (53.9%) | 2.29 |
| Single Male/Father | 0 (0.0%) | - |
| Single Female/Mother | 16 (18.0%) | 4.00 |
| Non-family | 25 (28.1%) | 3.08 |
| Total Households | 89 (100.0%) | 2.82 |
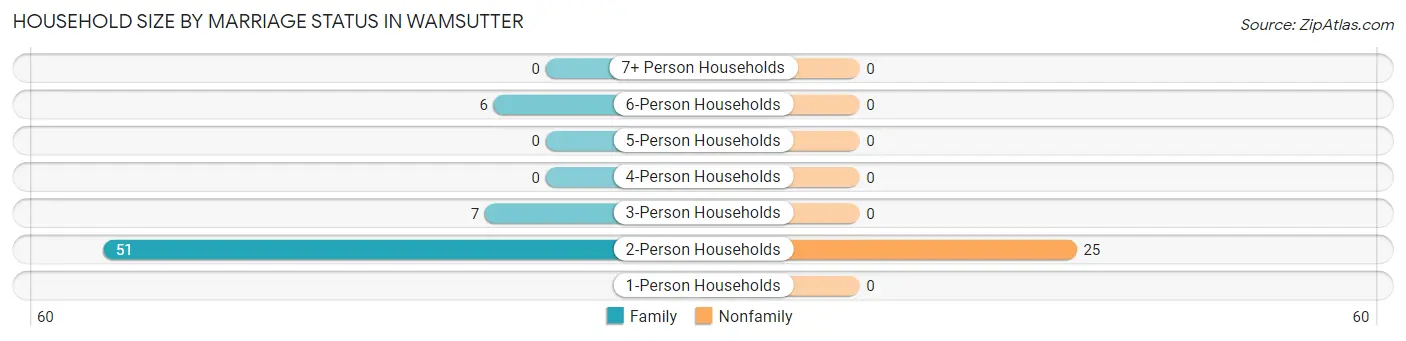
Household Size by Marriage Status in Wamsutter
Out of a total of 89 households in Wamsutter, 64 (71.9%) are family households, while 25 (28.1%) are nonfamily households. The most numerous type of family households are 2-person households, comprising 51, and the most common type of nonfamily households are 2-person households, comprising 25.
| Household Size | Family Households | Nonfamily Households |
| 1-Person Households | - | 0 (0.0%) |
| 2-Person Households | 51 (57.3%) | 25 (28.1%) |
| 3-Person Households | 7 (7.9%) | 0 (0.0%) |
| 4-Person Households | 0 (0.0%) | 0 (0.0%) |
| 5-Person Households | 0 (0.0%) | 0 (0.0%) |
| 6-Person Households | 6 (6.7%) | 0 (0.0%) |
| 7+ Person Households | 0 (0.0%) | 0 (0.0%) |
| Total | 64 (71.9%) | 25 (28.1%) |
Female Fertility in Wamsutter
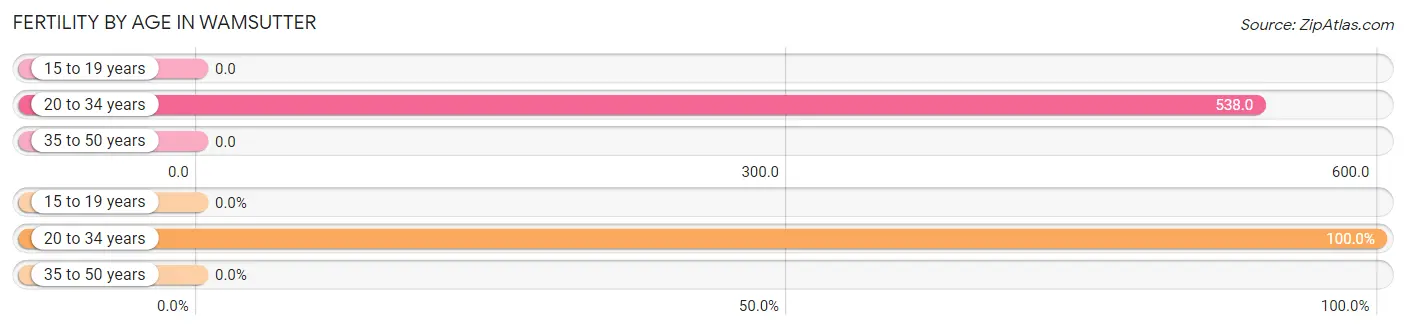
Fertility by Age in Wamsutter
Average fertility rate in Wamsutter is 389.0 births per 1,000 women. Women in the age bracket of 20 to 34 years have the highest fertility rate with 538.0 births per 1,000 women. Women in the age bracket of 20 to 34 years acount for 100.0% of all women with births.
| Age Bracket | Women with Births | Births / 1,000 Women |
| 15 to 19 years | 0 (0.0%) | 0.0 |
| 20 to 34 years | 7 (100.0%) | 538.0 |
| 35 to 50 years | 0 (0.0%) | 0.0 |
| Total | 7 (100.0%) | 389.0 |
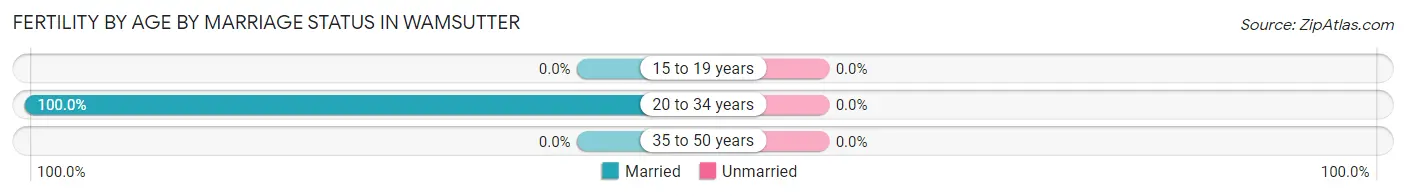
Fertility by Age by Marriage Status in Wamsutter
| Age Bracket | Married | Unmarried |
| 15 to 19 years | 0 (0.0%) | 0 (0.0%) |
| 20 to 34 years | 7 (100.0%) | 0 (0.0%) |
| 35 to 50 years | 0 (0.0%) | 0 (0.0%) |
| Total | 7 (100.0%) | 0 (0.0%) |
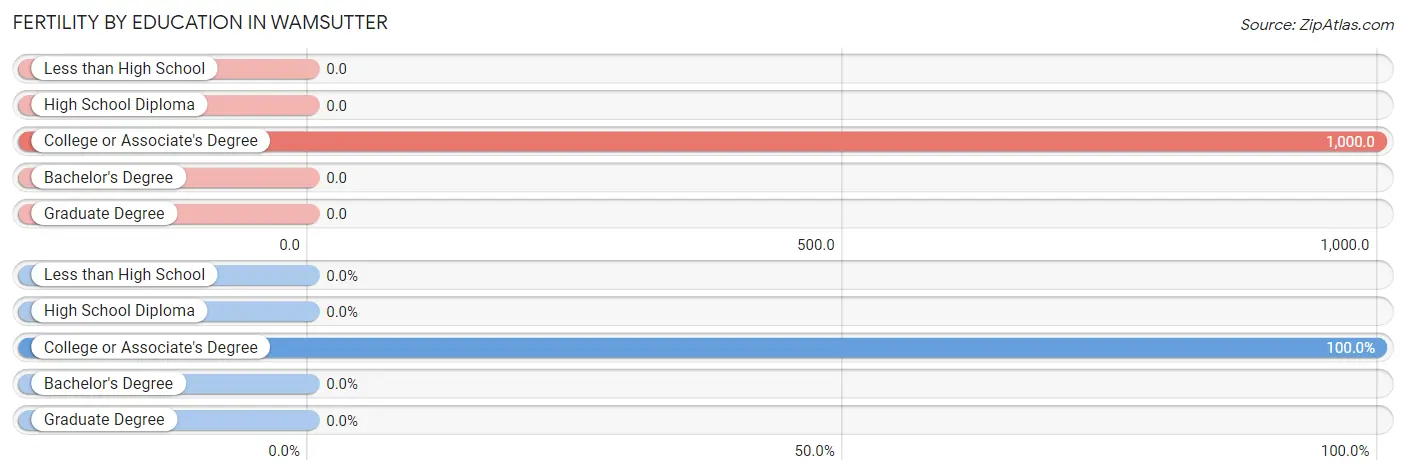
Fertility by Education in Wamsutter
| Educational Attainment | Women with Births | Births / 1,000 Women |
| Less than High School | 0 (0.0%) | 0.0 |
| High School Diploma | 0 (0.0%) | 0.0 |
| College or Associate's Degree | 7 (100.0%) | 1,000.0 |
| Bachelor's Degree | 0 (0.0%) | 0.0 |
| Graduate Degree | 0 (0.0%) | 0.0 |
| Total | 7 (100.0%) | 389.0 |
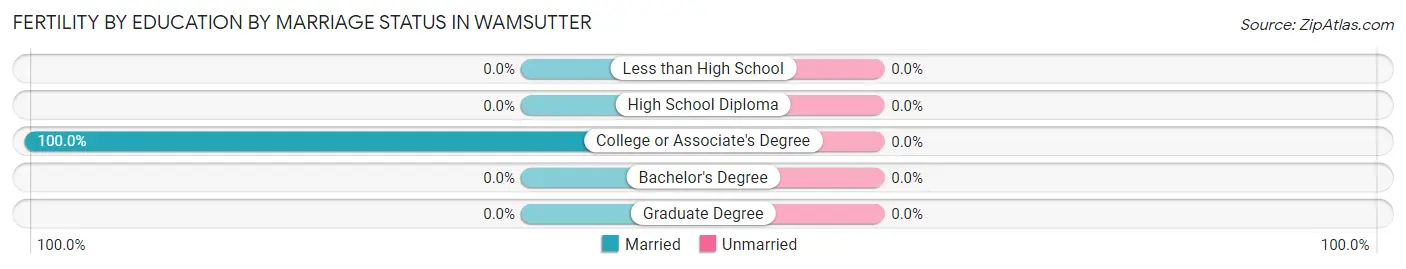
Fertility by Education by Marriage Status in Wamsutter
| Educational Attainment | Married | Unmarried |
| Less than High School | 0 (0.0%) | 0 (0.0%) |
| High School Diploma | 0 (0.0%) | 0 (0.0%) |
| College or Associate's Degree | 7 (100.0%) | 0 (0.0%) |
| Bachelor's Degree | 0 (0.0%) | 0 (0.0%) |
| Graduate Degree | 0 (0.0%) | 0 (0.0%) |
| Total | 7 (100.0%) | 0 (0.0%) |
Income in Wamsutter
Income Overview in Wamsutter
Per Capita Income in Wamsutter is $29,453, while median incomes of families and households are $76,250 and $65,625 respectively.
| Characteristic | Number | Measure |
| Per Capita Income | 251 | $29,453 |
| Median Family Income | 64 | $76,250 |
| Mean Family Income | 64 | $71,903 |
| Median Household Income | 89 | $65,625 |
| Mean Household Income | 89 | $69,916 |
| Income Deficit | 64 | $0 |
| Wage / Income Gap (%) | 251 | 0.00% |
| Wage / Income Gap ($) | 251 | 100.00¢ per $1 |
| Gini / Inequality Index | 251 | 0.17 |
Earnings by Sex in Wamsutter
| Sex | Number | Average Earnings |
| Male | 141 (81.0%) | $0 |
| Female | 33 (19.0%) | $0 |
| Total | 174 (100.0%) | $0 |
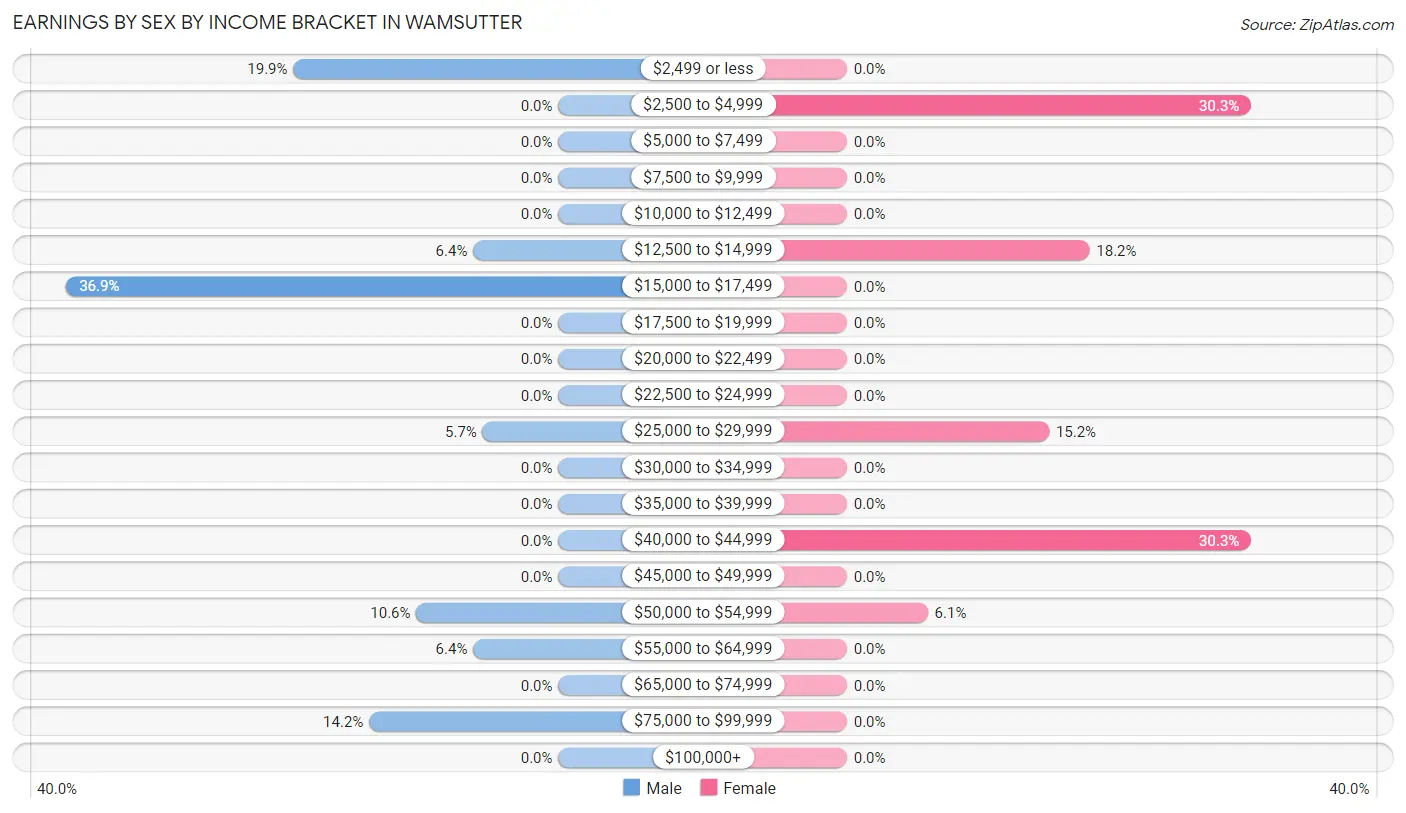
Earnings by Sex by Income Bracket in Wamsutter
The most common earnings brackets in Wamsutter are $15,000 to $17,499 for men (52 | 36.9%) and $2,500 to $4,999 for women (10 | 30.3%).
| Income | Male | Female |
| $2,499 or less | 28 (19.9%) | 0 (0.0%) |
| $2,500 to $4,999 | 0 (0.0%) | 10 (30.3%) |
| $5,000 to $7,499 | 0 (0.0%) | 0 (0.0%) |
| $7,500 to $9,999 | 0 (0.0%) | 0 (0.0%) |
| $10,000 to $12,499 | 0 (0.0%) | 0 (0.0%) |
| $12,500 to $14,999 | 9 (6.4%) | 6 (18.2%) |
| $15,000 to $17,499 | 52 (36.9%) | 0 (0.0%) |
| $17,500 to $19,999 | 0 (0.0%) | 0 (0.0%) |
| $20,000 to $22,499 | 0 (0.0%) | 0 (0.0%) |
| $22,500 to $24,999 | 0 (0.0%) | 0 (0.0%) |
| $25,000 to $29,999 | 8 (5.7%) | 5 (15.1%) |
| $30,000 to $34,999 | 0 (0.0%) | 0 (0.0%) |
| $35,000 to $39,999 | 0 (0.0%) | 0 (0.0%) |
| $40,000 to $44,999 | 0 (0.0%) | 10 (30.3%) |
| $45,000 to $49,999 | 0 (0.0%) | 0 (0.0%) |
| $50,000 to $54,999 | 15 (10.6%) | 2 (6.1%) |
| $55,000 to $64,999 | 9 (6.4%) | 0 (0.0%) |
| $65,000 to $74,999 | 0 (0.0%) | 0 (0.0%) |
| $75,000 to $99,999 | 20 (14.2%) | 0 (0.0%) |
| $100,000+ | 0 (0.0%) | 0 (0.0%) |
| Total | 141 (100.0%) | 33 (100.0%) |
Earnings by Sex by Educational Attainment in Wamsutter
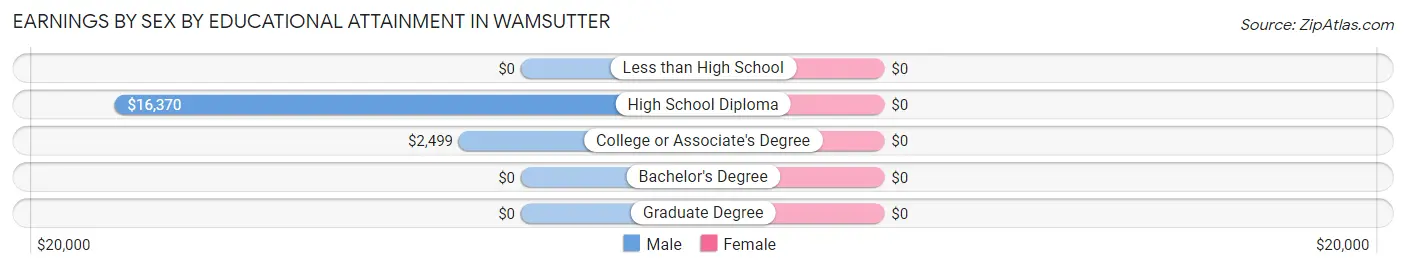
| Educational Attainment | Male Income | Female Income |
| Less than High School | - | - |
| High School Diploma | $16,370 | $0 |
| College or Associate's Degree | $2,499 | $0 |
| Bachelor's Degree | - | - |
| Graduate Degree | - | - |
| Total | - | - |
Family Income in Wamsutter
Family Income Brackets in Wamsutter
According to the Wamsutter family income data, there are 29 families falling into the $75,000 to $99,999 income range, which is the most common income bracket and makes up 45.3% of all families.
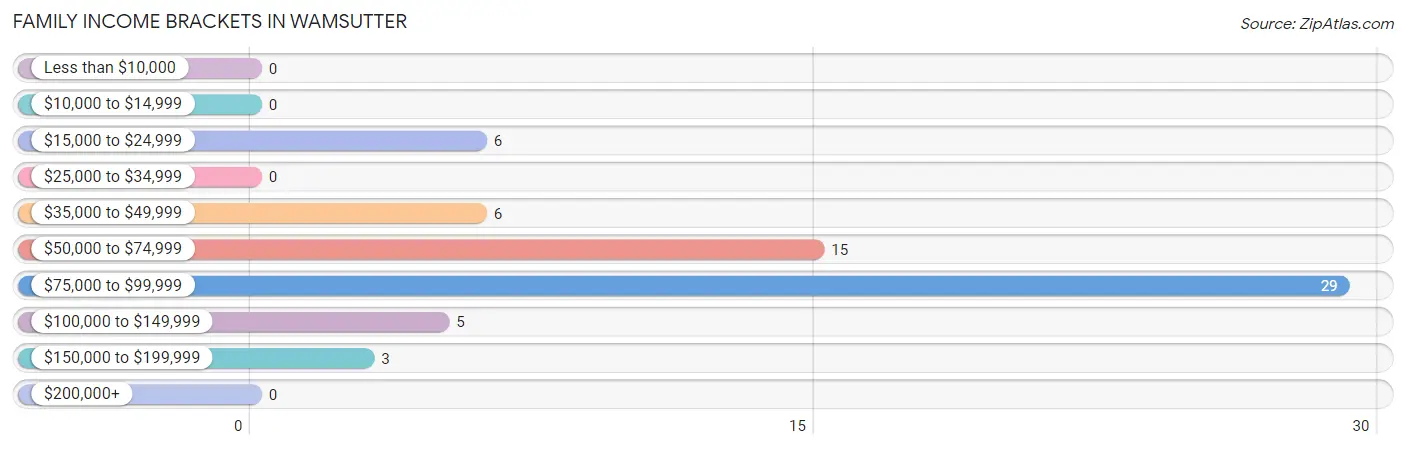
| Income Bracket | # Families | % Families |
| Less than $10,000 | 0 | 0.0% |
| $10,000 to $14,999 | 0 | 0.0% |
| $15,000 to $24,999 | 6 | 9.4% |
| $25,000 to $34,999 | 0 | 0.0% |
| $35,000 to $49,999 | 6 | 9.4% |
| $50,000 to $74,999 | 15 | 23.4% |
| $75,000 to $99,999 | 29 | 45.3% |
| $100,000 to $149,999 | 5 | 7.8% |
| $150,000 to $199,999 | 3 | 4.7% |
| $200,000+ | 0 | 0.0% |
Family Income by Famaliy Size in Wamsutter
2-person families (51 | 79.7%) account for the highest median family income in Wamsutter with $77,917 per family, while 2-person families (51 | 79.7%) have the highest median income of $38,958 per family member.
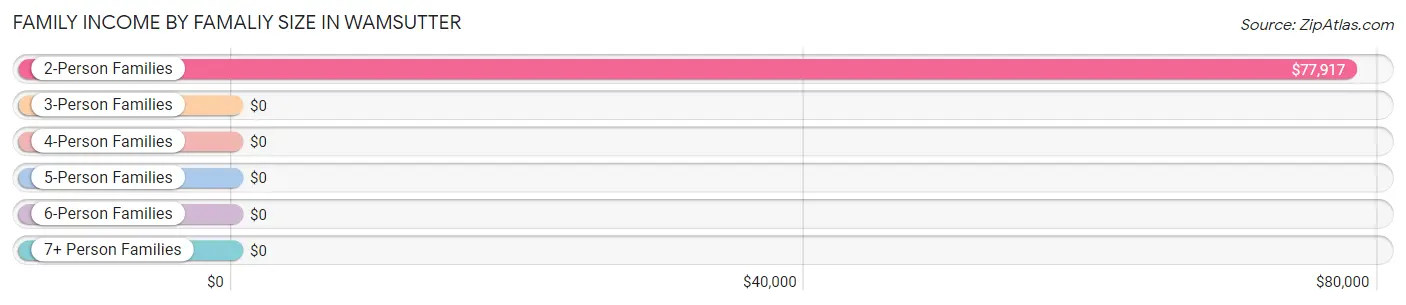
| Income Bracket | # Families | Median Income |
| 2-Person Families | 51 (79.7%) | $77,917 |
| 3-Person Families | 7 (10.9%) | $0 |
| 4-Person Families | 0 (0.0%) | $0 |
| 5-Person Families | 6 (9.4%) | $0 |
| 6-Person Families | 0 (0.0%) | $0 |
| 7+ Person Families | 0 (0.0%) | $0 |
| Total | 64 (100.0%) | $76,250 |
Family Income by Number of Earners in Wamsutter
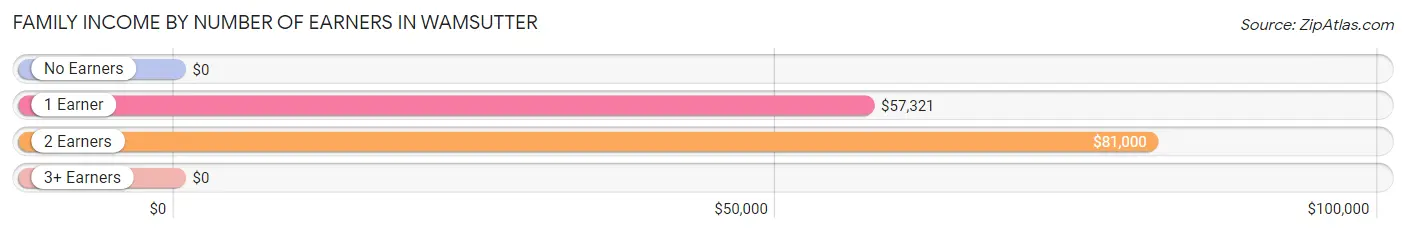
| Number of Earners | # Families | Median Income |
| No Earners | 11 (17.2%) | $0 |
| 1 Earner | 25 (39.1%) | $57,321 |
| 2 Earners | 28 (43.8%) | $81,000 |
| 3+ Earners | 0 (0.0%) | $0 |
| Total | 64 (100.0%) | $76,250 |
Household Income in Wamsutter
Household Income Brackets in Wamsutter
With 46 households falling in the category, the $50,000 to $74,999 income range is the most frequent in Wamsutter, accounting for 51.7% of all households.
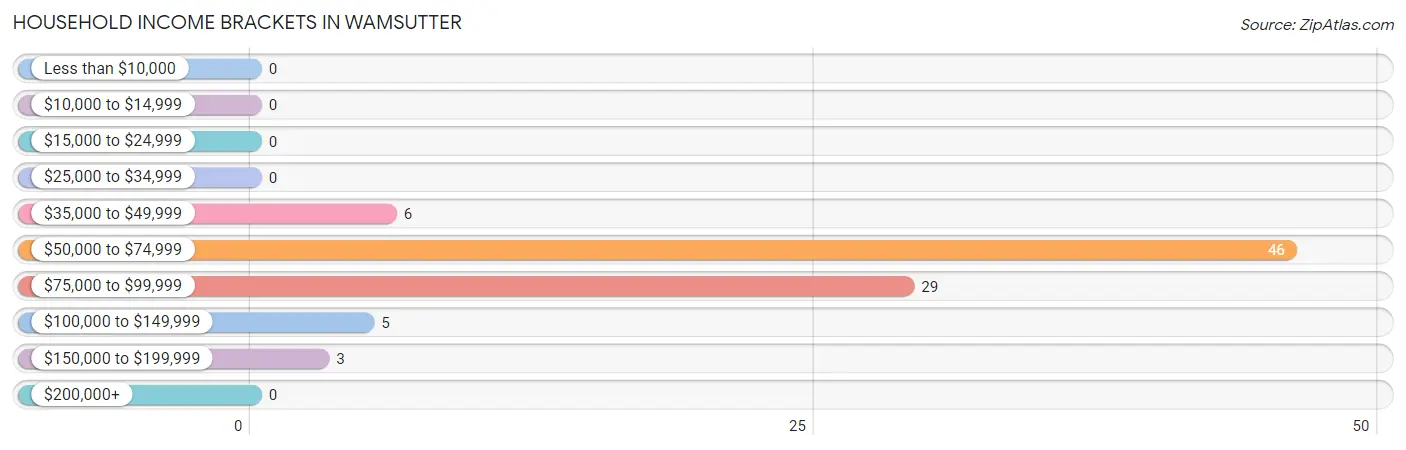
| Income Bracket | # Households | % Households |
| Less than $10,000 | 0 | 0.0% |
| $10,000 to $14,999 | 0 | 0.0% |
| $15,000 to $24,999 | 0 | 0.0% |
| $25,000 to $34,999 | 0 | 0.0% |
| $35,000 to $49,999 | 6 | 6.7% |
| $50,000 to $74,999 | 46 | 51.7% |
| $75,000 to $99,999 | 29 | 32.6% |
| $100,000 to $149,999 | 5 | 5.6% |
| $150,000 to $199,999 | 3 | 3.4% |
| $200,000+ | 0 | 0.0% |
Household Income by Householder Age in Wamsutter
The median household income in Wamsutter is $65,625, with the highest median household income of $76,500 found in the 45 to 64 years age bracket for the primary householder. A total of 62 households (69.7%) fall into this category. Meanwhile, the 15 to 24 years age bracket for the primary householder has the lowest median household income of $0, with 7 households (7.9%) in this group.
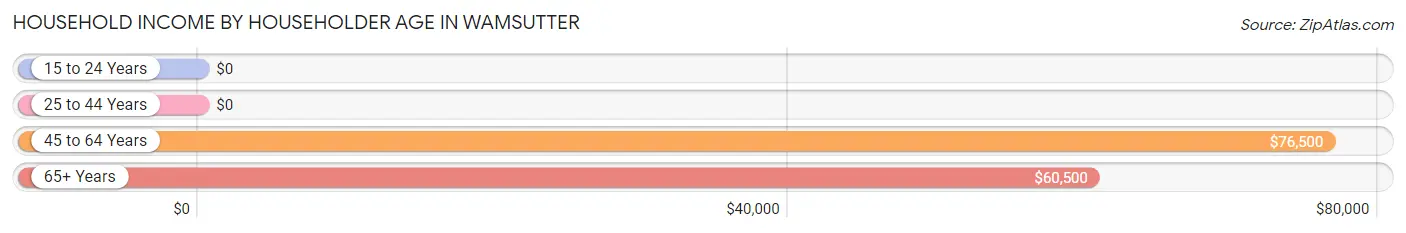
| Income Bracket | # Households | Median Income |
| 15 to 24 Years | 7 (7.9%) | $0 |
| 25 to 44 Years | 6 (6.7%) | $0 |
| 45 to 64 Years | 62 (69.7%) | $76,500 |
| 65+ Years | 14 (15.7%) | $60,500 |
| Total | 89 (100.0%) | $65,625 |
Poverty in Wamsutter
Income Below Poverty by Sex and Age in Wamsutter
With 3.5% poverty level for males and 30.0% for females among the residents of Wamsutter, 6 to 11 year old males and under 5 year old females are the most vulnerable to poverty, with 6 males (100.0%) and 10 females (100.0%) in their respective age groups living below the poverty level.
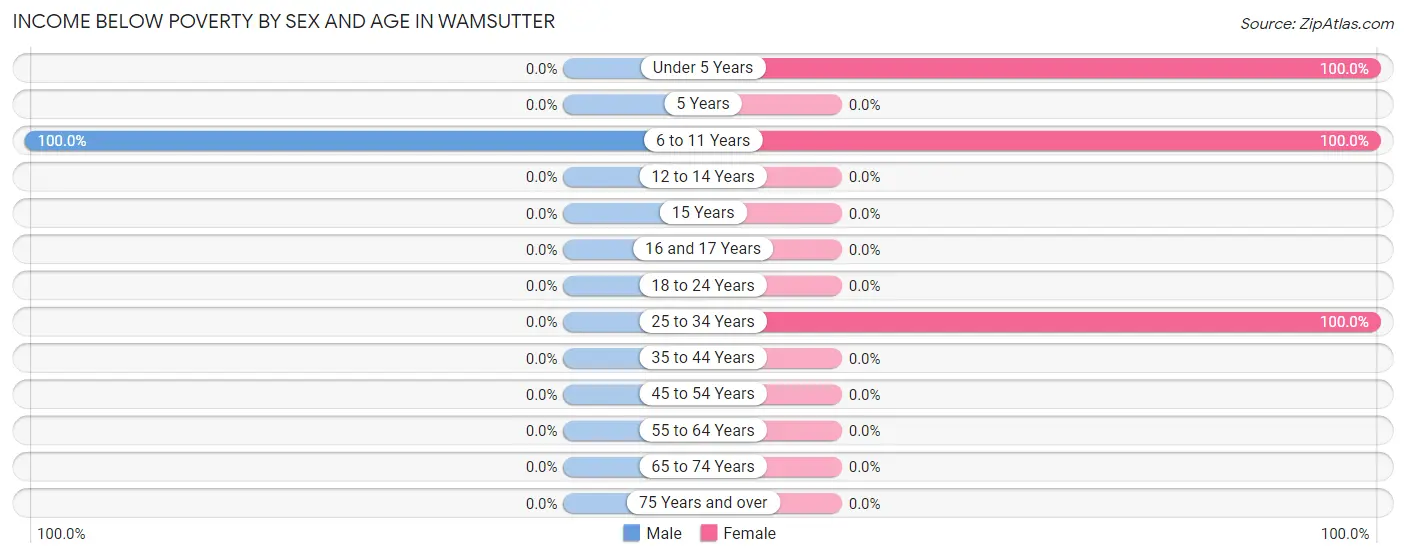
| Age Bracket | Male | Female |
| Under 5 Years | 0 (0.0%) | 10 (100.0%) |
| 5 Years | 0 (0.0%) | 0 (0.0%) |
| 6 to 11 Years | 6 (100.0%) | 8 (100.0%) |
| 12 to 14 Years | 0 (0.0%) | 0 (0.0%) |
| 15 Years | 0 (0.0%) | 0 (0.0%) |
| 16 and 17 Years | 0 (0.0%) | 0 (0.0%) |
| 18 to 24 Years | 0 (0.0%) | 0 (0.0%) |
| 25 to 34 Years | 0 (0.0%) | 6 (100.0%) |
| 35 to 44 Years | 0 (0.0%) | 0 (0.0%) |
| 45 to 54 Years | 0 (0.0%) | 0 (0.0%) |
| 55 to 64 Years | 0 (0.0%) | 0 (0.0%) |
| 65 to 74 Years | 0 (0.0%) | 0 (0.0%) |
| 75 Years and over | 0 (0.0%) | 0 (0.0%) |
| Total | 6 (3.5%) | 24 (30.0%) |
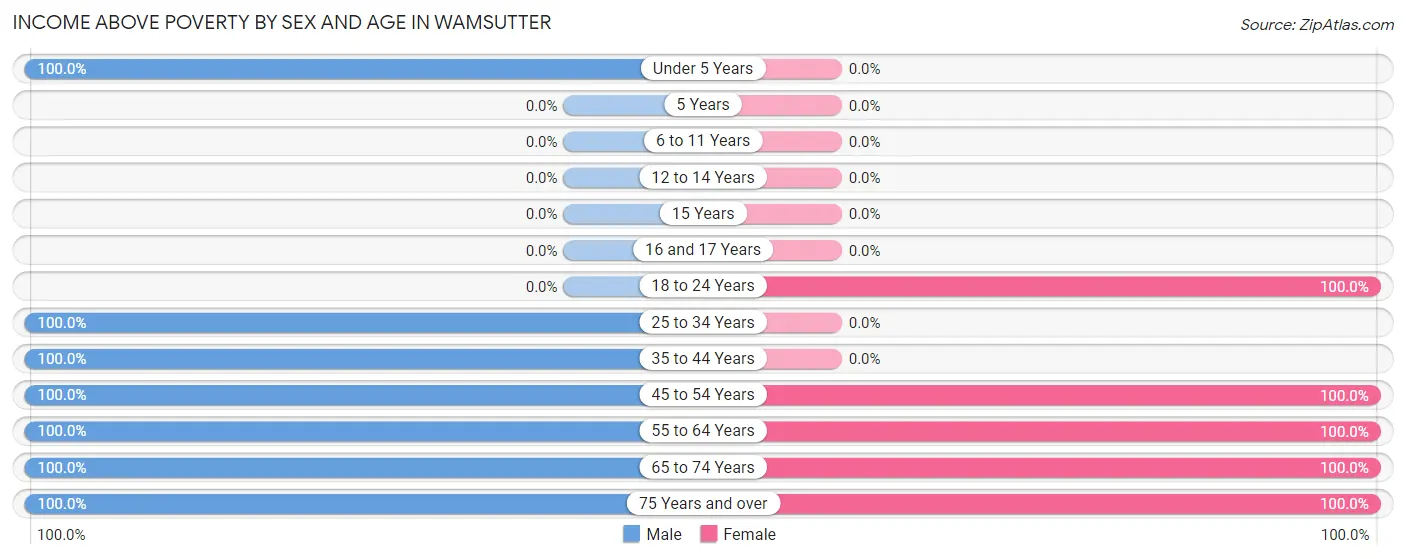
Income Above Poverty by Sex and Age in Wamsutter
According to the poverty statistics in Wamsutter, males aged under 5 years and females aged 18 to 24 years are the age groups that are most secure financially, with 100.0% of males and 100.0% of females in these age groups living above the poverty line.
| Age Bracket | Male | Female |
| Under 5 Years | 10 (100.0%) | 0 (0.0%) |
| 5 Years | 0 (0.0%) | 0 (0.0%) |
| 6 to 11 Years | 0 (0.0%) | 0 (0.0%) |
| 12 to 14 Years | 0 (0.0%) | 0 (0.0%) |
| 15 Years | 0 (0.0%) | 0 (0.0%) |
| 16 and 17 Years | 0 (0.0%) | 0 (0.0%) |
| 18 to 24 Years | 0 (0.0%) | 7 (100.0%) |
| 25 to 34 Years | 17 (100.0%) | 0 (0.0%) |
| 35 to 44 Years | 15 (100.0%) | 0 (0.0%) |
| 45 to 54 Years | 5 (100.0%) | 7 (100.0%) |
| 55 to 64 Years | 101 (100.0%) | 29 (100.0%) |
| 65 to 74 Years | 11 (100.0%) | 2 (100.0%) |
| 75 Years and over | 6 (100.0%) | 11 (100.0%) |
| Total | 165 (96.5%) | 56 (70.0%) |
Income Below Poverty Among Married-Couple Families in Wamsutter
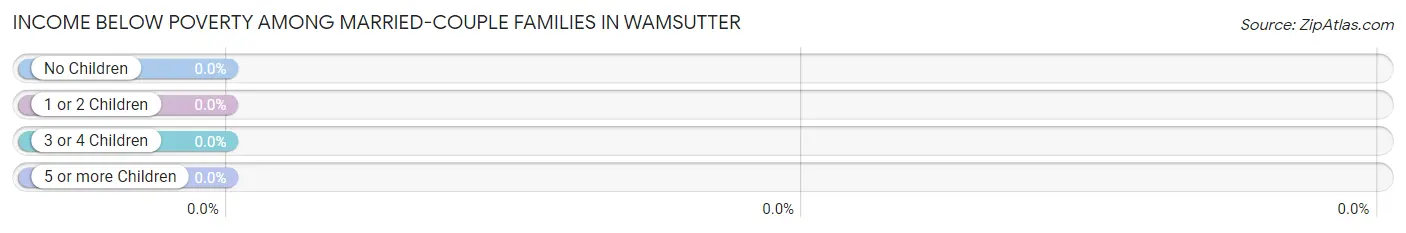
| Children | Above Poverty | Below Poverty |
| No Children | 41 (100.0%) | 0 (0.0%) |
| 1 or 2 Children | 7 (100.0%) | 0 (0.0%) |
| 3 or 4 Children | 0 (0.0%) | 0 (0.0%) |
| 5 or more Children | 0 (0.0%) | 0 (0.0%) |
| Total | 48 (100.0%) | 0 (0.0%) |
Income Below Poverty Among Single-Parent Households in Wamsutter
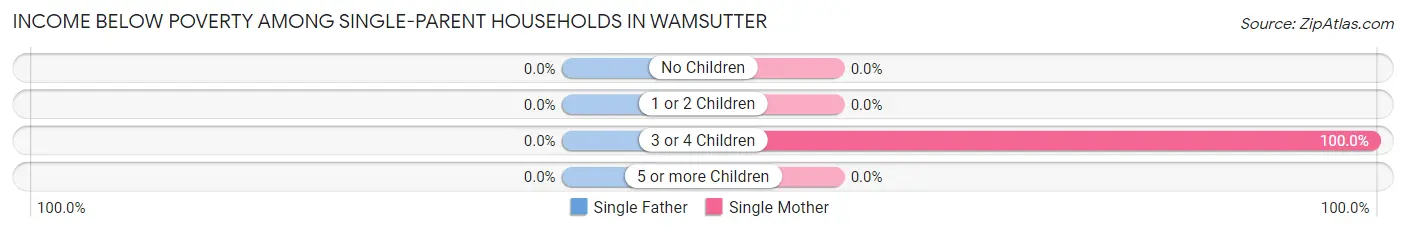
| Children | Single Father | Single Mother |
| No Children | 0 (0.0%) | 0 (0.0%) |
| 1 or 2 Children | 0 (0.0%) | 0 (0.0%) |
| 3 or 4 Children | 0 (0.0%) | 6 (100.0%) |
| 5 or more Children | 0 (0.0%) | 0 (0.0%) |
| Total | 0 (0.0%) | 6 (37.5%) |
Income Below Poverty Among Married-Couple vs Single-Parent Households in Wamsutter
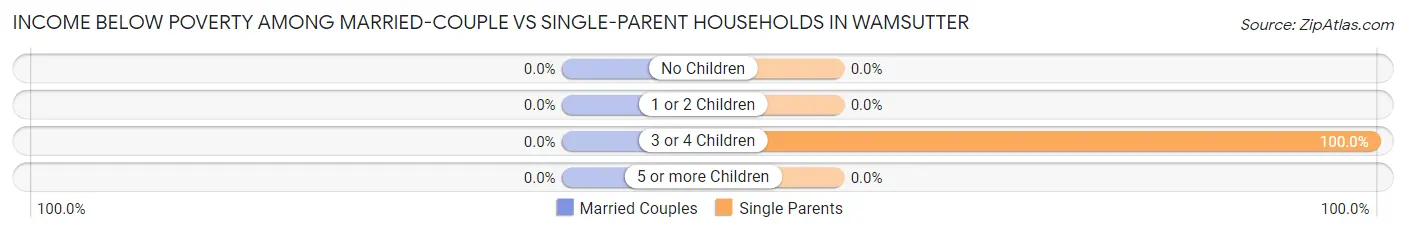
| Children | Married-Couple Families | Single-Parent Households |
| No Children | 0 (0.0%) | 0 (0.0%) |
| 1 or 2 Children | 0 (0.0%) | 0 (0.0%) |
| 3 or 4 Children | 0 (0.0%) | 6 (100.0%) |
| 5 or more Children | 0 (0.0%) | 0 (0.0%) |
| Total | 0 (0.0%) | 6 (37.5%) |
Employment Characteristics in Wamsutter
Employment by Class of Employer in Wamsutter
Among the 162 employed individuals in Wamsutter, private company employees (100 | 61.7%), self-employed (not incorporated) (25 | 15.4%), and self-employed (incorporated) (23 | 14.2%) make up the most common classes of employment.
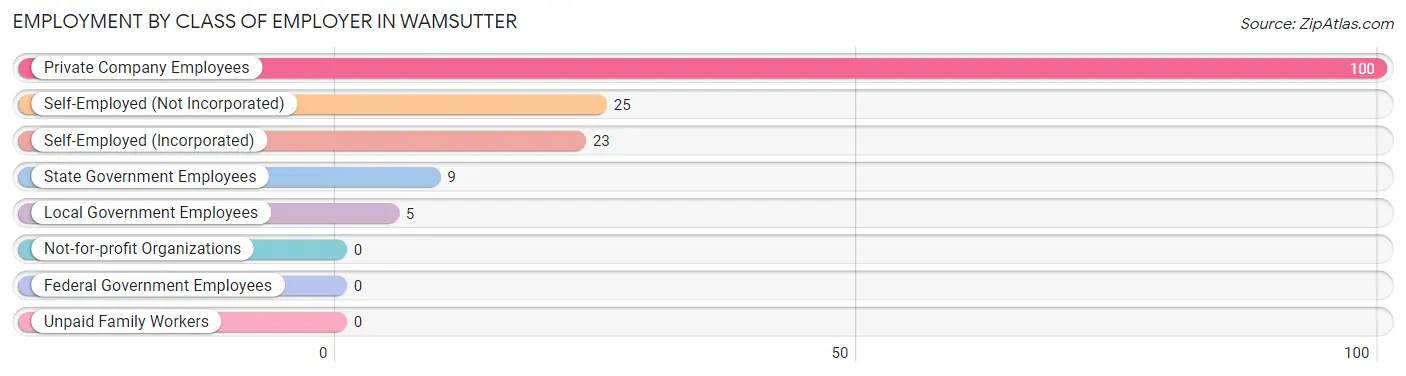
| Employer Class | # Employees | % Employees |
| Private Company Employees | 100 | 61.7% |
| Self-Employed (Incorporated) | 23 | 14.2% |
| Self-Employed (Not Incorporated) | 25 | 15.4% |
| Not-for-profit Organizations | 0 | 0.0% |
| Local Government Employees | 5 | 3.1% |
| State Government Employees | 9 | 5.6% |
| Federal Government Employees | 0 | 0.0% |
| Unpaid Family Workers | 0 | 0.0% |
| Total | 162 | 100.0% |
Employment Status by Age in Wamsutter
According to the labor force statistics for Wamsutter, out of the total population over 16 years of age (217), 80.2% or 174 individuals are in the labor force, with 6.9% or 12 of them unemployed. The age group with the highest labor force participation rate is 25 to 29 years, with 100.0% or 23 individuals in the labor force. Within the labor force, the 55 to 59 years age range has the highest percentage of unemployed individuals, with 10.8% or 12 of them being unemployed.
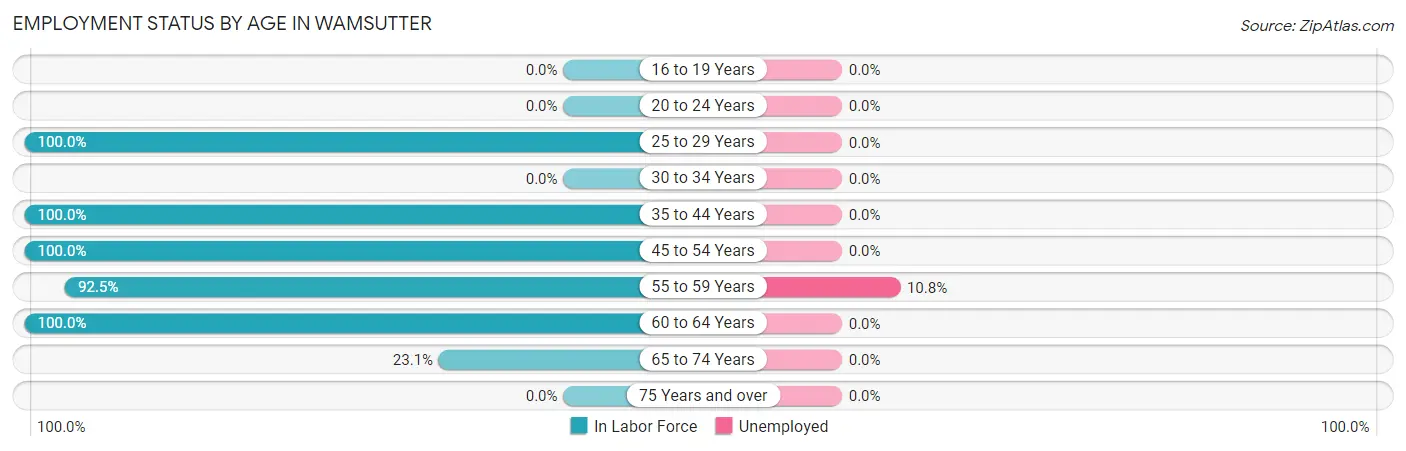
| Age Bracket | In Labor Force | Unemployed |
| 16 to 19 Years | 0 (0.0%) | 0 (0.0%) |
| 20 to 24 Years | 0 (0.0%) | 0 (0.0%) |
| 25 to 29 Years | 23 (100.0%) | 0 (0.0%) |
| 30 to 34 Years | 0 (0.0%) | 0 (0.0%) |
| 35 to 44 Years | 15 (100.0%) | 0 (0.0%) |
| 45 to 54 Years | 12 (100.0%) | 0 (0.0%) |
| 55 to 59 Years | 111 (92.5%) | 12 (10.8%) |
| 60 to 64 Years | 10 (100.0%) | 0 (0.0%) |
| 65 to 74 Years | 3 (23.1%) | 0 (0.0%) |
| 75 Years and over | 0 (0.0%) | 0 (0.0%) |
| Total | 174 (80.2%) | 12 (6.9%) |
Employment Status by Educational Attainment in Wamsutter
According to labor force statistics for Wamsutter, 95.0% of individuals (171) out of the total population between 25 and 64 years of age (180) are in the labor force, with 7.0% or 12 of them being unemployed. The group with the highest labor force participation rate are those with the educational attainment of less than high school, with 100.0% or 21 individuals in the labor force. Within the labor force, individuals with high school diploma education have the highest percentage of unemployment, with 11.7% or 12 of them being unemployed.
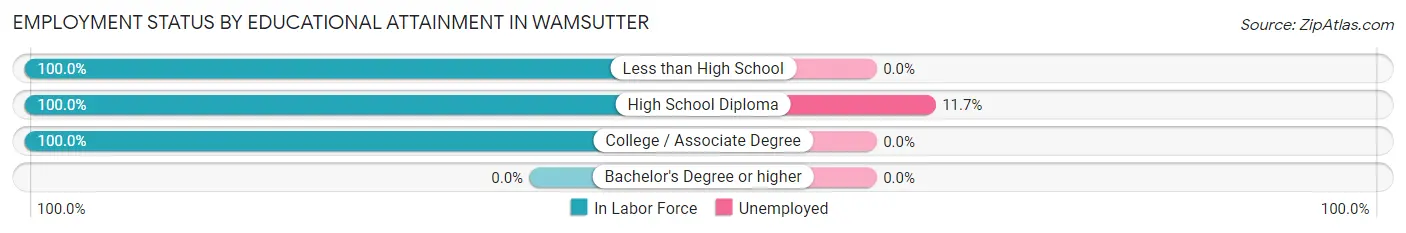
| Educational Attainment | In Labor Force | Unemployed |
| Less than High School | 21 (100.0%) | 0 (0.0%) |
| High School Diploma | 103 (100.0%) | 12 (11.7%) |
| College / Associate Degree | 47 (100.0%) | 0 (0.0%) |
| Bachelor's Degree or higher | 0 (0.0%) | 0 (0.0%) |
| Total | 171 (95.0%) | 13 (7.0%) |
Employment Occupations by Sex in Wamsutter
Management, Business, Science and Arts Occupations
The most common Management, Business, Science and Arts occupations in Wamsutter are , and Management (25 | 15.4%).
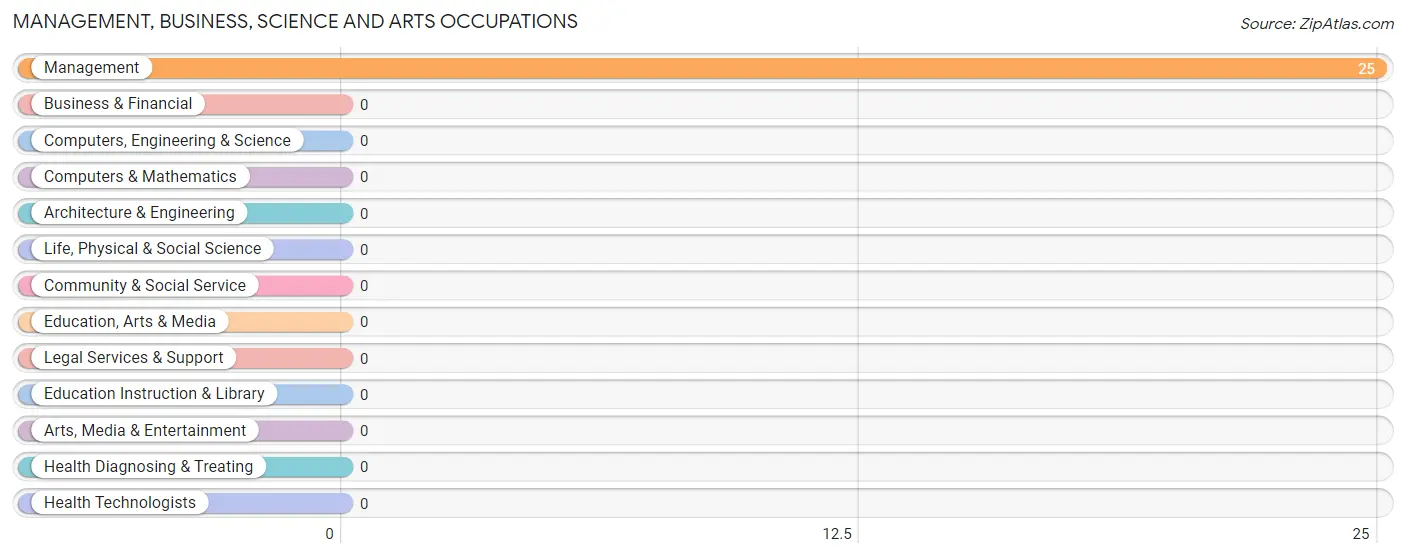
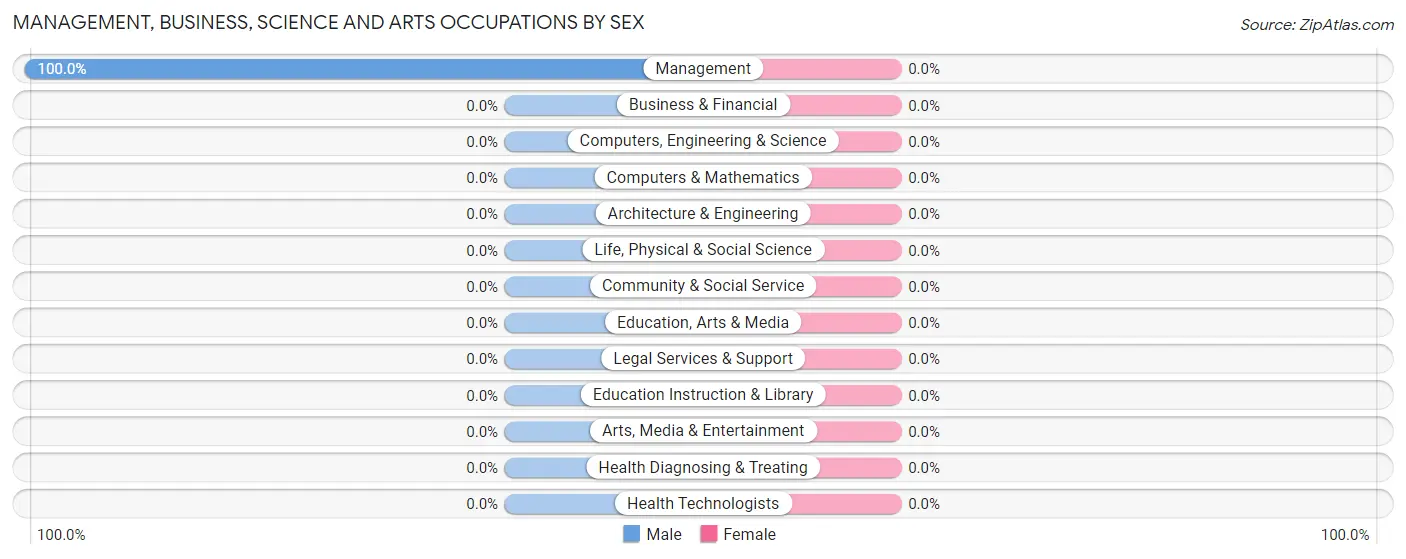
Management, Business, Science and Arts Occupations by Sex
| Occupation | Male | Female |
| Management | 25 (100.0%) | 0 (0.0%) |
| Business & Financial | 0 (0.0%) | 0 (0.0%) |
| Computers, Engineering & Science | 0 (0.0%) | 0 (0.0%) |
| Computers & Mathematics | 0 (0.0%) | 0 (0.0%) |
| Architecture & Engineering | 0 (0.0%) | 0 (0.0%) |
| Life, Physical & Social Science | 0 (0.0%) | 0 (0.0%) |
| Community & Social Service | 0 (0.0%) | 0 (0.0%) |
| Education, Arts & Media | 0 (0.0%) | 0 (0.0%) |
| Legal Services & Support | 0 (0.0%) | 0 (0.0%) |
| Education Instruction & Library | 0 (0.0%) | 0 (0.0%) |
| Arts, Media & Entertainment | 0 (0.0%) | 0 (0.0%) |
| Health Diagnosing & Treating | 0 (0.0%) | 0 (0.0%) |
| Health Technologists | 0 (0.0%) | 0 (0.0%) |
| Total (Category) | 25 (100.0%) | 0 (0.0%) |
| Total (Overall) | 129 (79.6%) | 33 (20.4%) |
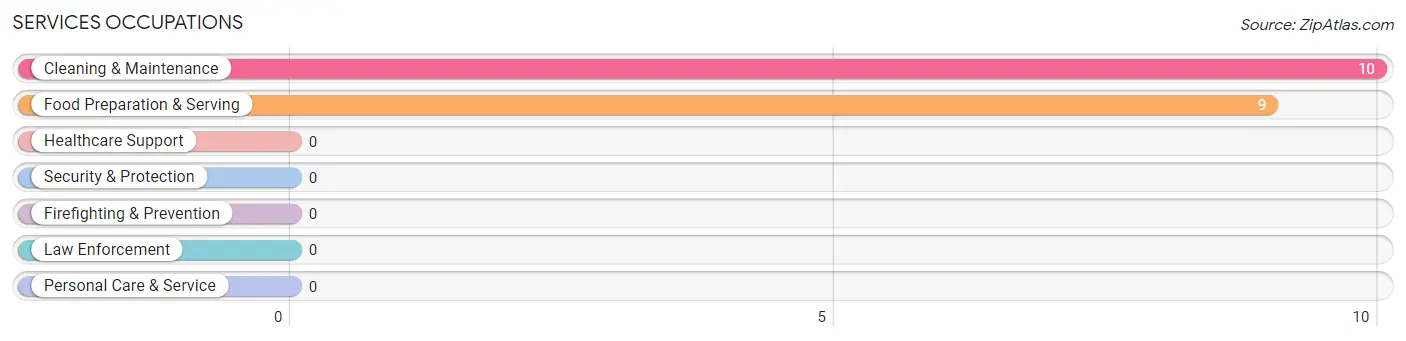
Services Occupations
The most common Services occupations in Wamsutter are Cleaning & Maintenance (10 | 6.2%), and Food Preparation & Serving (9 | 5.6%).
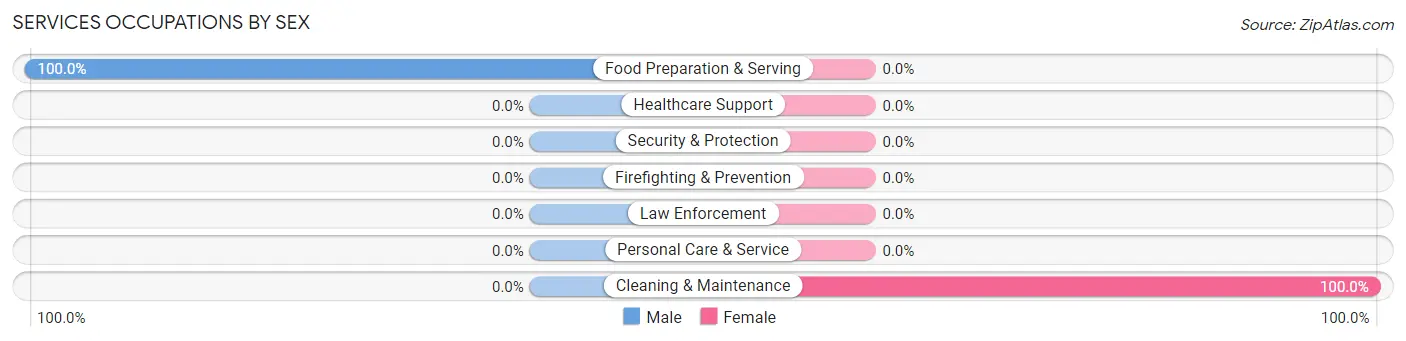
Services Occupations by Sex
| Occupation | Male | Female |
| Healthcare Support | 0 (0.0%) | 0 (0.0%) |
| Security & Protection | 0 (0.0%) | 0 (0.0%) |
| Firefighting & Prevention | 0 (0.0%) | 0 (0.0%) |
| Law Enforcement | 0 (0.0%) | 0 (0.0%) |
| Food Preparation & Serving | 9 (100.0%) | 0 (0.0%) |
| Cleaning & Maintenance | 0 (0.0%) | 10 (100.0%) |
| Personal Care & Service | 0 (0.0%) | 0 (0.0%) |
| Total (Category) | 9 (47.4%) | 10 (52.6%) |
| Total (Overall) | 129 (79.6%) | 33 (20.4%) |
Sales and Office Occupations
The most common Sales and Office occupations in Wamsutter are , and Sales & Related (26 | 16.1%).
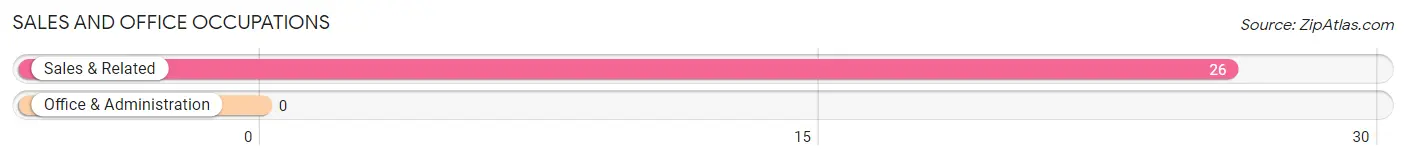
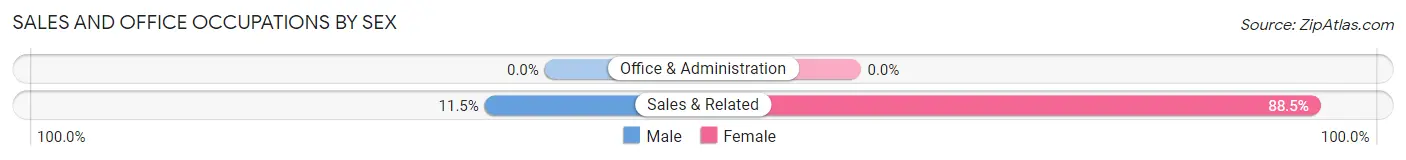
Sales and Office Occupations by Sex
| Occupation | Male | Female |
| Sales & Related | 3 (11.5%) | 23 (88.5%) |
| Office & Administration | 0 (0.0%) | 0 (0.0%) |
| Total (Category) | 3 (11.5%) | 23 (88.5%) |
| Total (Overall) | 129 (79.6%) | 33 (20.4%) |
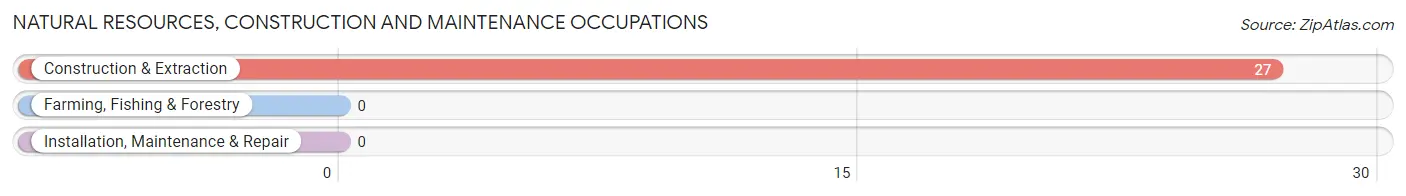
Natural Resources, Construction and Maintenance Occupations
The most common Natural Resources, Construction and Maintenance occupations in Wamsutter are , and Construction & Extraction (27 | 16.7%).
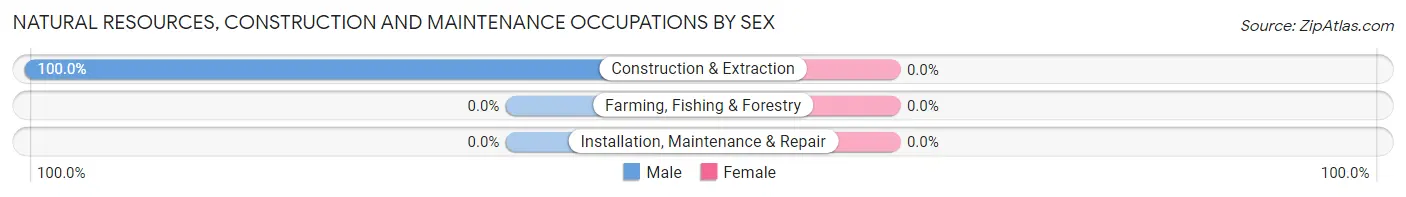
Natural Resources, Construction and Maintenance Occupations by Sex
| Occupation | Male | Female |
| Farming, Fishing & Forestry | 0 (0.0%) | 0 (0.0%) |
| Construction & Extraction | 27 (100.0%) | 0 (0.0%) |
| Installation, Maintenance & Repair | 0 (0.0%) | 0 (0.0%) |
| Total (Category) | 27 (100.0%) | 0 (0.0%) |
| Total (Overall) | 129 (79.6%) | 33 (20.4%) |
Production, Transportation and Moving Occupations
The most common Production, Transportation and Moving occupations in Wamsutter are Transportation (60 | 37.0%), and Production (5 | 3.1%).
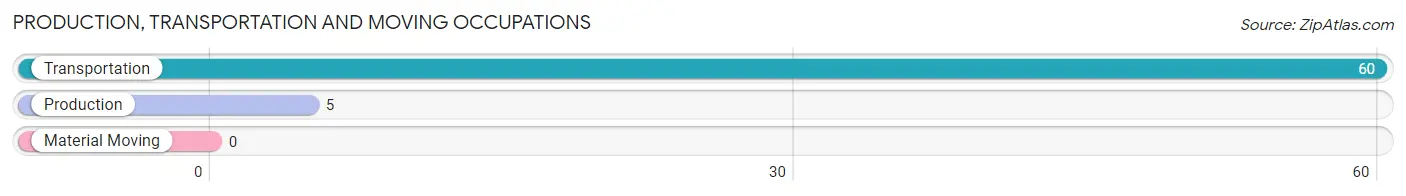
Production, Transportation and Moving Occupations by Sex
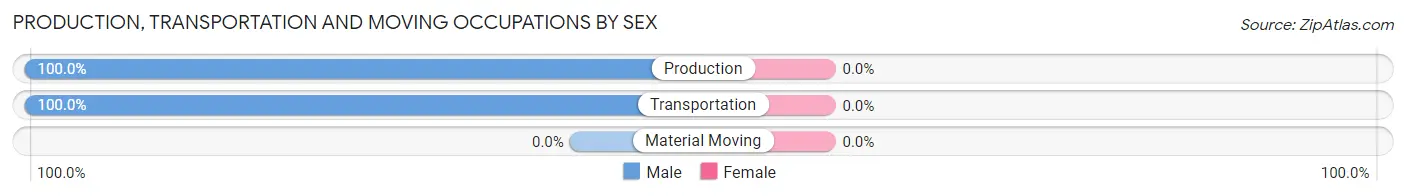
| Occupation | Male | Female |
| Production | 5 (100.0%) | 0 (0.0%) |
| Transportation | 60 (100.0%) | 0 (0.0%) |
| Material Moving | 0 (0.0%) | 0 (0.0%) |
| Total (Category) | 65 (100.0%) | 0 (0.0%) |
| Total (Overall) | 129 (79.6%) | 33 (20.4%) |
Employment Industries by Sex in Wamsutter
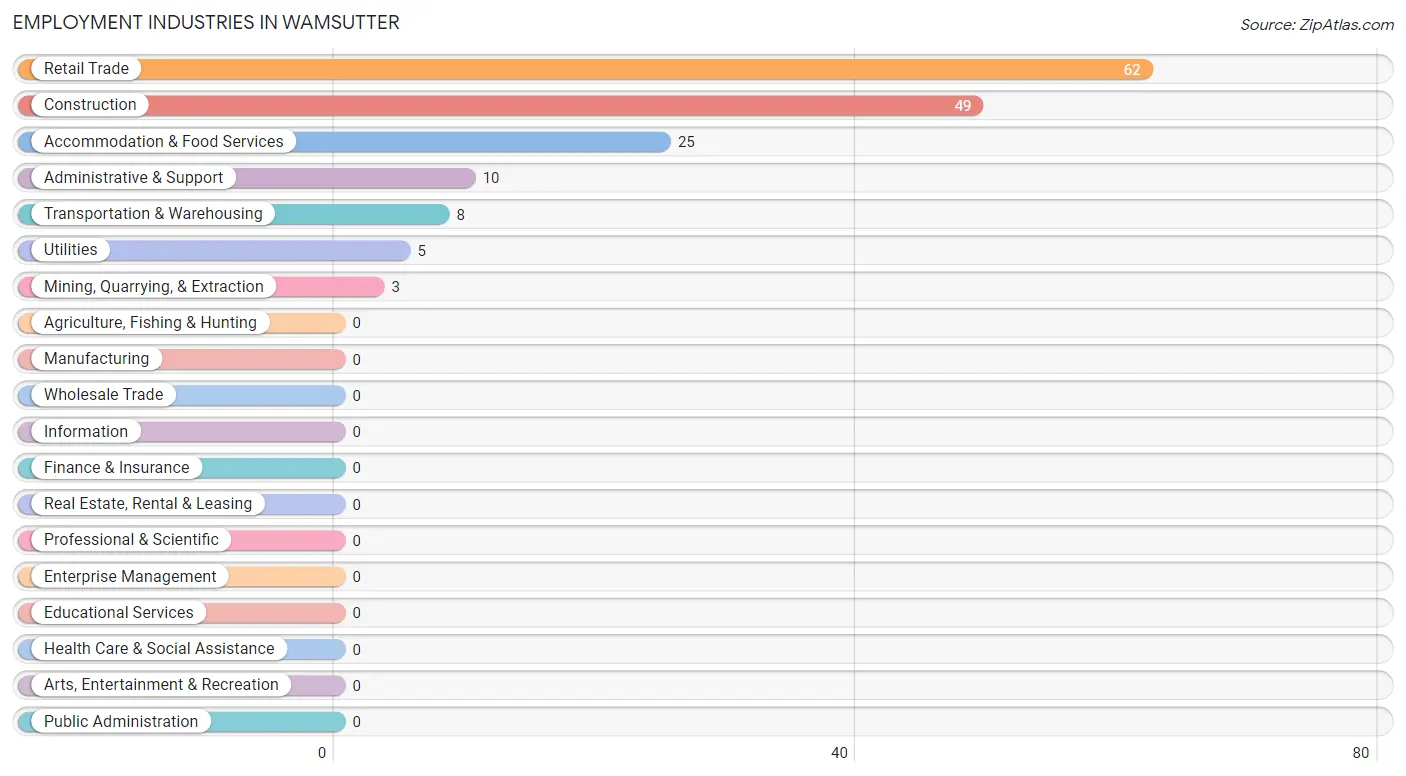
Employment Industries in Wamsutter
The major employment industries in Wamsutter include Retail Trade (62 | 38.3%), Construction (49 | 30.2%), Accommodation & Food Services (25 | 15.4%), Administrative & Support (10 | 6.2%), and Transportation & Warehousing (8 | 4.9%).
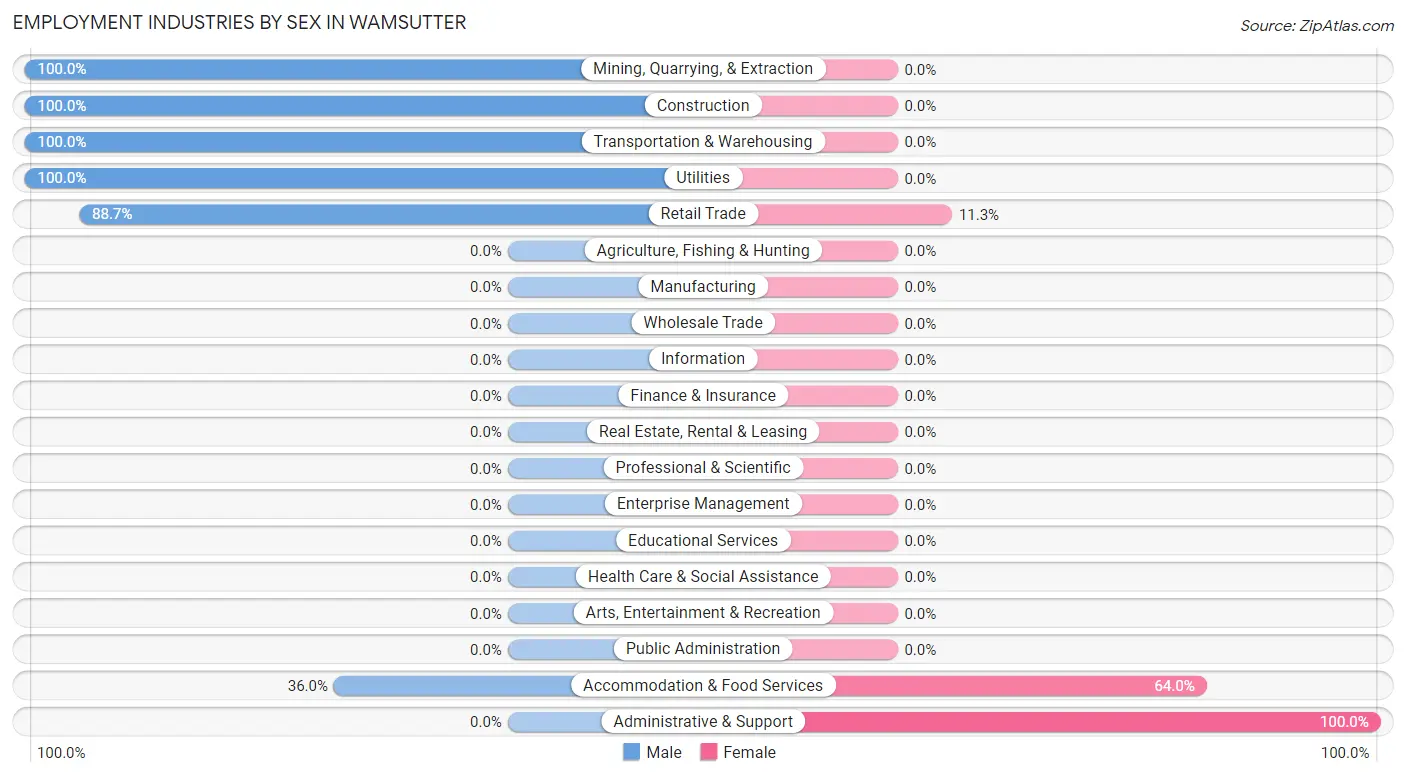
Employment Industries by Sex in Wamsutter
The Wamsutter industries that see more men than women are Mining, Quarrying, & Extraction (100.0%), Construction (100.0%), and Transportation & Warehousing (100.0%), whereas the industries that tend to have a higher number of women are Administrative & Support (100.0%), Accommodation & Food Services (64.0%), and Retail Trade (11.3%).
| Industry | Male | Female |
| Agriculture, Fishing & Hunting | 0 (0.0%) | 0 (0.0%) |
| Mining, Quarrying, & Extraction | 3 (100.0%) | 0 (0.0%) |
| Construction | 49 (100.0%) | 0 (0.0%) |
| Manufacturing | 0 (0.0%) | 0 (0.0%) |
| Wholesale Trade | 0 (0.0%) | 0 (0.0%) |
| Retail Trade | 55 (88.7%) | 7 (11.3%) |
| Transportation & Warehousing | 8 (100.0%) | 0 (0.0%) |
| Utilities | 5 (100.0%) | 0 (0.0%) |
| Information | 0 (0.0%) | 0 (0.0%) |
| Finance & Insurance | 0 (0.0%) | 0 (0.0%) |
| Real Estate, Rental & Leasing | 0 (0.0%) | 0 (0.0%) |
| Professional & Scientific | 0 (0.0%) | 0 (0.0%) |
| Enterprise Management | 0 (0.0%) | 0 (0.0%) |
| Administrative & Support | 0 (0.0%) | 10 (100.0%) |
| Educational Services | 0 (0.0%) | 0 (0.0%) |
| Health Care & Social Assistance | 0 (0.0%) | 0 (0.0%) |
| Arts, Entertainment & Recreation | 0 (0.0%) | 0 (0.0%) |
| Accommodation & Food Services | 9 (36.0%) | 16 (64.0%) |
| Public Administration | 0 (0.0%) | 0 (0.0%) |
| Total | 129 (79.6%) | 33 (20.4%) |
Education in Wamsutter
School Enrollment in Wamsutter
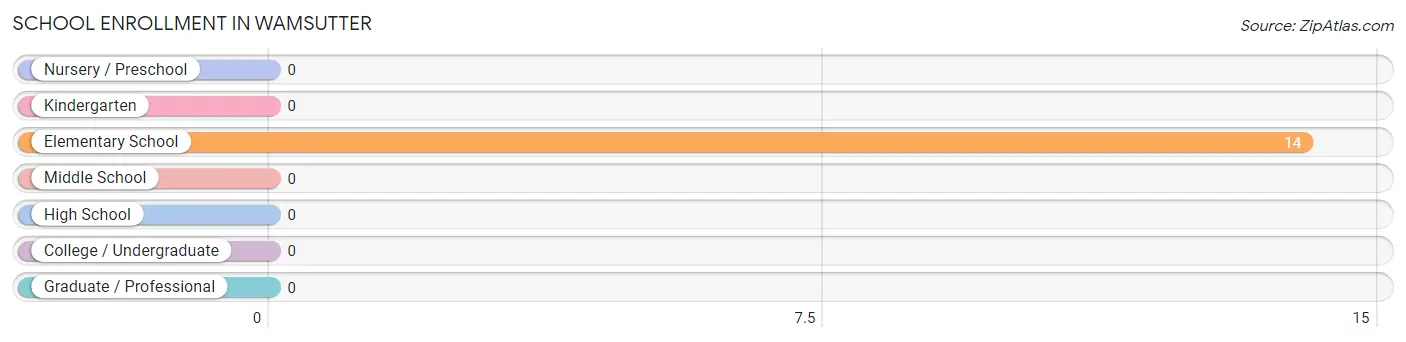
| School Level | # Students | % Students |
| Nursery / Preschool | 0 | 0.0% |
| Kindergarten | 0 | 0.0% |
| Elementary School | 14 | 100.0% |
| Middle School | 0 | 0.0% |
| High School | 0 | 0.0% |
| College / Undergraduate | 0 | 0.0% |
| Graduate / Professional | 0 | 0.0% |
| Total | 14 | 100.0% |
School Enrollment by Age by Funding Source in Wamsutter
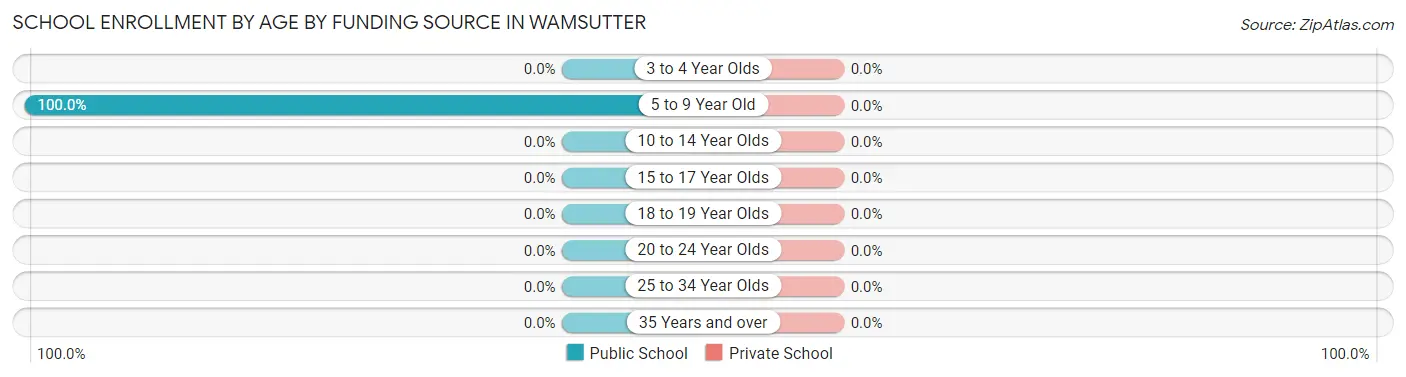
| Age Bracket | Public School | Private School |
| 3 to 4 Year Olds | 0 (0.0%) | 0 (0.0%) |
| 5 to 9 Year Old | 14 (100.0%) | 0 (0.0%) |
| 10 to 14 Year Olds | 0 (0.0%) | 0 (0.0%) |
| 15 to 17 Year Olds | 0 (0.0%) | 0 (0.0%) |
| 18 to 19 Year Olds | 0 (0.0%) | 0 (0.0%) |
| 20 to 24 Year Olds | 0 (0.0%) | 0 (0.0%) |
| 25 to 34 Year Olds | 0 (0.0%) | 0 (0.0%) |
| 35 Years and over | 0 (0.0%) | 0 (0.0%) |
| Total | 14 (100.0%) | 0 (0.0%) |
Educational Attainment by Field of Study in Wamsutter
Liberal arts & history (9 | 50.0%), and visual & performing arts (9 | 50.0%) are the most common fields of study among 18 individuals in Wamsutter who have obtained a bachelor's degree or higher.
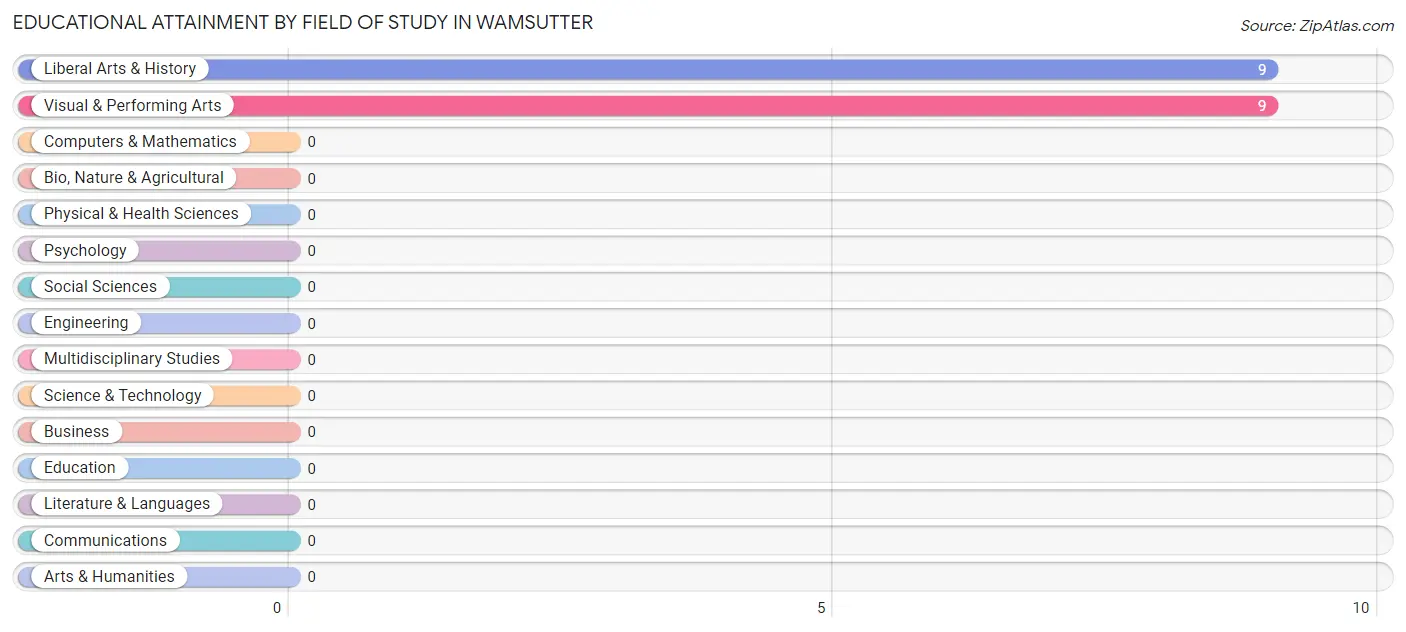
| Field of Study | # Graduates | % Graduates |
| Computers & Mathematics | 0 | 0.0% |
| Bio, Nature & Agricultural | 0 | 0.0% |
| Physical & Health Sciences | 0 | 0.0% |
| Psychology | 0 | 0.0% |
| Social Sciences | 0 | 0.0% |
| Engineering | 0 | 0.0% |
| Multidisciplinary Studies | 0 | 0.0% |
| Science & Technology | 0 | 0.0% |
| Business | 0 | 0.0% |
| Education | 0 | 0.0% |
| Literature & Languages | 0 | 0.0% |
| Liberal Arts & History | 9 | 50.0% |
| Visual & Performing Arts | 9 | 50.0% |
| Communications | 0 | 0.0% |
| Arts & Humanities | 0 | 0.0% |
| Total | 18 | 100.0% |
Transportation & Commute in Wamsutter
Vehicle Availability by Sex in Wamsutter
The most prevalent vehicle ownership categories in Wamsutter are males with 3 vehicles (92, accounting for 71.3%) and females with 3 vehicles (6, making up 278.8%).
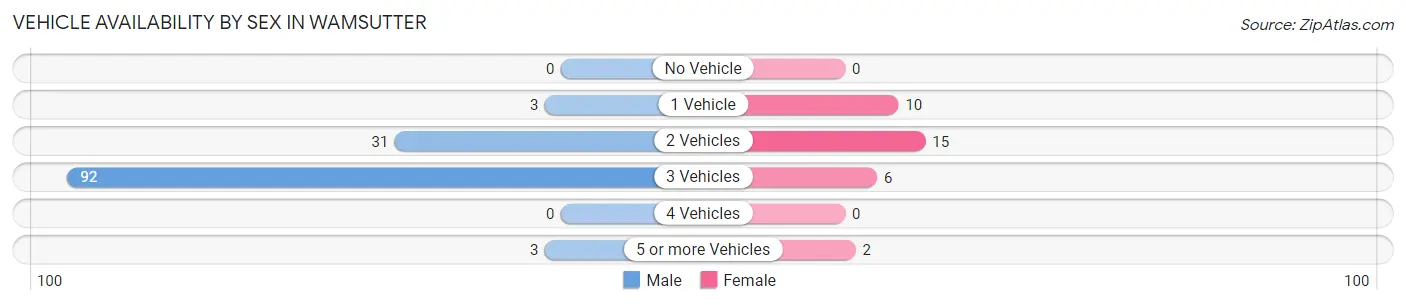
| Vehicles Available | Male | Female |
| No Vehicle | 0 (0.0%) | 0 (0.0%) |
| 1 Vehicle | 3 (2.3%) | 10 (30.3%) |
| 2 Vehicles | 31 (24.0%) | 15 (45.5%) |
| 3 Vehicles | 92 (71.3%) | 6 (18.2%) |
| 4 Vehicles | 0 (0.0%) | 0 (0.0%) |
| 5 or more Vehicles | 3 (2.3%) | 2 (6.1%) |
| Total | 129 (100.0%) | 33 (100.0%) |
Commute Time in Wamsutter
The most frequently occuring commute durations in Wamsutter are 5 to 9 minutes (60 commuters, 39.0%), 45 to 59 minutes (52 commuters, 33.8%), and less than 5 minutes (15 commuters, 9.7%).
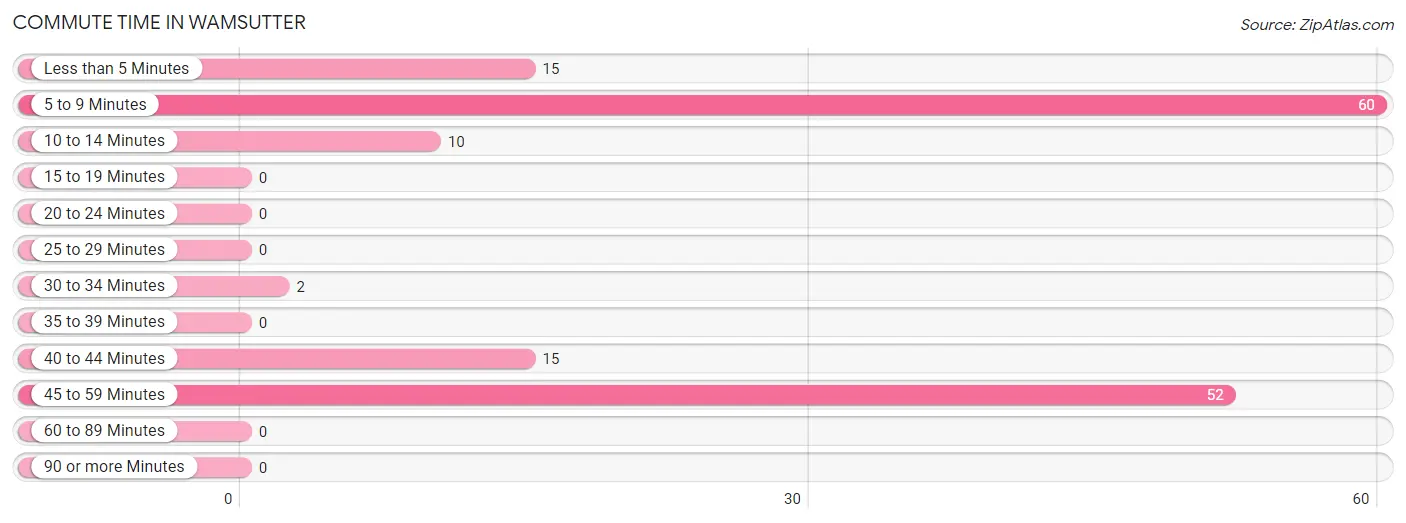
| Commute Time | # Commuters | % Commuters |
| Less than 5 Minutes | 15 | 9.7% |
| 5 to 9 Minutes | 60 | 39.0% |
| 10 to 14 Minutes | 10 | 6.5% |
| 15 to 19 Minutes | 0 | 0.0% |
| 20 to 24 Minutes | 0 | 0.0% |
| 25 to 29 Minutes | 0 | 0.0% |
| 30 to 34 Minutes | 2 | 1.3% |
| 35 to 39 Minutes | 0 | 0.0% |
| 40 to 44 Minutes | 15 | 9.7% |
| 45 to 59 Minutes | 52 | 33.8% |
| 60 to 89 Minutes | 0 | 0.0% |
| 90 or more Minutes | 0 | 0.0% |
Commute Time by Sex in Wamsutter
The most common commute times in Wamsutter are 45 to 59 minutes (52 commuters, 43.0%) for males and 5 to 9 minutes (21 commuters, 63.6%) for females.
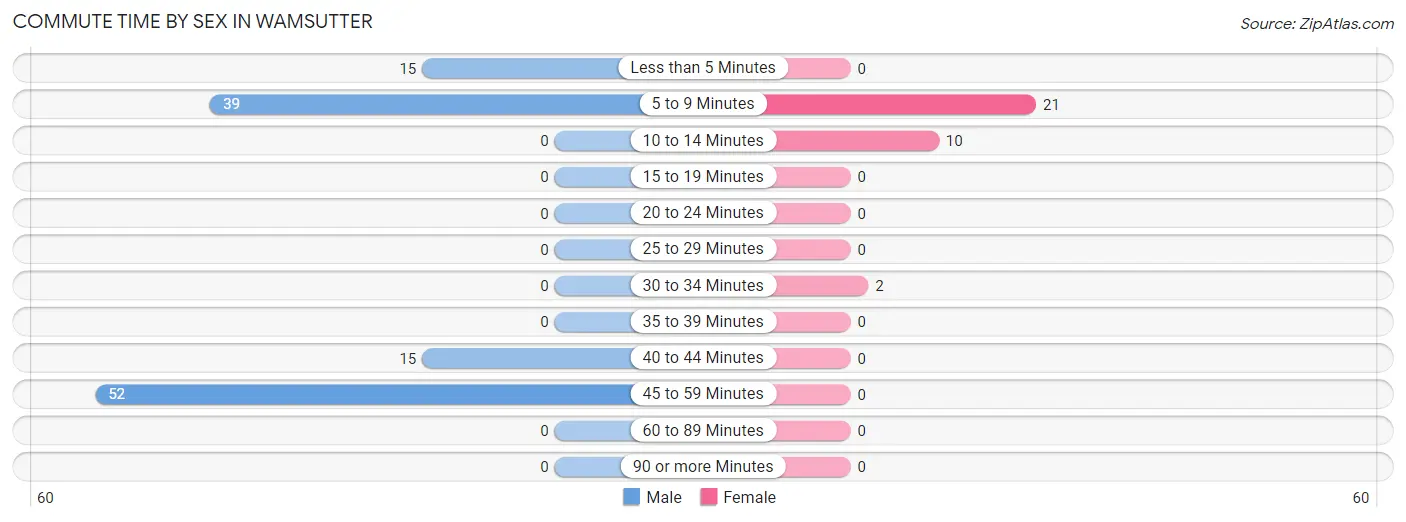
| Commute Time | Male | Female |
| Less than 5 Minutes | 15 (12.4%) | 0 (0.0%) |
| 5 to 9 Minutes | 39 (32.2%) | 21 (63.6%) |
| 10 to 14 Minutes | 0 (0.0%) | 10 (30.3%) |
| 15 to 19 Minutes | 0 (0.0%) | 0 (0.0%) |
| 20 to 24 Minutes | 0 (0.0%) | 0 (0.0%) |
| 25 to 29 Minutes | 0 (0.0%) | 0 (0.0%) |
| 30 to 34 Minutes | 0 (0.0%) | 2 (6.1%) |
| 35 to 39 Minutes | 0 (0.0%) | 0 (0.0%) |
| 40 to 44 Minutes | 15 (12.4%) | 0 (0.0%) |
| 45 to 59 Minutes | 52 (43.0%) | 0 (0.0%) |
| 60 to 89 Minutes | 0 (0.0%) | 0 (0.0%) |
| 90 or more Minutes | 0 (0.0%) | 0 (0.0%) |
Time of Departure to Work by Sex in Wamsutter
The most frequent times of departure to work in Wamsutter are 5:00 AM to 5:29 AM (52, 43.0%) for males and 5:00 AM to 5:29 AM (11, 33.3%) for females.
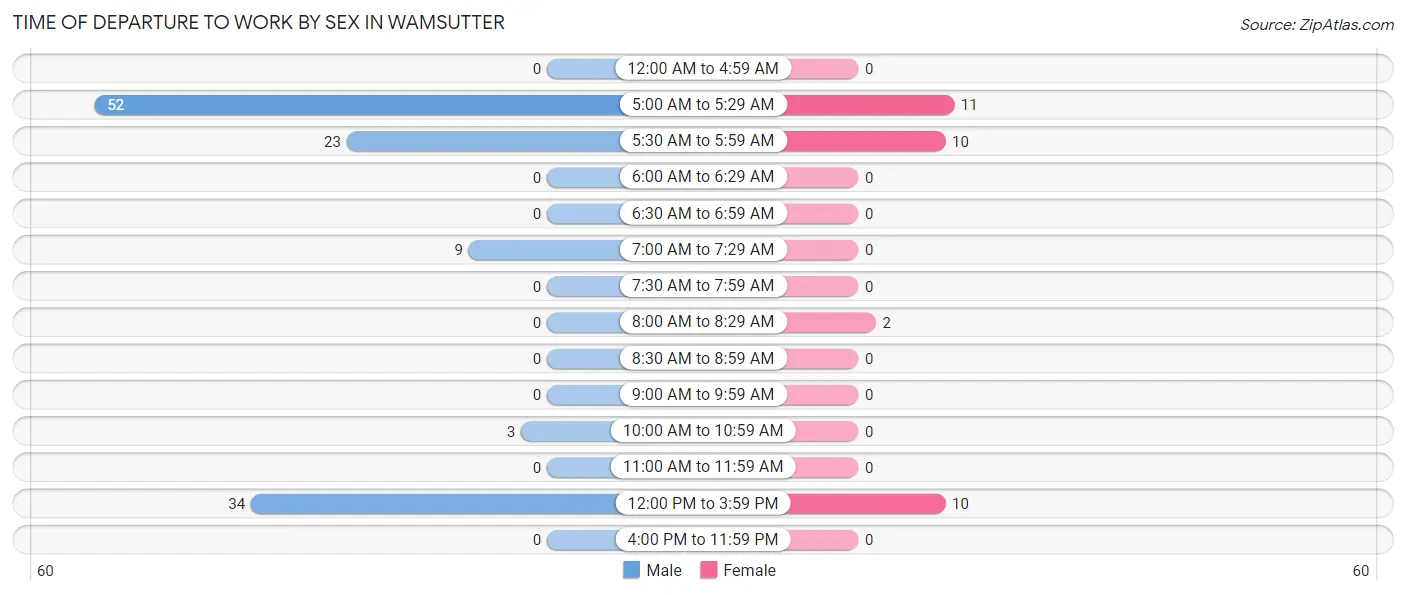
| Time of Departure | Male | Female |
| 12:00 AM to 4:59 AM | 0 (0.0%) | 0 (0.0%) |
| 5:00 AM to 5:29 AM | 52 (43.0%) | 11 (33.3%) |
| 5:30 AM to 5:59 AM | 23 (19.0%) | 10 (30.3%) |
| 6:00 AM to 6:29 AM | 0 (0.0%) | 0 (0.0%) |
| 6:30 AM to 6:59 AM | 0 (0.0%) | 0 (0.0%) |
| 7:00 AM to 7:29 AM | 9 (7.4%) | 0 (0.0%) |
| 7:30 AM to 7:59 AM | 0 (0.0%) | 0 (0.0%) |
| 8:00 AM to 8:29 AM | 0 (0.0%) | 2 (6.1%) |
| 8:30 AM to 8:59 AM | 0 (0.0%) | 0 (0.0%) |
| 9:00 AM to 9:59 AM | 0 (0.0%) | 0 (0.0%) |
| 10:00 AM to 10:59 AM | 3 (2.5%) | 0 (0.0%) |
| 11:00 AM to 11:59 AM | 0 (0.0%) | 0 (0.0%) |
| 12:00 PM to 3:59 PM | 34 (28.1%) | 10 (30.3%) |
| 4:00 PM to 11:59 PM | 0 (0.0%) | 0 (0.0%) |
| Total | 121 (100.0%) | 33 (100.0%) |
Housing Occupancy in Wamsutter
Occupancy by Ownership in Wamsutter
Of the total 89 dwellings in Wamsutter, owner-occupied units account for 41 (46.1%), while renter-occupied units make up 48 (53.9%).
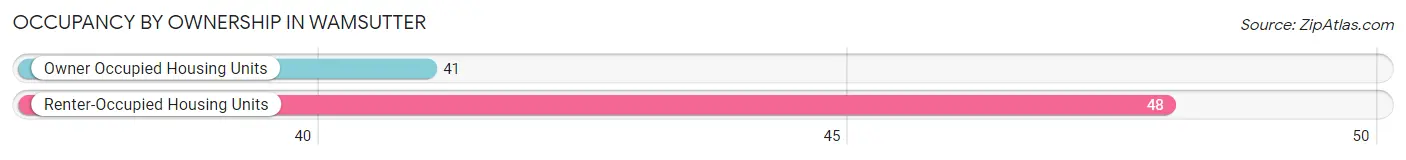
| Occupancy | # Housing Units | % Housing Units |
| Owner Occupied Housing Units | 41 | 46.1% |
| Renter-Occupied Housing Units | 48 | 53.9% |
| Total Occupied Housing Units | 89 | 100.0% |
Occupancy by Household Size in Wamsutter
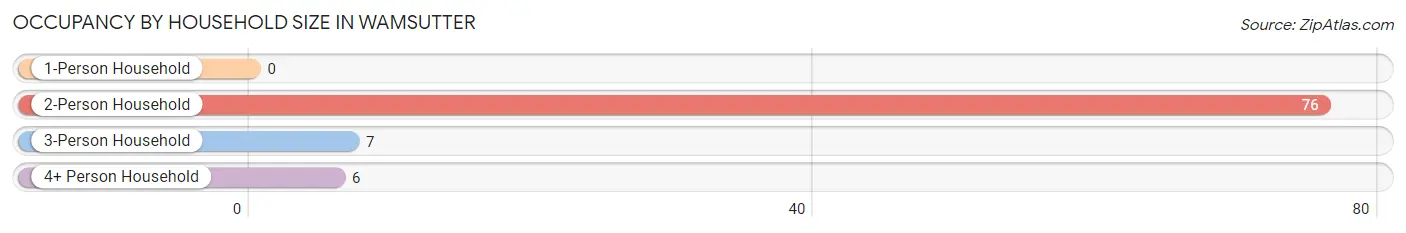
| Household Size | # Housing Units | % Housing Units |
| 1-Person Household | 0 | 0.0% |
| 2-Person Household | 76 | 85.4% |
| 3-Person Household | 7 | 7.9% |
| 4+ Person Household | 6 | 6.7% |
| Total Housing Units | 89 | 100.0% |
Occupancy by Ownership by Household Size in Wamsutter
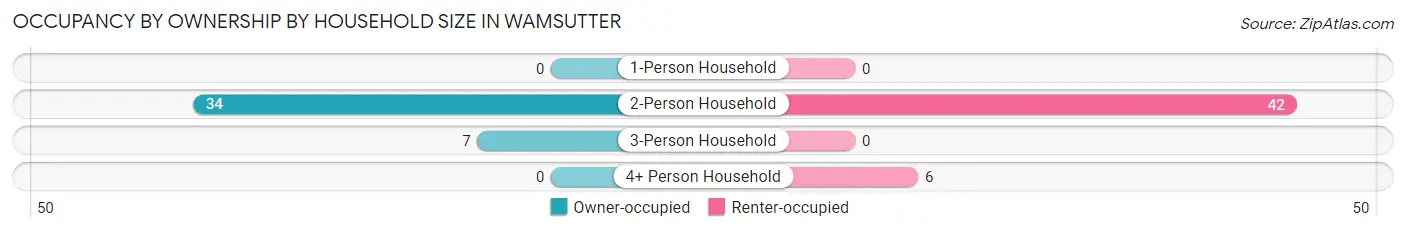
| Household Size | Owner-occupied | Renter-occupied |
| 1-Person Household | 0 (0.0%) | 0 (0.0%) |
| 2-Person Household | 34 (44.7%) | 42 (55.3%) |
| 3-Person Household | 7 (100.0%) | 0 (0.0%) |
| 4+ Person Household | 0 (0.0%) | 6 (100.0%) |
| Total Housing Units | 41 (46.1%) | 48 (53.9%) |
Occupancy by Educational Attainment in Wamsutter
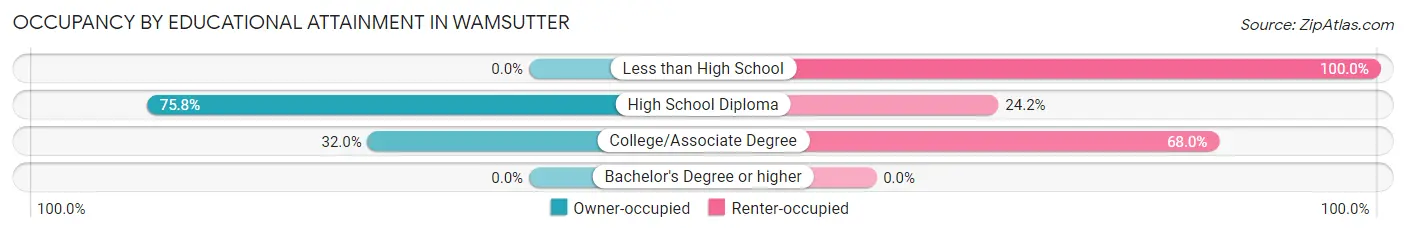
| Household Size | Owner-occupied | Renter-occupied |
| Less than High School | 0 (0.0%) | 6 (100.0%) |
| High School Diploma | 25 (75.8%) | 8 (24.2%) |
| College/Associate Degree | 16 (32.0%) | 34 (68.0%) |
| Bachelor's Degree or higher | 0 (0.0%) | 0 (0.0%) |
Occupancy by Age of Householder in Wamsutter
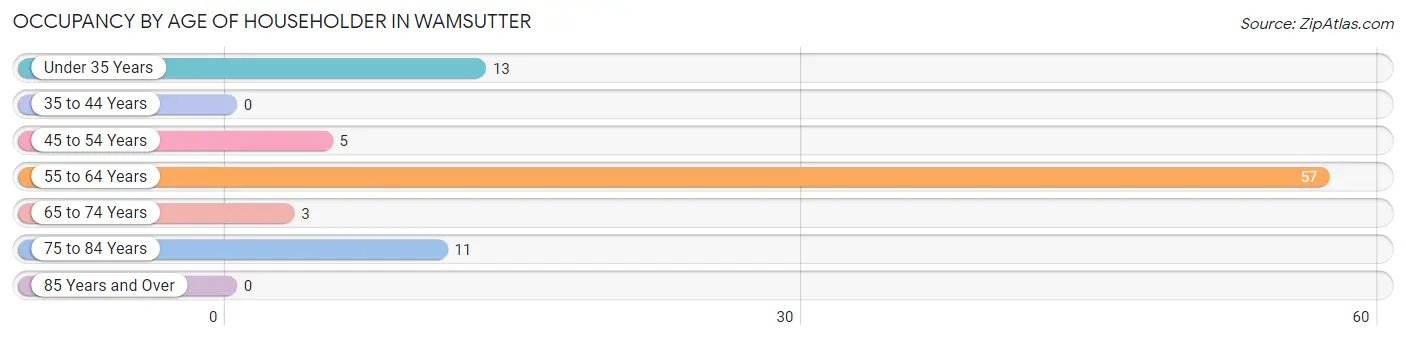
| Age Bracket | # Households | % Households |
| Under 35 Years | 13 | 14.6% |
| 35 to 44 Years | 0 | 0.0% |
| 45 to 54 Years | 5 | 5.6% |
| 55 to 64 Years | 57 | 64.0% |
| 65 to 74 Years | 3 | 3.4% |
| 75 to 84 Years | 11 | 12.4% |
| 85 Years and Over | 0 | 0.0% |
| Total | 89 | 100.0% |
Housing Finances in Wamsutter
Median Income by Occupancy in Wamsutter
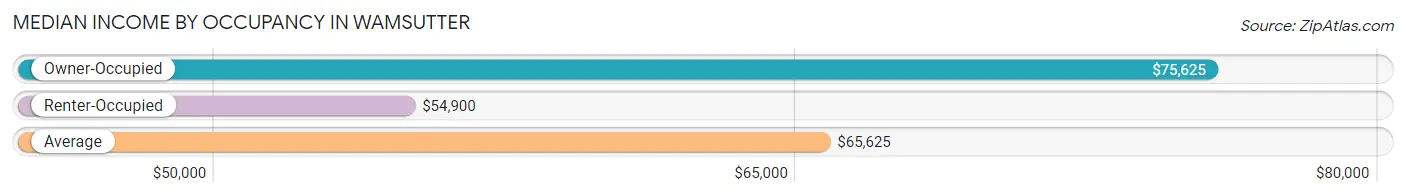
| Occupancy Type | # Households | Median Income |
| Owner-Occupied | 41 (46.1%) | $75,625 |
| Renter-Occupied | 48 (53.9%) | $54,900 |
| Average | 89 (100.0%) | $65,625 |
Occupancy by Householder Income Bracket in Wamsutter
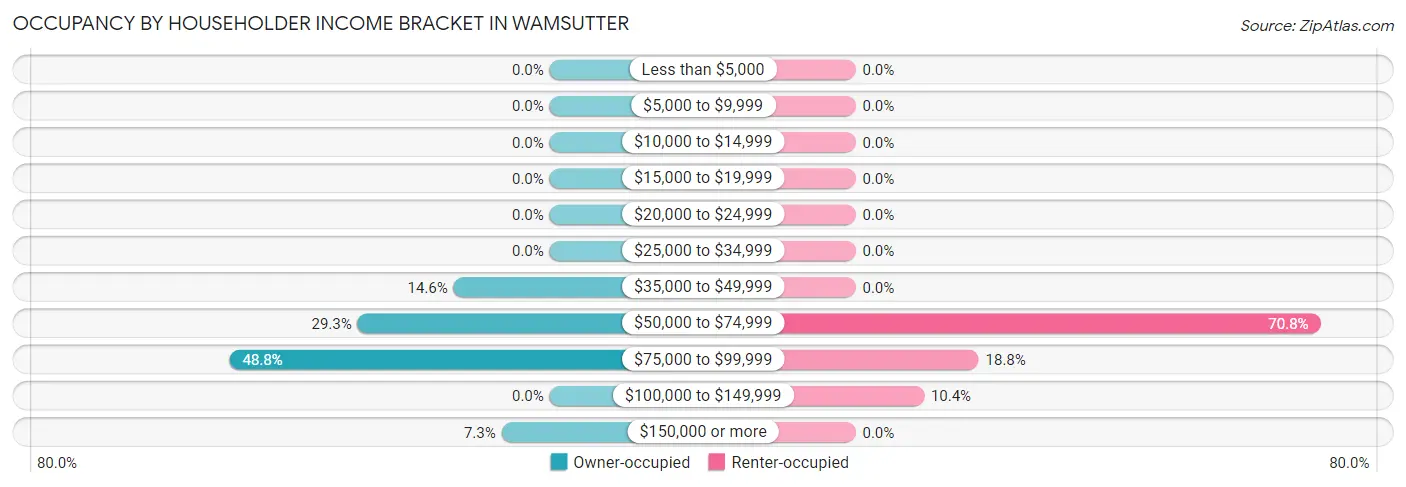
| Income Bracket | Owner-occupied | Renter-occupied |
| Less than $5,000 | 0 (0.0%) | 0 (0.0%) |
| $5,000 to $9,999 | 0 (0.0%) | 0 (0.0%) |
| $10,000 to $14,999 | 0 (0.0%) | 0 (0.0%) |
| $15,000 to $19,999 | 0 (0.0%) | 0 (0.0%) |
| $20,000 to $24,999 | 0 (0.0%) | 0 (0.0%) |
| $25,000 to $34,999 | 0 (0.0%) | 0 (0.0%) |
| $35,000 to $49,999 | 6 (14.6%) | 0 (0.0%) |
| $50,000 to $74,999 | 12 (29.3%) | 34 (70.8%) |
| $75,000 to $99,999 | 20 (48.8%) | 9 (18.8%) |
| $100,000 to $149,999 | 0 (0.0%) | 5 (10.4%) |
| $150,000 or more | 3 (7.3%) | 0 (0.0%) |
| Total | 41 (100.0%) | 48 (100.0%) |
Monthly Housing Cost Tiers in Wamsutter
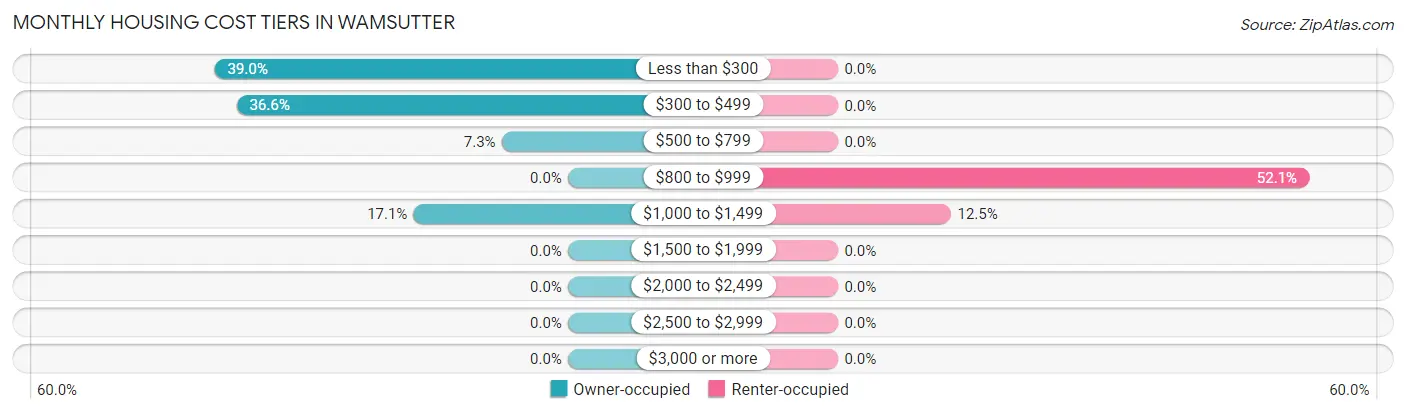
| Monthly Cost | Owner-occupied | Renter-occupied |
| Less than $300 | 16 (39.0%) | 0 (0.0%) |
| $300 to $499 | 15 (36.6%) | 0 (0.0%) |
| $500 to $799 | 3 (7.3%) | 0 (0.0%) |
| $800 to $999 | 0 (0.0%) | 25 (52.1%) |
| $1,000 to $1,499 | 7 (17.1%) | 6 (12.5%) |
| $1,500 to $1,999 | 0 (0.0%) | 0 (0.0%) |
| $2,000 to $2,499 | 0 (0.0%) | 0 (0.0%) |
| $2,500 to $2,999 | 0 (0.0%) | 0 (0.0%) |
| $3,000 or more | 0 (0.0%) | 0 (0.0%) |
| Total | 41 (100.0%) | 48 (100.0%) |
Physical Housing Characteristics in Wamsutter
Housing Structures in Wamsutter
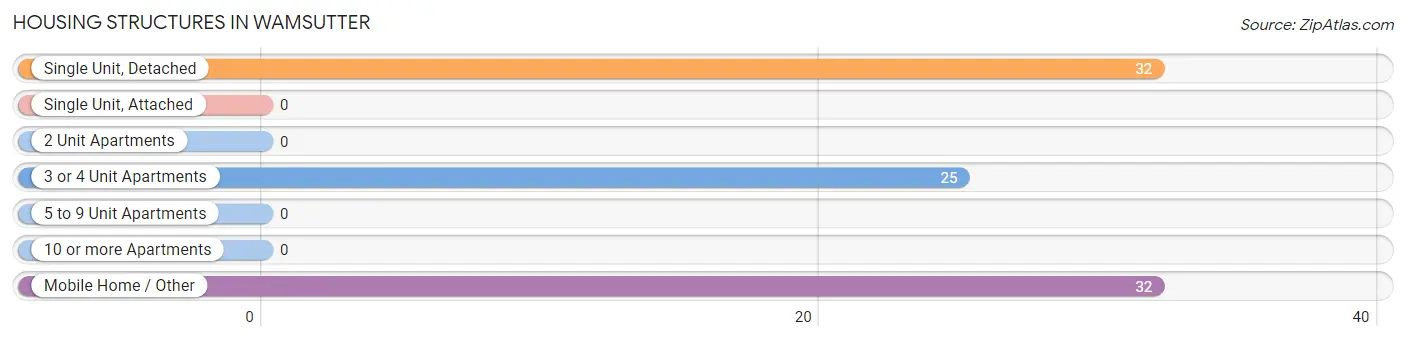
| Structure Type | # Housing Units | % Housing Units |
| Single Unit, Detached | 32 | 36.0% |
| Single Unit, Attached | 0 | 0.0% |
| 2 Unit Apartments | 0 | 0.0% |
| 3 or 4 Unit Apartments | 25 | 28.1% |
| 5 to 9 Unit Apartments | 0 | 0.0% |
| 10 or more Apartments | 0 | 0.0% |
| Mobile Home / Other | 32 | 36.0% |
| Total | 89 | 100.0% |
Housing Structures by Occupancy in Wamsutter
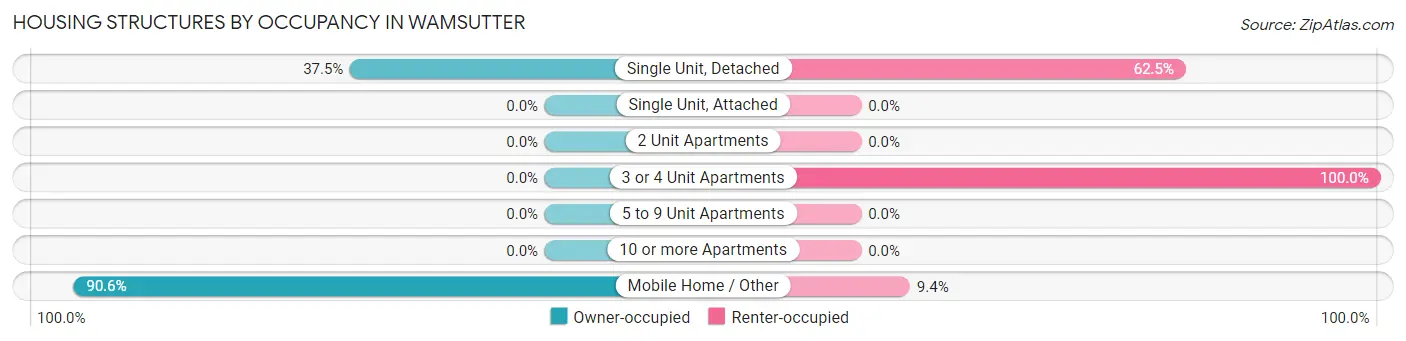
| Structure Type | Owner-occupied | Renter-occupied |
| Single Unit, Detached | 12 (37.5%) | 20 (62.5%) |
| Single Unit, Attached | 0 (0.0%) | 0 (0.0%) |
| 2 Unit Apartments | 0 (0.0%) | 0 (0.0%) |
| 3 or 4 Unit Apartments | 0 (0.0%) | 25 (100.0%) |
| 5 to 9 Unit Apartments | 0 (0.0%) | 0 (0.0%) |
| 10 or more Apartments | 0 (0.0%) | 0 (0.0%) |
| Mobile Home / Other | 29 (90.6%) | 3 (9.4%) |
| Total | 41 (46.1%) | 48 (53.9%) |
Housing Structures by Number of Rooms in Wamsutter
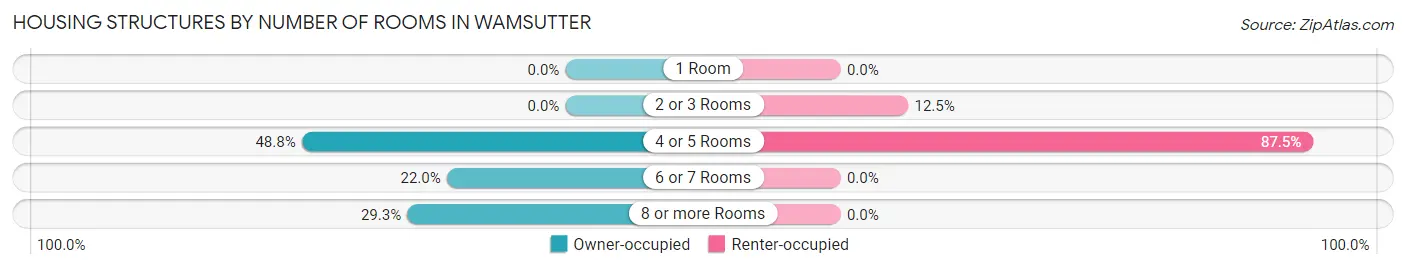
| Number of Rooms | Owner-occupied | Renter-occupied |
| 1 Room | 0 (0.0%) | 0 (0.0%) |
| 2 or 3 Rooms | 0 (0.0%) | 6 (12.5%) |
| 4 or 5 Rooms | 20 (48.8%) | 42 (87.5%) |
| 6 or 7 Rooms | 9 (22.0%) | 0 (0.0%) |
| 8 or more Rooms | 12 (29.3%) | 0 (0.0%) |
| Total | 41 (100.0%) | 48 (100.0%) |
Housing Structure by Heating Type in Wamsutter
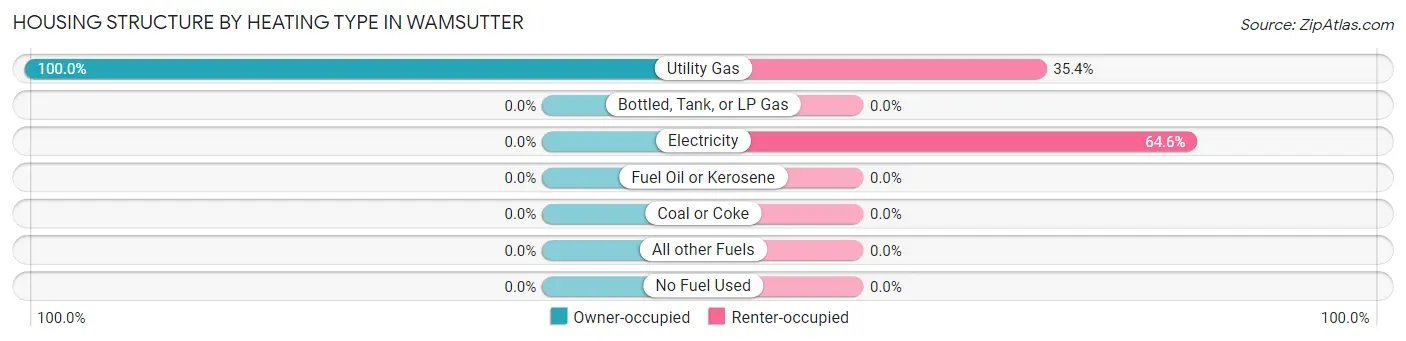
| Heating Type | Owner-occupied | Renter-occupied |
| Utility Gas | 41 (100.0%) | 17 (35.4%) |
| Bottled, Tank, or LP Gas | 0 (0.0%) | 0 (0.0%) |
| Electricity | 0 (0.0%) | 31 (64.6%) |
| Fuel Oil or Kerosene | 0 (0.0%) | 0 (0.0%) |
| Coal or Coke | 0 (0.0%) | 0 (0.0%) |
| All other Fuels | 0 (0.0%) | 0 (0.0%) |
| No Fuel Used | 0 (0.0%) | 0 (0.0%) |
| Total | 41 (100.0%) | 48 (100.0%) |
Household Vehicle Usage in Wamsutter
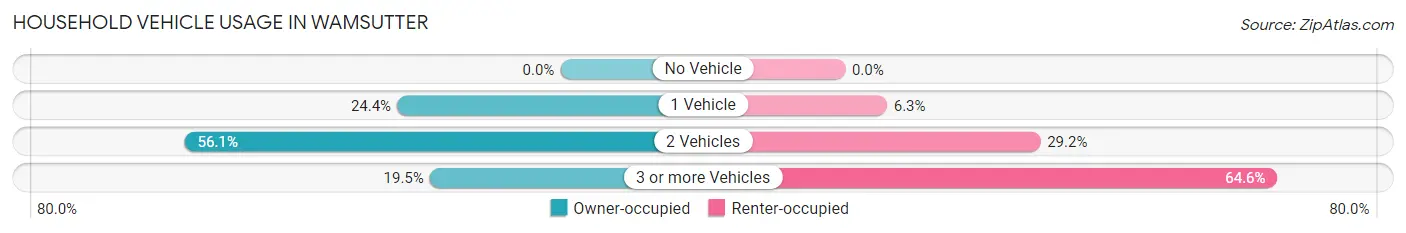
| Vehicles per Household | Owner-occupied | Renter-occupied |
| No Vehicle | 0 (0.0%) | 0 (0.0%) |
| 1 Vehicle | 10 (24.4%) | 3 (6.2%) |
| 2 Vehicles | 23 (56.1%) | 14 (29.2%) |
| 3 or more Vehicles | 8 (19.5%) | 31 (64.6%) |
| Total | 41 (100.0%) | 48 (100.0%) |
Real Estate & Mortgages in Wamsutter
Real Estate and Mortgage Overview in Wamsutter
| Characteristic | Without Mortgage | With Mortgage |
| Housing Units | 34 | 7 |
| Median Property Value | - | - |
| Median Household Income | $76,500 | $0 |
| Monthly Housing Costs | - | - |
| Real Estate Taxes | - | - |
Property Value by Mortgage Status in Wamsutter
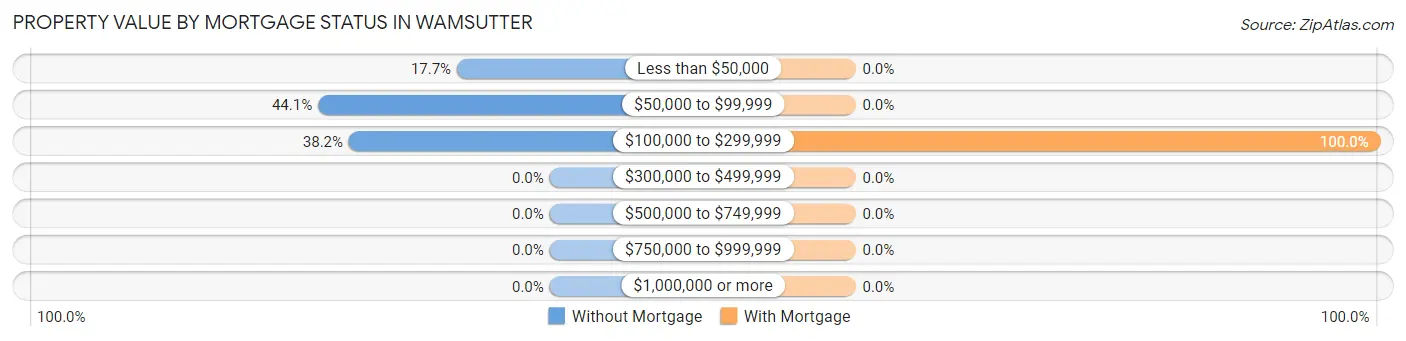
| Property Value | Without Mortgage | With Mortgage |
| Less than $50,000 | 6 (17.6%) | 0 (0.0%) |
| $50,000 to $99,999 | 15 (44.1%) | 0 (0.0%) |
| $100,000 to $299,999 | 13 (38.2%) | 7 (100.0%) |
| $300,000 to $499,999 | 0 (0.0%) | 0 (0.0%) |
| $500,000 to $749,999 | 0 (0.0%) | 0 (0.0%) |
| $750,000 to $999,999 | 0 (0.0%) | 0 (0.0%) |
| $1,000,000 or more | 0 (0.0%) | 0 (0.0%) |
| Total | 34 (100.0%) | 7 (100.0%) |
Household Income by Mortgage Status in Wamsutter
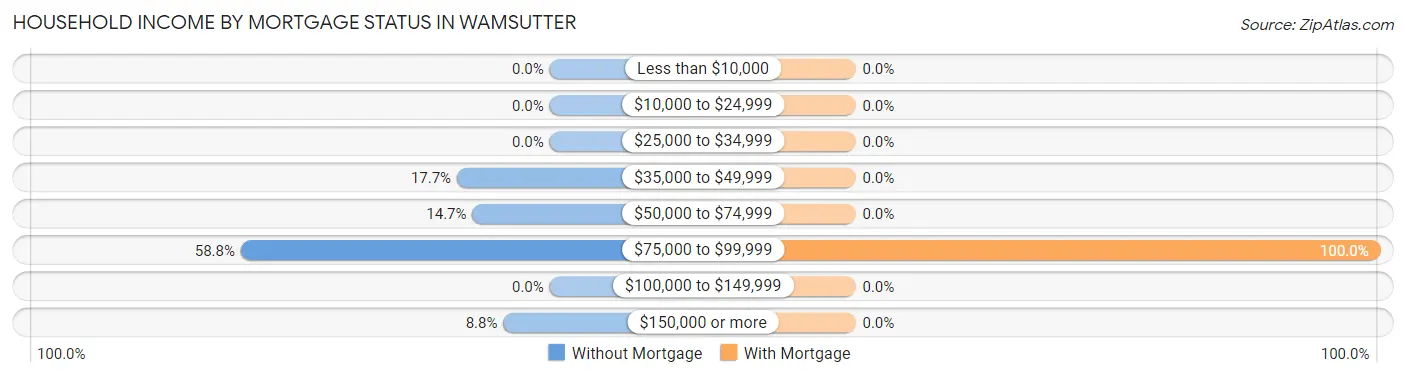
| Household Income | Without Mortgage | With Mortgage |
| Less than $10,000 | 0 (0.0%) | 0 (0.0%) |
| $10,000 to $24,999 | 0 (0.0%) | 0 (0.0%) |
| $25,000 to $34,999 | 0 (0.0%) | 0 (0.0%) |
| $35,000 to $49,999 | 6 (17.6%) | 0 (0.0%) |
| $50,000 to $74,999 | 5 (14.7%) | 0 (0.0%) |
| $75,000 to $99,999 | 20 (58.8%) | 7 (100.0%) |
| $100,000 to $149,999 | 0 (0.0%) | 0 (0.0%) |
| $150,000 or more | 3 (8.8%) | 0 (0.0%) |
| Total | 34 (100.0%) | 7 (100.0%) |
Property Value to Household Income Ratio in Wamsutter

| Value-to-Income Ratio | Without Mortgage | With Mortgage |
| Less than 2.0x | 24 (70.6%) | 0 (0.0%) |
| 2.0x to 2.9x | 0 (0.0%) | 0 (0.0%) |
| 3.0x to 3.9x | 10 (29.4%) | 0 (0.0%) |
| 4.0x or more | 0 (0.0%) | 7 (100.0%) |
| Total | 34 (100.0%) | 7 (100.0%) |
Real Estate Taxes by Mortgage Status in Wamsutter
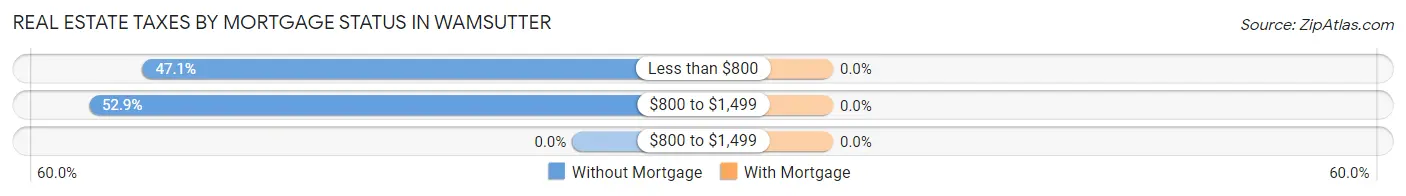
| Property Taxes | Without Mortgage | With Mortgage |
| Less than $800 | 16 (47.1%) | 0 (0.0%) |
| $800 to $1,499 | 18 (52.9%) | 0 (0.0%) |
| $800 to $1,499 | 0 (0.0%) | 0 (0.0%) |
| Total | 34 (100.0%) | 7 (100.0%) |
Health & Disability in Wamsutter
Health Insurance Coverage by Age in Wamsutter
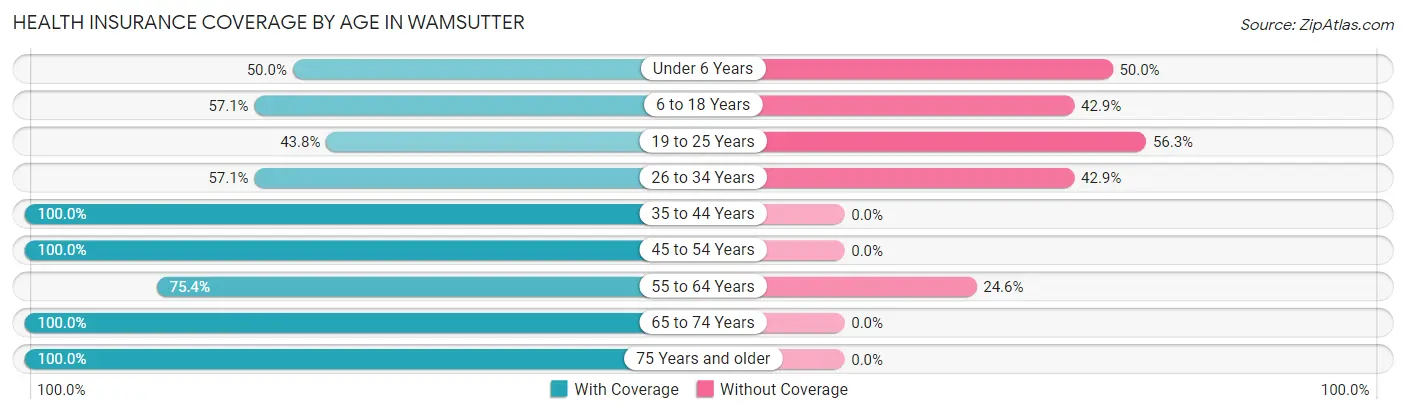
| Age Bracket | With Coverage | Without Coverage |
| Under 6 Years | 10 (50.0%) | 10 (50.0%) |
| 6 to 18 Years | 8 (57.1%) | 6 (42.9%) |
| 19 to 25 Years | 7 (43.8%) | 9 (56.2%) |
| 26 to 34 Years | 8 (57.1%) | 6 (42.9%) |
| 35 to 44 Years | 15 (100.0%) | 0 (0.0%) |
| 45 to 54 Years | 12 (100.0%) | 0 (0.0%) |
| 55 to 64 Years | 98 (75.4%) | 32 (24.6%) |
| 65 to 74 Years | 13 (100.0%) | 0 (0.0%) |
| 75 Years and older | 17 (100.0%) | 0 (0.0%) |
| Total | 188 (74.9%) | 63 (25.1%) |
Health Insurance Coverage by Citizenship Status in Wamsutter
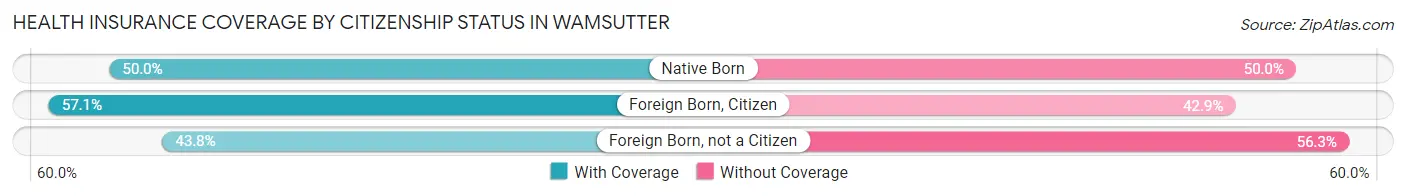
| Citizenship Status | With Coverage | Without Coverage |
| Native Born | 10 (50.0%) | 10 (50.0%) |
| Foreign Born, Citizen | 8 (57.1%) | 6 (42.9%) |
| Foreign Born, not a Citizen | 7 (43.8%) | 9 (56.2%) |
Health Insurance Coverage by Household Income in Wamsutter
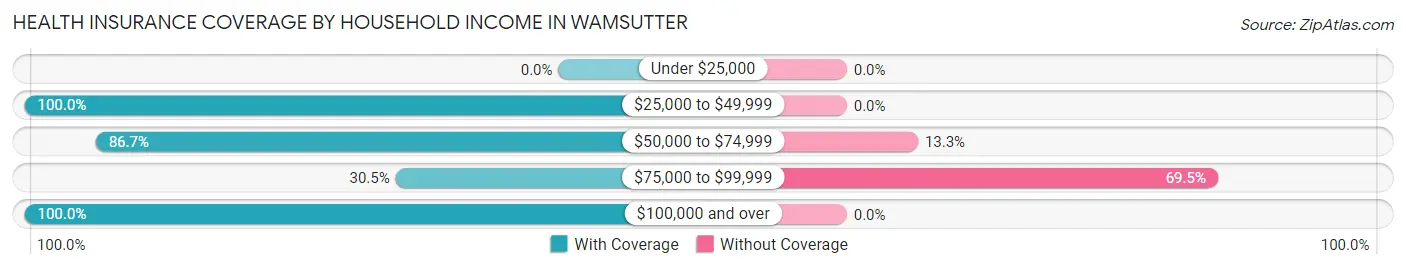
| Household Income | With Coverage | Without Coverage |
| Under $25,000 | 0 (0.0%) | 0 (0.0%) |
| $25,000 to $49,999 | 12 (100.0%) | 0 (0.0%) |
| $50,000 to $74,999 | 143 (86.7%) | 22 (13.3%) |
| $75,000 to $99,999 | 18 (30.5%) | 41 (69.5%) |
| $100,000 and over | 15 (100.0%) | 0 (0.0%) |
Public vs Private Health Insurance Coverage by Age in Wamsutter
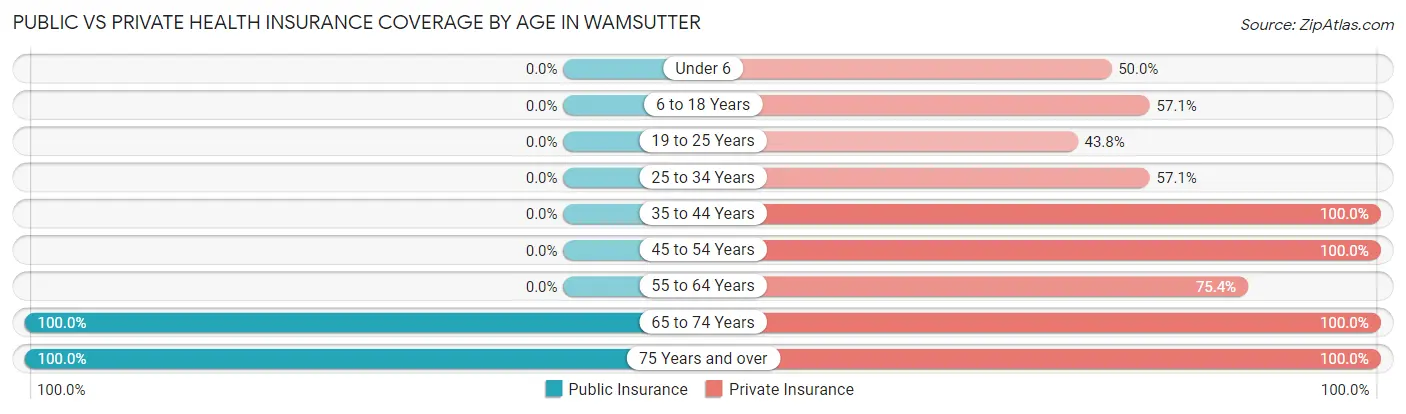
| Age Bracket | Public Insurance | Private Insurance |
| Under 6 | 0 (0.0%) | 10 (50.0%) |
| 6 to 18 Years | 0 (0.0%) | 8 (57.1%) |
| 19 to 25 Years | 0 (0.0%) | 7 (43.8%) |
| 25 to 34 Years | 0 (0.0%) | 8 (57.1%) |
| 35 to 44 Years | 0 (0.0%) | 15 (100.0%) |
| 45 to 54 Years | 0 (0.0%) | 12 (100.0%) |
| 55 to 64 Years | 0 (0.0%) | 98 (75.4%) |
| 65 to 74 Years | 13 (100.0%) | 13 (100.0%) |
| 75 Years and over | 17 (100.0%) | 17 (100.0%) |
| Total | 30 (11.9%) | 188 (74.9%) |
Disability Status by Sex by Age in Wamsutter
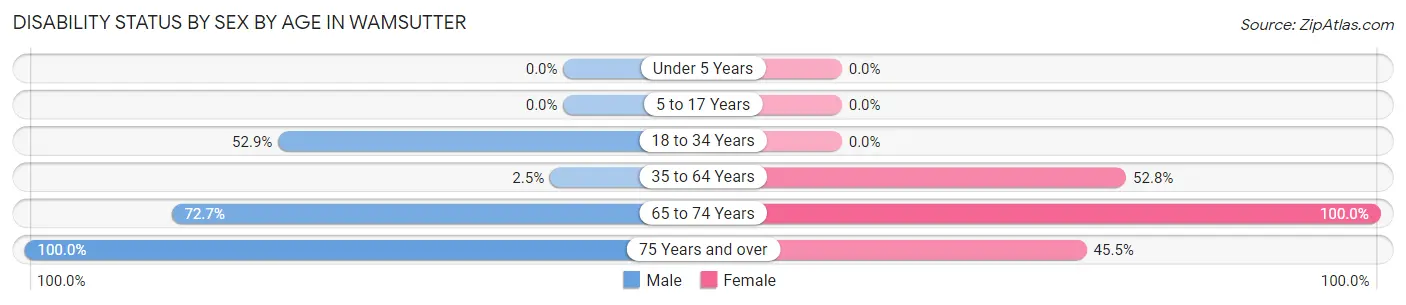
| Age Bracket | Male | Female |
| Under 5 Years | 0 (0.0%) | 0 (0.0%) |
| 5 to 17 Years | 0 (0.0%) | 0 (0.0%) |
| 18 to 34 Years | 9 (52.9%) | 0 (0.0%) |
| 35 to 64 Years | 3 (2.5%) | 19 (52.8%) |
| 65 to 74 Years | 8 (72.7%) | 2 (100.0%) |
| 75 Years and over | 6 (100.0%) | 5 (45.5%) |
Disability Class by Sex by Age in Wamsutter
Disability Class: Hearing Difficulty
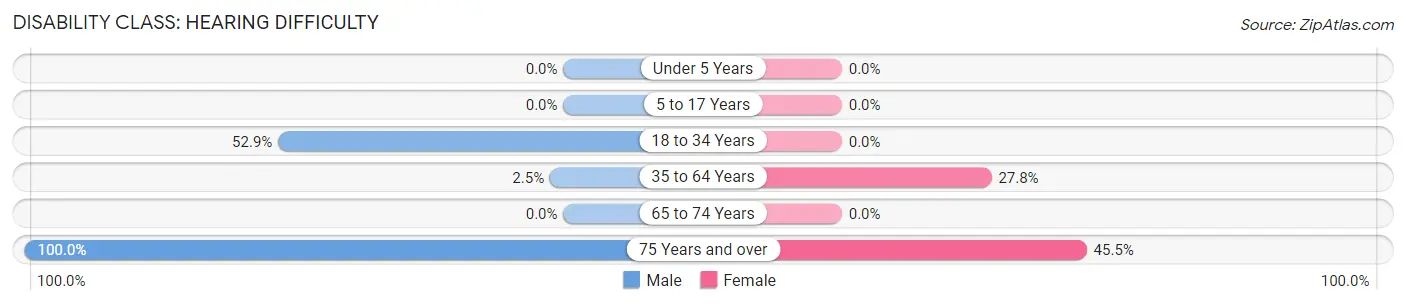
| Age Bracket | Male | Female |
| Under 5 Years | 0 (0.0%) | 0 (0.0%) |
| 5 to 17 Years | 0 (0.0%) | 0 (0.0%) |
| 18 to 34 Years | 9 (52.9%) | 0 (0.0%) |
| 35 to 64 Years | 3 (2.5%) | 10 (27.8%) |
| 65 to 74 Years | 0 (0.0%) | 0 (0.0%) |
| 75 Years and over | 6 (100.0%) | 5 (45.5%) |
Disability Class: Vision Difficulty
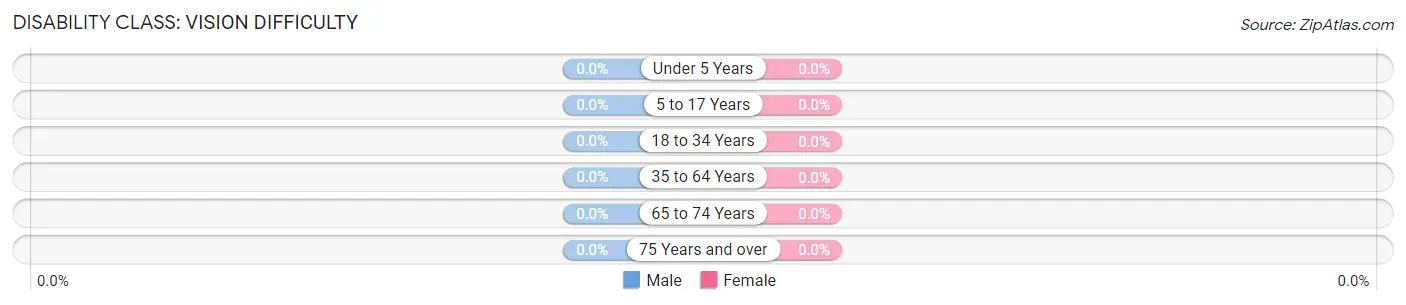
| Age Bracket | Male | Female |
| Under 5 Years | 0 (0.0%) | 0 (0.0%) |
| 5 to 17 Years | 0 (0.0%) | 0 (0.0%) |
| 18 to 34 Years | 0 (0.0%) | 0 (0.0%) |
| 35 to 64 Years | 0 (0.0%) | 0 (0.0%) |
| 65 to 74 Years | 0 (0.0%) | 0 (0.0%) |
| 75 Years and over | 0 (0.0%) | 0 (0.0%) |
Disability Class: Cognitive Difficulty
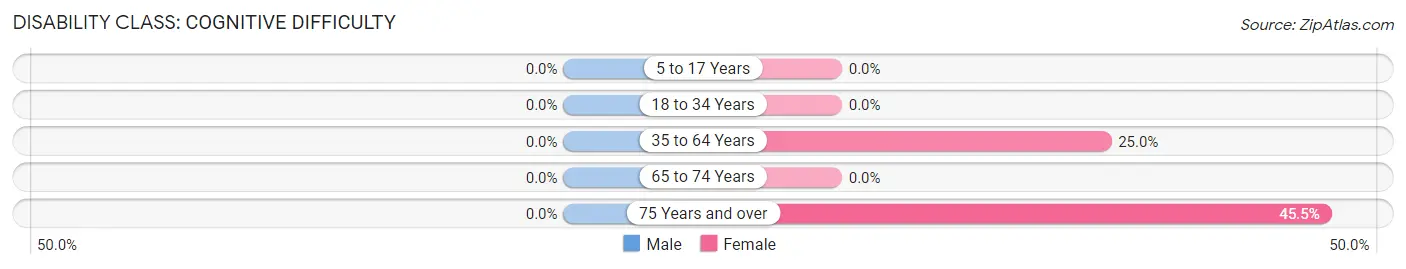
| Age Bracket | Male | Female |
| 5 to 17 Years | 0 (0.0%) | 0 (0.0%) |
| 18 to 34 Years | 0 (0.0%) | 0 (0.0%) |
| 35 to 64 Years | 0 (0.0%) | 9 (25.0%) |
| 65 to 74 Years | 0 (0.0%) | 0 (0.0%) |
| 75 Years and over | 0 (0.0%) | 5 (45.5%) |
Disability Class: Ambulatory Difficulty
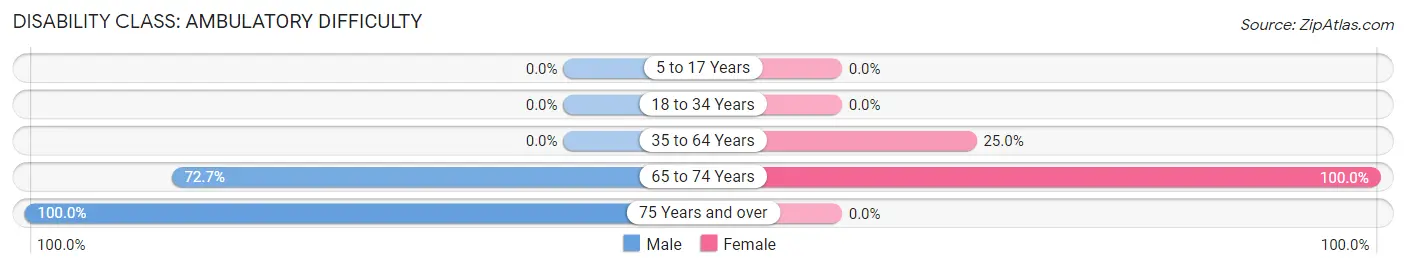
| Age Bracket | Male | Female |
| 5 to 17 Years | 0 (0.0%) | 0 (0.0%) |
| 18 to 34 Years | 0 (0.0%) | 0 (0.0%) |
| 35 to 64 Years | 0 (0.0%) | 9 (25.0%) |
| 65 to 74 Years | 8 (72.7%) | 2 (100.0%) |
| 75 Years and over | 6 (100.0%) | 0 (0.0%) |
Disability Class: Self-Care Difficulty
| Age Bracket | Male | Female |
| 5 to 17 Years | 0 (0.0%) | 0 (0.0%) |
| 18 to 34 Years | 0 (0.0%) | 0 (0.0%) |
| 35 to 64 Years | 0 (0.0%) | 0 (0.0%) |
| 65 to 74 Years | 0 (0.0%) | 0 (0.0%) |
| 75 Years and over | 0 (0.0%) | 0 (0.0%) |
Technology Access in Wamsutter
Computing Device Access in Wamsutter
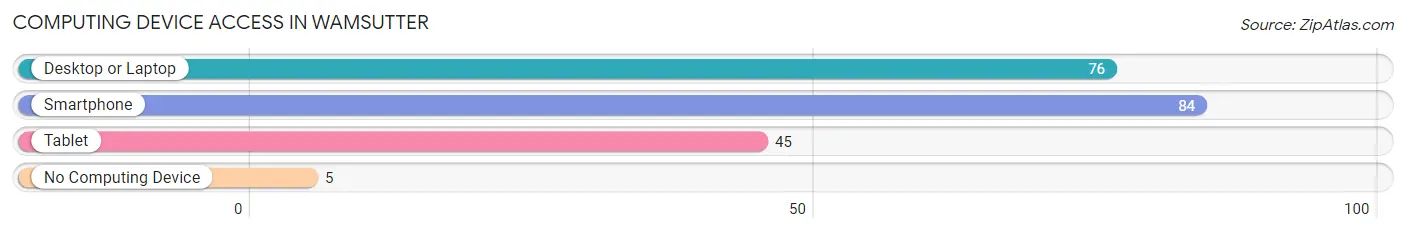
| Device Type | # Households | % Households |
| Desktop or Laptop | 76 | 85.4% |
| Smartphone | 84 | 94.4% |
| Tablet | 45 | 50.6% |
| No Computing Device | 5 | 5.6% |
| Total | 89 | 100.0% |
Internet Access in Wamsutter
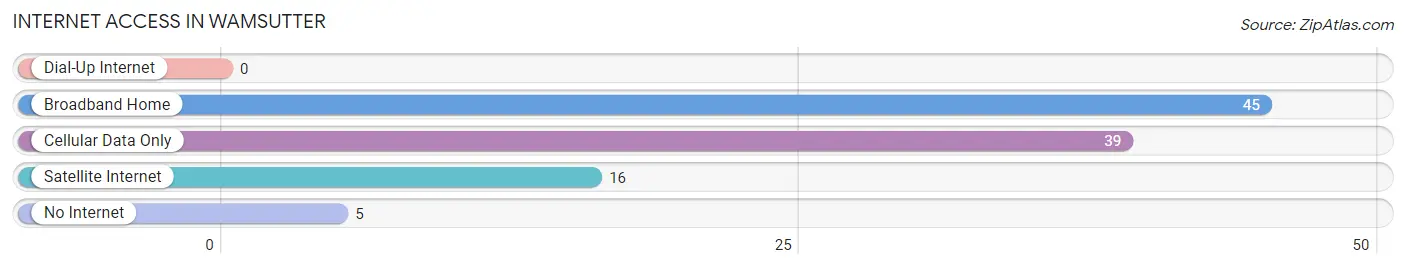
| Internet Type | # Households | % Households |
| Dial-Up Internet | 0 | 0.0% |
| Broadband Home | 45 | 50.6% |
| Cellular Data Only | 39 | 43.8% |
| Satellite Internet | 16 | 18.0% |
| No Internet | 5 | 5.6% |
| Total | 89 | 100.0% |
Wamsutter Summary
Wamsutter is a small town located in Sweetwater County, Wyoming, United States. It is situated in the high desert of the Great Divide Basin, approximately halfway between Rawlins and Rock Springs. The town was founded in the late 19th century as a railroad town and has since become a hub for oil and gas production in the region.
History
The area around Wamsutter was first inhabited by Native American tribes, including the Shoshone, Arapaho, and Ute. The first European settlers arrived in the area in the late 19th century, when the Union Pacific Railroad was built through the region. The town of Wamsutter was established in 1887 as a railroad town, and was named after a local rancher, William Wamsutter.
In the early 20th century, Wamsutter became a hub for oil and gas production in the region. The town was home to several oil and gas companies, including the Wamsutter Oil Company, which was founded in 1906. The town also became a center for sheep and cattle ranching, and the local economy was largely based on these industries.
In the late 20th century, Wamsutter experienced a decline in population as the oil and gas industry moved away from the area. The town's population dropped from a peak of 1,000 in the 1950s to just over 500 in 2000.
Geography
Wamsutter is located in the high desert of the Great Divide Basin, approximately halfway between Rawlins and Rock Springs. The town is situated at an elevation of 5,890 feet (1,795 m) above sea level. The surrounding area is mostly flat, with some rolling hills and sagebrush-covered plains.
The climate in Wamsutter is semi-arid, with hot summers and cold winters. The average annual temperature is 48°F (9°C), and the average annual precipitation is 8.5 inches (216 mm).
Economy
Wamsutter's economy is largely based on oil and gas production, ranching, and tourism. The town is home to several oil and gas companies, including the Wamsutter Oil Company, which was founded in 1906. The town is also home to several ranches, which raise sheep and cattle.
The town is also a popular tourist destination, with visitors coming to explore the nearby Great Divide Basin and the nearby Flaming Gorge National Recreation Area. The town is also home to several restaurants, hotels, and other tourist attractions.
Demographics
As of the 2010 census, Wamsutter had a population of 517. The racial makeup of the town was 94.2% White, 0.4% African American, 0.4% Native American, 0.2% Asian, 0.2% Pacific Islander, 2.3% from other races, and 2.3% from two or more races. Hispanic or Latino of any race were 5.3% of the population.
The median household income in Wamsutter was $41,250, and the median family income was $45,833. The per capita income was $19,945. About 11.2% of families and 14.2% of the population were below the poverty line, including 18.2% of those under age 18 and 8.3% of those age 65 or over.
Common Questions
What is the Total Population of Wamsutter?
Total Population of Wamsutter is 251.
What is the Total Male Population of Wamsutter?
Total Male Population of Wamsutter is 171.
What is the Total Female Population of Wamsutter?
Total Female Population of Wamsutter is 80.
What is the Ratio of Males per 100 Females in Wamsutter?
There are 213.75 Males per 100 Females in Wamsutter.
What is the Ratio of Females per 100 Males in Wamsutter?
There are 46.78 Females per 100 Males in Wamsutter.
What is the Median Population Age in Wamsutter?
Median Population Age in Wamsutter is 58.1 Years.
What is the Average Family Size in Wamsutter
Average Family Size in Wamsutter is 2.5 People.
What is the Average Household Size in Wamsutter
Average Household Size in Wamsutter is 2.8 People.
What is Per Capita Income in Wamsutter?
Per Capita income in Wamsutter is $29,453.
What is the Median Family Income in Wamsutter?
Median Family Income in Wamsutter is $76,250.
What is the Median Household income in Wamsutter?
Median Household Income in Wamsutter is $65,625.
What is Inequality or Gini Index in Wamsutter?
Inequality or Gini Index in Wamsutter is 0.17.
How Large is the Labor Force in Wamsutter?
There are 174 People in the Labor Forcein in Wamsutter.
What is the Percentage of People in the Labor Force in Wamsutter?
80.2% of People are in the Labor Force in Wamsutter.
What is the Unemployment Rate in Wamsutter?
Unemployment Rate in Wamsutter is 6.9%.