Ranchettes, WY
Ranchettes Map
Ranchettes Overview
5,731
TOTAL POPULATION
3,014
MALE POPULATION
2,717
FEMALE POPULATION
110.93
MALES / 100 FEMALES
90.15
FEMALES / 100 MALES
51.7
MEDIAN AGE
2.8
AVG FAMILY SIZE
2.5
AVG HOUSEHOLD SIZE
$54,076
PER CAPITA INCOME
$121,915
AVG FAMILY INCOME
$119,809
AVG HOUSEHOLD INCOME
16.5%
WAGE / INCOME GAP [ % ]
83.5¢/ $1
WAGE / INCOME GAP [ $ ]
$7,815
FAMILY INCOME DEFICIT
0.35
INEQUALITY / GINI INDEX
2,610
LABOR FORCE [ PEOPLE ]
56.2%
PERCENT IN LABOR FORCE
1.7%
UNEMPLOYMENT RATE
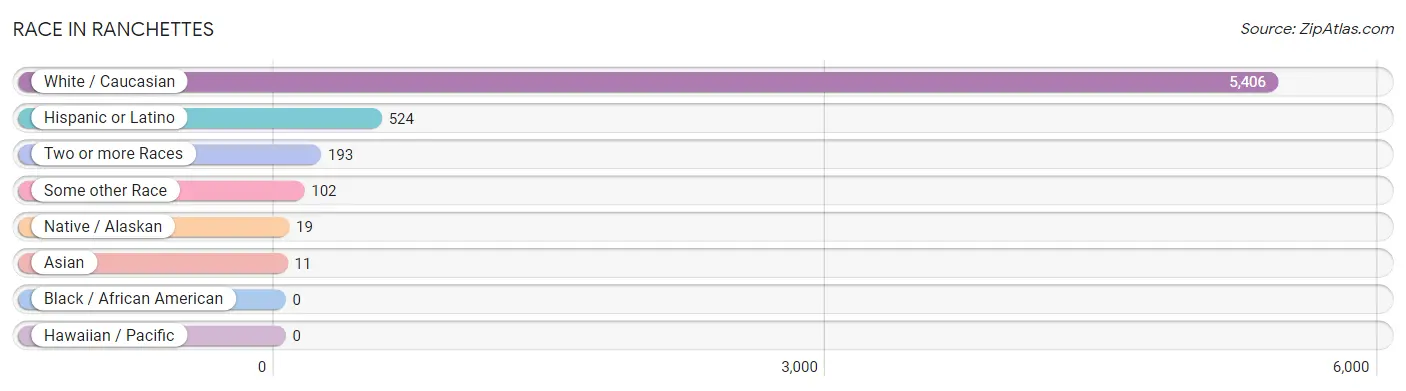
Race in Ranchettes
The most populous races in Ranchettes are White / Caucasian (5,406 | 94.3%), Hispanic or Latino (524 | 9.1%), and Two or more Races (193 | 3.4%).
| Race | # Population | % Population |
| Asian | 11 | 0.2% |
| Black / African American | 0 | 0.0% |
| Hawaiian / Pacific | 0 | 0.0% |
| Hispanic or Latino | 524 | 9.1% |
| Native / Alaskan | 19 | 0.3% |
| White / Caucasian | 5,406 | 94.3% |
| Two or more Races | 193 | 3.4% |
| Some other Race | 102 | 1.8% |
| Total | 5,731 | 100.0% |
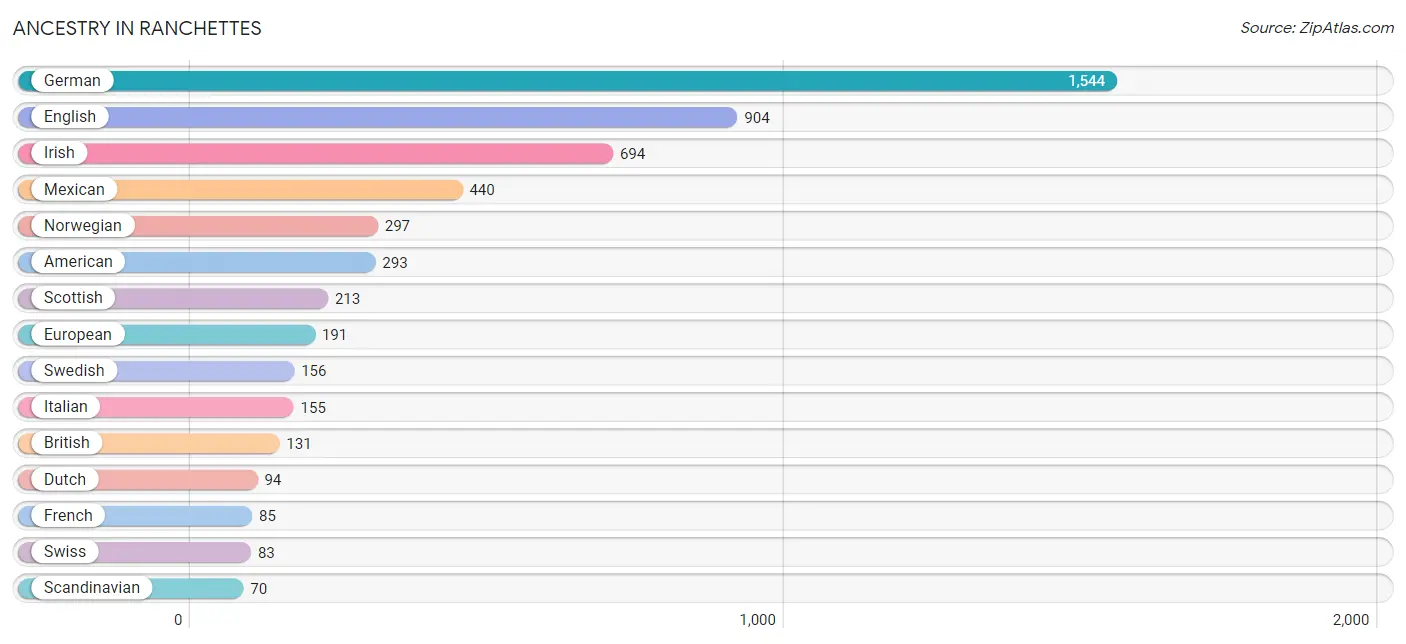
Ancestry in Ranchettes
The most populous ancestries reported in Ranchettes are German (1,544 | 26.9%), English (904 | 15.8%), Irish (694 | 12.1%), Mexican (440 | 7.7%), and Norwegian (297 | 5.2%), together accounting for 67.7% of all Ranchettes residents.
| Ancestry | # Population | % Population |
| American | 293 | 5.1% |
| Arab | 5 | 0.1% |
| Argentinean | 12 | 0.2% |
| Armenian | 8 | 0.1% |
| Austrian | 19 | 0.3% |
| Bhutanese | 17 | 0.3% |
| British | 131 | 2.3% |
| Burmese | 45 | 0.8% |
| Croatian | 19 | 0.3% |
| Czech | 56 | 1.0% |
| Czechoslovakian | 13 | 0.2% |
| Danish | 68 | 1.2% |
| Dutch | 94 | 1.6% |
| Eastern European | 27 | 0.5% |
| English | 904 | 15.8% |
| European | 191 | 3.3% |
| French | 85 | 1.5% |
| French Canadian | 24 | 0.4% |
| German | 1,544 | 26.9% |
| Greek | 22 | 0.4% |
| Hungarian | 12 | 0.2% |
| Irish | 694 | 12.1% |
| Italian | 155 | 2.7% |
| Korean | 7 | 0.1% |
| Mexican | 440 | 7.7% |
| Navajo | 34 | 0.6% |
| Northern European | 66 | 1.1% |
| Norwegian | 297 | 5.2% |
| Ottawa | 5 | 0.1% |
| Polish | 62 | 1.1% |
| Russian | 27 | 0.5% |
| Scandinavian | 70 | 1.2% |
| Scotch-Irish | 29 | 0.5% |
| Scottish | 213 | 3.7% |
| Shoshone | 8 | 0.1% |
| South American | 12 | 0.2% |
| Spanish | 37 | 0.6% |
| Swedish | 156 | 2.7% |
| Swiss | 83 | 1.5% |
| Syrian | 5 | 0.1% |
| Welsh | 12 | 0.2% | View All 41 Rows |
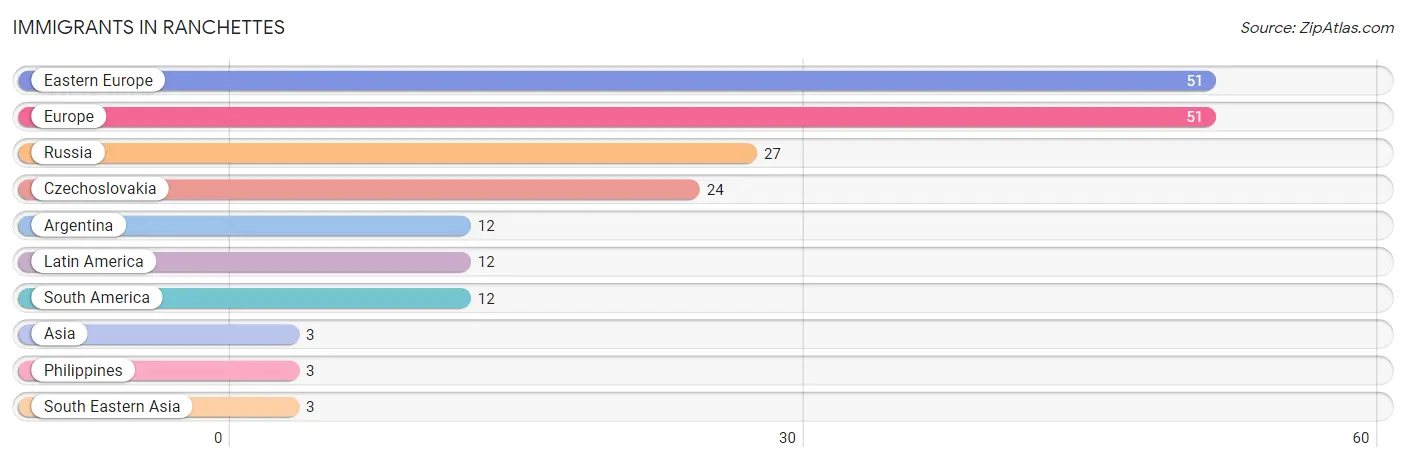
Immigrants in Ranchettes
The most numerous immigrant groups reported in Ranchettes came from Eastern Europe (51 | 0.9%), Europe (51 | 0.9%), Russia (27 | 0.5%), Czechoslovakia (24 | 0.4%), and Argentina (12 | 0.2%), together accounting for 2.9% of all Ranchettes residents.
| Immigration Origin | # Population | % Population |
| Argentina | 12 | 0.2% |
| Asia | 3 | 0.1% |
| Czechoslovakia | 24 | 0.4% |
| Eastern Europe | 51 | 0.9% |
| Europe | 51 | 0.9% |
| Latin America | 12 | 0.2% |
| Philippines | 3 | 0.1% |
| Russia | 27 | 0.5% |
| South America | 12 | 0.2% |
| South Eastern Asia | 3 | 0.1% | View All 10 Rows |
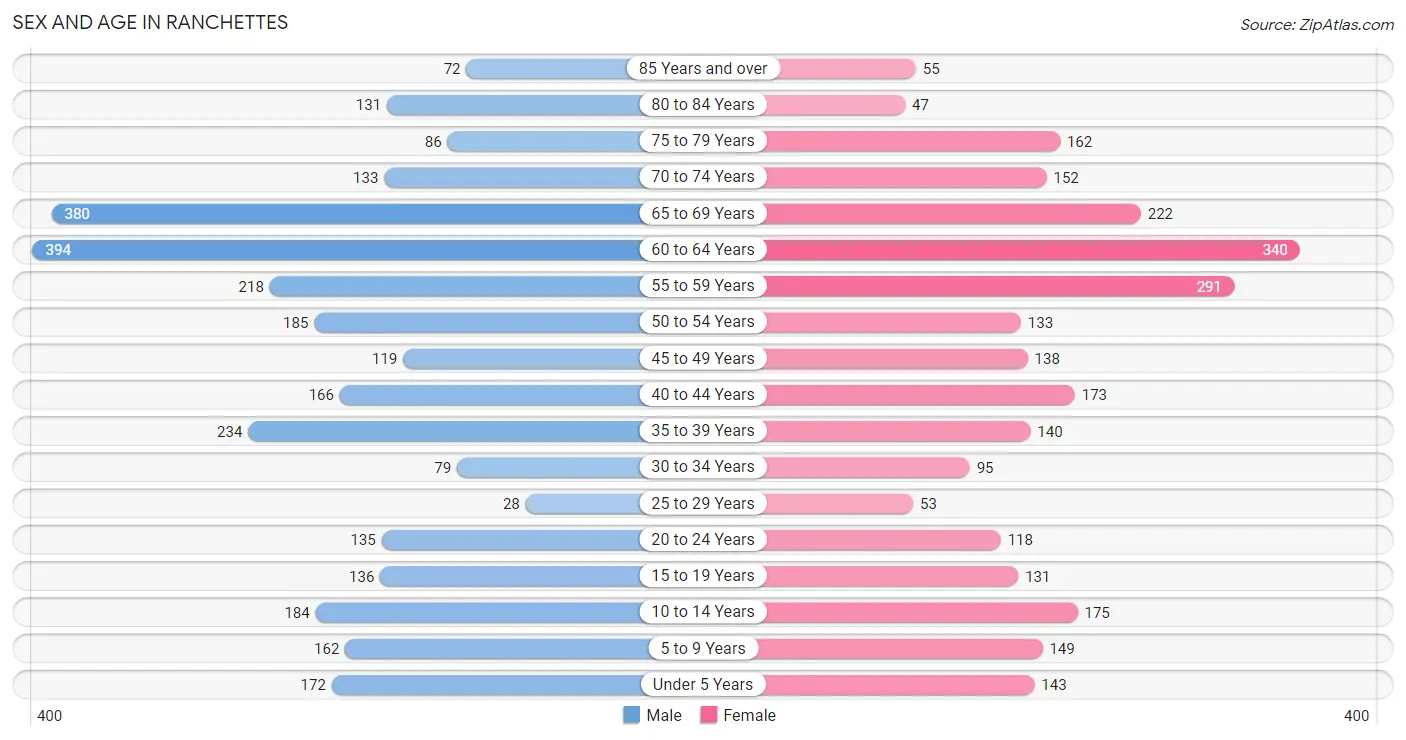
Sex and Age in Ranchettes
Sex and Age in Ranchettes
The most populous age groups in Ranchettes are 60 to 64 Years (394 | 13.1%) for men and 60 to 64 Years (340 | 12.5%) for women.
| Age Bracket | Male | Female |
| Under 5 Years | 172 (5.7%) | 143 (5.3%) |
| 5 to 9 Years | 162 (5.4%) | 149 (5.5%) |
| 10 to 14 Years | 184 (6.1%) | 175 (6.4%) |
| 15 to 19 Years | 136 (4.5%) | 131 (4.8%) |
| 20 to 24 Years | 135 (4.5%) | 118 (4.3%) |
| 25 to 29 Years | 28 (0.9%) | 53 (1.9%) |
| 30 to 34 Years | 79 (2.6%) | 95 (3.5%) |
| 35 to 39 Years | 234 (7.8%) | 140 (5.1%) |
| 40 to 44 Years | 166 (5.5%) | 173 (6.4%) |
| 45 to 49 Years | 119 (4.0%) | 138 (5.1%) |
| 50 to 54 Years | 185 (6.1%) | 133 (4.9%) |
| 55 to 59 Years | 218 (7.2%) | 291 (10.7%) |
| 60 to 64 Years | 394 (13.1%) | 340 (12.5%) |
| 65 to 69 Years | 380 (12.6%) | 222 (8.2%) |
| 70 to 74 Years | 133 (4.4%) | 152 (5.6%) |
| 75 to 79 Years | 86 (2.9%) | 162 (6.0%) |
| 80 to 84 Years | 131 (4.3%) | 47 (1.7%) |
| 85 Years and over | 72 (2.4%) | 55 (2.0%) |
| Total | 3,014 (100.0%) | 2,717 (100.0%) |
Families and Households in Ranchettes
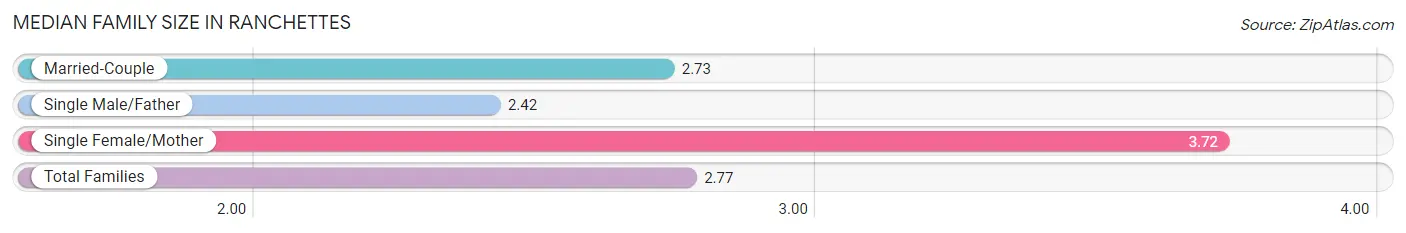
Median Family Size in Ranchettes
The median family size in Ranchettes is 2.77 persons per family, with single female/mother families (108 | 6.0%) accounting for the largest median family size of 3.72 persons per family. On the other hand, single male/father families (113 | 6.3%) represent the smallest median family size with 2.42 persons per family.
| Family Type | # Families | Family Size |
| Married-Couple | 1,579 (87.7%) | 2.73 |
| Single Male/Father | 113 (6.3%) | 2.42 |
| Single Female/Mother | 108 (6.0%) | 3.72 |
| Total Families | 1,800 (100.0%) | 2.77 |
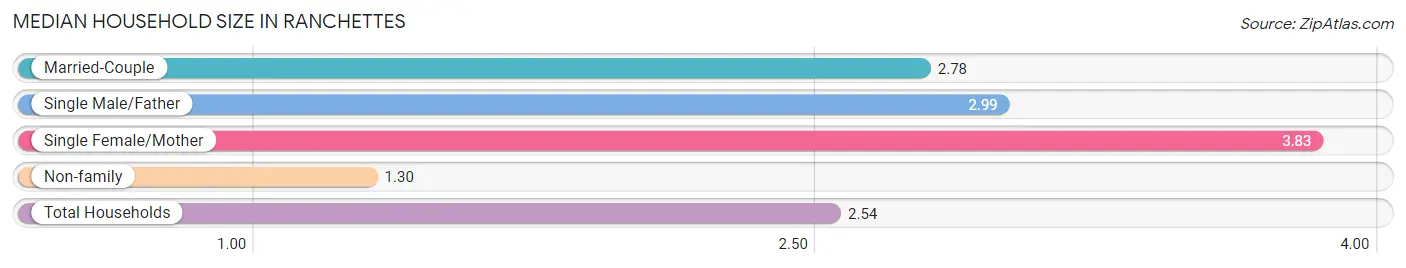
Median Household Size in Ranchettes
The median household size in Ranchettes is 2.54 persons per household, with single female/mother households (108 | 4.8%) accounting for the largest median household size of 3.83 persons per household. non-family households (455 | 20.2%) represent the smallest median household size with 1.30 persons per household.
| Household Type | # Households | Household Size |
| Married-Couple | 1,579 (70.0%) | 2.78 |
| Single Male/Father | 113 (5.0%) | 2.99 |
| Single Female/Mother | 108 (4.8%) | 3.83 |
| Non-family | 455 (20.2%) | 1.30 |
| Total Households | 2,255 (100.0%) | 2.54 |
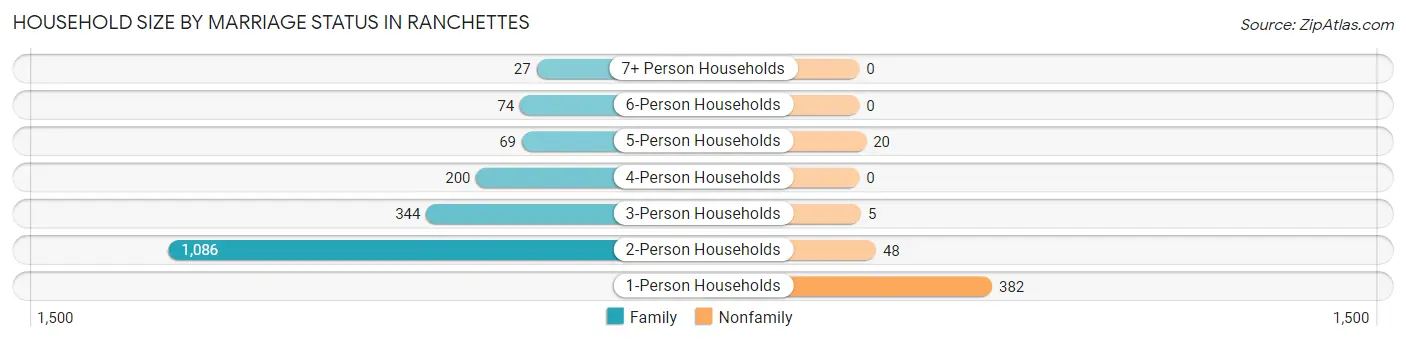
Household Size by Marriage Status in Ranchettes
Out of a total of 2,255 households in Ranchettes, 1,800 (79.8%) are family households, while 455 (20.2%) are nonfamily households. The most numerous type of family households are 2-person households, comprising 1,086, and the most common type of nonfamily households are 1-person households, comprising 382.
| Household Size | Family Households | Nonfamily Households |
| 1-Person Households | - | 382 (16.9%) |
| 2-Person Households | 1,086 (48.2%) | 48 (2.1%) |
| 3-Person Households | 344 (15.2%) | 5 (0.2%) |
| 4-Person Households | 200 (8.9%) | 0 (0.0%) |
| 5-Person Households | 69 (3.1%) | 20 (0.9%) |
| 6-Person Households | 74 (3.3%) | 0 (0.0%) |
| 7+ Person Households | 27 (1.2%) | 0 (0.0%) |
| Total | 1,800 (79.8%) | 455 (20.2%) |
Female Fertility in Ranchettes
Fertility by Age in Ranchettes
Average fertility rate in Ranchettes is 197.0 births per 1,000 women. Women in the age bracket of 20 to 34 years have the highest fertility rate with 327.0 births per 1,000 women. Women in the age bracket of 20 to 34 years acount for 51.2% of all women with births.
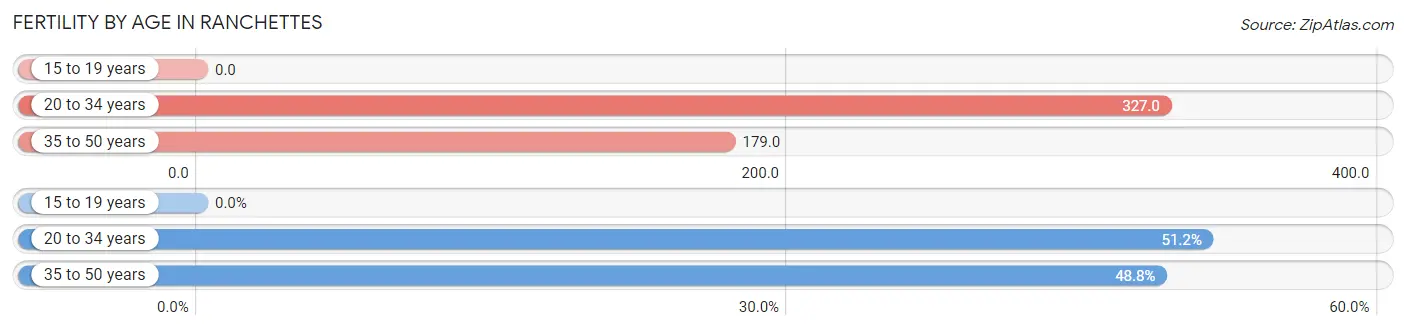
| Age Bracket | Women with Births | Births / 1,000 Women |
| 15 to 19 years | 0 (0.0%) | 0.0 |
| 20 to 34 years | 87 (51.2%) | 327.0 |
| 35 to 50 years | 83 (48.8%) | 179.0 |
| Total | 170 (100.0%) | 197.0 |
Fertility by Age by Marriage Status in Ranchettes
63.5% of women with births (170) in Ranchettes are married. The highest percentage of unmarried women with births falls into 35 to 50 years age bracket with 61.5% of them unmarried at the time of birth, while the lowest percentage of unmarried women with births belong to 20 to 34 years age bracket with 12.6% of them unmarried.
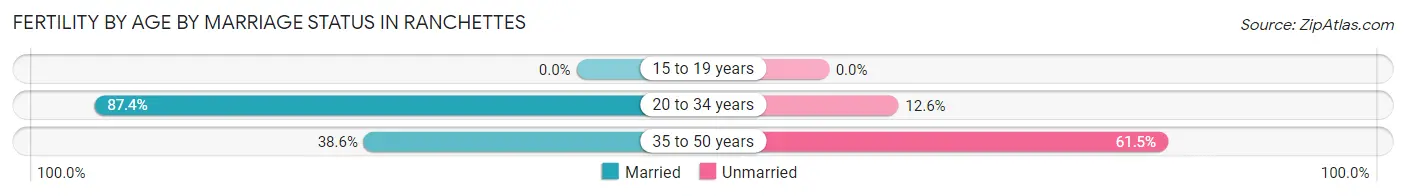
| Age Bracket | Married | Unmarried |
| 15 to 19 years | 0 (0.0%) | 0 (0.0%) |
| 20 to 34 years | 76 (87.4%) | 11 (12.6%) |
| 35 to 50 years | 32 (38.6%) | 51 (61.5%) |
| Total | 108 (63.5%) | 62 (36.5%) |
Fertility by Education in Ranchettes
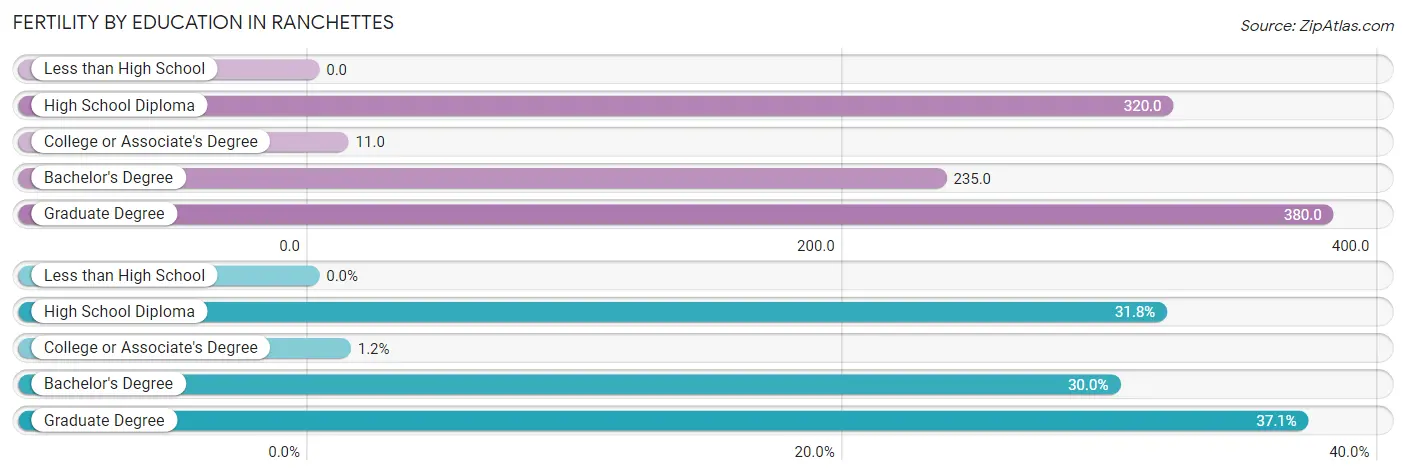
| Educational Attainment | Women with Births | Births / 1,000 Women |
| Less than High School | 0 (0.0%) | 0.0 |
| High School Diploma | 54 (31.8%) | 320.0 |
| College or Associate's Degree | 2 (1.2%) | 11.0 |
| Bachelor's Degree | 51 (30.0%) | 235.0 |
| Graduate Degree | 63 (37.1%) | 380.0 |
| Total | 170 (100.0%) | 197.0 |
Fertility by Education by Marriage Status in Ranchettes
36.5% of women with births in Ranchettes are unmarried. Women with the educational attainment of college or associate's degree are most likely to be married with 100.0% of them married at childbirth, while women with the educational attainment of graduate degree are least likely to be married with 80.9% of them unmarried at childbirth.
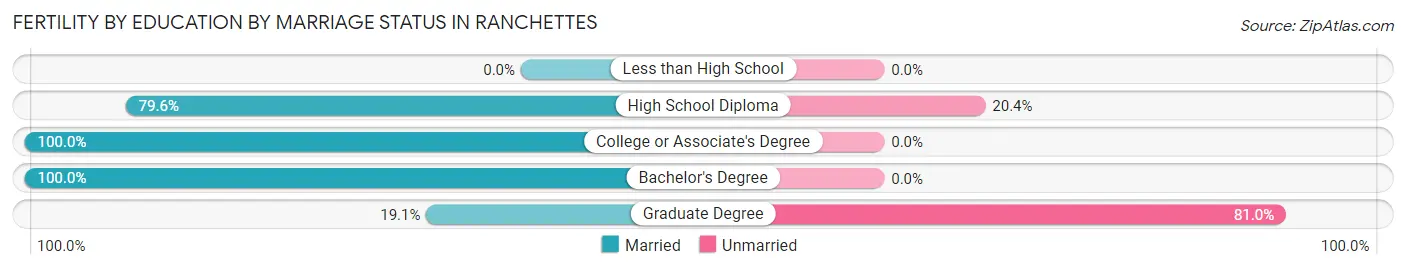
| Educational Attainment | Married | Unmarried |
| Less than High School | 0 (0.0%) | 0 (0.0%) |
| High School Diploma | 43 (79.6%) | 11 (20.4%) |
| College or Associate's Degree | 2 (100.0%) | 0 (0.0%) |
| Bachelor's Degree | 51 (100.0%) | 0 (0.0%) |
| Graduate Degree | 12 (19.1%) | 51 (80.9%) |
| Total | 108 (63.5%) | 62 (36.5%) |
Income in Ranchettes
Income Overview in Ranchettes
Per Capita Income in Ranchettes is $54,076, while median incomes of families and households are $121,915 and $119,809 respectively.
| Characteristic | Number | Measure |
| Per Capita Income | 5,731 | $54,076 |
| Median Family Income | 1,800 | $121,915 |
| Mean Family Income | 1,800 | $143,578 |
| Median Household Income | 2,255 | $119,809 |
| Mean Household Income | 2,255 | $135,746 |
| Income Deficit | 1,800 | $7,815 |
| Wage / Income Gap (%) | 5,731 | 16.49% |
| Wage / Income Gap ($) | 5,731 | 83.51¢ per $1 |
| Gini / Inequality Index | 5,731 | 0.35 |
Earnings by Sex in Ranchettes
Average Earnings in Ranchettes are $66,134, $70,353 for men and $58,750 for women, a difference of 16.5%.
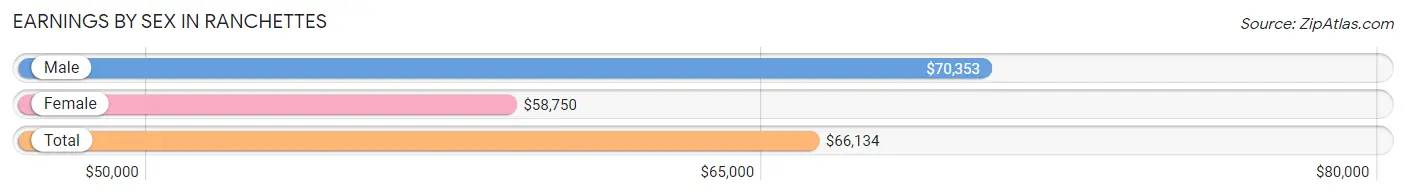
| Sex | Number | Average Earnings |
| Male | 1,439 (52.3%) | $70,353 |
| Female | 1,312 (47.7%) | $58,750 |
| Total | 2,751 (100.0%) | $66,134 |
Earnings by Sex by Income Bracket in Ranchettes
The most common earnings brackets in Ranchettes are $100,000+ for men (389 | 27.0%) and $100,000+ for women (375 | 28.6%).
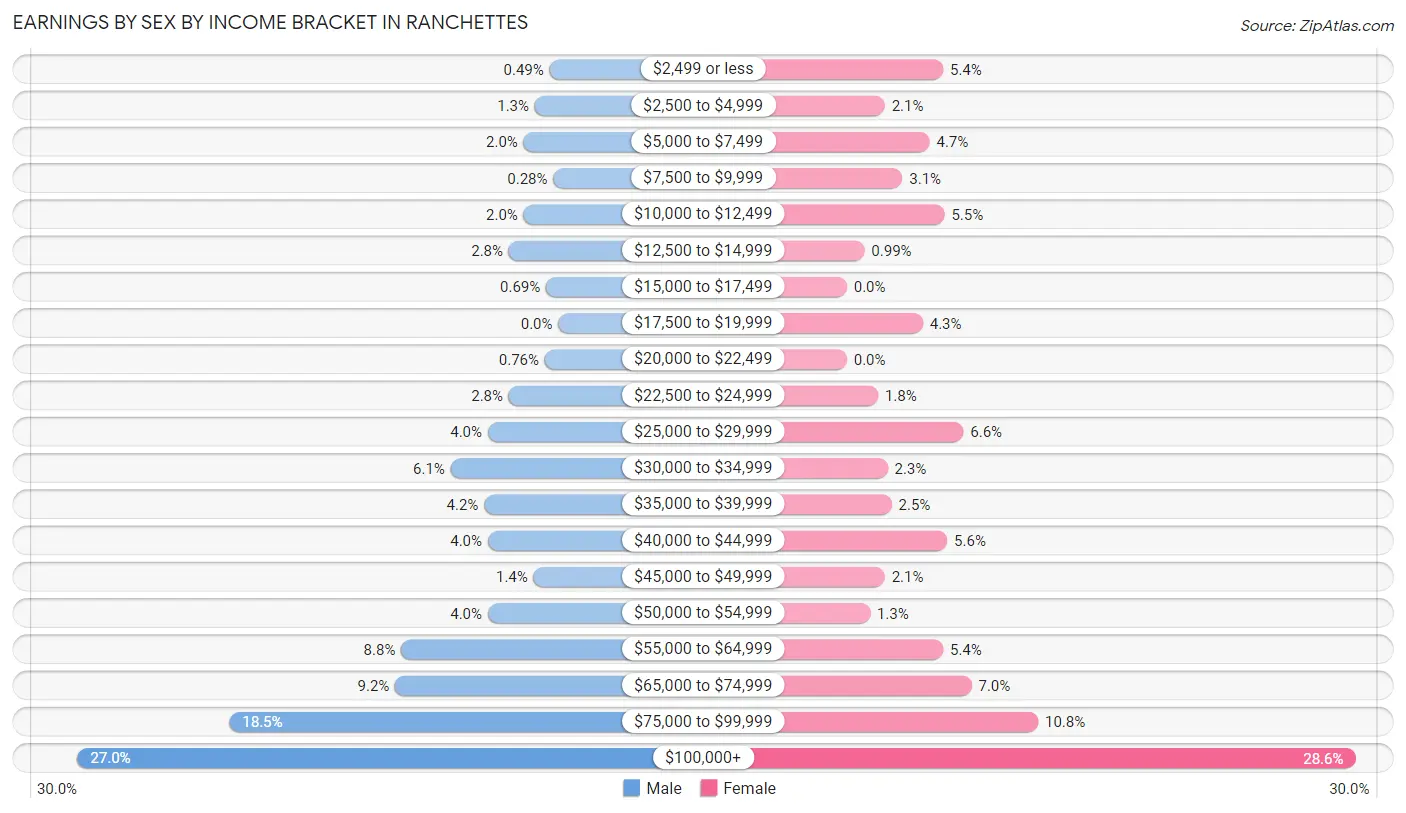
| Income | Male | Female |
| $2,499 or less | 7 (0.5%) | 71 (5.4%) |
| $2,500 to $4,999 | 19 (1.3%) | 28 (2.1%) |
| $5,000 to $7,499 | 28 (1.9%) | 61 (4.6%) |
| $7,500 to $9,999 | 4 (0.3%) | 41 (3.1%) |
| $10,000 to $12,499 | 28 (1.9%) | 72 (5.5%) |
| $12,500 to $14,999 | 40 (2.8%) | 13 (1.0%) |
| $15,000 to $17,499 | 10 (0.7%) | 0 (0.0%) |
| $17,500 to $19,999 | 0 (0.0%) | 56 (4.3%) |
| $20,000 to $22,499 | 11 (0.8%) | 0 (0.0%) |
| $22,500 to $24,999 | 40 (2.8%) | 23 (1.8%) |
| $25,000 to $29,999 | 57 (4.0%) | 86 (6.6%) |
| $30,000 to $34,999 | 87 (6.0%) | 30 (2.3%) |
| $35,000 to $39,999 | 60 (4.2%) | 33 (2.5%) |
| $40,000 to $44,999 | 57 (4.0%) | 74 (5.6%) |
| $45,000 to $49,999 | 20 (1.4%) | 28 (2.1%) |
| $50,000 to $54,999 | 57 (4.0%) | 17 (1.3%) |
| $55,000 to $64,999 | 127 (8.8%) | 71 (5.4%) |
| $65,000 to $74,999 | 132 (9.2%) | 92 (7.0%) |
| $75,000 to $99,999 | 266 (18.5%) | 141 (10.7%) |
| $100,000+ | 389 (27.0%) | 375 (28.6%) |
| Total | 1,439 (100.0%) | 1,312 (100.0%) |
Earnings by Sex by Educational Attainment in Ranchettes
Average earnings in Ranchettes are $75,000 for men and $67,440 for women, a difference of 10.1%. Men with an educational attainment of graduate degree enjoy the highest average annual earnings of $123,068, while those with high school diploma education earn the least with $59,886. Women with an educational attainment of graduate degree earn the most with the average annual earnings of $119,354, while those with high school diploma education have the smallest earnings of $26,192.
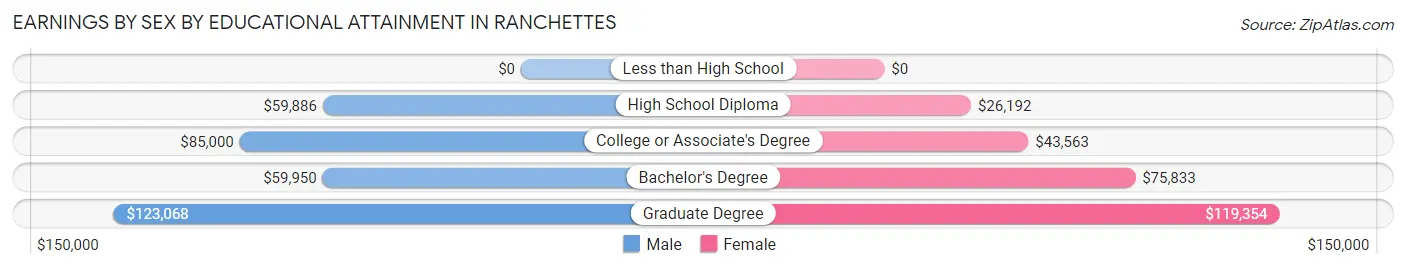
| Educational Attainment | Male Income | Female Income |
| Less than High School | - | - |
| High School Diploma | $59,886 | $26,192 |
| College or Associate's Degree | $85,000 | $43,563 |
| Bachelor's Degree | $59,950 | $75,833 |
| Graduate Degree | $123,068 | $119,354 |
| Total | $75,000 | $67,440 |
Family Income in Ranchettes
Family Income Brackets in Ranchettes
According to the Ranchettes family income data, there are 488 families falling into the $100,000 to $149,999 income range, which is the most common income bracket and makes up 27.1% of all families.
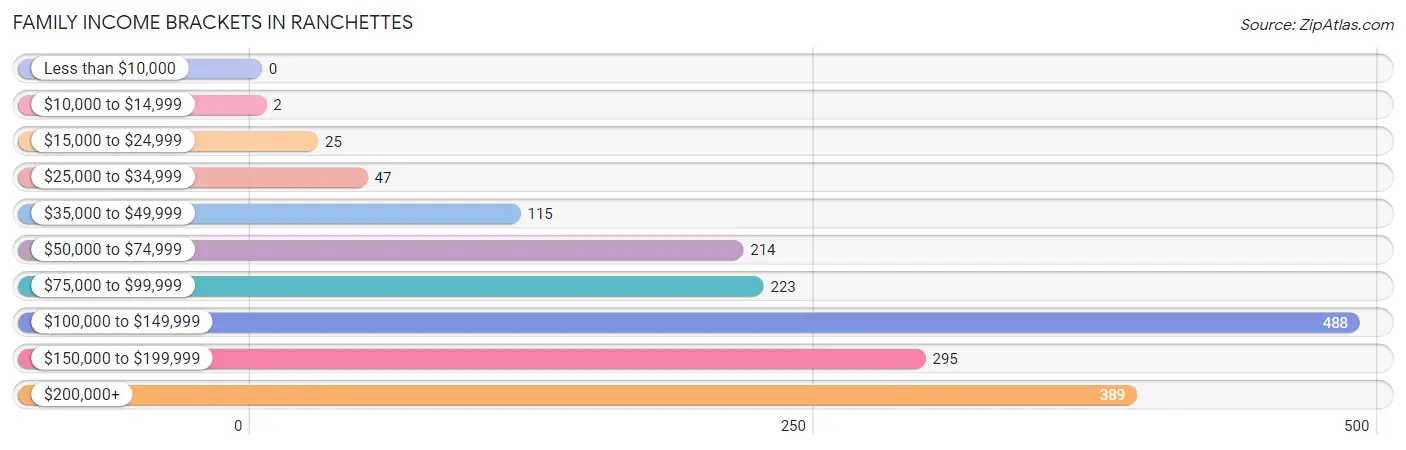
| Income Bracket | # Families | % Families |
| Less than $10,000 | 0 | 0.0% |
| $10,000 to $14,999 | 2 | 0.1% |
| $15,000 to $24,999 | 25 | 1.4% |
| $25,000 to $34,999 | 47 | 2.6% |
| $35,000 to $49,999 | 115 | 6.4% |
| $50,000 to $74,999 | 214 | 11.9% |
| $75,000 to $99,999 | 223 | 12.4% |
| $100,000 to $149,999 | 488 | 27.1% |
| $150,000 to $199,999 | 295 | 16.4% |
| $200,000+ | 389 | 21.6% |
Family Income by Famaliy Size in Ranchettes
4-person families (203 | 11.3%) account for the highest median family income in Ranchettes with $184,250 per family, while 2-person families (1,147 | 63.7%) have the highest median income of $57,969 per family member.
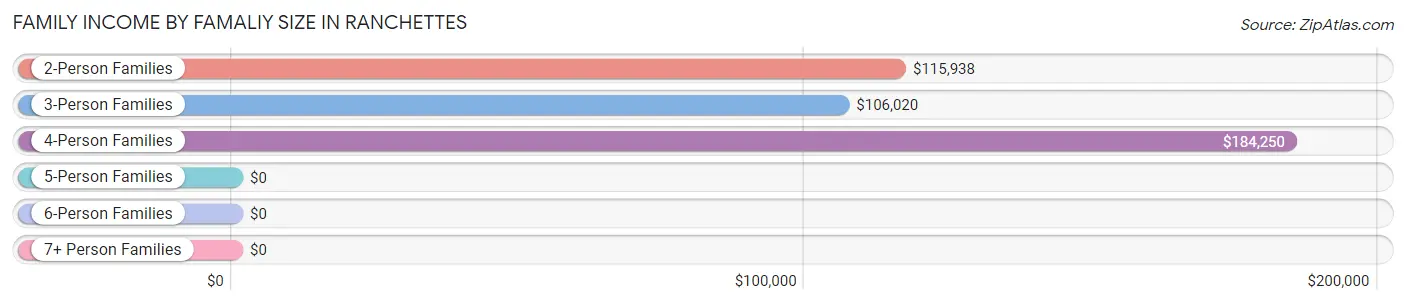
| Income Bracket | # Families | Median Income |
| 2-Person Families | 1,147 (63.7%) | $115,938 |
| 3-Person Families | 295 (16.4%) | $106,020 |
| 4-Person Families | 203 (11.3%) | $184,250 |
| 5-Person Families | 54 (3.0%) | $0 |
| 6-Person Families | 81 (4.5%) | $0 |
| 7+ Person Families | 20 (1.1%) | $0 |
| Total | 1,800 (100.0%) | $121,915 |
Family Income by Number of Earners in Ranchettes
The median family income in Ranchettes is $121,915, with families comprising 3+ earners (119) having the highest median family income of $225,843, while families with no earners (367) have the lowest median family income of $78,625, accounting for 6.6% and 20.4% of families, respectively.
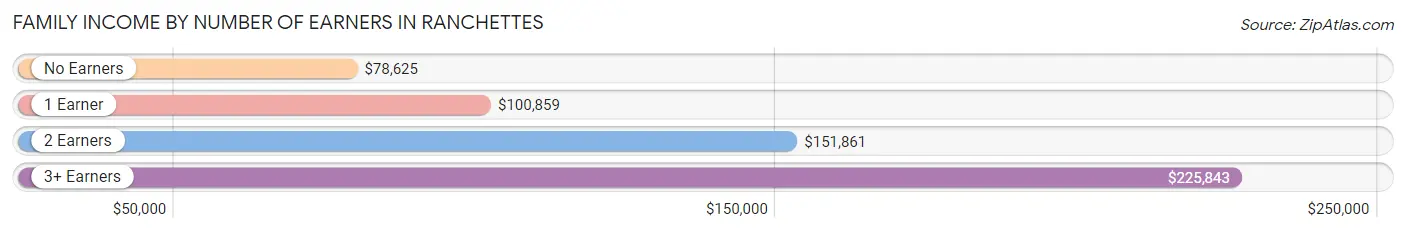
| Number of Earners | # Families | Median Income |
| No Earners | 367 (20.4%) | $78,625 |
| 1 Earner | 603 (33.5%) | $100,859 |
| 2 Earners | 711 (39.5%) | $151,861 |
| 3+ Earners | 119 (6.6%) | $225,843 |
| Total | 1,800 (100.0%) | $121,915 |
Household Income in Ranchettes
Household Income Brackets in Ranchettes
With 523 households falling in the category, the $100,000 to $149,999 income range is the most frequent in Ranchettes, accounting for 23.2% of all households.
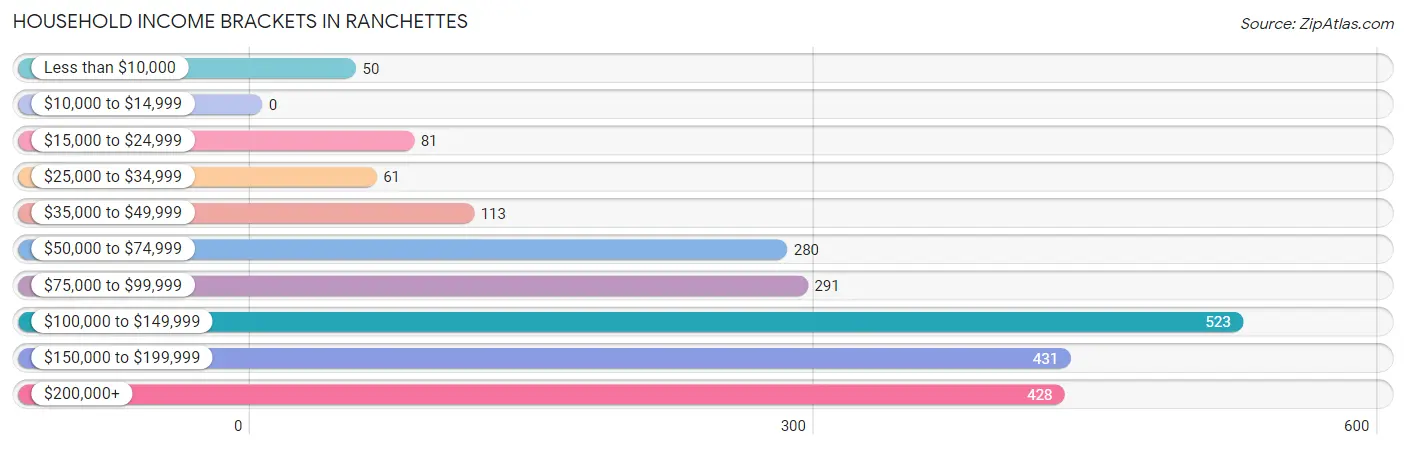
| Income Bracket | # Households | % Households |
| Less than $10,000 | 50 | 2.2% |
| $10,000 to $14,999 | 0 | 0.0% |
| $15,000 to $24,999 | 81 | 3.6% |
| $25,000 to $34,999 | 61 | 2.7% |
| $35,000 to $49,999 | 113 | 5.0% |
| $50,000 to $74,999 | 280 | 12.4% |
| $75,000 to $99,999 | 291 | 12.9% |
| $100,000 to $149,999 | 523 | 23.2% |
| $150,000 to $199,999 | 431 | 19.1% |
| $200,000+ | 428 | 19.0% |
Household Income by Householder Age in Ranchettes
The median household income in Ranchettes is $119,809, with the highest median household income of $150,382 found in the 25 to 44 years age bracket for the primary householder. A total of 443 households (19.7%) fall into this category. Meanwhile, the 15 to 24 years age bracket for the primary householder has the lowest median household income of $0, with 43 households (1.9%) in this group.
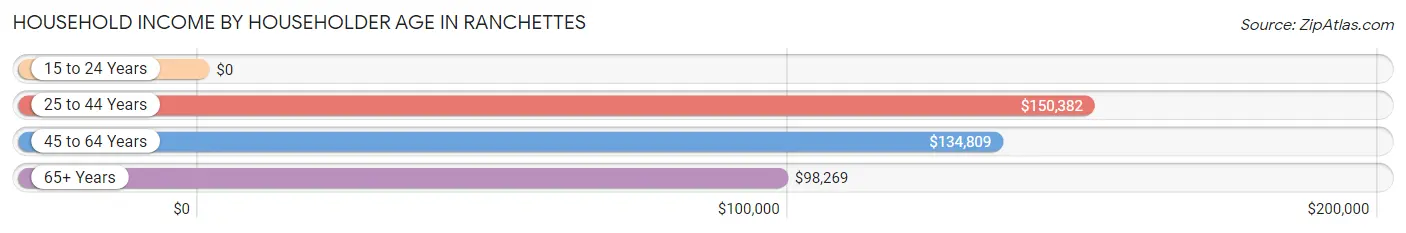
| Income Bracket | # Households | Median Income |
| 15 to 24 Years | 43 (1.9%) | $0 |
| 25 to 44 Years | 443 (19.7%) | $150,382 |
| 45 to 64 Years | 905 (40.1%) | $134,809 |
| 65+ Years | 864 (38.3%) | $98,269 |
| Total | 2,255 (100.0%) | $119,809 |
Poverty in Ranchettes
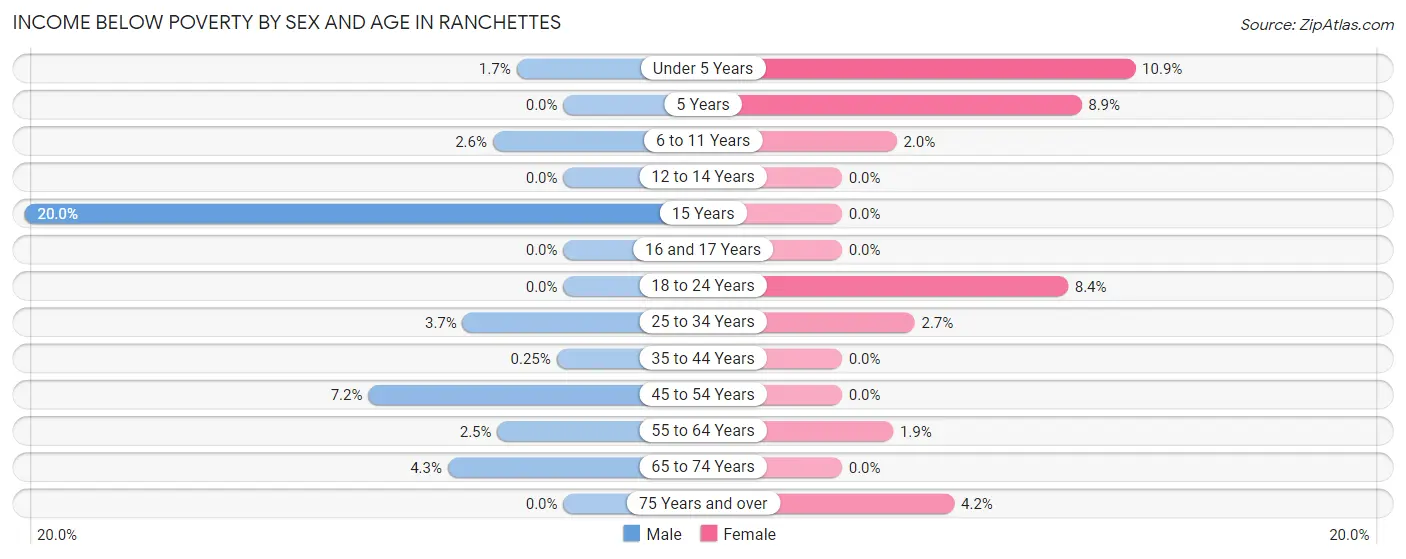
Income Below Poverty by Sex and Age in Ranchettes
With 3.0% poverty level for males and 2.2% for females among the residents of Ranchettes, 15 year old males and under 5 year old females are the most vulnerable to poverty, with 18 males (20.0%) and 11 females (10.9%) in their respective age groups living below the poverty level.
| Age Bracket | Male | Female |
| Under 5 Years | 3 (1.7%) | 11 (10.9%) |
| 5 Years | 0 (0.0%) | 4 (8.9%) |
| 6 to 11 Years | 5 (2.6%) | 4 (2.0%) |
| 12 to 14 Years | 0 (0.0%) | 0 (0.0%) |
| 15 Years | 18 (20.0%) | 0 (0.0%) |
| 16 and 17 Years | 0 (0.0%) | 0 (0.0%) |
| 18 to 24 Years | 0 (0.0%) | 13 (8.4%) |
| 25 to 34 Years | 4 (3.7%) | 4 (2.7%) |
| 35 to 44 Years | 1 (0.3%) | 0 (0.0%) |
| 45 to 54 Years | 22 (7.2%) | 0 (0.0%) |
| 55 to 64 Years | 15 (2.5%) | 12 (1.9%) |
| 65 to 74 Years | 22 (4.3%) | 0 (0.0%) |
| 75 Years and over | 0 (0.0%) | 11 (4.2%) |
| Total | 90 (3.0%) | 59 (2.2%) |
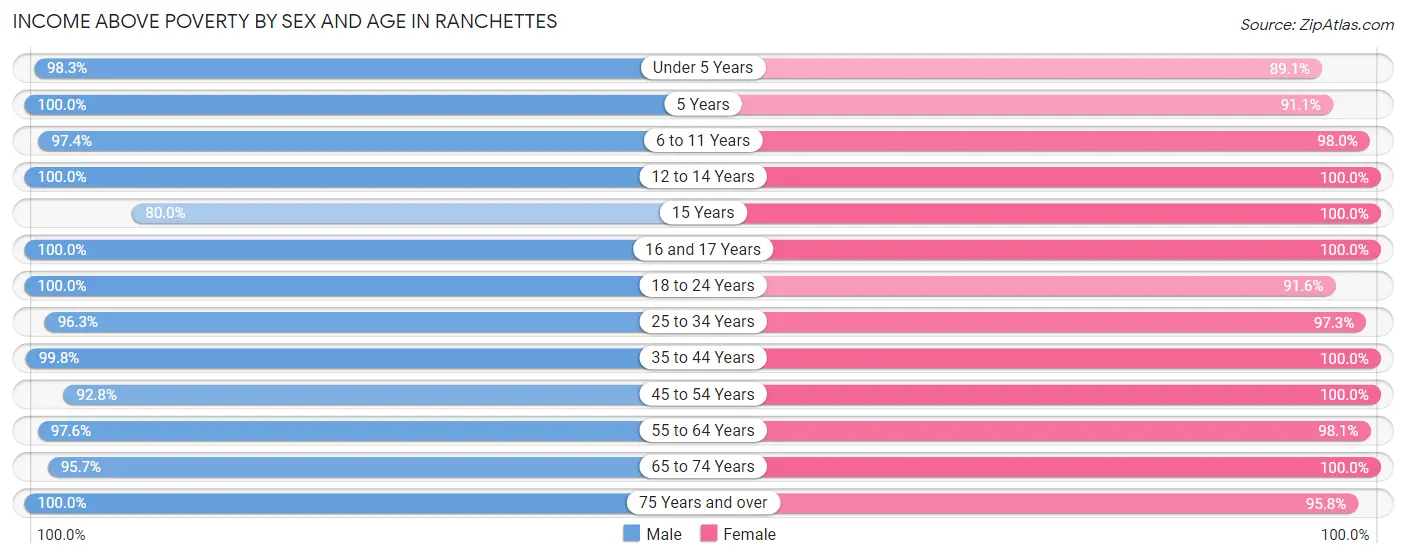
Income Above Poverty by Sex and Age in Ranchettes
According to the poverty statistics in Ranchettes, males aged 5 years and females aged 12 to 14 years are the age groups that are most secure financially, with 100.0% of males and 100.0% of females in these age groups living above the poverty line.
| Age Bracket | Male | Female |
| Under 5 Years | 169 (98.3%) | 90 (89.1%) |
| 5 Years | 33 (100.0%) | 41 (91.1%) |
| 6 to 11 Years | 186 (97.4%) | 193 (98.0%) |
| 12 to 14 Years | 106 (100.0%) | 43 (100.0%) |
| 15 Years | 72 (80.0%) | 12 (100.0%) |
| 16 and 17 Years | 23 (100.0%) | 82 (100.0%) |
| 18 to 24 Years | 158 (100.0%) | 142 (91.6%) |
| 25 to 34 Years | 103 (96.3%) | 144 (97.3%) |
| 35 to 44 Years | 399 (99.8%) | 313 (100.0%) |
| 45 to 54 Years | 282 (92.8%) | 271 (100.0%) |
| 55 to 64 Years | 597 (97.6%) | 619 (98.1%) |
| 65 to 74 Years | 491 (95.7%) | 374 (100.0%) |
| 75 Years and over | 289 (100.0%) | 253 (95.8%) |
| Total | 2,908 (97.0%) | 2,577 (97.8%) |
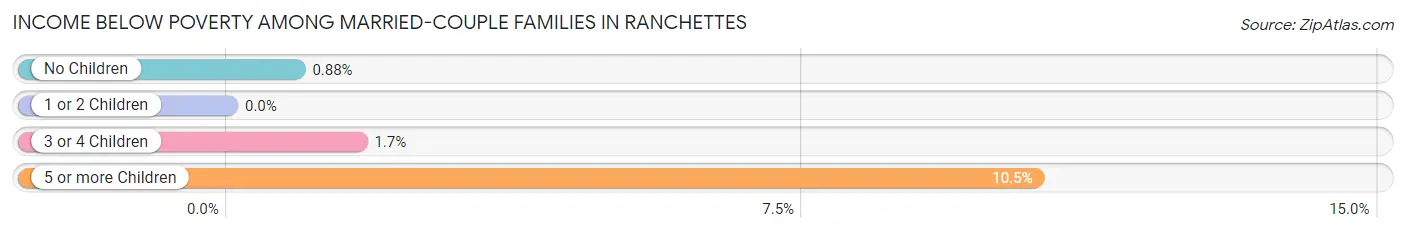
Income Below Poverty Among Married-Couple Families in Ranchettes
The poverty statistics for married-couple families in Ranchettes show that 0.8% or 13 of the total 1,579 families live below the poverty line. Families with 5 or more children have the highest poverty rate of 10.5%, comprising of 2 families. On the other hand, families with 1 or 2 children have the lowest poverty rate of 0.0%, which includes 0 families.
| Children | Above Poverty | Below Poverty |
| No Children | 1,129 (99.1%) | 10 (0.9%) |
| 1 or 2 Children | 362 (100.0%) | 0 (0.0%) |
| 3 or 4 Children | 58 (98.3%) | 1 (1.7%) |
| 5 or more Children | 17 (89.5%) | 2 (10.5%) |
| Total | 1,566 (99.2%) | 13 (0.8%) |
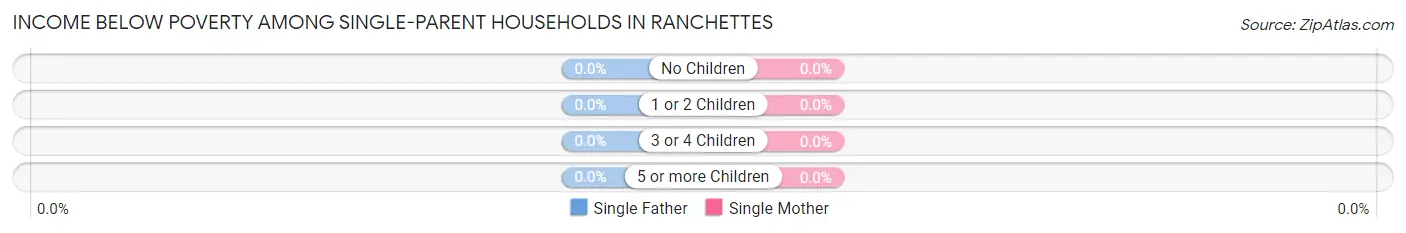
Income Below Poverty Among Single-Parent Households in Ranchettes
| Children | Single Father | Single Mother |
| No Children | 0 (0.0%) | 0 (0.0%) |
| 1 or 2 Children | 0 (0.0%) | 0 (0.0%) |
| 3 or 4 Children | 0 (0.0%) | 0 (0.0%) |
| 5 or more Children | 0 (0.0%) | 0 (0.0%) |
| Total | 0 (0.0%) | 0 (0.0%) |
Income Below Poverty Among Married-Couple vs Single-Parent Households in Ranchettes
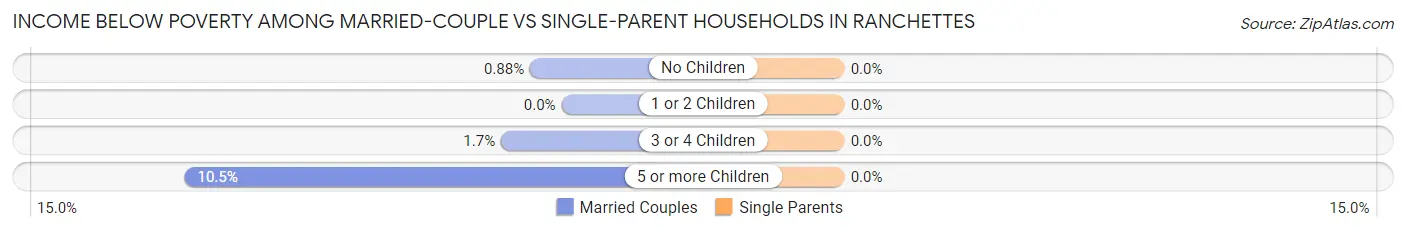
| Children | Married-Couple Families | Single-Parent Households |
| No Children | 10 (0.9%) | 0 (0.0%) |
| 1 or 2 Children | 0 (0.0%) | 0 (0.0%) |
| 3 or 4 Children | 1 (1.7%) | 0 (0.0%) |
| 5 or more Children | 2 (10.5%) | 0 (0.0%) |
| Total | 13 (0.8%) | 0 (0.0%) |
Employment Characteristics in Ranchettes
Employment by Class of Employer in Ranchettes
Among the 2,517 employed individuals in Ranchettes, private company employees (1,138 | 45.2%), federal government employees (290 | 11.5%), and state government employees (271 | 10.8%) make up the most common classes of employment.
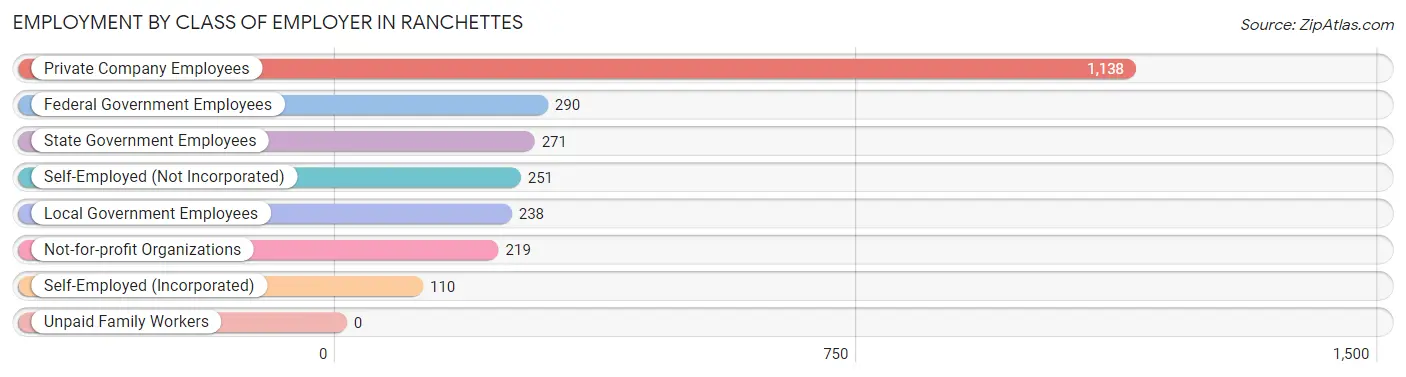
| Employer Class | # Employees | % Employees |
| Private Company Employees | 1,138 | 45.2% |
| Self-Employed (Incorporated) | 110 | 4.4% |
| Self-Employed (Not Incorporated) | 251 | 10.0% |
| Not-for-profit Organizations | 219 | 8.7% |
| Local Government Employees | 238 | 9.5% |
| State Government Employees | 271 | 10.8% |
| Federal Government Employees | 290 | 11.5% |
| Unpaid Family Workers | 0 | 0.0% |
| Total | 2,517 | 100.0% |
Employment Status by Age in Ranchettes
According to the labor force statistics for Ranchettes, out of the total population over 16 years of age (4,644), 56.2% or 2,610 individuals are in the labor force, with 1.7% or 44 of them unemployed. The age group with the highest labor force participation rate is 25 to 29 years, with 97.5% or 79 individuals in the labor force. Within the labor force, the 16 to 19 years age range has the highest percentage of unemployed individuals, with 40.0% or 24 of them being unemployed.
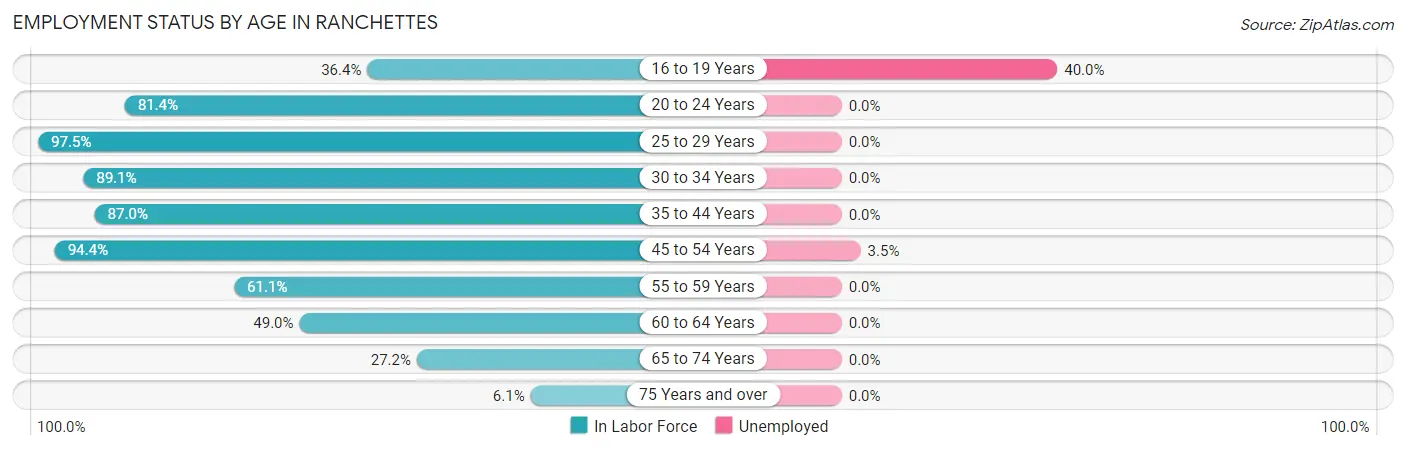
| Age Bracket | In Labor Force | Unemployed |
| 16 to 19 Years | 60 (36.4%) | 24 (40.0%) |
| 20 to 24 Years | 206 (81.4%) | 0 (0.0%) |
| 25 to 29 Years | 79 (97.5%) | 0 (0.0%) |
| 30 to 34 Years | 155 (89.1%) | 0 (0.0%) |
| 35 to 44 Years | 620 (87.0%) | 0 (0.0%) |
| 45 to 54 Years | 543 (94.4%) | 19 (3.5%) |
| 55 to 59 Years | 311 (61.1%) | 0 (0.0%) |
| 60 to 64 Years | 360 (49.0%) | 0 (0.0%) |
| 65 to 74 Years | 241 (27.2%) | 0 (0.0%) |
| 75 Years and over | 34 (6.1%) | 0 (0.0%) |
| Total | 2,610 (56.2%) | 44 (1.7%) |
Employment Status by Educational Attainment in Ranchettes
According to labor force statistics for Ranchettes, 74.2% of individuals (2,067) out of the total population between 25 and 64 years of age (2,786) are in the labor force, with 0.9% or 19 of them being unemployed. The group with the highest labor force participation rate are those with the educational attainment of less than high school, with 90.7% or 88 individuals in the labor force. Within the labor force, individuals with college / associate degree education have the highest percentage of unemployment, with 1.8% or 11 of them being unemployed.
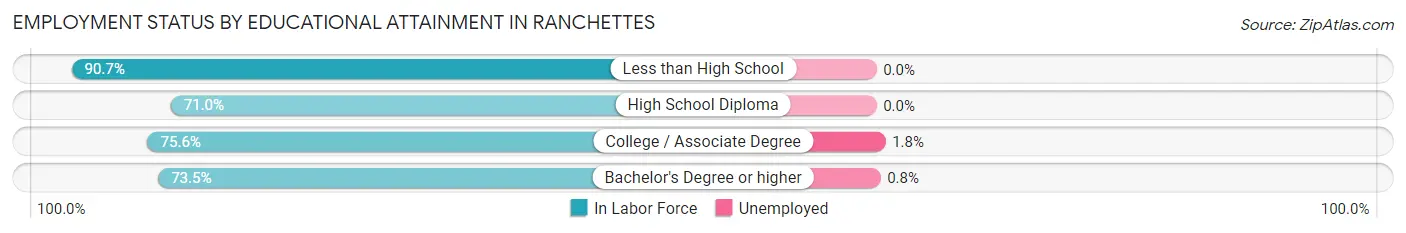
| Educational Attainment | In Labor Force | Unemployed |
| Less than High School | 88 (90.7%) | 0 (0.0%) |
| High School Diploma | 407 (71.0%) | 0 (0.0%) |
| College / Associate Degree | 628 (75.6%) | 15 (1.8%) |
| Bachelor's Degree or higher | 944 (73.5%) | 10 (0.8%) |
| Total | 2,067 (74.2%) | 25 (0.9%) |
Employment Occupations by Sex in Ranchettes
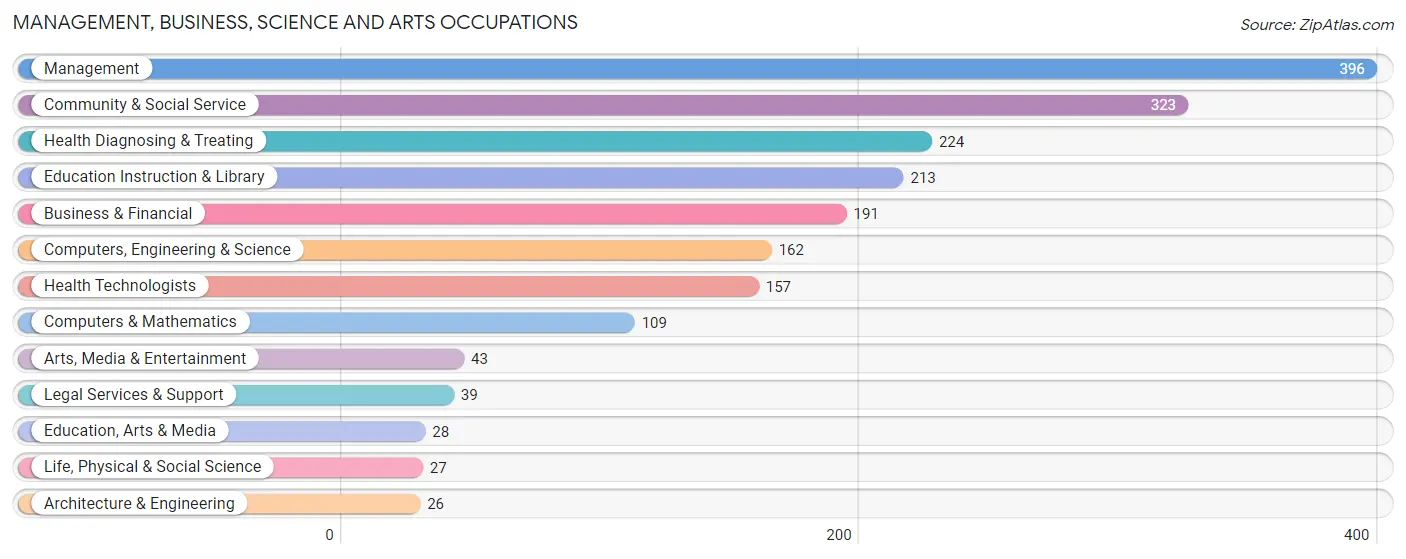
Management, Business, Science and Arts Occupations
The most common Management, Business, Science and Arts occupations in Ranchettes are Management (396 | 15.5%), Community & Social Service (323 | 12.7%), Health Diagnosing & Treating (224 | 8.8%), Education Instruction & Library (213 | 8.4%), and Business & Financial (191 | 7.5%).
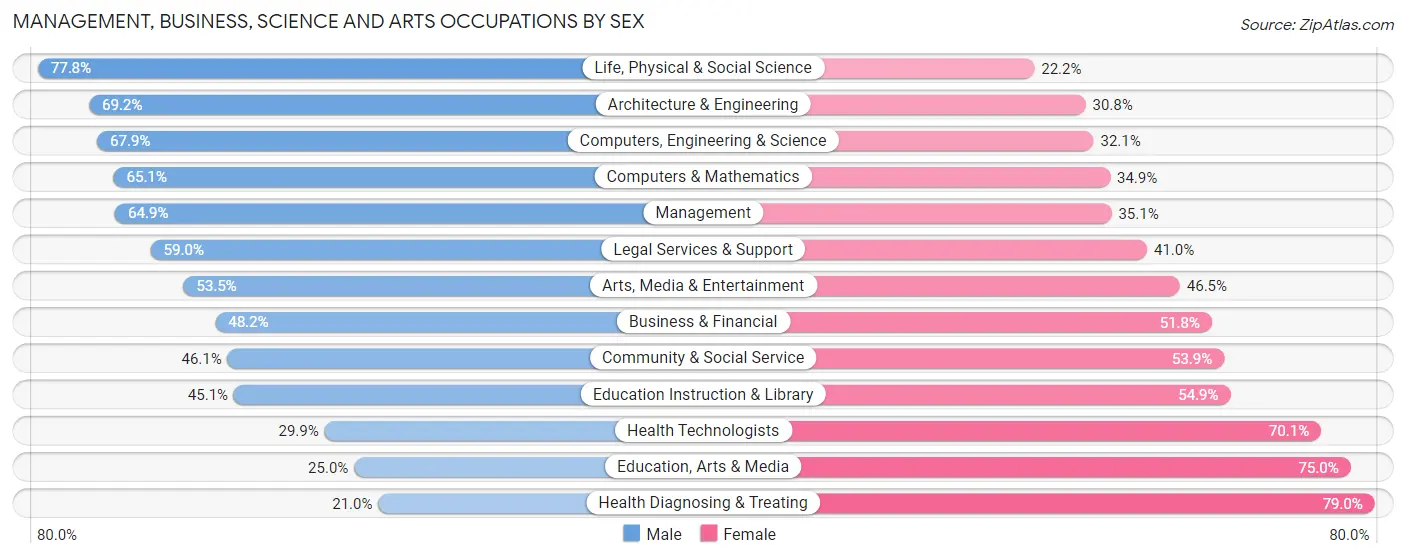
Management, Business, Science and Arts Occupations by Sex
Within the Management, Business, Science and Arts occupations in Ranchettes, the most male-oriented occupations are Life, Physical & Social Science (77.8%), Architecture & Engineering (69.2%), and Computers, Engineering & Science (67.9%), while the most female-oriented occupations are Health Diagnosing & Treating (79.0%), Education, Arts & Media (75.0%), and Health Technologists (70.1%).
| Occupation | Male | Female |
| Management | 257 (64.9%) | 139 (35.1%) |
| Business & Financial | 92 (48.2%) | 99 (51.8%) |
| Computers, Engineering & Science | 110 (67.9%) | 52 (32.1%) |
| Computers & Mathematics | 71 (65.1%) | 38 (34.9%) |
| Architecture & Engineering | 18 (69.2%) | 8 (30.8%) |
| Life, Physical & Social Science | 21 (77.8%) | 6 (22.2%) |
| Community & Social Service | 149 (46.1%) | 174 (53.9%) |
| Education, Arts & Media | 7 (25.0%) | 21 (75.0%) |
| Legal Services & Support | 23 (59.0%) | 16 (41.0%) |
| Education Instruction & Library | 96 (45.1%) | 117 (54.9%) |
| Arts, Media & Entertainment | 23 (53.5%) | 20 (46.5%) |
| Health Diagnosing & Treating | 47 (21.0%) | 177 (79.0%) |
| Health Technologists | 47 (29.9%) | 110 (70.1%) |
| Total (Category) | 655 (50.5%) | 641 (49.5%) |
| Total (Overall) | 1,375 (54.0%) | 1,171 (46.0%) |
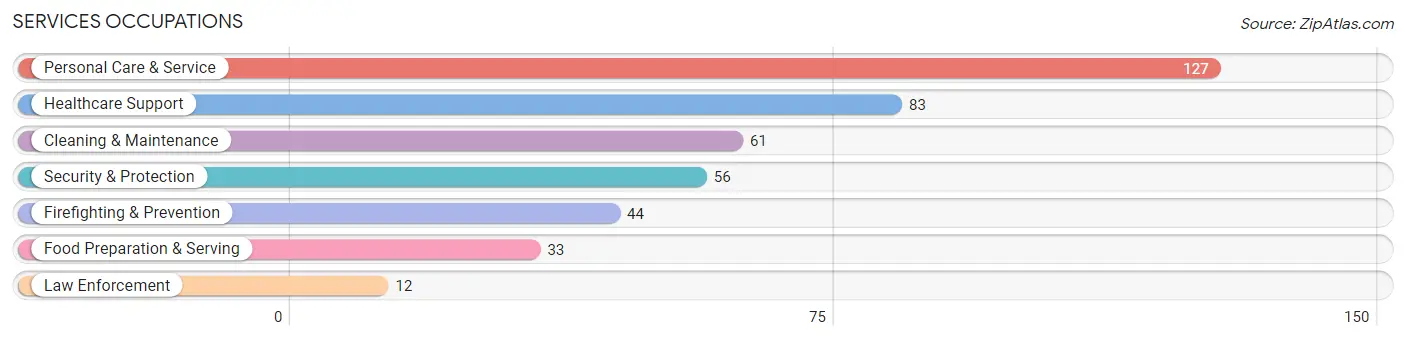
Services Occupations
The most common Services occupations in Ranchettes are Personal Care & Service (127 | 5.0%), Healthcare Support (83 | 3.3%), Cleaning & Maintenance (61 | 2.4%), Security & Protection (56 | 2.2%), and Firefighting & Prevention (44 | 1.7%).
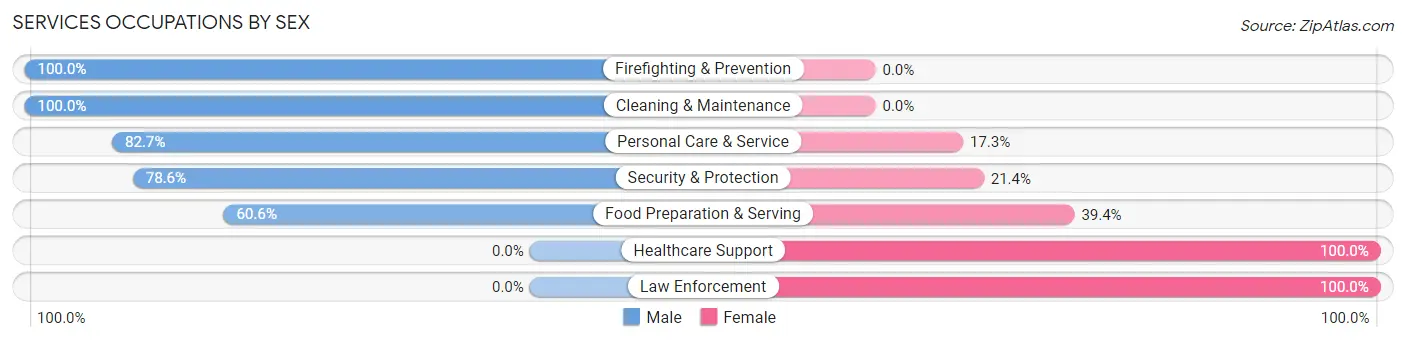
Services Occupations by Sex
Within the Services occupations in Ranchettes, the most male-oriented occupations are Firefighting & Prevention (100.0%), Cleaning & Maintenance (100.0%), and Personal Care & Service (82.7%), while the most female-oriented occupations are Healthcare Support (100.0%), Law Enforcement (100.0%), and Food Preparation & Serving (39.4%).
| Occupation | Male | Female |
| Healthcare Support | 0 (0.0%) | 83 (100.0%) |
| Security & Protection | 44 (78.6%) | 12 (21.4%) |
| Firefighting & Prevention | 44 (100.0%) | 0 (0.0%) |
| Law Enforcement | 0 (0.0%) | 12 (100.0%) |
| Food Preparation & Serving | 20 (60.6%) | 13 (39.4%) |
| Cleaning & Maintenance | 61 (100.0%) | 0 (0.0%) |
| Personal Care & Service | 105 (82.7%) | 22 (17.3%) |
| Total (Category) | 230 (63.9%) | 130 (36.1%) |
| Total (Overall) | 1,375 (54.0%) | 1,171 (46.0%) |
Sales and Office Occupations
The most common Sales and Office occupations in Ranchettes are Office & Administration (266 | 10.4%), and Sales & Related (198 | 7.8%).
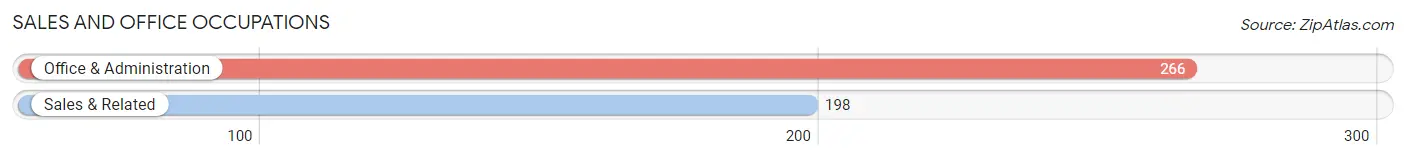
Sales and Office Occupations by Sex
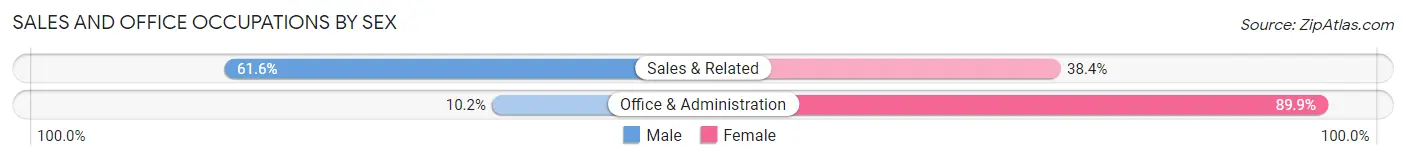
| Occupation | Male | Female |
| Sales & Related | 122 (61.6%) | 76 (38.4%) |
| Office & Administration | 27 (10.2%) | 239 (89.8%) |
| Total (Category) | 149 (32.1%) | 315 (67.9%) |
| Total (Overall) | 1,375 (54.0%) | 1,171 (46.0%) |
Natural Resources, Construction and Maintenance Occupations
The most common Natural Resources, Construction and Maintenance occupations in Ranchettes are Construction & Extraction (210 | 8.3%), Installation, Maintenance & Repair (66 | 2.6%), and Farming, Fishing & Forestry (8 | 0.3%).
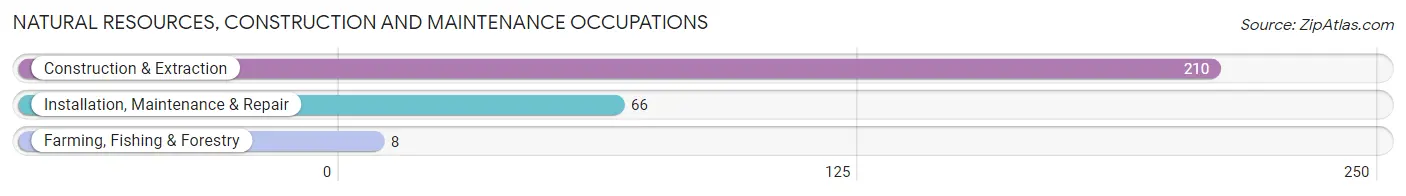
Natural Resources, Construction and Maintenance Occupations by Sex
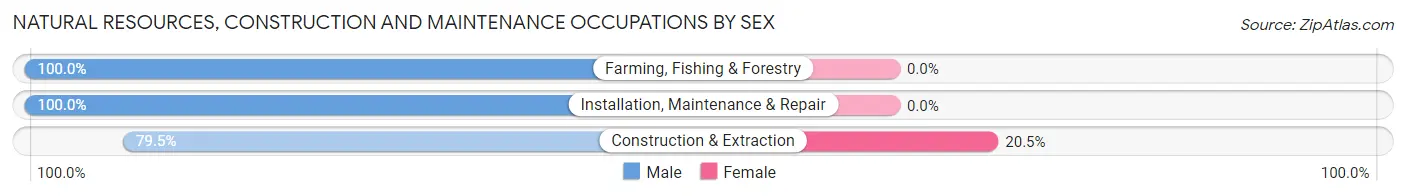
| Occupation | Male | Female |
| Farming, Fishing & Forestry | 8 (100.0%) | 0 (0.0%) |
| Construction & Extraction | 167 (79.5%) | 43 (20.5%) |
| Installation, Maintenance & Repair | 66 (100.0%) | 0 (0.0%) |
| Total (Category) | 241 (84.9%) | 43 (15.1%) |
| Total (Overall) | 1,375 (54.0%) | 1,171 (46.0%) |
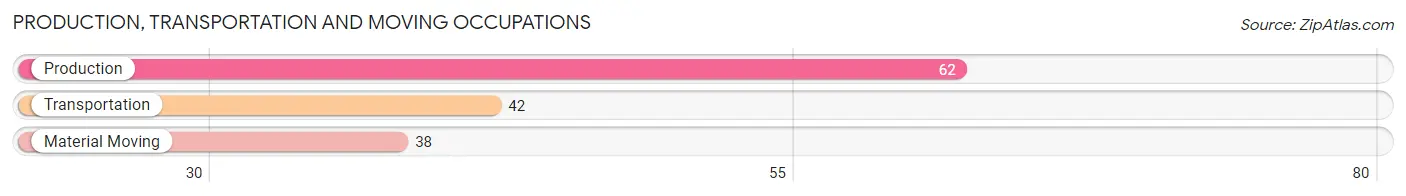
Production, Transportation and Moving Occupations
The most common Production, Transportation and Moving occupations in Ranchettes are Production (62 | 2.4%), Transportation (42 | 1.7%), and Material Moving (38 | 1.5%).
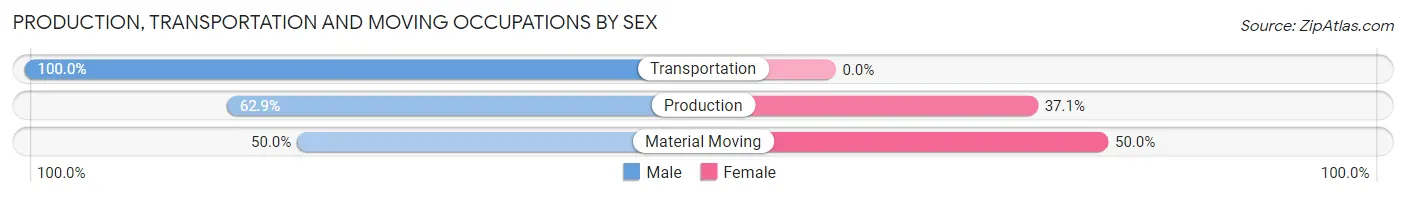
Production, Transportation and Moving Occupations by Sex
| Occupation | Male | Female |
| Production | 39 (62.9%) | 23 (37.1%) |
| Transportation | 42 (100.0%) | 0 (0.0%) |
| Material Moving | 19 (50.0%) | 19 (50.0%) |
| Total (Category) | 100 (70.4%) | 42 (29.6%) |
| Total (Overall) | 1,375 (54.0%) | 1,171 (46.0%) |
Employment Industries by Sex in Ranchettes
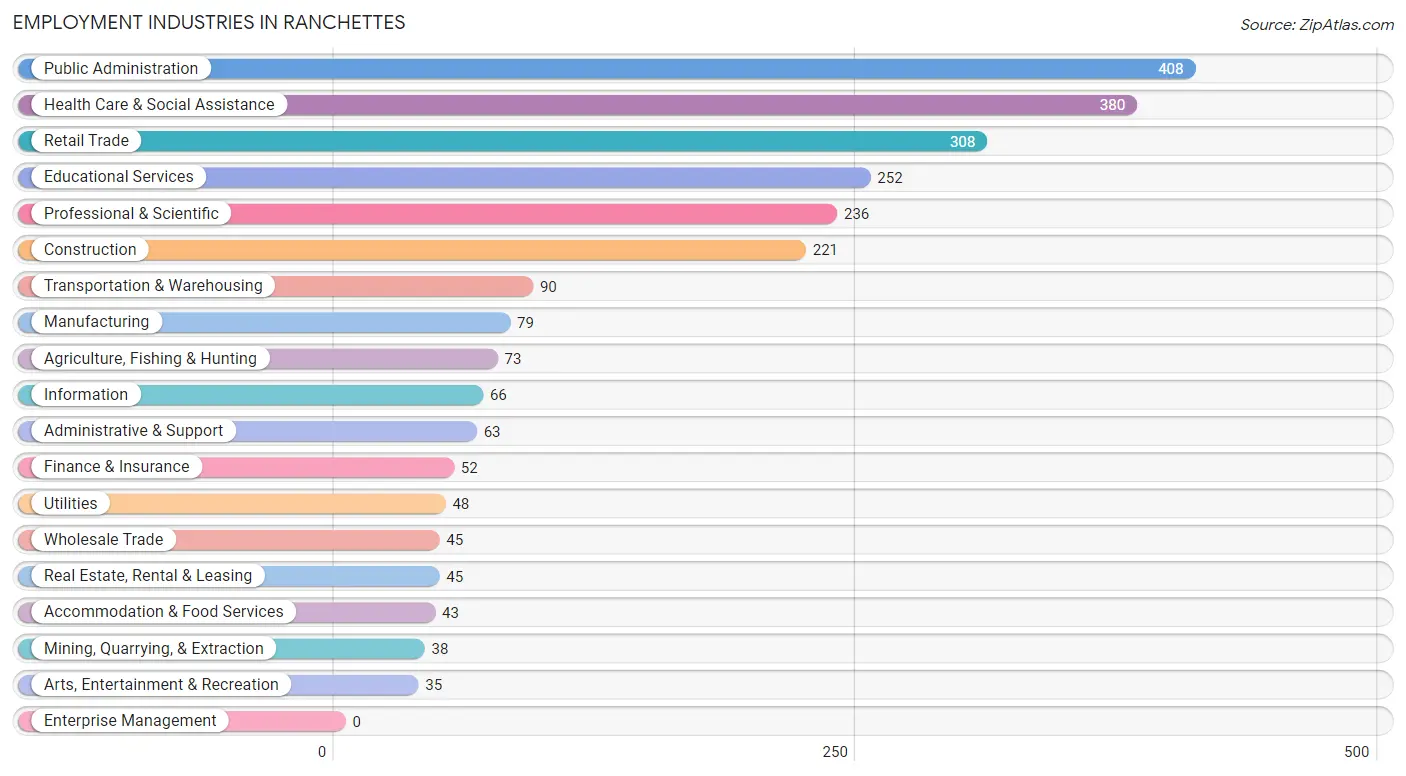
Employment Industries in Ranchettes
The major employment industries in Ranchettes include Public Administration (408 | 16.0%), Health Care & Social Assistance (380 | 14.9%), Retail Trade (308 | 12.1%), Educational Services (252 | 9.9%), and Professional & Scientific (236 | 9.3%).
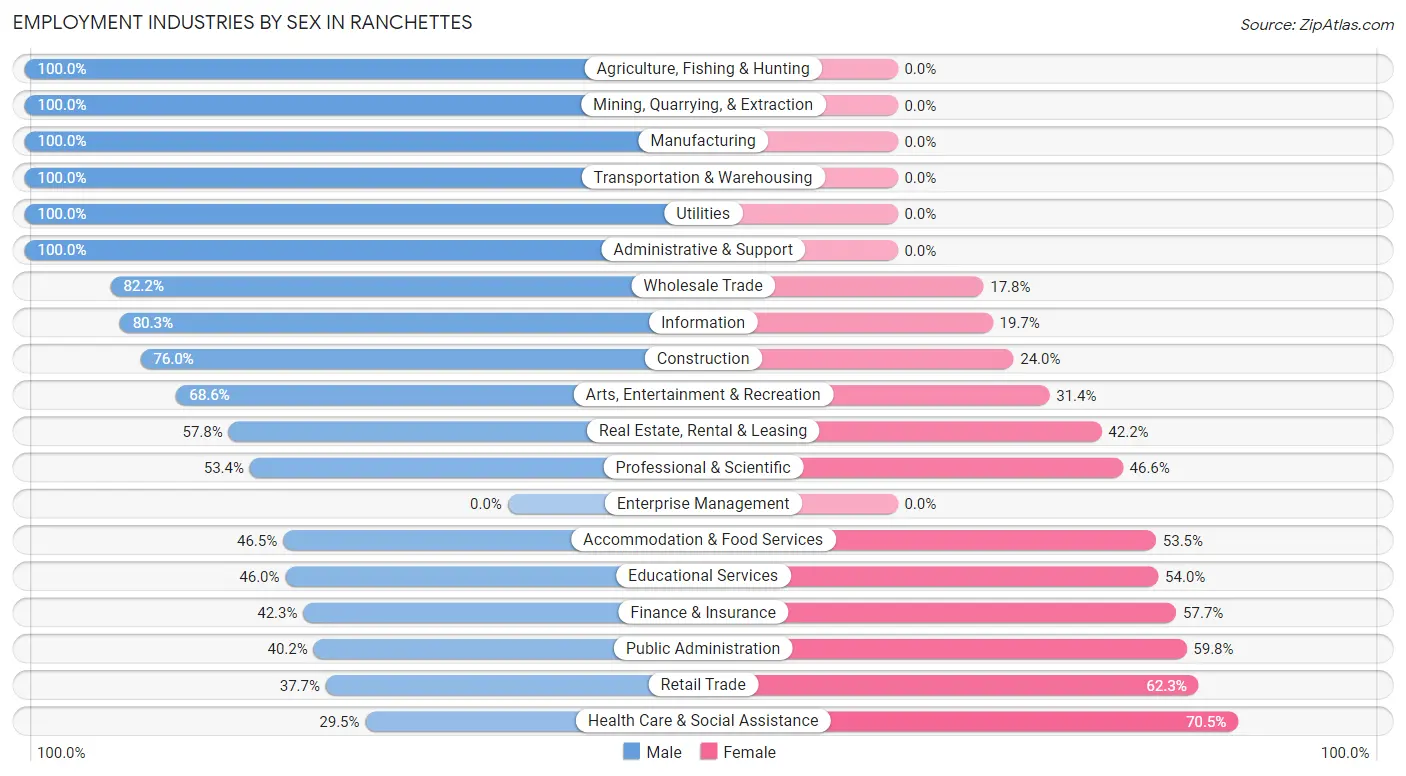
Employment Industries by Sex in Ranchettes
The Ranchettes industries that see more men than women are Agriculture, Fishing & Hunting (100.0%), Mining, Quarrying, & Extraction (100.0%), and Manufacturing (100.0%), whereas the industries that tend to have a higher number of women are Health Care & Social Assistance (70.5%), Retail Trade (62.3%), and Public Administration (59.8%).
| Industry | Male | Female |
| Agriculture, Fishing & Hunting | 73 (100.0%) | 0 (0.0%) |
| Mining, Quarrying, & Extraction | 38 (100.0%) | 0 (0.0%) |
| Construction | 168 (76.0%) | 53 (24.0%) |
| Manufacturing | 79 (100.0%) | 0 (0.0%) |
| Wholesale Trade | 37 (82.2%) | 8 (17.8%) |
| Retail Trade | 116 (37.7%) | 192 (62.3%) |
| Transportation & Warehousing | 90 (100.0%) | 0 (0.0%) |
| Utilities | 48 (100.0%) | 0 (0.0%) |
| Information | 53 (80.3%) | 13 (19.7%) |
| Finance & Insurance | 22 (42.3%) | 30 (57.7%) |
| Real Estate, Rental & Leasing | 26 (57.8%) | 19 (42.2%) |
| Professional & Scientific | 126 (53.4%) | 110 (46.6%) |
| Enterprise Management | 0 (0.0%) | 0 (0.0%) |
| Administrative & Support | 63 (100.0%) | 0 (0.0%) |
| Educational Services | 116 (46.0%) | 136 (54.0%) |
| Health Care & Social Assistance | 112 (29.5%) | 268 (70.5%) |
| Arts, Entertainment & Recreation | 24 (68.6%) | 11 (31.4%) |
| Accommodation & Food Services | 20 (46.5%) | 23 (53.5%) |
| Public Administration | 164 (40.2%) | 244 (59.8%) |
| Total | 1,375 (54.0%) | 1,171 (46.0%) |
Education in Ranchettes
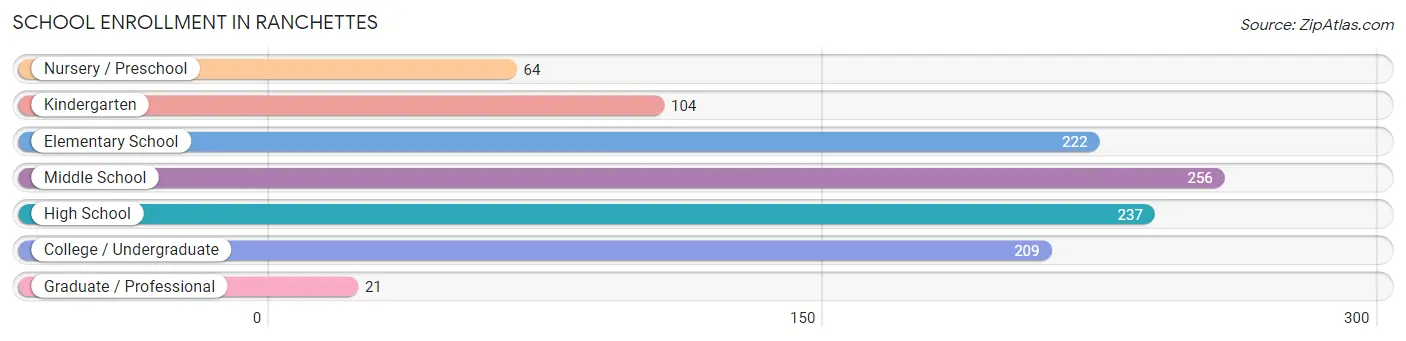
School Enrollment in Ranchettes
The most common levels of schooling among the 1,113 students in Ranchettes are middle school (256 | 23.0%), high school (237 | 21.3%), and elementary school (222 | 20.0%).
| School Level | # Students | % Students |
| Nursery / Preschool | 64 | 5.8% |
| Kindergarten | 104 | 9.3% |
| Elementary School | 222 | 20.0% |
| Middle School | 256 | 23.0% |
| High School | 237 | 21.3% |
| College / Undergraduate | 209 | 18.8% |
| Graduate / Professional | 21 | 1.9% |
| Total | 1,113 | 100.0% |
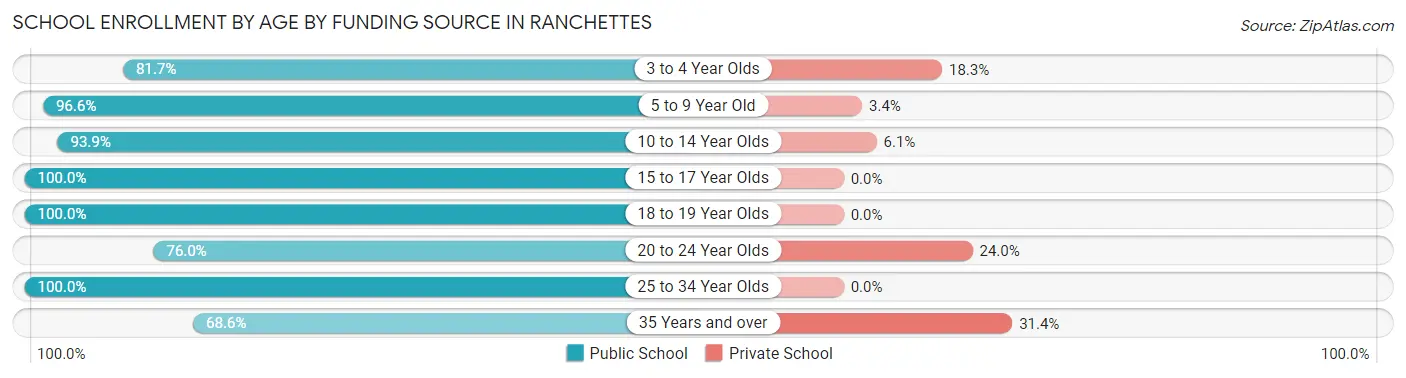
School Enrollment by Age by Funding Source in Ranchettes
Out of a total of 1,113 students who are enrolled in schools in Ranchettes, 102 (9.2%) attend a private institution, while the remaining 1,011 (90.8%) are enrolled in public schools. The age group of 35 years and over has the highest likelihood of being enrolled in private schools, with 43 (31.4% in the age bracket) enrolled. Conversely, the age group of 15 to 17 year olds has the lowest likelihood of being enrolled in a private school, with 207 (100.0% in the age bracket) attending a public institution.
| Age Bracket | Public School | Private School |
| 3 to 4 Year Olds | 49 (81.7%) | 11 (18.3%) |
| 5 to 9 Year Old | 225 (96.6%) | 8 (3.4%) |
| 10 to 14 Year Olds | 337 (93.9%) | 22 (6.1%) |
| 15 to 17 Year Olds | 207 (100.0%) | 0 (0.0%) |
| 18 to 19 Year Olds | 34 (100.0%) | 0 (0.0%) |
| 20 to 24 Year Olds | 57 (76.0%) | 18 (24.0%) |
| 25 to 34 Year Olds | 8 (100.0%) | 0 (0.0%) |
| 35 Years and over | 94 (68.6%) | 43 (31.4%) |
| Total | 1,011 (90.8%) | 102 (9.2%) |
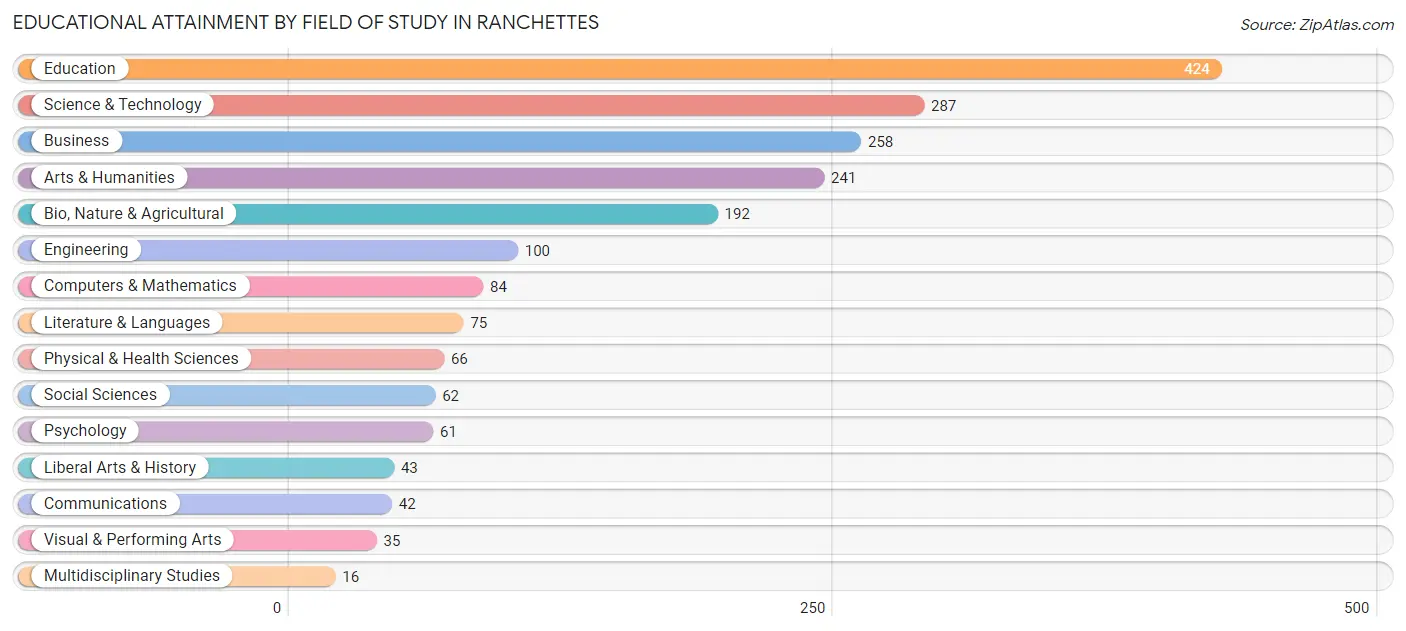
Educational Attainment by Field of Study in Ranchettes
Education (424 | 21.3%), science & technology (287 | 14.4%), business (258 | 13.0%), arts & humanities (241 | 12.1%), and bio, nature & agricultural (192 | 9.7%) are the most common fields of study among 1,986 individuals in Ranchettes who have obtained a bachelor's degree or higher.
| Field of Study | # Graduates | % Graduates |
| Computers & Mathematics | 84 | 4.2% |
| Bio, Nature & Agricultural | 192 | 9.7% |
| Physical & Health Sciences | 66 | 3.3% |
| Psychology | 61 | 3.1% |
| Social Sciences | 62 | 3.1% |
| Engineering | 100 | 5.0% |
| Multidisciplinary Studies | 16 | 0.8% |
| Science & Technology | 287 | 14.4% |
| Business | 258 | 13.0% |
| Education | 424 | 21.3% |
| Literature & Languages | 75 | 3.8% |
| Liberal Arts & History | 43 | 2.2% |
| Visual & Performing Arts | 35 | 1.8% |
| Communications | 42 | 2.1% |
| Arts & Humanities | 241 | 12.1% |
| Total | 1,986 | 100.0% |
Transportation & Commute in Ranchettes
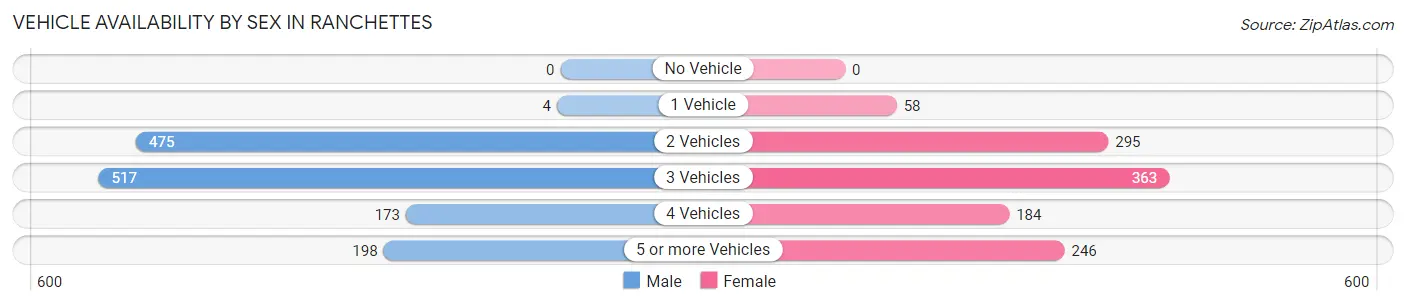
Vehicle Availability by Sex in Ranchettes
The most prevalent vehicle ownership categories in Ranchettes are males with 3 vehicles (517, accounting for 37.8%) and females with 3 vehicles (363, making up 45.1%).
| Vehicles Available | Male | Female |
| No Vehicle | 0 (0.0%) | 0 (0.0%) |
| 1 Vehicle | 4 (0.3%) | 58 (5.1%) |
| 2 Vehicles | 475 (34.7%) | 295 (25.7%) |
| 3 Vehicles | 517 (37.8%) | 363 (31.7%) |
| 4 Vehicles | 173 (12.7%) | 184 (16.1%) |
| 5 or more Vehicles | 198 (14.5%) | 246 (21.5%) |
| Total | 1,367 (100.0%) | 1,146 (100.0%) |
Commute Time in Ranchettes
The most frequently occuring commute durations in Ranchettes are 15 to 19 minutes (719 commuters, 33.6%), 10 to 14 minutes (544 commuters, 25.4%), and 20 to 24 minutes (337 commuters, 15.7%).
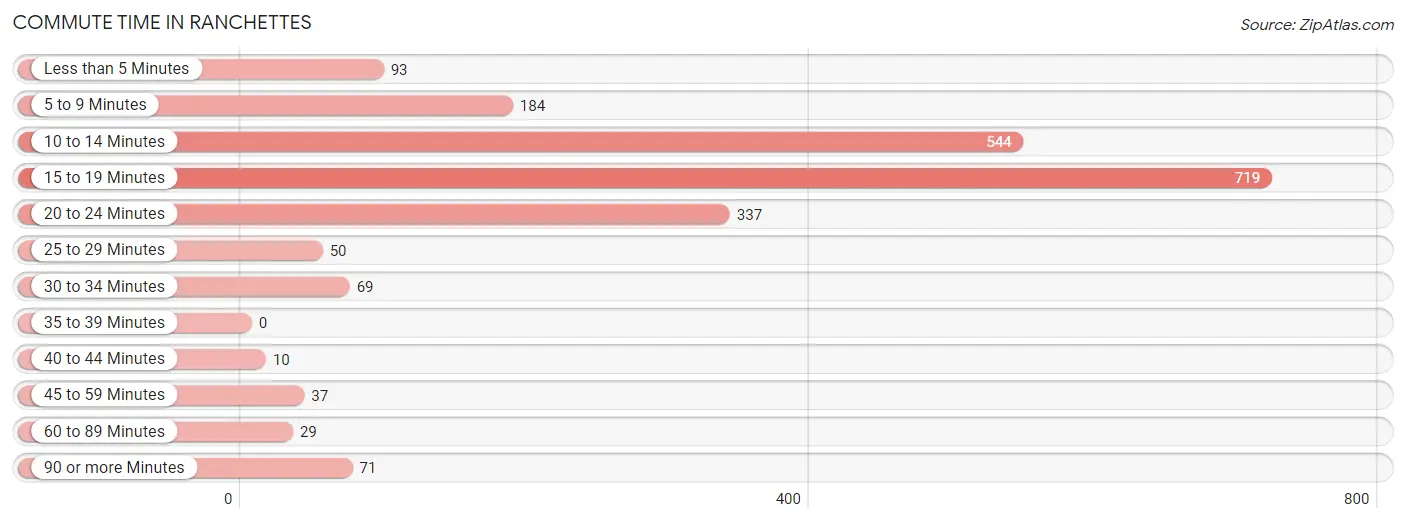
| Commute Time | # Commuters | % Commuters |
| Less than 5 Minutes | 93 | 4.3% |
| 5 to 9 Minutes | 184 | 8.6% |
| 10 to 14 Minutes | 544 | 25.4% |
| 15 to 19 Minutes | 719 | 33.6% |
| 20 to 24 Minutes | 337 | 15.7% |
| 25 to 29 Minutes | 50 | 2.3% |
| 30 to 34 Minutes | 69 | 3.2% |
| 35 to 39 Minutes | 0 | 0.0% |
| 40 to 44 Minutes | 10 | 0.5% |
| 45 to 59 Minutes | 37 | 1.7% |
| 60 to 89 Minutes | 29 | 1.3% |
| 90 or more Minutes | 71 | 3.3% |
Commute Time by Sex in Ranchettes
The most common commute times in Ranchettes are 15 to 19 minutes (408 commuters, 34.8%) for males and 15 to 19 minutes (311 commuters, 32.1%) for females.
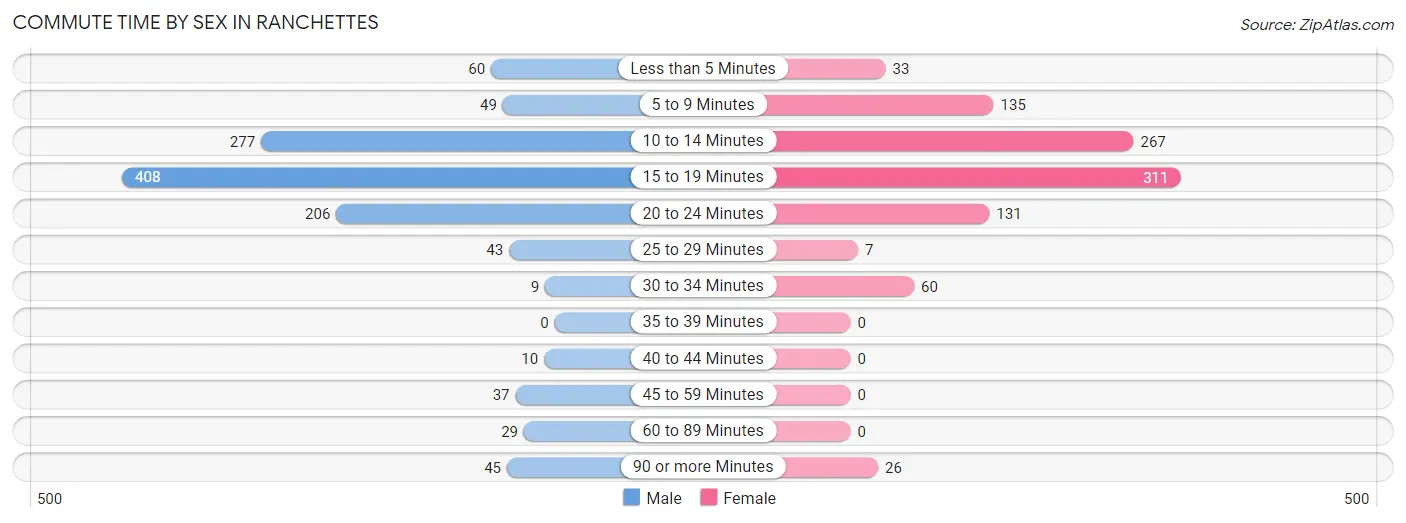
| Commute Time | Male | Female |
| Less than 5 Minutes | 60 (5.1%) | 33 (3.4%) |
| 5 to 9 Minutes | 49 (4.2%) | 135 (13.9%) |
| 10 to 14 Minutes | 277 (23.6%) | 267 (27.5%) |
| 15 to 19 Minutes | 408 (34.8%) | 311 (32.1%) |
| 20 to 24 Minutes | 206 (17.6%) | 131 (13.5%) |
| 25 to 29 Minutes | 43 (3.7%) | 7 (0.7%) |
| 30 to 34 Minutes | 9 (0.8%) | 60 (6.2%) |
| 35 to 39 Minutes | 0 (0.0%) | 0 (0.0%) |
| 40 to 44 Minutes | 10 (0.9%) | 0 (0.0%) |
| 45 to 59 Minutes | 37 (3.2%) | 0 (0.0%) |
| 60 to 89 Minutes | 29 (2.5%) | 0 (0.0%) |
| 90 or more Minutes | 45 (3.8%) | 26 (2.7%) |
Time of Departure to Work by Sex in Ranchettes
The most frequent times of departure to work in Ranchettes are 6:30 AM to 6:59 AM (290, 24.7%) for males and 7:30 AM to 7:59 AM (247, 25.5%) for females.
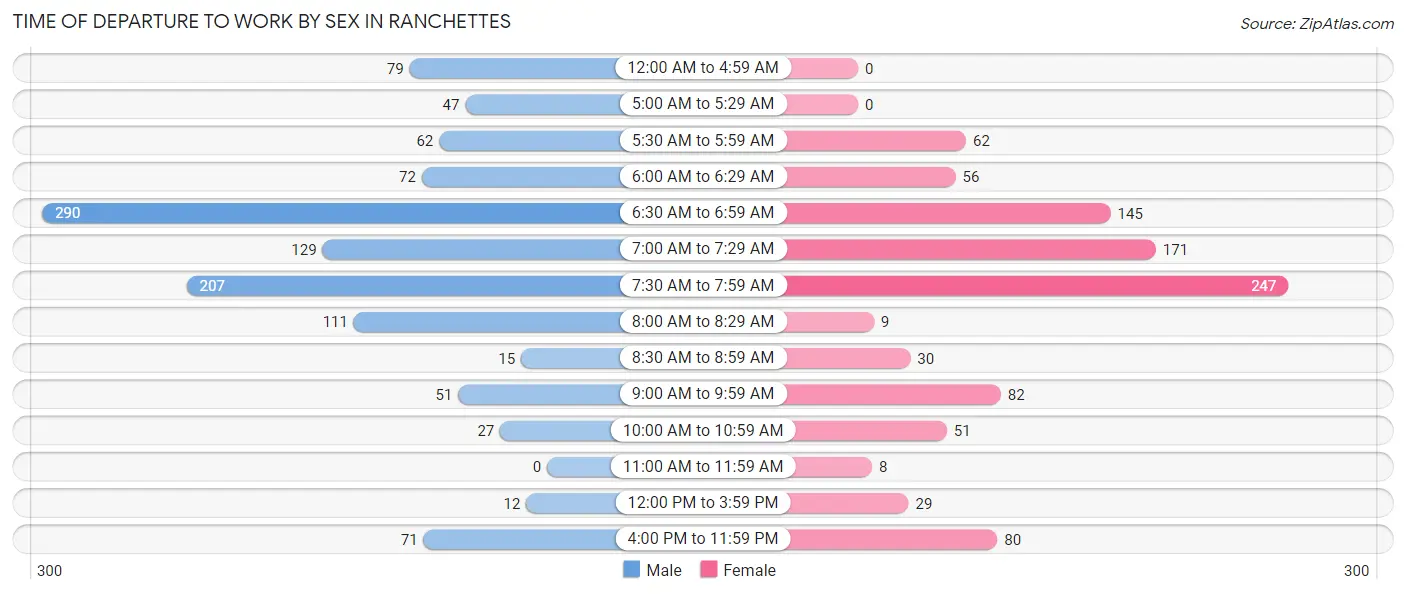
| Time of Departure | Male | Female |
| 12:00 AM to 4:59 AM | 79 (6.7%) | 0 (0.0%) |
| 5:00 AM to 5:29 AM | 47 (4.0%) | 0 (0.0%) |
| 5:30 AM to 5:59 AM | 62 (5.3%) | 62 (6.4%) |
| 6:00 AM to 6:29 AM | 72 (6.1%) | 56 (5.8%) |
| 6:30 AM to 6:59 AM | 290 (24.7%) | 145 (14.9%) |
| 7:00 AM to 7:29 AM | 129 (11.0%) | 171 (17.6%) |
| 7:30 AM to 7:59 AM | 207 (17.6%) | 247 (25.5%) |
| 8:00 AM to 8:29 AM | 111 (9.5%) | 9 (0.9%) |
| 8:30 AM to 8:59 AM | 15 (1.3%) | 30 (3.1%) |
| 9:00 AM to 9:59 AM | 51 (4.3%) | 82 (8.5%) |
| 10:00 AM to 10:59 AM | 27 (2.3%) | 51 (5.3%) |
| 11:00 AM to 11:59 AM | 0 (0.0%) | 8 (0.8%) |
| 12:00 PM to 3:59 PM | 12 (1.0%) | 29 (3.0%) |
| 4:00 PM to 11:59 PM | 71 (6.0%) | 80 (8.3%) |
| Total | 1,173 (100.0%) | 970 (100.0%) |
Housing Occupancy in Ranchettes
Occupancy by Ownership in Ranchettes
Of the total 2,255 dwellings in Ranchettes, owner-occupied units account for 2,075 (92.0%), while renter-occupied units make up 180 (8.0%).
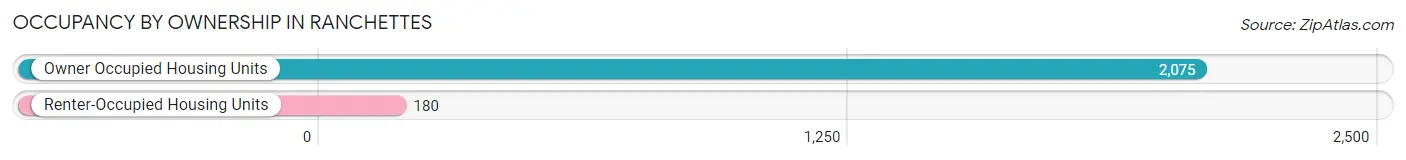
| Occupancy | # Housing Units | % Housing Units |
| Owner Occupied Housing Units | 2,075 | 92.0% |
| Renter-Occupied Housing Units | 180 | 8.0% |
| Total Occupied Housing Units | 2,255 | 100.0% |
Occupancy by Household Size in Ranchettes
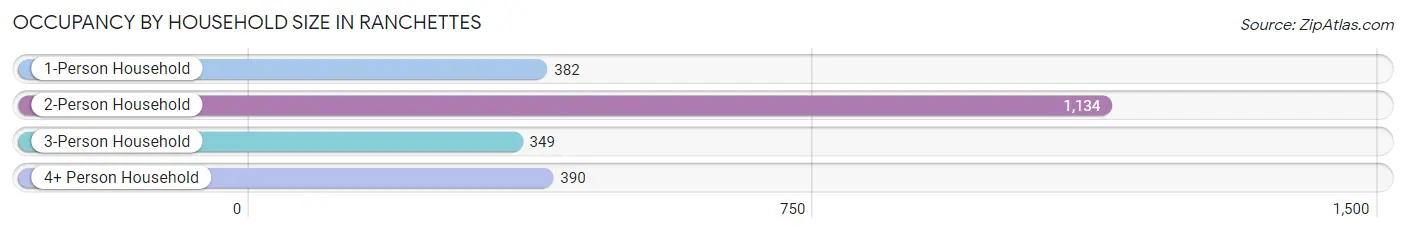
| Household Size | # Housing Units | % Housing Units |
| 1-Person Household | 382 | 16.9% |
| 2-Person Household | 1,134 | 50.3% |
| 3-Person Household | 349 | 15.5% |
| 4+ Person Household | 390 | 17.3% |
| Total Housing Units | 2,255 | 100.0% |
Occupancy by Ownership by Household Size in Ranchettes
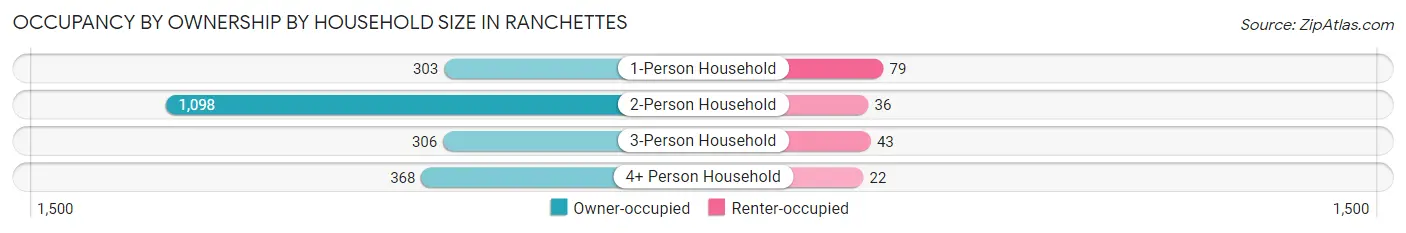
| Household Size | Owner-occupied | Renter-occupied |
| 1-Person Household | 303 (79.3%) | 79 (20.7%) |
| 2-Person Household | 1,098 (96.8%) | 36 (3.2%) |
| 3-Person Household | 306 (87.7%) | 43 (12.3%) |
| 4+ Person Household | 368 (94.4%) | 22 (5.6%) |
| Total Housing Units | 2,075 (92.0%) | 180 (8.0%) |
Occupancy by Educational Attainment in Ranchettes
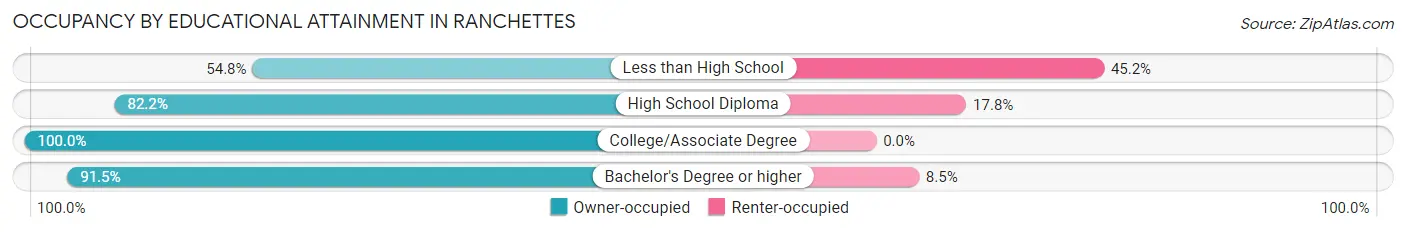
| Household Size | Owner-occupied | Renter-occupied |
| Less than High School | 17 (54.8%) | 14 (45.2%) |
| High School Diploma | 373 (82.2%) | 81 (17.8%) |
| College/Associate Degree | 766 (100.0%) | 0 (0.0%) |
| Bachelor's Degree or higher | 919 (91.5%) | 85 (8.5%) |
Occupancy by Age of Householder in Ranchettes
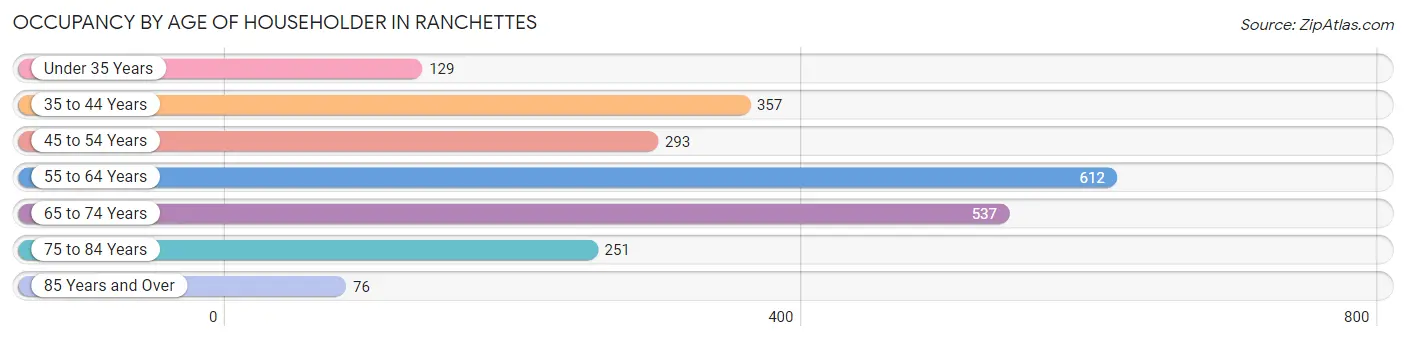
| Age Bracket | # Households | % Households |
| Under 35 Years | 129 | 5.7% |
| 35 to 44 Years | 357 | 15.8% |
| 45 to 54 Years | 293 | 13.0% |
| 55 to 64 Years | 612 | 27.1% |
| 65 to 74 Years | 537 | 23.8% |
| 75 to 84 Years | 251 | 11.1% |
| 85 Years and Over | 76 | 3.4% |
| Total | 2,255 | 100.0% |
Housing Finances in Ranchettes
Median Income by Occupancy in Ranchettes
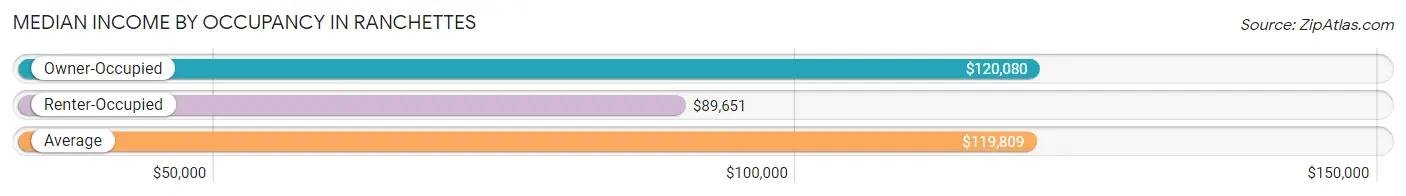
| Occupancy Type | # Households | Median Income |
| Owner-Occupied | 2,075 (92.0%) | $120,080 |
| Renter-Occupied | 180 (8.0%) | $89,651 |
| Average | 2,255 (100.0%) | $119,809 |
Occupancy by Householder Income Bracket in Ranchettes
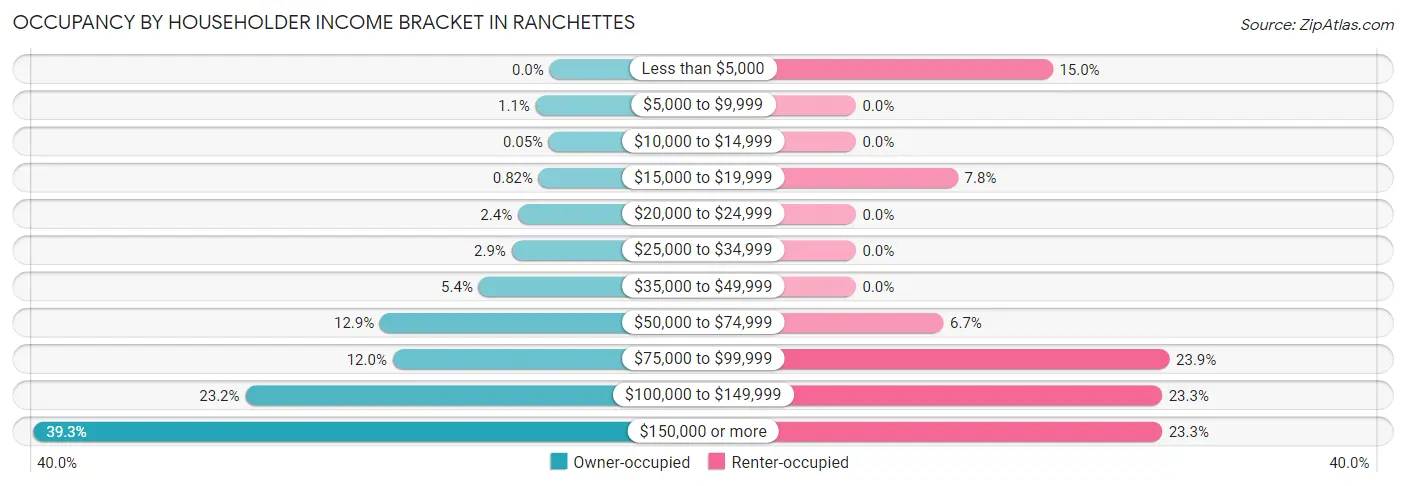
| Income Bracket | Owner-occupied | Renter-occupied |
| Less than $5,000 | 0 (0.0%) | 27 (15.0%) |
| $5,000 to $9,999 | 22 (1.1%) | 0 (0.0%) |
| $10,000 to $14,999 | 1 (0.1%) | 0 (0.0%) |
| $15,000 to $19,999 | 17 (0.8%) | 14 (7.8%) |
| $20,000 to $24,999 | 50 (2.4%) | 0 (0.0%) |
| $25,000 to $34,999 | 60 (2.9%) | 0 (0.0%) |
| $35,000 to $49,999 | 112 (5.4%) | 0 (0.0%) |
| $50,000 to $74,999 | 268 (12.9%) | 12 (6.7%) |
| $75,000 to $99,999 | 248 (11.9%) | 43 (23.9%) |
| $100,000 to $149,999 | 481 (23.2%) | 42 (23.3%) |
| $150,000 or more | 816 (39.3%) | 42 (23.3%) |
| Total | 2,075 (100.0%) | 180 (100.0%) |
Monthly Housing Cost Tiers in Ranchettes
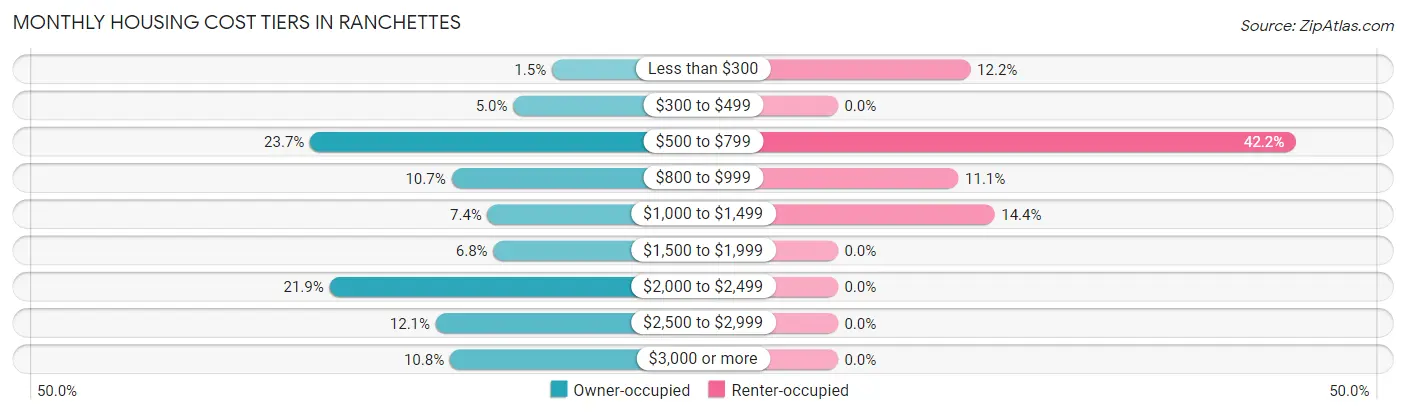
| Monthly Cost | Owner-occupied | Renter-occupied |
| Less than $300 | 30 (1.5%) | 22 (12.2%) |
| $300 to $499 | 104 (5.0%) | 0 (0.0%) |
| $500 to $799 | 492 (23.7%) | 76 (42.2%) |
| $800 to $999 | 222 (10.7%) | 20 (11.1%) |
| $1,000 to $1,499 | 153 (7.4%) | 26 (14.4%) |
| $1,500 to $1,999 | 142 (6.8%) | 0 (0.0%) |
| $2,000 to $2,499 | 455 (21.9%) | 0 (0.0%) |
| $2,500 to $2,999 | 252 (12.1%) | 0 (0.0%) |
| $3,000 or more | 225 (10.8%) | 0 (0.0%) |
| Total | 2,075 (100.0%) | 180 (100.0%) |
Physical Housing Characteristics in Ranchettes
Housing Structures in Ranchettes
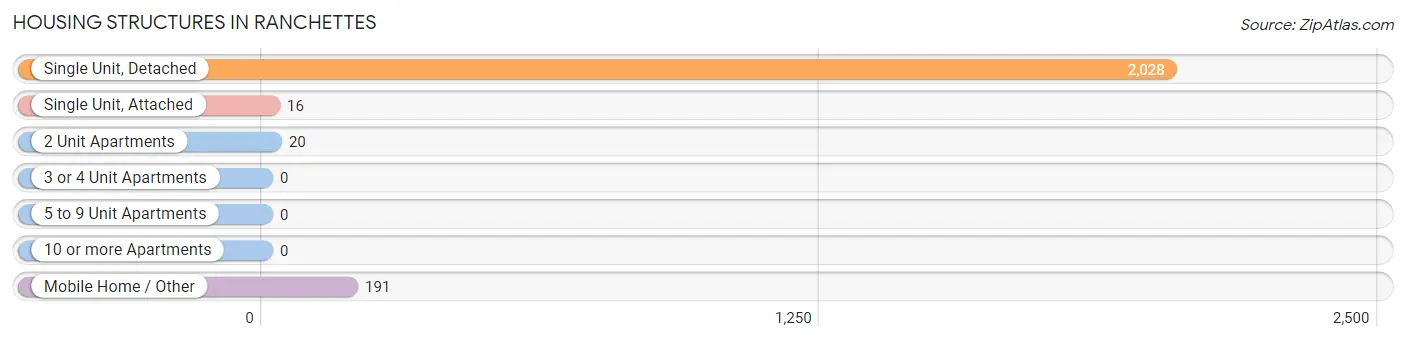
| Structure Type | # Housing Units | % Housing Units |
| Single Unit, Detached | 2,028 | 89.9% |
| Single Unit, Attached | 16 | 0.7% |
| 2 Unit Apartments | 20 | 0.9% |
| 3 or 4 Unit Apartments | 0 | 0.0% |
| 5 to 9 Unit Apartments | 0 | 0.0% |
| 10 or more Apartments | 0 | 0.0% |
| Mobile Home / Other | 191 | 8.5% |
| Total | 2,255 | 100.0% |
Housing Structures by Occupancy in Ranchettes
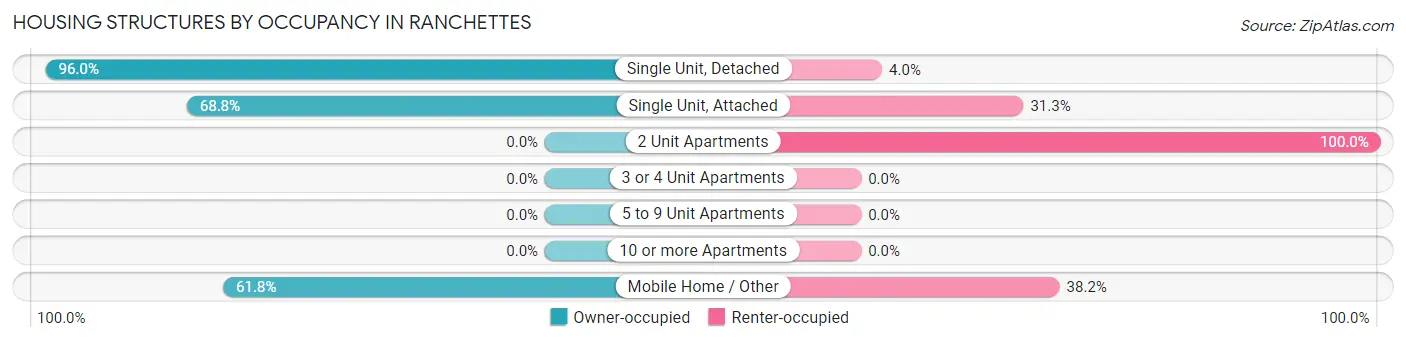
| Structure Type | Owner-occupied | Renter-occupied |
| Single Unit, Detached | 1,946 (96.0%) | 82 (4.0%) |
| Single Unit, Attached | 11 (68.8%) | 5 (31.2%) |
| 2 Unit Apartments | 0 (0.0%) | 20 (100.0%) |
| 3 or 4 Unit Apartments | 0 (0.0%) | 0 (0.0%) |
| 5 to 9 Unit Apartments | 0 (0.0%) | 0 (0.0%) |
| 10 or more Apartments | 0 (0.0%) | 0 (0.0%) |
| Mobile Home / Other | 118 (61.8%) | 73 (38.2%) |
| Total | 2,075 (92.0%) | 180 (8.0%) |
Housing Structures by Number of Rooms in Ranchettes
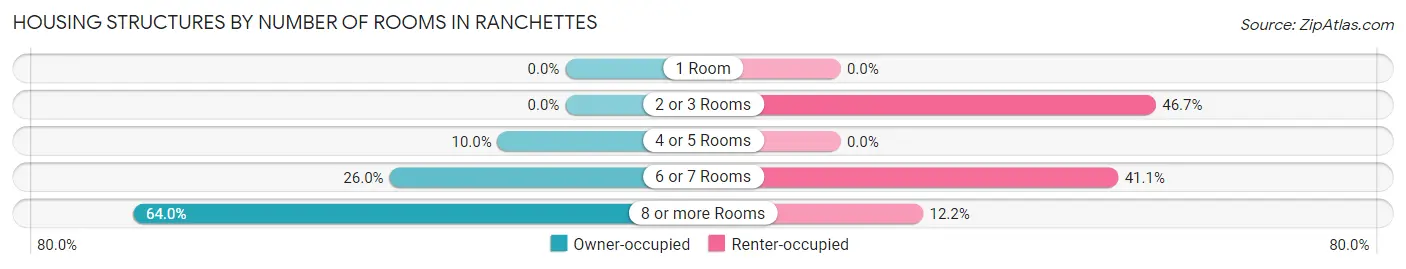
| Number of Rooms | Owner-occupied | Renter-occupied |
| 1 Room | 0 (0.0%) | 0 (0.0%) |
| 2 or 3 Rooms | 0 (0.0%) | 84 (46.7%) |
| 4 or 5 Rooms | 208 (10.0%) | 0 (0.0%) |
| 6 or 7 Rooms | 540 (26.0%) | 74 (41.1%) |
| 8 or more Rooms | 1,327 (63.9%) | 22 (12.2%) |
| Total | 2,075 (100.0%) | 180 (100.0%) |
Housing Structure by Heating Type in Ranchettes
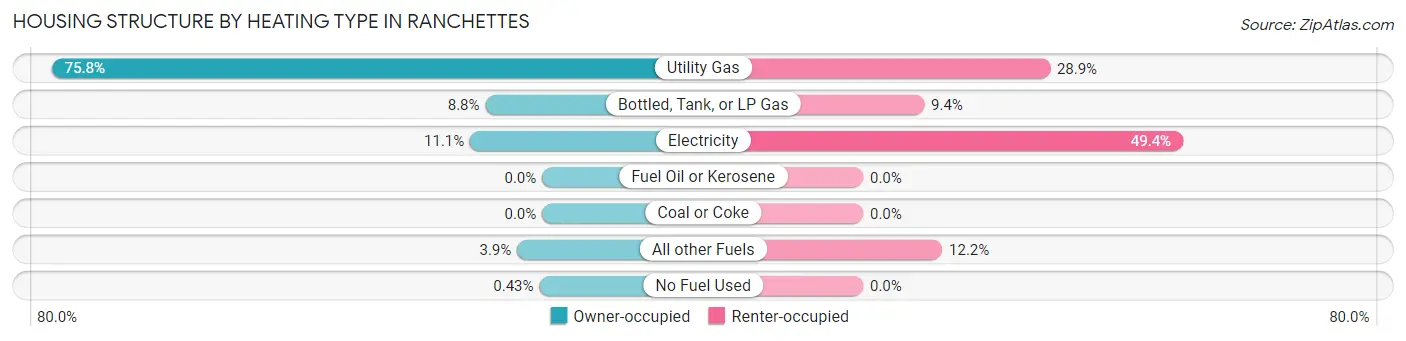
| Heating Type | Owner-occupied | Renter-occupied |
| Utility Gas | 1,573 (75.8%) | 52 (28.9%) |
| Bottled, Tank, or LP Gas | 182 (8.8%) | 17 (9.4%) |
| Electricity | 231 (11.1%) | 89 (49.4%) |
| Fuel Oil or Kerosene | 0 (0.0%) | 0 (0.0%) |
| Coal or Coke | 0 (0.0%) | 0 (0.0%) |
| All other Fuels | 80 (3.9%) | 22 (12.2%) |
| No Fuel Used | 9 (0.4%) | 0 (0.0%) |
| Total | 2,075 (100.0%) | 180 (100.0%) |
Household Vehicle Usage in Ranchettes
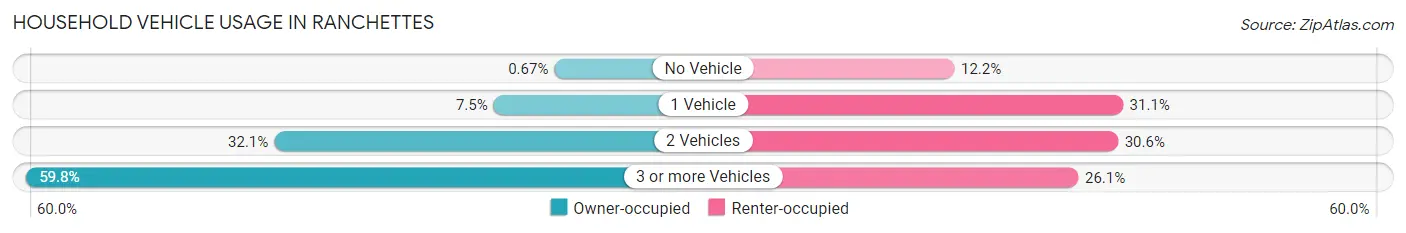
| Vehicles per Household | Owner-occupied | Renter-occupied |
| No Vehicle | 14 (0.7%) | 22 (12.2%) |
| 1 Vehicle | 155 (7.5%) | 56 (31.1%) |
| 2 Vehicles | 665 (32.1%) | 55 (30.6%) |
| 3 or more Vehicles | 1,241 (59.8%) | 47 (26.1%) |
| Total | 2,075 (100.0%) | 180 (100.0%) |
Real Estate & Mortgages in Ranchettes
Real Estate and Mortgage Overview in Ranchettes
| Characteristic | Without Mortgage | With Mortgage |
| Housing Units | 862 | 1,213 |
| Median Property Value | $508,900 | $525,700 |
| Median Household Income | $101,932 | $562 |
| Monthly Housing Costs | $666 | $225 |
| Real Estate Taxes | $2,491 | $13 |
Property Value by Mortgage Status in Ranchettes
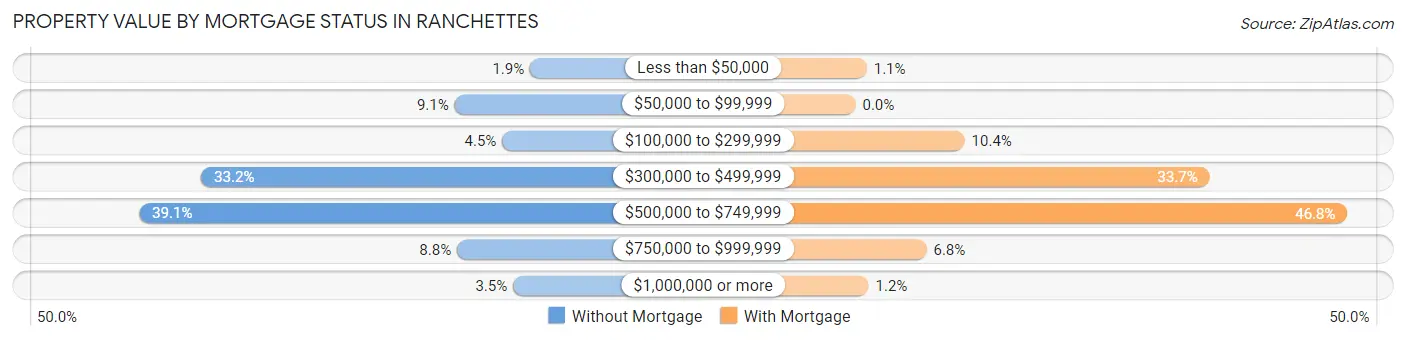
| Property Value | Without Mortgage | With Mortgage |
| Less than $50,000 | 16 (1.9%) | 13 (1.1%) |
| $50,000 to $99,999 | 78 (9.0%) | 0 (0.0%) |
| $100,000 to $299,999 | 39 (4.5%) | 126 (10.4%) |
| $300,000 to $499,999 | 286 (33.2%) | 409 (33.7%) |
| $500,000 to $749,999 | 337 (39.1%) | 568 (46.8%) |
| $750,000 to $999,999 | 76 (8.8%) | 82 (6.8%) |
| $1,000,000 or more | 30 (3.5%) | 15 (1.2%) |
| Total | 862 (100.0%) | 1,213 (100.0%) |
Household Income by Mortgage Status in Ranchettes
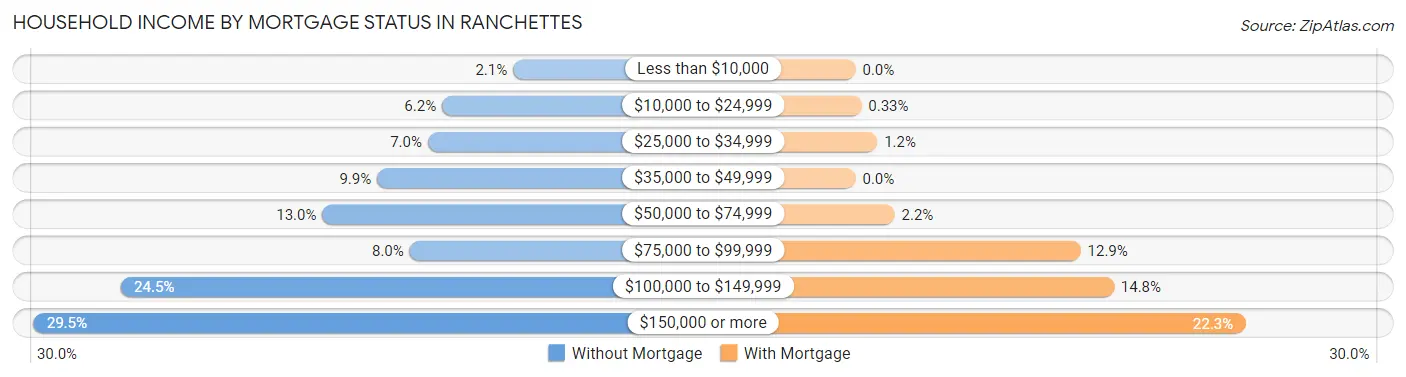
| Household Income | Without Mortgage | With Mortgage |
| Less than $10,000 | 18 (2.1%) | 0 (0.0%) |
| $10,000 to $24,999 | 53 (6.1%) | 4 (0.3%) |
| $25,000 to $34,999 | 60 (7.0%) | 15 (1.2%) |
| $35,000 to $49,999 | 85 (9.9%) | 0 (0.0%) |
| $50,000 to $74,999 | 112 (13.0%) | 27 (2.2%) |
| $75,000 to $99,999 | 69 (8.0%) | 156 (12.9%) |
| $100,000 to $149,999 | 211 (24.5%) | 179 (14.8%) |
| $150,000 or more | 254 (29.5%) | 270 (22.3%) |
| Total | 862 (100.0%) | 1,213 (100.0%) |
Property Value to Household Income Ratio in Ranchettes
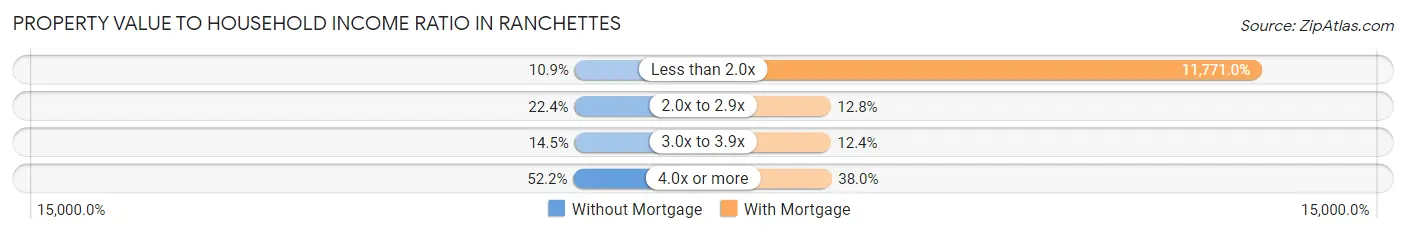
| Value-to-Income Ratio | Without Mortgage | With Mortgage |
| Less than 2.0x | 94 (10.9%) | 142,782 (11,771.0%) |
| 2.0x to 2.9x | 193 (22.4%) | 155 (12.8%) |
| 3.0x to 3.9x | 125 (14.5%) | 150 (12.4%) |
| 4.0x or more | 450 (52.2%) | 461 (38.0%) |
| Total | 862 (100.0%) | 1,213 (100.0%) |
Real Estate Taxes by Mortgage Status in Ranchettes
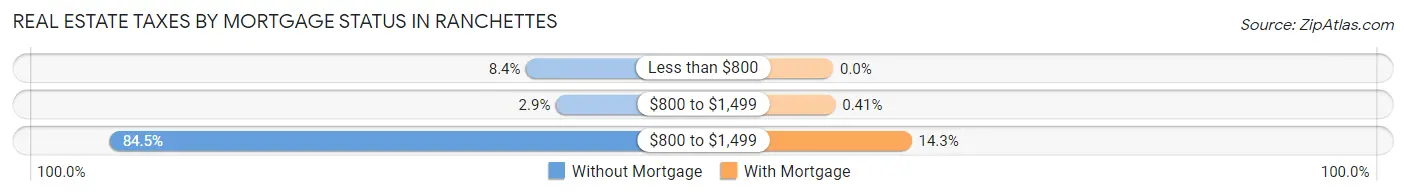
| Property Taxes | Without Mortgage | With Mortgage |
| Less than $800 | 72 (8.4%) | 0 (0.0%) |
| $800 to $1,499 | 25 (2.9%) | 5 (0.4%) |
| $800 to $1,499 | 728 (84.5%) | 174 (14.3%) |
| Total | 862 (100.0%) | 1,213 (100.0%) |
Health & Disability in Ranchettes
Health Insurance Coverage by Age in Ranchettes
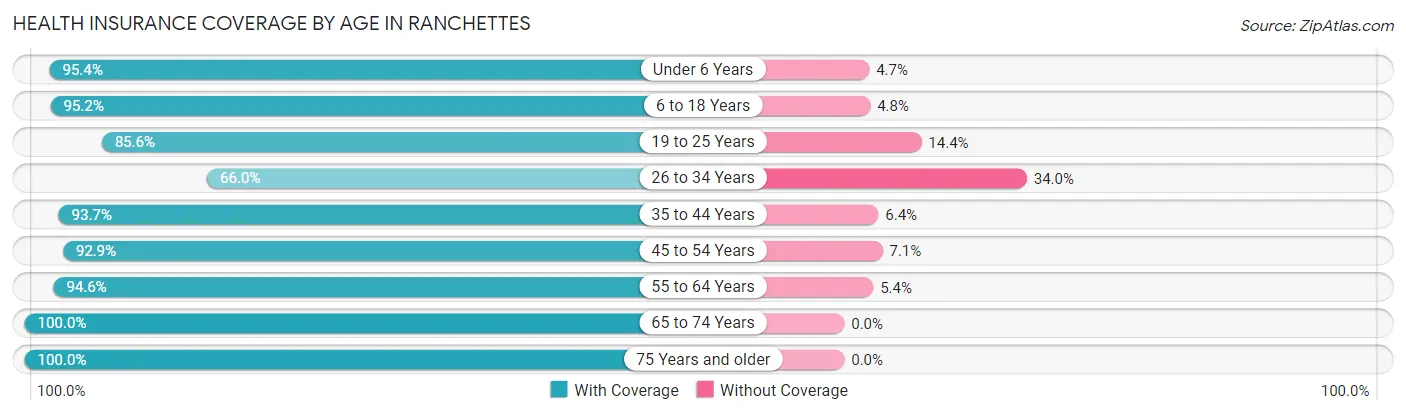
| Age Bracket | With Coverage | Without Coverage |
| Under 6 Years | 390 (95.4%) | 19 (4.6%) |
| 6 to 18 Years | 768 (95.2%) | 39 (4.8%) |
| 19 to 25 Years | 262 (85.6%) | 44 (14.4%) |
| 26 to 34 Years | 157 (66.0%) | 81 (34.0%) |
| 35 to 44 Years | 649 (93.6%) | 44 (6.4%) |
| 45 to 54 Years | 534 (92.9%) | 41 (7.1%) |
| 55 to 64 Years | 1,176 (94.6%) | 67 (5.4%) |
| 65 to 74 Years | 887 (100.0%) | 0 (0.0%) |
| 75 Years and older | 553 (100.0%) | 0 (0.0%) |
| Total | 5,376 (94.1%) | 335 (5.9%) |
Health Insurance Coverage by Citizenship Status in Ranchettes
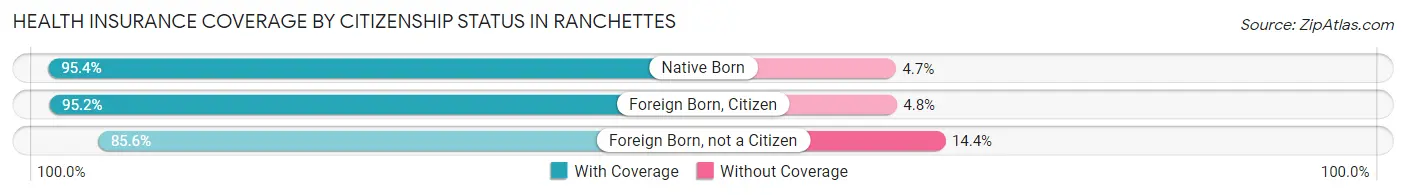
| Citizenship Status | With Coverage | Without Coverage |
| Native Born | 390 (95.4%) | 19 (4.6%) |
| Foreign Born, Citizen | 768 (95.2%) | 39 (4.8%) |
| Foreign Born, not a Citizen | 262 (85.6%) | 44 (14.4%) |
Health Insurance Coverage by Household Income in Ranchettes
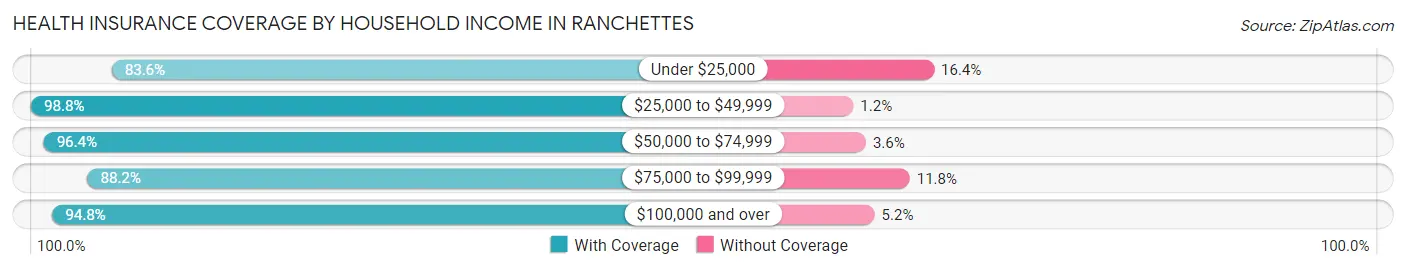
| Household Income | With Coverage | Without Coverage |
| Under $25,000 | 138 (83.6%) | 27 (16.4%) |
| $25,000 to $49,999 | 318 (98.8%) | 4 (1.2%) |
| $50,000 to $74,999 | 617 (96.4%) | 23 (3.6%) |
| $75,000 to $99,999 | 560 (88.2%) | 75 (11.8%) |
| $100,000 and over | 3,739 (94.8%) | 206 (5.2%) |
Public vs Private Health Insurance Coverage by Age in Ranchettes
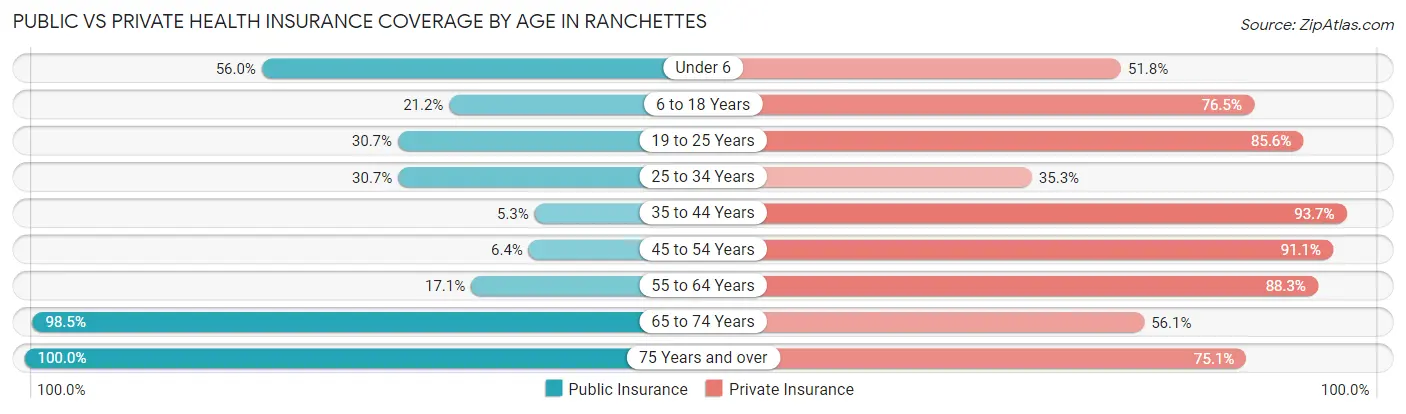
| Age Bracket | Public Insurance | Private Insurance |
| Under 6 | 229 (56.0%) | 212 (51.8%) |
| 6 to 18 Years | 171 (21.2%) | 617 (76.5%) |
| 19 to 25 Years | 94 (30.7%) | 262 (85.6%) |
| 25 to 34 Years | 73 (30.7%) | 84 (35.3%) |
| 35 to 44 Years | 37 (5.3%) | 649 (93.6%) |
| 45 to 54 Years | 37 (6.4%) | 524 (91.1%) |
| 55 to 64 Years | 213 (17.1%) | 1,098 (88.3%) |
| 65 to 74 Years | 874 (98.5%) | 498 (56.1%) |
| 75 Years and over | 553 (100.0%) | 415 (75.0%) |
| Total | 2,281 (39.9%) | 4,359 (76.3%) |
Disability Status by Sex by Age in Ranchettes
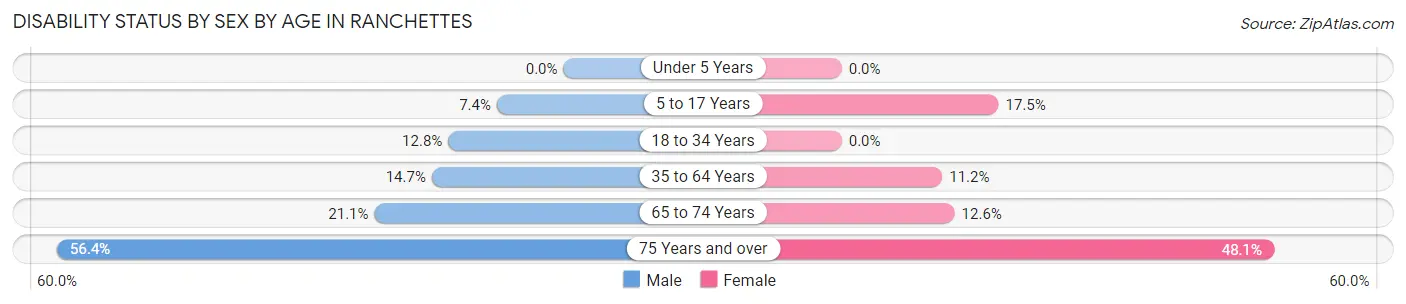
| Age Bracket | Male | Female |
| Under 5 Years | 0 (0.0%) | 0 (0.0%) |
| 5 to 17 Years | 34 (7.4%) | 73 (17.5%) |
| 18 to 34 Years | 34 (12.8%) | 0 (0.0%) |
| 35 to 64 Years | 190 (14.7%) | 136 (11.2%) |
| 65 to 74 Years | 108 (21.0%) | 47 (12.6%) |
| 75 Years and over | 163 (56.4%) | 127 (48.1%) |
Disability Class by Sex by Age in Ranchettes
Disability Class: Hearing Difficulty
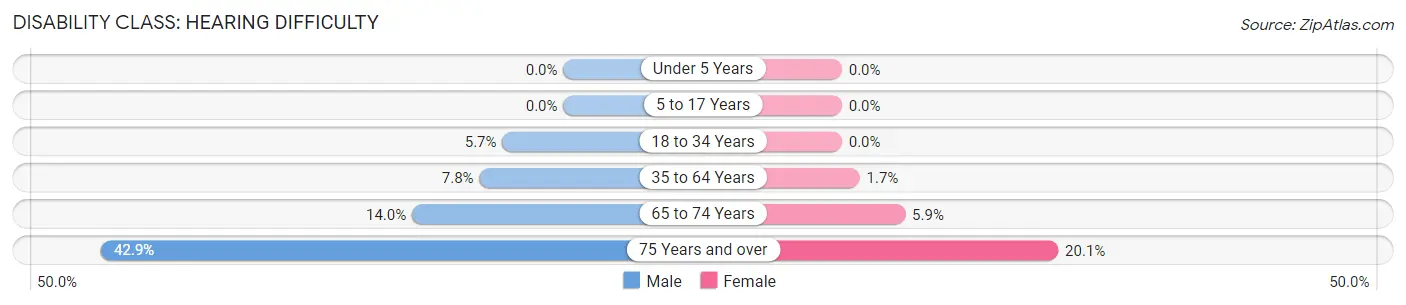
| Age Bracket | Male | Female |
| Under 5 Years | 0 (0.0%) | 0 (0.0%) |
| 5 to 17 Years | 0 (0.0%) | 0 (0.0%) |
| 18 to 34 Years | 15 (5.7%) | 0 (0.0%) |
| 35 to 64 Years | 101 (7.8%) | 20 (1.7%) |
| 65 to 74 Years | 72 (14.0%) | 22 (5.9%) |
| 75 Years and over | 124 (42.9%) | 53 (20.1%) |
Disability Class: Vision Difficulty
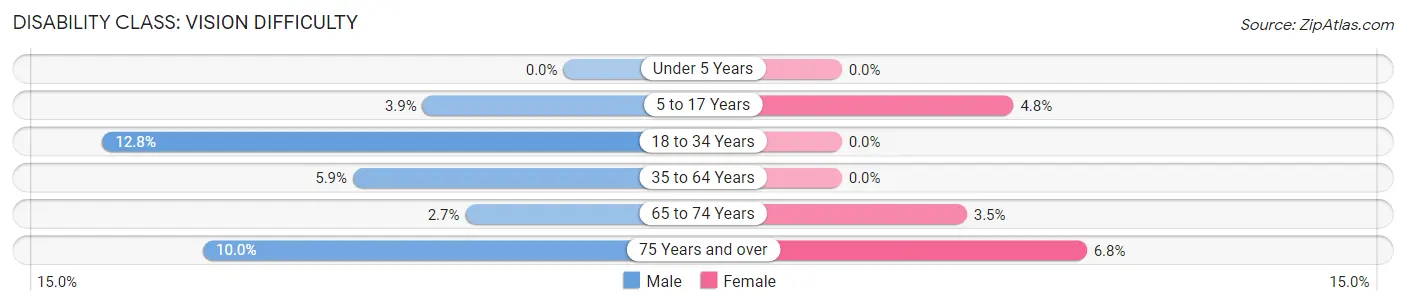
| Age Bracket | Male | Female |
| Under 5 Years | 0 (0.0%) | 0 (0.0%) |
| 5 to 17 Years | 18 (3.9%) | 20 (4.8%) |
| 18 to 34 Years | 34 (12.8%) | 0 (0.0%) |
| 35 to 64 Years | 76 (5.9%) | 0 (0.0%) |
| 65 to 74 Years | 14 (2.7%) | 13 (3.5%) |
| 75 Years and over | 29 (10.0%) | 18 (6.8%) |
Disability Class: Cognitive Difficulty
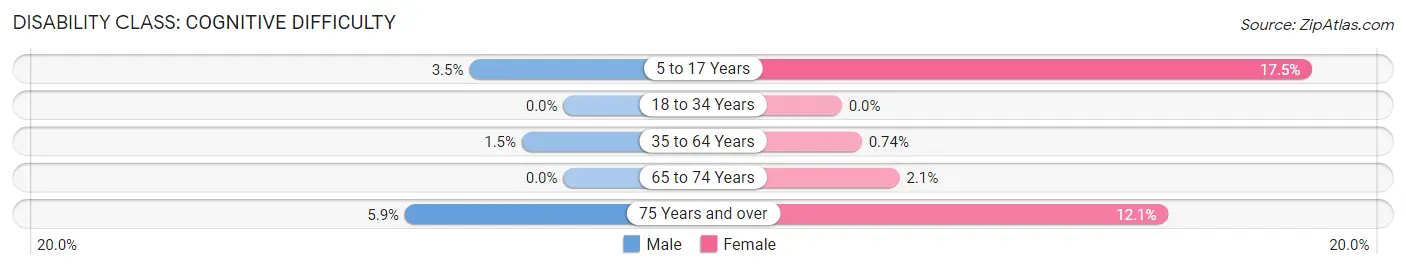
| Age Bracket | Male | Female |
| 5 to 17 Years | 16 (3.5%) | 73 (17.5%) |
| 18 to 34 Years | 0 (0.0%) | 0 (0.0%) |
| 35 to 64 Years | 20 (1.5%) | 9 (0.7%) |
| 65 to 74 Years | 0 (0.0%) | 8 (2.1%) |
| 75 Years and over | 17 (5.9%) | 32 (12.1%) |
Disability Class: Ambulatory Difficulty
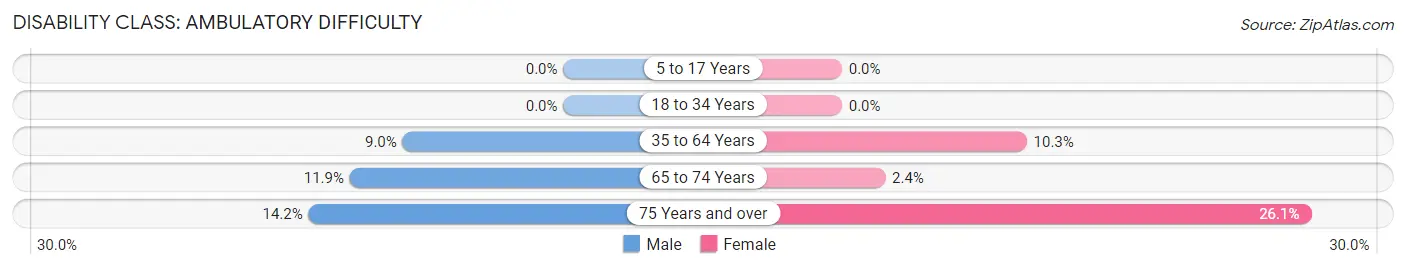
| Age Bracket | Male | Female |
| 5 to 17 Years | 0 (0.0%) | 0 (0.0%) |
| 18 to 34 Years | 0 (0.0%) | 0 (0.0%) |
| 35 to 64 Years | 116 (8.9%) | 125 (10.3%) |
| 65 to 74 Years | 61 (11.9%) | 9 (2.4%) |
| 75 Years and over | 41 (14.2%) | 69 (26.1%) |
Disability Class: Self-Care Difficulty

| Age Bracket | Male | Female |
| 5 to 17 Years | 0 (0.0%) | 19 (4.5%) |
| 18 to 34 Years | 0 (0.0%) | 0 (0.0%) |
| 35 to 64 Years | 61 (4.7%) | 54 (4.4%) |
| 65 to 74 Years | 14 (2.7%) | 0 (0.0%) |
| 75 Years and over | 18 (6.2%) | 21 (8.0%) |
Technology Access in Ranchettes
Computing Device Access in Ranchettes
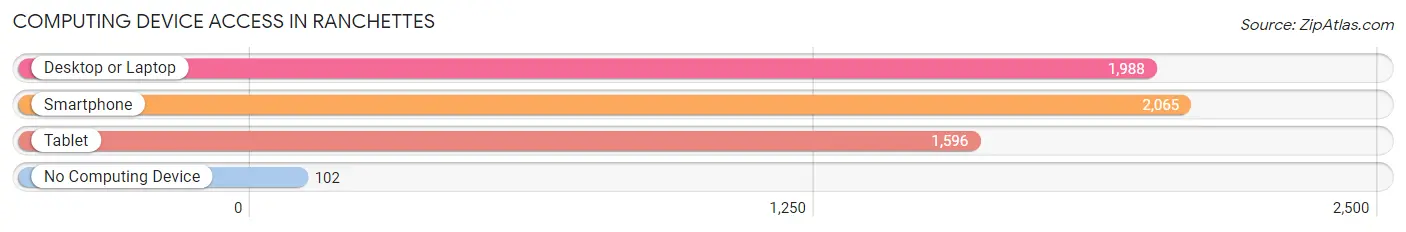
| Device Type | # Households | % Households |
| Desktop or Laptop | 1,988 | 88.2% |
| Smartphone | 2,065 | 91.6% |
| Tablet | 1,596 | 70.8% |
| No Computing Device | 102 | 4.5% |
| Total | 2,255 | 100.0% |
Internet Access in Ranchettes
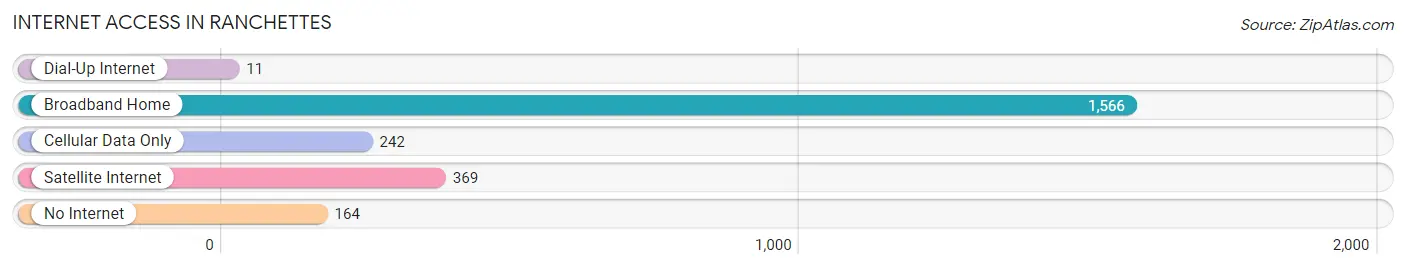
| Internet Type | # Households | % Households |
| Dial-Up Internet | 11 | 0.5% |
| Broadband Home | 1,566 | 69.5% |
| Cellular Data Only | 242 | 10.7% |
| Satellite Internet | 369 | 16.4% |
| No Internet | 164 | 7.3% |
| Total | 2,255 | 100.0% |
Ranchettes Summary
Ranchettes, Wyoming is a small unincorporated community located in Laramie County, Wyoming. It is situated in the southeastern part of the state, approximately 10 miles east of Cheyenne. The population of Ranchettes was estimated to be 1,845 in 2019.
History
Ranchettes was first settled in the late 1800s by ranchers and farmers who were attracted to the area by its fertile soil and abundant water supply. The community was originally known as "Rancho de los Rancheros" and was home to a number of small ranches. In the early 1900s, the area was annexed by the City of Cheyenne and the name was changed to Ranchettes.
The community grew steadily throughout the 20th century, and by the 1950s, it had become a popular destination for tourists and vacationers. The area was home to a number of resorts, restaurants, and other businesses catering to visitors.
Geography
Ranchettes is located in southeastern Wyoming, approximately 10 miles east of Cheyenne. The community is situated in the Laramie Basin, which is part of the Great Plains region of the United States. The area is characterized by rolling hills, grasslands, and open prairies.
The climate in Ranchettes is semi-arid, with hot summers and cold winters. The average annual temperature is approximately 50°F, and the average annual precipitation is approximately 16 inches.
Economy
The economy of Ranchettes is largely based on agriculture and tourism. The area is home to a number of small farms and ranches, which produce a variety of crops and livestock. Tourism is also an important part of the local economy, as the area is a popular destination for outdoor recreation and sightseeing.
In addition, Ranchettes is home to a number of businesses, including restaurants, retail stores, and service providers. The community is also home to a number of manufacturing and industrial businesses, which provide employment opportunities for local residents.
Demographics
As of 2019, the population of Ranchettes was estimated to be 1,845. The racial makeup of the community is predominantly white (90.2%), followed by Hispanic or Latino (4.7%), Native American (2.2%), and African American (1.2%).
The median household income in Ranchettes is approximately $50,000, and the median home value is approximately $200,000. The unemployment rate in the community is approximately 4.2%.
Conclusion
Ranchettes, Wyoming is a small unincorporated community located in Laramie County, Wyoming. It is situated in the southeastern part of the state, approximately 10 miles east of Cheyenne. The population of Ranchettes was estimated to be 1,845 in 2019. The economy of Ranchettes is largely based on agriculture and tourism, and the community is home to a number of businesses, including restaurants, retail stores, and service providers. The racial makeup of the community is predominantly white, followed by Hispanic or Latino, Native American, and African American. The median household income in Ranchettes is approximately $50,000, and the median home value is approximately $200,000.
Common Questions
What is the Total Population of Ranchettes?
Total Population of Ranchettes is 5,731.
What is the Total Male Population of Ranchettes?
Total Male Population of Ranchettes is 3,014.
What is the Total Female Population of Ranchettes?
Total Female Population of Ranchettes is 2,717.
What is the Ratio of Males per 100 Females in Ranchettes?
There are 110.93 Males per 100 Females in Ranchettes.
What is the Ratio of Females per 100 Males in Ranchettes?
There are 90.15 Females per 100 Males in Ranchettes.
What is the Median Population Age in Ranchettes?
Median Population Age in Ranchettes is 51.7 Years.
What is the Average Family Size in Ranchettes
Average Family Size in Ranchettes is 2.8 People.
What is the Average Household Size in Ranchettes
Average Household Size in Ranchettes is 2.5 People.
What is Per Capita Income in Ranchettes?
Per Capita income in Ranchettes is $54,076.
What is the Median Family Income in Ranchettes?
Median Family Income in Ranchettes is $121,915.
What is the Median Household income in Ranchettes?
Median Household Income in Ranchettes is $119,809.
What is Income or Wage Gap in Ranchettes?
Income or Wage Gap in Ranchettes is 16.5%.
Women in Ranchettes earn 83.5 cents for every dollar earned by a man.
What is Family Income Deficit in Ranchettes?
Family Income Deficit in Ranchettes is $7,815.
Families that are below poverty line in Ranchettes earn $7,815 less on average than the poverty threshold level.
What is Inequality or Gini Index in Ranchettes?
Inequality or Gini Index in Ranchettes is 0.35.
How Large is the Labor Force in Ranchettes?
There are 2,610 People in the Labor Forcein in Ranchettes.
What is the Percentage of People in the Labor Force in Ranchettes?
56.2% of People are in the Labor Force in Ranchettes.
What is the Unemployment Rate in Ranchettes?
Unemployment Rate in Ranchettes is 1.7%.