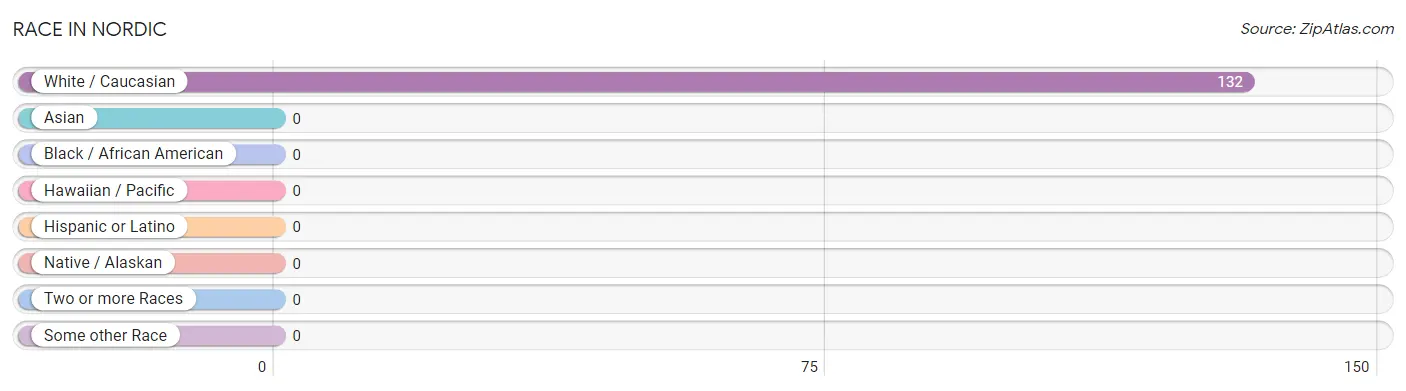
The most populous races in Nordic are , and White / Caucasian (132 | 100.0%).
Race
# Population
% Population
Asian
0
0.0%
Black / African American
0
0.0%
Hawaiian / Pacific
0
0.0%
Hispanic or Latino
0
0.0%
Native / Alaskan
0
0.0%
White / Caucasian
132
100.0%
Two or more Races
0
0.0%
Some other Race
0
0.0%
Total
132
100.0%
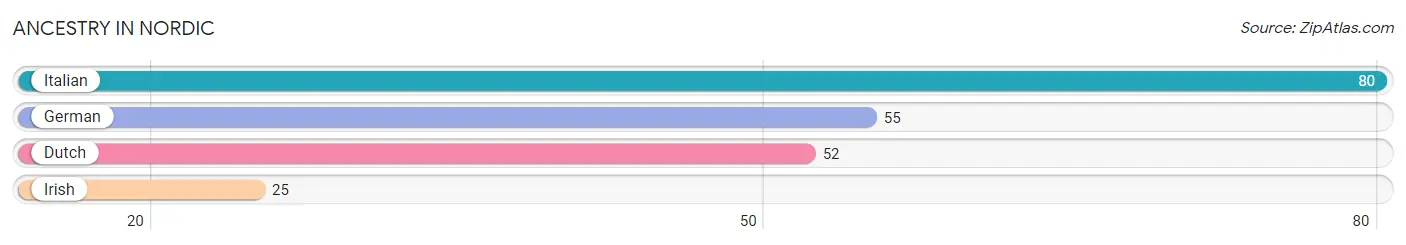
Ancestry in Nordic
The most populous ancestries reported in Nordic are Italian (80 | 60.6%), German (55 | 41.7%), Dutch (52 | 39.4%), and Irish (25 | 18.9%), together accounting for 160.6% of all Nordic residents.
Ancestry
# Population
% Population
Dutch
52
39.4%
German
55
41.7%
Irish
25
18.9%
Italian
80
60.6%
View All 4 Rows
Immigrants in Nordic
Immigration Origin
# Population
% Population
View All 0 Rows
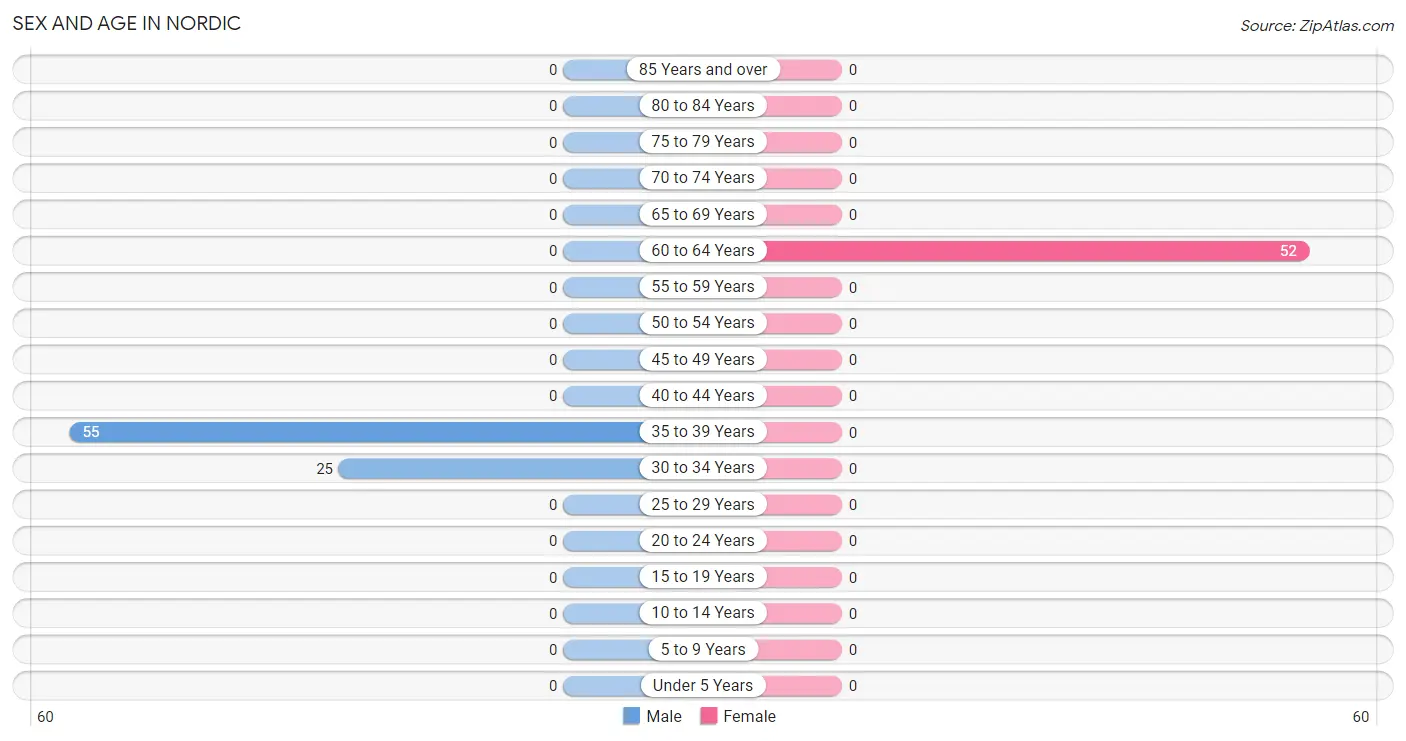
Sex and Age in Nordic
Sex and Age in Nordic
The most populous age groups in Nordic are 35 to 39 Years (55 | 68.8%) for men and 60 to 64 Years (52 | 100.0%) for women.
Age Bracket
Male
Female
Under 5 Years
0 (0.0%)
0 (0.0%)
5 to 9 Years
0 (0.0%)
0 (0.0%)
10 to 14 Years
0 (0.0%)
0 (0.0%)
15 to 19 Years
0 (0.0%)
0 (0.0%)
20 to 24 Years
0 (0.0%)
0 (0.0%)
25 to 29 Years
0 (0.0%)
0 (0.0%)
30 to 34 Years
25 (31.2%)
0 (0.0%)
35 to 39 Years
55 (68.8%)
0 (0.0%)
40 to 44 Years
0 (0.0%)
0 (0.0%)
45 to 49 Years
0 (0.0%)
0 (0.0%)
50 to 54 Years
0 (0.0%)
0 (0.0%)
55 to 59 Years
0 (0.0%)
0 (0.0%)
60 to 64 Years
0 (0.0%)
52 (100.0%)
65 to 69 Years
0 (0.0%)
0 (0.0%)
70 to 74 Years
0 (0.0%)
0 (0.0%)
75 to 79 Years
0 (0.0%)
0 (0.0%)
80 to 84 Years
0 (0.0%)
0 (0.0%)
85 Years and over
0 (0.0%)
0 (0.0%)
Total
80 (100.0%)
52 (100.0%)
Families and Households in Nordic
Median Family Size in Nordic
Family Type
# Families
Family Size
Married-Couple
0 (0.0%)
-
Single Male/Father
0 (0.0%)
-
Single Female/Mother
0 (0.0%)
-
Total Families
0 (0.0%)
-
Median Household Size in Nordic
Household Type
# Households
Household Size
Married-Couple
0 (0.0%)
-
Single Male/Father
0 (0.0%)
-
Single Female/Mother
0 (0.0%)
-
Non-family
132 (100.0%)
-
Total Households
132 (100.0%)
-
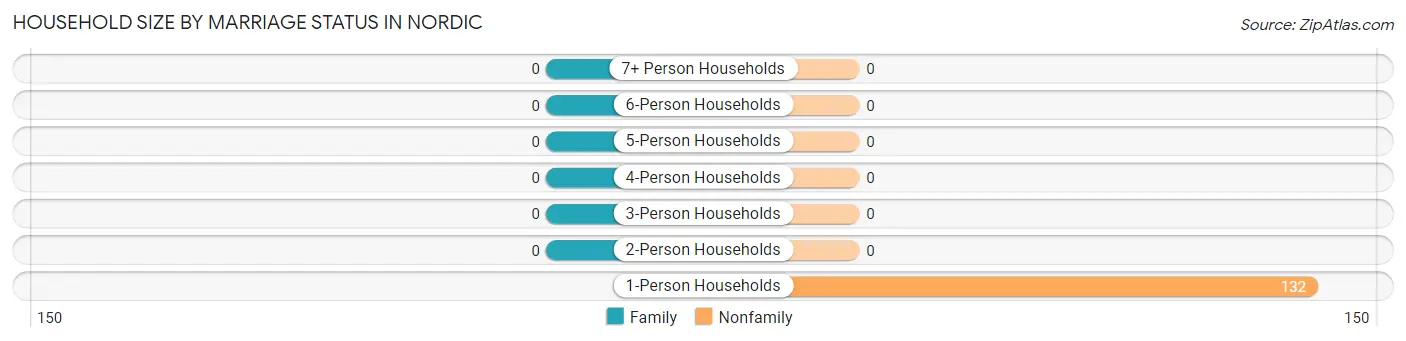
Household Size by Marriage Status in Nordic
Household Size
Family Households
Nonfamily Households
1-Person Households
-
132 (100.0%)
2-Person Households
0 (0.0%)
0 (0.0%)
3-Person Households
0 (0.0%)
0 (0.0%)
4-Person Households
0 (0.0%)
0 (0.0%)
5-Person Households
0 (0.0%)
0 (0.0%)
6-Person Households
0 (0.0%)
0 (0.0%)
7+ Person Households
0 (0.0%)
0 (0.0%)
Total
0 (0.0%)
132 (100.0%)
Female Fertility in Nordic
Fertility by Age in Nordic
Age Bracket
Women with Births
Births / 1,000 Women
15 to 19 years
0 (0.0%)
0.0
20 to 34 years
0 (0.0%)
0.0
35 to 50 years
0 (0.0%)
0.0
Total
0 (0.0%)
0.0
Fertility by Age by Marriage Status in Nordic
Age Bracket
Married
Unmarried
15 to 19 years
0 (0.0%)
0 (0.0%)
20 to 34 years
0 (0.0%)
0 (0.0%)
35 to 50 years
0 (0.0%)
0 (0.0%)
Total
0 (0.0%)
0 (0.0%)
Fertility by Education in Nordic
Educational Attainment
Women with Births
Births / 1,000 Women
Less than High School
0 (0.0%)
0.0
High School Diploma
0 (0.0%)
0.0
College or Associate's Degree
0 (0.0%)
0.0
Bachelor's Degree
0 (0.0%)
0.0
Graduate Degree
0 (0.0%)
0.0
Total
0 (0.0%)
0.0
Fertility by Education by Marriage Status in Nordic
Educational Attainment
Married
Unmarried
Less than High School
0 (0.0%)
0 (0.0%)
High School Diploma
0 (0.0%)
0 (0.0%)
College or Associate's Degree
0 (0.0%)
0 (0.0%)
Bachelor's Degree
0 (0.0%)
0 (0.0%)
Graduate Degree
0 (0.0%)
0 (0.0%)
Total
0 (0.0%)
0 (0.0%)
Income in Nordic
Income Overview in Nordic
Characteristic
Number
Measure
Per Capita Income
132
$61,311
Median Family Income
0
$0
Mean Family Income
0
$0
Median Household Income
132
$66,400
Mean Household Income
132
$61,311
Income Deficit
0
$0
Wage / Income Gap (%)
132
0.00%
Wage / Income Gap ($)
132
100.00¢ per $1
Gini / Inequality Index
132
0.18
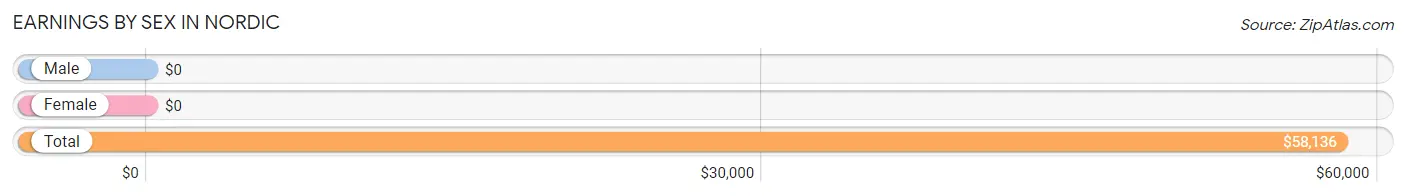
Earnings by Sex in Nordic
Sex
Number
Average Earnings
Male
80 (60.6%)
$0
Female
52 (39.4%)
$0
Total
132 (100.0%)
$58,136
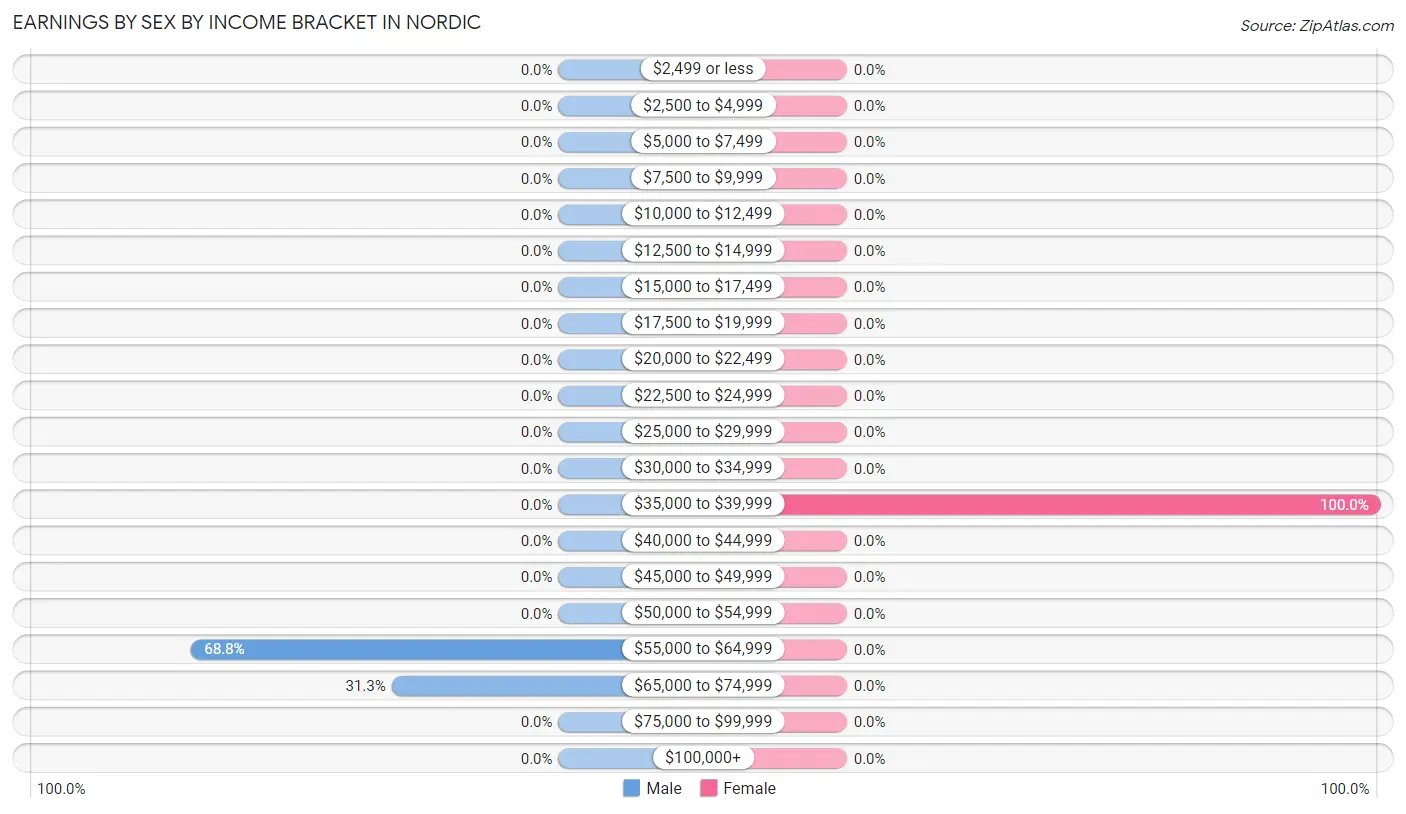
Earnings by Sex by Income Bracket in Nordic
The most common earnings brackets in Nordic are $55,000 to $64,999 for men (55 | 68.8%) and $35,000 to $39,999 for women (52 | 100.0%).
Income
Male
Female
$2,499 or less
0 (0.0%)
0 (0.0%)
$2,500 to $4,999
0 (0.0%)
0 (0.0%)
$5,000 to $7,499
0 (0.0%)
0 (0.0%)
$7,500 to $9,999
0 (0.0%)
0 (0.0%)
$10,000 to $12,499
0 (0.0%)
0 (0.0%)
$12,500 to $14,999
0 (0.0%)
0 (0.0%)
$15,000 to $17,499
0 (0.0%)
0 (0.0%)
$17,500 to $19,999
0 (0.0%)
0 (0.0%)
$20,000 to $22,499
0 (0.0%)
0 (0.0%)
$22,500 to $24,999
0 (0.0%)
0 (0.0%)
$25,000 to $29,999
0 (0.0%)
0 (0.0%)
$30,000 to $34,999
0 (0.0%)
0 (0.0%)
$35,000 to $39,999
0 (0.0%)
52 (100.0%)
$40,000 to $44,999
0 (0.0%)
0 (0.0%)
$45,000 to $49,999
0 (0.0%)
0 (0.0%)
$50,000 to $54,999
0 (0.0%)
0 (0.0%)
$55,000 to $64,999
55 (68.8%)
0 (0.0%)
$65,000 to $74,999
25 (31.2%)
0 (0.0%)
$75,000 to $99,999
0 (0.0%)
0 (0.0%)
$100,000+
0 (0.0%)
0 (0.0%)
Total
80 (100.0%)
52 (100.0%)
Earnings by Sex by Educational Attainment in Nordic
Educational Attainment
Male Income
Female Income
Less than High School
-
-
High School Diploma
-
-
College or Associate's Degree
-
-
Bachelor's Degree
-
-
Graduate Degree
-
-
Total
-
-
Family Income in Nordic
Family Income Brackets in Nordic
Income Bracket
# Families
% Families
Less than $10,000
0
0.0%
$10,000 to $14,999
0
0.0%
$15,000 to $24,999
0
0.0%
$25,000 to $34,999
0
0.0%
$35,000 to $49,999
0
0.0%
$50,000 to $74,999
0
0.0%
$75,000 to $99,999
0
0.0%
$100,000 to $149,999
0
0.0%
$150,000 to $199,999
0
0.0%
$200,000+
0
0.0%
Family Income by Famaliy Size in Nordic
Income Bracket
# Families
Median Income
2-Person Families
0 (0.0%)
$0
3-Person Families
0 (0.0%)
$0
4-Person Families
0 (0.0%)
$0
5-Person Families
0 (0.0%)
$0
6-Person Families
0 (0.0%)
$0
7+ Person Families
0 (0.0%)
$0
Total
0 (0.0%)
$0
Family Income by Number of Earners in Nordic
Number of Earners
# Families
Median Income
No Earners
0 (0.0%)
$0
1 Earner
0 (0.0%)
$0
2 Earners
0 (0.0%)
$0
3+ Earners
0 (0.0%)
$0
Total
0 (0.0%)
$0
Household Income in Nordic
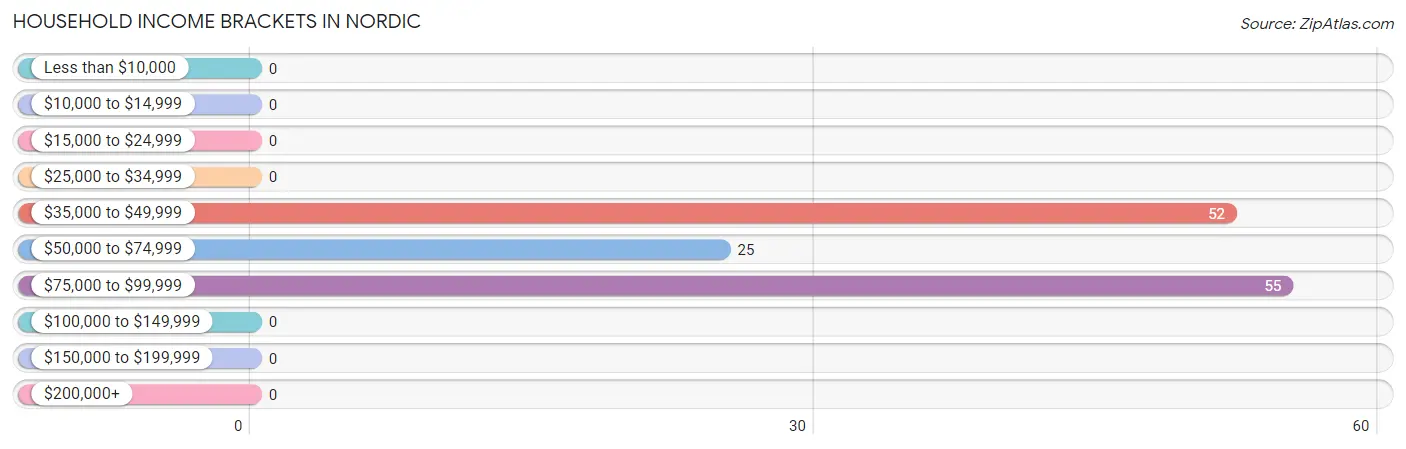
Household Income Brackets in Nordic
With 55 households falling in the category, the $75,000 to $99,999 income range is the most frequent in Nordic, accounting for 41.7% of all households.
Income Bracket
# Households
% Households
Less than $10,000
0
0.0%
$10,000 to $14,999
0
0.0%
$15,000 to $24,999
0
0.0%
$25,000 to $34,999
0
0.0%
$35,000 to $49,999
52
39.4%
$50,000 to $74,999
25
18.9%
$75,000 to $99,999
55
41.7%
$100,000 to $149,999
0
0.0%
$150,000 to $199,999
0
0.0%
$200,000+
0
0.0%
Household Income by Householder Age in Nordic
Income Bracket
# Households
Median Income
15 to 24 Years
0 (0.0%)
$0
25 to 44 Years
80 (60.6%)
$0
45 to 64 Years
52 (39.4%)
$0
65+ Years
0 (0.0%)
$0
Total
132 (100.0%)
$66,400
Poverty in Nordic
Income Below Poverty by Sex and Age in Nordic
Age Bracket
Male
Female
Under 5 Years
0 (0.0%)
0 (0.0%)
5 Years
0 (0.0%)
0 (0.0%)
6 to 11 Years
0 (0.0%)
0 (0.0%)
12 to 14 Years
0 (0.0%)
0 (0.0%)
15 Years
0 (0.0%)
0 (0.0%)
16 and 17 Years
0 (0.0%)
0 (0.0%)
18 to 24 Years
0 (0.0%)
0 (0.0%)
25 to 34 Years
0 (0.0%)
0 (0.0%)
35 to 44 Years
0 (0.0%)
0 (0.0%)
45 to 54 Years
0 (0.0%)
0 (0.0%)
55 to 64 Years
0 (0.0%)
0 (0.0%)
65 to 74 Years
0 (0.0%)
0 (0.0%)
75 Years and over
0 (0.0%)
0 (0.0%)
Total
0 (0.0%)
0 (0.0%)
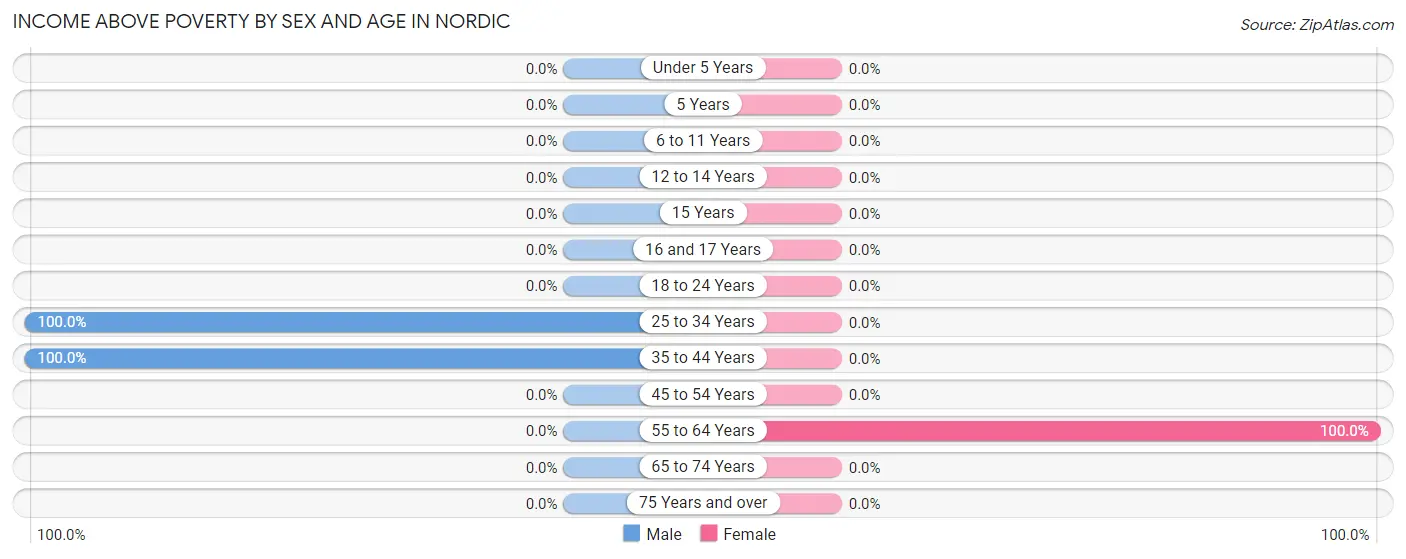
Income Above Poverty by Sex and Age in Nordic
According to the poverty statistics in Nordic, males aged 25 to 34 years and females aged 55 to 64 years are the age groups that are most secure financially, with 100.0% of males and 100.0% of females in these age groups living above the poverty line.
Age Bracket
Male
Female
Under 5 Years
0 (0.0%)
0 (0.0%)
5 Years
0 (0.0%)
0 (0.0%)
6 to 11 Years
0 (0.0%)
0 (0.0%)
12 to 14 Years
0 (0.0%)
0 (0.0%)
15 Years
0 (0.0%)
0 (0.0%)
16 and 17 Years
0 (0.0%)
0 (0.0%)
18 to 24 Years
0 (0.0%)
0 (0.0%)
25 to 34 Years
25 (100.0%)
0 (0.0%)
35 to 44 Years
55 (100.0%)
0 (0.0%)
45 to 54 Years
0 (0.0%)
0 (0.0%)
55 to 64 Years
0 (0.0%)
52 (100.0%)
65 to 74 Years
0 (0.0%)
0 (0.0%)
75 Years and over
0 (0.0%)
0 (0.0%)
Total
80 (100.0%)
52 (100.0%)
Income Below Poverty Among Married-Couple Families in Nordic
Children
Above Poverty
Below Poverty
No Children
0 (0.0%)
0 (0.0%)
1 or 2 Children
0 (0.0%)
0 (0.0%)
3 or 4 Children
0 (0.0%)
0 (0.0%)
5 or more Children
0 (0.0%)
0 (0.0%)
Total
0 (0.0%)
0 (0.0%)
Income Below Poverty Among Single-Parent Households in Nordic
Children
Single Father
Single Mother
No Children
0 (0.0%)
0 (0.0%)
1 or 2 Children
0 (0.0%)
0 (0.0%)
3 or 4 Children
0 (0.0%)
0 (0.0%)
5 or more Children
0 (0.0%)
0 (0.0%)
Total
0 (0.0%)
0 (0.0%)
Income Below Poverty Among Married-Couple vs Single-Parent Households in Nordic
Children
Married-Couple Families
Single-Parent Households
No Children
0 (0.0%)
0 (0.0%)
1 or 2 Children
0 (0.0%)
0 (0.0%)
3 or 4 Children
0 (0.0%)
0 (0.0%)
5 or more Children
0 (0.0%)
0 (0.0%)
Total
0 (0.0%)
0 (0.0%)
Employment Characteristics in Nordic
Employment by Class of Employer in Nordic
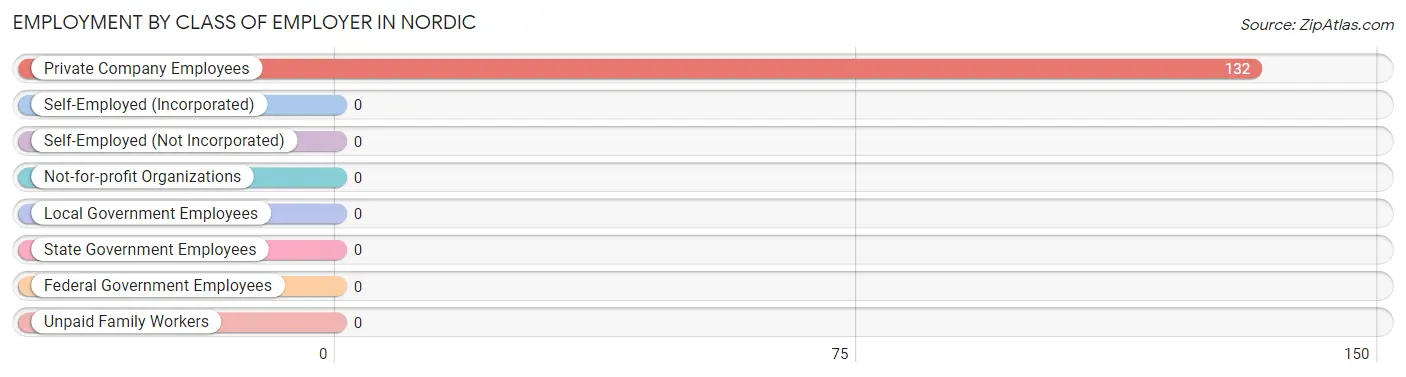
Among the 132 employed individuals in Nordic, , and private company employees (132 | 100.0%) make up the most common classes of employment.
Employer Class
# Employees
% Employees
Private Company Employees
132
100.0%
Self-Employed (Incorporated)
0
0.0%
Self-Employed (Not Incorporated)
0
0.0%
Not-for-profit Organizations
0
0.0%
Local Government Employees
0
0.0%
State Government Employees
0
0.0%
Federal Government Employees
0
0.0%
Unpaid Family Workers
0
0.0%
Total
132
100.0%
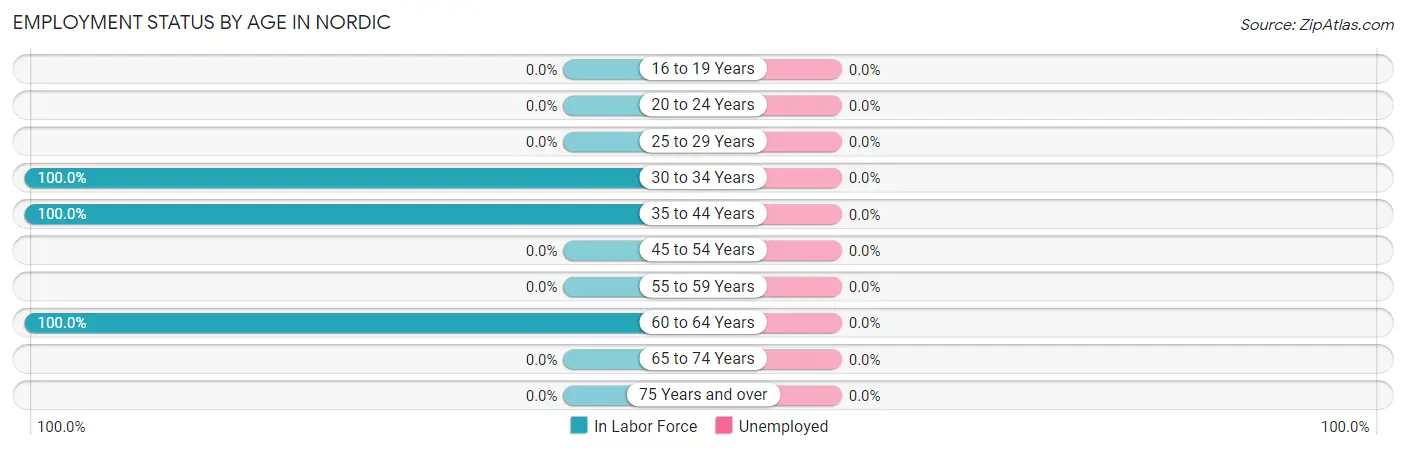
Employment Status by Age in Nordic
Age Bracket
In Labor Force
Unemployed
16 to 19 Years
0 (0.0%)
0 (0.0%)
20 to 24 Years
0 (0.0%)
0 (0.0%)
25 to 29 Years
0 (0.0%)
0 (0.0%)
30 to 34 Years
25 (100.0%)
0 (0.0%)
35 to 44 Years
55 (100.0%)
0 (0.0%)
45 to 54 Years
0 (0.0%)
0 (0.0%)
55 to 59 Years
0 (0.0%)
0 (0.0%)
60 to 64 Years
52 (100.0%)
0 (0.0%)
65 to 74 Years
0 (0.0%)
0 (0.0%)
75 Years and over
0 (0.0%)
0 (0.0%)
Total
132 (100.0%)
0 (0.0%)
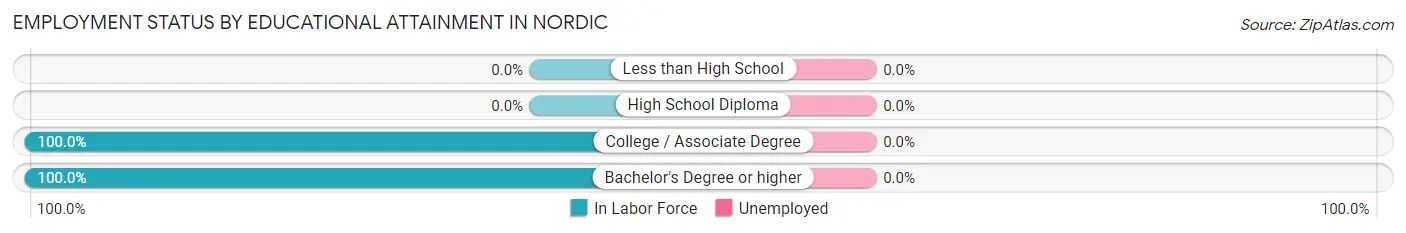
Employment Status by Educational Attainment in Nordic
Educational Attainment
In Labor Force
Unemployed
Less than High School
0 (0.0%)
0 (0.0%)
High School Diploma
0 (0.0%)
0 (0.0%)
College / Associate Degree
107 (100.0%)
0 (0.0%)
Bachelor's Degree or higher
25 (100.0%)
0 (0.0%)
Total
132 (100.0%)
0 (0.0%)
Employment Occupations by Sex in Nordic
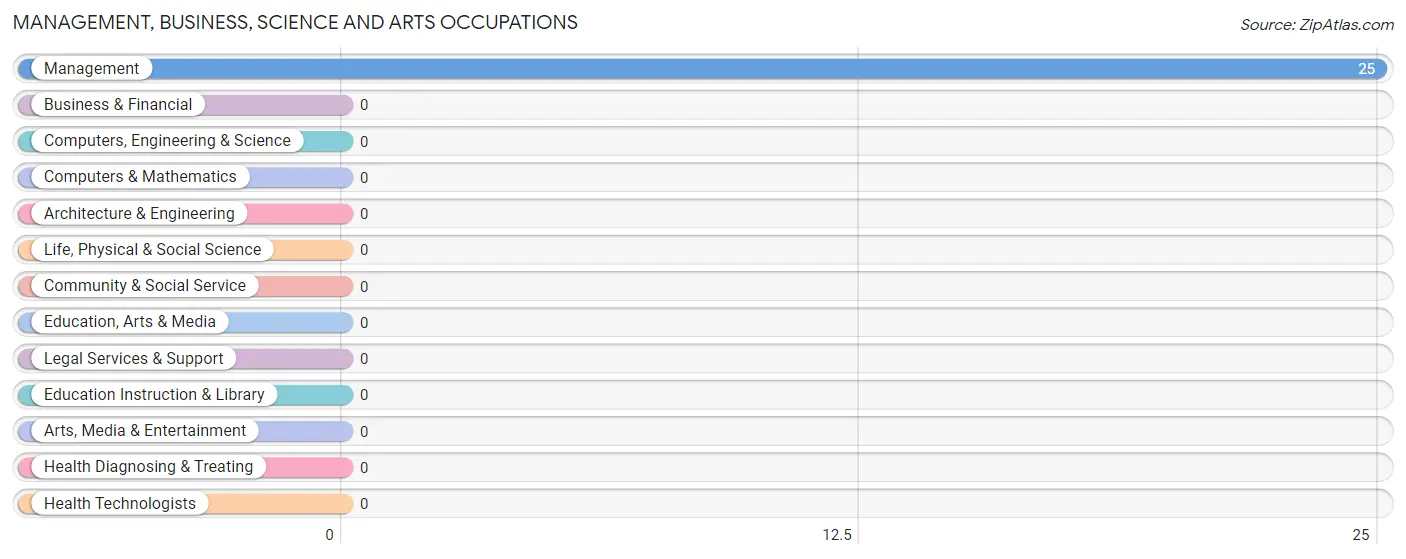
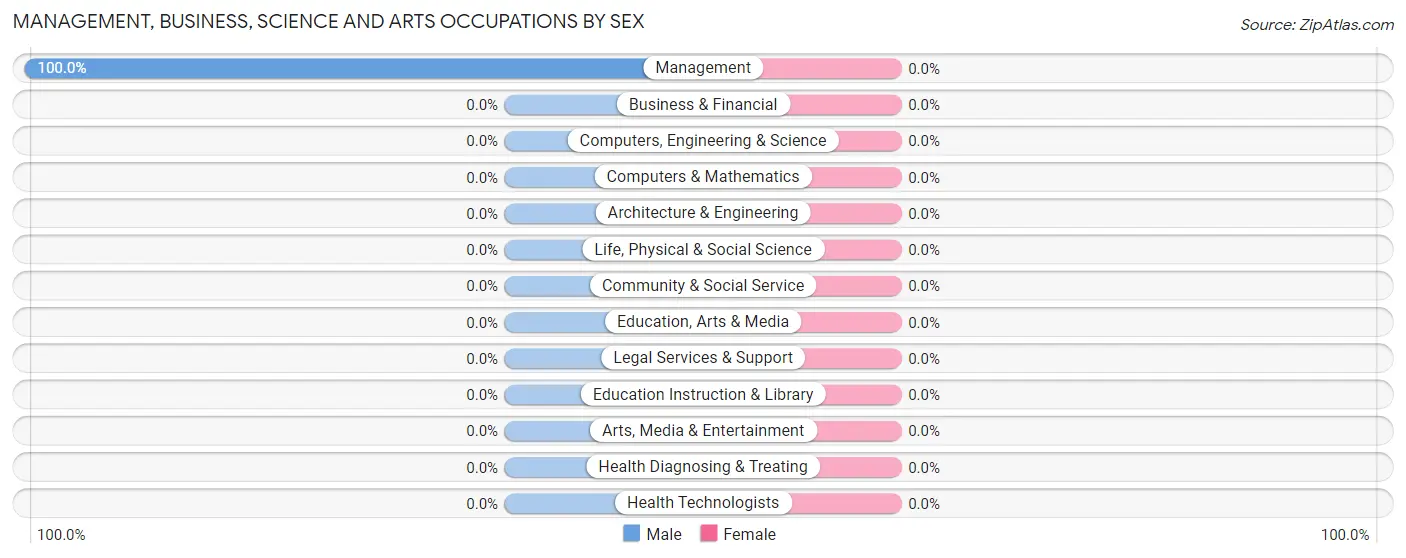
Management, Business, Science and Arts Occupations
The most common Management, Business, Science and Arts occupations in Nordic are , and Management (25 | 18.9%).
Management, Business, Science and Arts Occupations by Sex
Occupation
Male
Female
Management
25 (100.0%)
0 (0.0%)
Business & Financial
0 (0.0%)
0 (0.0%)
Computers, Engineering & Science
0 (0.0%)
0 (0.0%)
Computers & Mathematics
0 (0.0%)
0 (0.0%)
Architecture & Engineering
0 (0.0%)
0 (0.0%)
Life, Physical & Social Science
0 (0.0%)
0 (0.0%)
Community & Social Service
0 (0.0%)
0 (0.0%)
Education, Arts & Media
0 (0.0%)
0 (0.0%)
Legal Services & Support
0 (0.0%)
0 (0.0%)
Education Instruction & Library
0 (0.0%)
0 (0.0%)
Arts, Media & Entertainment
0 (0.0%)
0 (0.0%)
Health Diagnosing & Treating
0 (0.0%)
0 (0.0%)
Health Technologists
0 (0.0%)
0 (0.0%)
Total (Category)
25 (100.0%)
0 (0.0%)
Total (Overall)
80 (60.6%)
52 (39.4%)
Services Occupations
Services Occupations by Sex
Occupation
Male
Female
Healthcare Support
0 (0.0%)
0 (0.0%)
Security & Protection
0 (0.0%)
0 (0.0%)
Firefighting & Prevention
0 (0.0%)
0 (0.0%)
Law Enforcement
0 (0.0%)
0 (0.0%)
Food Preparation & Serving
0 (0.0%)
0 (0.0%)
Cleaning & Maintenance
0 (0.0%)
0 (0.0%)
Personal Care & Service
0 (0.0%)
0 (0.0%)
Total (Category)
0 (0.0%)
0 (0.0%)
Total (Overall)
80 (60.6%)
52 (39.4%)
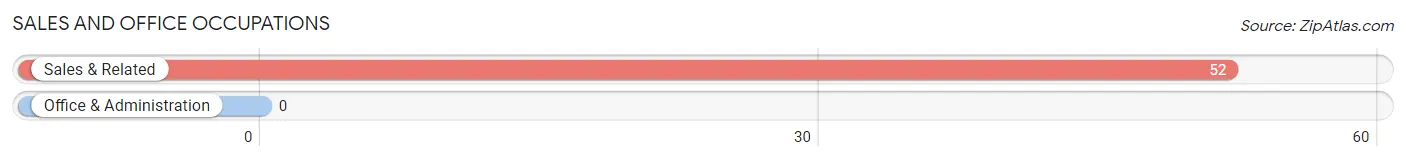
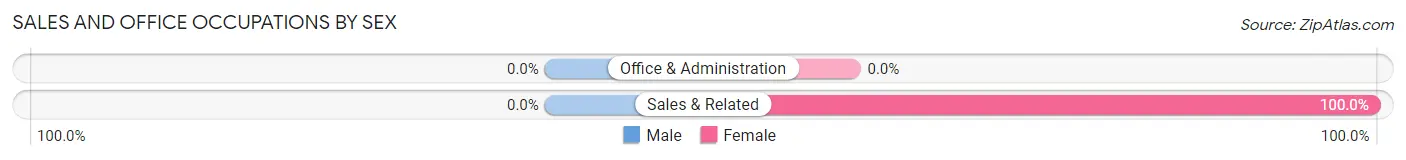
Sales and Office Occupations
The most common Sales and Office occupations in Nordic are , and Sales & Related (52 | 39.4%).
Sales and Office Occupations by Sex
Occupation
Male
Female
Sales & Related
0 (0.0%)
52 (100.0%)
Office & Administration
0 (0.0%)
0 (0.0%)
Total (Category)
0 (0.0%)
52 (100.0%)
Total (Overall)
80 (60.6%)
52 (39.4%)
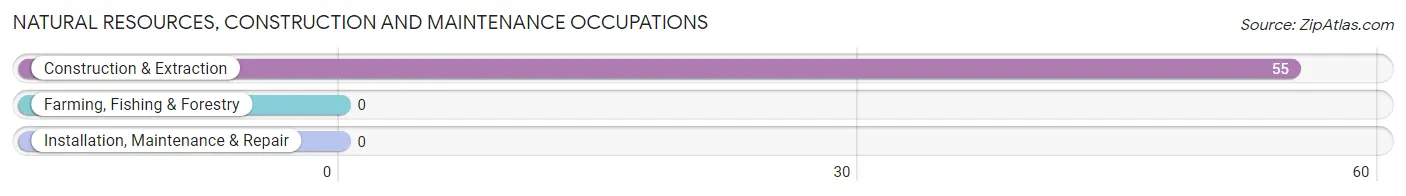
Natural Resources, Construction and Maintenance Occupations
The most common Natural Resources, Construction and Maintenance occupations in Nordic are , and Construction & Extraction (55 | 41.7%).
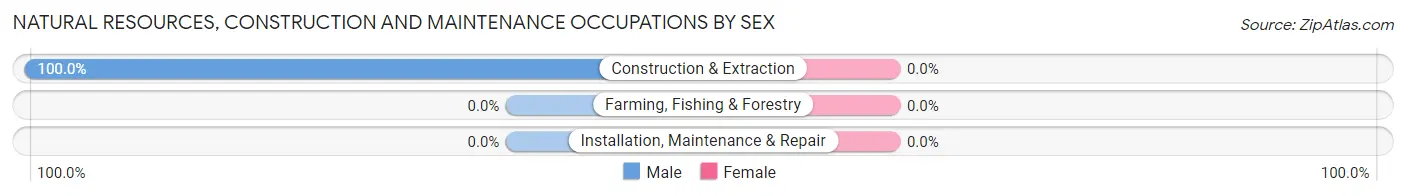
Natural Resources, Construction and Maintenance Occupations by Sex
Occupation
Male
Female
Farming, Fishing & Forestry
0 (0.0%)
0 (0.0%)
Construction & Extraction
55 (100.0%)
0 (0.0%)
Installation, Maintenance & Repair
0 (0.0%)
0 (0.0%)
Total (Category)
55 (100.0%)
0 (0.0%)
Total (Overall)
80 (60.6%)
52 (39.4%)
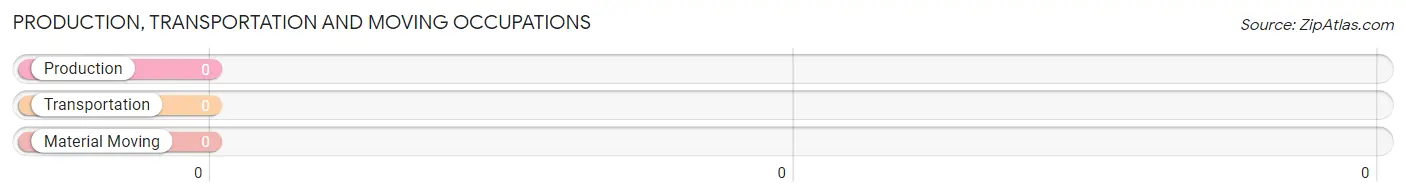
Production, Transportation and Moving Occupations
Production, Transportation and Moving Occupations by Sex
Occupation
Male
Female
Production
0 (0.0%)
0 (0.0%)
Transportation
0 (0.0%)
0 (0.0%)
Material Moving
0 (0.0%)
0 (0.0%)
Total (Category)
0 (0.0%)
0 (0.0%)
Total (Overall)
80 (60.6%)
52 (39.4%)
Employment Industries by Sex in Nordic
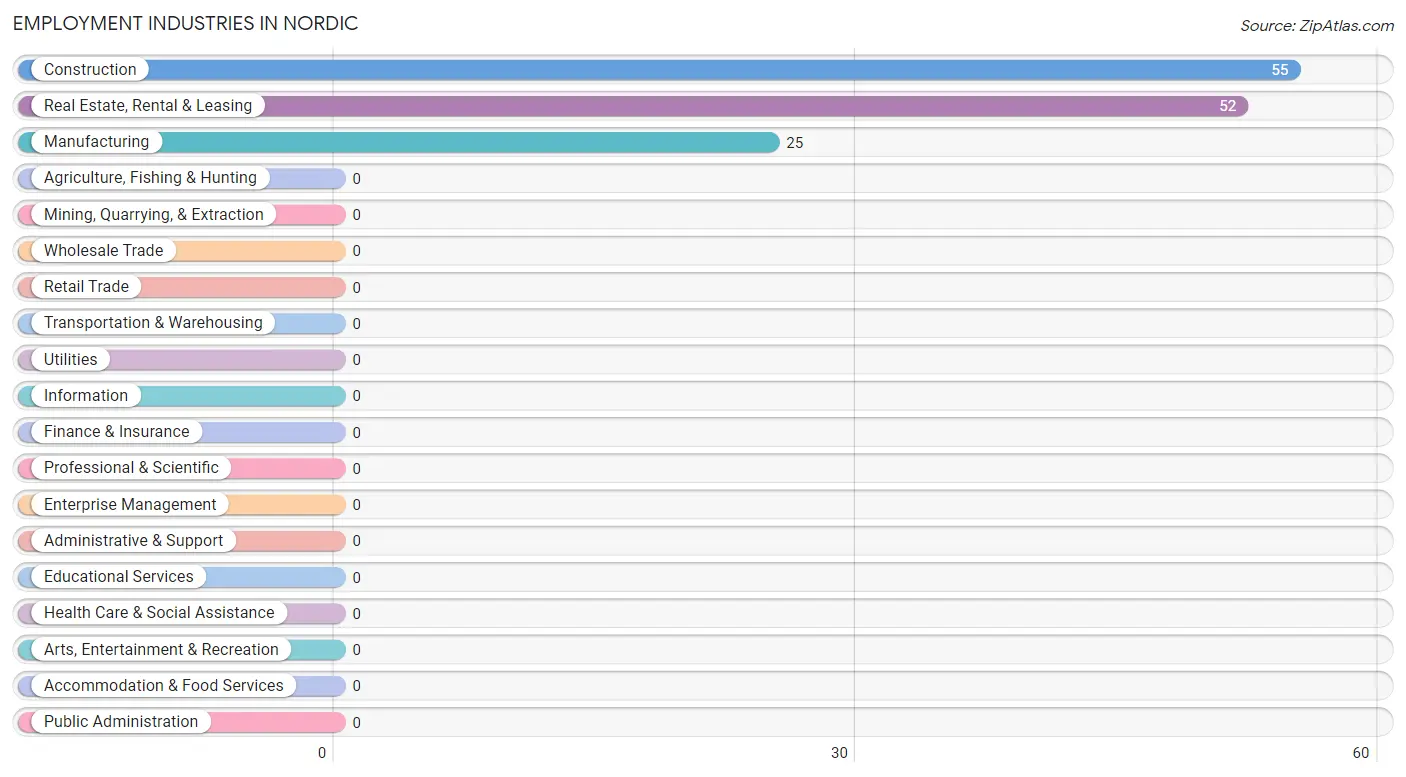
Employment Industries in Nordic
The major employment industries in Nordic include Construction (55 | 41.7%), Real Estate, Rental & Leasing (52 | 39.4%), and Manufacturing (25 | 18.9%).
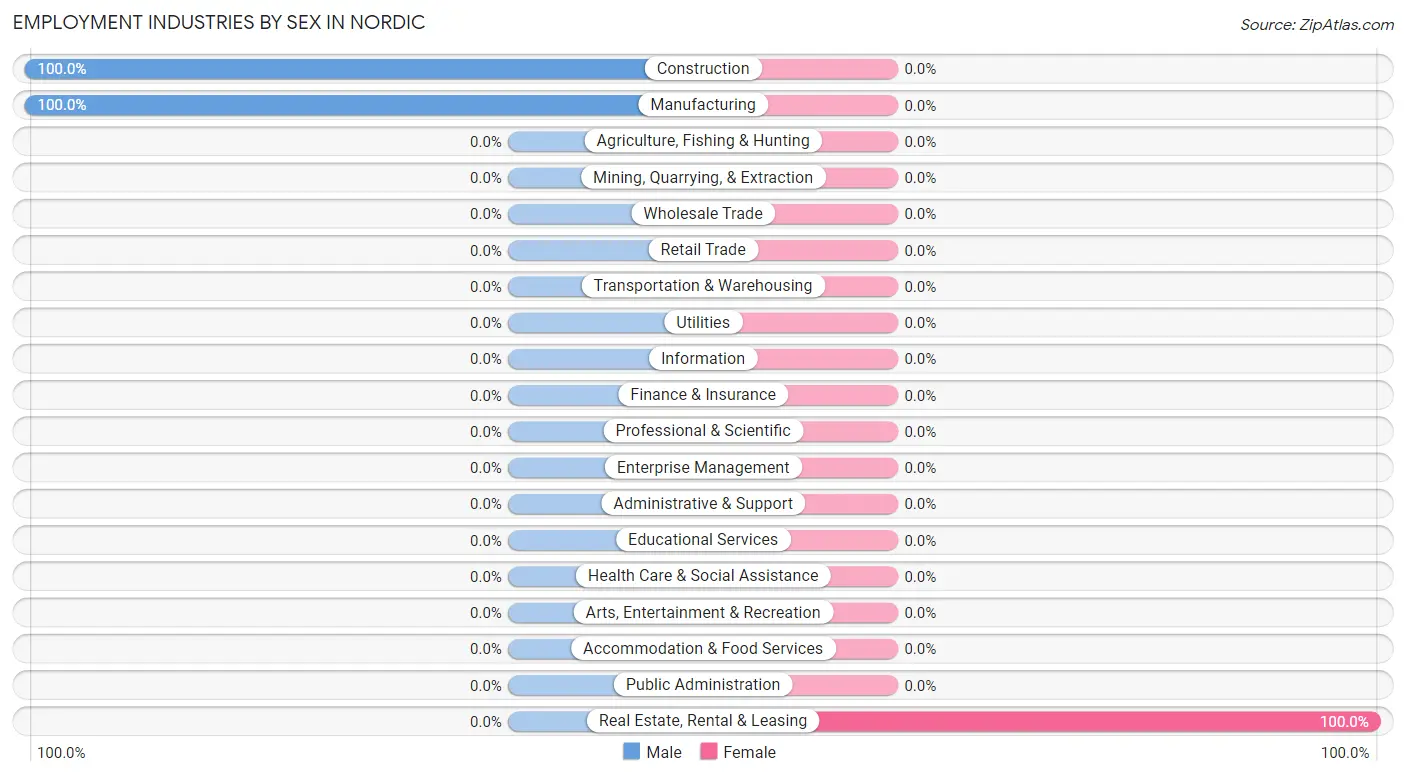
Employment Industries by Sex in Nordic
Industry
Male
Female
Agriculture, Fishing & Hunting
0 (0.0%)
0 (0.0%)
Mining, Quarrying, & Extraction
0 (0.0%)
0 (0.0%)
Construction
55 (100.0%)
0 (0.0%)
Manufacturing
25 (100.0%)
0 (0.0%)
Wholesale Trade
0 (0.0%)
0 (0.0%)
Retail Trade
0 (0.0%)
0 (0.0%)
Transportation & Warehousing
0 (0.0%)
0 (0.0%)
Utilities
0 (0.0%)
0 (0.0%)
Information
0 (0.0%)
0 (0.0%)
Finance & Insurance
0 (0.0%)
0 (0.0%)
Real Estate, Rental & Leasing
0 (0.0%)
52 (100.0%)
Professional & Scientific
0 (0.0%)
0 (0.0%)
Enterprise Management
0 (0.0%)
0 (0.0%)
Administrative & Support
0 (0.0%)
0 (0.0%)
Educational Services
0 (0.0%)
0 (0.0%)
Health Care & Social Assistance
0 (0.0%)
0 (0.0%)
Arts, Entertainment & Recreation
0 (0.0%)
0 (0.0%)
Accommodation & Food Services
0 (0.0%)
0 (0.0%)
Public Administration
0 (0.0%)
0 (0.0%)
Total
80 (60.6%)
52 (39.4%)
Education in Nordic
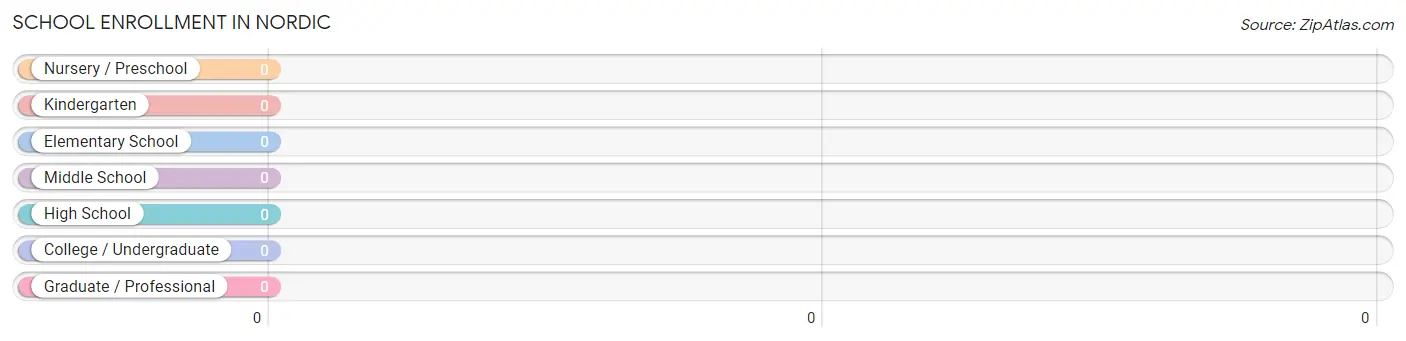
School Enrollment in Nordic
School Level
# Students
% Students
Nursery / Preschool
0
0.0%
Kindergarten
0
0.0%
Elementary School
0
0.0%
Middle School
0
0.0%
High School
0
0.0%
College / Undergraduate
0
0.0%
Graduate / Professional
0
0.0%
Total
0
0.0%
School Enrollment by Age by Funding Source in Nordic
Age Bracket
Public School
Private School
3 to 4 Year Olds
0 (0.0%)
0 (0.0%)
5 to 9 Year Old
0 (0.0%)
0 (0.0%)
10 to 14 Year Olds
0 (0.0%)
0 (0.0%)
15 to 17 Year Olds
0 (0.0%)
0 (0.0%)
18 to 19 Year Olds
0 (0.0%)
0 (0.0%)
20 to 24 Year Olds
0 (0.0%)
0 (0.0%)
25 to 34 Year Olds
0 (0.0%)
0 (0.0%)
35 Years and over
0 (0.0%)
0 (0.0%)
Total
0 (0.0%)
0 (0.0%)
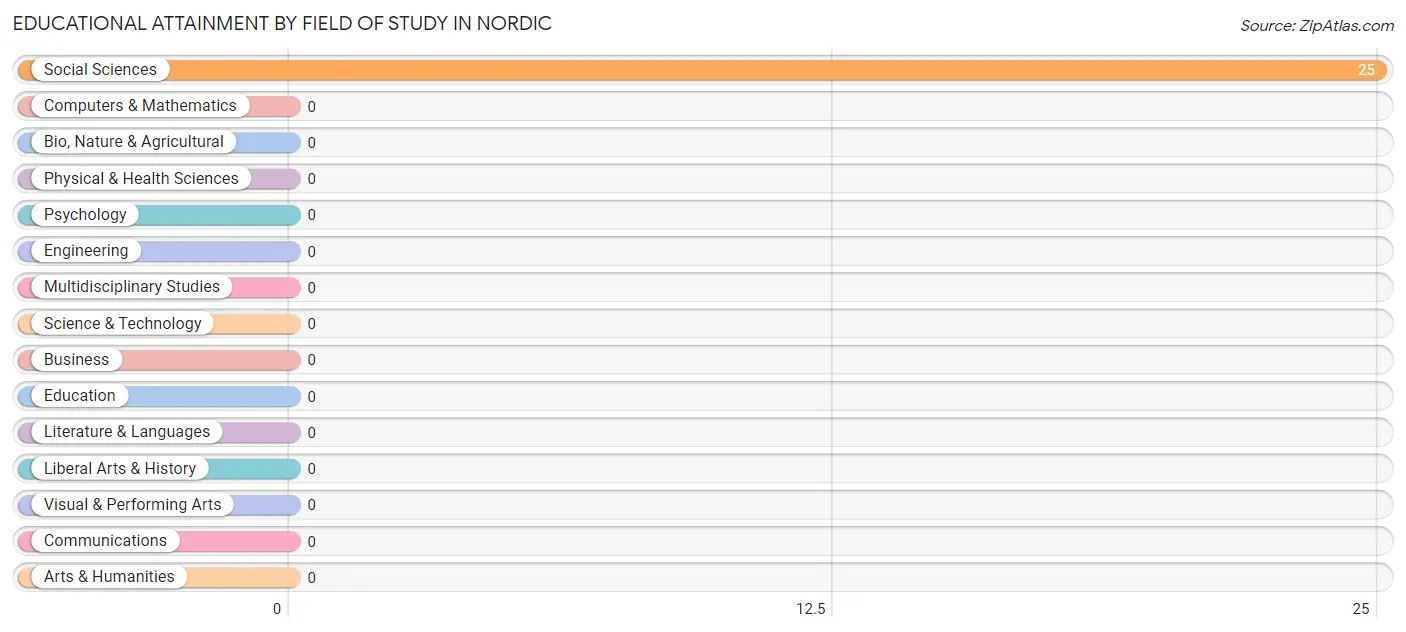
Educational Attainment by Field of Study in Nordic
, and social sciences (25 | 100.0%) are the most common fields of study among 25 individuals in Nordic who have obtained a bachelor's degree or higher.
Field of Study
# Graduates
% Graduates
Computers & Mathematics
0
0.0%
Bio, Nature & Agricultural
0
0.0%
Physical & Health Sciences
0
0.0%
Psychology
0
0.0%
Social Sciences
25
100.0%
Engineering
0
0.0%
Multidisciplinary Studies
0
0.0%
Science & Technology
0
0.0%
Business
0
0.0%
Education
0
0.0%
Literature & Languages
0
0.0%
Liberal Arts & History
0
0.0%
Visual & Performing Arts
0
0.0%
Communications
0
0.0%
Arts & Humanities
0
0.0%
Total
25
100.0%
Transportation & Commute in Nordic
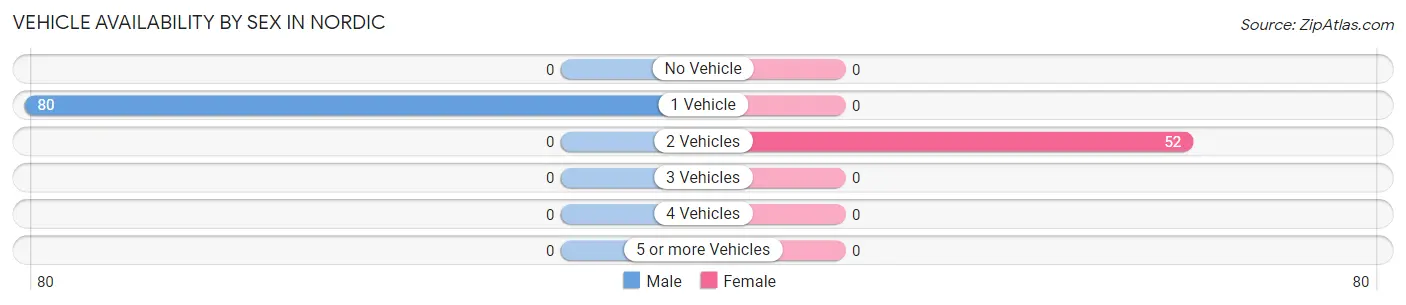
Vehicle Availability by Sex in Nordic
The most prevalent vehicle ownership categories in Nordic are males with 1 vehicle (80, accounting for 100.0%) and females with 1 vehicle (0, making up 153.8%).
Vehicles Available
Male
Female
No Vehicle
0 (0.0%)
0 (0.0%)
1 Vehicle
80 (100.0%)
0 (0.0%)
2 Vehicles
0 (0.0%)
52 (100.0%)
3 Vehicles
0 (0.0%)
0 (0.0%)
4 Vehicles
0 (0.0%)
0 (0.0%)
5 or more Vehicles
0 (0.0%)
0 (0.0%)
Total
80 (100.0%)
52 (100.0%)
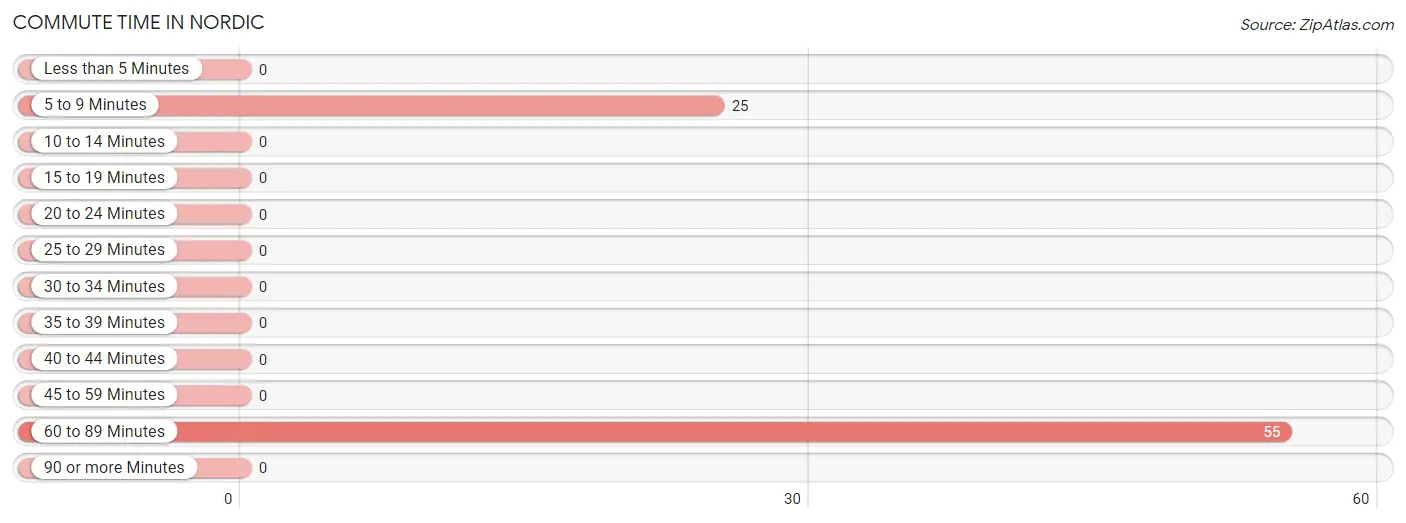
Commute Time in Nordic
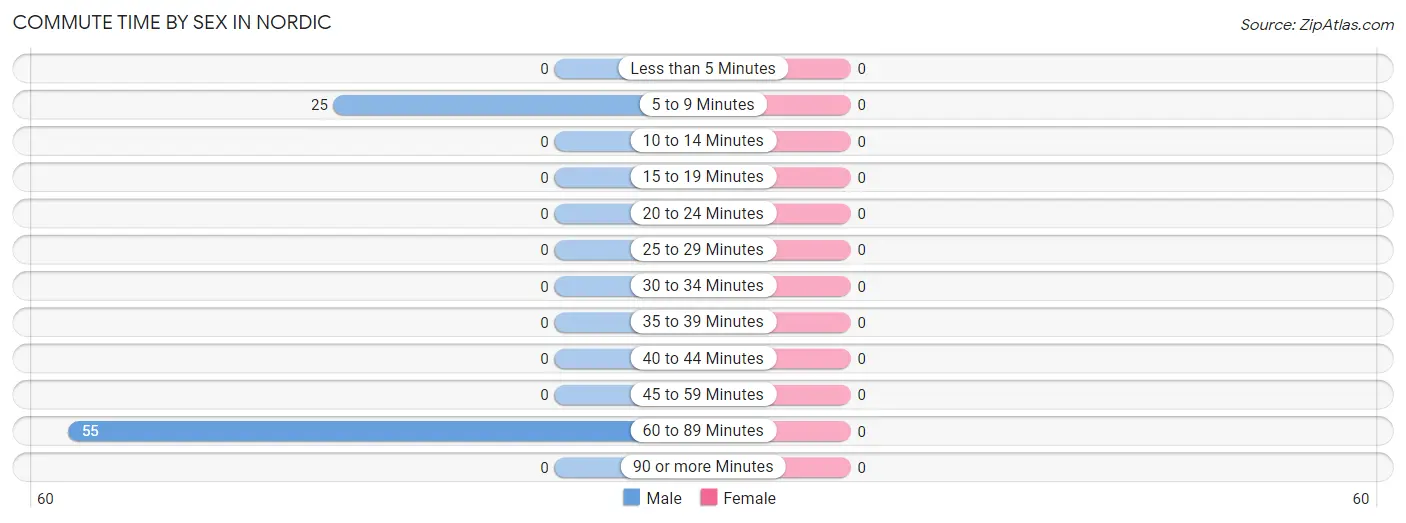
The most frequently occuring commute durations in Nordic are 60 to 89 minutes (55 commuters, 68.8%), 5 to 9 minutes (25 commuters, 31.2%), and less than 5 minutes (0 commuters, 0.0%).
Commute Time
# Commuters
% Commuters
Less than 5 Minutes
0
0.0%
5 to 9 Minutes
25
31.2%
10 to 14 Minutes
0
0.0%
15 to 19 Minutes
0
0.0%
20 to 24 Minutes
0
0.0%
25 to 29 Minutes
0
0.0%
30 to 34 Minutes
0
0.0%
35 to 39 Minutes
0
0.0%
40 to 44 Minutes
0
0.0%
45 to 59 Minutes
0
0.0%
60 to 89 Minutes
55
68.8%
90 or more Minutes
0
0.0%
Commute Time by Sex in Nordic
Commute Time
Male
Female
Less than 5 Minutes
0 (0.0%)
0 (0.0%)
5 to 9 Minutes
25 (31.2%)
0 (0.0%)
10 to 14 Minutes
0 (0.0%)
0 (0.0%)
15 to 19 Minutes
0 (0.0%)
0 (0.0%)
20 to 24 Minutes
0 (0.0%)
0 (0.0%)
25 to 29 Minutes
0 (0.0%)
0 (0.0%)
30 to 34 Minutes
0 (0.0%)
0 (0.0%)
35 to 39 Minutes
0 (0.0%)
0 (0.0%)
40 to 44 Minutes
0 (0.0%)
0 (0.0%)
45 to 59 Minutes
0 (0.0%)
0 (0.0%)
60 to 89 Minutes
55 (68.8%)
0 (0.0%)
90 or more Minutes
0 (0.0%)
0 (0.0%)
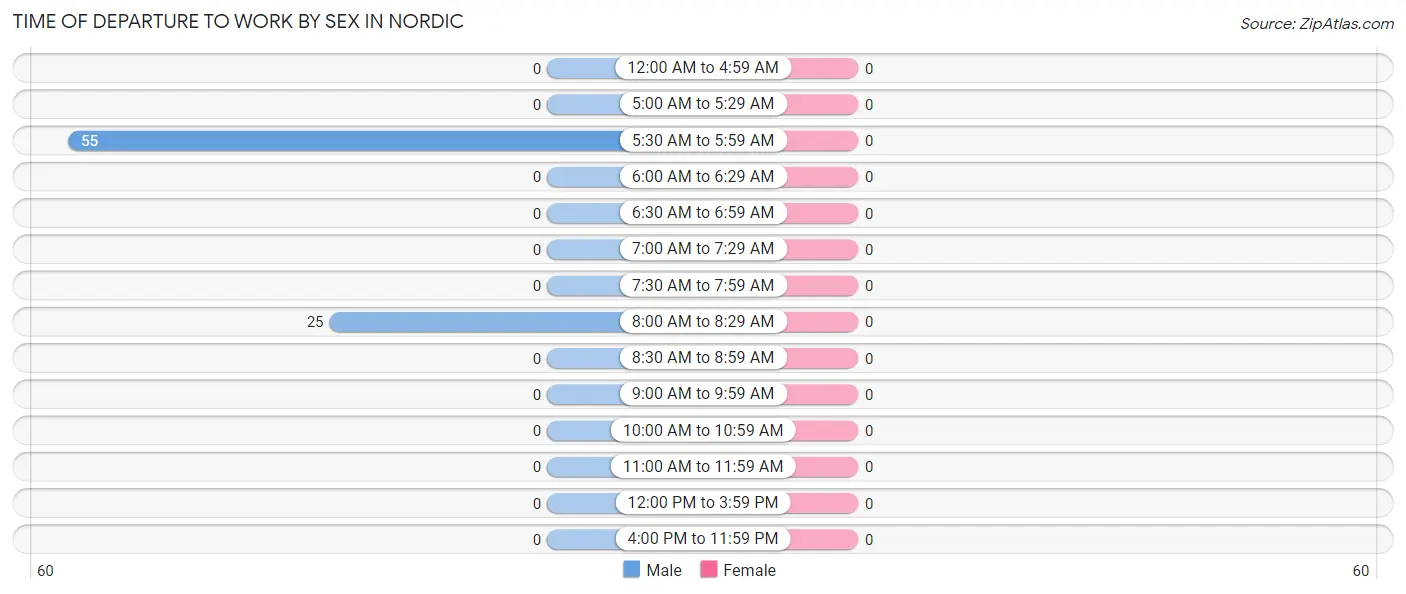
Time of Departure to Work by Sex in Nordic
Time of Departure
Male
Female
12:00 AM to 4:59 AM
0 (0.0%)
0 (0.0%)
5:00 AM to 5:29 AM
0 (0.0%)
0 (0.0%)
5:30 AM to 5:59 AM
55 (68.8%)
0 (0.0%)
6:00 AM to 6:29 AM
0 (0.0%)
0 (0.0%)
6:30 AM to 6:59 AM
0 (0.0%)
0 (0.0%)
7:00 AM to 7:29 AM
0 (0.0%)
0 (0.0%)
7:30 AM to 7:59 AM
0 (0.0%)
0 (0.0%)
8:00 AM to 8:29 AM
25 (31.2%)
0 (0.0%)
8:30 AM to 8:59 AM
0 (0.0%)
0 (0.0%)
9:00 AM to 9:59 AM
0 (0.0%)
0 (0.0%)
10:00 AM to 10:59 AM
0 (0.0%)
0 (0.0%)
11:00 AM to 11:59 AM
0 (0.0%)
0 (0.0%)
12:00 PM to 3:59 PM
0 (0.0%)
0 (0.0%)
4:00 PM to 11:59 PM
0 (0.0%)
0 (0.0%)
Total
80 (100.0%)
0 (0.0%)
Housing Occupancy in Nordic
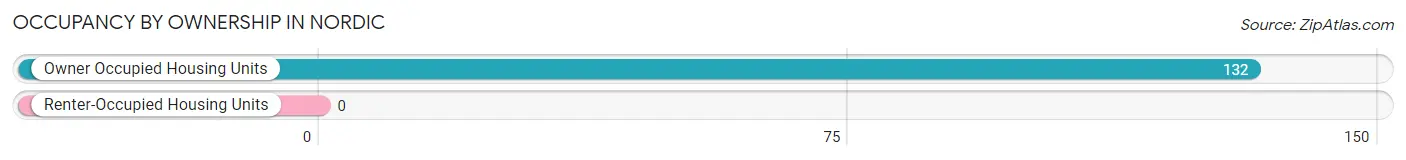
Occupancy by Ownership in Nordic
Of the total 132 dwellings in Nordic, owner-occupied units account for 132 (100.0%), while renter-occupied units make up 0 (0.0%).
Occupancy
# Housing Units
% Housing Units
Owner Occupied Housing Units
132
100.0%
Renter-Occupied Housing Units
0
0.0%
Total Occupied Housing Units
132
100.0%
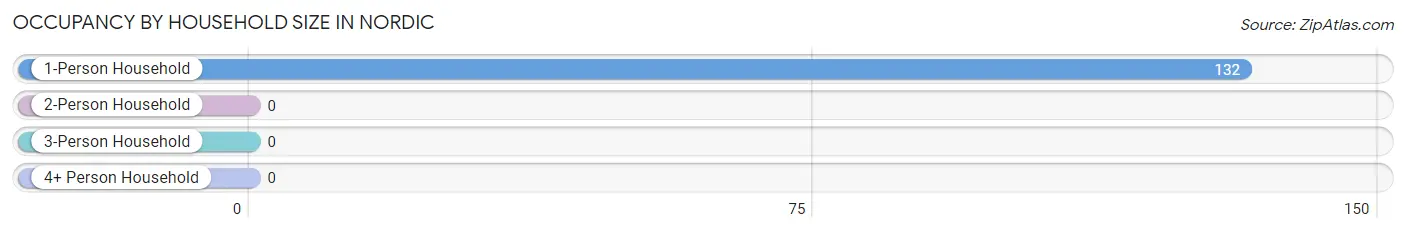
Occupancy by Household Size in Nordic
Household Size
# Housing Units
% Housing Units
1-Person Household
132
100.0%
2-Person Household
0
0.0%
3-Person Household
0
0.0%
4+ Person Household
0
0.0%
Total Housing Units
132
100.0%
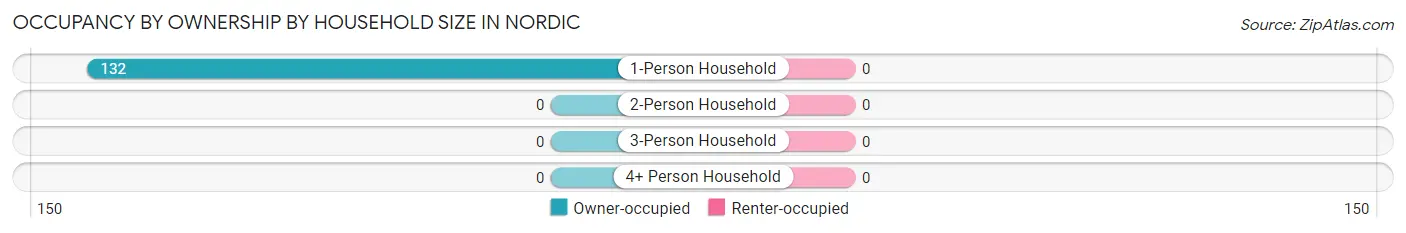
Occupancy by Ownership by Household Size in Nordic
Household Size
Owner-occupied
Renter-occupied
1-Person Household
132 (100.0%)
0 (0.0%)
2-Person Household
0 (0.0%)
0 (0.0%)
3-Person Household
0 (0.0%)
0 (0.0%)
4+ Person Household
0 (0.0%)
0 (0.0%)
Total Housing Units
132 (100.0%)
0 (0.0%)
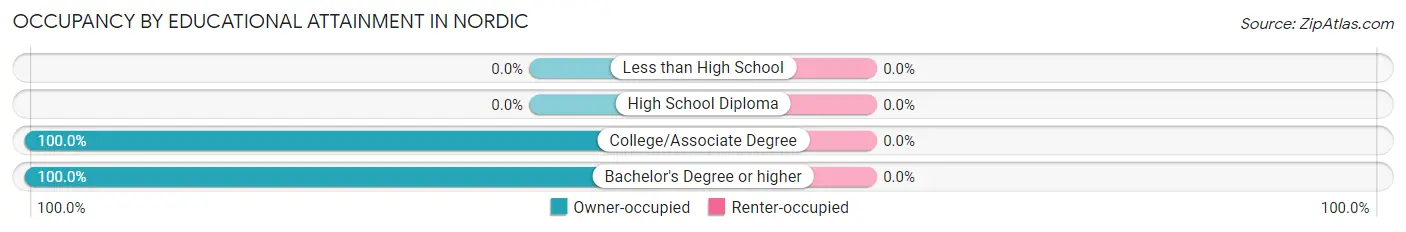
Occupancy by Educational Attainment in Nordic
Household Size
Owner-occupied
Renter-occupied
Less than High School
0 (0.0%)
0 (0.0%)
High School Diploma
0 (0.0%)
0 (0.0%)
College/Associate Degree
107 (100.0%)
0 (0.0%)
Bachelor's Degree or higher
25 (100.0%)
0 (0.0%)
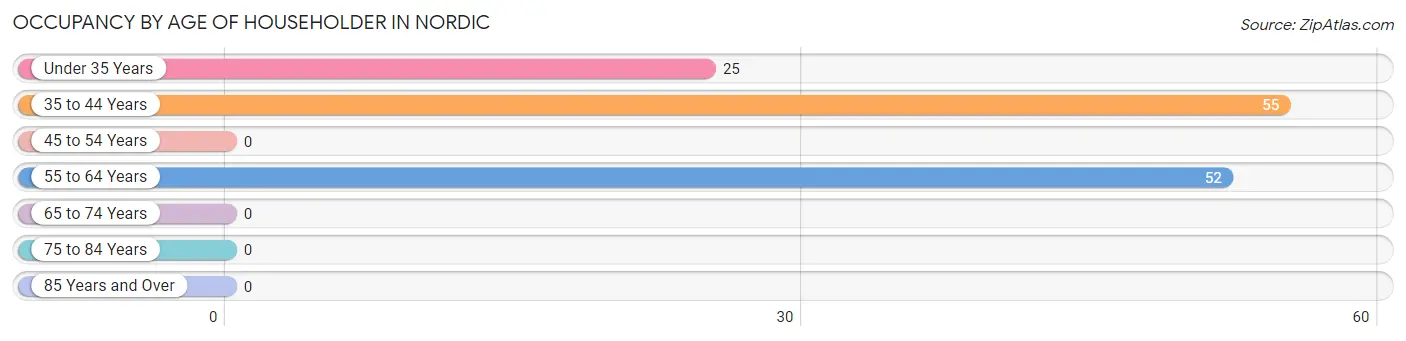
Occupancy by Age of Householder in Nordic
Age Bracket
# Households
% Households
Under 35 Years
25
18.9%
35 to 44 Years
55
41.7%
45 to 54 Years
0
0.0%
55 to 64 Years
52
39.4%
65 to 74 Years
0
0.0%
75 to 84 Years
0
0.0%
85 Years and Over
0
0.0%
Total
132
100.0%
Housing Finances in Nordic
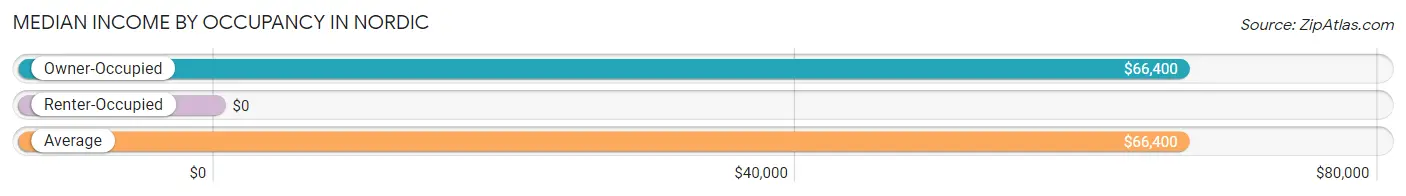
Median Income by Occupancy in Nordic
Occupancy Type
# Households
Median Income
Owner-Occupied
132 (100.0%)
$66,400
Renter-Occupied
0 (0.0%)
$0
Average
132 (100.0%)
$66,400
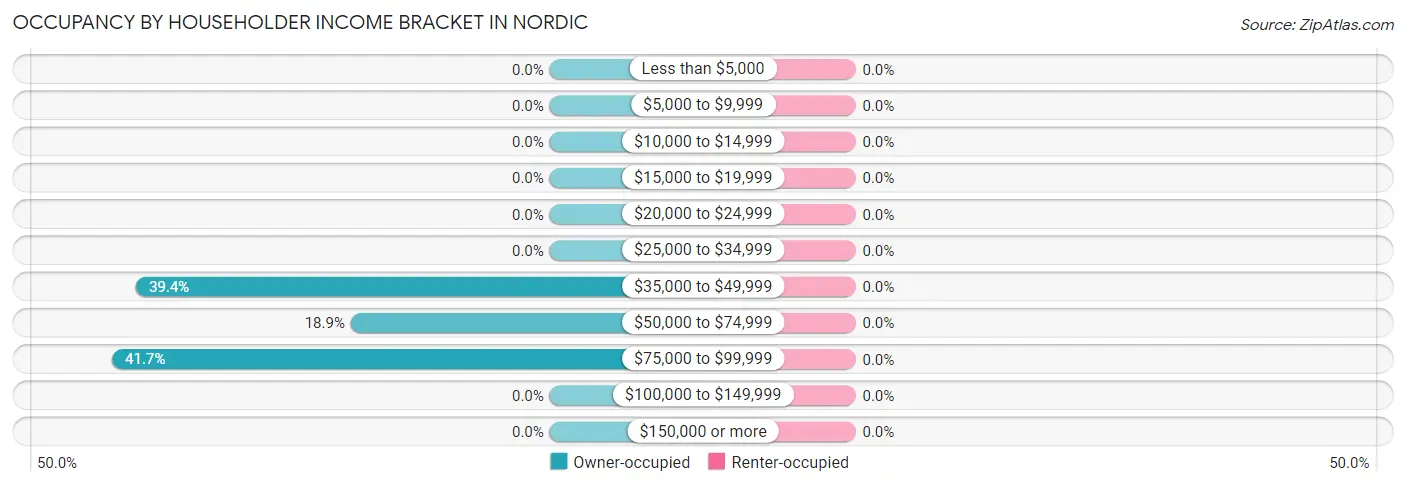
Occupancy by Householder Income Bracket in Nordic
Income Bracket
Owner-occupied
Renter-occupied
Less than $5,000
0 (0.0%)
0 (0.0%)
$5,000 to $9,999
0 (0.0%)
0 (0.0%)
$10,000 to $14,999
0 (0.0%)
0 (0.0%)
$15,000 to $19,999
0 (0.0%)
0 (0.0%)
$20,000 to $24,999
0 (0.0%)
0 (0.0%)
$25,000 to $34,999
0 (0.0%)
0 (0.0%)
$35,000 to $49,999
52 (39.4%)
0 (0.0%)
$50,000 to $74,999
25 (18.9%)
0 (0.0%)
$75,000 to $99,999
55 (41.7%)
0 (0.0%)
$100,000 to $149,999
0 (0.0%)
0 (0.0%)
$150,000 or more
0 (0.0%)
0 (0.0%)
Total
132 (100.0%)
0 (0.0%)
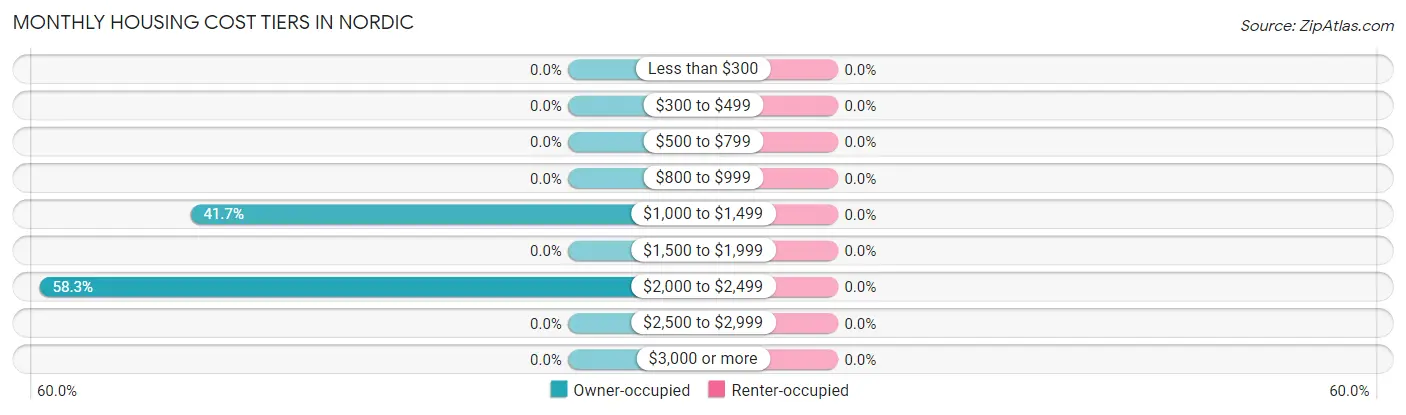
Monthly Housing Cost Tiers in Nordic
Monthly Cost
Owner-occupied
Renter-occupied
Less than $300
0 (0.0%)
0 (0.0%)
$300 to $499
0 (0.0%)
0 (0.0%)
$500 to $799
0 (0.0%)
0 (0.0%)
$800 to $999
0 (0.0%)
0 (0.0%)
$1,000 to $1,499
55 (41.7%)
0 (0.0%)
$1,500 to $1,999
0 (0.0%)
0 (0.0%)
$2,000 to $2,499
77 (58.3%)
0 (0.0%)
$2,500 to $2,999
0 (0.0%)
0 (0.0%)
$3,000 or more
0 (0.0%)
0 (0.0%)
Total
132 (100.0%)
0 (0.0%)
Physical Housing Characteristics in Nordic
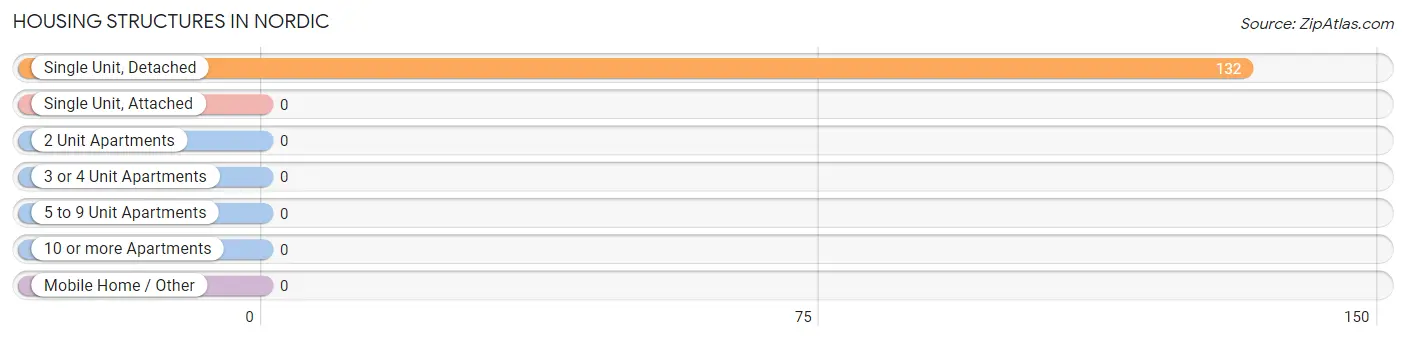
Housing Structures in Nordic
Structure Type
# Housing Units
% Housing Units
Single Unit, Detached
132
100.0%
Single Unit, Attached
0
0.0%
2 Unit Apartments
0
0.0%
3 or 4 Unit Apartments
0
0.0%
5 to 9 Unit Apartments
0
0.0%
10 or more Apartments
0
0.0%
Mobile Home / Other
0
0.0%
Total
132
100.0%
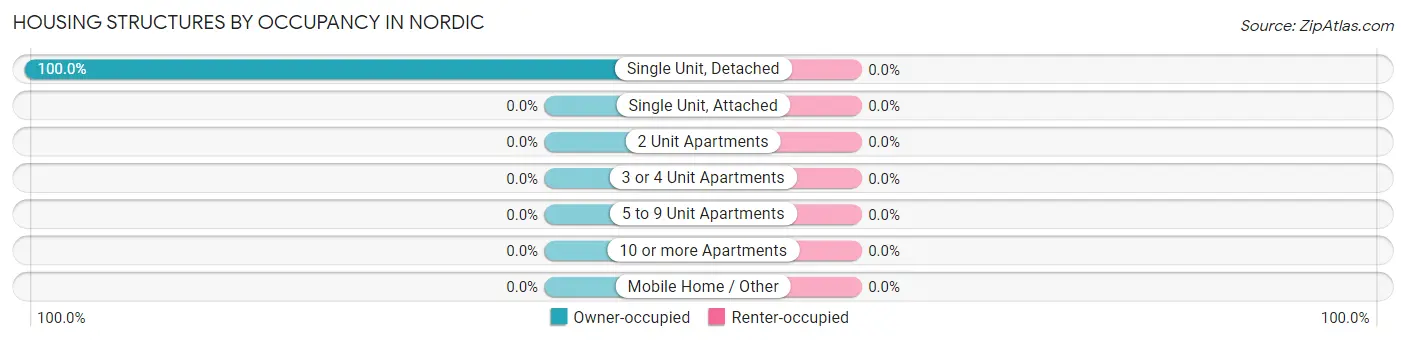
Housing Structures by Occupancy in Nordic
Structure Type
Owner-occupied
Renter-occupied
Single Unit, Detached
132 (100.0%)
0 (0.0%)
Single Unit, Attached
0 (0.0%)
0 (0.0%)
2 Unit Apartments
0 (0.0%)
0 (0.0%)
3 or 4 Unit Apartments
0 (0.0%)
0 (0.0%)
5 to 9 Unit Apartments
0 (0.0%)
0 (0.0%)
10 or more Apartments
0 (0.0%)
0 (0.0%)
Mobile Home / Other
0 (0.0%)
0 (0.0%)
Total
132 (100.0%)
0 (0.0%)
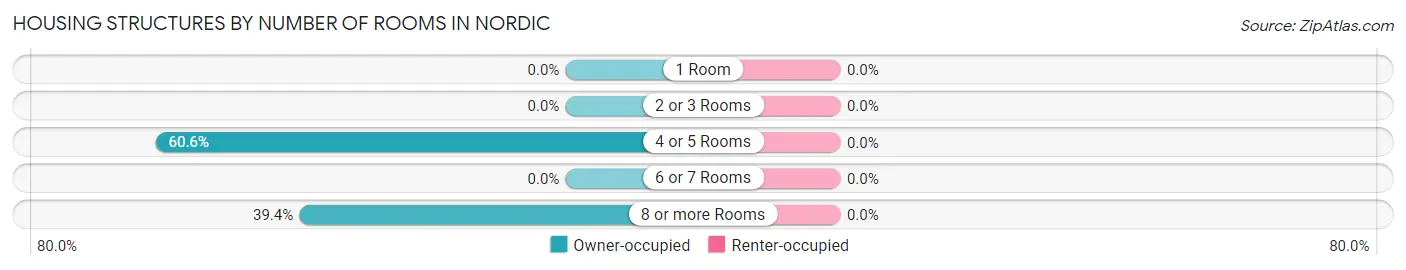
Housing Structures by Number of Rooms in Nordic
Number of Rooms
Owner-occupied
Renter-occupied
1 Room
0 (0.0%)
0 (0.0%)
2 or 3 Rooms
0 (0.0%)
0 (0.0%)
4 or 5 Rooms
80 (60.6%)
0 (0.0%)
6 or 7 Rooms
0 (0.0%)
0 (0.0%)
8 or more Rooms
52 (39.4%)
0 (0.0%)
Total
132 (100.0%)
0 (0.0%)
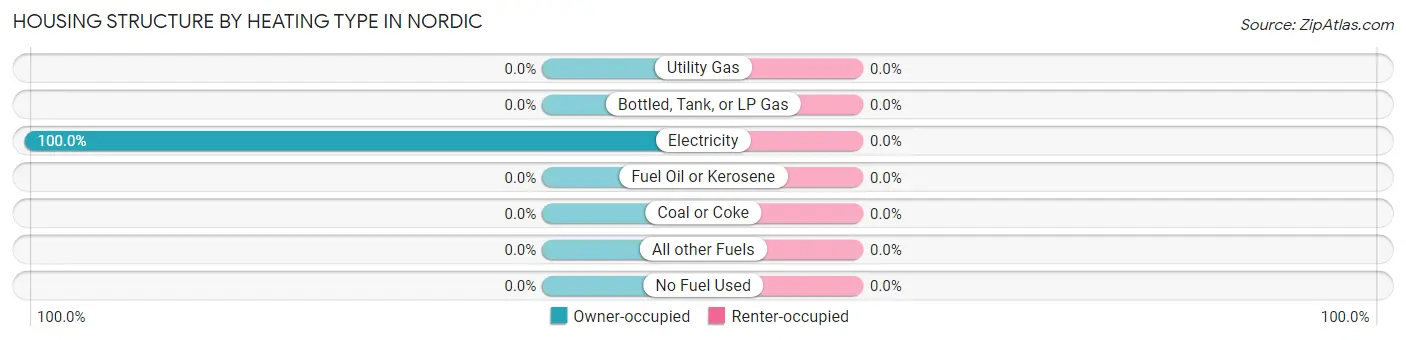
Housing Structure by Heating Type in Nordic
Heating Type
Owner-occupied
Renter-occupied
Utility Gas
0 (0.0%)
0 (0.0%)
Bottled, Tank, or LP Gas
0 (0.0%)
0 (0.0%)
Electricity
132 (100.0%)
0 (0.0%)
Fuel Oil or Kerosene
0 (0.0%)
0 (0.0%)
Coal or Coke
0 (0.0%)
0 (0.0%)
All other Fuels
0 (0.0%)
0 (0.0%)
No Fuel Used
0 (0.0%)
0 (0.0%)
Total
132 (100.0%)
0 (0.0%)
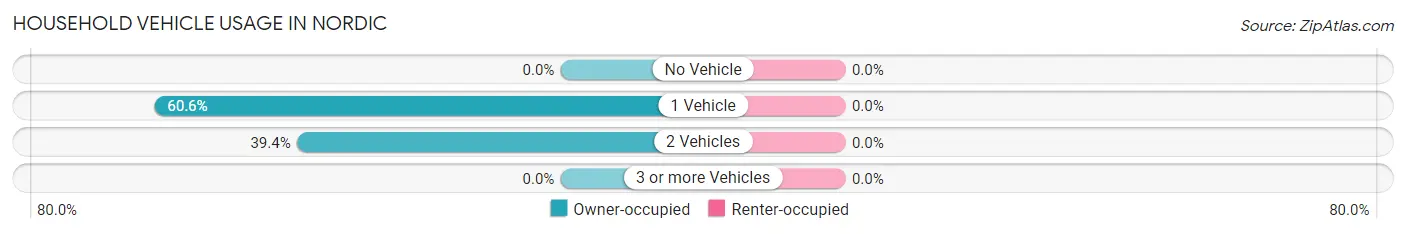
Household Vehicle Usage in Nordic
Vehicles per Household
Owner-occupied
Renter-occupied
No Vehicle
0 (0.0%)
0 (0.0%)
1 Vehicle
80 (60.6%)
0 (0.0%)
2 Vehicles
52 (39.4%)
0 (0.0%)
3 or more Vehicles
0 (0.0%)
0 (0.0%)
Total
132 (100.0%)
0 (0.0%)
Real Estate & Mortgages in Nordic
Real Estate and Mortgage Overview in Nordic
Characteristic
Without Mortgage
With Mortgage
Housing Units
0
132
Median Property Value
-
-
Median Household Income
-
-
Monthly Housing Costs
-
-
Real Estate Taxes
-
-
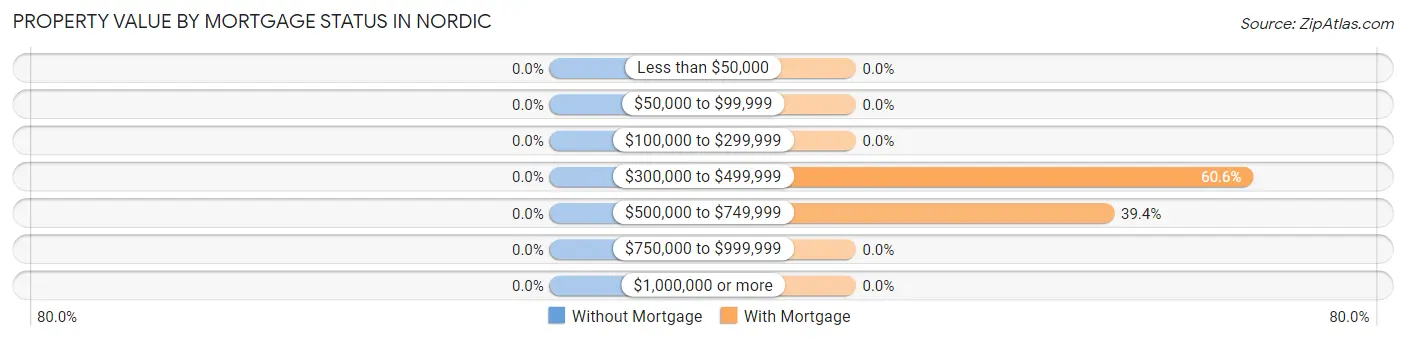
Property Value by Mortgage Status in Nordic
Property Value
Without Mortgage
With Mortgage
Less than $50,000
0 (0.0%)
0 (0.0%)
$50,000 to $99,999
0 (0.0%)
0 (0.0%)
$100,000 to $299,999
0 (0.0%)
0 (0.0%)
$300,000 to $499,999
0 (0.0%)
80 (60.6%)
$500,000 to $749,999
0 (0.0%)
52 (39.4%)
$750,000 to $999,999
0 (0.0%)
0 (0.0%)
$1,000,000 or more
0 (0.0%)
0 (0.0%)
Total
0 (0.0%)
132 (100.0%)
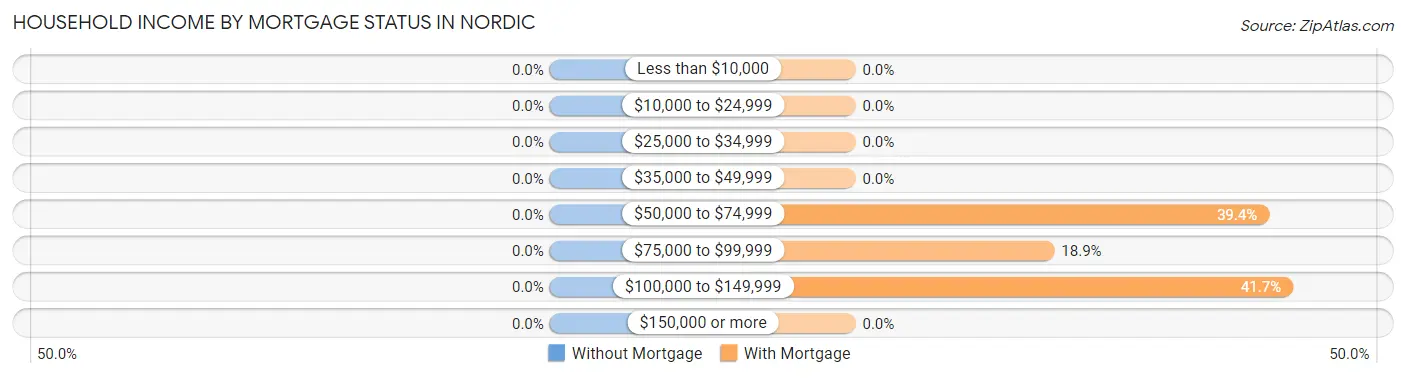
Household Income by Mortgage Status in Nordic
Household Income
Without Mortgage
With Mortgage
Less than $10,000
0 (0.0%)
0 (0.0%)
$10,000 to $24,999
0 (0.0%)
0 (0.0%)
$25,000 to $34,999
0 (0.0%)
0 (0.0%)
$35,000 to $49,999
0 (0.0%)
0 (0.0%)
$50,000 to $74,999
0 (0.0%)
52 (39.4%)
$75,000 to $99,999
0 (0.0%)
25 (18.9%)
$100,000 to $149,999
0 (0.0%)
55 (41.7%)
$150,000 or more
0 (0.0%)
0 (0.0%)
Total
0 (0.0%)
132 (100.0%)
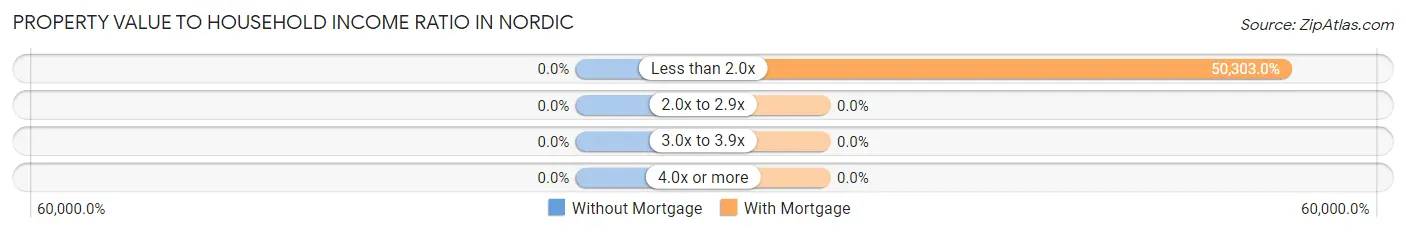
Property Value to Household Income Ratio in Nordic
Value-to-Income Ratio
Without Mortgage
With Mortgage
Less than 2.0x
0 (0.0%)
66,400 (50,303.0%)
2.0x to 2.9x
0 (0.0%)
0 (0.0%)
3.0x to 3.9x
0 (0.0%)
0 (0.0%)
4.0x or more
0 (0.0%)
0 (0.0%)
Total
0 (0.0%)
132 (100.0%)
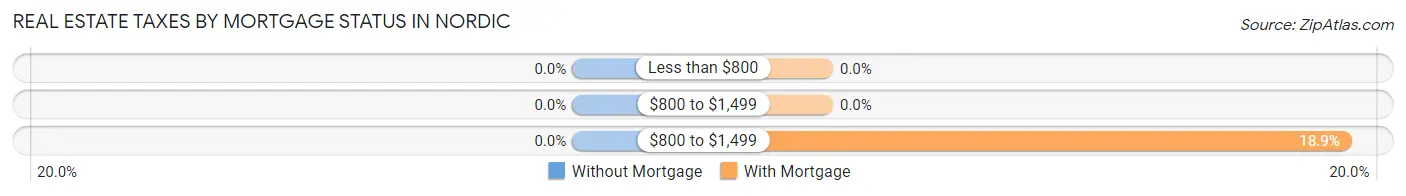
Real Estate Taxes by Mortgage Status in Nordic
Property Taxes
Without Mortgage
With Mortgage
Less than $800
0 (0.0%)
0 (0.0%)
$800 to $1,499
0 (0.0%)
0 (0.0%)
$800 to $1,499
0 (0.0%)
25 (18.9%)
Total
0 (0.0%)
132 (100.0%)
Health & Disability in Nordic
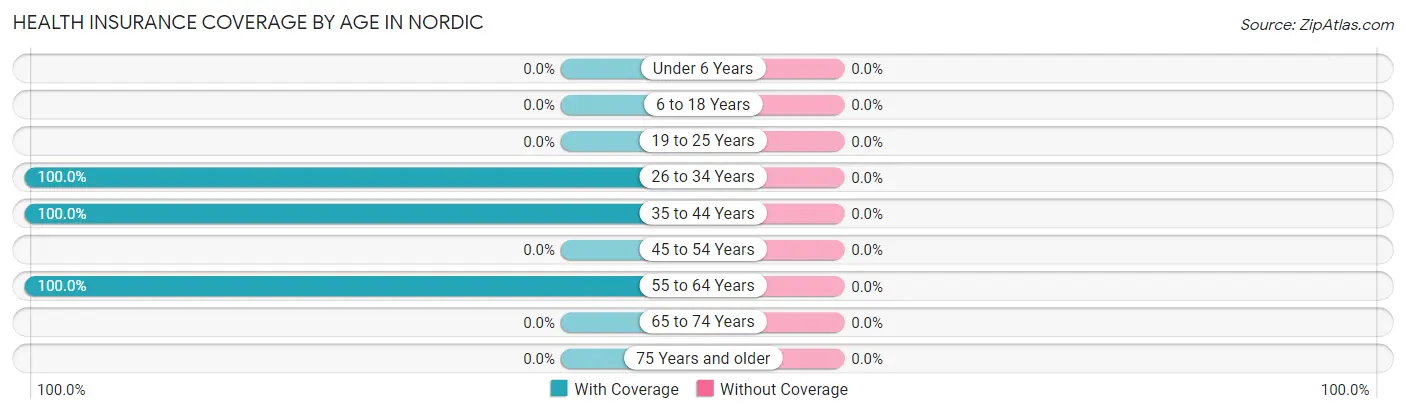
Health Insurance Coverage by Age in Nordic
Age Bracket
With Coverage
Without Coverage
Under 6 Years
0 (0.0%)
0 (0.0%)
6 to 18 Years
0 (0.0%)
0 (0.0%)
19 to 25 Years
0 (0.0%)
0 (0.0%)
26 to 34 Years
25 (100.0%)
0 (0.0%)
35 to 44 Years
55 (100.0%)
0 (0.0%)
45 to 54 Years
0 (0.0%)
0 (0.0%)
55 to 64 Years
52 (100.0%)
0 (0.0%)
65 to 74 Years
0 (0.0%)
0 (0.0%)
75 Years and older
0 (0.0%)
0 (0.0%)
Total
132 (100.0%)
0 (0.0%)
Health Insurance Coverage by Citizenship Status in Nordic
Citizenship Status
With Coverage
Without Coverage
Native Born
0 (0.0%)
0 (0.0%)
Foreign Born, Citizen
0 (0.0%)
0 (0.0%)
Foreign Born, not a Citizen
0 (0.0%)
0 (0.0%)
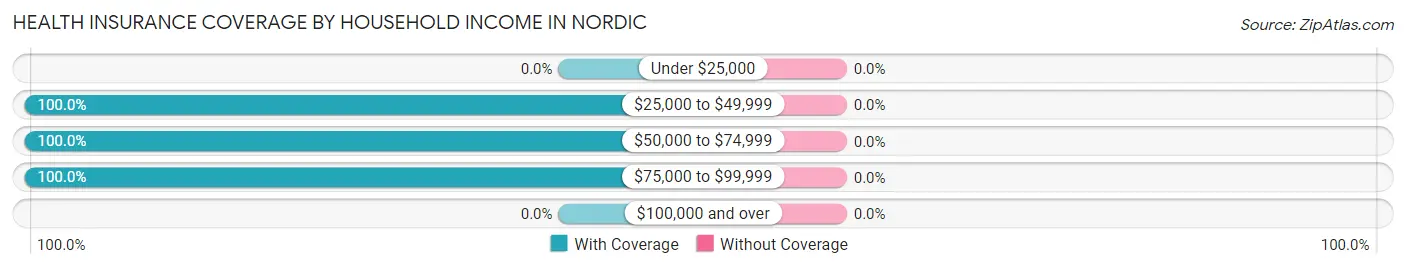
Health Insurance Coverage by Household Income in Nordic
Household Income
With Coverage
Without Coverage
Under $25,000
0 (0.0%)
0 (0.0%)
$25,000 to $49,999
52 (100.0%)
0 (0.0%)
$50,000 to $74,999
25 (100.0%)
0 (0.0%)
$75,000 to $99,999
55 (100.0%)
0 (0.0%)
$100,000 and over
0 (0.0%)
0 (0.0%)
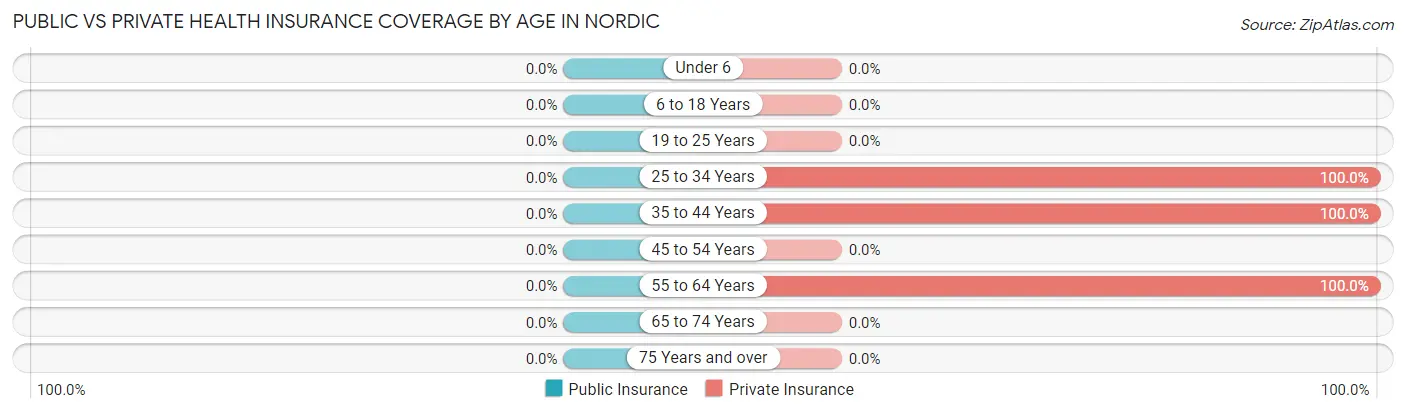
Public vs Private Health Insurance Coverage by Age in Nordic
Age Bracket
Public Insurance
Private Insurance
Under 6
0 (0.0%)
0 (0.0%)
6 to 18 Years
0 (0.0%)
0 (0.0%)
19 to 25 Years
0 (0.0%)
0 (0.0%)
25 to 34 Years
0 (0.0%)
25 (100.0%)
35 to 44 Years
0 (0.0%)
55 (100.0%)
45 to 54 Years
0 (0.0%)
0 (0.0%)
55 to 64 Years
0 (0.0%)
52 (100.0%)
65 to 74 Years
0 (0.0%)
0 (0.0%)
75 Years and over
0 (0.0%)
0 (0.0%)
Total
0 (0.0%)
132 (100.0%)
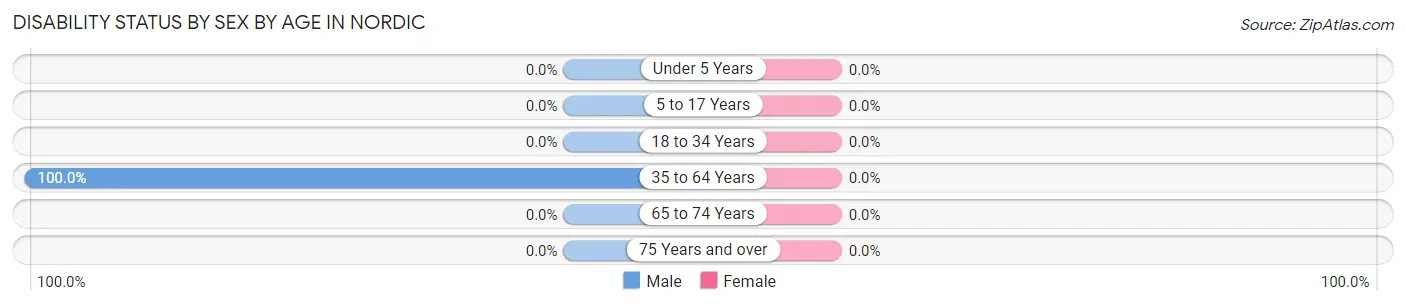
Disability Status by Sex by Age in Nordic
Age Bracket
Male
Female
Under 5 Years
0 (0.0%)
0 (0.0%)
5 to 17 Years
0 (0.0%)
0 (0.0%)
18 to 34 Years
0 (0.0%)
0 (0.0%)
35 to 64 Years
55 (100.0%)
0 (0.0%)
65 to 74 Years
0 (0.0%)
0 (0.0%)
75 Years and over
0 (0.0%)
0 (0.0%)
Disability Class by Sex by Age in Nordic
Disability Class: Hearing Difficulty
Age Bracket
Male
Female
Under 5 Years
0 (0.0%)
0 (0.0%)
5 to 17 Years
0 (0.0%)
0 (0.0%)
18 to 34 Years
0 (0.0%)
0 (0.0%)
35 to 64 Years
0 (0.0%)
0 (0.0%)
65 to 74 Years
0 (0.0%)
0 (0.0%)
75 Years and over
0 (0.0%)
0 (0.0%)
Disability Class: Vision Difficulty
Age Bracket
Male
Female
Under 5 Years
0 (0.0%)
0 (0.0%)
5 to 17 Years
0 (0.0%)
0 (0.0%)
18 to 34 Years
0 (0.0%)
0 (0.0%)
35 to 64 Years
0 (0.0%)
0 (0.0%)
65 to 74 Years
0 (0.0%)
0 (0.0%)
75 Years and over
0 (0.0%)
0 (0.0%)
Disability Class: Cognitive Difficulty
Age Bracket
Male
Female
5 to 17 Years
0 (0.0%)
0 (0.0%)
18 to 34 Years
0 (0.0%)
0 (0.0%)
35 to 64 Years
55 (100.0%)
0 (0.0%)
65 to 74 Years
0 (0.0%)
0 (0.0%)
75 Years and over
0 (0.0%)
0 (0.0%)
Disability Class: Ambulatory Difficulty
Age Bracket
Male
Female
5 to 17 Years
0 (0.0%)
0 (0.0%)
18 to 34 Years
0 (0.0%)
0 (0.0%)
35 to 64 Years
0 (0.0%)
0 (0.0%)
65 to 74 Years
0 (0.0%)
0 (0.0%)
75 Years and over
0 (0.0%)
0 (0.0%)
Disability Class: Self-Care Difficulty
Age Bracket
Male
Female
5 to 17 Years
0 (0.0%)
0 (0.0%)
18 to 34 Years
0 (0.0%)
0 (0.0%)
35 to 64 Years
0 (0.0%)
0 (0.0%)
65 to 74 Years
0 (0.0%)
0 (0.0%)
75 Years and over
0 (0.0%)
0 (0.0%)
Technology Access in Nordic
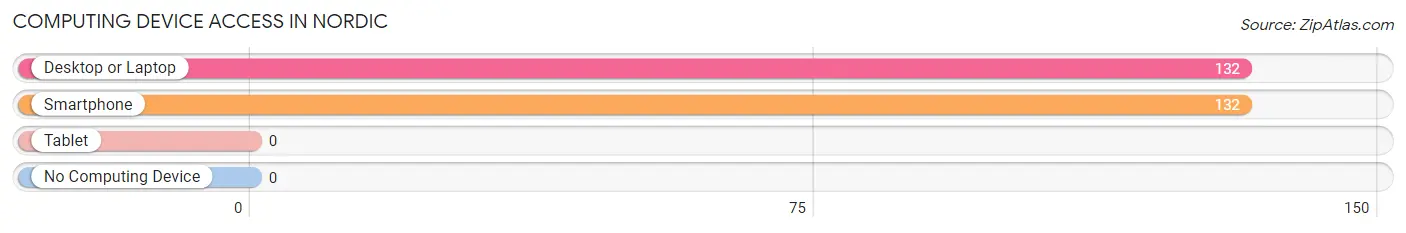
Computing Device Access in Nordic
Device Type
# Households
% Households
Desktop or Laptop
132
100.0%
Smartphone
132
100.0%
Tablet
0
0.0%
No Computing Device
0
0.0%
Total
132
100.0%
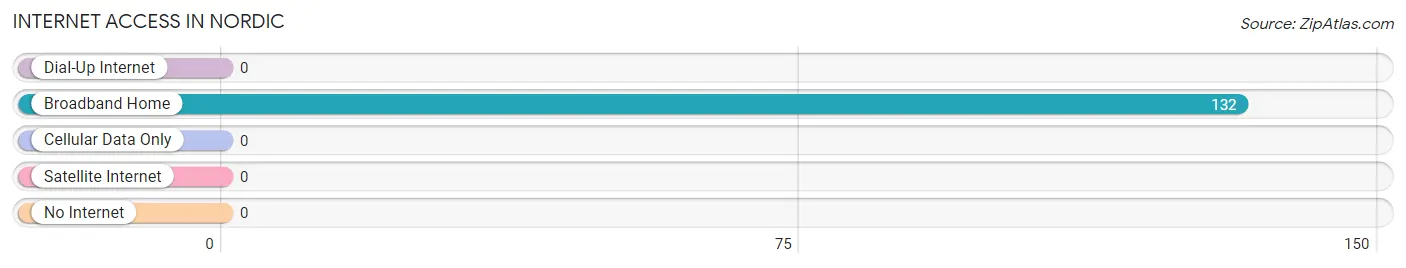
Internet Access in Nordic
Internet Type
# Households
% Households
Dial-Up Internet
0
0.0%
Broadband Home
132
100.0%
Cellular Data Only
0
0.0%
Satellite Internet
0
0.0%
No Internet
0
0.0%
Total
132
100.0%
Nordic Summary
Nordic, Wyoming is a small town located in the southeastern corner of the state, near the border of Colorado and Nebraska. It is situated in the Laramie Mountains, and is part of the Laramie River Valley. The town was founded in 1887 and was named after the Nordic settlers who first settled in the area.
History
Nordic was founded in 1887 by a group of Swedish immigrants who had come to the United States in search of a better life. The town was originally called Swede Town, but the name was changed to Nordic in 1895. The town was a small farming community, and the settlers grew wheat, oats, and barley. They also raised cattle and sheep, and the town was known for its excellent quality wool.
In the early 1900s, the town began to grow and prosper. The railroad came to town in 1906, and the town was incorporated in 1909. The railroad brought new businesses and industries to the area, and the town began to grow rapidly. By the 1920s, the town had a population of over 1,000 people.
Geography
Nordic is located in the southeastern corner of Wyoming, near the border of Colorado and Nebraska. It is situated in the Laramie Mountains, and is part of the Laramie River Valley. The town is located at an elevation of 6,000 feet, and the surrounding area is mostly flat and rolling hills. The town is surrounded by the Medicine Bow National Forest, and the nearby Medicine Bow Mountains provide a beautiful backdrop.
Economy
Nordic’s economy is largely based on agriculture and tourism. The town is home to several farms, and the surrounding area is known for its excellent quality wheat, oats, and barley. The town is also home to several tourist attractions, including the Medicine Bow National Forest and the nearby Medicine Bow Mountains.
The town is also home to several small businesses, including restaurants, shops, and hotels. The town is also home to a small airport, which serves as a hub for air travel in the region.
Demographics
As of the 2010 census, the population of Nordic was 1,093. The town is predominantly white, with a small Hispanic population. The median household income is $45,000, and the median home value is $150,000. The town has a low unemployment rate, and the majority of the population is employed in the agricultural and tourism industries.
Common Questions
What is the Total Population of Nordic?
Total Population of Nordic is 132.
What is the Total Male Population of Nordic?
Total Male Population of Nordic is 80.
What is the Total Female Population of Nordic?
Total Female Population of Nordic is 52.
What is the Ratio of Males per 100 Females in Nordic?
There are 153.85 Males per 100 Females in Nordic.
What is the Ratio of Females per 100 Males in Nordic?
There are 65.00 Females per 100 Males in Nordic.
What is the Median Population Age in Nordic?
Median Population Age in Nordic is 36.7 Years.
What is Per Capita Income in Nordic?
Per Capita income in Nordic is $61,311.
What is the Median Household income in Nordic?
Median Household Income in Nordic is $66,400.
What is Inequality or Gini Index in Nordic?
Inequality or Gini Index in Nordic is 0.18.
How Large is the Labor Force in Nordic?
There are 132 People in the Labor Forcein in Nordic.
What is the Percentage of People in the Labor Force in Nordic?
100.0% of People are in the Labor Force in Nordic.
Report Title
Report Link
HTML Copy & Paste Link
Social Media
Copy and paste the folowing code into any webpage where you would like this interactive chart to display