Weston County, WY
Weston County Map
Weston County Overview
6,870
TOTAL POPULATION
3,718
MALE POPULATION
3,152
FEMALE POPULATION
117.96
MALES / 100 FEMALES
84.78
FEMALES / 100 MALES
43.1
MEDIAN AGE
2.9
AVG FAMILY SIZE
2.5
AVG HOUSEHOLD SIZE
$37,067
PER CAPITA INCOME
$77,656
AVG FAMILY INCOME
$71,800
AVG HOUSEHOLD INCOME
51.8%
WAGE / INCOME GAP [ % ]
48.2¢/ $1
WAGE / INCOME GAP [ $ ]
0.48
INEQUALITY / GINI INDEX
3,161
LABOR FORCE [ PEOPLE ]
55.4%
PERCENT IN LABOR FORCE
3.6%
UNEMPLOYMENT RATE
Weston County Area Codes
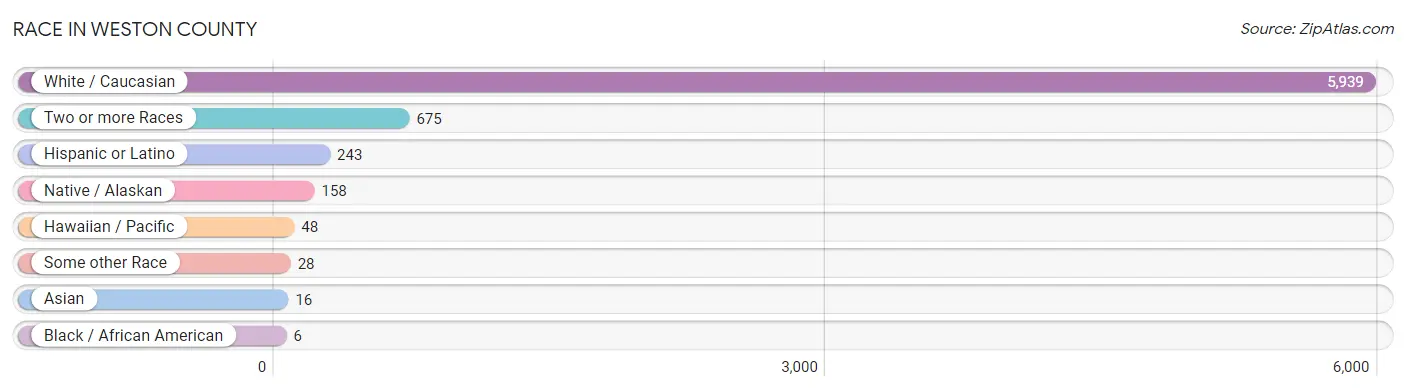
Race in Weston County
The most populous races in Weston County are White / Caucasian (5,939 | 86.5%), Two or more Races (675 | 9.8%), and Hispanic or Latino (243 | 3.5%).
| Race | # Population | % Population |
| Asian | 16 | 0.2% |
| Black / African American | 6 | 0.1% |
| Hawaiian / Pacific | 48 | 0.7% |
| Hispanic or Latino | 243 | 3.5% |
| Native / Alaskan | 158 | 2.3% |
| White / Caucasian | 5,939 | 86.5% |
| Two or more Races | 675 | 9.8% |
| Some other Race | 28 | 0.4% |
| Total | 6,870 | 100.0% |
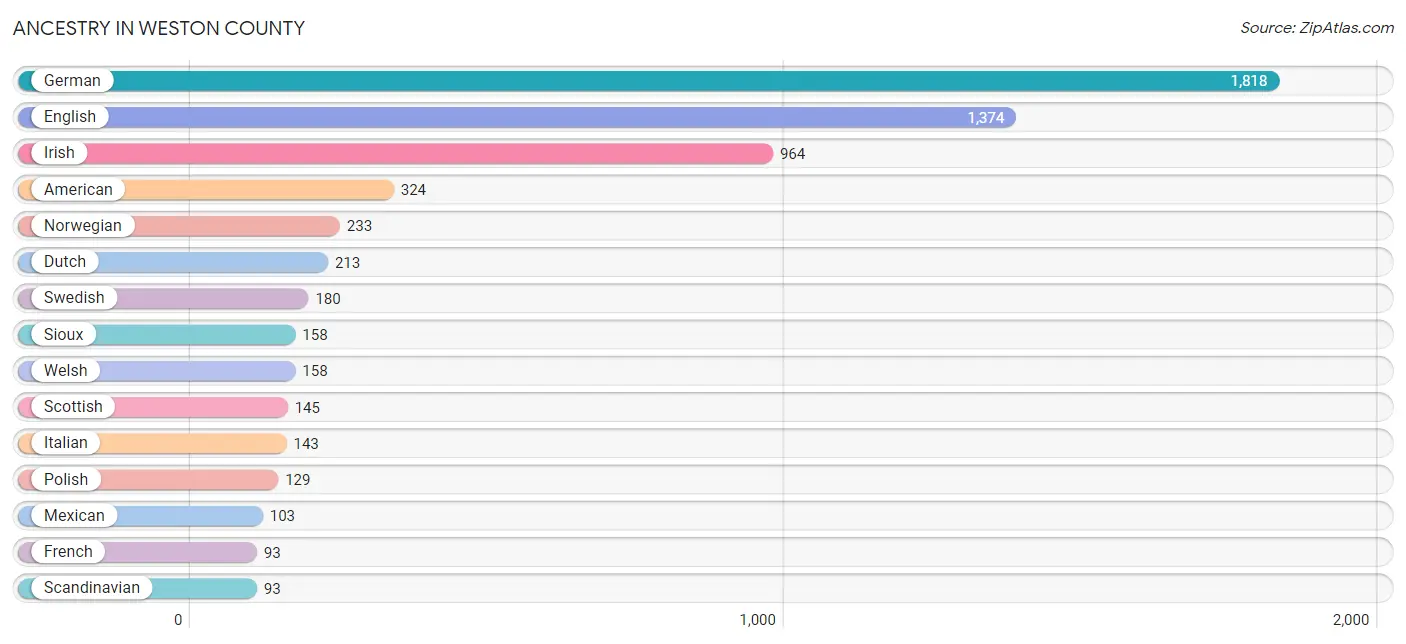
Ancestry in Weston County
The most populous ancestries reported in Weston County are German (1,818 | 26.5%), English (1,374 | 20.0%), Irish (964 | 14.0%), American (324 | 4.7%), and Norwegian (233 | 3.4%), together accounting for 68.6% of all Weston County residents.
| Ancestry | # Population | % Population |
| American | 324 | 4.7% |
| Basque | 2 | 0.0% |
| Belgian | 9 | 0.1% |
| Bhutanese | 1 | 0.0% |
| Blackfeet | 20 | 0.3% |
| British | 28 | 0.4% |
| Canadian | 12 | 0.2% |
| Central American | 69 | 1.0% |
| Central American Indian | 51 | 0.7% |
| Cherokee | 74 | 1.1% |
| Cheyenne | 36 | 0.5% |
| Crow | 2 | 0.0% |
| Czech | 11 | 0.2% |
| Czechoslovakian | 14 | 0.2% |
| Danish | 85 | 1.2% |
| Dutch | 213 | 3.1% |
| English | 1,374 | 20.0% |
| Estonian | 9 | 0.1% |
| European | 60 | 0.9% |
| Finnish | 25 | 0.4% |
| French | 93 | 1.3% |
| French Canadian | 17 | 0.3% |
| German | 1,818 | 26.5% |
| German Russian | 2 | 0.0% |
| Greek | 5 | 0.1% |
| Guatemalan | 59 | 0.9% |
| Honduran | 1 | 0.0% |
| Icelander | 3 | 0.0% |
| Indian (Asian) | 15 | 0.2% |
| Irish | 964 | 14.0% |
| Italian | 143 | 2.1% |
| Korean | 58 | 0.8% |
| Luxembourger | 5 | 0.1% |
| Mexican | 103 | 1.5% |
| Mexican American Indian | 52 | 0.8% |
| Norwegian | 233 | 3.4% |
| Polish | 129 | 1.9% |
| Portuguese | 2 | 0.0% |
| Potawatomi | 18 | 0.3% |
| Puerto Rican | 19 | 0.3% |
| Russian | 49 | 0.7% |
| Salvadoran | 9 | 0.1% |
| Scandinavian | 93 | 1.3% |
| Scotch-Irish | 19 | 0.3% |
| Scottish | 145 | 2.1% |
| Shoshone | 4 | 0.1% |
| Sioux | 158 | 2.3% |
| Spanish | 37 | 0.5% |
| Swedish | 180 | 2.6% |
| Swiss | 11 | 0.2% |
| Welsh | 158 | 2.3% |
| Yugoslavian | 57 | 0.8% | View All 52 Rows |
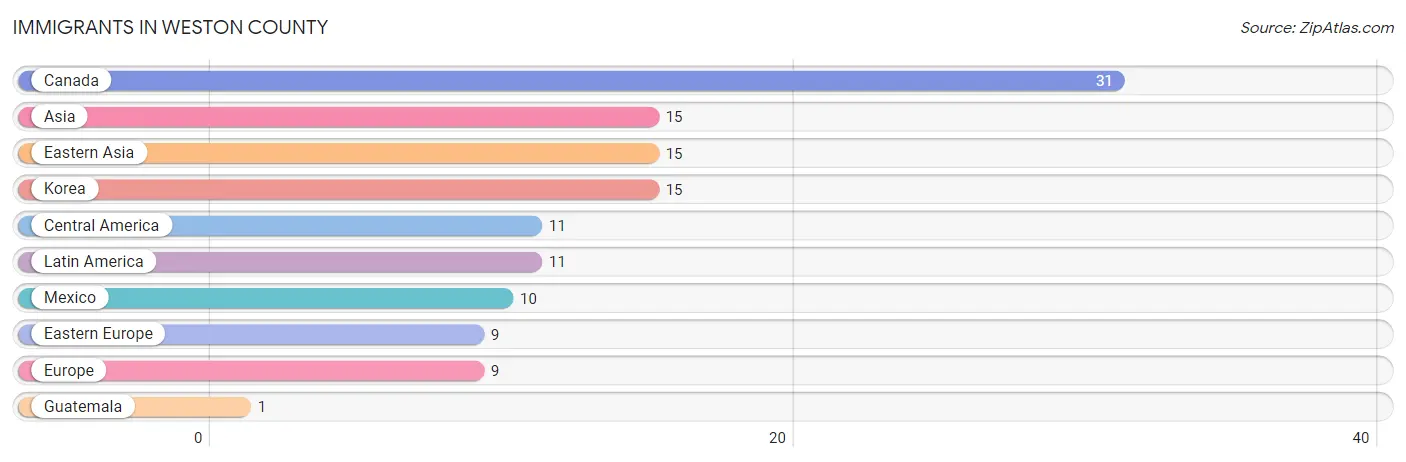
Immigrants in Weston County
The most numerous immigrant groups reported in Weston County came from Canada (31 | 0.4%), Asia (15 | 0.2%), Eastern Asia (15 | 0.2%), Korea (15 | 0.2%), and Central America (11 | 0.2%), together accounting for 1.3% of all Weston County residents.
| Immigration Origin | # Population | % Population |
| Asia | 15 | 0.2% |
| Canada | 31 | 0.4% |
| Central America | 11 | 0.2% |
| Eastern Asia | 15 | 0.2% |
| Eastern Europe | 9 | 0.1% |
| Europe | 9 | 0.1% |
| Guatemala | 1 | 0.0% |
| Korea | 15 | 0.2% |
| Latin America | 11 | 0.2% |
| Mexico | 10 | 0.2% | View All 10 Rows |
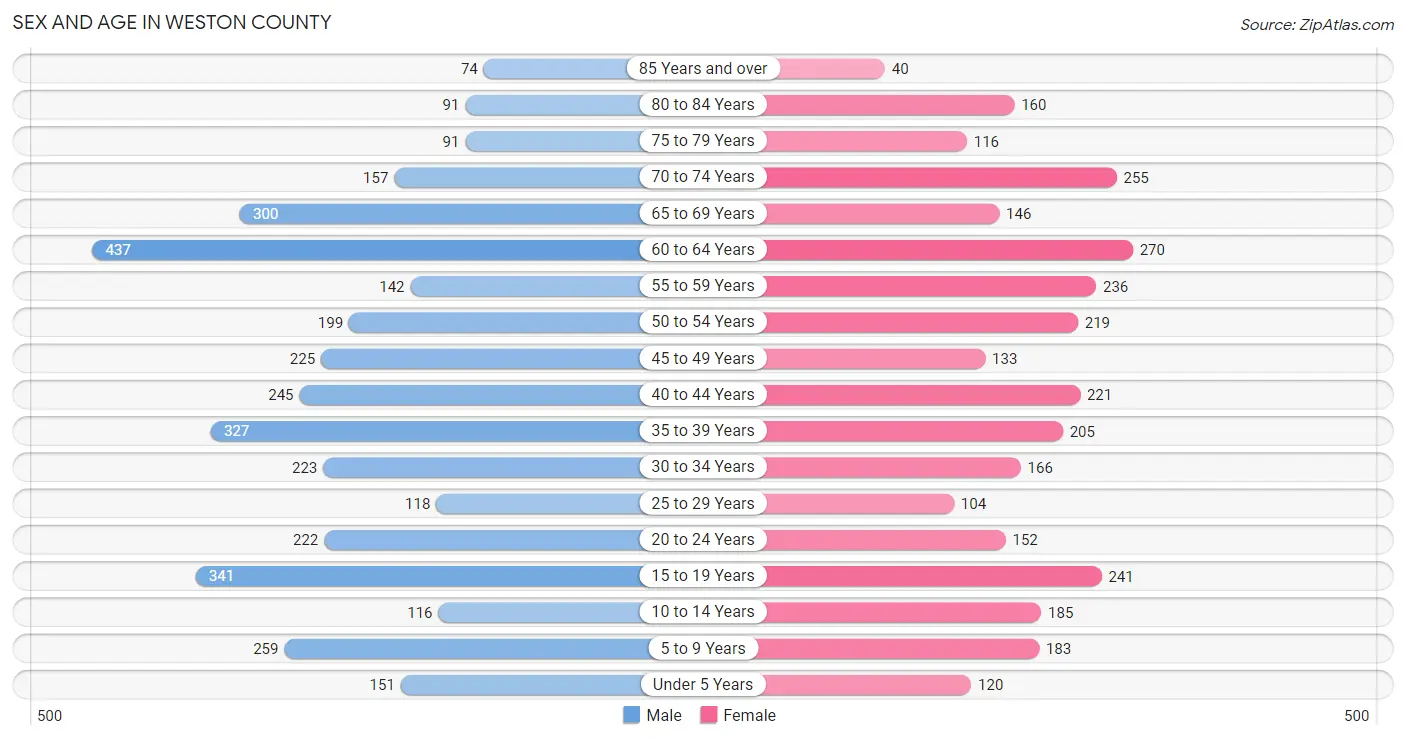
Sex and Age in Weston County
Sex and Age in Weston County
The most populous age groups in Weston County are 60 to 64 Years (437 | 11.7%) for men and 60 to 64 Years (270 | 8.6%) for women.
| Age Bracket | Male | Female |
| Under 5 Years | 151 (4.1%) | 120 (3.8%) |
| 5 to 9 Years | 259 (7.0%) | 183 (5.8%) |
| 10 to 14 Years | 116 (3.1%) | 185 (5.9%) |
| 15 to 19 Years | 341 (9.2%) | 241 (7.6%) |
| 20 to 24 Years | 222 (6.0%) | 152 (4.8%) |
| 25 to 29 Years | 118 (3.2%) | 104 (3.3%) |
| 30 to 34 Years | 223 (6.0%) | 166 (5.3%) |
| 35 to 39 Years | 327 (8.8%) | 205 (6.5%) |
| 40 to 44 Years | 245 (6.6%) | 221 (7.0%) |
| 45 to 49 Years | 225 (6.0%) | 133 (4.2%) |
| 50 to 54 Years | 199 (5.3%) | 219 (7.0%) |
| 55 to 59 Years | 142 (3.8%) | 236 (7.5%) |
| 60 to 64 Years | 437 (11.7%) | 270 (8.6%) |
| 65 to 69 Years | 300 (8.1%) | 146 (4.6%) |
| 70 to 74 Years | 157 (4.2%) | 255 (8.1%) |
| 75 to 79 Years | 91 (2.5%) | 116 (3.7%) |
| 80 to 84 Years | 91 (2.5%) | 160 (5.1%) |
| 85 Years and over | 74 (2.0%) | 40 (1.3%) |
| Total | 3,718 (100.0%) | 3,152 (100.0%) |
Families and Households in Weston County
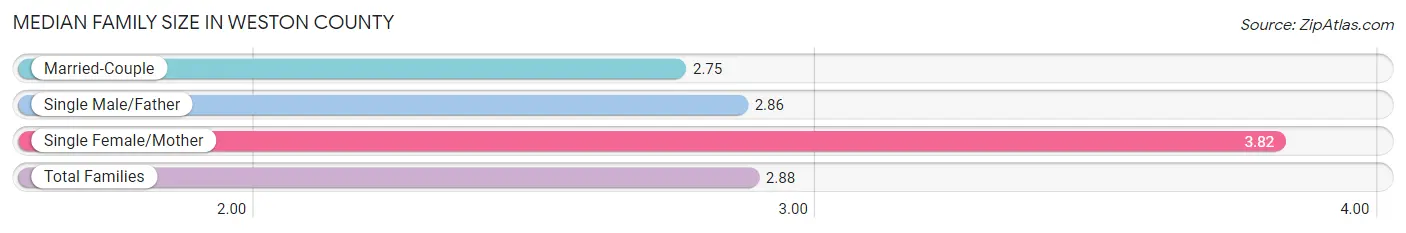
Median Family Size in Weston County
The median family size in Weston County is 2.88 persons per family, with single female/mother families (204 | 11.2%) accounting for the largest median family size of 3.82 persons per family. On the other hand, married-couple families (1,455 | 80.1%) represent the smallest median family size with 2.75 persons per family.
| Family Type | # Families | Family Size |
| Married-Couple | 1,455 (80.1%) | 2.75 |
| Single Male/Father | 157 (8.6%) | 2.86 |
| Single Female/Mother | 204 (11.2%) | 3.82 |
| Total Families | 1,816 (100.0%) | 2.88 |
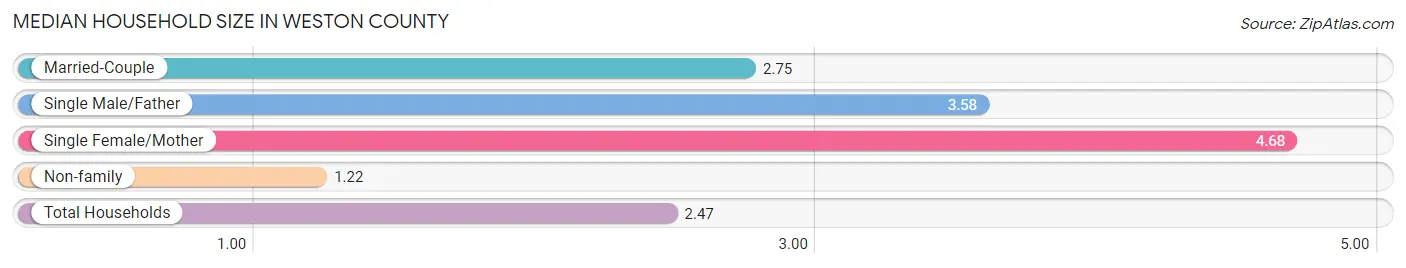
Median Household Size in Weston County
The median household size in Weston County is 2.47 persons per household, with single female/mother households (204 | 7.7%) accounting for the largest median household size of 4.68 persons per household. non-family households (822 | 31.2%) represent the smallest median household size with 1.22 persons per household.
| Household Type | # Households | Household Size |
| Married-Couple | 1,455 (55.2%) | 2.75 |
| Single Male/Father | 157 (5.9%) | 3.58 |
| Single Female/Mother | 204 (7.7%) | 4.68 |
| Non-family | 822 (31.2%) | 1.22 |
| Total Households | 2,638 (100.0%) | 2.47 |
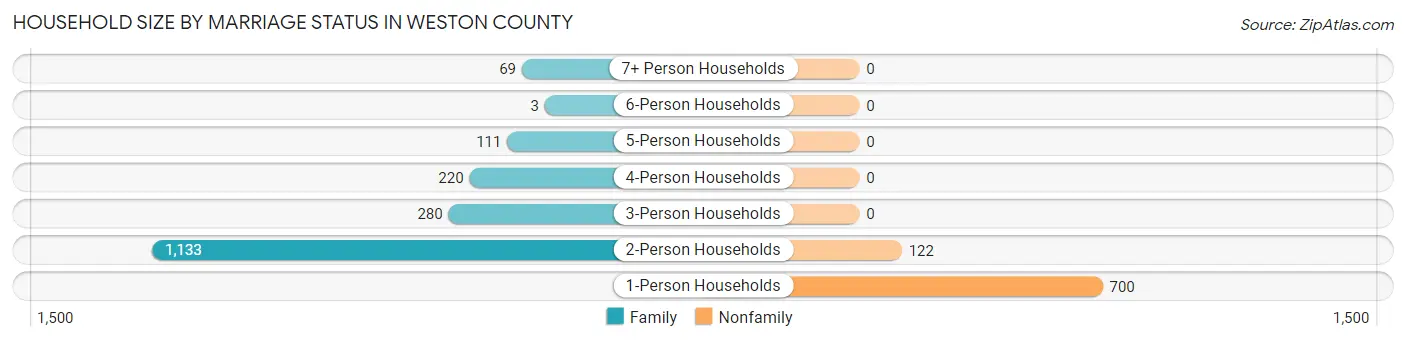
Household Size by Marriage Status in Weston County
Out of a total of 2,638 households in Weston County, 1,816 (68.8%) are family households, while 822 (31.2%) are nonfamily households. The most numerous type of family households are 2-person households, comprising 1,133, and the most common type of nonfamily households are 1-person households, comprising 700.
| Household Size | Family Households | Nonfamily Households |
| 1-Person Households | - | 700 (26.5%) |
| 2-Person Households | 1,133 (42.9%) | 122 (4.6%) |
| 3-Person Households | 280 (10.6%) | 0 (0.0%) |
| 4-Person Households | 220 (8.3%) | 0 (0.0%) |
| 5-Person Households | 111 (4.2%) | 0 (0.0%) |
| 6-Person Households | 3 (0.1%) | 0 (0.0%) |
| 7+ Person Households | 69 (2.6%) | 0 (0.0%) |
| Total | 1,816 (68.8%) | 822 (31.2%) |
Female Fertility in Weston County
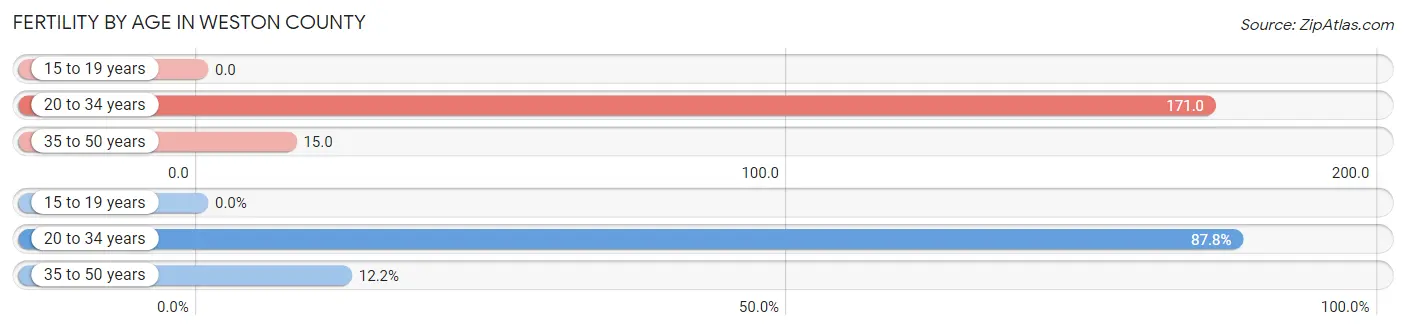
Fertility by Age in Weston County
Average fertility rate in Weston County is 62.0 births per 1,000 women. Women in the age bracket of 20 to 34 years have the highest fertility rate with 171.0 births per 1,000 women. Women in the age bracket of 20 to 34 years acount for 87.8% of all women with births.
| Age Bracket | Women with Births | Births / 1,000 Women |
| 15 to 19 years | 0 (0.0%) | 0.0 |
| 20 to 34 years | 72 (87.8%) | 171.0 |
| 35 to 50 years | 10 (12.2%) | 15.0 |
| Total | 82 (100.0%) | 62.0 |
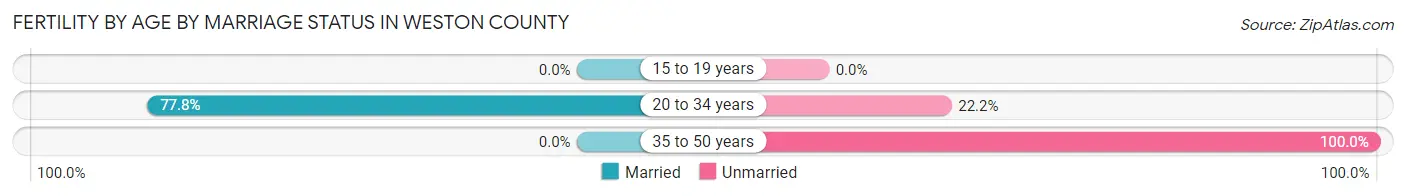
Fertility by Age by Marriage Status in Weston County
68.3% of women with births (82) in Weston County are married. The highest percentage of unmarried women with births falls into 35 to 50 years age bracket with 100.0% of them unmarried at the time of birth, while the lowest percentage of unmarried women with births belong to 20 to 34 years age bracket with 22.2% of them unmarried.
| Age Bracket | Married | Unmarried |
| 15 to 19 years | 0 (0.0%) | 0 (0.0%) |
| 20 to 34 years | 56 (77.8%) | 16 (22.2%) |
| 35 to 50 years | 0 (0.0%) | 10 (100.0%) |
| Total | 56 (68.3%) | 26 (31.7%) |
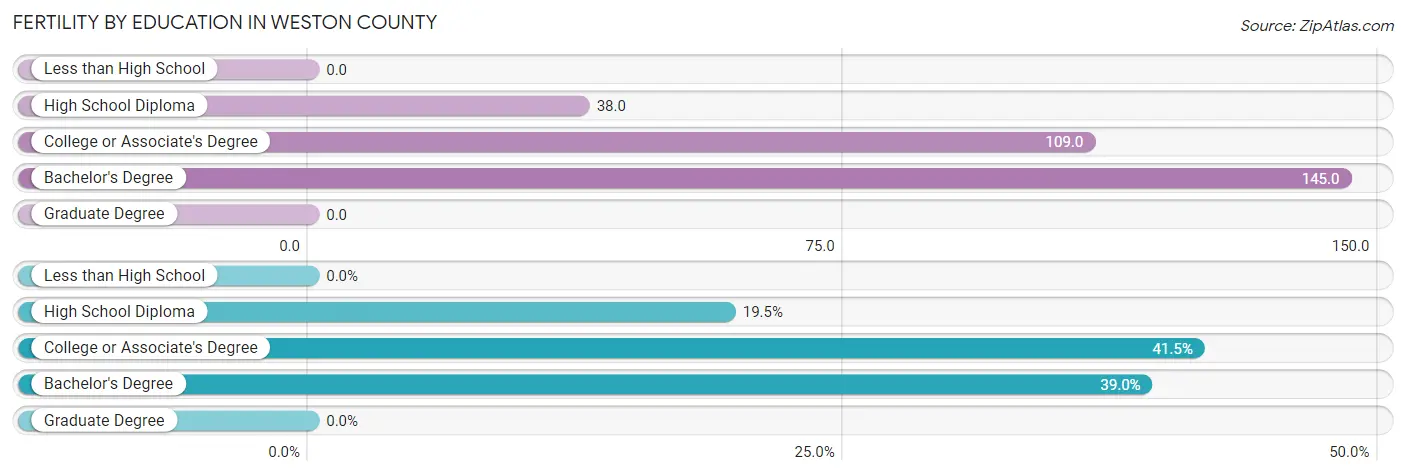
Fertility by Education in Weston County
| Educational Attainment | Women with Births | Births / 1,000 Women |
| Less than High School | 0 (0.0%) | 0.0 |
| High School Diploma | 16 (19.5%) | 38.0 |
| College or Associate's Degree | 34 (41.5%) | 109.0 |
| Bachelor's Degree | 32 (39.0%) | 145.0 |
| Graduate Degree | 0 (0.0%) | 0.0 |
| Total | 82 (100.0%) | 62.0 |
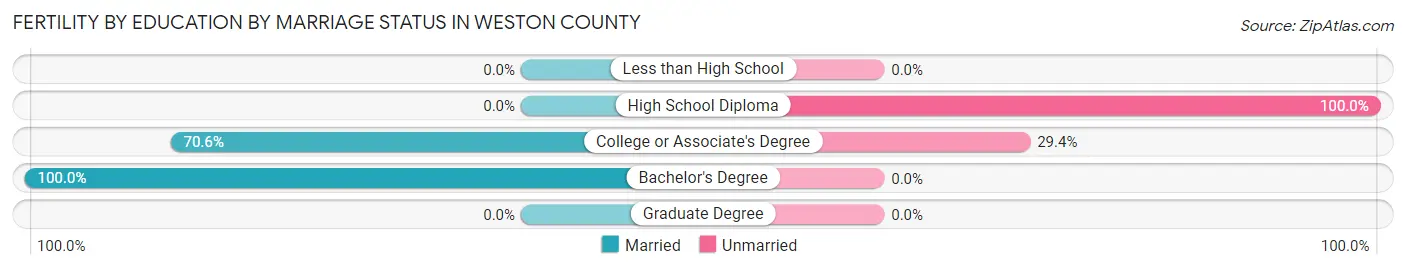
Fertility by Education by Marriage Status in Weston County
31.7% of women with births in Weston County are unmarried. Women with the educational attainment of bachelor's degree are most likely to be married with 100.0% of them married at childbirth, while women with the educational attainment of high school diploma are least likely to be married with 100.0% of them unmarried at childbirth.
| Educational Attainment | Married | Unmarried |
| Less than High School | 0 (0.0%) | 0 (0.0%) |
| High School Diploma | 0 (0.0%) | 16 (100.0%) |
| College or Associate's Degree | 24 (70.6%) | 10 (29.4%) |
| Bachelor's Degree | 32 (100.0%) | 0 (0.0%) |
| Graduate Degree | 0 (0.0%) | 0 (0.0%) |
| Total | 56 (68.3%) | 26 (31.7%) |
Income in Weston County
Income Overview in Weston County
Per Capita Income in Weston County is $37,067, while median incomes of families and households are $77,656 and $71,800 respectively.
| Characteristic | Number | Measure |
| Per Capita Income | 6,870 | $37,067 |
| Median Family Income | 1,816 | $77,656 |
| Mean Family Income | 1,816 | $90,112 |
| Median Household Income | 2,638 | $71,800 |
| Mean Household Income | 2,638 | $92,279 |
| Income Deficit | 1,816 | $0 |
| Wage / Income Gap (%) | 6,870 | 51.79% |
| Wage / Income Gap ($) | 6,870 | 48.21¢ per $1 |
| Gini / Inequality Index | 6,870 | 0.48 |
Earnings by Sex in Weston County
Average Earnings in Weston County are $36,492, $59,688 for men and $28,773 for women, a difference of 51.8%.
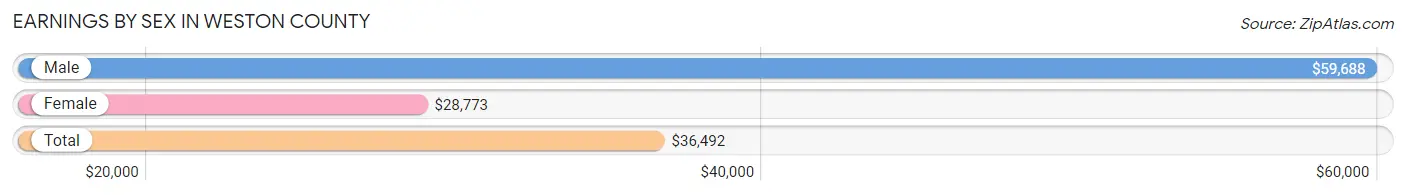
| Sex | Number | Average Earnings |
| Male | 2,041 (58.8%) | $59,688 |
| Female | 1,428 (41.2%) | $28,773 |
| Total | 3,469 (100.0%) | $36,492 |
Earnings by Sex by Income Bracket in Weston County
The most common earnings brackets in Weston County are $100,000+ for men (444 | 21.7%) and $35,000 to $39,999 for women (237 | 16.6%).
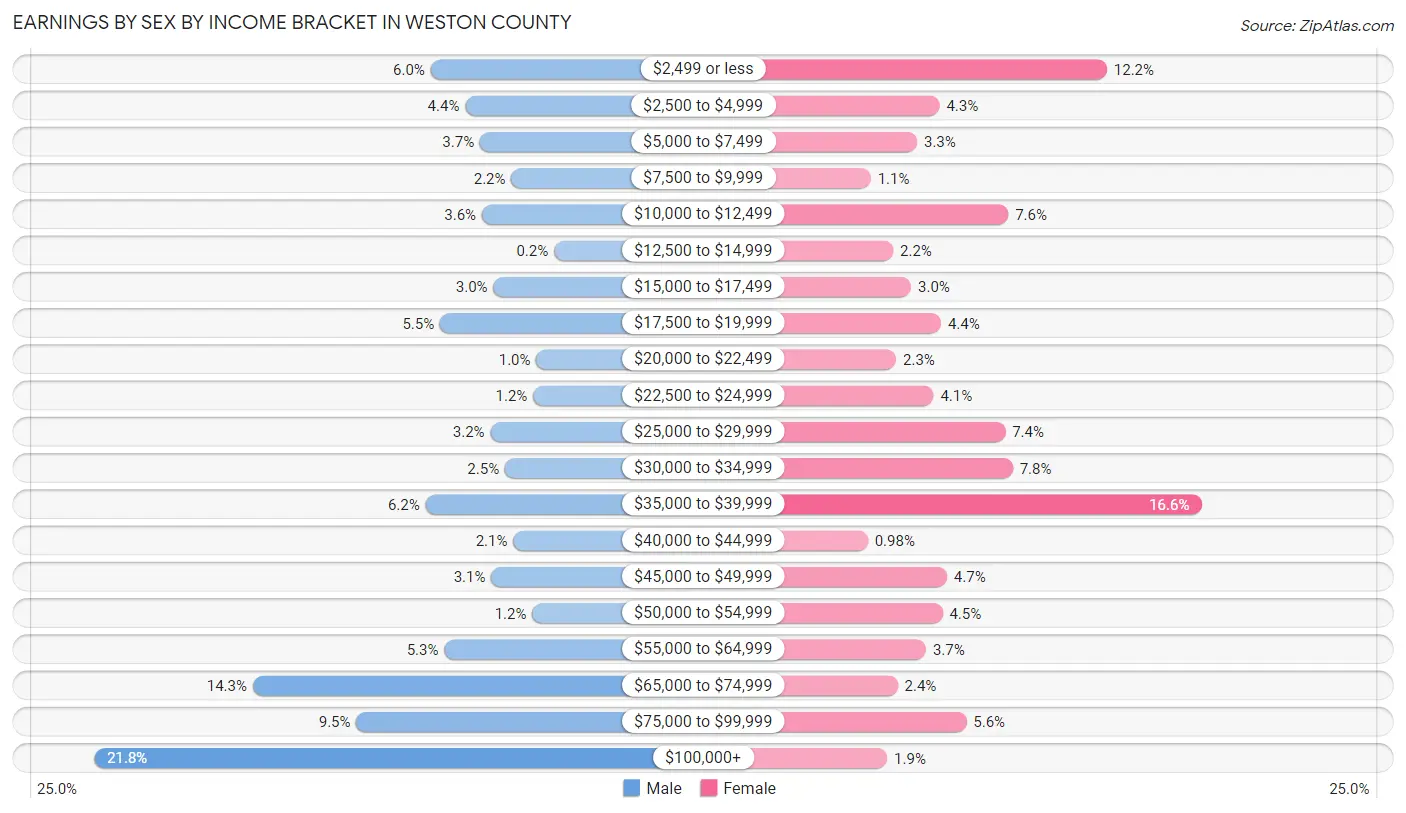
| Income | Male | Female |
| $2,499 or less | 122 (6.0%) | 174 (12.2%) |
| $2,500 to $4,999 | 89 (4.4%) | 62 (4.3%) |
| $5,000 to $7,499 | 75 (3.7%) | 47 (3.3%) |
| $7,500 to $9,999 | 45 (2.2%) | 16 (1.1%) |
| $10,000 to $12,499 | 73 (3.6%) | 108 (7.6%) |
| $12,500 to $14,999 | 4 (0.2%) | 31 (2.2%) |
| $15,000 to $17,499 | 62 (3.0%) | 43 (3.0%) |
| $17,500 to $19,999 | 113 (5.5%) | 63 (4.4%) |
| $20,000 to $22,499 | 21 (1.0%) | 33 (2.3%) |
| $22,500 to $24,999 | 24 (1.2%) | 58 (4.1%) |
| $25,000 to $29,999 | 65 (3.2%) | 106 (7.4%) |
| $30,000 to $34,999 | 51 (2.5%) | 111 (7.8%) |
| $35,000 to $39,999 | 127 (6.2%) | 237 (16.6%) |
| $40,000 to $44,999 | 43 (2.1%) | 14 (1.0%) |
| $45,000 to $49,999 | 64 (3.1%) | 67 (4.7%) |
| $50,000 to $54,999 | 25 (1.2%) | 64 (4.5%) |
| $55,000 to $64,999 | 109 (5.3%) | 53 (3.7%) |
| $65,000 to $74,999 | 292 (14.3%) | 34 (2.4%) |
| $75,000 to $99,999 | 193 (9.5%) | 80 (5.6%) |
| $100,000+ | 444 (21.7%) | 27 (1.9%) |
| Total | 2,041 (100.0%) | 1,428 (100.0%) |
Earnings by Sex by Educational Attainment in Weston County
Average earnings in Weston County are $67,363 for men and $32,579 for women, a difference of 51.6%. Men with an educational attainment of graduate degree enjoy the highest average annual earnings of $105,341, while those with high school diploma education earn the least with $62,679. Women with an educational attainment of graduate degree earn the most with the average annual earnings of $56,875, while those with high school diploma education have the smallest earnings of $17,250.
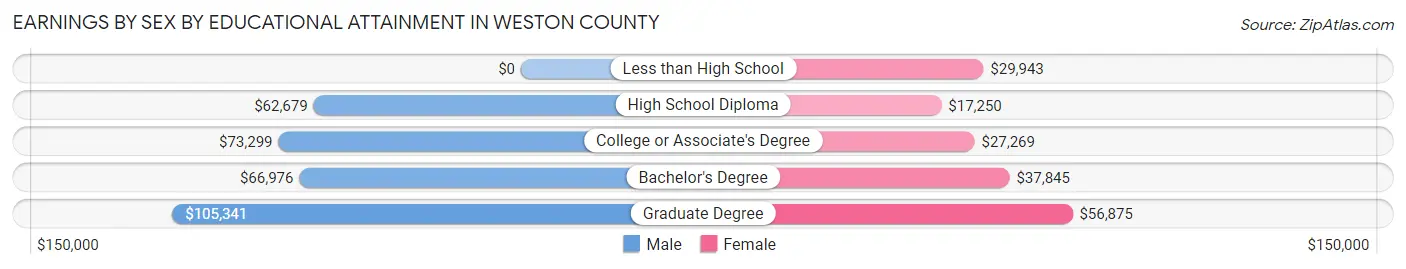
| Educational Attainment | Male Income | Female Income |
| Less than High School | - | - |
| High School Diploma | $62,679 | $17,250 |
| College or Associate's Degree | $73,299 | $27,269 |
| Bachelor's Degree | $66,976 | $37,845 |
| Graduate Degree | $105,341 | $56,875 |
| Total | $67,363 | $32,579 |
Family Income in Weston County
Family Income Brackets in Weston County
According to the Weston County family income data, there are 372 families falling into the $100,000 to $149,999 income range, which is the most common income bracket and makes up 20.5% of all families. Conversely, the $10,000 to $14,999 income bracket is the least frequent group with only 54 families (3.0%) belonging to this category.
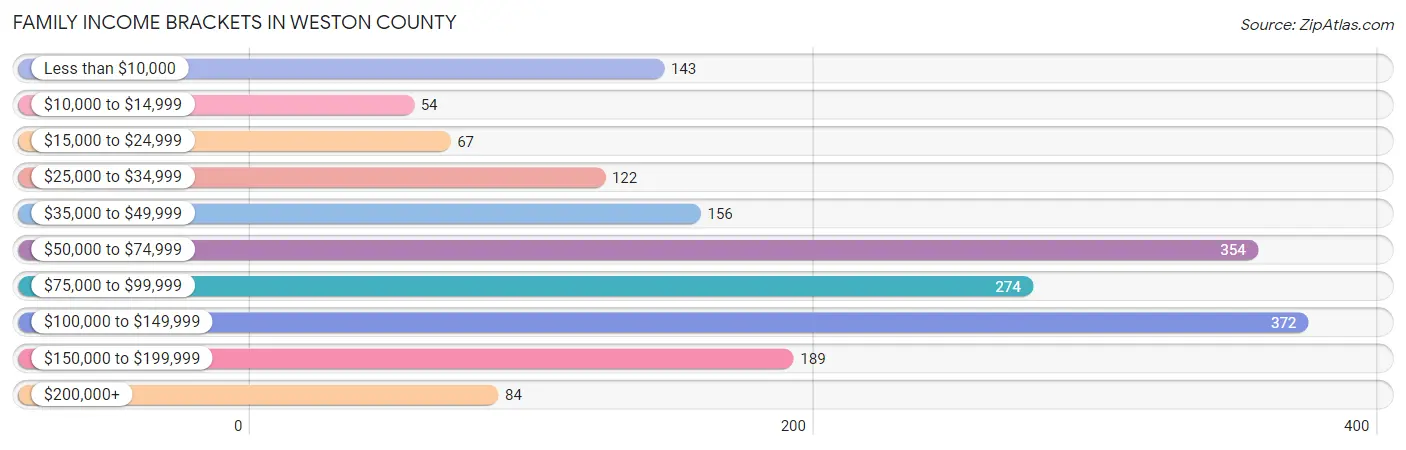
| Income Bracket | # Families | % Families |
| Less than $10,000 | 143 | 7.9% |
| $10,000 to $14,999 | 54 | 3.0% |
| $15,000 to $24,999 | 67 | 3.7% |
| $25,000 to $34,999 | 122 | 6.7% |
| $35,000 to $49,999 | 156 | 8.6% |
| $50,000 to $74,999 | 354 | 19.5% |
| $75,000 to $99,999 | 274 | 15.1% |
| $100,000 to $149,999 | 372 | 20.5% |
| $150,000 to $199,999 | 189 | 10.4% |
| $200,000+ | 84 | 4.6% |
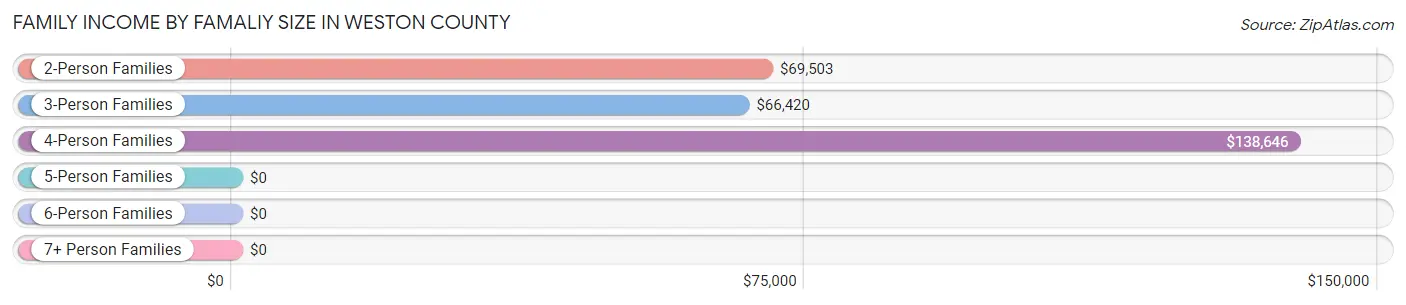
Family Income by Famaliy Size in Weston County
4-person families (185 | 10.2%) account for the highest median family income in Weston County with $138,646 per family, while 2-person families (1,167 | 64.3%) have the highest median income of $34,752 per family member.
| Income Bracket | # Families | Median Income |
| 2-Person Families | 1,167 (64.3%) | $69,503 |
| 3-Person Families | 326 (17.9%) | $66,420 |
| 4-Person Families | 185 (10.2%) | $138,646 |
| 5-Person Families | 111 (6.1%) | $0 |
| 6-Person Families | 3 (0.2%) | $0 |
| 7+ Person Families | 24 (1.3%) | $0 |
| Total | 1,816 (100.0%) | $77,656 |
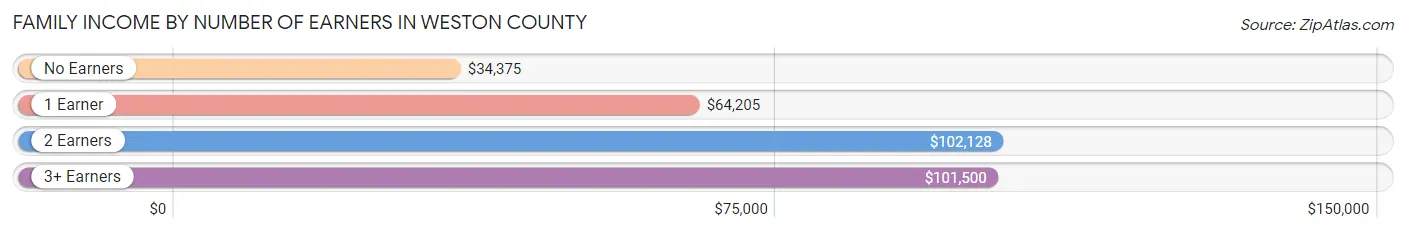
Family Income by Number of Earners in Weston County
The median family income in Weston County is $77,656, with families comprising 2 earners (701) having the highest median family income of $102,128, while families with no earners (452) have the lowest median family income of $34,375, accounting for 38.6% and 24.9% of families, respectively.
| Number of Earners | # Families | Median Income |
| No Earners | 452 (24.9%) | $34,375 |
| 1 Earner | 551 (30.3%) | $64,205 |
| 2 Earners | 701 (38.6%) | $102,128 |
| 3+ Earners | 112 (6.2%) | $101,500 |
| Total | 1,816 (100.0%) | $77,656 |
Household Income in Weston County
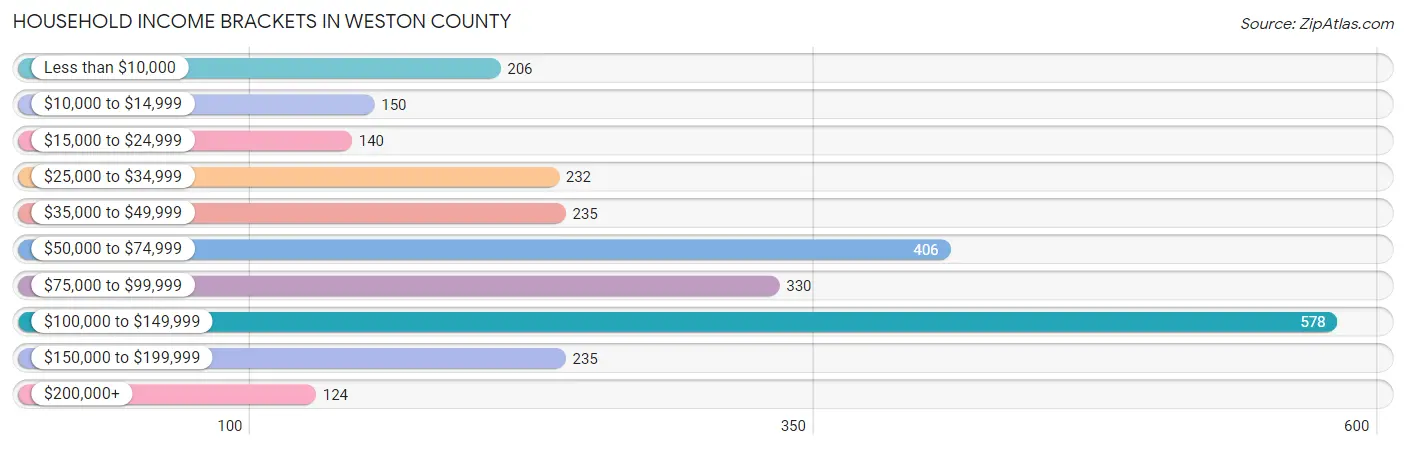
Household Income Brackets in Weston County
With 578 households falling in the category, the $100,000 to $149,999 income range is the most frequent in Weston County, accounting for 21.9% of all households. In contrast, only 124 households (4.7%) fall into the $200,000+ income bracket, making it the least populous group.
| Income Bracket | # Households | % Households |
| Less than $10,000 | 206 | 7.8% |
| $10,000 to $14,999 | 150 | 5.7% |
| $15,000 to $24,999 | 140 | 5.3% |
| $25,000 to $34,999 | 232 | 8.8% |
| $35,000 to $49,999 | 235 | 8.9% |
| $50,000 to $74,999 | 406 | 15.4% |
| $75,000 to $99,999 | 330 | 12.5% |
| $100,000 to $149,999 | 578 | 21.9% |
| $150,000 to $199,999 | 235 | 8.9% |
| $200,000+ | 124 | 4.7% |
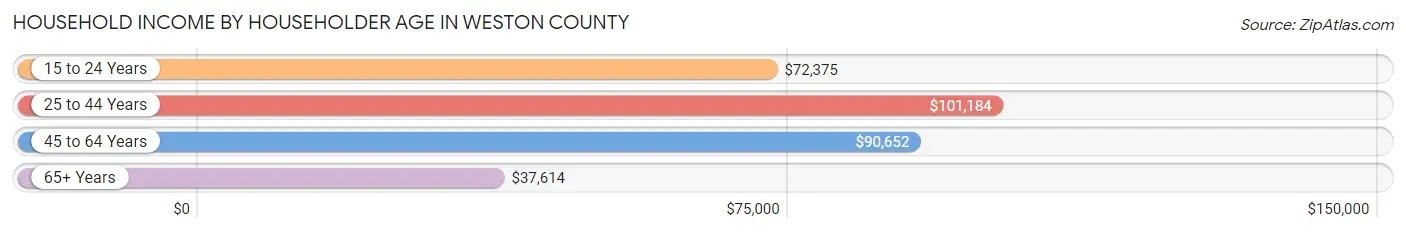
Household Income by Householder Age in Weston County
The median household income in Weston County is $71,800, with the highest median household income of $101,184 found in the 25 to 44 years age bracket for the primary householder. A total of 718 households (27.2%) fall into this category. Meanwhile, the 65+ years age bracket for the primary householder has the lowest median household income of $37,614, with 849 households (32.2%) in this group.
| Income Bracket | # Households | Median Income |
| 15 to 24 Years | 37 (1.4%) | $72,375 |
| 25 to 44 Years | 718 (27.2%) | $101,184 |
| 45 to 64 Years | 1,034 (39.2%) | $90,652 |
| 65+ Years | 849 (32.2%) | $37,614 |
| Total | 2,638 (100.0%) | $71,800 |
Poverty in Weston County
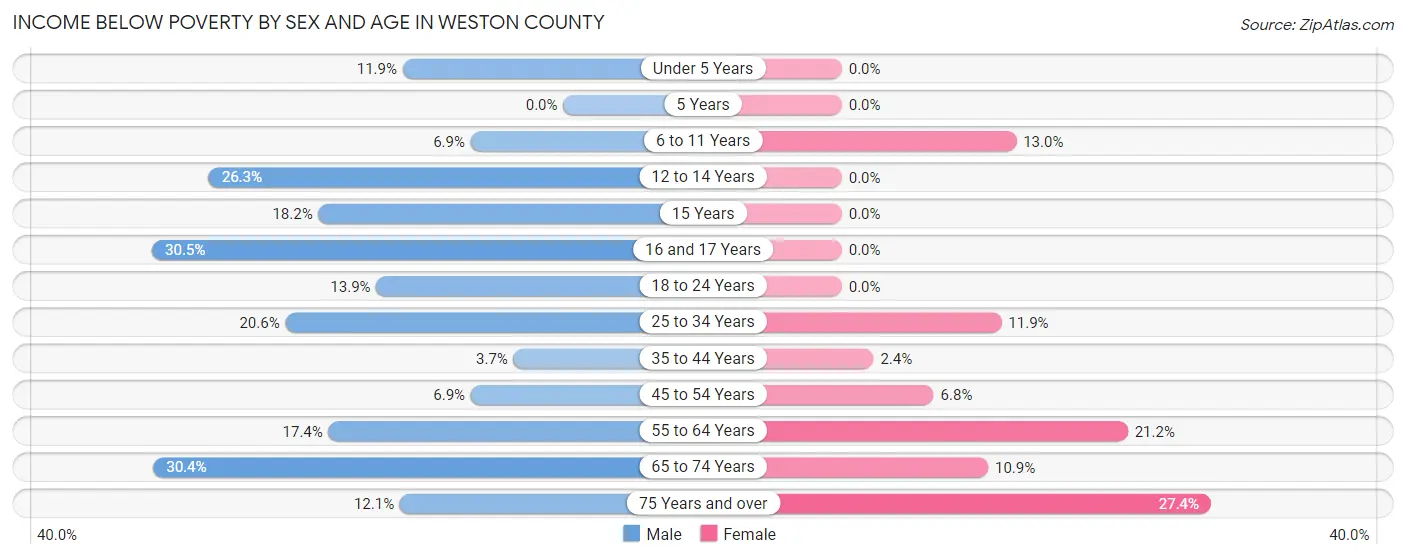
Income Below Poverty by Sex and Age in Weston County
With 15.4% poverty level for males and 10.2% for females among the residents of Weston County, 16 and 17 year old males and 75 year old and over females are the most vulnerable to poverty, with 58 males (30.5%) and 77 females (27.4%) in their respective age groups living below the poverty level.
| Age Bracket | Male | Female |
| Under 5 Years | 18 (11.9%) | 0 (0.0%) |
| 5 Years | 0 (0.0%) | 0 (0.0%) |
| 6 to 11 Years | 16 (6.9%) | 18 (13.0%) |
| 12 to 14 Years | 20 (26.3%) | 0 (0.0%) |
| 15 Years | 10 (18.2%) | 0 (0.0%) |
| 16 and 17 Years | 58 (30.5%) | 0 (0.0%) |
| 18 to 24 Years | 39 (13.9%) | 0 (0.0%) |
| 25 to 34 Years | 52 (20.6%) | 32 (11.8%) |
| 35 to 44 Years | 17 (3.7%) | 10 (2.4%) |
| 45 to 54 Years | 28 (6.9%) | 24 (6.8%) |
| 55 to 64 Years | 95 (17.4%) | 107 (21.2%) |
| 65 to 74 Years | 137 (30.4%) | 43 (10.9%) |
| 75 Years and over | 29 (12.1%) | 77 (27.4%) |
| Total | 519 (15.4%) | 311 (10.2%) |
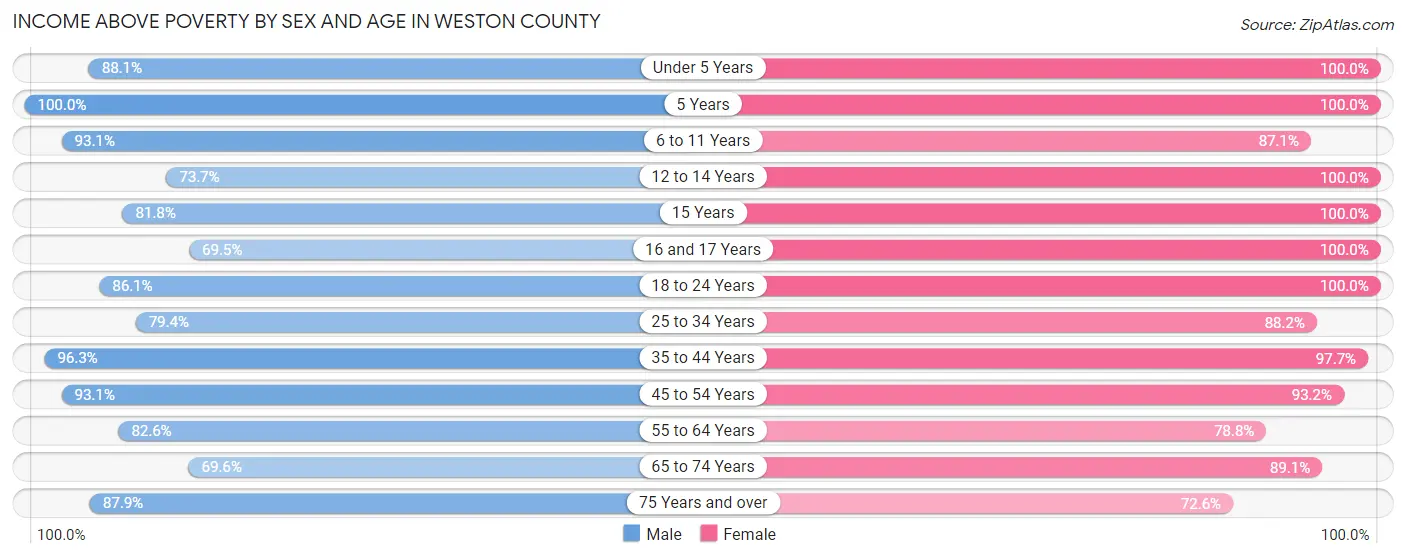
Income Above Poverty by Sex and Age in Weston County
According to the poverty statistics in Weston County, males aged 5 years and females aged under 5 years are the age groups that are most secure financially, with 100.0% of males and 100.0% of females in these age groups living above the poverty line.
| Age Bracket | Male | Female |
| Under 5 Years | 133 (88.1%) | 120 (100.0%) |
| 5 Years | 32 (100.0%) | 66 (100.0%) |
| 6 to 11 Years | 217 (93.1%) | 121 (87.1%) |
| 12 to 14 Years | 56 (73.7%) | 93 (100.0%) |
| 15 Years | 45 (81.8%) | 96 (100.0%) |
| 16 and 17 Years | 132 (69.5%) | 48 (100.0%) |
| 18 to 24 Years | 242 (86.1%) | 247 (100.0%) |
| 25 to 34 Years | 200 (79.4%) | 238 (88.1%) |
| 35 to 44 Years | 444 (96.3%) | 416 (97.7%) |
| 45 to 54 Years | 380 (93.1%) | 328 (93.2%) |
| 55 to 64 Years | 450 (82.6%) | 397 (78.8%) |
| 65 to 74 Years | 313 (69.6%) | 353 (89.1%) |
| 75 Years and over | 210 (87.9%) | 204 (72.6%) |
| Total | 2,854 (84.6%) | 2,727 (89.8%) |
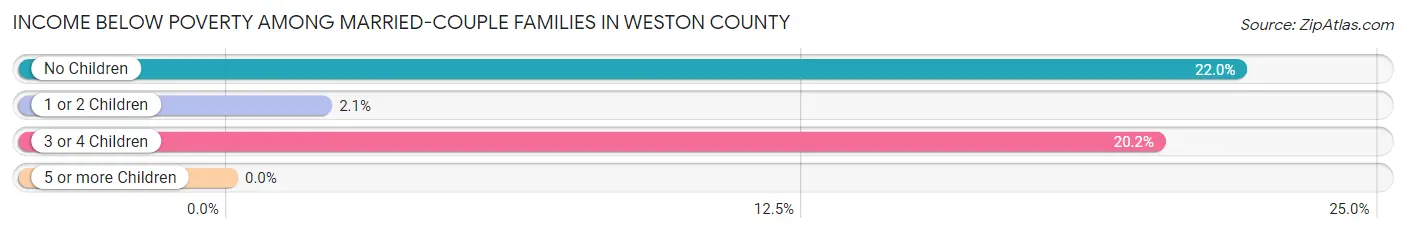
Income Below Poverty Among Married-Couple Families in Weston County
The poverty statistics for married-couple families in Weston County show that 17.6% or 256 of the total 1,455 families live below the poverty line. Families with no children have the highest poverty rate of 22.0%, comprising of 229 families. On the other hand, families with 5 or more children have the lowest poverty rate of 0.0%, which includes 0 families.
| Children | Above Poverty | Below Poverty |
| No Children | 814 (78.0%) | 229 (22.0%) |
| 1 or 2 Children | 286 (98.0%) | 6 (2.1%) |
| 3 or 4 Children | 83 (79.8%) | 21 (20.2%) |
| 5 or more Children | 16 (100.0%) | 0 (0.0%) |
| Total | 1,199 (82.4%) | 256 (17.6%) |
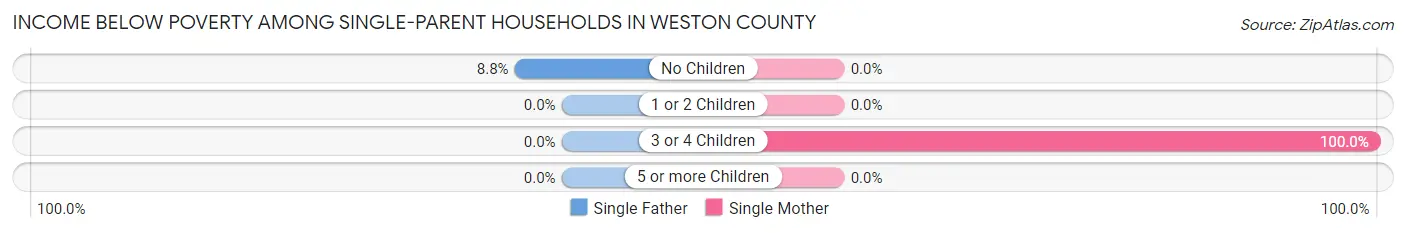
Income Below Poverty Among Single-Parent Households in Weston County
According to the poverty data in Weston County, 3.2% or 5 single-father households and 4.9% or 10 single-mother households are living below the poverty line. Among single-father households, those with no children have the highest poverty rate, with 5 households (8.8%) experiencing poverty. Likewise, among single-mother households, those with 3 or 4 children have the highest poverty rate, with 10 households (100.0%) falling below the poverty line.
| Children | Single Father | Single Mother |
| No Children | 5 (8.8%) | 0 (0.0%) |
| 1 or 2 Children | 0 (0.0%) | 0 (0.0%) |
| 3 or 4 Children | 0 (0.0%) | 10 (100.0%) |
| 5 or more Children | 0 (0.0%) | 0 (0.0%) |
| Total | 5 (3.2%) | 10 (4.9%) |
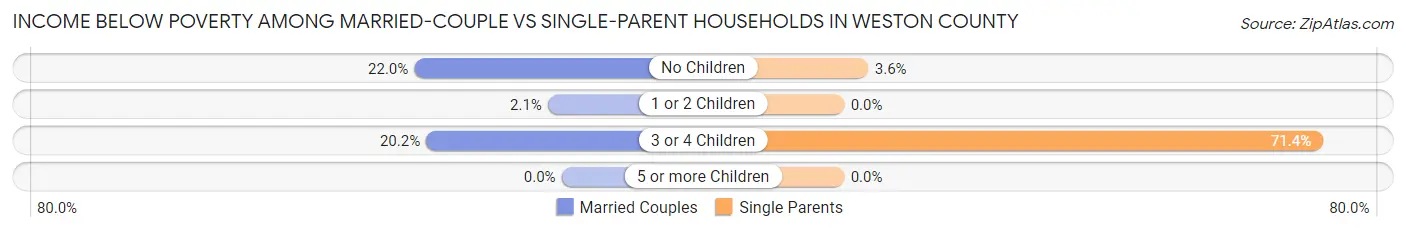
Income Below Poverty Among Married-Couple vs Single-Parent Households in Weston County
The poverty data for Weston County shows that 256 of the married-couple family households (17.6%) and 15 of the single-parent households (4.2%) are living below the poverty level. Within the married-couple family households, those with no children have the highest poverty rate, with 229 households (22.0%) falling below the poverty line. Among the single-parent households, those with 3 or 4 children have the highest poverty rate, with 10 household (71.4%) living below poverty.
| Children | Married-Couple Families | Single-Parent Households |
| No Children | 229 (22.0%) | 5 (3.6%) |
| 1 or 2 Children | 6 (2.1%) | 0 (0.0%) |
| 3 or 4 Children | 21 (20.2%) | 10 (71.4%) |
| 5 or more Children | 0 (0.0%) | 0 (0.0%) |
| Total | 256 (17.6%) | 15 (4.2%) |
Employment Characteristics in Weston County
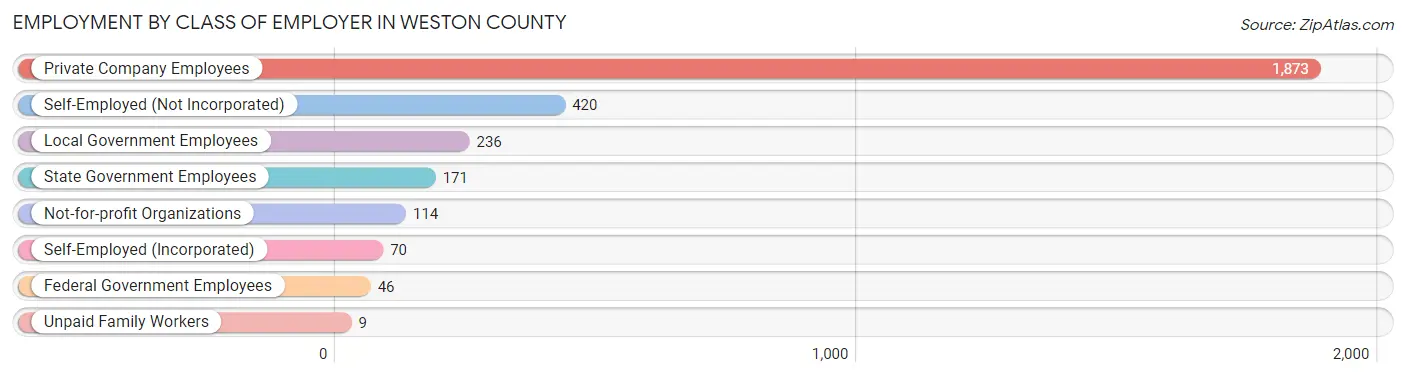
Employment by Class of Employer in Weston County
Among the 2,939 employed individuals in Weston County, private company employees (1,873 | 63.7%), self-employed (not incorporated) (420 | 14.3%), and local government employees (236 | 8.0%) make up the most common classes of employment.
| Employer Class | # Employees | % Employees |
| Private Company Employees | 1,873 | 63.7% |
| Self-Employed (Incorporated) | 70 | 2.4% |
| Self-Employed (Not Incorporated) | 420 | 14.3% |
| Not-for-profit Organizations | 114 | 3.9% |
| Local Government Employees | 236 | 8.0% |
| State Government Employees | 171 | 5.8% |
| Federal Government Employees | 46 | 1.6% |
| Unpaid Family Workers | 9 | 0.3% |
| Total | 2,939 | 100.0% |
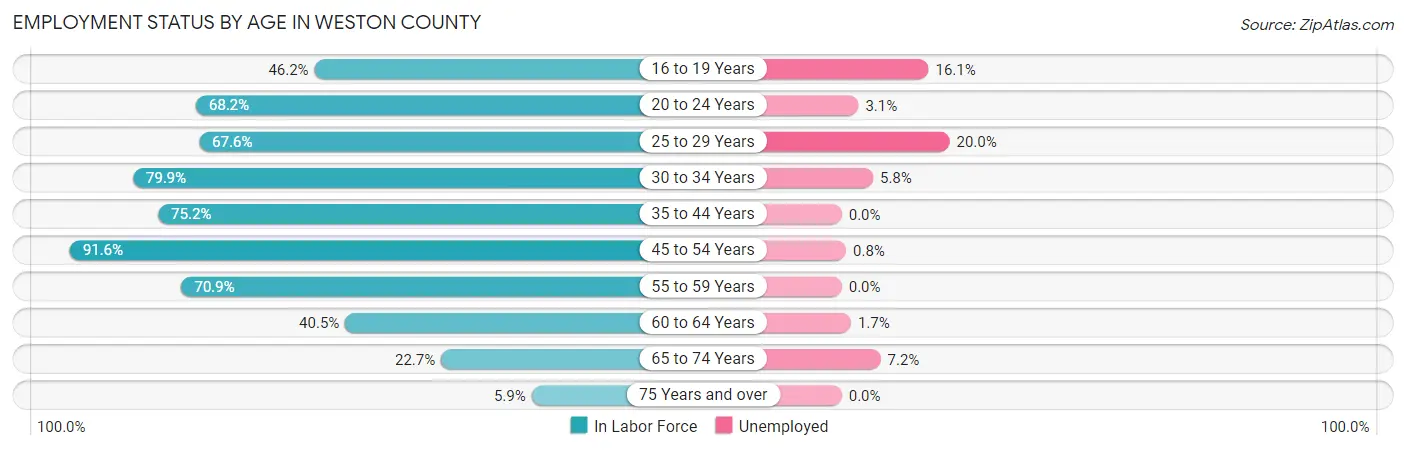
Employment Status by Age in Weston County
According to the labor force statistics for Weston County, out of the total population over 16 years of age (5,705), 55.4% or 3,161 individuals are in the labor force, with 3.6% or 114 of them unemployed. The age group with the highest labor force participation rate is 45 to 54 years, with 91.6% or 711 individuals in the labor force. Within the labor force, the 25 to 29 years age range has the highest percentage of unemployed individuals, with 20.0% or 30 of them being unemployed.
| Age Bracket | In Labor Force | Unemployed |
| 16 to 19 Years | 199 (46.2%) | 32 (16.1%) |
| 20 to 24 Years | 255 (68.2%) | 8 (3.1%) |
| 25 to 29 Years | 150 (67.6%) | 30 (20.0%) |
| 30 to 34 Years | 311 (79.9%) | 18 (5.8%) |
| 35 to 44 Years | 750 (75.2%) | 0 (0.0%) |
| 45 to 54 Years | 711 (91.6%) | 6 (0.8%) |
| 55 to 59 Years | 268 (70.9%) | 0 (0.0%) |
| 60 to 64 Years | 286 (40.5%) | 5 (1.7%) |
| 65 to 74 Years | 195 (22.7%) | 14 (7.2%) |
| 75 Years and over | 34 (5.9%) | 0 (0.0%) |
| Total | 3,161 (55.4%) | 114 (3.6%) |
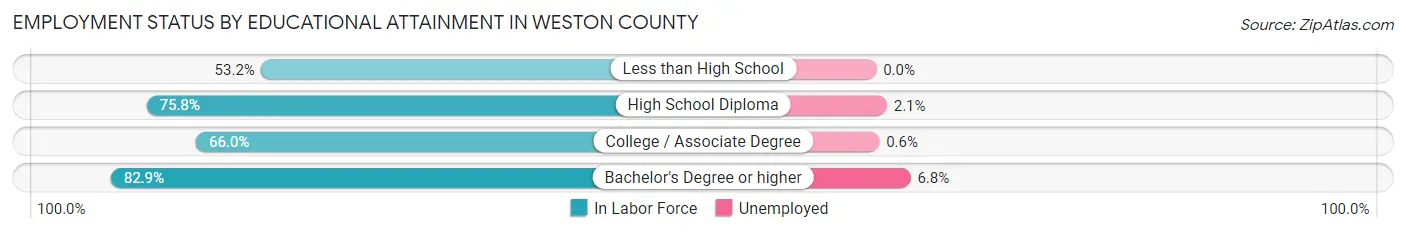
Employment Status by Educational Attainment in Weston County
According to labor force statistics for Weston County, 71.4% of individuals (2,478) out of the total population between 25 and 64 years of age (3,470) are in the labor force, with 2.4% or 59 of them being unemployed. The group with the highest labor force participation rate are those with the educational attainment of bachelor's degree or higher, with 82.9% or 499 individuals in the labor force. Within the labor force, individuals with bachelor's degree or higher education have the highest percentage of unemployment, with 6.8% or 34 of them being unemployed.
| Educational Attainment | In Labor Force | Unemployed |
| Less than High School | 165 (53.2%) | 0 (0.0%) |
| High School Diploma | 958 (75.8%) | 27 (2.1%) |
| College / Associate Degree | 854 (66.0%) | 8 (0.6%) |
| Bachelor's Degree or higher | 499 (82.9%) | 41 (6.8%) |
| Total | 2,478 (71.4%) | 83 (2.4%) |
Employment Occupations by Sex in Weston County
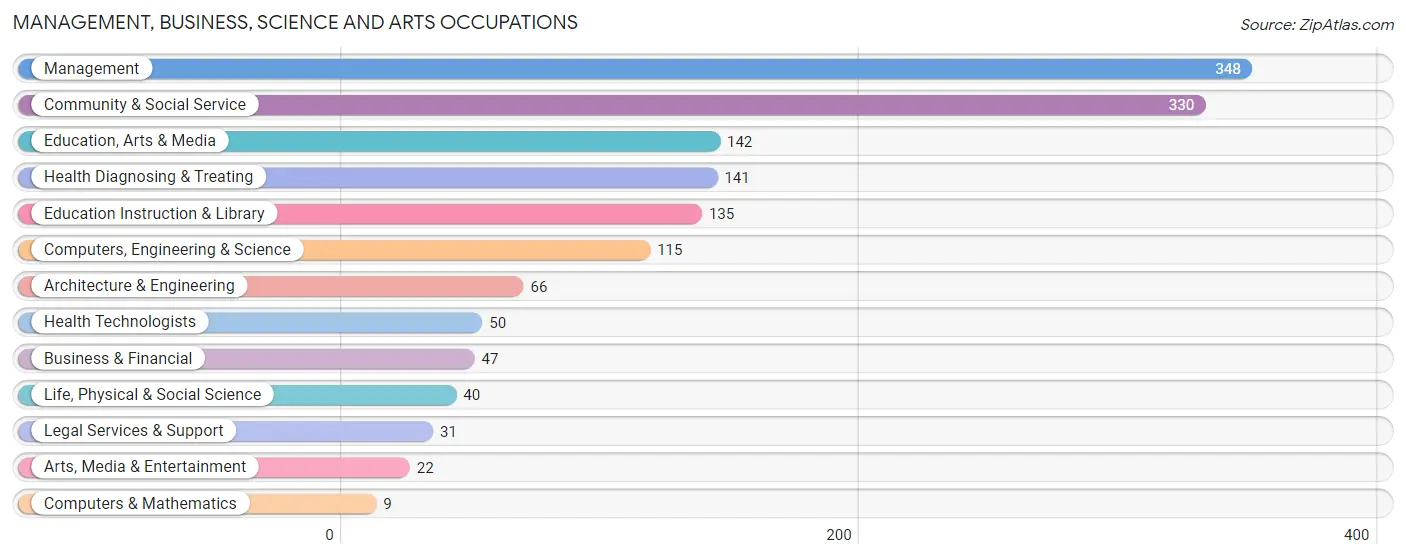
Management, Business, Science and Arts Occupations
The most common Management, Business, Science and Arts occupations in Weston County are Management (348 | 11.5%), Community & Social Service (330 | 10.9%), Education, Arts & Media (142 | 4.7%), Health Diagnosing & Treating (141 | 4.6%), and Education Instruction & Library (135 | 4.4%).
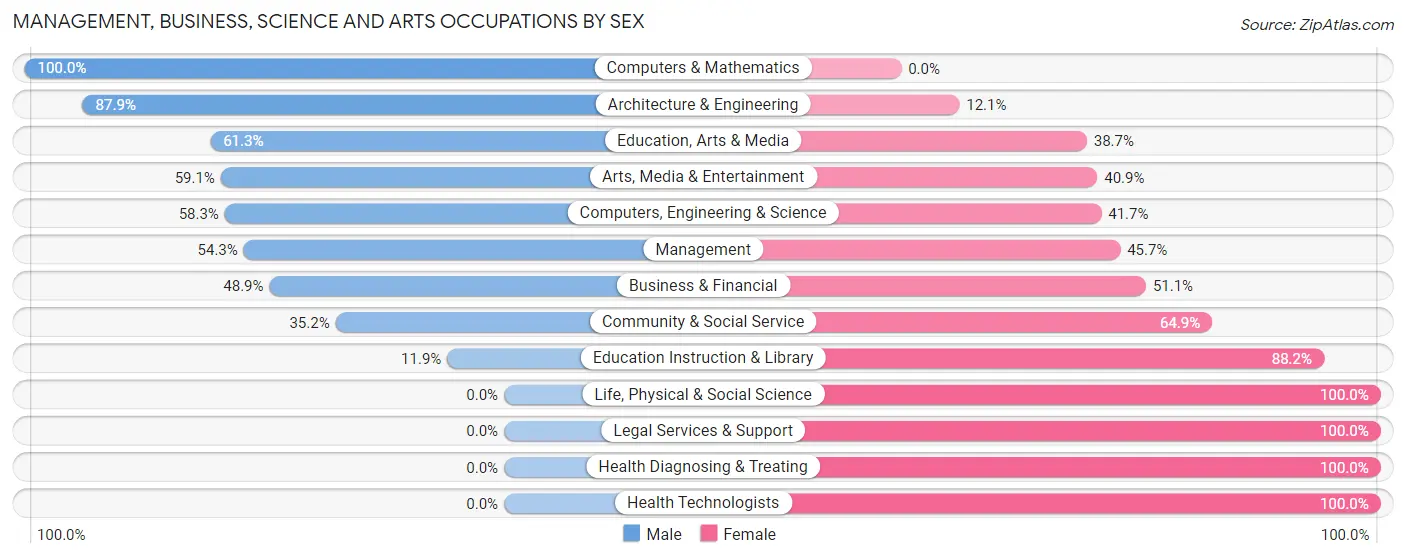
Management, Business, Science and Arts Occupations by Sex
Within the Management, Business, Science and Arts occupations in Weston County, the most male-oriented occupations are Computers & Mathematics (100.0%), Architecture & Engineering (87.9%), and Education, Arts & Media (61.3%), while the most female-oriented occupations are Life, Physical & Social Science (100.0%), Legal Services & Support (100.0%), and Health Diagnosing & Treating (100.0%).
| Occupation | Male | Female |
| Management | 189 (54.3%) | 159 (45.7%) |
| Business & Financial | 23 (48.9%) | 24 (51.1%) |
| Computers, Engineering & Science | 67 (58.3%) | 48 (41.7%) |
| Computers & Mathematics | 9 (100.0%) | 0 (0.0%) |
| Architecture & Engineering | 58 (87.9%) | 8 (12.1%) |
| Life, Physical & Social Science | 0 (0.0%) | 40 (100.0%) |
| Community & Social Service | 116 (35.1%) | 214 (64.8%) |
| Education, Arts & Media | 87 (61.3%) | 55 (38.7%) |
| Legal Services & Support | 0 (0.0%) | 31 (100.0%) |
| Education Instruction & Library | 16 (11.8%) | 119 (88.1%) |
| Arts, Media & Entertainment | 13 (59.1%) | 9 (40.9%) |
| Health Diagnosing & Treating | 0 (0.0%) | 141 (100.0%) |
| Health Technologists | 0 (0.0%) | 50 (100.0%) |
| Total (Category) | 395 (40.3%) | 586 (59.7%) |
| Total (Overall) | 1,786 (58.9%) | 1,249 (41.1%) |
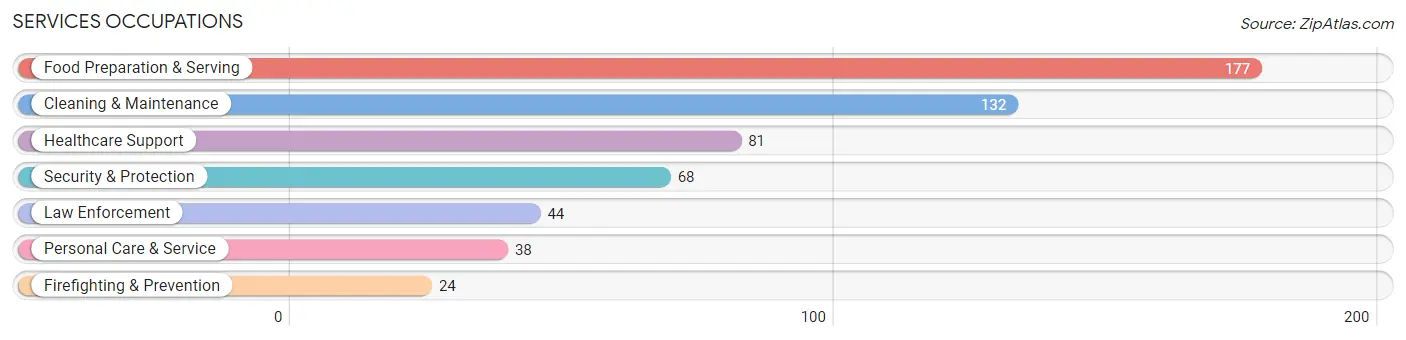
Services Occupations
The most common Services occupations in Weston County are Food Preparation & Serving (177 | 5.8%), Cleaning & Maintenance (132 | 4.3%), Healthcare Support (81 | 2.7%), Security & Protection (68 | 2.2%), and Law Enforcement (44 | 1.5%).
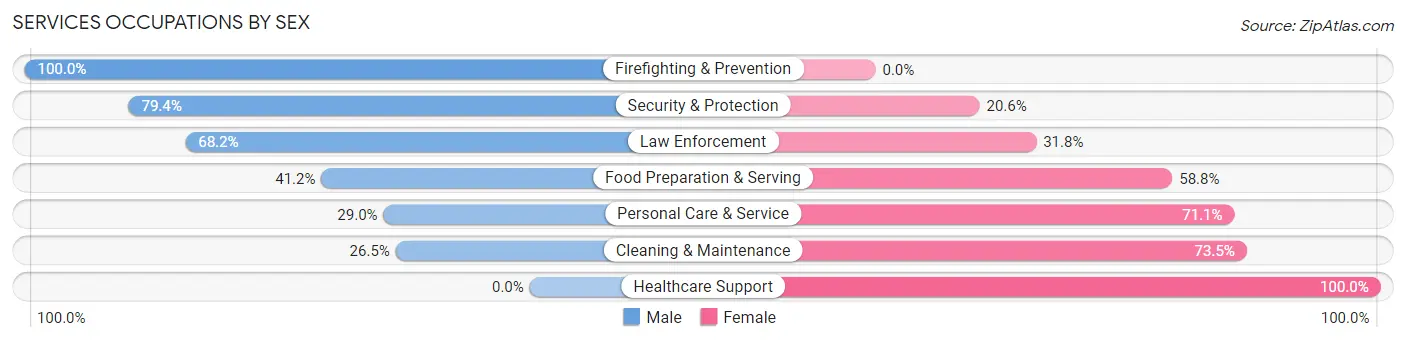
Services Occupations by Sex
Within the Services occupations in Weston County, the most male-oriented occupations are Firefighting & Prevention (100.0%), Security & Protection (79.4%), and Law Enforcement (68.2%), while the most female-oriented occupations are Healthcare Support (100.0%), Cleaning & Maintenance (73.5%), and Personal Care & Service (71.1%).
| Occupation | Male | Female |
| Healthcare Support | 0 (0.0%) | 81 (100.0%) |
| Security & Protection | 54 (79.4%) | 14 (20.6%) |
| Firefighting & Prevention | 24 (100.0%) | 0 (0.0%) |
| Law Enforcement | 30 (68.2%) | 14 (31.8%) |
| Food Preparation & Serving | 73 (41.2%) | 104 (58.8%) |
| Cleaning & Maintenance | 35 (26.5%) | 97 (73.5%) |
| Personal Care & Service | 11 (28.9%) | 27 (71.1%) |
| Total (Category) | 173 (34.9%) | 323 (65.1%) |
| Total (Overall) | 1,786 (58.9%) | 1,249 (41.1%) |
Sales and Office Occupations
The most common Sales and Office occupations in Weston County are Office & Administration (230 | 7.6%), and Sales & Related (96 | 3.2%).

Sales and Office Occupations by Sex

| Occupation | Male | Female |
| Sales & Related | 63 (65.6%) | 33 (34.4%) |
| Office & Administration | 24 (10.4%) | 206 (89.6%) |
| Total (Category) | 87 (26.7%) | 239 (73.3%) |
| Total (Overall) | 1,786 (58.9%) | 1,249 (41.1%) |
Natural Resources, Construction and Maintenance Occupations
The most common Natural Resources, Construction and Maintenance occupations in Weston County are Construction & Extraction (309 | 10.2%), Installation, Maintenance & Repair (294 | 9.7%), and Farming, Fishing & Forestry (16 | 0.5%).
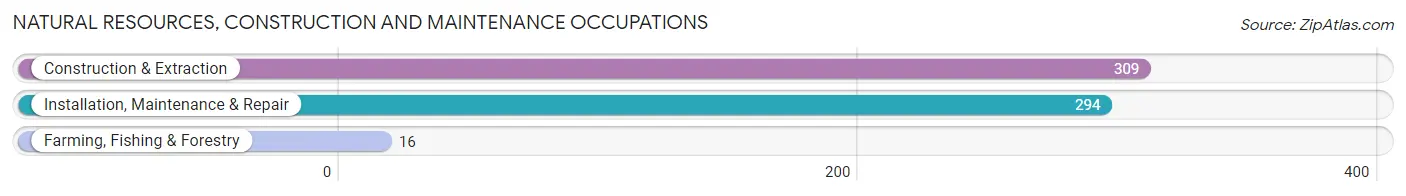
Natural Resources, Construction and Maintenance Occupations by Sex
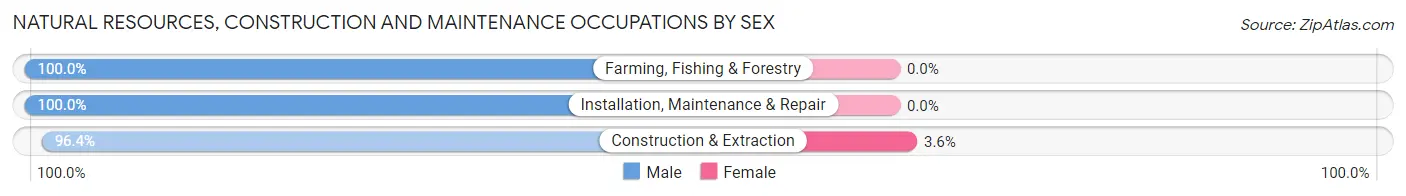
| Occupation | Male | Female |
| Farming, Fishing & Forestry | 16 (100.0%) | 0 (0.0%) |
| Construction & Extraction | 298 (96.4%) | 11 (3.6%) |
| Installation, Maintenance & Repair | 294 (100.0%) | 0 (0.0%) |
| Total (Category) | 608 (98.2%) | 11 (1.8%) |
| Total (Overall) | 1,786 (58.9%) | 1,249 (41.1%) |
Production, Transportation and Moving Occupations
The most common Production, Transportation and Moving occupations in Weston County are Production (300 | 9.9%), Transportation (176 | 5.8%), and Material Moving (137 | 4.5%).
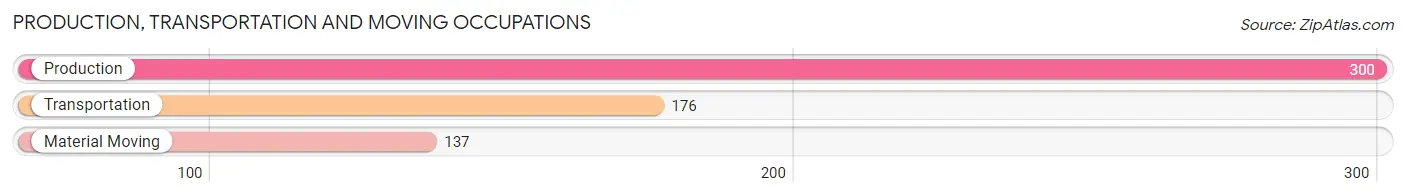
Production, Transportation and Moving Occupations by Sex

| Occupation | Male | Female |
| Production | 273 (91.0%) | 27 (9.0%) |
| Transportation | 176 (100.0%) | 0 (0.0%) |
| Material Moving | 74 (54.0%) | 63 (46.0%) |
| Total (Category) | 523 (85.3%) | 90 (14.7%) |
| Total (Overall) | 1,786 (58.9%) | 1,249 (41.1%) |
Employment Industries by Sex in Weston County
Employment Industries in Weston County
The major employment industries in Weston County include Mining, Quarrying, & Extraction (600 | 19.8%), Health Care & Social Assistance (321 | 10.6%), Retail Trade (214 | 7.0%), Construction (209 | 6.9%), and Public Administration (196 | 6.5%).
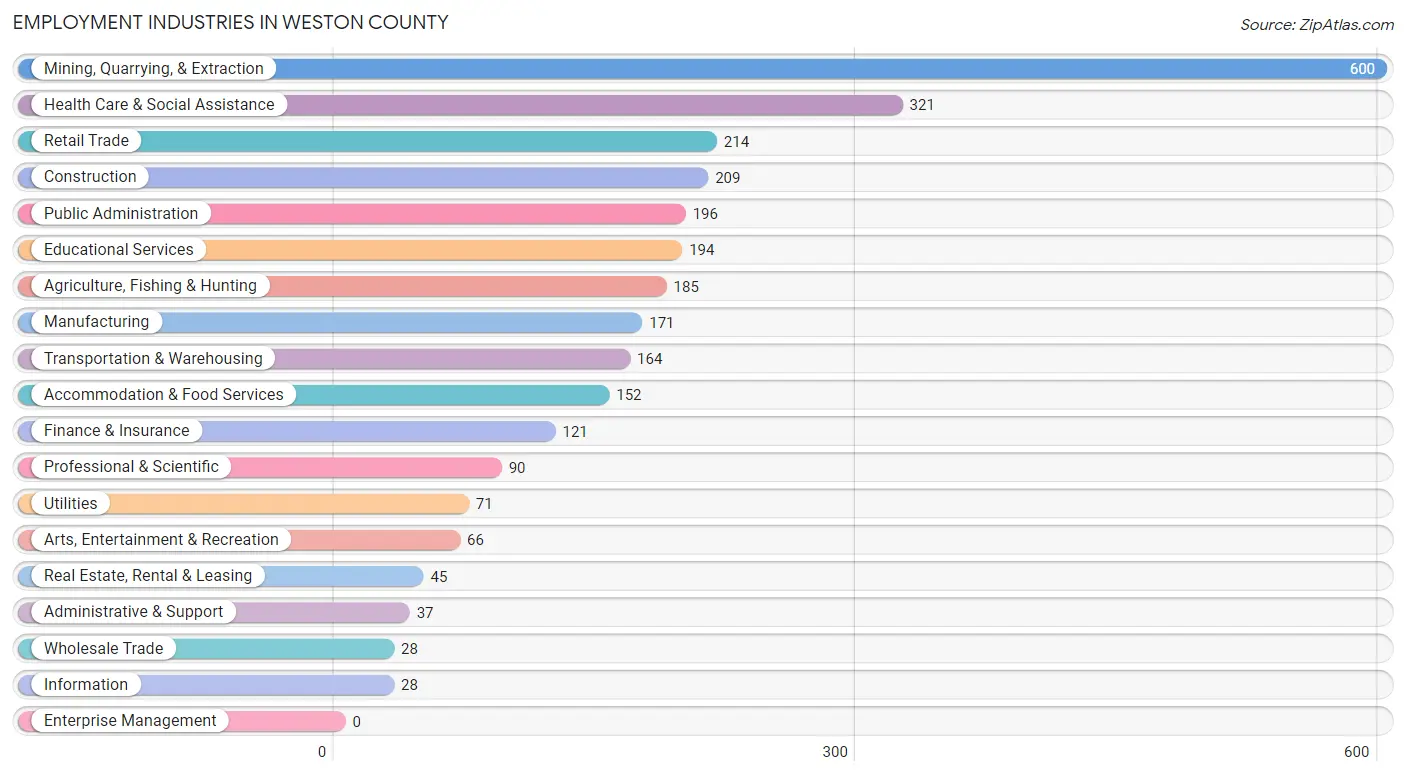
Employment Industries by Sex in Weston County
The Weston County industries that see more men than women are Agriculture, Fishing & Hunting (96.2%), Construction (96.2%), and Transportation & Warehousing (95.1%), whereas the industries that tend to have a higher number of women are Finance & Insurance (100.0%), Real Estate, Rental & Leasing (100.0%), and Administrative & Support (100.0%).
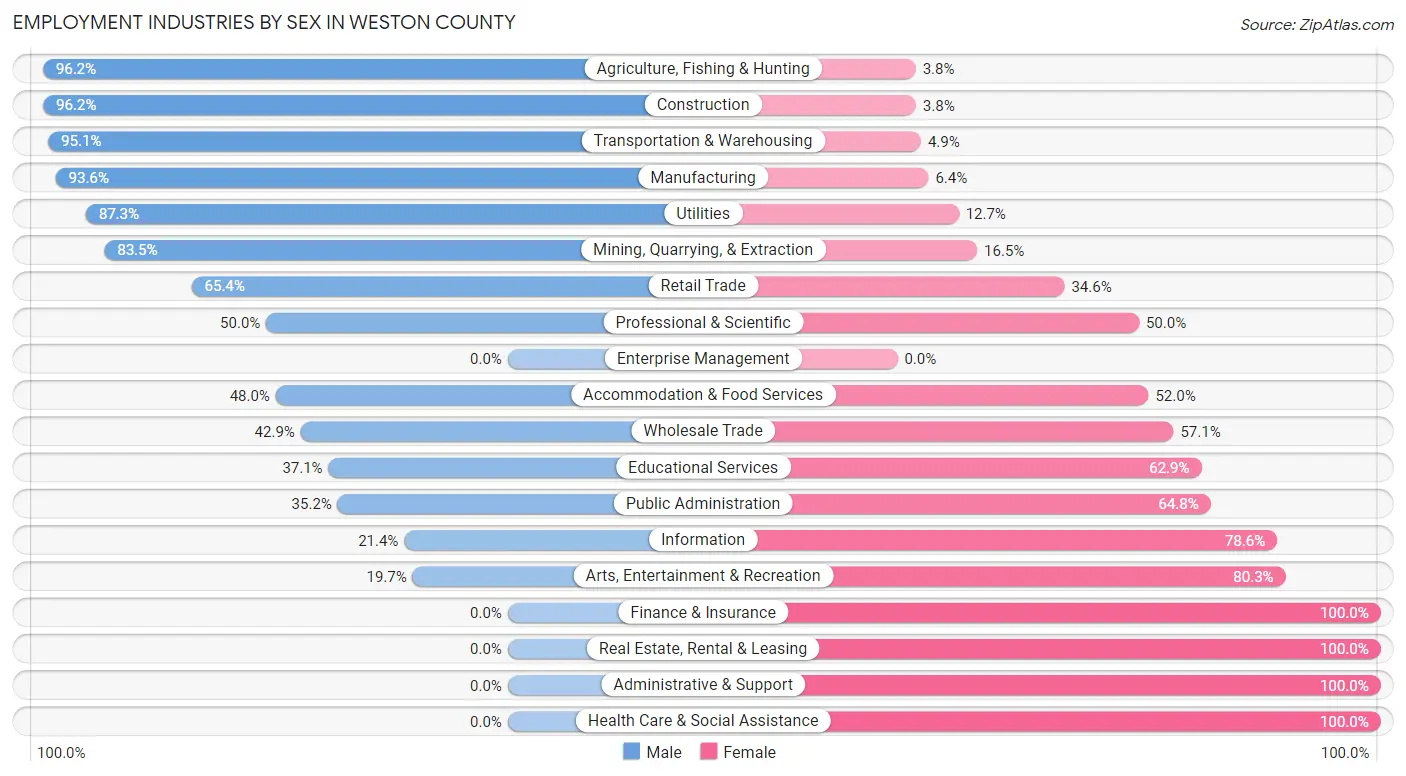
| Industry | Male | Female |
| Agriculture, Fishing & Hunting | 178 (96.2%) | 7 (3.8%) |
| Mining, Quarrying, & Extraction | 501 (83.5%) | 99 (16.5%) |
| Construction | 201 (96.2%) | 8 (3.8%) |
| Manufacturing | 160 (93.6%) | 11 (6.4%) |
| Wholesale Trade | 12 (42.9%) | 16 (57.1%) |
| Retail Trade | 140 (65.4%) | 74 (34.6%) |
| Transportation & Warehousing | 156 (95.1%) | 8 (4.9%) |
| Utilities | 62 (87.3%) | 9 (12.7%) |
| Information | 6 (21.4%) | 22 (78.6%) |
| Finance & Insurance | 0 (0.0%) | 121 (100.0%) |
| Real Estate, Rental & Leasing | 0 (0.0%) | 45 (100.0%) |
| Professional & Scientific | 45 (50.0%) | 45 (50.0%) |
| Enterprise Management | 0 (0.0%) | 0 (0.0%) |
| Administrative & Support | 0 (0.0%) | 37 (100.0%) |
| Educational Services | 72 (37.1%) | 122 (62.9%) |
| Health Care & Social Assistance | 0 (0.0%) | 321 (100.0%) |
| Arts, Entertainment & Recreation | 13 (19.7%) | 53 (80.3%) |
| Accommodation & Food Services | 73 (48.0%) | 79 (52.0%) |
| Public Administration | 69 (35.2%) | 127 (64.8%) |
| Total | 1,786 (58.9%) | 1,249 (41.1%) |
Education in Weston County
School Enrollment in Weston County
The most common levels of schooling among the 1,449 students in Weston County are high school (539 | 37.2%), elementary school (287 | 19.8%), and middle school (228 | 15.7%).
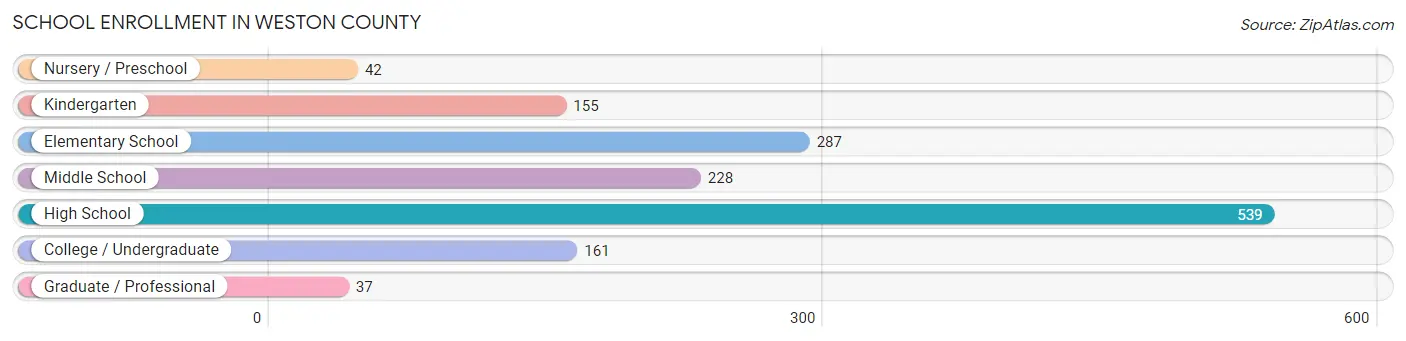
| School Level | # Students | % Students |
| Nursery / Preschool | 42 | 2.9% |
| Kindergarten | 155 | 10.7% |
| Elementary School | 287 | 19.8% |
| Middle School | 228 | 15.7% |
| High School | 539 | 37.2% |
| College / Undergraduate | 161 | 11.1% |
| Graduate / Professional | 37 | 2.5% |
| Total | 1,449 | 100.0% |
School Enrollment by Age by Funding Source in Weston County
Out of a total of 1,449 students who are enrolled in schools in Weston County, 77 (5.3%) attend a private institution, while the remaining 1,372 (94.7%) are enrolled in public schools. The age group of 20 to 24 year olds has the highest likelihood of being enrolled in private schools, with 19 (63.3% in the age bracket) enrolled. Conversely, the age group of 3 to 4 year olds has the lowest likelihood of being enrolled in a private school, with 9 (100.0% in the age bracket) attending a public institution.
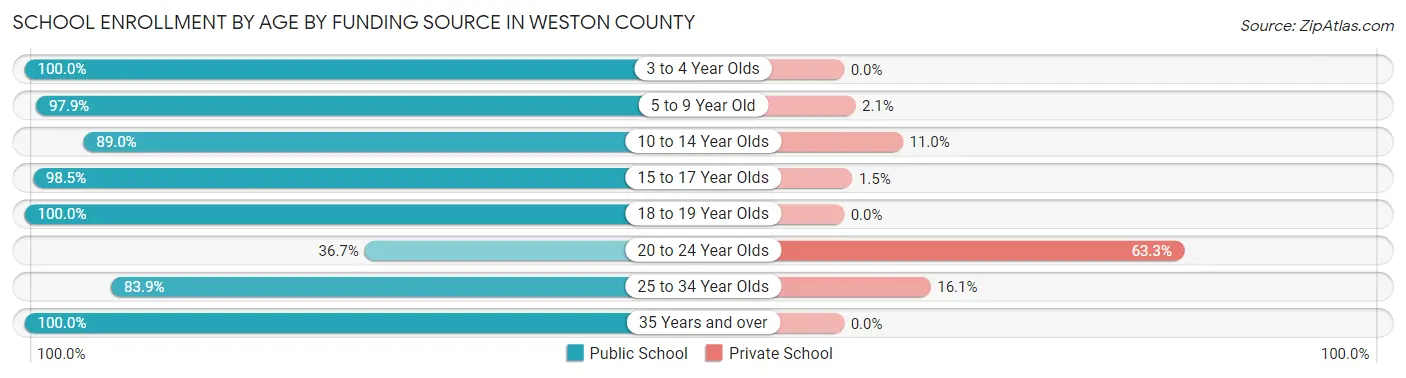
| Age Bracket | Public School | Private School |
| 3 to 4 Year Olds | 9 (100.0%) | 0 (0.0%) |
| 5 to 9 Year Old | 416 (97.9%) | 9 (2.1%) |
| 10 to 14 Year Olds | 268 (89.0%) | 33 (11.0%) |
| 15 to 17 Year Olds | 383 (98.5%) | 6 (1.5%) |
| 18 to 19 Year Olds | 145 (100.0%) | 0 (0.0%) |
| 20 to 24 Year Olds | 11 (36.7%) | 19 (63.3%) |
| 25 to 34 Year Olds | 52 (83.9%) | 10 (16.1%) |
| 35 Years and over | 88 (100.0%) | 0 (0.0%) |
| Total | 1,372 (94.7%) | 77 (5.3%) |
Educational Attainment by Field of Study in Weston County
Education (237 | 24.7%), business (132 | 13.8%), liberal arts & history (93 | 9.7%), science & technology (91 | 9.5%), and communications (77 | 8.0%) are the most common fields of study among 959 individuals in Weston County who have obtained a bachelor's degree or higher.
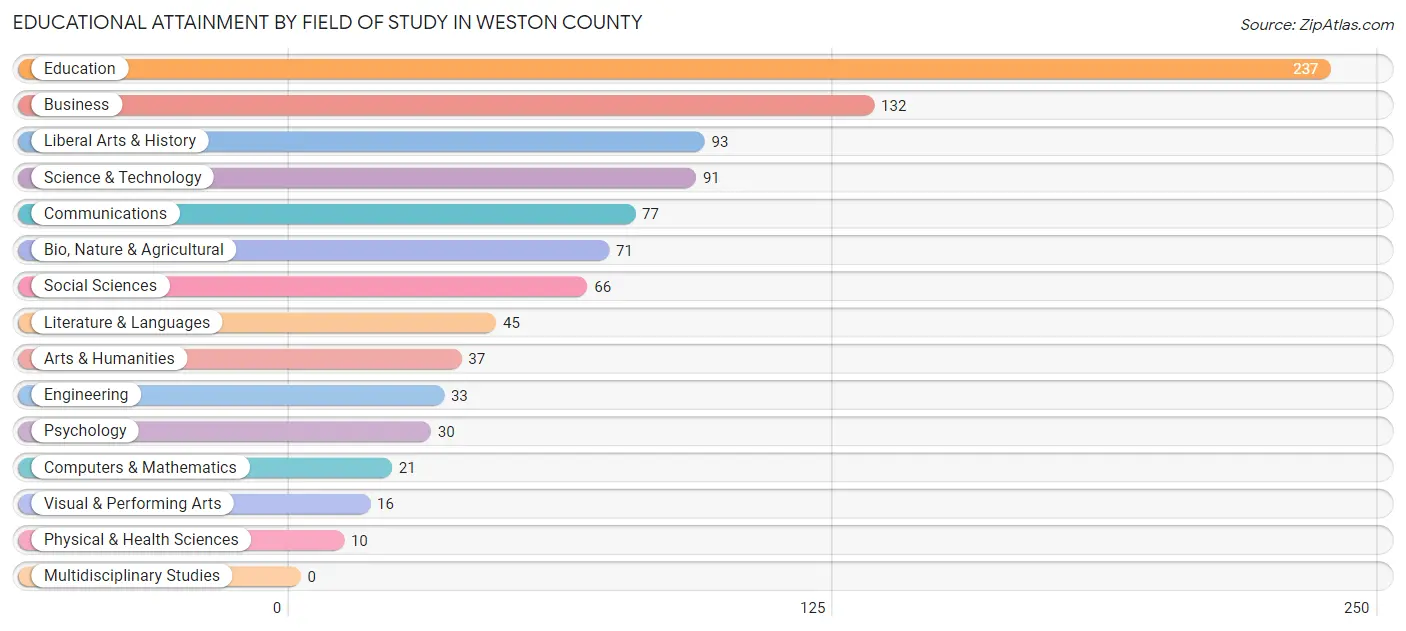
| Field of Study | # Graduates | % Graduates |
| Computers & Mathematics | 21 | 2.2% |
| Bio, Nature & Agricultural | 71 | 7.4% |
| Physical & Health Sciences | 10 | 1.0% |
| Psychology | 30 | 3.1% |
| Social Sciences | 66 | 6.9% |
| Engineering | 33 | 3.4% |
| Multidisciplinary Studies | 0 | 0.0% |
| Science & Technology | 91 | 9.5% |
| Business | 132 | 13.8% |
| Education | 237 | 24.7% |
| Literature & Languages | 45 | 4.7% |
| Liberal Arts & History | 93 | 9.7% |
| Visual & Performing Arts | 16 | 1.7% |
| Communications | 77 | 8.0% |
| Arts & Humanities | 37 | 3.9% |
| Total | 959 | 100.0% |
Transportation & Commute in Weston County
Vehicle Availability by Sex in Weston County
The most prevalent vehicle ownership categories in Weston County are males with 2 vehicles (652, accounting for 37.3%) and females with 2 vehicles (503, making up 54.7%).
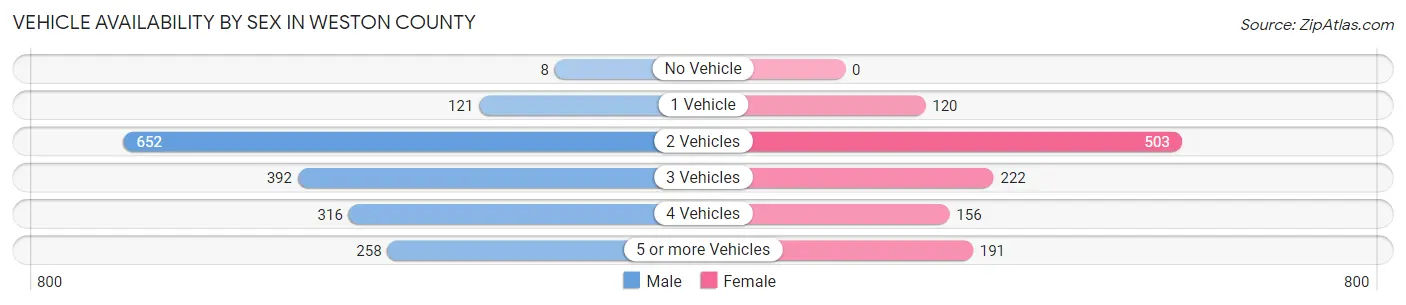
| Vehicles Available | Male | Female |
| No Vehicle | 8 (0.5%) | 0 (0.0%) |
| 1 Vehicle | 121 (6.9%) | 120 (10.1%) |
| 2 Vehicles | 652 (37.3%) | 503 (42.2%) |
| 3 Vehicles | 392 (22.4%) | 222 (18.6%) |
| 4 Vehicles | 316 (18.1%) | 156 (13.1%) |
| 5 or more Vehicles | 258 (14.8%) | 191 (16.0%) |
| Total | 1,747 (100.0%) | 1,192 (100.0%) |
Commute Time in Weston County
The most frequently occuring commute durations in Weston County are 5 to 9 minutes (685 commuters, 24.7%), less than 5 minutes (497 commuters, 17.9%), and 60 to 89 minutes (436 commuters, 15.7%).
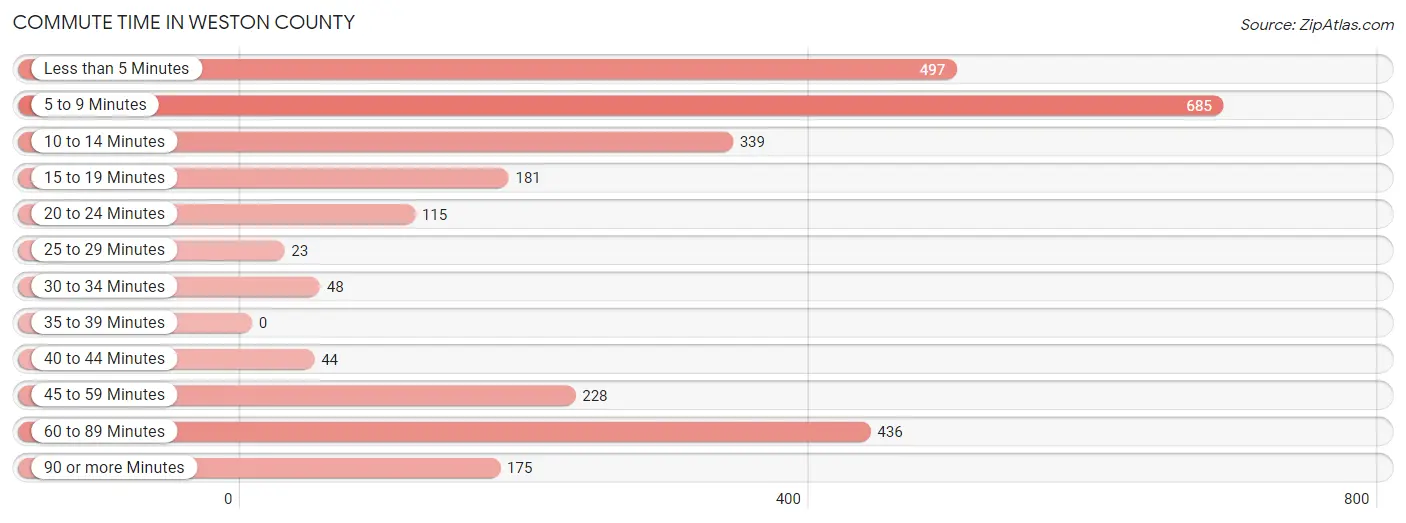
| Commute Time | # Commuters | % Commuters |
| Less than 5 Minutes | 497 | 17.9% |
| 5 to 9 Minutes | 685 | 24.7% |
| 10 to 14 Minutes | 339 | 12.2% |
| 15 to 19 Minutes | 181 | 6.5% |
| 20 to 24 Minutes | 115 | 4.2% |
| 25 to 29 Minutes | 23 | 0.8% |
| 30 to 34 Minutes | 48 | 1.7% |
| 35 to 39 Minutes | 0 | 0.0% |
| 40 to 44 Minutes | 44 | 1.6% |
| 45 to 59 Minutes | 228 | 8.2% |
| 60 to 89 Minutes | 436 | 15.7% |
| 90 or more Minutes | 175 | 6.3% |
Commute Time by Sex in Weston County
The most common commute times in Weston County are 5 to 9 minutes (402 commuters, 24.6%) for males and 5 to 9 minutes (283 commuters, 24.9%) for females.
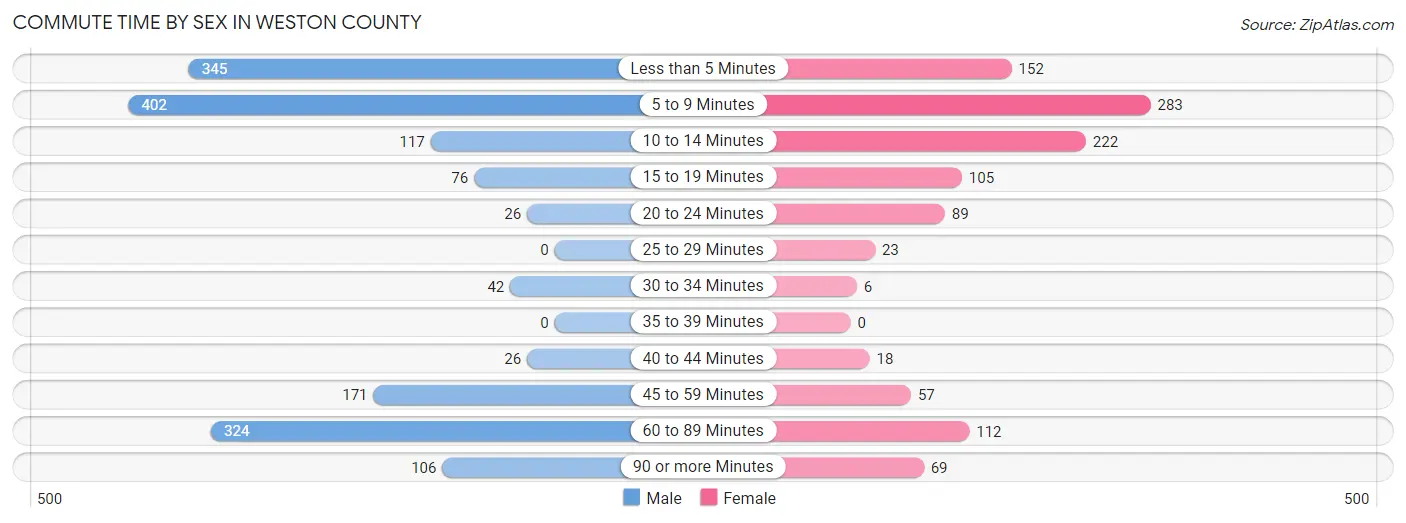
| Commute Time | Male | Female |
| Less than 5 Minutes | 345 (21.1%) | 152 (13.4%) |
| 5 to 9 Minutes | 402 (24.6%) | 283 (24.9%) |
| 10 to 14 Minutes | 117 (7.2%) | 222 (19.5%) |
| 15 to 19 Minutes | 76 (4.6%) | 105 (9.2%) |
| 20 to 24 Minutes | 26 (1.6%) | 89 (7.8%) |
| 25 to 29 Minutes | 0 (0.0%) | 23 (2.0%) |
| 30 to 34 Minutes | 42 (2.6%) | 6 (0.5%) |
| 35 to 39 Minutes | 0 (0.0%) | 0 (0.0%) |
| 40 to 44 Minutes | 26 (1.6%) | 18 (1.6%) |
| 45 to 59 Minutes | 171 (10.5%) | 57 (5.0%) |
| 60 to 89 Minutes | 324 (19.8%) | 112 (9.9%) |
| 90 or more Minutes | 106 (6.5%) | 69 (6.1%) |
Time of Departure to Work by Sex in Weston County
The most frequent times of departure to work in Weston County are 5:00 AM to 5:29 AM (382, 23.4%) for males and 7:00 AM to 7:29 AM (213, 18.8%) for females.
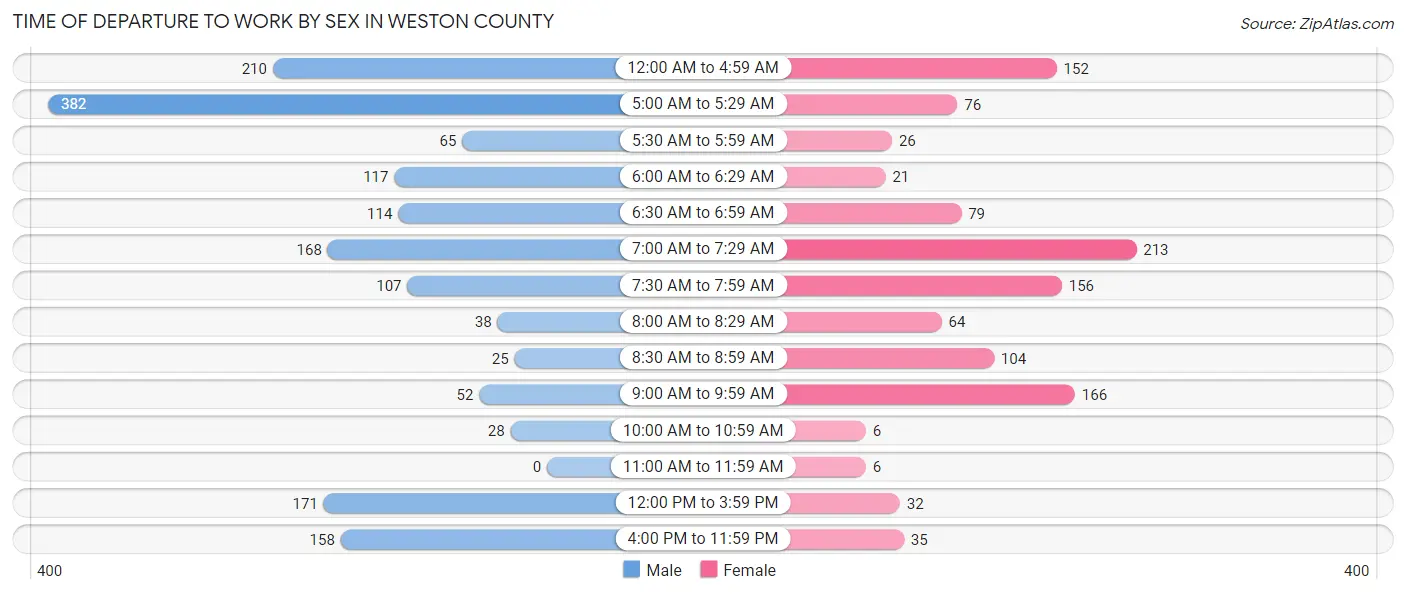
| Time of Departure | Male | Female |
| 12:00 AM to 4:59 AM | 210 (12.8%) | 152 (13.4%) |
| 5:00 AM to 5:29 AM | 382 (23.4%) | 76 (6.7%) |
| 5:30 AM to 5:59 AM | 65 (4.0%) | 26 (2.3%) |
| 6:00 AM to 6:29 AM | 117 (7.2%) | 21 (1.8%) |
| 6:30 AM to 6:59 AM | 114 (7.0%) | 79 (7.0%) |
| 7:00 AM to 7:29 AM | 168 (10.3%) | 213 (18.8%) |
| 7:30 AM to 7:59 AM | 107 (6.5%) | 156 (13.7%) |
| 8:00 AM to 8:29 AM | 38 (2.3%) | 64 (5.6%) |
| 8:30 AM to 8:59 AM | 25 (1.5%) | 104 (9.1%) |
| 9:00 AM to 9:59 AM | 52 (3.2%) | 166 (14.6%) |
| 10:00 AM to 10:59 AM | 28 (1.7%) | 6 (0.5%) |
| 11:00 AM to 11:59 AM | 0 (0.0%) | 6 (0.5%) |
| 12:00 PM to 3:59 PM | 171 (10.5%) | 32 (2.8%) |
| 4:00 PM to 11:59 PM | 158 (9.7%) | 35 (3.1%) |
| Total | 1,635 (100.0%) | 1,136 (100.0%) |
Housing Occupancy in Weston County
Occupancy by Ownership in Weston County
Of the total 2,638 dwellings in Weston County, owner-occupied units account for 2,375 (90.0%), while renter-occupied units make up 263 (10.0%).
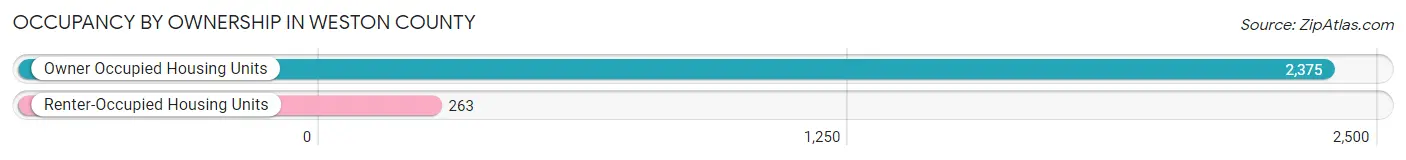
| Occupancy | # Housing Units | % Housing Units |
| Owner Occupied Housing Units | 2,375 | 90.0% |
| Renter-Occupied Housing Units | 263 | 10.0% |
| Total Occupied Housing Units | 2,638 | 100.0% |
Occupancy by Household Size in Weston County
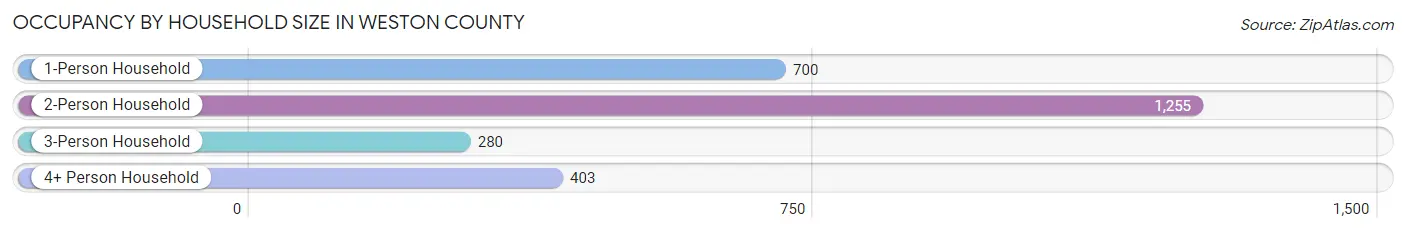
| Household Size | # Housing Units | % Housing Units |
| 1-Person Household | 700 | 26.5% |
| 2-Person Household | 1,255 | 47.6% |
| 3-Person Household | 280 | 10.6% |
| 4+ Person Household | 403 | 15.3% |
| Total Housing Units | 2,638 | 100.0% |
Occupancy by Ownership by Household Size in Weston County
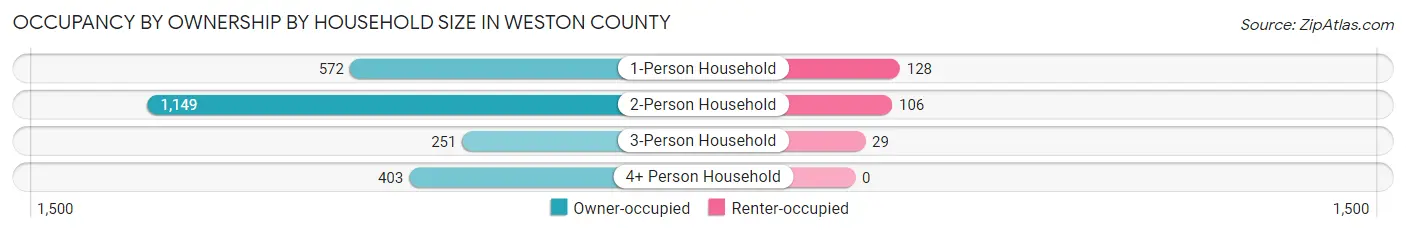
| Household Size | Owner-occupied | Renter-occupied |
| 1-Person Household | 572 (81.7%) | 128 (18.3%) |
| 2-Person Household | 1,149 (91.5%) | 106 (8.5%) |
| 3-Person Household | 251 (89.6%) | 29 (10.4%) |
| 4+ Person Household | 403 (100.0%) | 0 (0.0%) |
| Total Housing Units | 2,375 (90.0%) | 263 (10.0%) |
Occupancy by Educational Attainment in Weston County
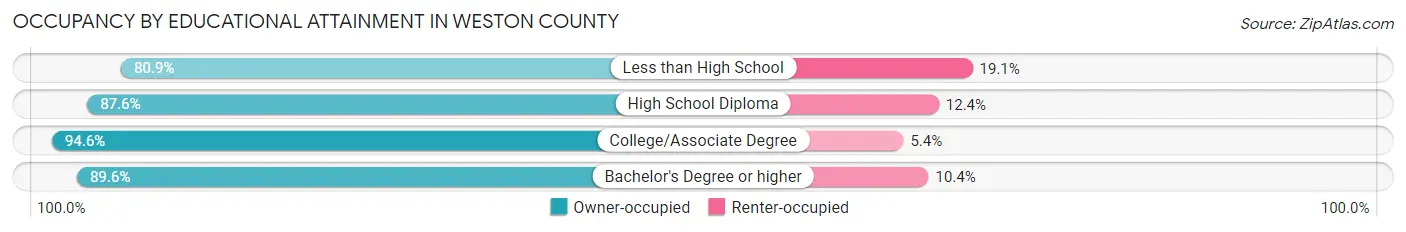
| Household Size | Owner-occupied | Renter-occupied |
| Less than High School | 220 (80.9%) | 52 (19.1%) |
| High School Diploma | 669 (87.6%) | 95 (12.4%) |
| College/Associate Degree | 960 (94.6%) | 55 (5.4%) |
| Bachelor's Degree or higher | 526 (89.6%) | 61 (10.4%) |
Occupancy by Age of Householder in Weston County
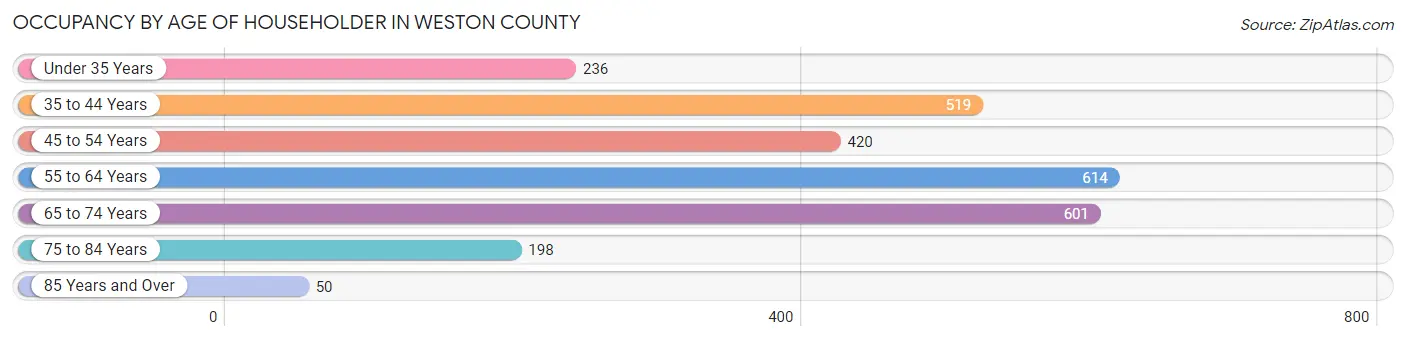
| Age Bracket | # Households | % Households |
| Under 35 Years | 236 | 8.9% |
| 35 to 44 Years | 519 | 19.7% |
| 45 to 54 Years | 420 | 15.9% |
| 55 to 64 Years | 614 | 23.3% |
| 65 to 74 Years | 601 | 22.8% |
| 75 to 84 Years | 198 | 7.5% |
| 85 Years and Over | 50 | 1.9% |
| Total | 2,638 | 100.0% |
Housing Finances in Weston County
Median Income by Occupancy in Weston County
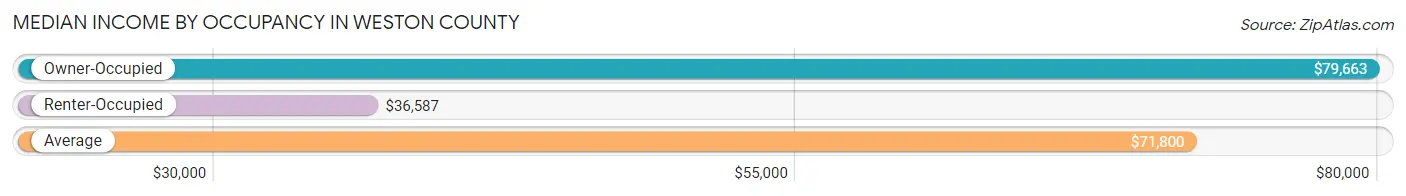
| Occupancy Type | # Households | Median Income |
| Owner-Occupied | 2,375 (90.0%) | $79,663 |
| Renter-Occupied | 263 (10.0%) | $36,587 |
| Average | 2,638 (100.0%) | $71,800 |
Occupancy by Householder Income Bracket in Weston County
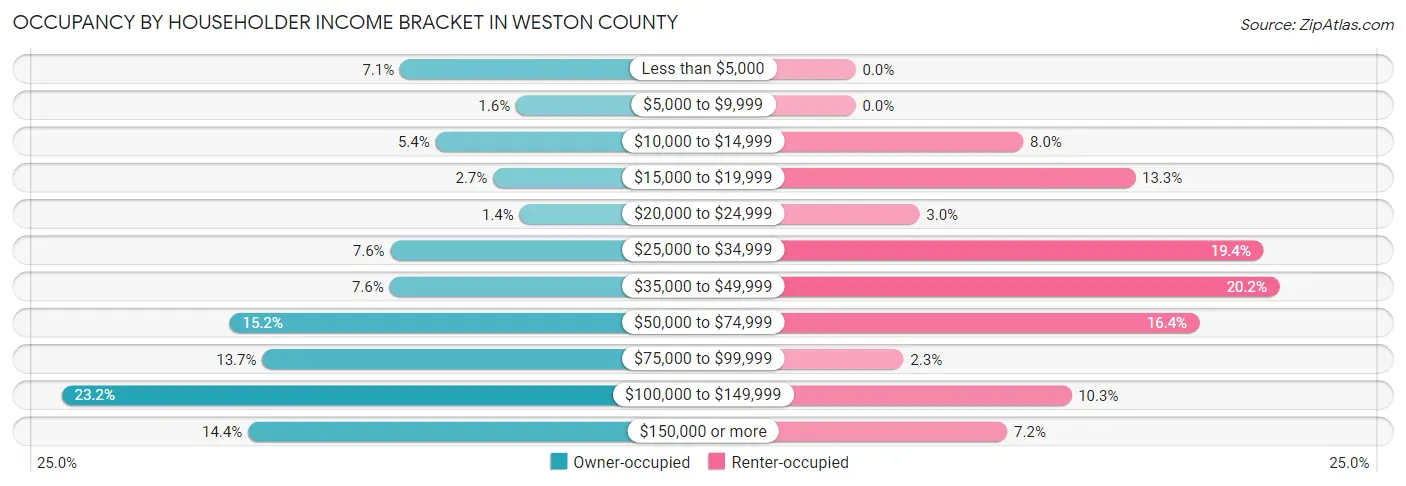
| Income Bracket | Owner-occupied | Renter-occupied |
| Less than $5,000 | 169 (7.1%) | 0 (0.0%) |
| $5,000 to $9,999 | 38 (1.6%) | 0 (0.0%) |
| $10,000 to $14,999 | 129 (5.4%) | 21 (8.0%) |
| $15,000 to $19,999 | 64 (2.7%) | 35 (13.3%) |
| $20,000 to $24,999 | 34 (1.4%) | 8 (3.0%) |
| $25,000 to $34,999 | 180 (7.6%) | 51 (19.4%) |
| $35,000 to $49,999 | 181 (7.6%) | 53 (20.2%) |
| $50,000 to $74,999 | 362 (15.2%) | 43 (16.4%) |
| $75,000 to $99,999 | 325 (13.7%) | 6 (2.3%) |
| $100,000 to $149,999 | 552 (23.2%) | 27 (10.3%) |
| $150,000 or more | 341 (14.4%) | 19 (7.2%) |
| Total | 2,375 (100.0%) | 263 (100.0%) |
Monthly Housing Cost Tiers in Weston County
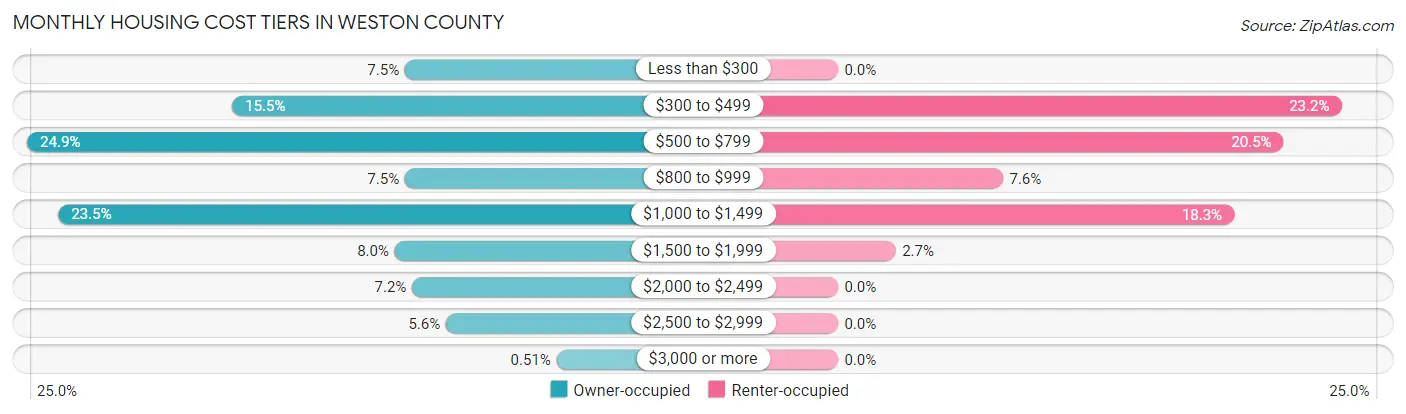
| Monthly Cost | Owner-occupied | Renter-occupied |
| Less than $300 | 178 (7.5%) | 0 (0.0%) |
| $300 to $499 | 367 (15.4%) | 61 (23.2%) |
| $500 to $799 | 591 (24.9%) | 54 (20.5%) |
| $800 to $999 | 178 (7.5%) | 20 (7.6%) |
| $1,000 to $1,499 | 557 (23.4%) | 48 (18.2%) |
| $1,500 to $1,999 | 189 (8.0%) | 7 (2.7%) |
| $2,000 to $2,499 | 170 (7.2%) | 0 (0.0%) |
| $2,500 to $2,999 | 133 (5.6%) | 0 (0.0%) |
| $3,000 or more | 12 (0.5%) | 0 (0.0%) |
| Total | 2,375 (100.0%) | 263 (100.0%) |
Physical Housing Characteristics in Weston County
Housing Structures in Weston County
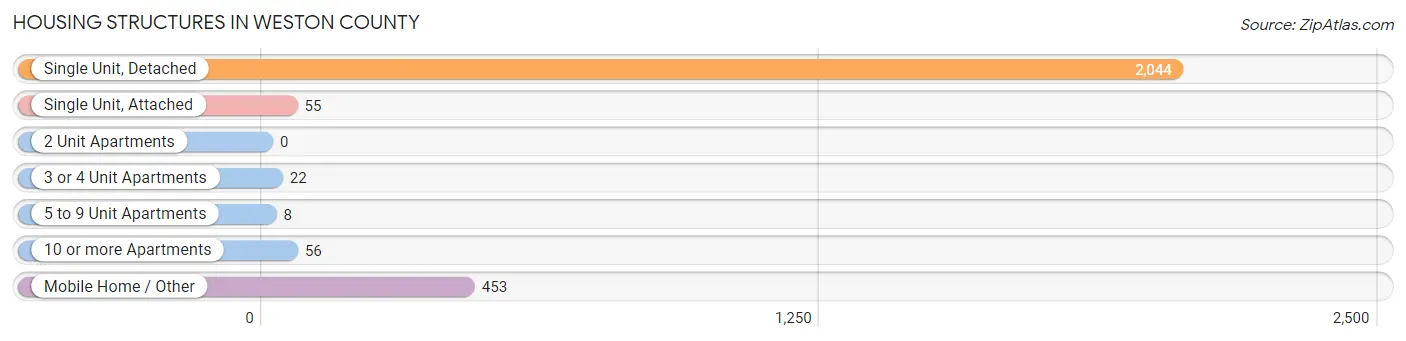
| Structure Type | # Housing Units | % Housing Units |
| Single Unit, Detached | 2,044 | 77.5% |
| Single Unit, Attached | 55 | 2.1% |
| 2 Unit Apartments | 0 | 0.0% |
| 3 or 4 Unit Apartments | 22 | 0.8% |
| 5 to 9 Unit Apartments | 8 | 0.3% |
| 10 or more Apartments | 56 | 2.1% |
| Mobile Home / Other | 453 | 17.2% |
| Total | 2,638 | 100.0% |
Housing Structures by Occupancy in Weston County
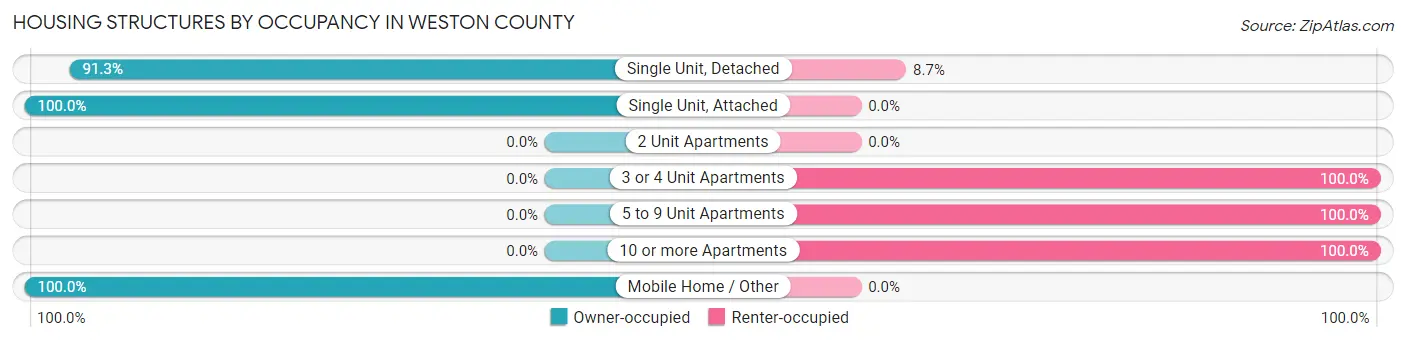
| Structure Type | Owner-occupied | Renter-occupied |
| Single Unit, Detached | 1,867 (91.3%) | 177 (8.7%) |
| Single Unit, Attached | 55 (100.0%) | 0 (0.0%) |
| 2 Unit Apartments | 0 (0.0%) | 0 (0.0%) |
| 3 or 4 Unit Apartments | 0 (0.0%) | 22 (100.0%) |
| 5 to 9 Unit Apartments | 0 (0.0%) | 8 (100.0%) |
| 10 or more Apartments | 0 (0.0%) | 56 (100.0%) |
| Mobile Home / Other | 453 (100.0%) | 0 (0.0%) |
| Total | 2,375 (90.0%) | 263 (10.0%) |
Housing Structures by Number of Rooms in Weston County
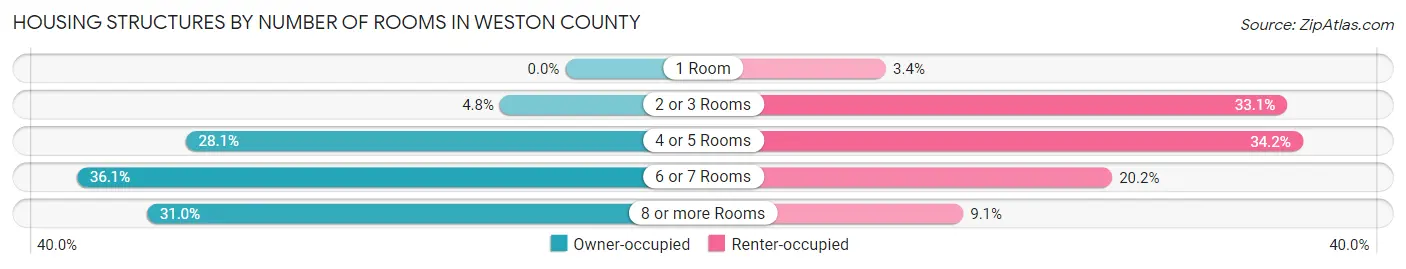
| Number of Rooms | Owner-occupied | Renter-occupied |
| 1 Room | 0 (0.0%) | 9 (3.4%) |
| 2 or 3 Rooms | 115 (4.8%) | 87 (33.1%) |
| 4 or 5 Rooms | 667 (28.1%) | 90 (34.2%) |
| 6 or 7 Rooms | 858 (36.1%) | 53 (20.2%) |
| 8 or more Rooms | 735 (30.9%) | 24 (9.1%) |
| Total | 2,375 (100.0%) | 263 (100.0%) |
Housing Structure by Heating Type in Weston County
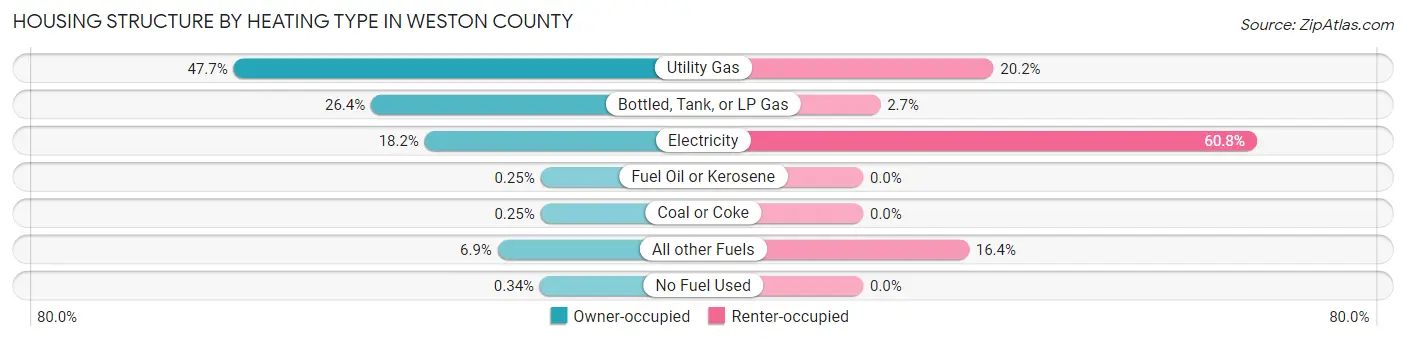
| Heating Type | Owner-occupied | Renter-occupied |
| Utility Gas | 1,133 (47.7%) | 53 (20.2%) |
| Bottled, Tank, or LP Gas | 628 (26.4%) | 7 (2.7%) |
| Electricity | 431 (18.1%) | 160 (60.8%) |
| Fuel Oil or Kerosene | 6 (0.3%) | 0 (0.0%) |
| Coal or Coke | 6 (0.3%) | 0 (0.0%) |
| All other Fuels | 163 (6.9%) | 43 (16.4%) |
| No Fuel Used | 8 (0.3%) | 0 (0.0%) |
| Total | 2,375 (100.0%) | 263 (100.0%) |
Household Vehicle Usage in Weston County
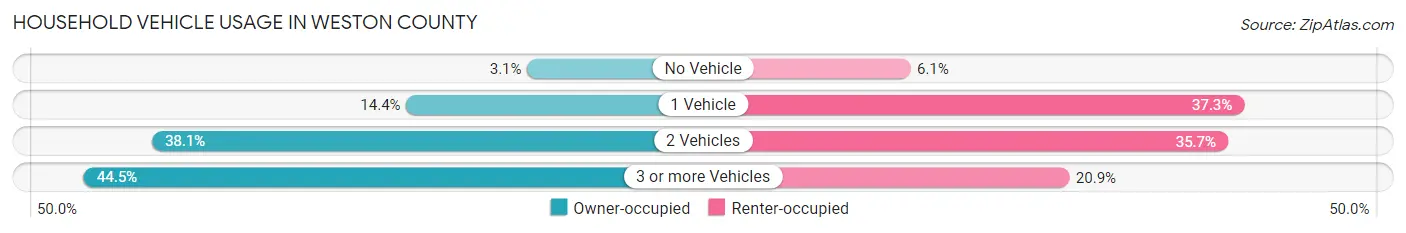
| Vehicles per Household | Owner-occupied | Renter-occupied |
| No Vehicle | 73 (3.1%) | 16 (6.1%) |
| 1 Vehicle | 341 (14.4%) | 98 (37.3%) |
| 2 Vehicles | 905 (38.1%) | 94 (35.7%) |
| 3 or more Vehicles | 1,056 (44.5%) | 55 (20.9%) |
| Total | 2,375 (100.0%) | 263 (100.0%) |
Real Estate & Mortgages in Weston County
Real Estate and Mortgage Overview in Weston County
| Characteristic | Without Mortgage | With Mortgage |
| Housing Units | 1,262 | 1,113 |
| Median Property Value | $174,300 | $222,400 |
| Median Household Income | $53,167 | $186 |
| Monthly Housing Costs | $525 | $12 |
| Real Estate Taxes | $1,121 | $44 |
Property Value by Mortgage Status in Weston County
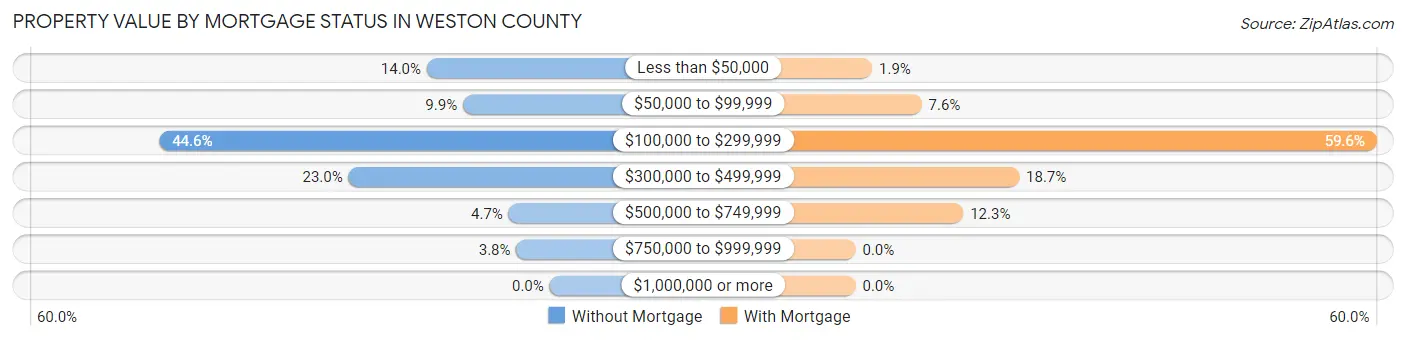
| Property Value | Without Mortgage | With Mortgage |
| Less than $50,000 | 177 (14.0%) | 21 (1.9%) |
| $50,000 to $99,999 | 125 (9.9%) | 84 (7.5%) |
| $100,000 to $299,999 | 563 (44.6%) | 663 (59.6%) |
| $300,000 to $499,999 | 290 (23.0%) | 208 (18.7%) |
| $500,000 to $749,999 | 59 (4.7%) | 137 (12.3%) |
| $750,000 to $999,999 | 48 (3.8%) | 0 (0.0%) |
| $1,000,000 or more | 0 (0.0%) | 0 (0.0%) |
| Total | 1,262 (100.0%) | 1,113 (100.0%) |
Household Income by Mortgage Status in Weston County
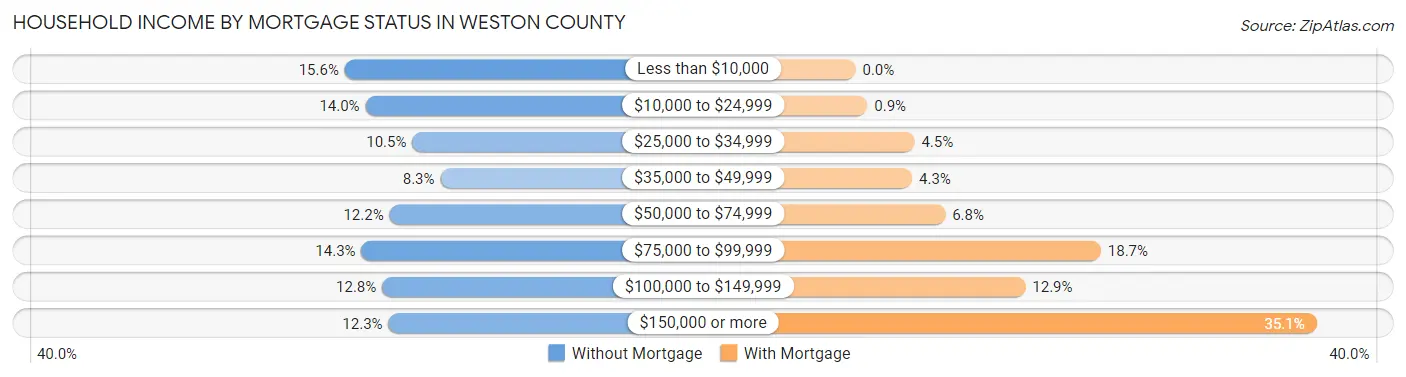
| Household Income | Without Mortgage | With Mortgage |
| Less than $10,000 | 197 (15.6%) | 0 (0.0%) |
| $10,000 to $24,999 | 177 (14.0%) | 10 (0.9%) |
| $25,000 to $34,999 | 132 (10.5%) | 50 (4.5%) |
| $35,000 to $49,999 | 105 (8.3%) | 48 (4.3%) |
| $50,000 to $74,999 | 154 (12.2%) | 76 (6.8%) |
| $75,000 to $99,999 | 181 (14.3%) | 208 (18.7%) |
| $100,000 to $149,999 | 161 (12.8%) | 144 (12.9%) |
| $150,000 or more | 155 (12.3%) | 391 (35.1%) |
| Total | 1,262 (100.0%) | 1,113 (100.0%) |
Property Value to Household Income Ratio in Weston County
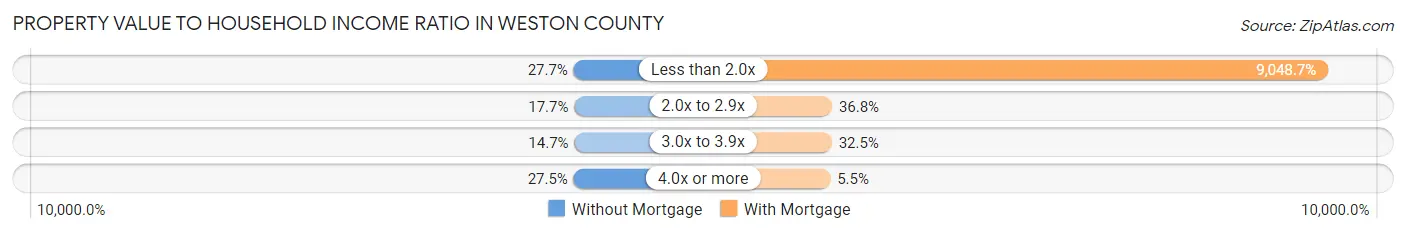
| Value-to-Income Ratio | Without Mortgage | With Mortgage |
| Less than 2.0x | 349 (27.7%) | 100,712 (9,048.7%) |
| 2.0x to 2.9x | 223 (17.7%) | 409 (36.7%) |
| 3.0x to 3.9x | 186 (14.7%) | 362 (32.5%) |
| 4.0x or more | 347 (27.5%) | 61 (5.5%) |
| Total | 1,262 (100.0%) | 1,113 (100.0%) |
Real Estate Taxes by Mortgage Status in Weston County
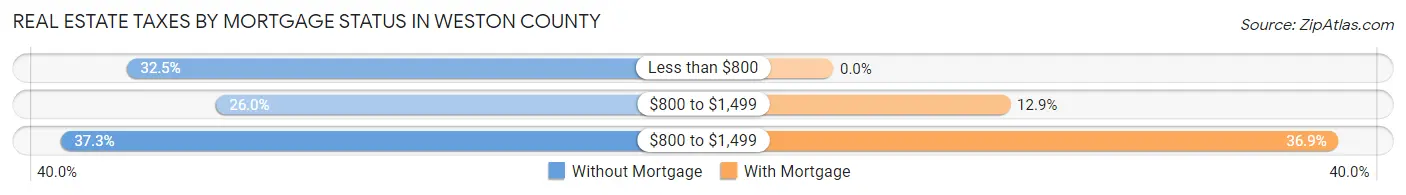
| Property Taxes | Without Mortgage | With Mortgage |
| Less than $800 | 410 (32.5%) | 0 (0.0%) |
| $800 to $1,499 | 328 (26.0%) | 144 (12.9%) |
| $800 to $1,499 | 471 (37.3%) | 411 (36.9%) |
| Total | 1,262 (100.0%) | 1,113 (100.0%) |
Health & Disability in Weston County
Health Insurance Coverage by Age in Weston County
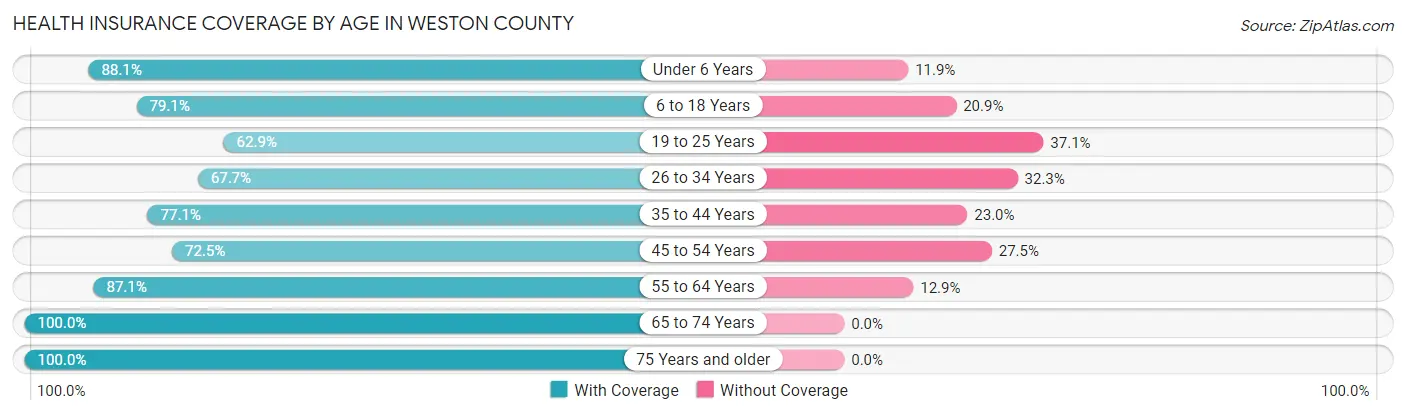
| Age Bracket | With Coverage | Without Coverage |
| Under 6 Years | 325 (88.1%) | 44 (11.9%) |
| 6 to 18 Years | 887 (79.1%) | 234 (20.9%) |
| 19 to 25 Years | 298 (62.9%) | 176 (37.1%) |
| 26 to 34 Years | 333 (67.7%) | 159 (32.3%) |
| 35 to 44 Years | 675 (77.0%) | 201 (23.0%) |
| 45 to 54 Years | 551 (72.5%) | 209 (27.5%) |
| 55 to 64 Years | 914 (87.1%) | 135 (12.9%) |
| 65 to 74 Years | 846 (100.0%) | 0 (0.0%) |
| 75 Years and older | 520 (100.0%) | 0 (0.0%) |
| Total | 5,349 (82.2%) | 1,158 (17.8%) |
Health Insurance Coverage by Citizenship Status in Weston County

| Citizenship Status | With Coverage | Without Coverage |
| Native Born | 325 (88.1%) | 44 (11.9%) |
| Foreign Born, Citizen | 887 (79.1%) | 234 (20.9%) |
| Foreign Born, not a Citizen | 298 (62.9%) | 176 (37.1%) |
Health Insurance Coverage by Household Income in Weston County
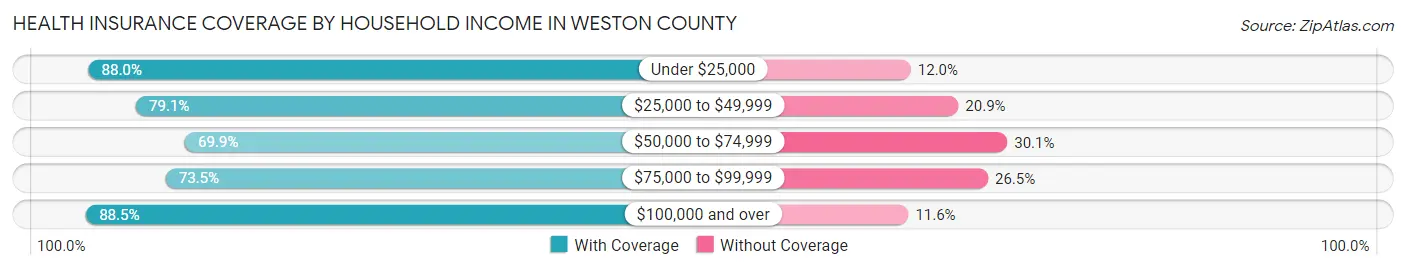
| Household Income | With Coverage | Without Coverage |
| Under $25,000 | 704 (88.0%) | 96 (12.0%) |
| $25,000 to $49,999 | 749 (79.1%) | 198 (20.9%) |
| $50,000 to $74,999 | 628 (69.9%) | 270 (30.1%) |
| $75,000 to $99,999 | 731 (73.5%) | 263 (26.5%) |
| $100,000 and over | 2,534 (88.4%) | 331 (11.6%) |
Public vs Private Health Insurance Coverage by Age in Weston County
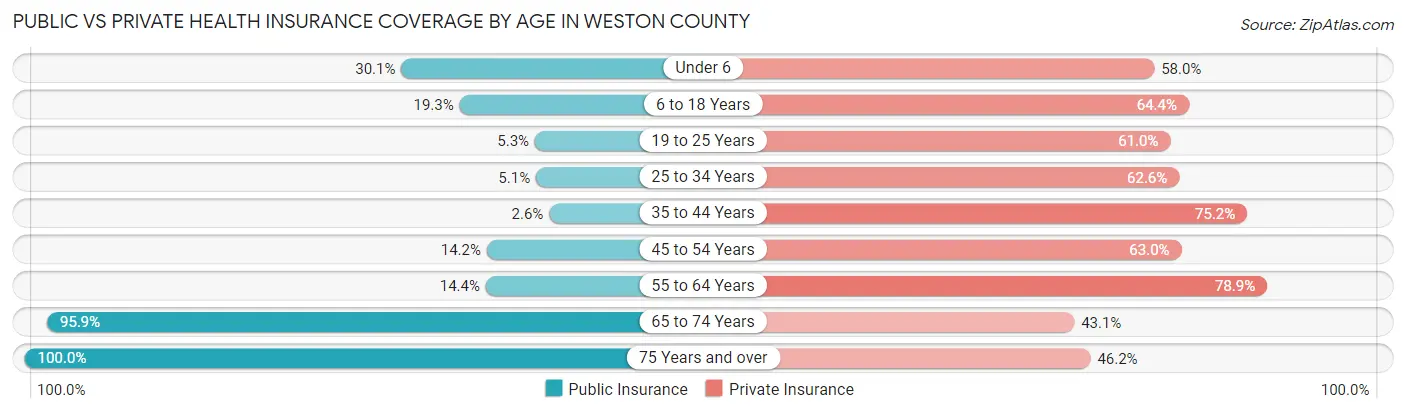
| Age Bracket | Public Insurance | Private Insurance |
| Under 6 | 111 (30.1%) | 214 (58.0%) |
| 6 to 18 Years | 216 (19.3%) | 722 (64.4%) |
| 19 to 25 Years | 25 (5.3%) | 289 (61.0%) |
| 25 to 34 Years | 25 (5.1%) | 308 (62.6%) |
| 35 to 44 Years | 23 (2.6%) | 659 (75.2%) |
| 45 to 54 Years | 108 (14.2%) | 479 (63.0%) |
| 55 to 64 Years | 151 (14.4%) | 828 (78.9%) |
| 65 to 74 Years | 811 (95.9%) | 365 (43.1%) |
| 75 Years and over | 520 (100.0%) | 240 (46.2%) |
| Total | 1,990 (30.6%) | 4,104 (63.1%) |
Disability Status by Sex by Age in Weston County
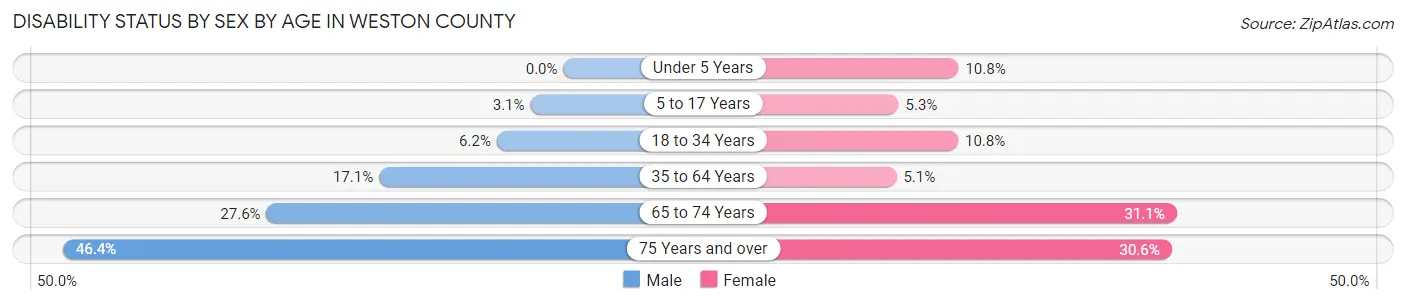
| Age Bracket | Male | Female |
| Under 5 Years | 0 (0.0%) | 13 (10.8%) |
| 5 to 17 Years | 19 (3.1%) | 27 (5.3%) |
| 18 to 34 Years | 33 (6.2%) | 56 (10.8%) |
| 35 to 64 Years | 240 (17.1%) | 65 (5.1%) |
| 65 to 74 Years | 124 (27.6%) | 123 (31.1%) |
| 75 Years and over | 111 (46.4%) | 86 (30.6%) |
Disability Class by Sex by Age in Weston County
Disability Class: Hearing Difficulty
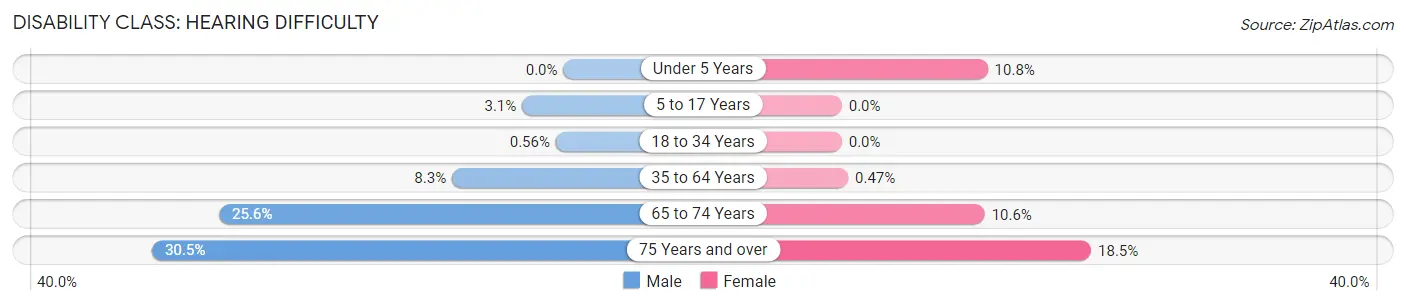
| Age Bracket | Male | Female |
| Under 5 Years | 0 (0.0%) | 13 (10.8%) |
| 5 to 17 Years | 19 (3.1%) | 0 (0.0%) |
| 18 to 34 Years | 3 (0.6%) | 0 (0.0%) |
| 35 to 64 Years | 116 (8.3%) | 6 (0.5%) |
| 65 to 74 Years | 115 (25.6%) | 42 (10.6%) |
| 75 Years and over | 73 (30.5%) | 52 (18.5%) |
Disability Class: Vision Difficulty
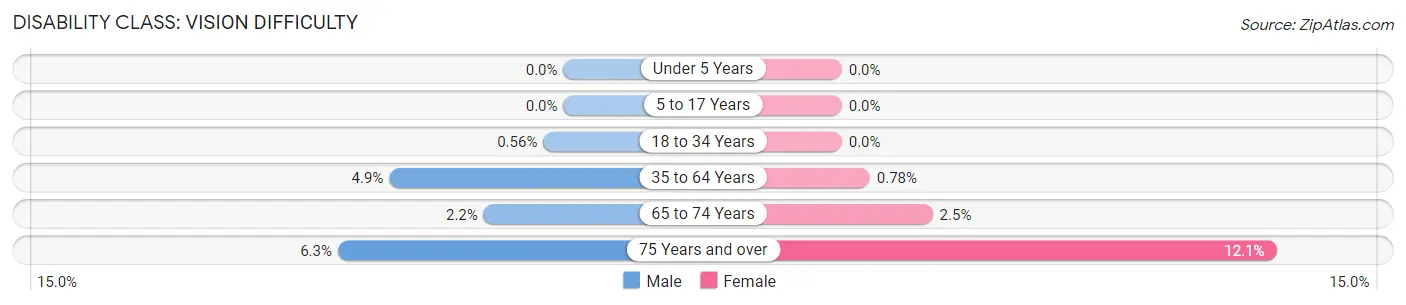
| Age Bracket | Male | Female |
| Under 5 Years | 0 (0.0%) | 0 (0.0%) |
| 5 to 17 Years | 0 (0.0%) | 0 (0.0%) |
| 18 to 34 Years | 3 (0.6%) | 0 (0.0%) |
| 35 to 64 Years | 68 (4.9%) | 10 (0.8%) |
| 65 to 74 Years | 10 (2.2%) | 10 (2.5%) |
| 75 Years and over | 15 (6.3%) | 34 (12.1%) |
Disability Class: Cognitive Difficulty
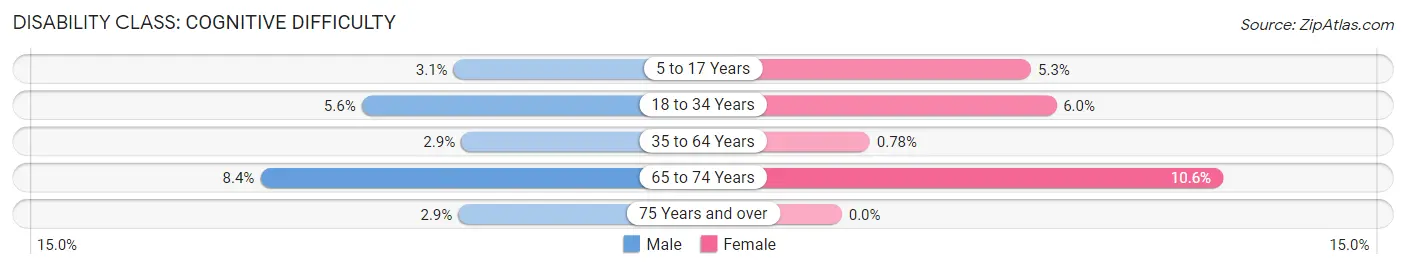
| Age Bracket | Male | Female |
| 5 to 17 Years | 19 (3.1%) | 27 (5.3%) |
| 18 to 34 Years | 30 (5.6%) | 31 (6.0%) |
| 35 to 64 Years | 40 (2.9%) | 10 (0.8%) |
| 65 to 74 Years | 38 (8.4%) | 42 (10.6%) |
| 75 Years and over | 7 (2.9%) | 0 (0.0%) |
Disability Class: Ambulatory Difficulty
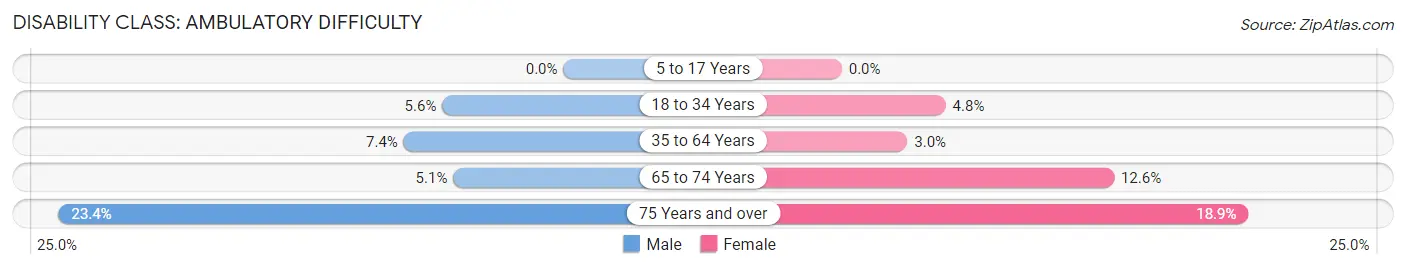
| Age Bracket | Male | Female |
| 5 to 17 Years | 0 (0.0%) | 0 (0.0%) |
| 18 to 34 Years | 30 (5.6%) | 25 (4.8%) |
| 35 to 64 Years | 104 (7.4%) | 39 (3.0%) |
| 65 to 74 Years | 23 (5.1%) | 50 (12.6%) |
| 75 Years and over | 56 (23.4%) | 53 (18.9%) |
Disability Class: Self-Care Difficulty
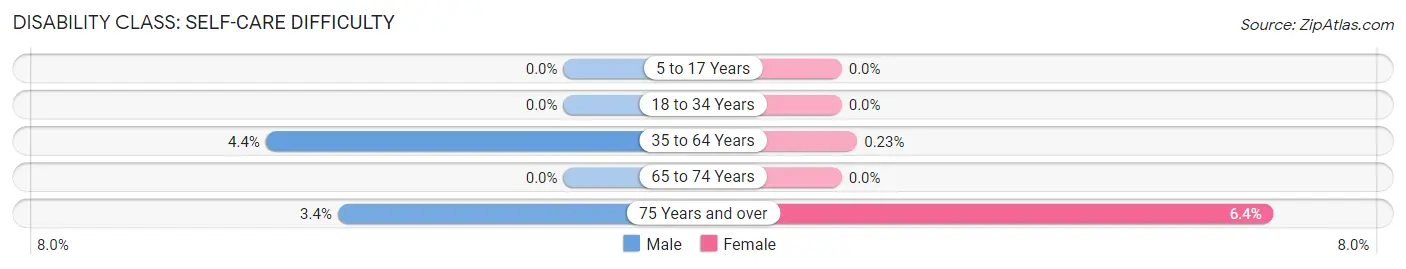
| Age Bracket | Male | Female |
| 5 to 17 Years | 0 (0.0%) | 0 (0.0%) |
| 18 to 34 Years | 0 (0.0%) | 0 (0.0%) |
| 35 to 64 Years | 62 (4.4%) | 3 (0.2%) |
| 65 to 74 Years | 0 (0.0%) | 0 (0.0%) |
| 75 Years and over | 8 (3.4%) | 18 (6.4%) |
Technology Access in Weston County
Computing Device Access in Weston County
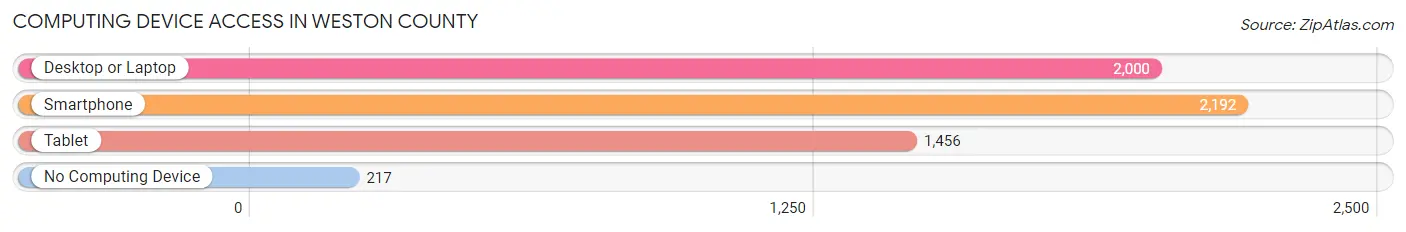
| Device Type | # Households | % Households |
| Desktop or Laptop | 2,000 | 75.8% |
| Smartphone | 2,192 | 83.1% |
| Tablet | 1,456 | 55.2% |
| No Computing Device | 217 | 8.2% |
| Total | 2,638 | 100.0% |
Internet Access in Weston County
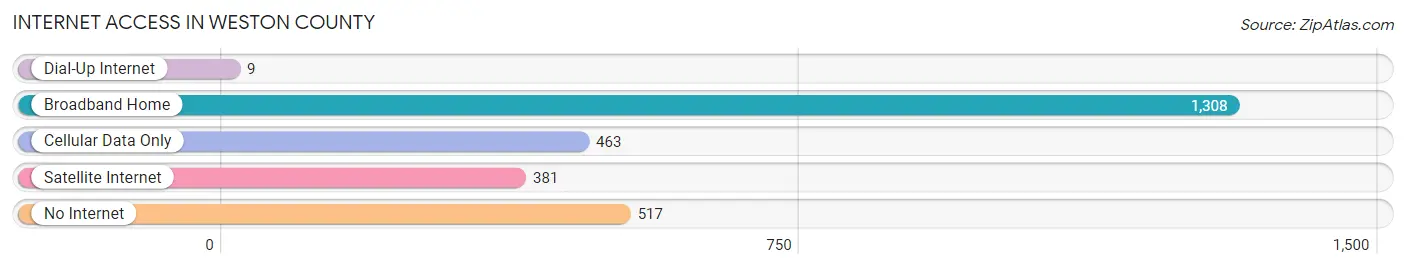
| Internet Type | # Households | % Households |
| Dial-Up Internet | 9 | 0.3% |
| Broadband Home | 1,308 | 49.6% |
| Cellular Data Only | 463 | 17.5% |
| Satellite Internet | 381 | 14.4% |
| No Internet | 517 | 19.6% |
| Total | 2,638 | 100.0% |
Weston County Summary
Weston County is located in the northeastern corner of Wyoming, and is bordered by South Dakota to the east, Montana to the north, and Crook and Campbell counties to the south and west, respectively. The county seat is Newcastle, and the county has a total area of 2,068 square miles, of which 2,062 square miles is land and 6 square miles is water. As of the 2010 census, the population was 7,208, making it the fourth least populous county in Wyoming.
Geography
Weston County is located in the Black Hills region of Wyoming, and is characterized by rolling hills, grassy plains, and rugged mountains. The county is home to the Black Hills National Forest, which covers 1,079,000 acres and is home to a variety of wildlife, including elk, deer, bighorn sheep, and mountain lions. The county is also home to the Bearlodge Mountains, which are part of the Black Hills National Forest. The highest point in the county is Bald Mountain, which has an elevation of 8,890 feet.
The county is drained by the Belle Fourche River, which flows through the county from north to south. The Belle Fourche River is a tributary of the Cheyenne River, which flows through the county from east to west. Other major waterways in the county include the Little Missouri River, the Powder River, and the Tongue River.
Climate
Weston County has a semi-arid climate, with hot summers and cold winters. The average annual temperature is 48°F, and the average annual precipitation is 16.5 inches. The county is subject to frequent thunderstorms during the summer months, and snowfall is common during the winter months.
Economy
The economy of Weston County is largely based on agriculture and ranching. The county is home to a number of cattle ranches, and the county is also home to a number of farms that produce wheat, corn, hay, and other crops. The county is also home to a number of oil and gas wells, and the county is home to a number of coal mines.
The county is also home to a number of tourist attractions, including the Black Hills National Forest, the Bearlodge Mountains, and the Belle Fourche River. The county is also home to a number of historic sites, including the Fort Phil Kearny State Historic Site, the Fort Fetterman State Historic Site, and the Weston County Museum.
Demographics
As of the 2010 census, there were 7,208 people, 2,845 households, and 1,945 families residing in the county. The population density was 3.5 people per square mile. The racial makeup of the county was 95.2% White, 0.3% African American, 0.7% Native American, 0.3% Asian, 0.1% Pacific Islander, 1.7% from other races, and 1.7% from two or more races. Hispanic or Latino of any race were 4.2% of the population.
The median income for a household in the county was $41,944, and the median income for a family was $50,938. The per capita income for the county was $20,945. About 11.2% of families and 14.2% of the population were below the poverty line, including 19.2% of those under age 18 and 8.2% of those age 65 or over.
Weston County is a rural county with a small population, but it is home to a variety of industries and attractions that make it an attractive place to live and work. The county is home to a number of ranches, farms, and tourist attractions, and the county is also home to a number of historic sites. The county is also home to a number of oil and gas wells, and the county is home to a number of coal mines. The county is also home to a number of tourist attractions, including the Black Hills National Forest, the Bearlodge Mountains, and the Belle Fourche River.
Common Questions
What is the Total Population of Weston County?
Total Population of Weston County is 6,870.
What is the Total Male Population of Weston County?
Total Male Population of Weston County is 3,718.
What is the Total Female Population of Weston County?
Total Female Population of Weston County is 3,152.
What is the Ratio of Males per 100 Females in Weston County?
There are 117.96 Males per 100 Females in Weston County.
What is the Ratio of Females per 100 Males in Weston County?
There are 84.78 Females per 100 Males in Weston County.
What is the Median Population Age in Weston County?
Median Population Age in Weston County is 43.1 Years.
What is the Average Family Size in Weston County
Average Family Size in Weston County is 2.9 People.
What is the Average Household Size in Weston County
Average Household Size in Weston County is 2.5 People.
What is Per Capita Income in Weston County?
Per Capita income in Weston County is $37,067.
What is the Median Family Income in Weston County?
Median Family Income in Weston County is $77,656.
What is the Median Household income in Weston County?
Median Household Income in Weston County is $71,800.
What is Income or Wage Gap in Weston County?
Income or Wage Gap in Weston County is 51.8%.
Women in Weston County earn 48.2 cents for every dollar earned by a man.
What is Inequality or Gini Index in Weston County?
Inequality or Gini Index in Weston County is 0.48.
How Large is the Labor Force in Weston County?
There are 3,161 People in the Labor Forcein in Weston County.
What is the Percentage of People in the Labor Force in Weston County?
55.4% of People are in the Labor Force in Weston County.
What is the Unemployment Rate in Weston County?
Unemployment Rate in Weston County is 3.6%.