Uinta County, WY
Uinta County Map
Uinta County Overview
20,546
TOTAL POPULATION
10,446
MALE POPULATION
10,100
FEMALE POPULATION
103.43
MALES / 100 FEMALES
96.69
FEMALES / 100 MALES
36.0
MEDIAN AGE
3.3
AVG FAMILY SIZE
2.7
AVG HOUSEHOLD SIZE
$32,955
PER CAPITA INCOME
$91,003
AVG FAMILY INCOME
$78,164
AVG HOUSEHOLD INCOME
57.9%
WAGE / INCOME GAP [ % ]
42.1¢/ $1
WAGE / INCOME GAP [ $ ]
0.36
INEQUALITY / GINI INDEX
9,910
LABOR FORCE [ PEOPLE ]
64.0%
PERCENT IN LABOR FORCE
3.4%
UNEMPLOYMENT RATE
Uinta County Area Codes
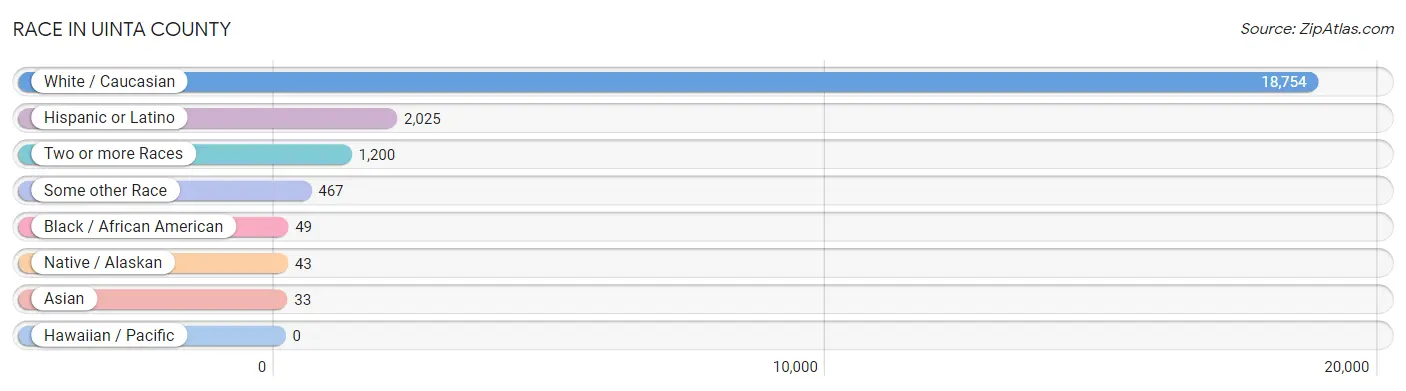
Race in Uinta County
The most populous races in Uinta County are White / Caucasian (18,754 | 91.3%), Hispanic or Latino (2,025 | 9.9%), and Two or more Races (1,200 | 5.8%).
| Race | # Population | % Population |
| Asian | 33 | 0.2% |
| Black / African American | 49 | 0.2% |
| Hawaiian / Pacific | 0 | 0.0% |
| Hispanic or Latino | 2,025 | 9.9% |
| Native / Alaskan | 43 | 0.2% |
| White / Caucasian | 18,754 | 91.3% |
| Two or more Races | 1,200 | 5.8% |
| Some other Race | 467 | 2.3% |
| Total | 20,546 | 100.0% |
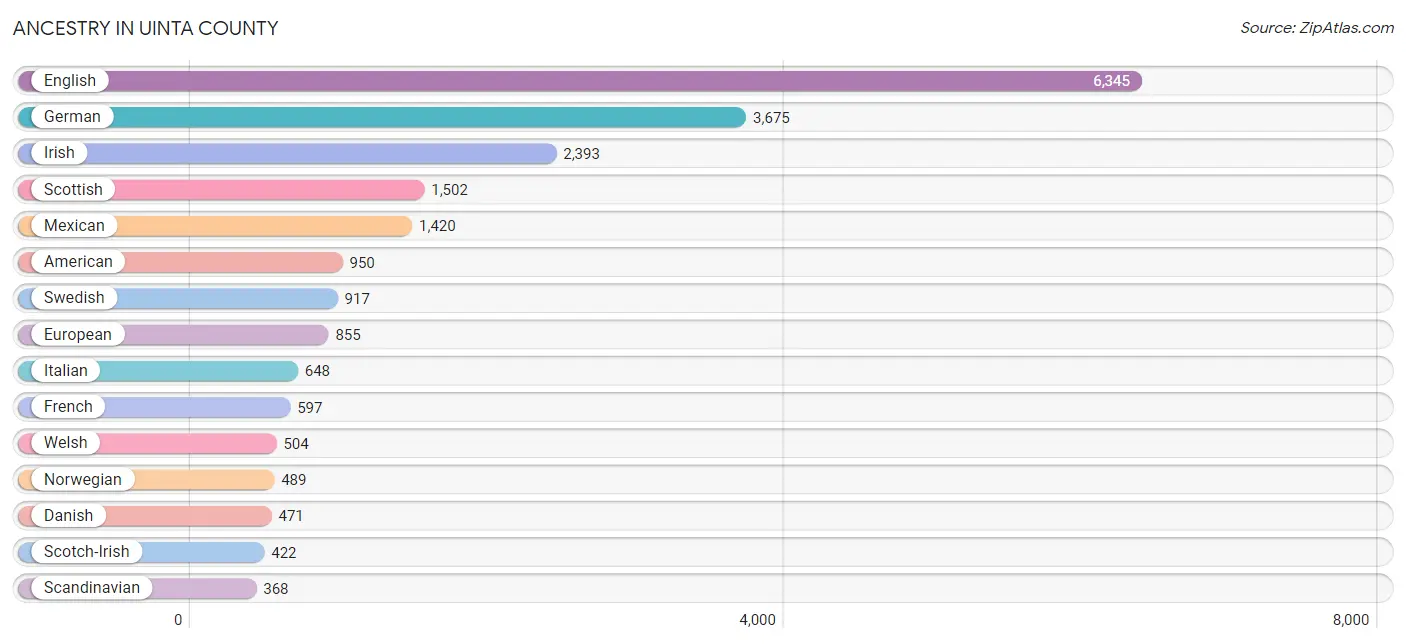
Ancestry in Uinta County
The most populous ancestries reported in Uinta County are English (6,345 | 30.9%), German (3,675 | 17.9%), Irish (2,393 | 11.7%), Scottish (1,502 | 7.3%), and Mexican (1,420 | 6.9%), together accounting for 74.6% of all Uinta County residents.
| Ancestry | # Population | % Population |
| American | 950 | 4.6% |
| Apache | 64 | 0.3% |
| Arab | 1 | 0.0% |
| Austrian | 30 | 0.2% |
| Basque | 69 | 0.3% |
| Belgian | 9 | 0.0% |
| Bhutanese | 95 | 0.5% |
| Blackfeet | 31 | 0.2% |
| British | 177 | 0.9% |
| Cajun | 3 | 0.0% |
| Central American | 125 | 0.6% |
| Central American Indian | 100 | 0.5% |
| Cherokee | 173 | 0.8% |
| Cheyenne | 30 | 0.2% |
| Chippewa | 14 | 0.1% |
| Choctaw | 57 | 0.3% |
| Croatian | 4 | 0.0% |
| Cuban | 64 | 0.3% |
| Czech | 253 | 1.2% |
| Czechoslovakian | 7 | 0.0% |
| Danish | 471 | 2.3% |
| Dutch | 303 | 1.5% |
| English | 6,345 | 30.9% |
| European | 855 | 4.2% |
| Finnish | 23 | 0.1% |
| French | 597 | 2.9% |
| French Canadian | 110 | 0.5% |
| German | 3,675 | 17.9% |
| Greek | 198 | 1.0% |
| Guatemalan | 112 | 0.5% |
| Hungarian | 24 | 0.1% |
| Icelander | 2 | 0.0% |
| Indian (Asian) | 2 | 0.0% |
| Irish | 2,393 | 11.7% |
| Iroquois | 1 | 0.0% |
| Italian | 648 | 3.2% |
| Korean | 84 | 0.4% |
| Lithuanian | 15 | 0.1% |
| Mexican | 1,420 | 6.9% |
| Moroccan | 1 | 0.0% |
| Native Hawaiian | 9 | 0.0% |
| Navajo | 66 | 0.3% |
| Nicaraguan | 7 | 0.0% |
| Nigerian | 24 | 0.1% |
| Northern European | 22 | 0.1% |
| Norwegian | 489 | 2.4% |
| Osage | 29 | 0.1% |
| Paiute | 10 | 0.1% |
| Panamanian | 6 | 0.0% |
| Polish | 195 | 0.9% |
| Portuguese | 93 | 0.4% |
| Puerto Rican | 158 | 0.8% |
| Russian | 71 | 0.4% |
| Scandinavian | 368 | 1.8% |
| Scotch-Irish | 422 | 2.1% |
| Scottish | 1,502 | 7.3% |
| Seminole | 2 | 0.0% |
| Shoshone | 36 | 0.2% |
| Sioux | 4 | 0.0% |
| Slovak | 19 | 0.1% |
| Slovene | 6 | 0.0% |
| Spaniard | 18 | 0.1% |
| Spanish | 56 | 0.3% |
| Spanish American | 12 | 0.1% |
| Subsaharan African | 24 | 0.1% |
| Swedish | 917 | 4.5% |
| Swiss | 53 | 0.3% |
| Ukrainian | 6 | 0.0% |
| Ute | 60 | 0.3% |
| Welsh | 504 | 2.5% |
| Yugoslavian | 54 | 0.3% | View All 71 Rows |
Immigrants in Uinta County
The most numerous immigrant groups reported in Uinta County came from Latin America (359 | 1.8%), Central America (295 | 1.4%), Mexico (230 | 1.1%), Guatemala (65 | 0.3%), and Caribbean (64 | 0.3%), together accounting for 4.9% of all Uinta County residents.

| Immigration Origin | # Population | % Population |
| Africa | 4 | 0.0% |
| Asia | 1 | 0.0% |
| Canada | 23 | 0.1% |
| Caribbean | 64 | 0.3% |
| Central America | 295 | 1.4% |
| Cuba | 64 | 0.3% |
| Europe | 64 | 0.3% |
| Germany | 62 | 0.3% |
| Guatemala | 65 | 0.3% |
| Latin America | 359 | 1.8% |
| Mexico | 230 | 1.1% |
| Nigeria | 4 | 0.0% |
| Northern Europe | 2 | 0.0% |
| Philippines | 1 | 0.0% |
| South Eastern Asia | 1 | 0.0% |
| Western Africa | 4 | 0.0% |
| Western Europe | 62 | 0.3% | View All 17 Rows |
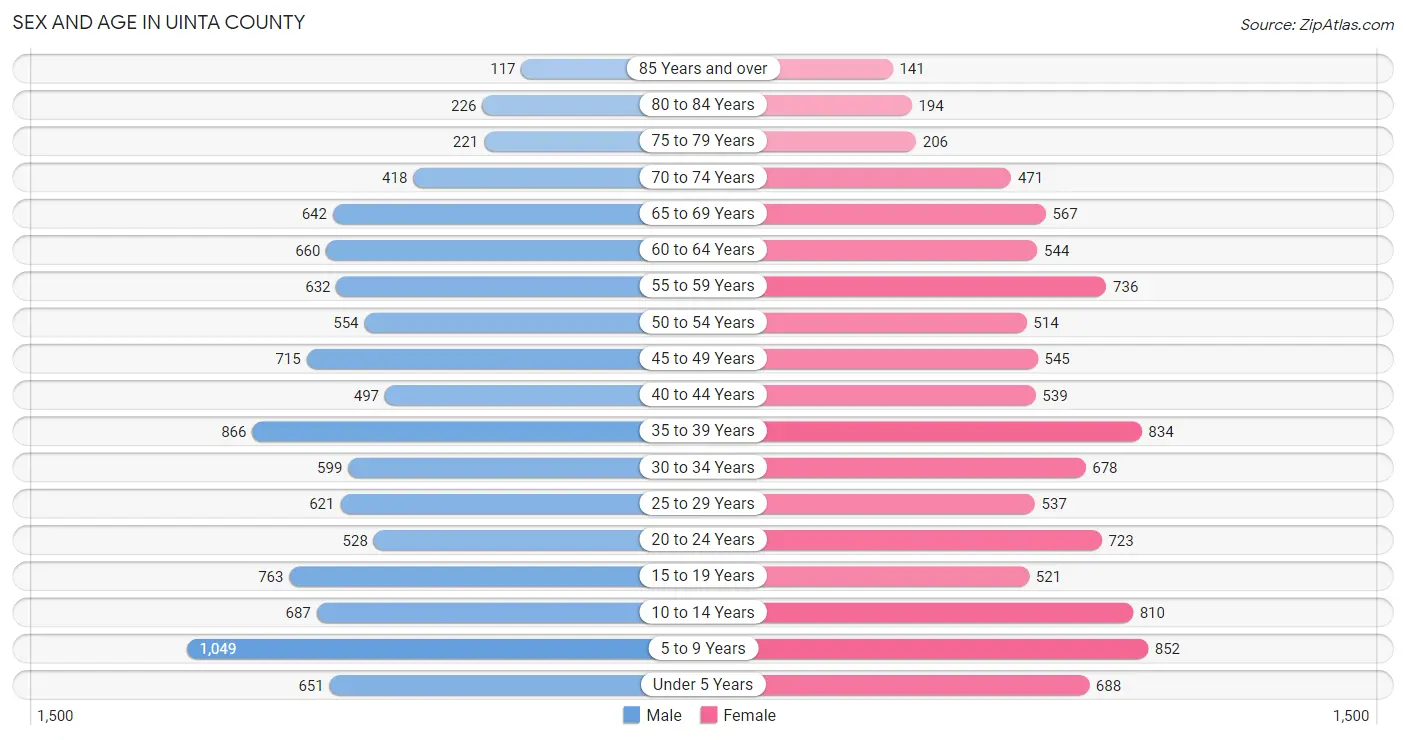
Sex and Age in Uinta County
Sex and Age in Uinta County
The most populous age groups in Uinta County are 5 to 9 Years (1,049 | 10.0%) for men and 5 to 9 Years (852 | 8.4%) for women.
| Age Bracket | Male | Female |
| Under 5 Years | 651 (6.2%) | 688 (6.8%) |
| 5 to 9 Years | 1,049 (10.0%) | 852 (8.4%) |
| 10 to 14 Years | 687 (6.6%) | 810 (8.0%) |
| 15 to 19 Years | 763 (7.3%) | 521 (5.2%) |
| 20 to 24 Years | 528 (5.1%) | 723 (7.2%) |
| 25 to 29 Years | 621 (5.9%) | 537 (5.3%) |
| 30 to 34 Years | 599 (5.7%) | 678 (6.7%) |
| 35 to 39 Years | 866 (8.3%) | 834 (8.3%) |
| 40 to 44 Years | 497 (4.8%) | 539 (5.3%) |
| 45 to 49 Years | 715 (6.8%) | 545 (5.4%) |
| 50 to 54 Years | 554 (5.3%) | 514 (5.1%) |
| 55 to 59 Years | 632 (6.0%) | 736 (7.3%) |
| 60 to 64 Years | 660 (6.3%) | 544 (5.4%) |
| 65 to 69 Years | 642 (6.1%) | 567 (5.6%) |
| 70 to 74 Years | 418 (4.0%) | 471 (4.7%) |
| 75 to 79 Years | 221 (2.1%) | 206 (2.0%) |
| 80 to 84 Years | 226 (2.2%) | 194 (1.9%) |
| 85 Years and over | 117 (1.1%) | 141 (1.4%) |
| Total | 10,446 (100.0%) | 10,100 (100.0%) |
Families and Households in Uinta County
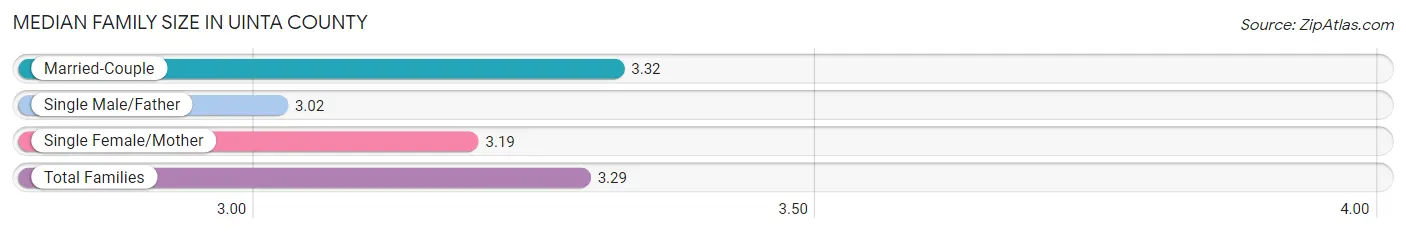
Median Family Size in Uinta County
The median family size in Uinta County is 3.29 persons per family, with married-couple families (4,175 | 82.5%) accounting for the largest median family size of 3.32 persons per family. On the other hand, single male/father families (333 | 6.6%) represent the smallest median family size with 3.02 persons per family.
| Family Type | # Families | Family Size |
| Married-Couple | 4,175 (82.5%) | 3.32 |
| Single Male/Father | 333 (6.6%) | 3.02 |
| Single Female/Mother | 550 (10.9%) | 3.19 |
| Total Families | 5,058 (100.0%) | 3.29 |
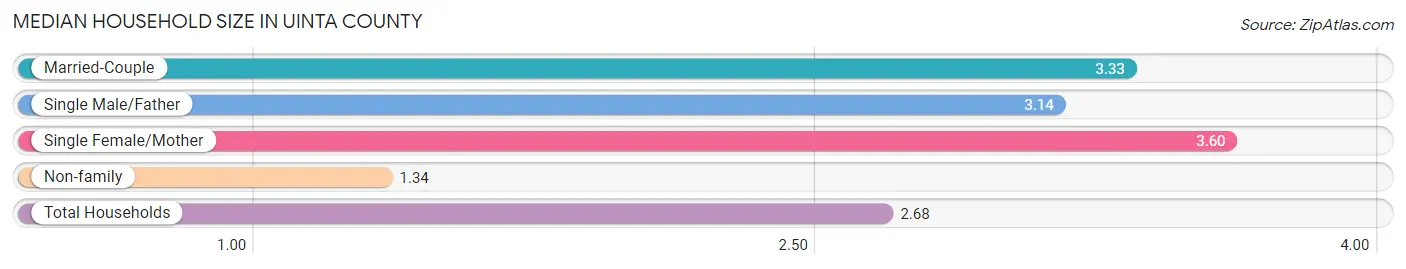
Median Household Size in Uinta County
The median household size in Uinta County is 2.68 persons per household, with single female/mother households (550 | 7.2%) accounting for the largest median household size of 3.6 persons per household. non-family households (2,528 | 33.3%) represent the smallest median household size with 1.34 persons per household.
| Household Type | # Households | Household Size |
| Married-Couple | 4,175 (55.0%) | 3.33 |
| Single Male/Father | 333 (4.4%) | 3.14 |
| Single Female/Mother | 550 (7.2%) | 3.60 |
| Non-family | 2,528 (33.3%) | 1.34 |
| Total Households | 7,586 (100.0%) | 2.68 |
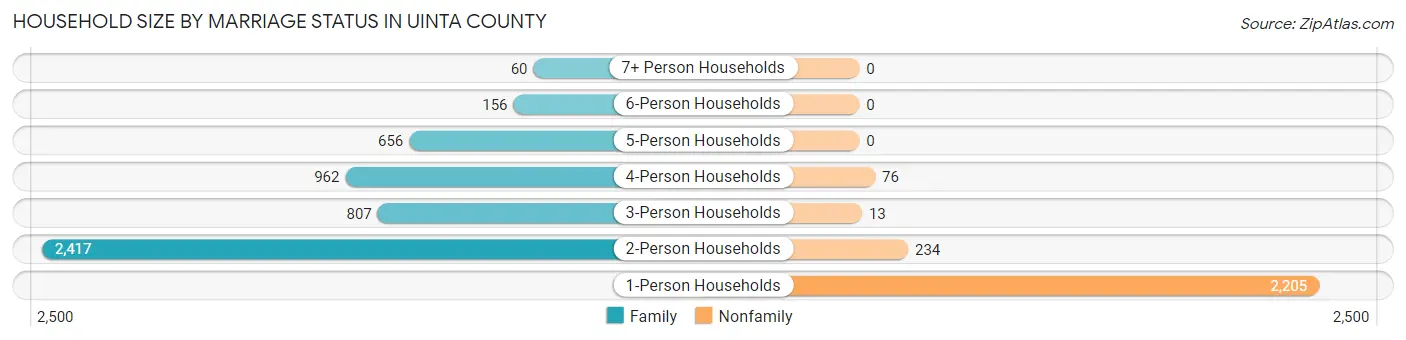
Household Size by Marriage Status in Uinta County
Out of a total of 7,586 households in Uinta County, 5,058 (66.7%) are family households, while 2,528 (33.3%) are nonfamily households. The most numerous type of family households are 2-person households, comprising 2,417, and the most common type of nonfamily households are 1-person households, comprising 2,205.
| Household Size | Family Households | Nonfamily Households |
| 1-Person Households | - | 2,205 (29.1%) |
| 2-Person Households | 2,417 (31.9%) | 234 (3.1%) |
| 3-Person Households | 807 (10.6%) | 13 (0.2%) |
| 4-Person Households | 962 (12.7%) | 76 (1.0%) |
| 5-Person Households | 656 (8.6%) | 0 (0.0%) |
| 6-Person Households | 156 (2.1%) | 0 (0.0%) |
| 7+ Person Households | 60 (0.8%) | 0 (0.0%) |
| Total | 5,058 (66.7%) | 2,528 (33.3%) |
Female Fertility in Uinta County
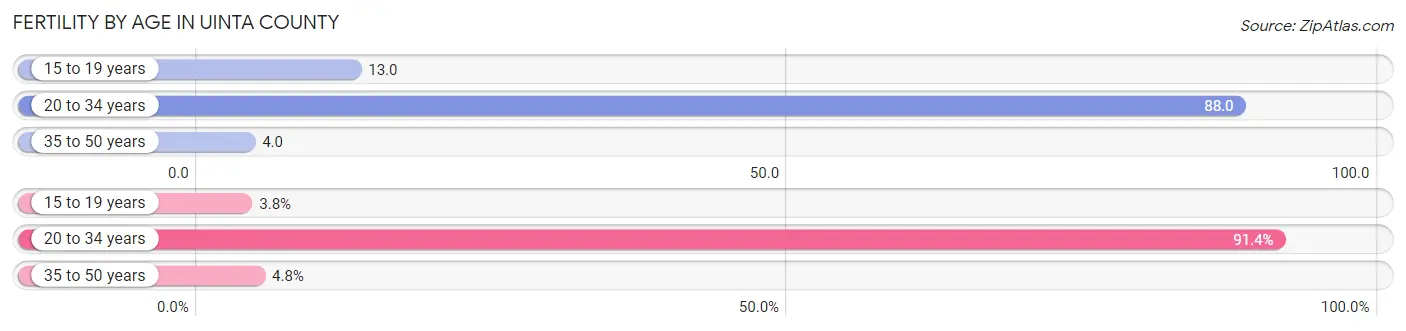
Fertility by Age in Uinta County
Average fertility rate in Uinta County is 41.0 births per 1,000 women. Women in the age bracket of 20 to 34 years have the highest fertility rate with 88.0 births per 1,000 women. Women in the age bracket of 20 to 34 years acount for 91.4% of all women with births.
| Age Bracket | Women with Births | Births / 1,000 Women |
| 15 to 19 years | 7 (3.8%) | 13.0 |
| 20 to 34 years | 170 (91.4%) | 88.0 |
| 35 to 50 years | 9 (4.8%) | 4.0 |
| Total | 186 (100.0%) | 41.0 |
Fertility by Age by Marriage Status in Uinta County
81.2% of women with births (186) in Uinta County are married. The highest percentage of unmarried women with births falls into 20 to 34 years age bracket with 20.6% of them unmarried at the time of birth, while the lowest percentage of unmarried women with births belong to 15 to 19 years age bracket with 0.0% of them unmarried.
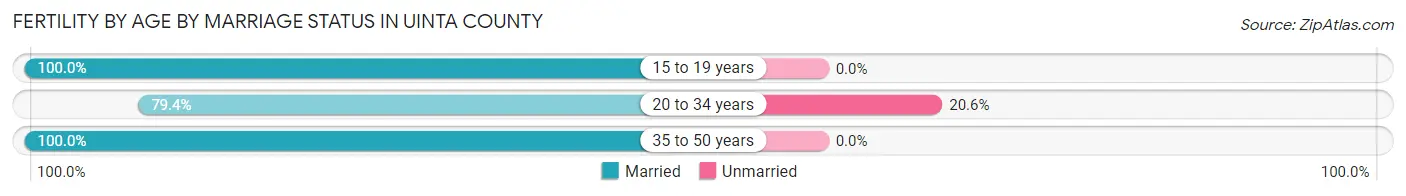
| Age Bracket | Married | Unmarried |
| 15 to 19 years | 7 (100.0%) | 0 (0.0%) |
| 20 to 34 years | 135 (79.4%) | 35 (20.6%) |
| 35 to 50 years | 9 (100.0%) | 0 (0.0%) |
| Total | 151 (81.2%) | 35 (18.8%) |
Fertility by Education in Uinta County
Average fertility rate in Uinta County is 41.0 births per 1,000 women. Women with the education attainment of high school diploma have the highest fertility rate of 51.0 births per 1,000 women, while women with the education attainment of bachelor's degree have the lowest fertility at 29.0 births per 1,000 women. Women with the education attainment of high school diploma represent 36.0% of all women with births.
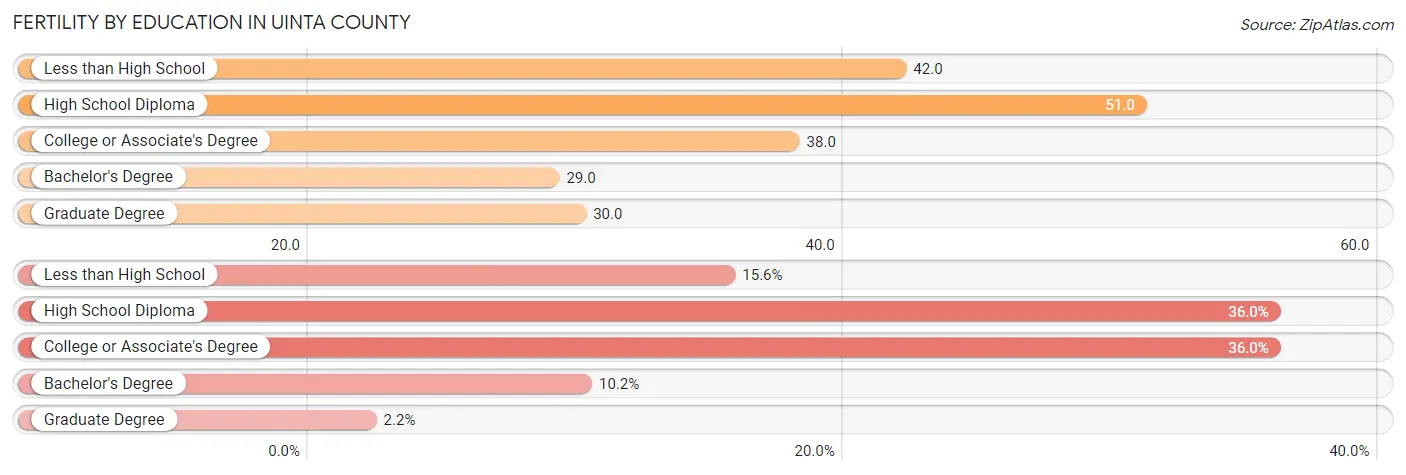
| Educational Attainment | Women with Births | Births / 1,000 Women |
| Less than High School | 29 (15.6%) | 42.0 |
| High School Diploma | 67 (36.0%) | 51.0 |
| College or Associate's Degree | 67 (36.0%) | 38.0 |
| Bachelor's Degree | 19 (10.2%) | 29.0 |
| Graduate Degree | 4 (2.1%) | 30.0 |
| Total | 186 (100.0%) | 41.0 |
Fertility by Education by Marriage Status in Uinta County
18.8% of women with births in Uinta County are unmarried. Women with the educational attainment of less than high school are most likely to be married with 100.0% of them married at childbirth, while women with the educational attainment of college or associate's degree are least likely to be married with 52.2% of them unmarried at childbirth.
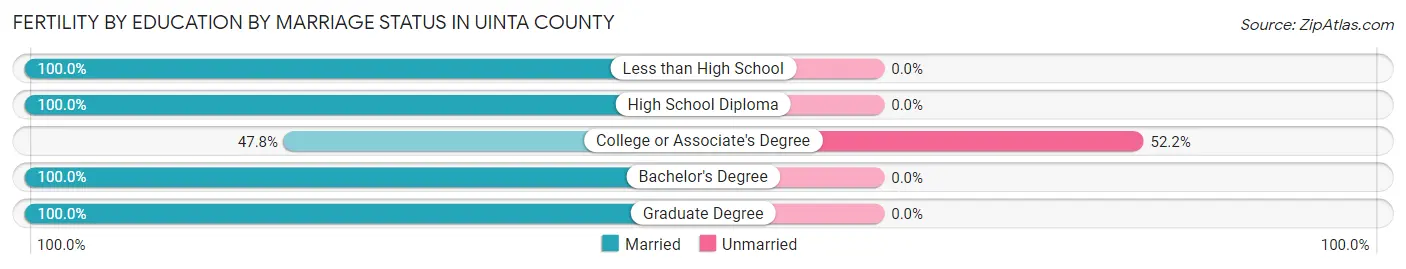
| Educational Attainment | Married | Unmarried |
| Less than High School | 29 (100.0%) | 0 (0.0%) |
| High School Diploma | 67 (100.0%) | 0 (0.0%) |
| College or Associate's Degree | 32 (47.8%) | 35 (52.2%) |
| Bachelor's Degree | 19 (100.0%) | 0 (0.0%) |
| Graduate Degree | 4 (100.0%) | 0 (0.0%) |
| Total | 151 (81.2%) | 35 (18.8%) |
Income in Uinta County
Income Overview in Uinta County
Per Capita Income in Uinta County is $32,955, while median incomes of families and households are $91,003 and $78,164 respectively.
| Characteristic | Number | Measure |
| Per Capita Income | 20,546 | $32,955 |
| Median Family Income | 5,058 | $91,003 |
| Mean Family Income | 5,058 | $99,452 |
| Median Household Income | 7,586 | $78,164 |
| Mean Household Income | 7,586 | $85,497 |
| Income Deficit | 5,058 | $0 |
| Wage / Income Gap (%) | 20,546 | 57.90% |
| Wage / Income Gap ($) | 20,546 | 42.10¢ per $1 |
| Gini / Inequality Index | 20,546 | 0.36 |
Earnings by Sex in Uinta County
Average Earnings in Uinta County are $32,447, $56,895 for men and $23,952 for women, a difference of 57.9%.
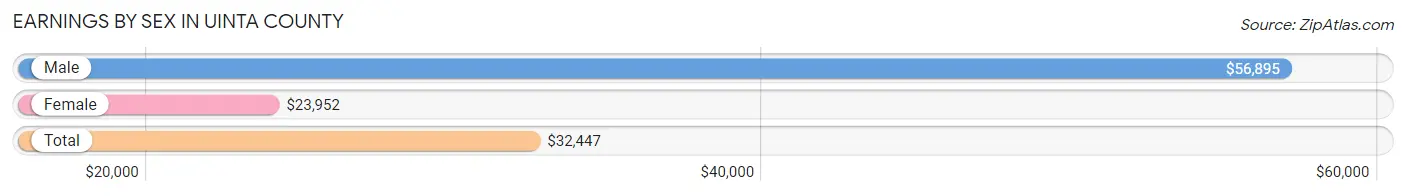
| Sex | Number | Average Earnings |
| Male | 5,641 (52.1%) | $56,895 |
| Female | 5,178 (47.9%) | $23,952 |
| Total | 10,819 (100.0%) | $32,447 |
Earnings by Sex by Income Bracket in Uinta County
The most common earnings brackets in Uinta County are $100,000+ for men (1,123 | 19.9%) and $25,000 to $29,999 for women (824 | 15.9%).
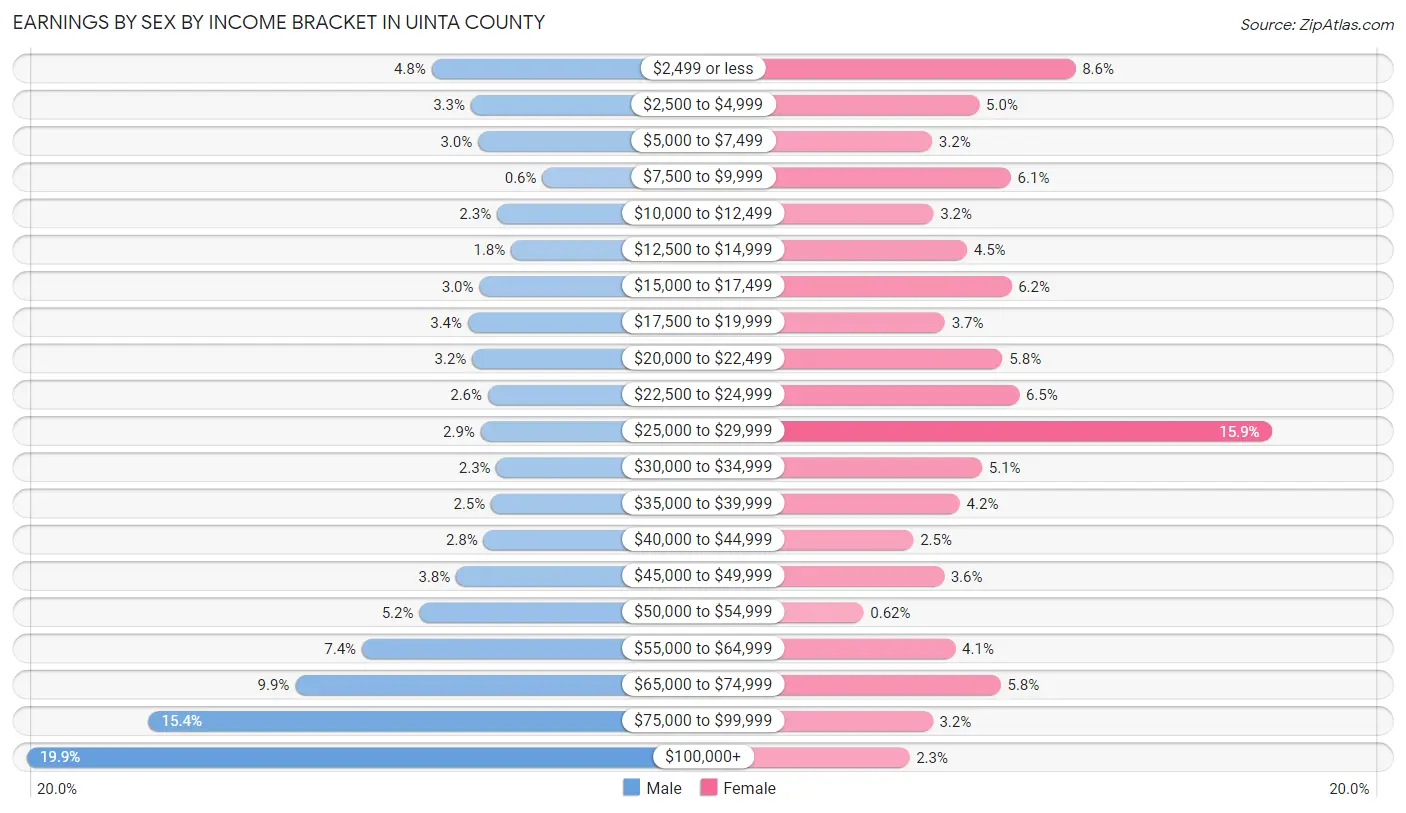
| Income | Male | Female |
| $2,499 or less | 268 (4.8%) | 443 (8.6%) |
| $2,500 to $4,999 | 185 (3.3%) | 257 (5.0%) |
| $5,000 to $7,499 | 170 (3.0%) | 165 (3.2%) |
| $7,500 to $9,999 | 34 (0.6%) | 318 (6.1%) |
| $10,000 to $12,499 | 130 (2.3%) | 168 (3.2%) |
| $12,500 to $14,999 | 100 (1.8%) | 233 (4.5%) |
| $15,000 to $17,499 | 167 (3.0%) | 319 (6.2%) |
| $17,500 to $19,999 | 191 (3.4%) | 190 (3.7%) |
| $20,000 to $22,499 | 182 (3.2%) | 302 (5.8%) |
| $22,500 to $24,999 | 149 (2.6%) | 334 (6.5%) |
| $25,000 to $29,999 | 164 (2.9%) | 824 (15.9%) |
| $30,000 to $34,999 | 131 (2.3%) | 262 (5.1%) |
| $35,000 to $39,999 | 142 (2.5%) | 219 (4.2%) |
| $40,000 to $44,999 | 158 (2.8%) | 129 (2.5%) |
| $45,000 to $49,999 | 216 (3.8%) | 188 (3.6%) |
| $50,000 to $54,999 | 294 (5.2%) | 32 (0.6%) |
| $55,000 to $64,999 | 415 (7.4%) | 210 (4.1%) |
| $65,000 to $74,999 | 556 (9.9%) | 298 (5.8%) |
| $75,000 to $99,999 | 866 (15.3%) | 166 (3.2%) |
| $100,000+ | 1,123 (19.9%) | 121 (2.3%) |
| Total | 5,641 (100.0%) | 5,178 (100.0%) |
Earnings by Sex by Educational Attainment in Uinta County
Average earnings in Uinta County are $68,377 for men and $25,523 for women, a difference of 62.7%. Men with an educational attainment of graduate degree enjoy the highest average annual earnings of $113,092, while those with less than high school education earn the least with $18,958. Women with an educational attainment of graduate degree earn the most with the average annual earnings of $71,118, while those with high school diploma education have the smallest earnings of $23,192.
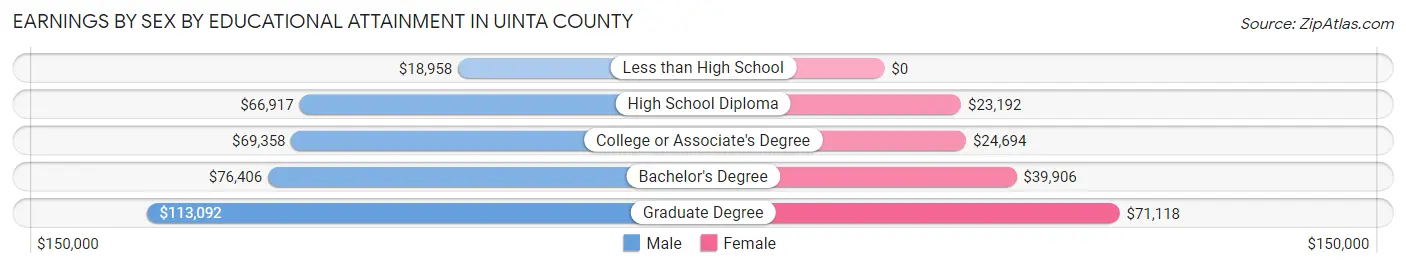
| Educational Attainment | Male Income | Female Income |
| Less than High School | $18,958 | $0 |
| High School Diploma | $66,917 | $23,192 |
| College or Associate's Degree | $69,358 | $24,694 |
| Bachelor's Degree | $76,406 | $39,906 |
| Graduate Degree | $113,092 | $71,118 |
| Total | $68,377 | $25,523 |
Family Income in Uinta County
Family Income Brackets in Uinta County
According to the Uinta County family income data, there are 1,361 families falling into the $100,000 to $149,999 income range, which is the most common income bracket and makes up 26.9% of all families. Conversely, the $10,000 to $14,999 income bracket is the least frequent group with only 10 families (0.2%) belonging to this category.
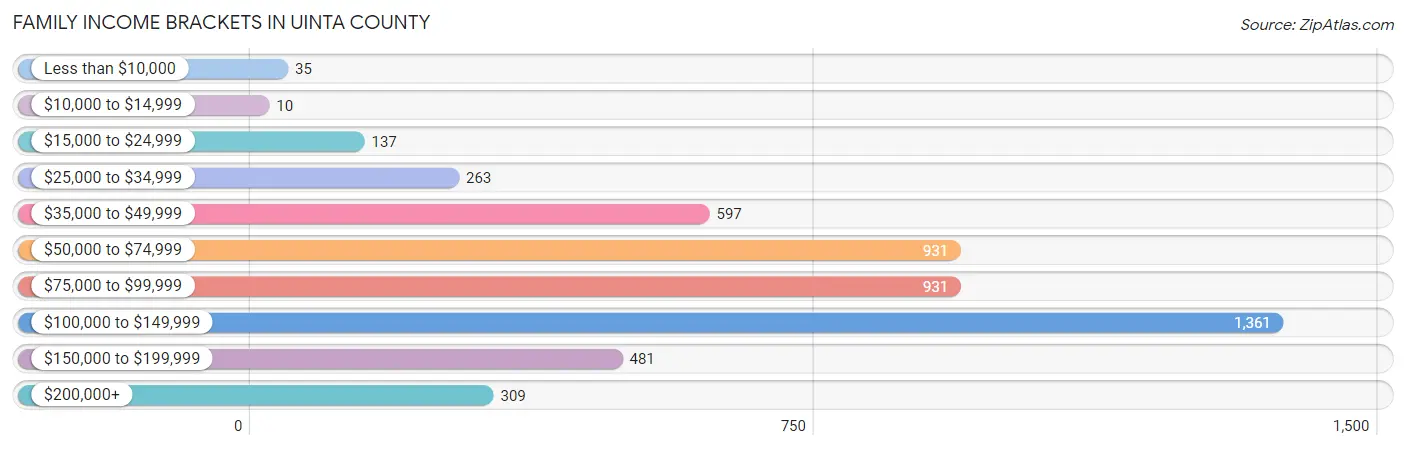
| Income Bracket | # Families | % Families |
| Less than $10,000 | 35 | 0.7% |
| $10,000 to $14,999 | 10 | 0.2% |
| $15,000 to $24,999 | 137 | 2.7% |
| $25,000 to $34,999 | 263 | 5.2% |
| $35,000 to $49,999 | 597 | 11.8% |
| $50,000 to $74,999 | 931 | 18.4% |
| $75,000 to $99,999 | 931 | 18.4% |
| $100,000 to $149,999 | 1,361 | 26.9% |
| $150,000 to $199,999 | 481 | 9.5% |
| $200,000+ | 309 | 6.1% |
Family Income by Famaliy Size in Uinta County
5-person families (533 | 10.5%) account for the highest median family income in Uinta County with $115,625 per family, while 2-person families (2,493 | 49.3%) have the highest median income of $41,909 per family member.
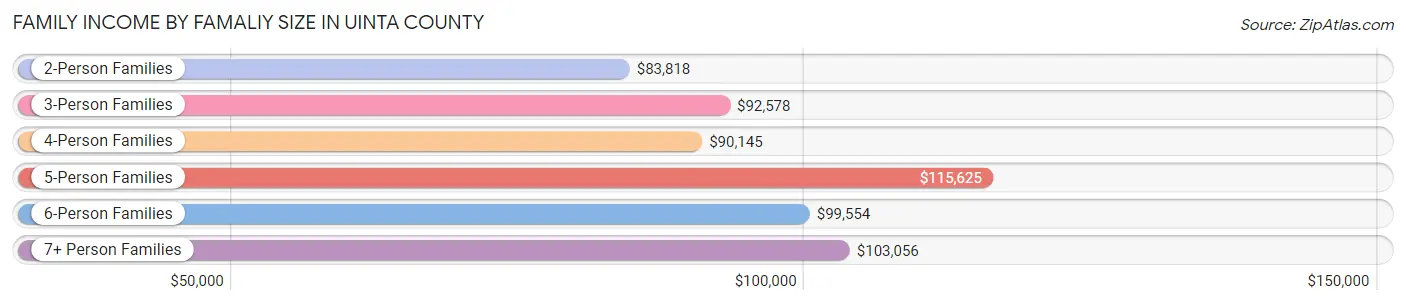
| Income Bracket | # Families | Median Income |
| 2-Person Families | 2,493 (49.3%) | $83,818 |
| 3-Person Families | 785 (15.5%) | $92,578 |
| 4-Person Families | 1,031 (20.4%) | $90,145 |
| 5-Person Families | 533 (10.5%) | $115,625 |
| 6-Person Families | 156 (3.1%) | $99,554 |
| 7+ Person Families | 60 (1.2%) | $103,056 |
| Total | 5,058 (100.0%) | $91,003 |
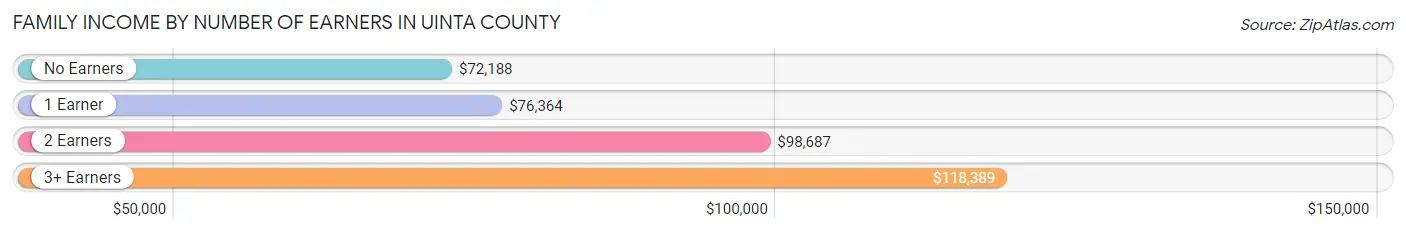
Family Income by Number of Earners in Uinta County
The median family income in Uinta County is $91,003, with families comprising 3+ earners (513) having the highest median family income of $118,389, while families with no earners (675) have the lowest median family income of $72,188, accounting for 10.1% and 13.4% of families, respectively.
| Number of Earners | # Families | Median Income |
| No Earners | 675 (13.4%) | $72,188 |
| 1 Earner | 1,476 (29.2%) | $76,364 |
| 2 Earners | 2,394 (47.3%) | $98,687 |
| 3+ Earners | 513 (10.1%) | $118,389 |
| Total | 5,058 (100.0%) | $91,003 |
Household Income in Uinta County
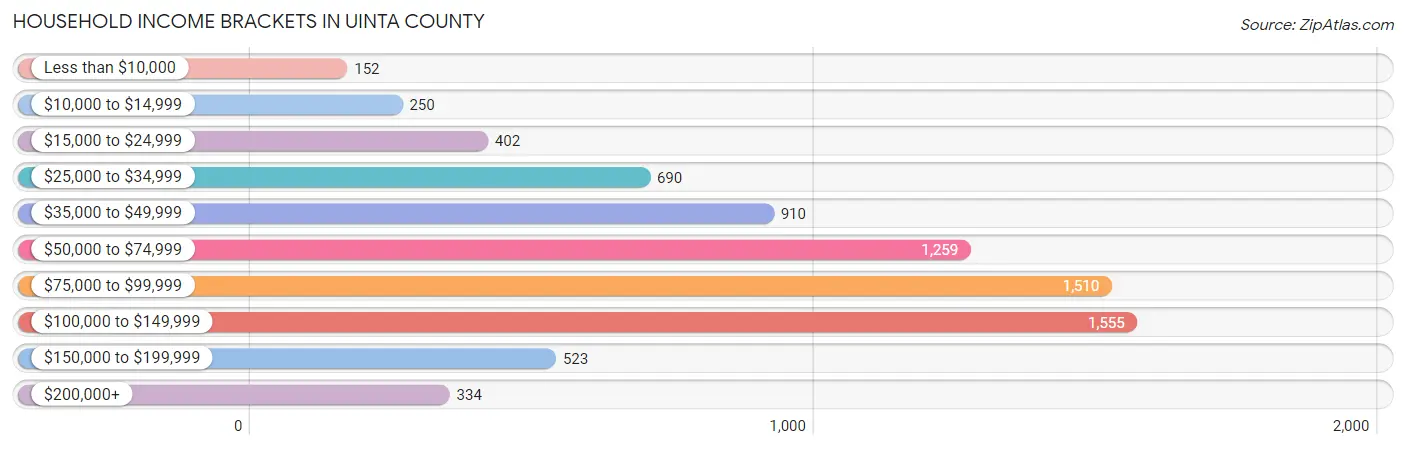
Household Income Brackets in Uinta County
With 1,555 households falling in the category, the $100,000 to $149,999 income range is the most frequent in Uinta County, accounting for 20.5% of all households. In contrast, only 152 households (2.0%) fall into the less than $10,000 income bracket, making it the least populous group.
| Income Bracket | # Households | % Households |
| Less than $10,000 | 152 | 2.0% |
| $10,000 to $14,999 | 250 | 3.3% |
| $15,000 to $24,999 | 402 | 5.3% |
| $25,000 to $34,999 | 690 | 9.1% |
| $35,000 to $49,999 | 910 | 12.0% |
| $50,000 to $74,999 | 1,259 | 16.6% |
| $75,000 to $99,999 | 1,510 | 19.9% |
| $100,000 to $149,999 | 1,555 | 20.5% |
| $150,000 to $199,999 | 523 | 6.9% |
| $200,000+ | 334 | 4.4% |
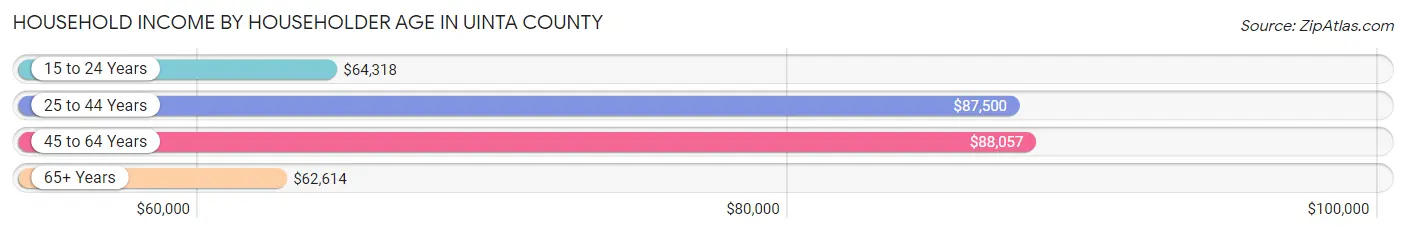
Household Income by Householder Age in Uinta County
The median household income in Uinta County is $78,164, with the highest median household income of $88,057 found in the 45 to 64 years age bracket for the primary householder. A total of 2,928 households (38.6%) fall into this category. Meanwhile, the 65+ years age bracket for the primary householder has the lowest median household income of $62,614, with 1,970 households (26.0%) in this group.
| Income Bracket | # Households | Median Income |
| 15 to 24 Years | 332 (4.4%) | $64,318 |
| 25 to 44 Years | 2,356 (31.1%) | $87,500 |
| 45 to 64 Years | 2,928 (38.6%) | $88,057 |
| 65+ Years | 1,970 (26.0%) | $62,614 |
| Total | 7,586 (100.0%) | $78,164 |
Poverty in Uinta County
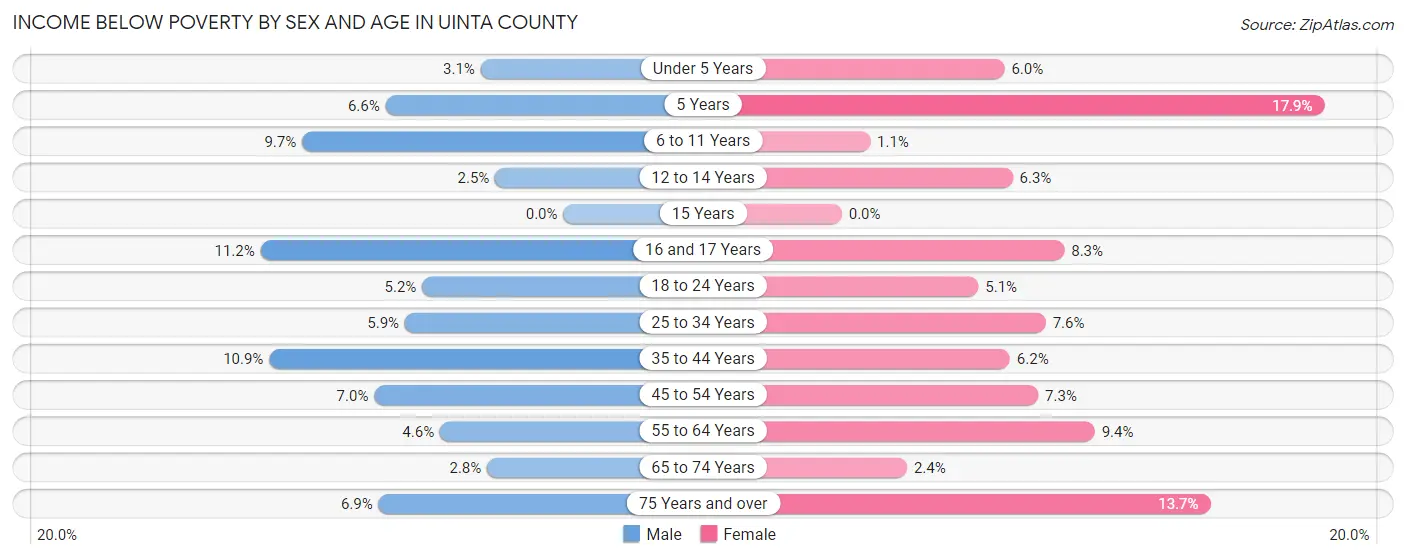
Income Below Poverty by Sex and Age in Uinta County
With 6.5% poverty level for males and 6.6% for females among the residents of Uinta County, 16 and 17 year old males and 5 year old females are the most vulnerable to poverty, with 47 males (11.2%) and 48 females (17.9%) in their respective age groups living below the poverty level.
| Age Bracket | Male | Female |
| Under 5 Years | 20 (3.1%) | 41 (6.0%) |
| 5 Years | 7 (6.6%) | 48 (17.9%) |
| 6 to 11 Years | 105 (9.7%) | 9 (1.1%) |
| 12 to 14 Years | 11 (2.5%) | 31 (6.3%) |
| 15 Years | 0 (0.0%) | 0 (0.0%) |
| 16 and 17 Years | 47 (11.2%) | 18 (8.3%) |
| 18 to 24 Years | 40 (5.2%) | 39 (5.1%) |
| 25 to 34 Years | 70 (5.9%) | 92 (7.6%) |
| 35 to 44 Years | 148 (10.9%) | 85 (6.2%) |
| 45 to 54 Years | 88 (7.0%) | 77 (7.3%) |
| 55 to 64 Years | 59 (4.6%) | 119 (9.4%) |
| 65 to 74 Years | 30 (2.8%) | 25 (2.4%) |
| 75 Years and over | 38 (6.9%) | 68 (13.7%) |
| Total | 663 (6.5%) | 652 (6.6%) |
Income Above Poverty by Sex and Age in Uinta County
According to the poverty statistics in Uinta County, males aged 15 years and females aged 15 years are the age groups that are most secure financially, with 100.0% of males and 100.0% of females in these age groups living above the poverty line.
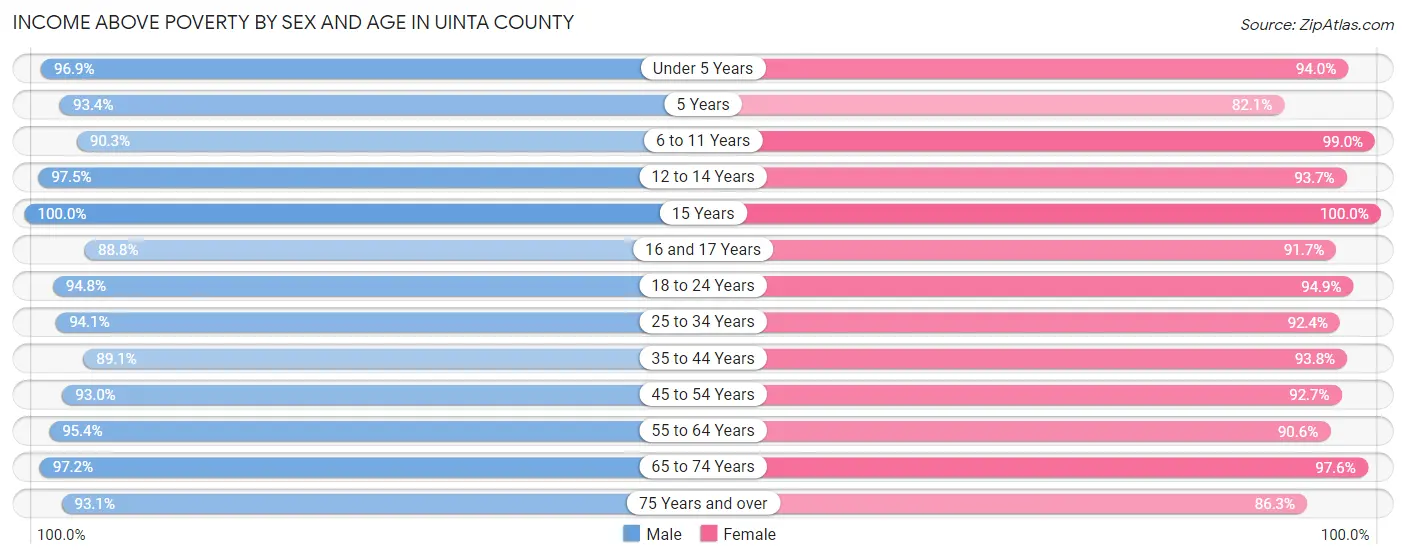
| Age Bracket | Male | Female |
| Under 5 Years | 631 (96.9%) | 638 (94.0%) |
| 5 Years | 99 (93.4%) | 220 (82.1%) |
| 6 to 11 Years | 977 (90.3%) | 845 (99.0%) |
| 12 to 14 Years | 423 (97.5%) | 458 (93.7%) |
| 15 Years | 98 (100.0%) | 227 (100.0%) |
| 16 and 17 Years | 371 (88.8%) | 200 (91.7%) |
| 18 to 24 Years | 724 (94.8%) | 730 (94.9%) |
| 25 to 34 Years | 1,121 (94.1%) | 1,123 (92.4%) |
| 35 to 44 Years | 1,207 (89.1%) | 1,277 (93.8%) |
| 45 to 54 Years | 1,165 (93.0%) | 979 (92.7%) |
| 55 to 64 Years | 1,230 (95.4%) | 1,148 (90.6%) |
| 65 to 74 Years | 1,030 (97.2%) | 1,009 (97.6%) |
| 75 Years and over | 516 (93.1%) | 429 (86.3%) |
| Total | 9,592 (93.5%) | 9,283 (93.4%) |
Income Below Poverty Among Married-Couple Families in Uinta County
The poverty statistics for married-couple families in Uinta County show that 2.3% or 95 of the total 4,175 families live below the poverty line. Families with 3 or 4 children have the highest poverty rate of 8.1%, comprising of 42 families. On the other hand, families with 5 or more children have the lowest poverty rate of 0.0%, which includes 0 families.
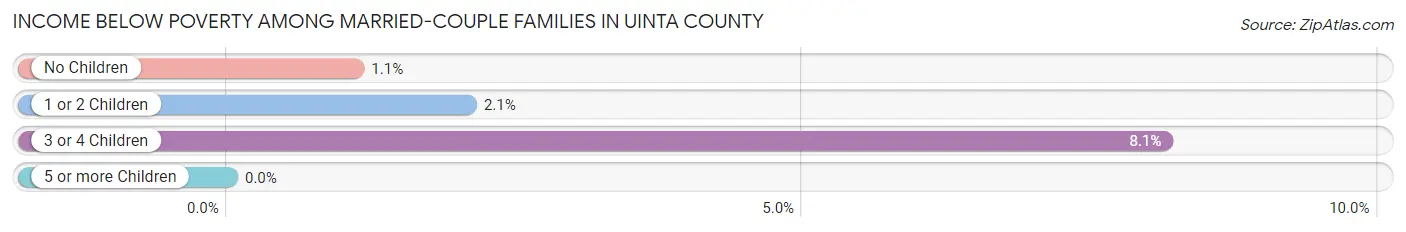
| Children | Above Poverty | Below Poverty |
| No Children | 2,240 (98.9%) | 25 (1.1%) |
| 1 or 2 Children | 1,319 (97.9%) | 28 (2.1%) |
| 3 or 4 Children | 474 (91.9%) | 42 (8.1%) |
| 5 or more Children | 47 (100.0%) | 0 (0.0%) |
| Total | 4,080 (97.7%) | 95 (2.3%) |
Income Below Poverty Among Single-Parent Households in Uinta County
According to the poverty data in Uinta County, 3.9% or 13 single-father households and 3.8% or 21 single-mother households are living below the poverty line. Among single-father households, those with 3 or 4 children have the highest poverty rate, with 8 households (33.3%) experiencing poverty. Likewise, among single-mother households, those with 1 or 2 children have the highest poverty rate, with 14 households (5.3%) falling below the poverty line.
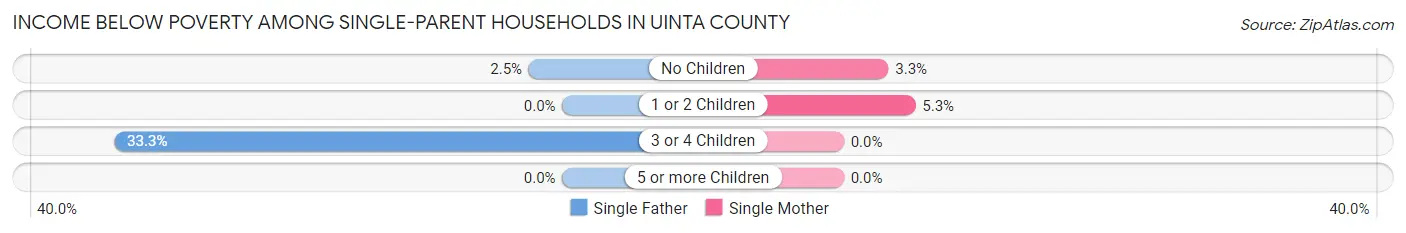
| Children | Single Father | Single Mother |
| No Children | 5 (2.5%) | 7 (3.3%) |
| 1 or 2 Children | 0 (0.0%) | 14 (5.3%) |
| 3 or 4 Children | 8 (33.3%) | 0 (0.0%) |
| 5 or more Children | 0 (0.0%) | 0 (0.0%) |
| Total | 13 (3.9%) | 21 (3.8%) |
Income Below Poverty Among Married-Couple vs Single-Parent Households in Uinta County
The poverty data for Uinta County shows that 95 of the married-couple family households (2.3%) and 34 of the single-parent households (3.8%) are living below the poverty level. Within the married-couple family households, those with 3 or 4 children have the highest poverty rate, with 42 households (8.1%) falling below the poverty line. Among the single-parent households, those with 3 or 4 children have the highest poverty rate, with 8 household (7.8%) living below poverty.
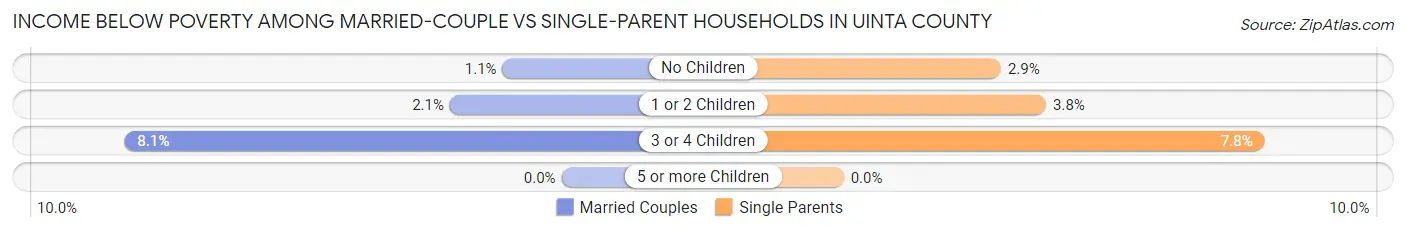
| Children | Married-Couple Families | Single-Parent Households |
| No Children | 25 (1.1%) | 12 (2.9%) |
| 1 or 2 Children | 28 (2.1%) | 14 (3.8%) |
| 3 or 4 Children | 42 (8.1%) | 8 (7.8%) |
| 5 or more Children | 0 (0.0%) | 0 (0.0%) |
| Total | 95 (2.3%) | 34 (3.8%) |
Employment Characteristics in Uinta County
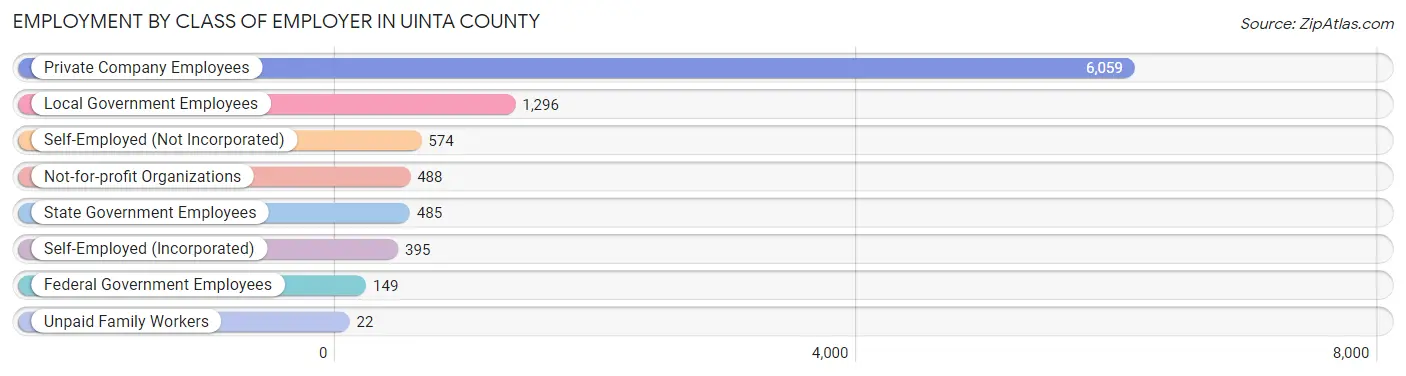
Employment by Class of Employer in Uinta County
Among the 9,468 employed individuals in Uinta County, private company employees (6,059 | 64.0%), local government employees (1,296 | 13.7%), and self-employed (not incorporated) (574 | 6.1%) make up the most common classes of employment.
| Employer Class | # Employees | % Employees |
| Private Company Employees | 6,059 | 64.0% |
| Self-Employed (Incorporated) | 395 | 4.2% |
| Self-Employed (Not Incorporated) | 574 | 6.1% |
| Not-for-profit Organizations | 488 | 5.1% |
| Local Government Employees | 1,296 | 13.7% |
| State Government Employees | 485 | 5.1% |
| Federal Government Employees | 149 | 1.6% |
| Unpaid Family Workers | 22 | 0.2% |
| Total | 9,468 | 100.0% |
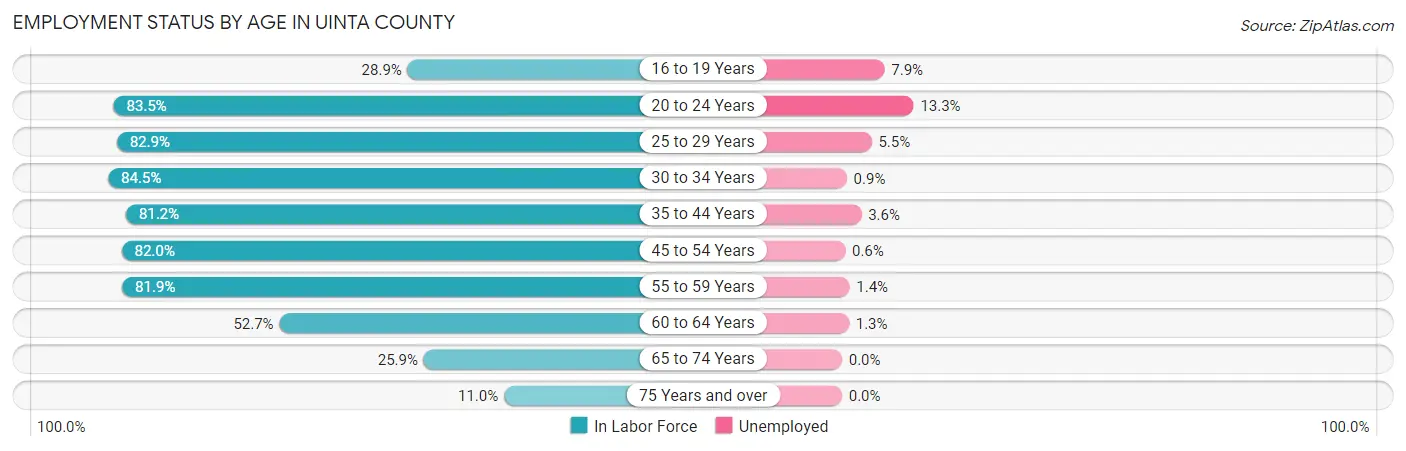
Employment Status by Age in Uinta County
According to the labor force statistics for Uinta County, out of the total population over 16 years of age (15,484), 64.0% or 9,910 individuals are in the labor force, with 3.4% or 337 of them unemployed. The age group with the highest labor force participation rate is 30 to 34 years, with 84.5% or 1,079 individuals in the labor force. Within the labor force, the 20 to 24 years age range has the highest percentage of unemployed individuals, with 13.3% or 139 of them being unemployed.
| Age Bracket | In Labor Force | Unemployed |
| 16 to 19 Years | 277 (28.9%) | 22 (7.9%) |
| 20 to 24 Years | 1,045 (83.5%) | 139 (13.3%) |
| 25 to 29 Years | 960 (82.9%) | 53 (5.5%) |
| 30 to 34 Years | 1,079 (84.5%) | 10 (0.9%) |
| 35 to 44 Years | 2,222 (81.2%) | 80 (3.6%) |
| 45 to 54 Years | 1,909 (82.0%) | 11 (0.6%) |
| 55 to 59 Years | 1,120 (81.9%) | 16 (1.4%) |
| 60 to 64 Years | 635 (52.7%) | 8 (1.3%) |
| 65 to 74 Years | 543 (25.9%) | 0 (0.0%) |
| 75 Years and over | 122 (11.0%) | 0 (0.0%) |
| Total | 9,910 (64.0%) | 337 (3.4%) |
Employment Status by Educational Attainment in Uinta County
According to labor force statistics for Uinta County, 78.7% of individuals (7,926) out of the total population between 25 and 64 years of age (10,071) are in the labor force, with 2.2% or 174 of them being unemployed. The group with the highest labor force participation rate are those with the educational attainment of college / associate degree, with 82.2% or 3,168 individuals in the labor force. Within the labor force, individuals with less than high school education have the highest percentage of unemployment, with 10.7% or 28 of them being unemployed.

| Educational Attainment | In Labor Force | Unemployed |
| Less than High School | 261 (51.5%) | 54 (10.7%) |
| High School Diploma | 2,972 (78.3%) | 87 (2.3%) |
| College / Associate Degree | 3,168 (82.2%) | 77 (2.0%) |
| Bachelor's Degree or higher | 1,524 (79.6%) | 23 (1.2%) |
| Total | 7,926 (78.7%) | 222 (2.2%) |
Employment Occupations by Sex in Uinta County
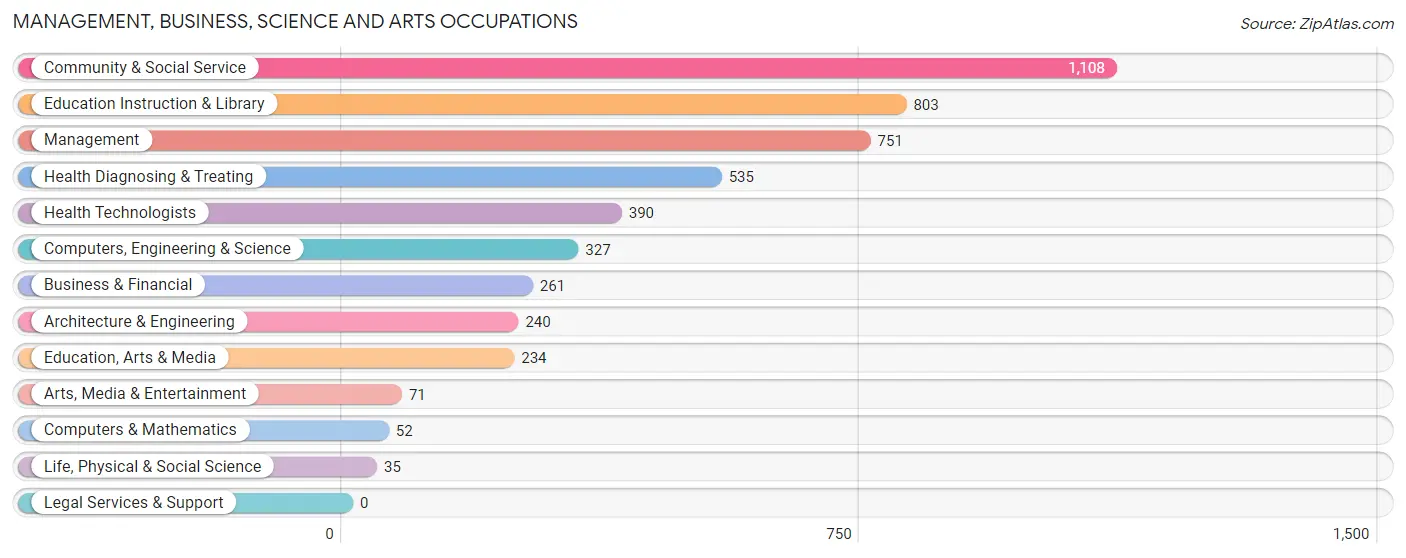
Management, Business, Science and Arts Occupations
The most common Management, Business, Science and Arts occupations in Uinta County are Community & Social Service (1,108 | 11.6%), Education Instruction & Library (803 | 8.4%), Management (751 | 7.9%), Health Diagnosing & Treating (535 | 5.6%), and Health Technologists (390 | 4.1%).
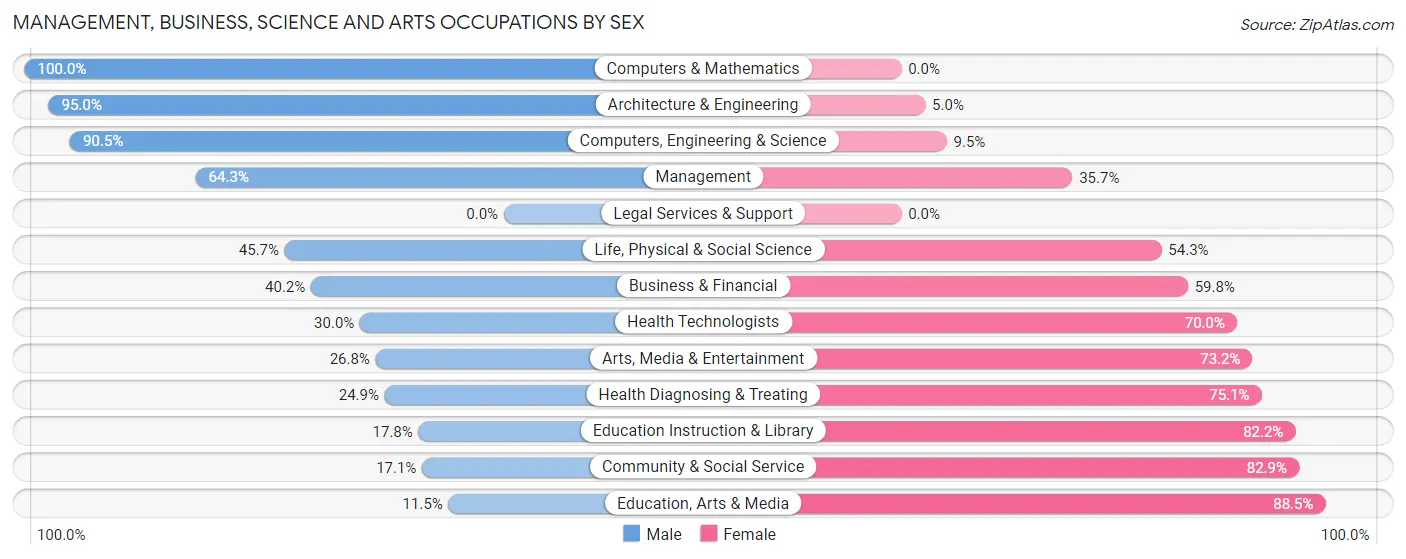
Management, Business, Science and Arts Occupations by Sex
Within the Management, Business, Science and Arts occupations in Uinta County, the most male-oriented occupations are Computers & Mathematics (100.0%), Architecture & Engineering (95.0%), and Computers, Engineering & Science (90.5%), while the most female-oriented occupations are Education, Arts & Media (88.5%), Community & Social Service (82.9%), and Education Instruction & Library (82.2%).
| Occupation | Male | Female |
| Management | 483 (64.3%) | 268 (35.7%) |
| Business & Financial | 105 (40.2%) | 156 (59.8%) |
| Computers, Engineering & Science | 296 (90.5%) | 31 (9.5%) |
| Computers & Mathematics | 52 (100.0%) | 0 (0.0%) |
| Architecture & Engineering | 228 (95.0%) | 12 (5.0%) |
| Life, Physical & Social Science | 16 (45.7%) | 19 (54.3%) |
| Community & Social Service | 189 (17.1%) | 919 (82.9%) |
| Education, Arts & Media | 27 (11.5%) | 207 (88.5%) |
| Legal Services & Support | 0 (0.0%) | 0 (0.0%) |
| Education Instruction & Library | 143 (17.8%) | 660 (82.2%) |
| Arts, Media & Entertainment | 19 (26.8%) | 52 (73.2%) |
| Health Diagnosing & Treating | 133 (24.9%) | 402 (75.1%) |
| Health Technologists | 117 (30.0%) | 273 (70.0%) |
| Total (Category) | 1,206 (40.4%) | 1,776 (59.6%) |
| Total (Overall) | 5,009 (52.4%) | 4,553 (47.6%) |
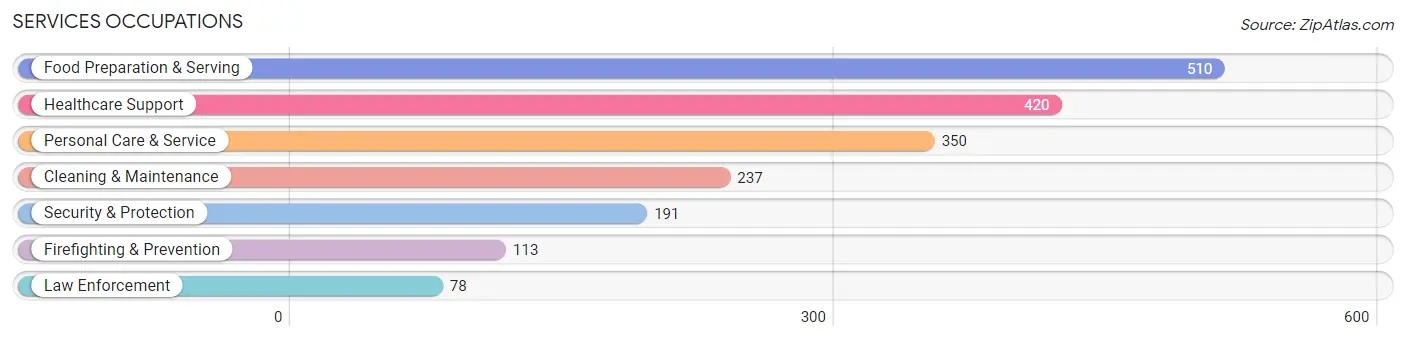
Services Occupations
The most common Services occupations in Uinta County are Food Preparation & Serving (510 | 5.3%), Healthcare Support (420 | 4.4%), Personal Care & Service (350 | 3.7%), Cleaning & Maintenance (237 | 2.5%), and Security & Protection (191 | 2.0%).
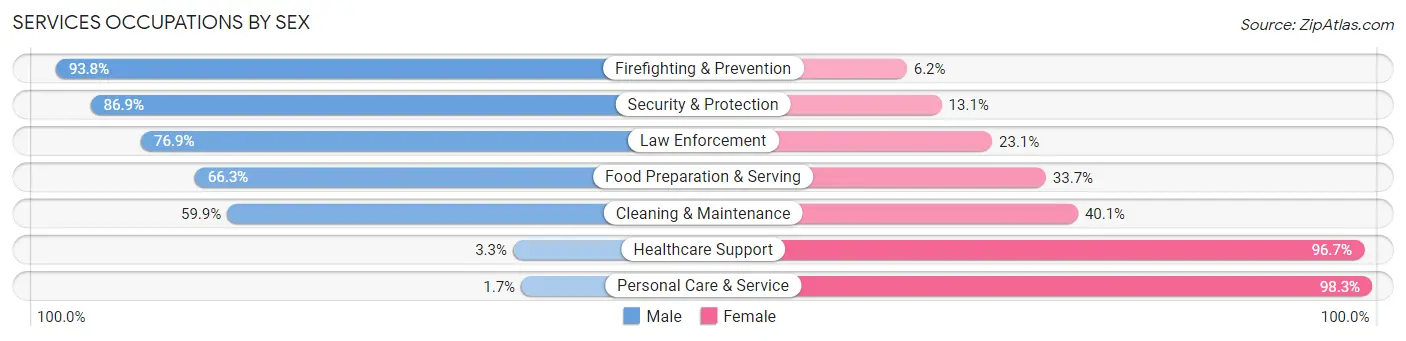
Services Occupations by Sex
Within the Services occupations in Uinta County, the most male-oriented occupations are Firefighting & Prevention (93.8%), Security & Protection (86.9%), and Law Enforcement (76.9%), while the most female-oriented occupations are Personal Care & Service (98.3%), Healthcare Support (96.7%), and Cleaning & Maintenance (40.1%).
| Occupation | Male | Female |
| Healthcare Support | 14 (3.3%) | 406 (96.7%) |
| Security & Protection | 166 (86.9%) | 25 (13.1%) |
| Firefighting & Prevention | 106 (93.8%) | 7 (6.2%) |
| Law Enforcement | 60 (76.9%) | 18 (23.1%) |
| Food Preparation & Serving | 338 (66.3%) | 172 (33.7%) |
| Cleaning & Maintenance | 142 (59.9%) | 95 (40.1%) |
| Personal Care & Service | 6 (1.7%) | 344 (98.3%) |
| Total (Category) | 666 (39.0%) | 1,042 (61.0%) |
| Total (Overall) | 5,009 (52.4%) | 4,553 (47.6%) |
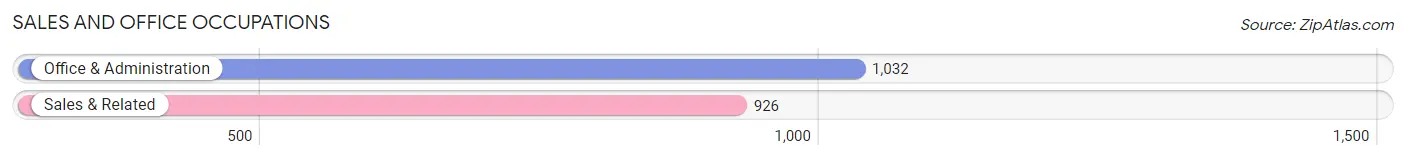
Sales and Office Occupations
The most common Sales and Office occupations in Uinta County are Office & Administration (1,032 | 10.8%), and Sales & Related (926 | 9.7%).
Sales and Office Occupations by Sex
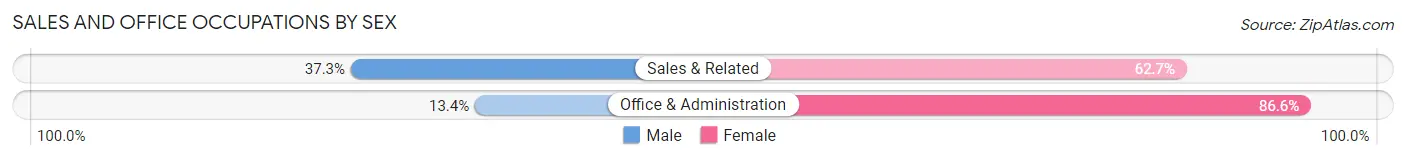
| Occupation | Male | Female |
| Sales & Related | 345 (37.3%) | 581 (62.7%) |
| Office & Administration | 138 (13.4%) | 894 (86.6%) |
| Total (Category) | 483 (24.7%) | 1,475 (75.3%) |
| Total (Overall) | 5,009 (52.4%) | 4,553 (47.6%) |
Natural Resources, Construction and Maintenance Occupations
The most common Natural Resources, Construction and Maintenance occupations in Uinta County are Construction & Extraction (950 | 9.9%), Installation, Maintenance & Repair (622 | 6.5%), and Farming, Fishing & Forestry (90 | 0.9%).
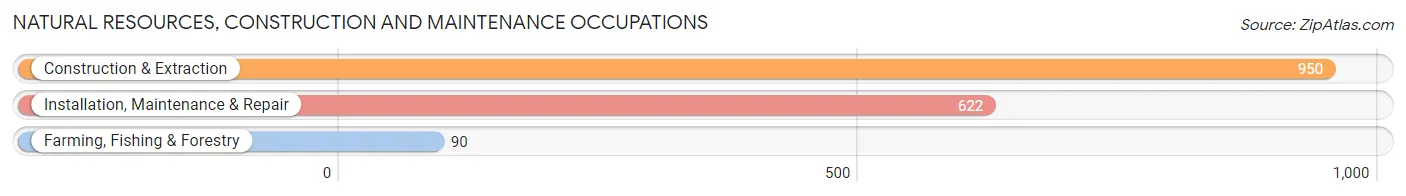
Natural Resources, Construction and Maintenance Occupations by Sex
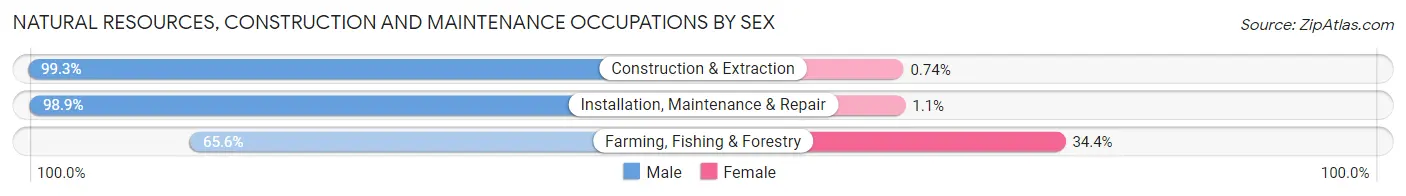
| Occupation | Male | Female |
| Farming, Fishing & Forestry | 59 (65.6%) | 31 (34.4%) |
| Construction & Extraction | 943 (99.3%) | 7 (0.7%) |
| Installation, Maintenance & Repair | 615 (98.9%) | 7 (1.1%) |
| Total (Category) | 1,617 (97.3%) | 45 (2.7%) |
| Total (Overall) | 5,009 (52.4%) | 4,553 (47.6%) |
Production, Transportation and Moving Occupations
The most common Production, Transportation and Moving occupations in Uinta County are Transportation (593 | 6.2%), Production (373 | 3.9%), and Material Moving (286 | 3.0%).
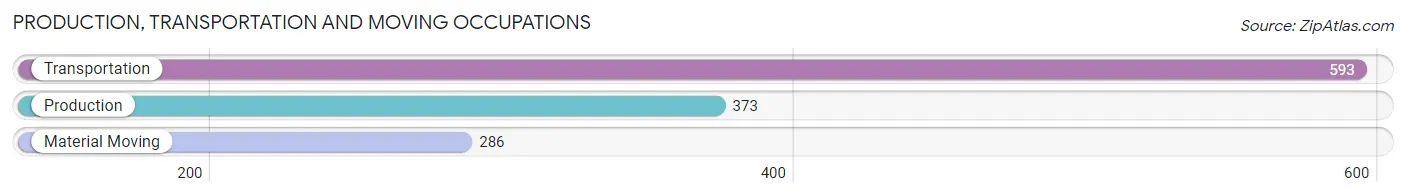
Production, Transportation and Moving Occupations by Sex
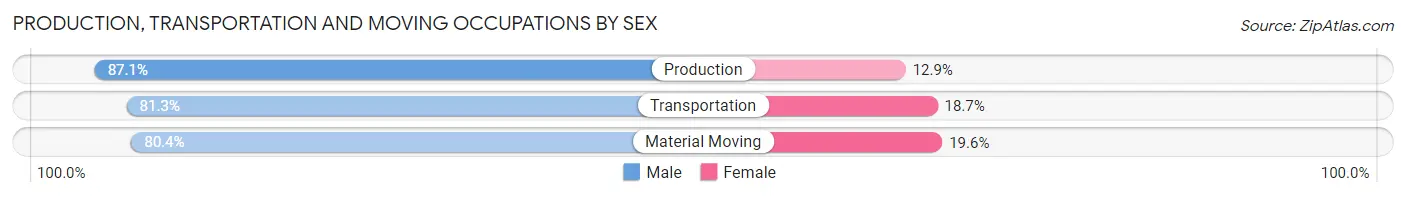
| Occupation | Male | Female |
| Production | 325 (87.1%) | 48 (12.9%) |
| Transportation | 482 (81.3%) | 111 (18.7%) |
| Material Moving | 230 (80.4%) | 56 (19.6%) |
| Total (Category) | 1,037 (82.8%) | 215 (17.2%) |
| Total (Overall) | 5,009 (52.4%) | 4,553 (47.6%) |
Employment Industries by Sex in Uinta County
Employment Industries in Uinta County
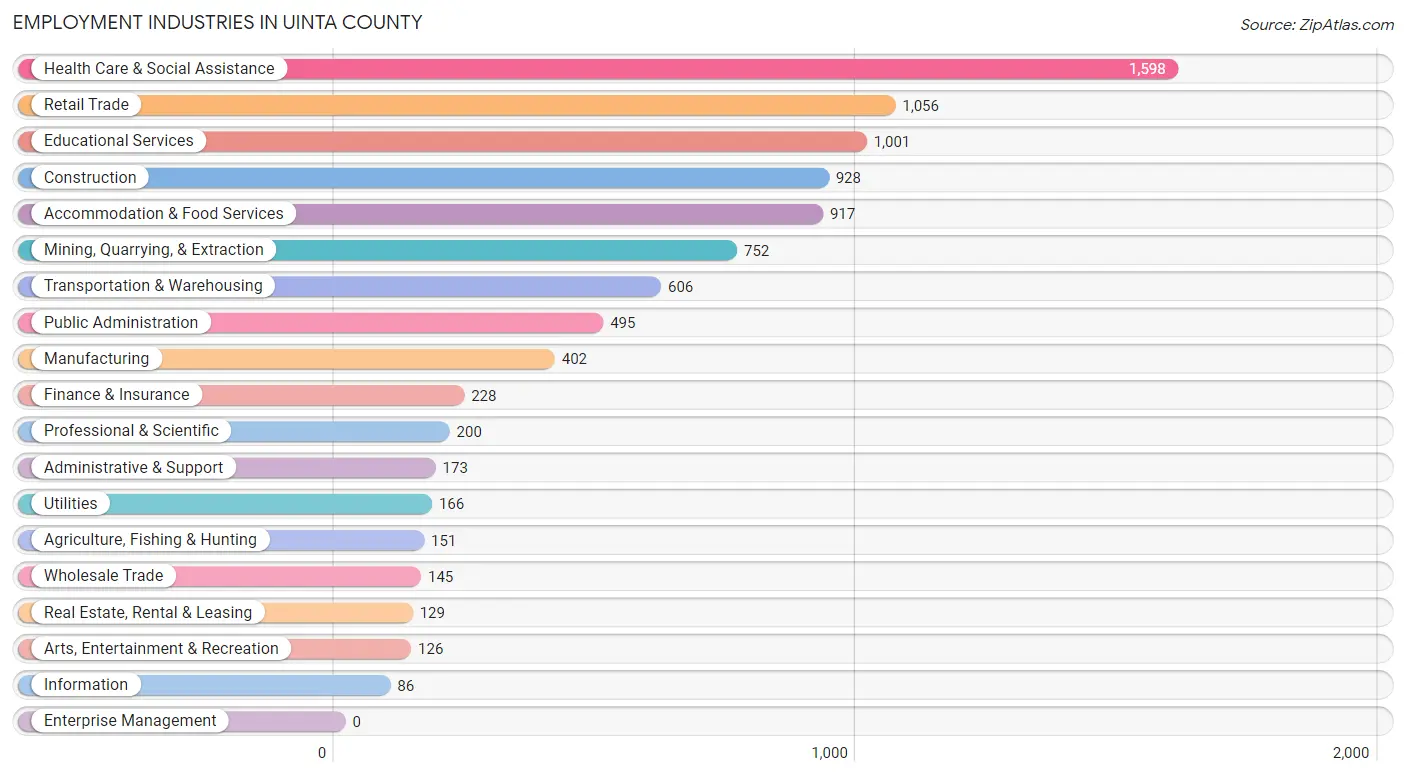
The major employment industries in Uinta County include Health Care & Social Assistance (1,598 | 16.7%), Retail Trade (1,056 | 11.0%), Educational Services (1,001 | 10.5%), Construction (928 | 9.7%), and Accommodation & Food Services (917 | 9.6%).
Employment Industries by Sex in Uinta County
The Uinta County industries that see more men than women are Utilities (100.0%), Mining, Quarrying, & Extraction (98.5%), and Wholesale Trade (93.1%), whereas the industries that tend to have a higher number of women are Health Care & Social Assistance (85.0%), Finance & Insurance (84.2%), and Real Estate, Rental & Leasing (79.1%).
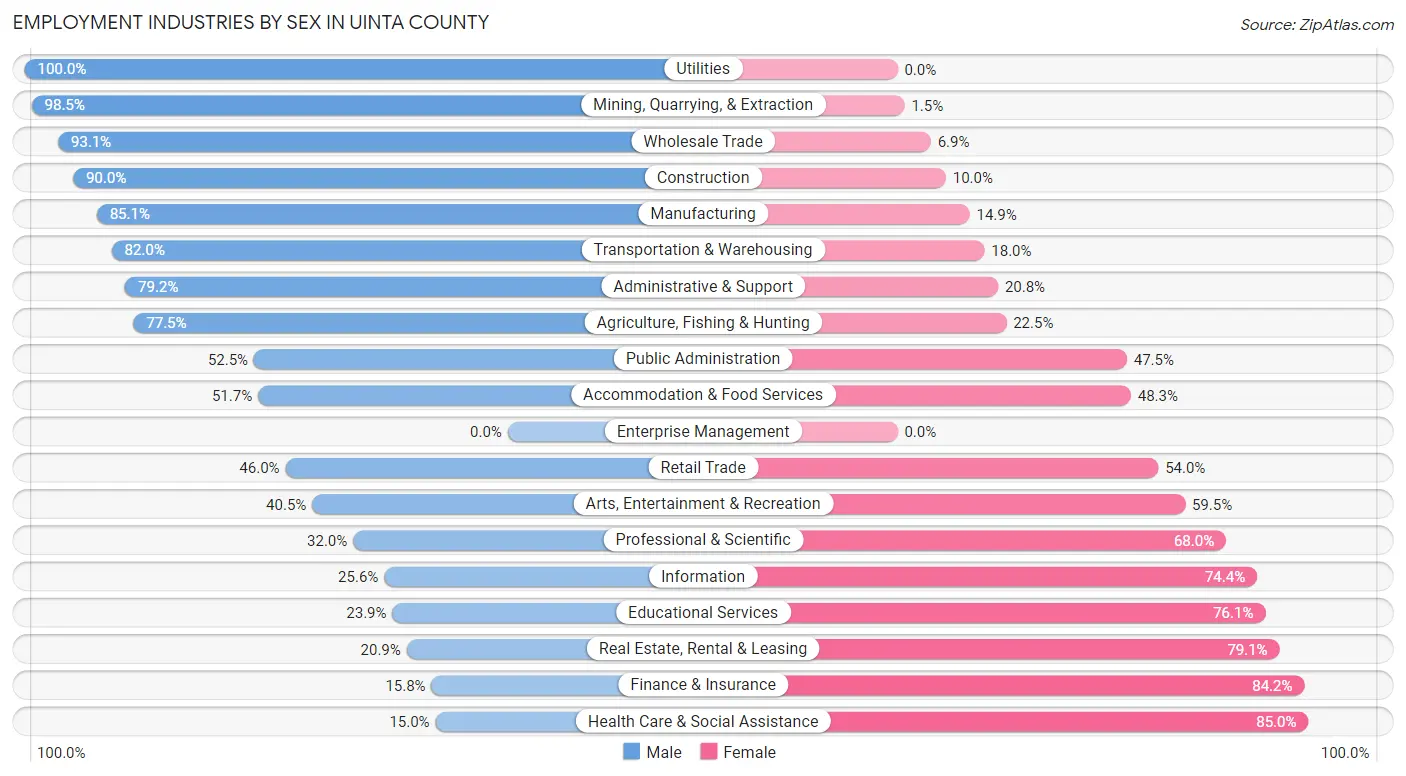
| Industry | Male | Female |
| Agriculture, Fishing & Hunting | 117 (77.5%) | 34 (22.5%) |
| Mining, Quarrying, & Extraction | 741 (98.5%) | 11 (1.5%) |
| Construction | 835 (90.0%) | 93 (10.0%) |
| Manufacturing | 342 (85.1%) | 60 (14.9%) |
| Wholesale Trade | 135 (93.1%) | 10 (6.9%) |
| Retail Trade | 486 (46.0%) | 570 (54.0%) |
| Transportation & Warehousing | 497 (82.0%) | 109 (18.0%) |
| Utilities | 166 (100.0%) | 0 (0.0%) |
| Information | 22 (25.6%) | 64 (74.4%) |
| Finance & Insurance | 36 (15.8%) | 192 (84.2%) |
| Real Estate, Rental & Leasing | 27 (20.9%) | 102 (79.1%) |
| Professional & Scientific | 64 (32.0%) | 136 (68.0%) |
| Enterprise Management | 0 (0.0%) | 0 (0.0%) |
| Administrative & Support | 137 (79.2%) | 36 (20.8%) |
| Educational Services | 239 (23.9%) | 762 (76.1%) |
| Health Care & Social Assistance | 239 (15.0%) | 1,359 (85.0%) |
| Arts, Entertainment & Recreation | 51 (40.5%) | 75 (59.5%) |
| Accommodation & Food Services | 474 (51.7%) | 443 (48.3%) |
| Public Administration | 260 (52.5%) | 235 (47.5%) |
| Total | 5,009 (52.4%) | 4,553 (47.6%) |
Education in Uinta County
School Enrollment in Uinta County
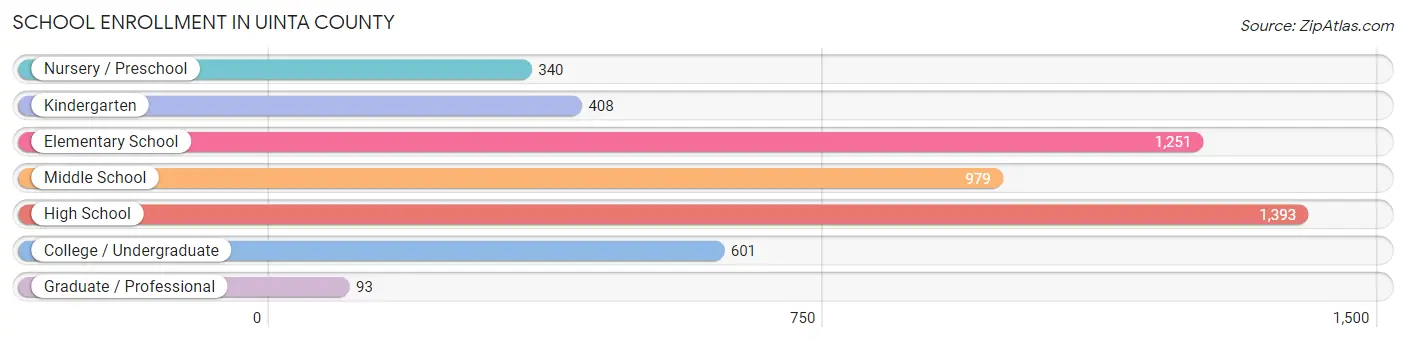
The most common levels of schooling among the 5,065 students in Uinta County are high school (1,393 | 27.5%), elementary school (1,251 | 24.7%), and middle school (979 | 19.3%).
| School Level | # Students | % Students |
| Nursery / Preschool | 340 | 6.7% |
| Kindergarten | 408 | 8.1% |
| Elementary School | 1,251 | 24.7% |
| Middle School | 979 | 19.3% |
| High School | 1,393 | 27.5% |
| College / Undergraduate | 601 | 11.9% |
| Graduate / Professional | 93 | 1.8% |
| Total | 5,065 | 100.0% |
School Enrollment by Age by Funding Source in Uinta County
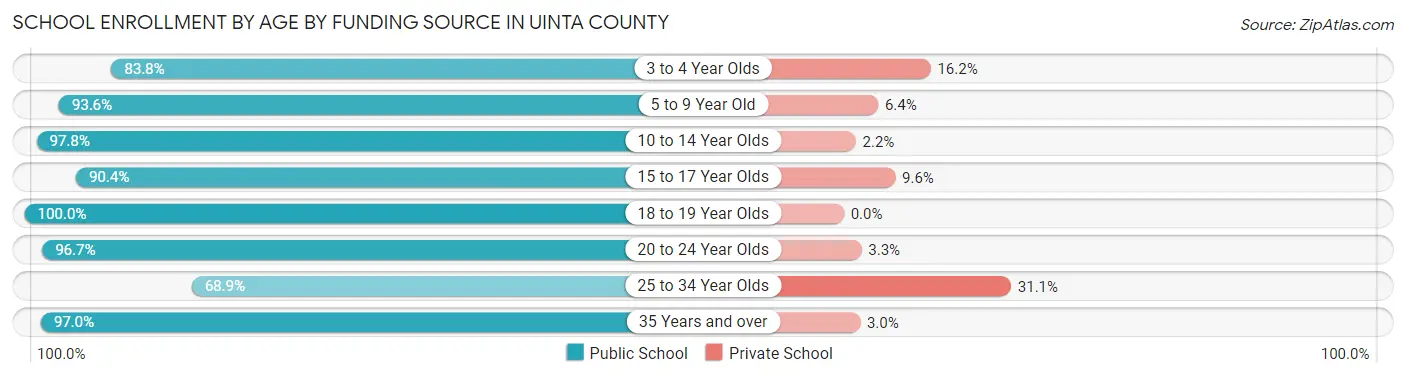
Out of a total of 5,065 students who are enrolled in schools in Uinta County, 355 (7.0%) attend a private institution, while the remaining 4,710 (93.0%) are enrolled in public schools. The age group of 25 to 34 year olds has the highest likelihood of being enrolled in private schools, with 85 (31.1% in the age bracket) enrolled. Conversely, the age group of 18 to 19 year olds has the lowest likelihood of being enrolled in a private school, with 127 (100.0% in the age bracket) attending a public institution.
| Age Bracket | Public School | Private School |
| 3 to 4 Year Olds | 140 (83.8%) | 27 (16.2%) |
| 5 to 9 Year Old | 1,583 (93.6%) | 108 (6.4%) |
| 10 to 14 Year Olds | 1,404 (97.8%) | 32 (2.2%) |
| 15 to 17 Year Olds | 868 (90.4%) | 92 (9.6%) |
| 18 to 19 Year Olds | 127 (100.0%) | 0 (0.0%) |
| 20 to 24 Year Olds | 206 (96.7%) | 7 (3.3%) |
| 25 to 34 Year Olds | 188 (68.9%) | 85 (31.1%) |
| 35 Years and over | 192 (97.0%) | 6 (3.0%) |
| Total | 4,710 (93.0%) | 355 (7.0%) |
Educational Attainment by Field of Study in Uinta County
Education (609 | 21.7%), science & technology (333 | 11.8%), bio, nature & agricultural (317 | 11.3%), business (298 | 10.6%), and psychology (210 | 7.5%) are the most common fields of study among 2,811 individuals in Uinta County who have obtained a bachelor's degree or higher.
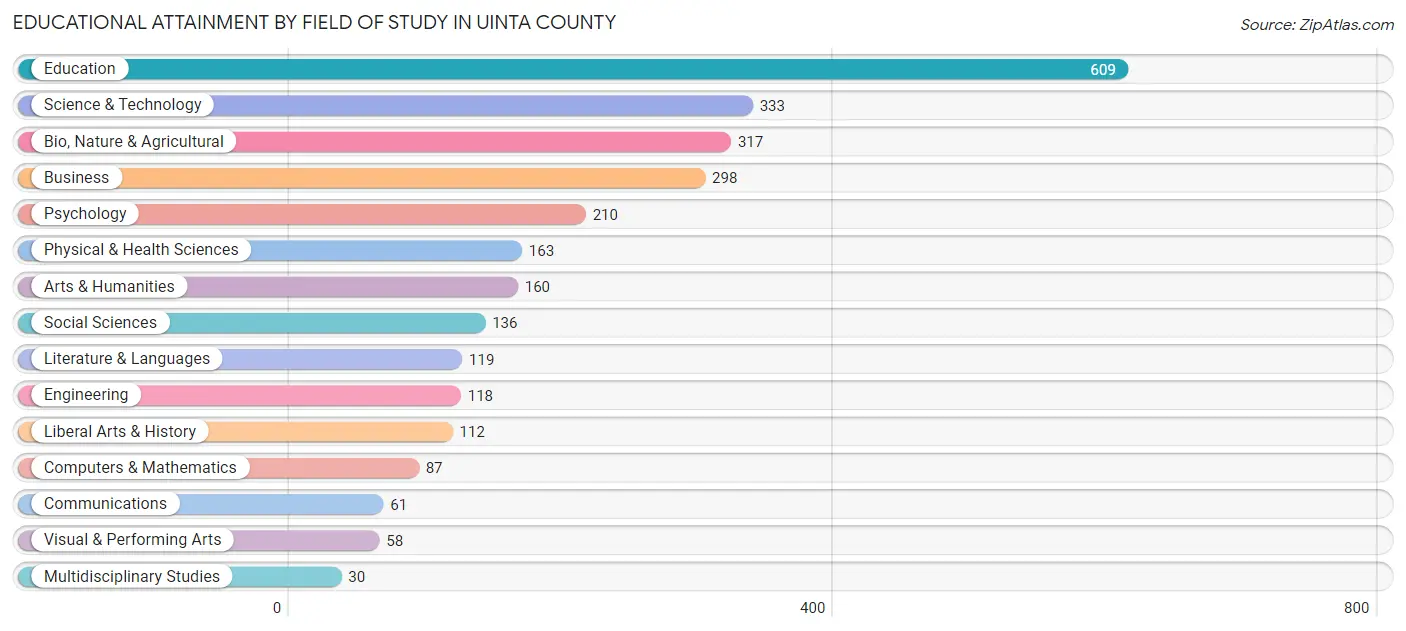
| Field of Study | # Graduates | % Graduates |
| Computers & Mathematics | 87 | 3.1% |
| Bio, Nature & Agricultural | 317 | 11.3% |
| Physical & Health Sciences | 163 | 5.8% |
| Psychology | 210 | 7.5% |
| Social Sciences | 136 | 4.8% |
| Engineering | 118 | 4.2% |
| Multidisciplinary Studies | 30 | 1.1% |
| Science & Technology | 333 | 11.8% |
| Business | 298 | 10.6% |
| Education | 609 | 21.7% |
| Literature & Languages | 119 | 4.2% |
| Liberal Arts & History | 112 | 4.0% |
| Visual & Performing Arts | 58 | 2.1% |
| Communications | 61 | 2.2% |
| Arts & Humanities | 160 | 5.7% |
| Total | 2,811 | 100.0% |
Transportation & Commute in Uinta County
Vehicle Availability by Sex in Uinta County
The most prevalent vehicle ownership categories in Uinta County are males with 2 vehicles (1,902, accounting for 38.2%) and females with 2 vehicles (1,633, making up 42.5%).
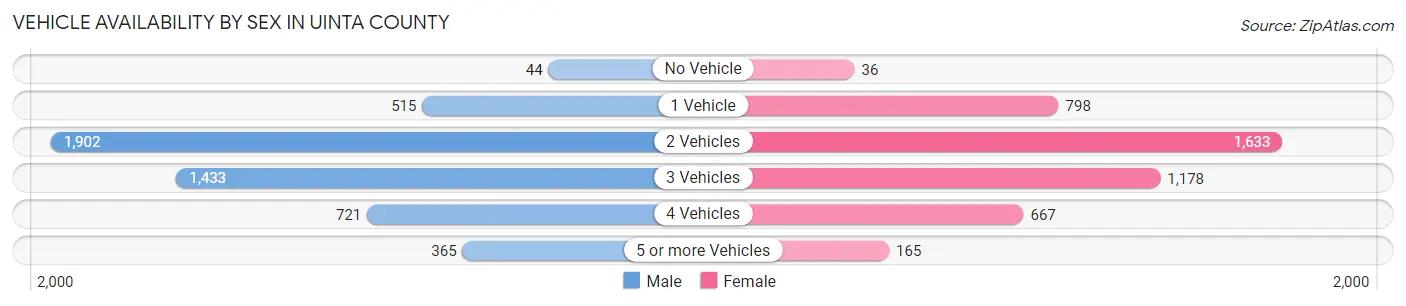
| Vehicles Available | Male | Female |
| No Vehicle | 44 (0.9%) | 36 (0.8%) |
| 1 Vehicle | 515 (10.3%) | 798 (17.8%) |
| 2 Vehicles | 1,902 (38.2%) | 1,633 (36.5%) |
| 3 Vehicles | 1,433 (28.8%) | 1,178 (26.3%) |
| 4 Vehicles | 721 (14.5%) | 667 (14.9%) |
| 5 or more Vehicles | 365 (7.3%) | 165 (3.7%) |
| Total | 4,980 (100.0%) | 4,477 (100.0%) |
Commute Time in Uinta County
The most frequently occuring commute durations in Uinta County are 5 to 9 minutes (2,697 commuters, 29.9%), 10 to 14 minutes (2,288 commuters, 25.4%), and less than 5 minutes (883 commuters, 9.8%).
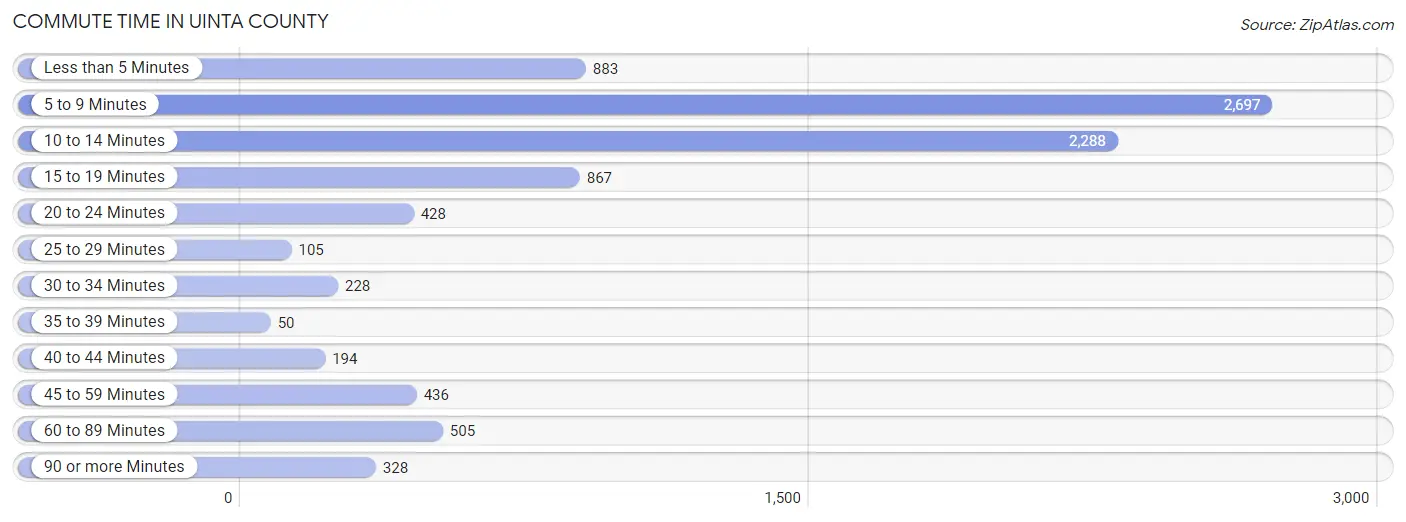
| Commute Time | # Commuters | % Commuters |
| Less than 5 Minutes | 883 | 9.8% |
| 5 to 9 Minutes | 2,697 | 29.9% |
| 10 to 14 Minutes | 2,288 | 25.4% |
| 15 to 19 Minutes | 867 | 9.6% |
| 20 to 24 Minutes | 428 | 4.8% |
| 25 to 29 Minutes | 105 | 1.2% |
| 30 to 34 Minutes | 228 | 2.5% |
| 35 to 39 Minutes | 50 | 0.6% |
| 40 to 44 Minutes | 194 | 2.1% |
| 45 to 59 Minutes | 436 | 4.8% |
| 60 to 89 Minutes | 505 | 5.6% |
| 90 or more Minutes | 328 | 3.6% |
Commute Time by Sex in Uinta County
The most common commute times in Uinta County are 5 to 9 minutes (1,309 commuters, 27.5%) for males and 5 to 9 minutes (1,388 commuters, 32.7%) for females.
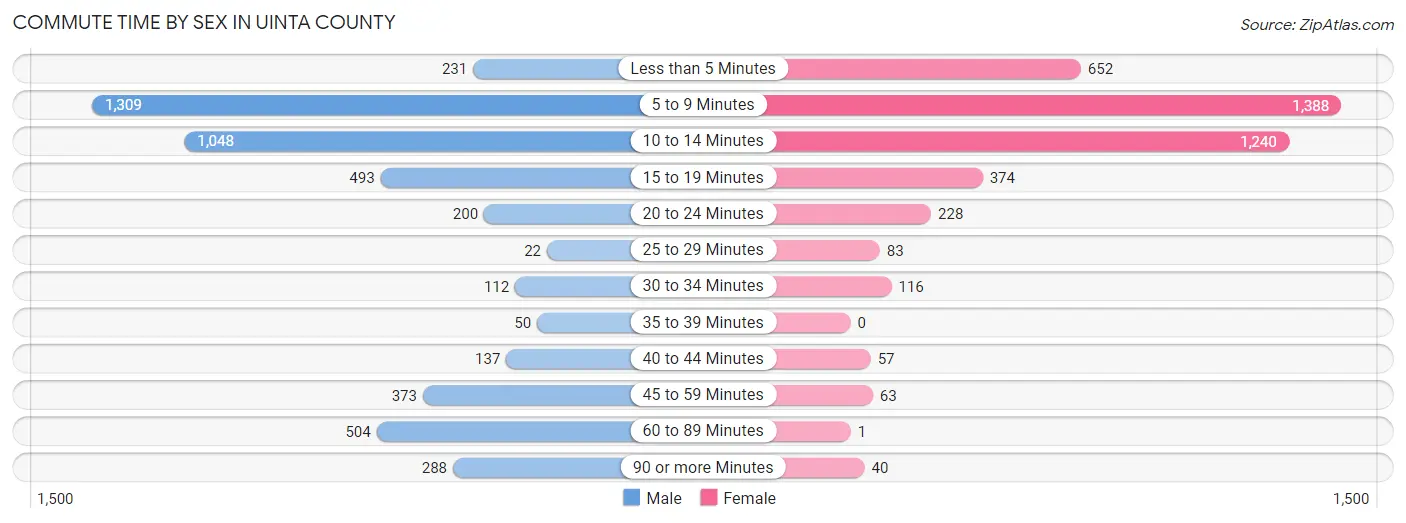
| Commute Time | Male | Female |
| Less than 5 Minutes | 231 (4.9%) | 652 (15.4%) |
| 5 to 9 Minutes | 1,309 (27.5%) | 1,388 (32.7%) |
| 10 to 14 Minutes | 1,048 (22.0%) | 1,240 (29.2%) |
| 15 to 19 Minutes | 493 (10.3%) | 374 (8.8%) |
| 20 to 24 Minutes | 200 (4.2%) | 228 (5.4%) |
| 25 to 29 Minutes | 22 (0.5%) | 83 (2.0%) |
| 30 to 34 Minutes | 112 (2.4%) | 116 (2.7%) |
| 35 to 39 Minutes | 50 (1.1%) | 0 (0.0%) |
| 40 to 44 Minutes | 137 (2.9%) | 57 (1.3%) |
| 45 to 59 Minutes | 373 (7.8%) | 63 (1.5%) |
| 60 to 89 Minutes | 504 (10.6%) | 1 (0.0%) |
| 90 or more Minutes | 288 (6.0%) | 40 (0.9%) |
Time of Departure to Work by Sex in Uinta County
The most frequent times of departure to work in Uinta County are 5:30 AM to 5:59 AM (677, 14.2%) for males and 7:30 AM to 7:59 AM (774, 18.2%) for females.
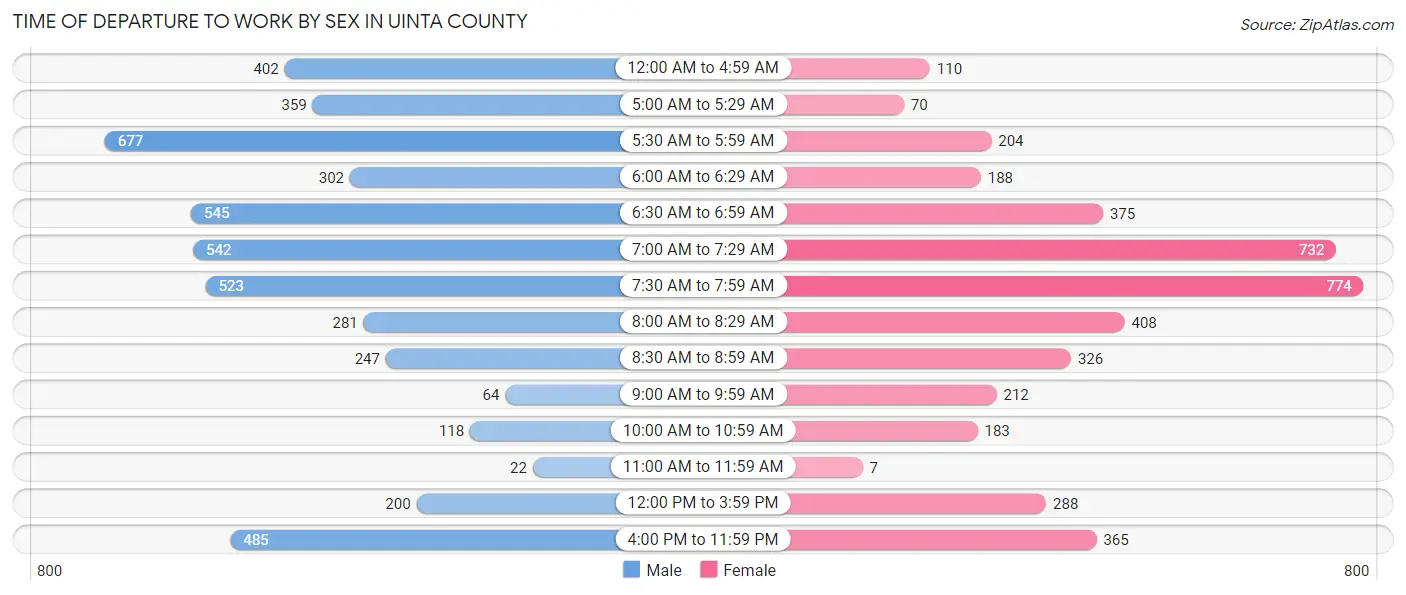
| Time of Departure | Male | Female |
| 12:00 AM to 4:59 AM | 402 (8.4%) | 110 (2.6%) |
| 5:00 AM to 5:29 AM | 359 (7.5%) | 70 (1.7%) |
| 5:30 AM to 5:59 AM | 677 (14.2%) | 204 (4.8%) |
| 6:00 AM to 6:29 AM | 302 (6.3%) | 188 (4.4%) |
| 6:30 AM to 6:59 AM | 545 (11.4%) | 375 (8.8%) |
| 7:00 AM to 7:29 AM | 542 (11.4%) | 732 (17.3%) |
| 7:30 AM to 7:59 AM | 523 (11.0%) | 774 (18.2%) |
| 8:00 AM to 8:29 AM | 281 (5.9%) | 408 (9.6%) |
| 8:30 AM to 8:59 AM | 247 (5.2%) | 326 (7.7%) |
| 9:00 AM to 9:59 AM | 64 (1.3%) | 212 (5.0%) |
| 10:00 AM to 10:59 AM | 118 (2.5%) | 183 (4.3%) |
| 11:00 AM to 11:59 AM | 22 (0.5%) | 7 (0.2%) |
| 12:00 PM to 3:59 PM | 200 (4.2%) | 288 (6.8%) |
| 4:00 PM to 11:59 PM | 485 (10.2%) | 365 (8.6%) |
| Total | 4,767 (100.0%) | 4,242 (100.0%) |
Housing Occupancy in Uinta County
Occupancy by Ownership in Uinta County
Of the total 7,586 dwellings in Uinta County, owner-occupied units account for 5,914 (78.0%), while renter-occupied units make up 1,672 (22.0%).
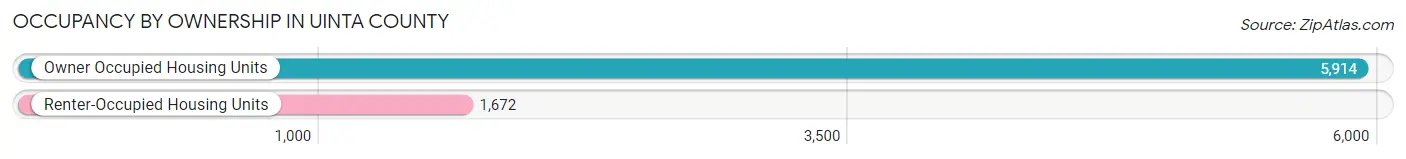
| Occupancy | # Housing Units | % Housing Units |
| Owner Occupied Housing Units | 5,914 | 78.0% |
| Renter-Occupied Housing Units | 1,672 | 22.0% |
| Total Occupied Housing Units | 7,586 | 100.0% |
Occupancy by Household Size in Uinta County
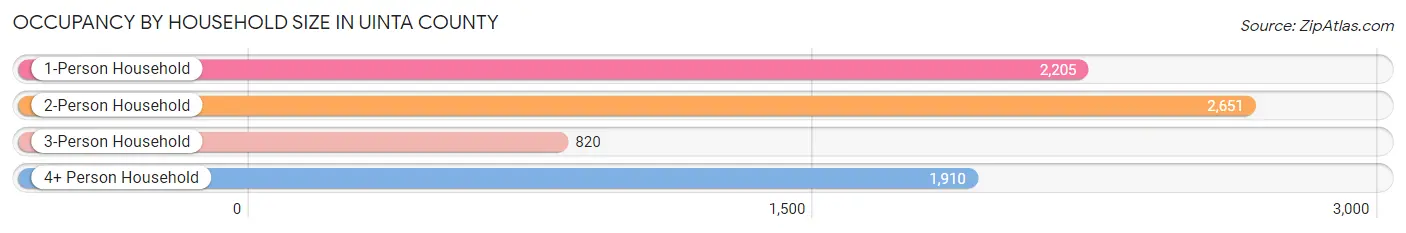
| Household Size | # Housing Units | % Housing Units |
| 1-Person Household | 2,205 | 29.1% |
| 2-Person Household | 2,651 | 34.9% |
| 3-Person Household | 820 | 10.8% |
| 4+ Person Household | 1,910 | 25.2% |
| Total Housing Units | 7,586 | 100.0% |
Occupancy by Ownership by Household Size in Uinta County
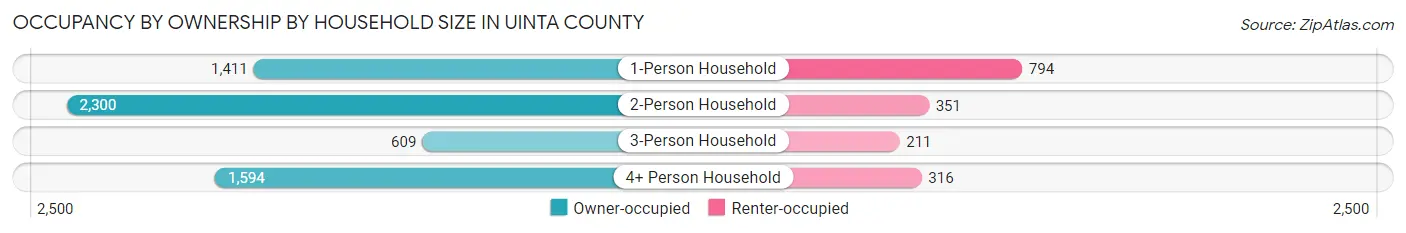
| Household Size | Owner-occupied | Renter-occupied |
| 1-Person Household | 1,411 (64.0%) | 794 (36.0%) |
| 2-Person Household | 2,300 (86.8%) | 351 (13.2%) |
| 3-Person Household | 609 (74.3%) | 211 (25.7%) |
| 4+ Person Household | 1,594 (83.5%) | 316 (16.5%) |
| Total Housing Units | 5,914 (78.0%) | 1,672 (22.0%) |
Occupancy by Educational Attainment in Uinta County
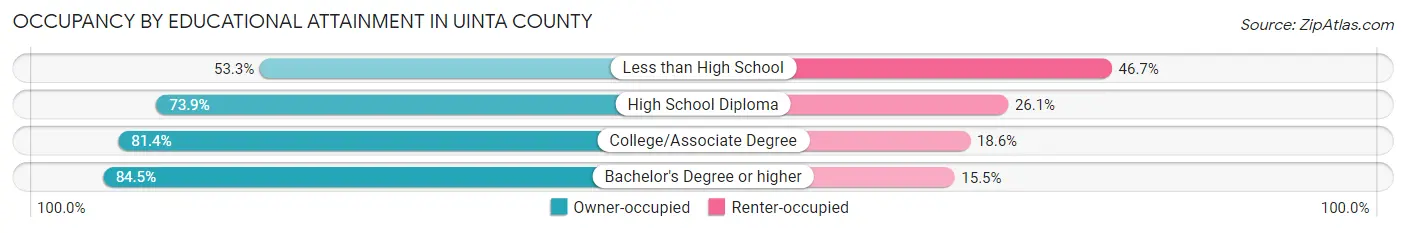
| Household Size | Owner-occupied | Renter-occupied |
| Less than High School | 217 (53.3%) | 190 (46.7%) |
| High School Diploma | 1,880 (73.9%) | 665 (26.1%) |
| College/Associate Degree | 2,601 (81.4%) | 594 (18.6%) |
| Bachelor's Degree or higher | 1,216 (84.5%) | 223 (15.5%) |
Occupancy by Age of Householder in Uinta County
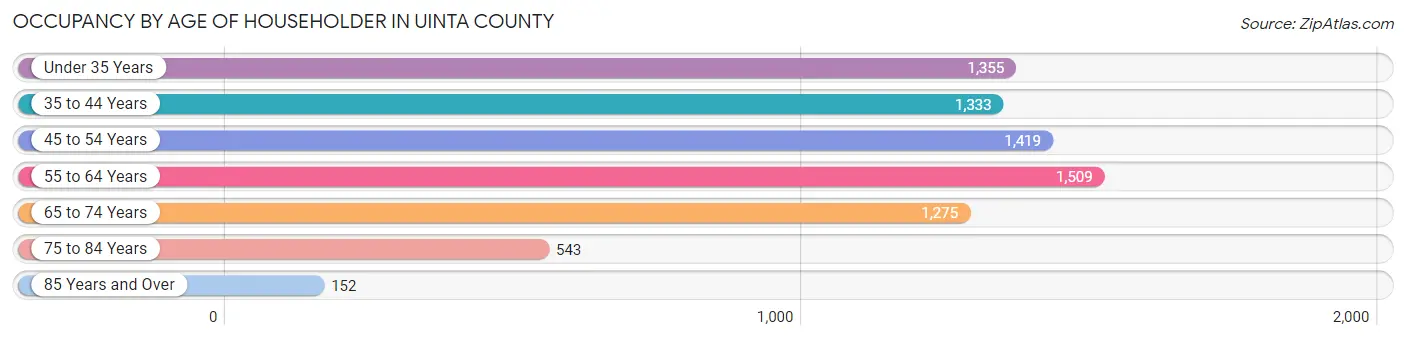
| Age Bracket | # Households | % Households |
| Under 35 Years | 1,355 | 17.9% |
| 35 to 44 Years | 1,333 | 17.6% |
| 45 to 54 Years | 1,419 | 18.7% |
| 55 to 64 Years | 1,509 | 19.9% |
| 65 to 74 Years | 1,275 | 16.8% |
| 75 to 84 Years | 543 | 7.2% |
| 85 Years and Over | 152 | 2.0% |
| Total | 7,586 | 100.0% |
Housing Finances in Uinta County
Median Income by Occupancy in Uinta County
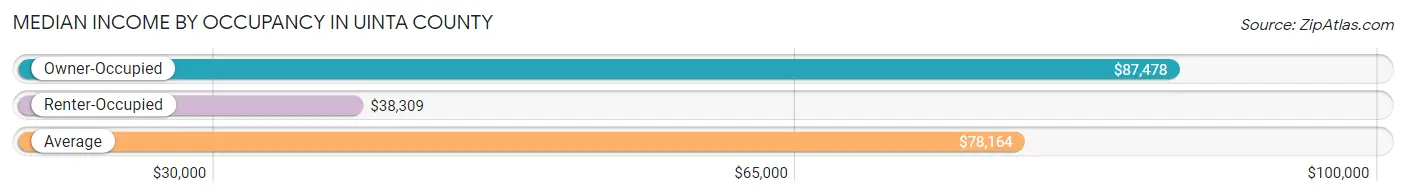
| Occupancy Type | # Households | Median Income |
| Owner-Occupied | 5,914 (78.0%) | $87,478 |
| Renter-Occupied | 1,672 (22.0%) | $38,309 |
| Average | 7,586 (100.0%) | $78,164 |
Occupancy by Householder Income Bracket in Uinta County
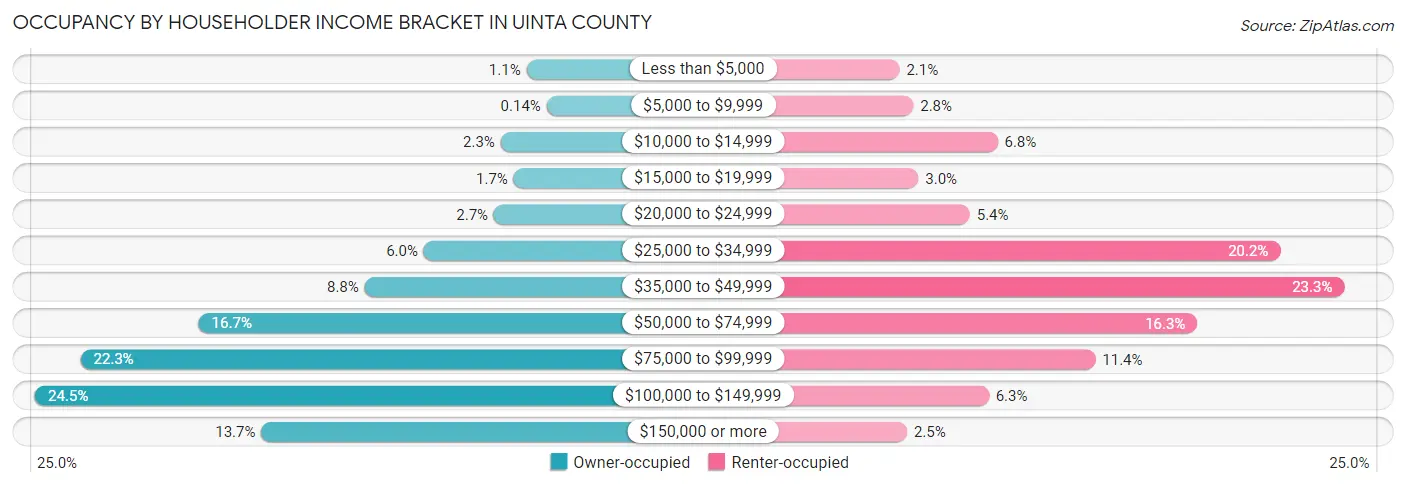
| Income Bracket | Owner-occupied | Renter-occupied |
| Less than $5,000 | 65 (1.1%) | 35 (2.1%) |
| $5,000 to $9,999 | 8 (0.1%) | 46 (2.8%) |
| $10,000 to $14,999 | 138 (2.3%) | 113 (6.8%) |
| $15,000 to $19,999 | 101 (1.7%) | 50 (3.0%) |
| $20,000 to $24,999 | 157 (2.6%) | 91 (5.4%) |
| $25,000 to $34,999 | 354 (6.0%) | 338 (20.2%) |
| $35,000 to $49,999 | 521 (8.8%) | 389 (23.3%) |
| $50,000 to $74,999 | 988 (16.7%) | 272 (16.3%) |
| $75,000 to $99,999 | 1,321 (22.3%) | 191 (11.4%) |
| $100,000 to $149,999 | 1,449 (24.5%) | 106 (6.3%) |
| $150,000 or more | 812 (13.7%) | 41 (2.5%) |
| Total | 5,914 (100.0%) | 1,672 (100.0%) |
Monthly Housing Cost Tiers in Uinta County
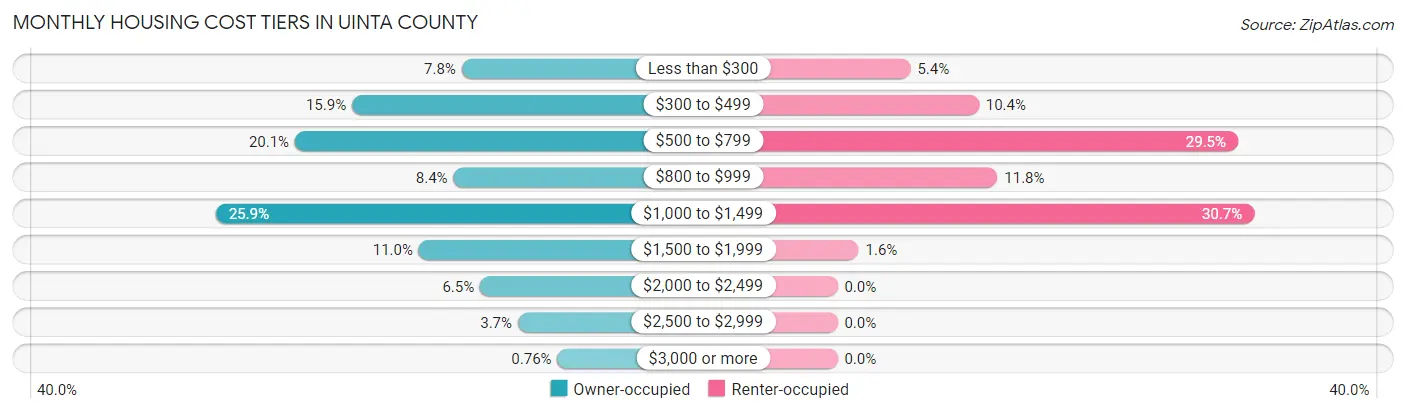
| Monthly Cost | Owner-occupied | Renter-occupied |
| Less than $300 | 462 (7.8%) | 90 (5.4%) |
| $300 to $499 | 940 (15.9%) | 174 (10.4%) |
| $500 to $799 | 1,188 (20.1%) | 493 (29.5%) |
| $800 to $999 | 498 (8.4%) | 197 (11.8%) |
| $1,000 to $1,499 | 1,533 (25.9%) | 513 (30.7%) |
| $1,500 to $1,999 | 649 (11.0%) | 26 (1.6%) |
| $2,000 to $2,499 | 382 (6.5%) | 0 (0.0%) |
| $2,500 to $2,999 | 217 (3.7%) | 0 (0.0%) |
| $3,000 or more | 45 (0.8%) | 0 (0.0%) |
| Total | 5,914 (100.0%) | 1,672 (100.0%) |
Physical Housing Characteristics in Uinta County
Housing Structures in Uinta County
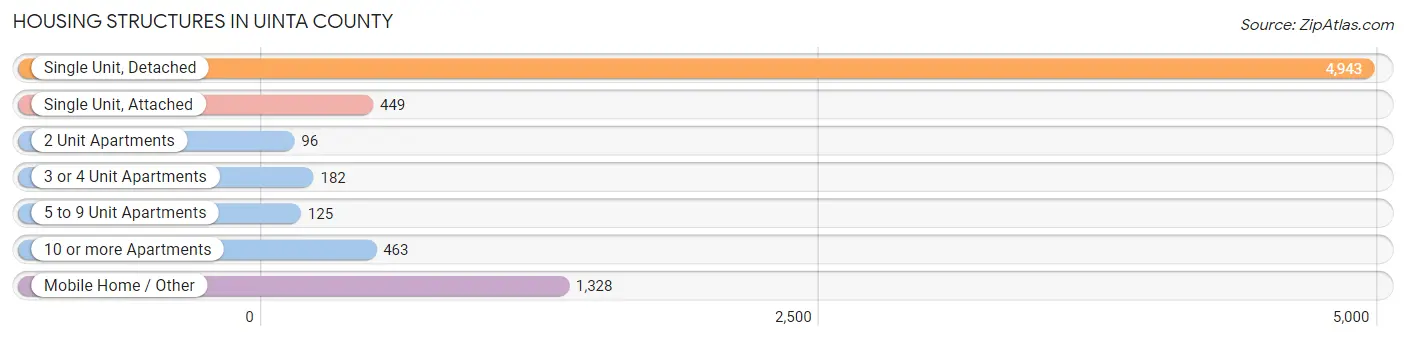
| Structure Type | # Housing Units | % Housing Units |
| Single Unit, Detached | 4,943 | 65.2% |
| Single Unit, Attached | 449 | 5.9% |
| 2 Unit Apartments | 96 | 1.3% |
| 3 or 4 Unit Apartments | 182 | 2.4% |
| 5 to 9 Unit Apartments | 125 | 1.7% |
| 10 or more Apartments | 463 | 6.1% |
| Mobile Home / Other | 1,328 | 17.5% |
| Total | 7,586 | 100.0% |
Housing Structures by Occupancy in Uinta County
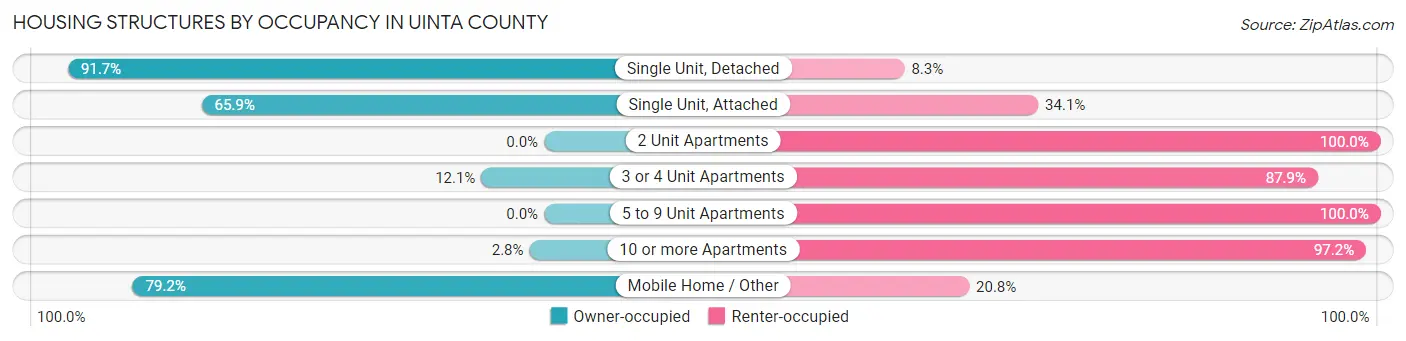
| Structure Type | Owner-occupied | Renter-occupied |
| Single Unit, Detached | 4,531 (91.7%) | 412 (8.3%) |
| Single Unit, Attached | 296 (65.9%) | 153 (34.1%) |
| 2 Unit Apartments | 0 (0.0%) | 96 (100.0%) |
| 3 or 4 Unit Apartments | 22 (12.1%) | 160 (87.9%) |
| 5 to 9 Unit Apartments | 0 (0.0%) | 125 (100.0%) |
| 10 or more Apartments | 13 (2.8%) | 450 (97.2%) |
| Mobile Home / Other | 1,052 (79.2%) | 276 (20.8%) |
| Total | 5,914 (78.0%) | 1,672 (22.0%) |
Housing Structures by Number of Rooms in Uinta County
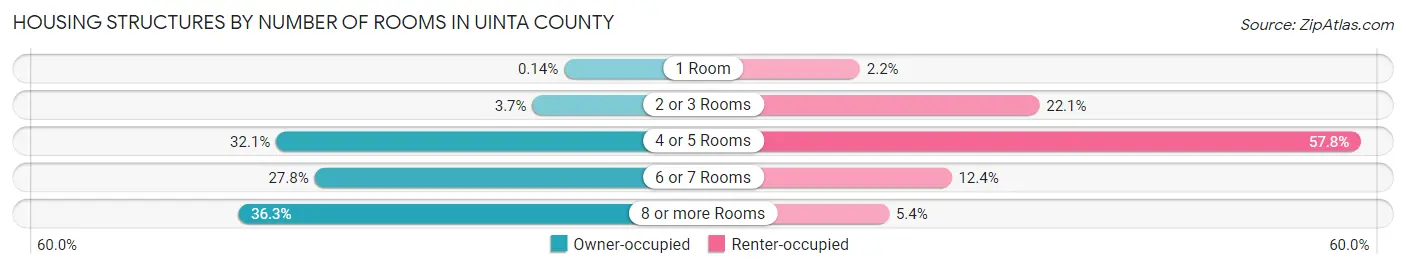
| Number of Rooms | Owner-occupied | Renter-occupied |
| 1 Room | 8 (0.1%) | 37 (2.2%) |
| 2 or 3 Rooms | 216 (3.6%) | 370 (22.1%) |
| 4 or 5 Rooms | 1,897 (32.1%) | 967 (57.8%) |
| 6 or 7 Rooms | 1,646 (27.8%) | 207 (12.4%) |
| 8 or more Rooms | 2,147 (36.3%) | 91 (5.4%) |
| Total | 5,914 (100.0%) | 1,672 (100.0%) |
Housing Structure by Heating Type in Uinta County
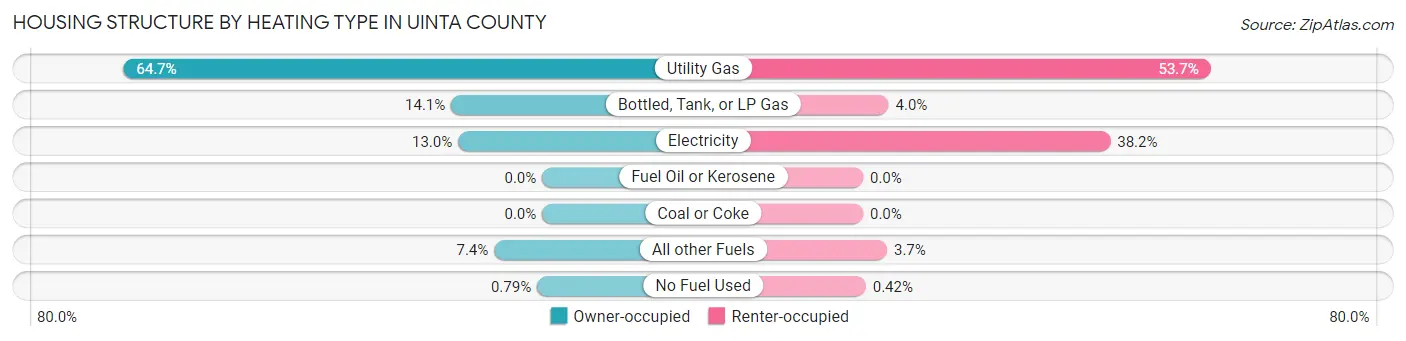
| Heating Type | Owner-occupied | Renter-occupied |
| Utility Gas | 3,828 (64.7%) | 898 (53.7%) |
| Bottled, Tank, or LP Gas | 832 (14.1%) | 66 (4.0%) |
| Electricity | 768 (13.0%) | 639 (38.2%) |
| Fuel Oil or Kerosene | 0 (0.0%) | 0 (0.0%) |
| Coal or Coke | 0 (0.0%) | 0 (0.0%) |
| All other Fuels | 439 (7.4%) | 62 (3.7%) |
| No Fuel Used | 47 (0.8%) | 7 (0.4%) |
| Total | 5,914 (100.0%) | 1,672 (100.0%) |
Household Vehicle Usage in Uinta County
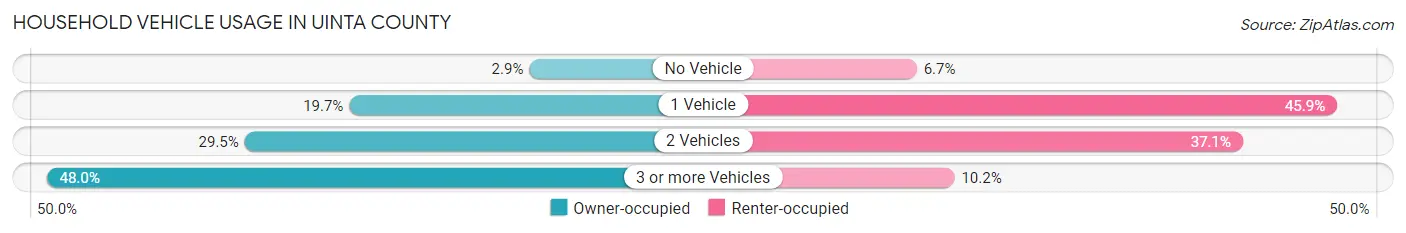
| Vehicles per Household | Owner-occupied | Renter-occupied |
| No Vehicle | 171 (2.9%) | 112 (6.7%) |
| 1 Vehicle | 1,165 (19.7%) | 768 (45.9%) |
| 2 Vehicles | 1,742 (29.5%) | 621 (37.1%) |
| 3 or more Vehicles | 2,836 (47.9%) | 171 (10.2%) |
| Total | 5,914 (100.0%) | 1,672 (100.0%) |
Real Estate & Mortgages in Uinta County
Real Estate and Mortgage Overview in Uinta County
| Characteristic | Without Mortgage | With Mortgage |
| Housing Units | 2,428 | 3,486 |
| Median Property Value | $208,200 | $231,600 |
| Median Household Income | $72,222 | $642 |
| Monthly Housing Costs | $468 | $23 |
| Real Estate Taxes | $1,276 | $32 |
Property Value by Mortgage Status in Uinta County
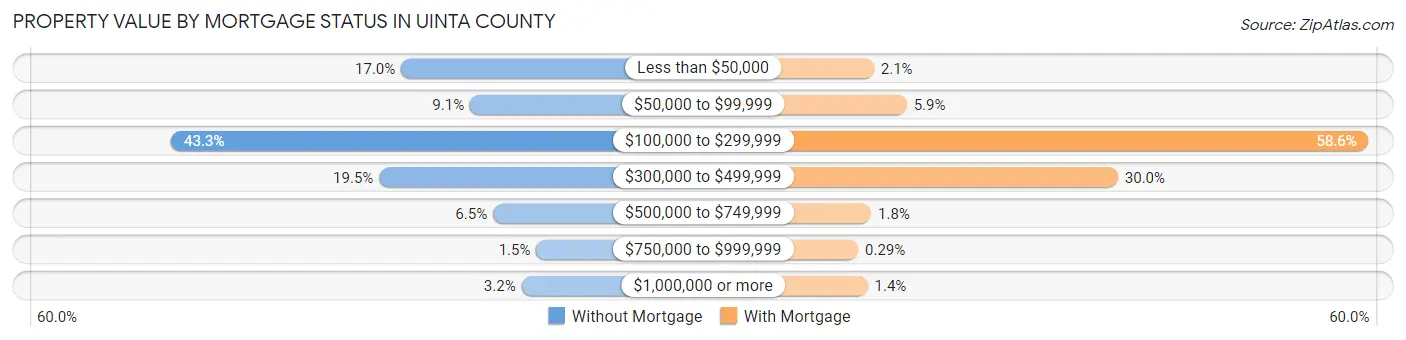
| Property Value | Without Mortgage | With Mortgage |
| Less than $50,000 | 412 (17.0%) | 73 (2.1%) |
| $50,000 to $99,999 | 221 (9.1%) | 204 (5.9%) |
| $100,000 to $299,999 | 1,050 (43.2%) | 2,044 (58.6%) |
| $300,000 to $499,999 | 473 (19.5%) | 1,045 (30.0%) |
| $500,000 to $749,999 | 157 (6.5%) | 62 (1.8%) |
| $750,000 to $999,999 | 37 (1.5%) | 10 (0.3%) |
| $1,000,000 or more | 78 (3.2%) | 48 (1.4%) |
| Total | 2,428 (100.0%) | 3,486 (100.0%) |
Household Income by Mortgage Status in Uinta County
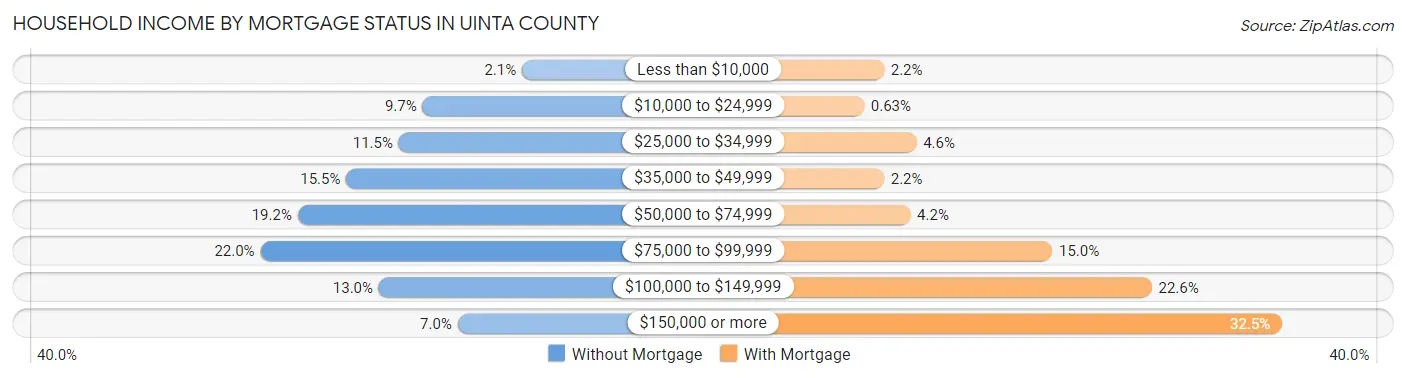
| Household Income | Without Mortgage | With Mortgage |
| Less than $10,000 | 51 (2.1%) | 75 (2.1%) |
| $10,000 to $24,999 | 235 (9.7%) | 22 (0.6%) |
| $25,000 to $34,999 | 279 (11.5%) | 161 (4.6%) |
| $35,000 to $49,999 | 376 (15.5%) | 75 (2.1%) |
| $50,000 to $74,999 | 466 (19.2%) | 145 (4.2%) |
| $75,000 to $99,999 | 535 (22.0%) | 522 (15.0%) |
| $100,000 to $149,999 | 316 (13.0%) | 786 (22.6%) |
| $150,000 or more | 170 (7.0%) | 1,133 (32.5%) |
| Total | 2,428 (100.0%) | 3,486 (100.0%) |
Property Value to Household Income Ratio in Uinta County
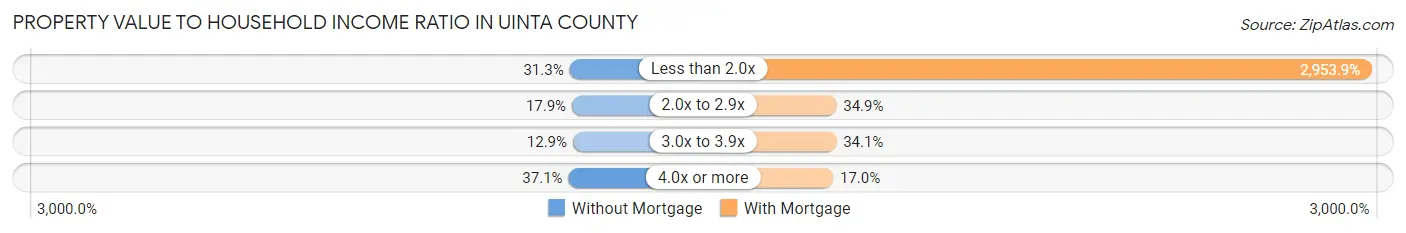
| Value-to-Income Ratio | Without Mortgage | With Mortgage |
| Less than 2.0x | 760 (31.3%) | 102,973 (2,953.9%) |
| 2.0x to 2.9x | 435 (17.9%) | 1,216 (34.9%) |
| 3.0x to 3.9x | 314 (12.9%) | 1,190 (34.1%) |
| 4.0x or more | 901 (37.1%) | 591 (17.0%) |
| Total | 2,428 (100.0%) | 3,486 (100.0%) |
Real Estate Taxes by Mortgage Status in Uinta County
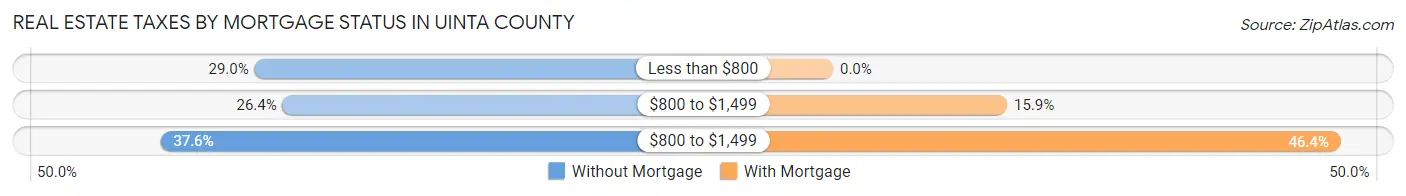
| Property Taxes | Without Mortgage | With Mortgage |
| Less than $800 | 704 (29.0%) | 0 (0.0%) |
| $800 to $1,499 | 642 (26.4%) | 554 (15.9%) |
| $800 to $1,499 | 913 (37.6%) | 1,616 (46.4%) |
| Total | 2,428 (100.0%) | 3,486 (100.0%) |
Health & Disability in Uinta County
Health Insurance Coverage by Age in Uinta County
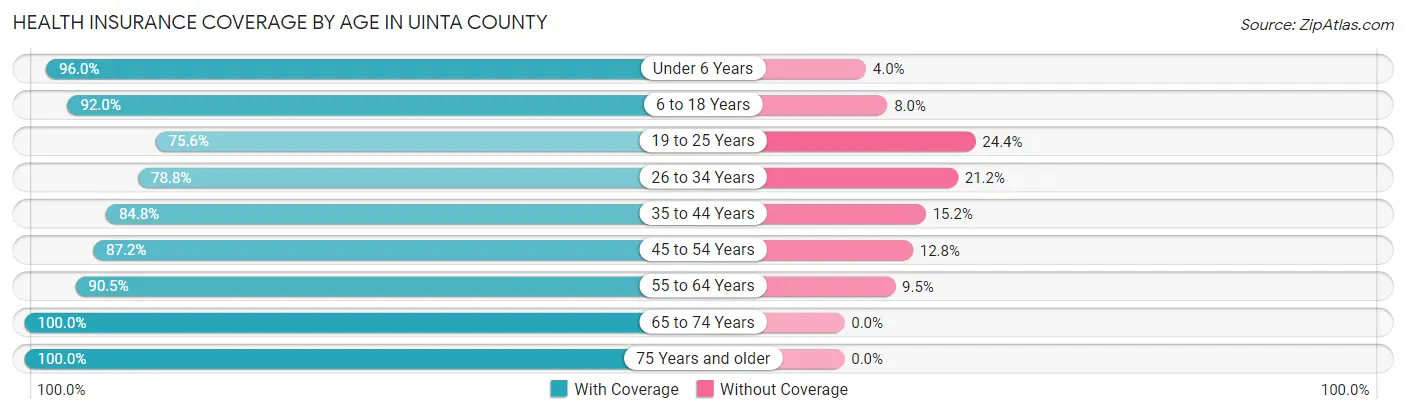
| Age Bracket | With Coverage | Without Coverage |
| Under 6 Years | 1,695 (96.0%) | 71 (4.0%) |
| 6 to 18 Years | 3,760 (92.0%) | 327 (8.0%) |
| 19 to 25 Years | 1,156 (75.6%) | 374 (24.4%) |
| 26 to 34 Years | 1,777 (78.8%) | 477 (21.2%) |
| 35 to 44 Years | 2,297 (84.8%) | 411 (15.2%) |
| 45 to 54 Years | 2,014 (87.2%) | 295 (12.8%) |
| 55 to 64 Years | 2,314 (90.5%) | 242 (9.5%) |
| 65 to 74 Years | 2,094 (100.0%) | 0 (0.0%) |
| 75 Years and older | 1,051 (100.0%) | 0 (0.0%) |
| Total | 18,158 (89.2%) | 2,197 (10.8%) |
Health Insurance Coverage by Citizenship Status in Uinta County
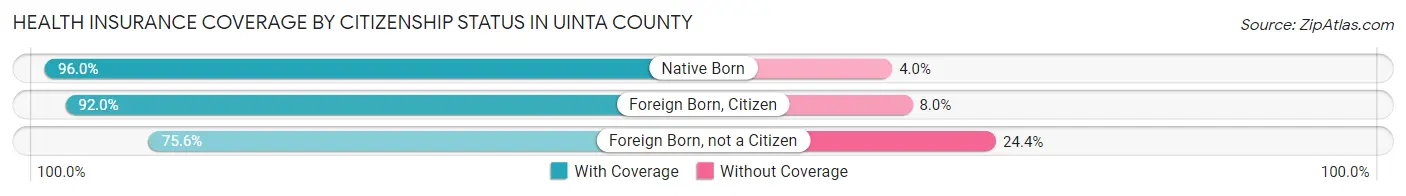
| Citizenship Status | With Coverage | Without Coverage |
| Native Born | 1,695 (96.0%) | 71 (4.0%) |
| Foreign Born, Citizen | 3,760 (92.0%) | 327 (8.0%) |
| Foreign Born, not a Citizen | 1,156 (75.6%) | 374 (24.4%) |
Health Insurance Coverage by Household Income in Uinta County
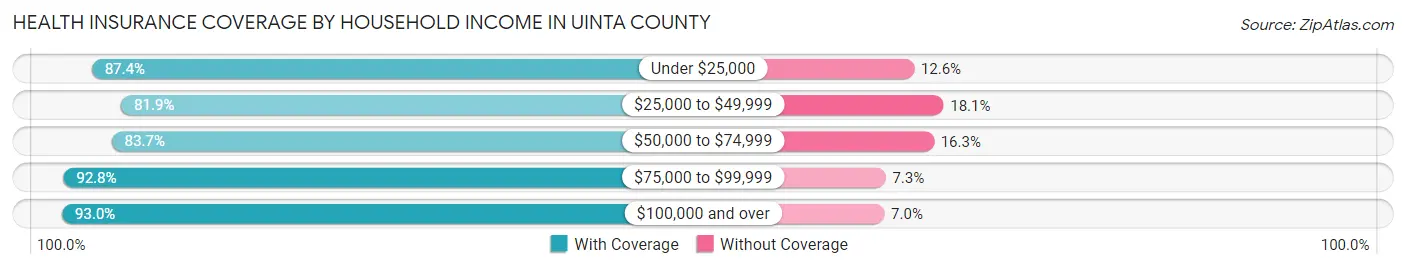
| Household Income | With Coverage | Without Coverage |
| Under $25,000 | 938 (87.4%) | 135 (12.6%) |
| $25,000 to $49,999 | 2,914 (81.9%) | 643 (18.1%) |
| $50,000 to $74,999 | 2,764 (83.7%) | 538 (16.3%) |
| $75,000 to $99,999 | 3,853 (92.7%) | 301 (7.2%) |
| $100,000 and over | 7,642 (93.0%) | 575 (7.0%) |
Public vs Private Health Insurance Coverage by Age in Uinta County
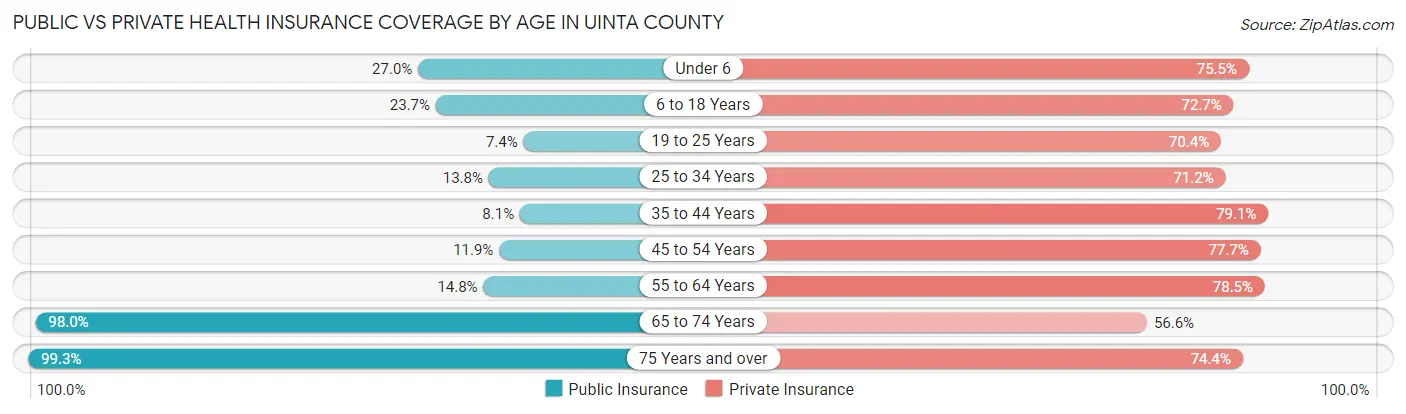
| Age Bracket | Public Insurance | Private Insurance |
| Under 6 | 476 (27.0%) | 1,334 (75.5%) |
| 6 to 18 Years | 967 (23.7%) | 2,972 (72.7%) |
| 19 to 25 Years | 113 (7.4%) | 1,077 (70.4%) |
| 25 to 34 Years | 312 (13.8%) | 1,605 (71.2%) |
| 35 to 44 Years | 218 (8.1%) | 2,143 (79.1%) |
| 45 to 54 Years | 275 (11.9%) | 1,795 (77.7%) |
| 55 to 64 Years | 379 (14.8%) | 2,007 (78.5%) |
| 65 to 74 Years | 2,052 (98.0%) | 1,186 (56.6%) |
| 75 Years and over | 1,044 (99.3%) | 782 (74.4%) |
| Total | 5,836 (28.7%) | 14,901 (73.2%) |
Disability Status by Sex by Age in Uinta County
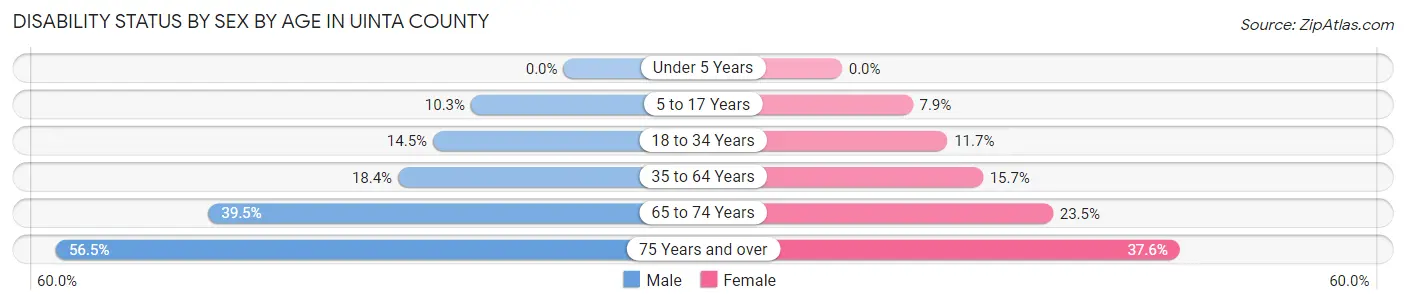
| Age Bracket | Male | Female |
| Under 5 Years | 0 (0.0%) | 0 (0.0%) |
| 5 to 17 Years | 232 (10.3%) | 166 (7.9%) |
| 18 to 34 Years | 284 (14.5%) | 233 (11.7%) |
| 35 to 64 Years | 716 (18.4%) | 578 (15.7%) |
| 65 to 74 Years | 419 (39.5%) | 243 (23.5%) |
| 75 Years and over | 313 (56.5%) | 187 (37.6%) |
Disability Class by Sex by Age in Uinta County
Disability Class: Hearing Difficulty
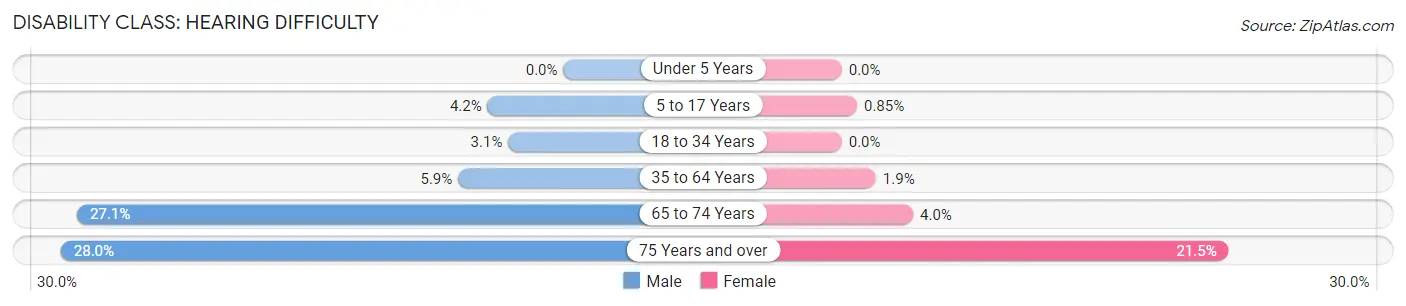
| Age Bracket | Male | Female |
| Under 5 Years | 0 (0.0%) | 0 (0.0%) |
| 5 to 17 Years | 95 (4.2%) | 18 (0.9%) |
| 18 to 34 Years | 60 (3.1%) | 0 (0.0%) |
| 35 to 64 Years | 228 (5.9%) | 70 (1.9%) |
| 65 to 74 Years | 287 (27.1%) | 41 (4.0%) |
| 75 Years and over | 155 (28.0%) | 107 (21.5%) |
Disability Class: Vision Difficulty
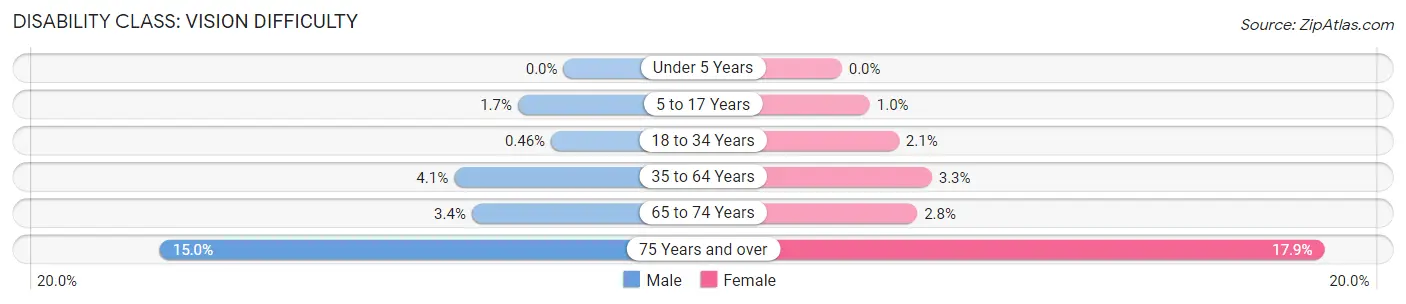
| Age Bracket | Male | Female |
| Under 5 Years | 0 (0.0%) | 0 (0.0%) |
| 5 to 17 Years | 38 (1.7%) | 22 (1.0%) |
| 18 to 34 Years | 9 (0.5%) | 42 (2.1%) |
| 35 to 64 Years | 158 (4.1%) | 123 (3.3%) |
| 65 to 74 Years | 36 (3.4%) | 29 (2.8%) |
| 75 Years and over | 83 (15.0%) | 89 (17.9%) |
Disability Class: Cognitive Difficulty
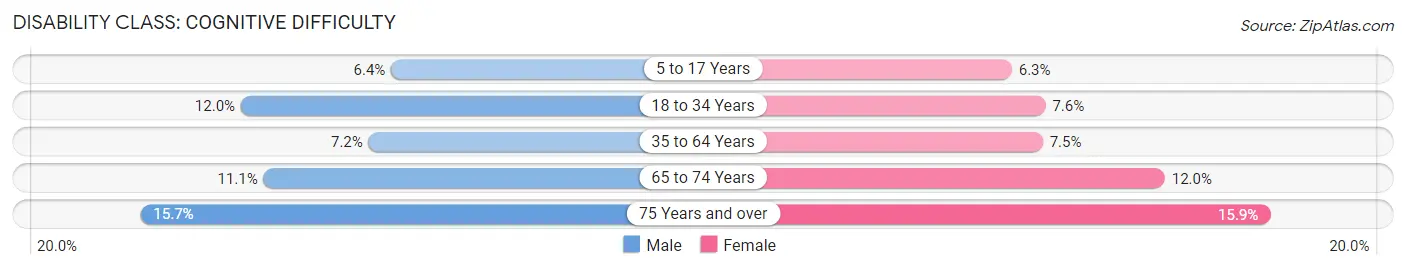
| Age Bracket | Male | Female |
| 5 to 17 Years | 144 (6.4%) | 133 (6.3%) |
| 18 to 34 Years | 234 (12.0%) | 150 (7.6%) |
| 35 to 64 Years | 281 (7.2%) | 275 (7.5%) |
| 65 to 74 Years | 118 (11.1%) | 124 (12.0%) |
| 75 Years and over | 87 (15.7%) | 79 (15.9%) |
Disability Class: Ambulatory Difficulty
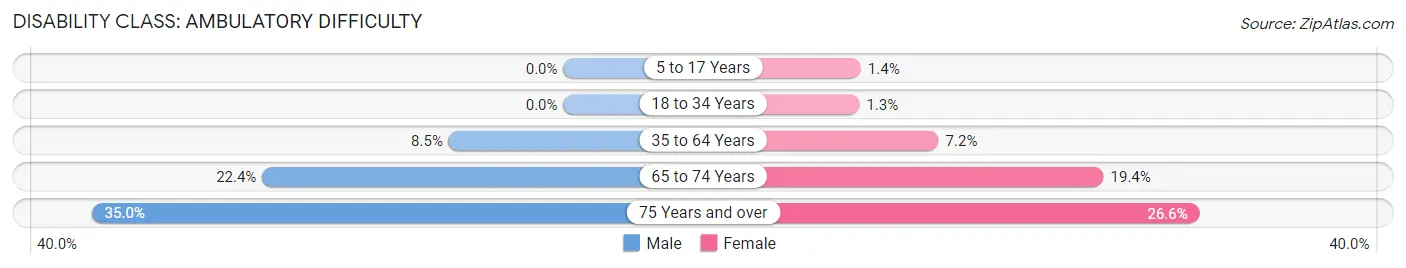
| Age Bracket | Male | Female |
| 5 to 17 Years | 0 (0.0%) | 30 (1.4%) |
| 18 to 34 Years | 0 (0.0%) | 26 (1.3%) |
| 35 to 64 Years | 331 (8.5%) | 265 (7.2%) |
| 65 to 74 Years | 237 (22.4%) | 201 (19.4%) |
| 75 Years and over | 194 (35.0%) | 132 (26.6%) |
Disability Class: Self-Care Difficulty
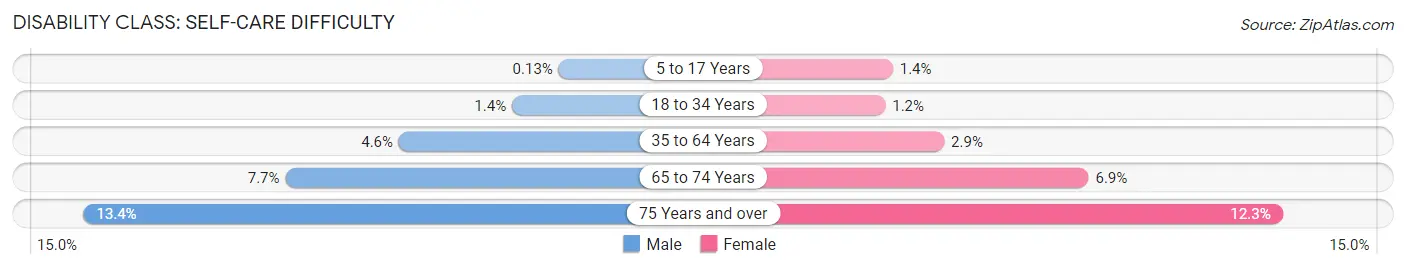
| Age Bracket | Male | Female |
| 5 to 17 Years | 3 (0.1%) | 30 (1.4%) |
| 18 to 34 Years | 28 (1.4%) | 24 (1.2%) |
| 35 to 64 Years | 178 (4.6%) | 105 (2.9%) |
| 65 to 74 Years | 82 (7.7%) | 71 (6.9%) |
| 75 Years and over | 74 (13.4%) | 61 (12.3%) |
Technology Access in Uinta County
Computing Device Access in Uinta County
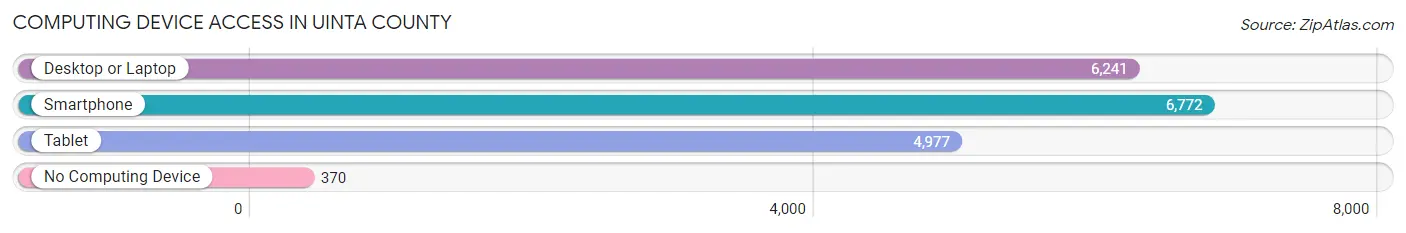
| Device Type | # Households | % Households |
| Desktop or Laptop | 6,241 | 82.3% |
| Smartphone | 6,772 | 89.3% |
| Tablet | 4,977 | 65.6% |
| No Computing Device | 370 | 4.9% |
| Total | 7,586 | 100.0% |
Internet Access in Uinta County
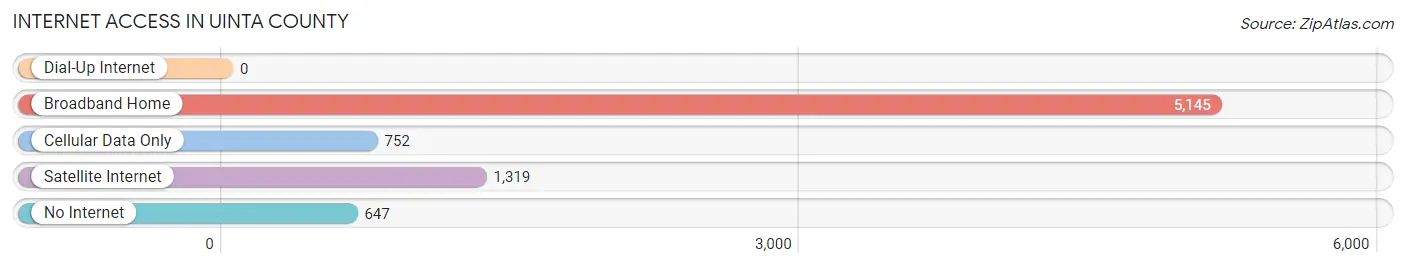
| Internet Type | # Households | % Households |
| Dial-Up Internet | 0 | 0.0% |
| Broadband Home | 5,145 | 67.8% |
| Cellular Data Only | 752 | 9.9% |
| Satellite Internet | 1,319 | 17.4% |
| No Internet | 647 | 8.5% |
| Total | 7,586 | 100.0% |
Uinta County Summary
Uinta County is located in the southwestern corner of Wyoming, and is bordered by Utah to the south, Sweetwater County to the west, Lincoln County to the north, and Summit County to the east. The county seat is Evanston, and the largest city is Mountain View. Uinta County is the second-largest county in Wyoming by area, covering an area of 4,921 square miles.
History
Uinta County was created in 1869, and was named after the Uinta Mountains, which are located in the county. The county was originally part of Sweetwater County, but was split off in 1884. The county was originally populated by Native American tribes, including the Shoshone, Ute, and Gosiute.
The first settlers in the area were fur trappers and traders, who arrived in the early 1800s. The first permanent settlers arrived in the 1860s, and the county was officially organized in 1869. The first town in the county was Evanston, which was founded in 1868.
Geography
Uinta County is located in the southwestern corner of Wyoming, and is bordered by Utah to the south, Sweetwater County to the west, Lincoln County to the north, and Summit County to the east. The county covers an area of 4,921 square miles, making it the second-largest county in Wyoming by area.
The county is located in the Rocky Mountains, and is home to the Uinta Mountains, which are located in the northern part of the county. The highest point in the county is Kings Peak, which has an elevation of 13,528 feet. The county also contains several rivers, including the Bear River, Green River, and Blacks Fork.
Economy
The economy of Uinta County is largely based on agriculture, mining, and tourism. The county is home to several large ranches, which produce beef, sheep, and hay. The county is also home to several coal mines, which produce coal for use in power plants.
Tourism is also an important part of the economy, as the county is home to several national parks and monuments, including Flaming Gorge National Recreation Area, Fossil Butte National Monument, and the Uinta-Wasatch-Cache National Forest. The county is also home to several ski resorts, which attract visitors from all over the world.
Demographics
As of the 2010 census, Uinta County had a population of 21,118. The population was spread out, with 51.2% of the population being male and 48.8% being female. The median age was 36.7 years, and the median household income was $50,945.
The racial makeup of the county was 91.2% White, 0.7% African American, 0.7% Native American, 0.4% Asian, 0.1% Pacific Islander, 4.7% from other races, and 2.2% from two or more races. Hispanic or Latino of any race were 8.3% of the population.
The largest ancestry groups in Uinta County were German (25.2%), English (17.2%), Irish (14.2%), and Norwegian (10.2%). The largest religious affiliations were Catholic (25.2%), LDS (17.2%), and Baptist (14.2%).
Common Questions
What is the Total Population of Uinta County?
Total Population of Uinta County is 20,546.
What is the Total Male Population of Uinta County?
Total Male Population of Uinta County is 10,446.
What is the Total Female Population of Uinta County?
Total Female Population of Uinta County is 10,100.
What is the Ratio of Males per 100 Females in Uinta County?
There are 103.43 Males per 100 Females in Uinta County.
What is the Ratio of Females per 100 Males in Uinta County?
There are 96.69 Females per 100 Males in Uinta County.
What is the Median Population Age in Uinta County?
Median Population Age in Uinta County is 36.0 Years.
What is the Average Family Size in Uinta County
Average Family Size in Uinta County is 3.3 People.
What is the Average Household Size in Uinta County
Average Household Size in Uinta County is 2.7 People.
What is Per Capita Income in Uinta County?
Per Capita income in Uinta County is $32,955.
What is the Median Family Income in Uinta County?
Median Family Income in Uinta County is $91,003.
What is the Median Household income in Uinta County?
Median Household Income in Uinta County is $78,164.
What is Income or Wage Gap in Uinta County?
Income or Wage Gap in Uinta County is 57.9%.
Women in Uinta County earn 42.1 cents for every dollar earned by a man.
What is Inequality or Gini Index in Uinta County?
Inequality or Gini Index in Uinta County is 0.36.
How Large is the Labor Force in Uinta County?
There are 9,910 People in the Labor Forcein in Uinta County.
What is the Percentage of People in the Labor Force in Uinta County?
64.0% of People are in the Labor Force in Uinta County.
What is the Unemployment Rate in Uinta County?
Unemployment Rate in Uinta County is 3.4%.