Teton County, WY
Teton County Map
Teton County Overview
23,346
TOTAL POPULATION
12,114
MALE POPULATION
11,232
FEMALE POPULATION
107.85
MALES / 100 FEMALES
92.72
FEMALES / 100 MALES
39.9
MEDIAN AGE
2.7
AVG FAMILY SIZE
2.3
AVG HOUSEHOLD SIZE
$76,296
PER CAPITA INCOME
$125,325
AVG FAMILY INCOME
$108,279
AVG HOUSEHOLD INCOME
27.0%
WAGE / INCOME GAP [ % ]
73.0¢/ $1
WAGE / INCOME GAP [ $ ]
0.54
INEQUALITY / GINI INDEX
15,475
LABOR FORCE [ PEOPLE ]
78.6%
PERCENT IN LABOR FORCE
2.1%
UNEMPLOYMENT RATE
Teton County Area Codes
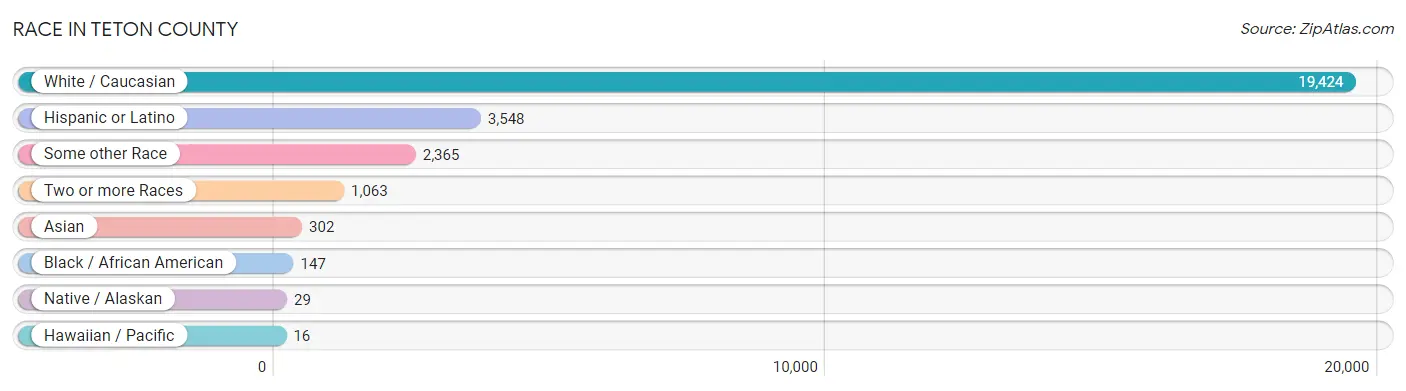
Race in Teton County
The most populous races in Teton County are White / Caucasian (19,424 | 83.2%), Hispanic or Latino (3,548 | 15.2%), and Some other Race (2,365 | 10.1%).
| Race | # Population | % Population |
| Asian | 302 | 1.3% |
| Black / African American | 147 | 0.6% |
| Hawaiian / Pacific | 16 | 0.1% |
| Hispanic or Latino | 3,548 | 15.2% |
| Native / Alaskan | 29 | 0.1% |
| White / Caucasian | 19,424 | 83.2% |
| Two or more Races | 1,063 | 4.5% |
| Some other Race | 2,365 | 10.1% |
| Total | 23,346 | 100.0% |
Ancestry in Teton County
The most populous ancestries reported in Teton County are German (3,597 | 15.4%), English (3,566 | 15.3%), Irish (3,457 | 14.8%), Mexican (2,822 | 12.1%), and Scottish (1,304 | 5.6%), together accounting for 63.2% of all Teton County residents.

| Ancestry | # Population | % Population |
| Albanian | 46 | 0.2% |
| American | 550 | 2.4% |
| Apache | 29 | 0.1% |
| Arab | 100 | 0.4% |
| Arapaho | 2 | 0.0% |
| Australian | 24 | 0.1% |
| Austrian | 217 | 0.9% |
| Belgian | 63 | 0.3% |
| Bhutanese | 84 | 0.4% |
| British | 218 | 0.9% |
| Canadian | 45 | 0.2% |
| Central American | 1 | 0.0% |
| Cherokee | 54 | 0.2% |
| Colombian | 81 | 0.4% |
| Cree | 27 | 0.1% |
| Czech | 49 | 0.2% |
| Danish | 305 | 1.3% |
| Dominican | 10 | 0.0% |
| Dutch | 475 | 2.0% |
| Eastern European | 77 | 0.3% |
| Ecuadorian | 27 | 0.1% |
| English | 3,566 | 15.3% |
| European | 600 | 2.6% |
| Filipino | 8 | 0.0% |
| Finnish | 104 | 0.4% |
| French | 851 | 3.6% |
| French Canadian | 14 | 0.1% |
| German | 3,597 | 15.4% |
| Hungarian | 146 | 0.6% |
| Indian (Asian) | 52 | 0.2% |
| Irish | 3,457 | 14.8% |
| Italian | 1,148 | 4.9% |
| Jamaican | 3 | 0.0% |
| Korean | 90 | 0.4% |
| Lithuanian | 16 | 0.1% |
| Maltese | 11 | 0.1% |
| Mexican | 2,822 | 12.1% |
| Mongolian | 16 | 0.1% |
| Native Hawaiian | 2 | 0.0% |
| Navajo | 93 | 0.4% |
| Nigerian | 39 | 0.2% |
| Northern European | 183 | 0.8% |
| Norwegian | 742 | 3.2% |
| Pakistani | 64 | 0.3% |
| Pennsylvania German | 32 | 0.1% |
| Peruvian | 183 | 0.8% |
| Polish | 797 | 3.4% |
| Portuguese | 63 | 0.3% |
| Puerto Rican | 102 | 0.4% |
| Romanian | 104 | 0.4% |
| Russian | 79 | 0.3% |
| Salvadoran | 1 | 0.0% |
| Scandinavian | 261 | 1.1% |
| Scotch-Irish | 449 | 1.9% |
| Scottish | 1,304 | 5.6% |
| Serbian | 22 | 0.1% |
| Slavic | 160 | 0.7% |
| Slovak | 41 | 0.2% |
| South African | 39 | 0.2% |
| South American | 291 | 1.3% |
| Spanish | 32 | 0.1% |
| Sri Lankan | 54 | 0.2% |
| Subsaharan African | 78 | 0.3% |
| Swedish | 509 | 2.2% |
| Swiss | 75 | 0.3% |
| Thai | 68 | 0.3% |
| Tongan | 52 | 0.2% |
| Turkish | 29 | 0.1% |
| Ukrainian | 249 | 1.1% |
| Welsh | 265 | 1.1% |
| Yugoslavian | 83 | 0.4% | View All 71 Rows |
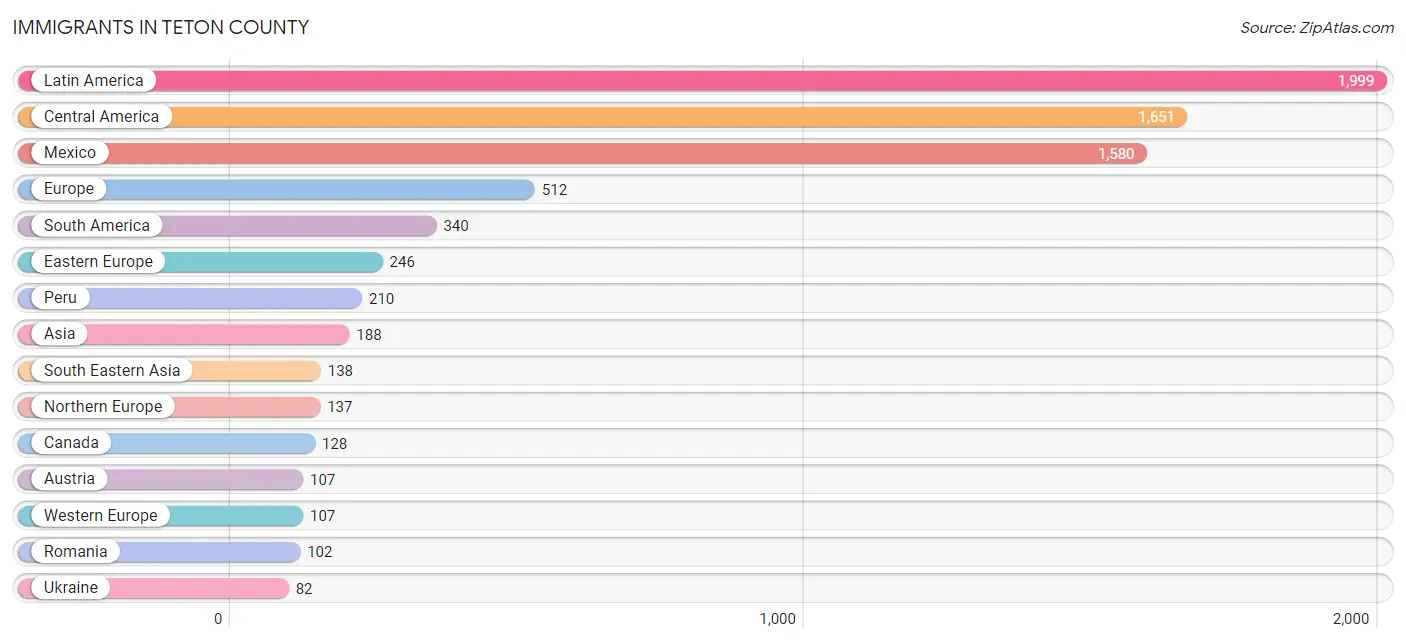
Immigrants in Teton County
The most numerous immigrant groups reported in Teton County came from Latin America (1,999 | 8.6%), Central America (1,651 | 7.1%), Mexico (1,580 | 6.8%), Europe (512 | 2.2%), and South America (340 | 1.5%), together accounting for 26.0% of all Teton County residents.
| Immigration Origin | # Population | % Population |
| Africa | 35 | 0.2% |
| Albania | 46 | 0.2% |
| Asia | 188 | 0.8% |
| Australia | 34 | 0.2% |
| Austria | 107 | 0.5% |
| Canada | 128 | 0.5% |
| Caribbean | 8 | 0.0% |
| Central America | 1,651 | 7.1% |
| Chile | 28 | 0.1% |
| China | 49 | 0.2% |
| Colombia | 75 | 0.3% |
| Dominican Republic | 5 | 0.0% |
| Eastern Asia | 49 | 0.2% |
| Eastern Europe | 246 | 1.1% |
| Ecuador | 27 | 0.1% |
| El Salvador | 71 | 0.3% |
| England | 43 | 0.2% |
| Europe | 512 | 2.2% |
| Hong Kong | 27 | 0.1% |
| Italy | 22 | 0.1% |
| Jamaica | 3 | 0.0% |
| Latin America | 1,999 | 8.6% |
| Malaysia | 16 | 0.1% |
| Mexico | 1,580 | 6.8% |
| Moldova | 2 | 0.0% |
| Nigeria | 35 | 0.2% |
| Northern Europe | 137 | 0.6% |
| Norway | 4 | 0.0% |
| Oceania | 50 | 0.2% |
| Peru | 210 | 0.9% |
| Philippines | 58 | 0.3% |
| Poland | 11 | 0.1% |
| Romania | 102 | 0.4% |
| Russia | 3 | 0.0% |
| South America | 340 | 1.5% |
| South Eastern Asia | 138 | 0.6% |
| Southern Europe | 22 | 0.1% |
| Taiwan | 8 | 0.0% |
| Thailand | 64 | 0.3% |
| Turkey | 1 | 0.0% |
| Ukraine | 82 | 0.4% |
| Western Africa | 35 | 0.2% |
| Western Asia | 1 | 0.0% |
| Western Europe | 107 | 0.5% | View All 44 Rows |
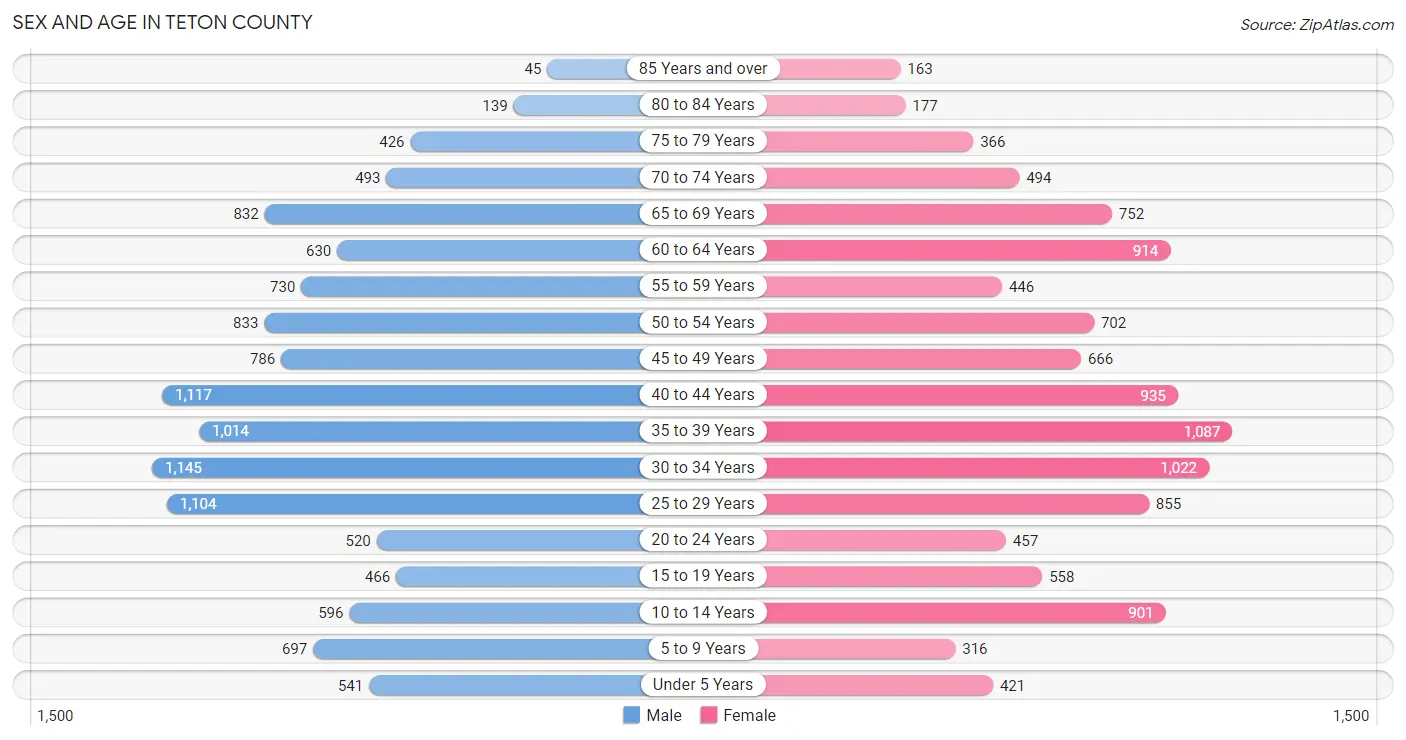
Sex and Age in Teton County
Sex and Age in Teton County
The most populous age groups in Teton County are 30 to 34 Years (1,145 | 9.5%) for men and 35 to 39 Years (1,087 | 9.7%) for women.
| Age Bracket | Male | Female |
| Under 5 Years | 541 (4.5%) | 421 (3.7%) |
| 5 to 9 Years | 697 (5.8%) | 316 (2.8%) |
| 10 to 14 Years | 596 (4.9%) | 901 (8.0%) |
| 15 to 19 Years | 466 (3.8%) | 558 (5.0%) |
| 20 to 24 Years | 520 (4.3%) | 457 (4.1%) |
| 25 to 29 Years | 1,104 (9.1%) | 855 (7.6%) |
| 30 to 34 Years | 1,145 (9.5%) | 1,022 (9.1%) |
| 35 to 39 Years | 1,014 (8.4%) | 1,087 (9.7%) |
| 40 to 44 Years | 1,117 (9.2%) | 935 (8.3%) |
| 45 to 49 Years | 786 (6.5%) | 666 (5.9%) |
| 50 to 54 Years | 833 (6.9%) | 702 (6.2%) |
| 55 to 59 Years | 730 (6.0%) | 446 (4.0%) |
| 60 to 64 Years | 630 (5.2%) | 914 (8.1%) |
| 65 to 69 Years | 832 (6.9%) | 752 (6.7%) |
| 70 to 74 Years | 493 (4.1%) | 494 (4.4%) |
| 75 to 79 Years | 426 (3.5%) | 366 (3.3%) |
| 80 to 84 Years | 139 (1.1%) | 177 (1.6%) |
| 85 Years and over | 45 (0.4%) | 163 (1.5%) |
| Total | 12,114 (100.0%) | 11,232 (100.0%) |
Families and Households in Teton County
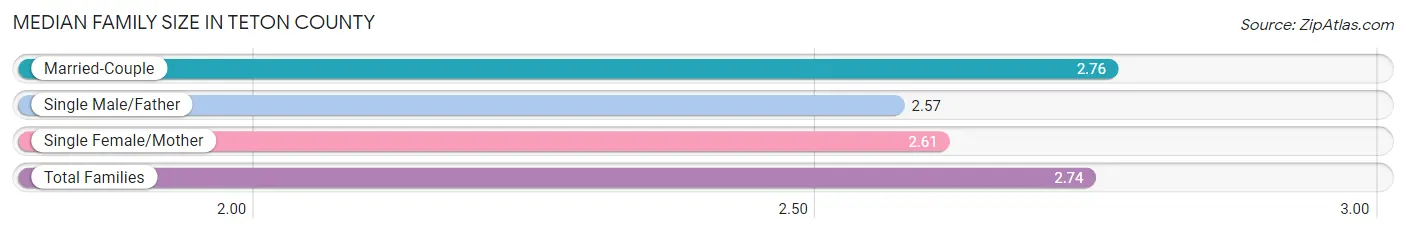
Median Family Size in Teton County
The median family size in Teton County is 2.74 persons per family, with married-couple families (5,019 | 83.6%) accounting for the largest median family size of 2.76 persons per family. On the other hand, single male/father families (471 | 7.9%) represent the smallest median family size with 2.57 persons per family.
| Family Type | # Families | Family Size |
| Married-Couple | 5,019 (83.6%) | 2.76 |
| Single Male/Father | 471 (7.9%) | 2.57 |
| Single Female/Mother | 511 (8.5%) | 2.61 |
| Total Families | 6,001 (100.0%) | 2.74 |
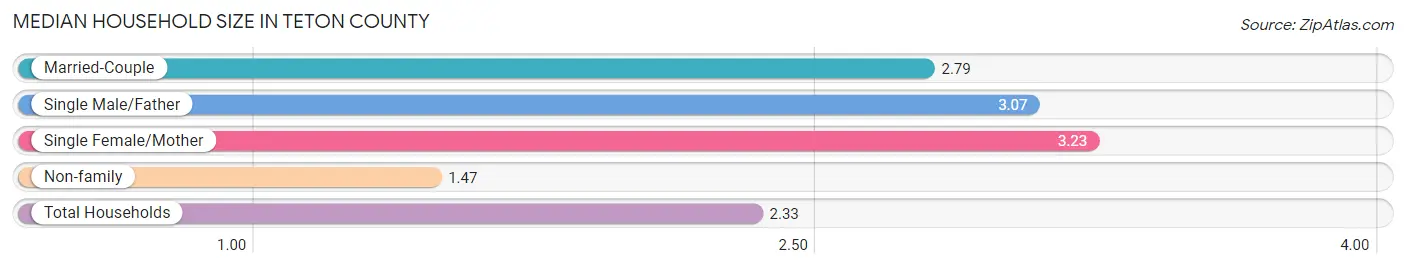
Median Household Size in Teton County
The median household size in Teton County is 2.33 persons per household, with single female/mother households (511 | 5.3%) accounting for the largest median household size of 3.23 persons per household. non-family households (3,644 | 37.8%) represent the smallest median household size with 1.47 persons per household.
| Household Type | # Households | Household Size |
| Married-Couple | 5,019 (52.0%) | 2.79 |
| Single Male/Father | 471 (4.9%) | 3.07 |
| Single Female/Mother | 511 (5.3%) | 3.23 |
| Non-family | 3,644 (37.8%) | 1.47 |
| Total Households | 9,645 (100.0%) | 2.33 |
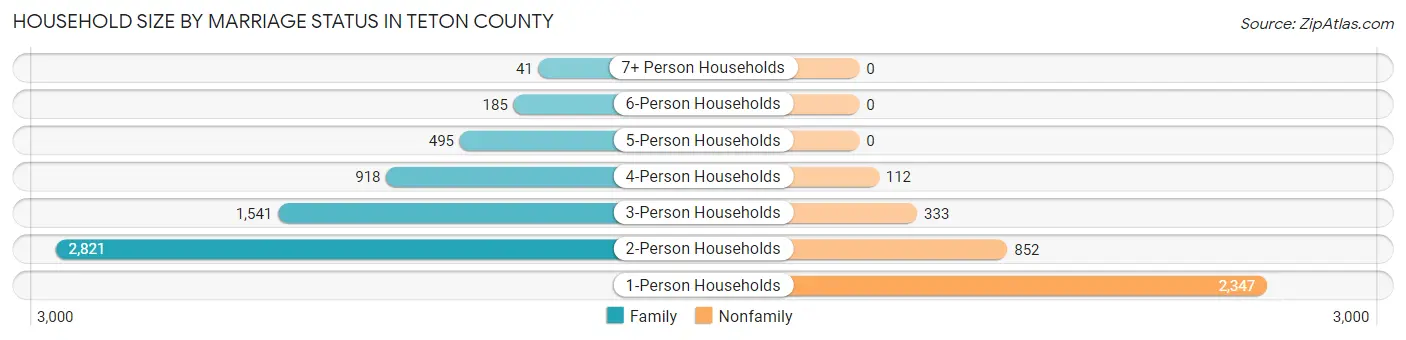
Household Size by Marriage Status in Teton County
Out of a total of 9,645 households in Teton County, 6,001 (62.2%) are family households, while 3,644 (37.8%) are nonfamily households. The most numerous type of family households are 2-person households, comprising 2,821, and the most common type of nonfamily households are 1-person households, comprising 2,347.
| Household Size | Family Households | Nonfamily Households |
| 1-Person Households | - | 2,347 (24.3%) |
| 2-Person Households | 2,821 (29.2%) | 852 (8.8%) |
| 3-Person Households | 1,541 (16.0%) | 333 (3.5%) |
| 4-Person Households | 918 (9.5%) | 112 (1.2%) |
| 5-Person Households | 495 (5.1%) | 0 (0.0%) |
| 6-Person Households | 185 (1.9%) | 0 (0.0%) |
| 7+ Person Households | 41 (0.4%) | 0 (0.0%) |
| Total | 6,001 (62.2%) | 3,644 (37.8%) |
Female Fertility in Teton County
Fertility by Age in Teton County
Average fertility rate in Teton County is 47.0 births per 1,000 women. Women in the age bracket of 20 to 34 years have the highest fertility rate with 80.0 births per 1,000 women. Women in the age bracket of 20 to 34 years acount for 68.1% of all women with births.

| Age Bracket | Women with Births | Births / 1,000 Women |
| 15 to 19 years | 0 (0.0%) | 0.0 |
| 20 to 34 years | 186 (68.1%) | 80.0 |
| 35 to 50 years | 87 (31.9%) | 29.0 |
| Total | 273 (100.0%) | 47.0 |
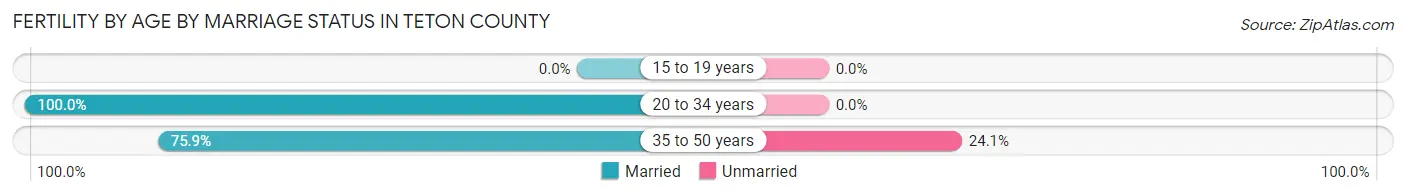
Fertility by Age by Marriage Status in Teton County
92.3% of women with births (273) in Teton County are married. The highest percentage of unmarried women with births falls into 35 to 50 years age bracket with 24.1% of them unmarried at the time of birth, while the lowest percentage of unmarried women with births belong to 20 to 34 years age bracket with 0.0% of them unmarried.
| Age Bracket | Married | Unmarried |
| 15 to 19 years | 0 (0.0%) | 0 (0.0%) |
| 20 to 34 years | 186 (100.0%) | 0 (0.0%) |
| 35 to 50 years | 66 (75.9%) | 21 (24.1%) |
| Total | 252 (92.3%) | 21 (7.7%) |
Fertility by Education in Teton County
Average fertility rate in Teton County is 47.0 births per 1,000 women. Women with the education attainment of college or associate's degree have the highest fertility rate of 101.0 births per 1,000 women, while women with the education attainment of graduate degree have the lowest fertility at 12.0 births per 1,000 women. Women with the education attainment of college or associate's degree represent 33.7% of all women with births.
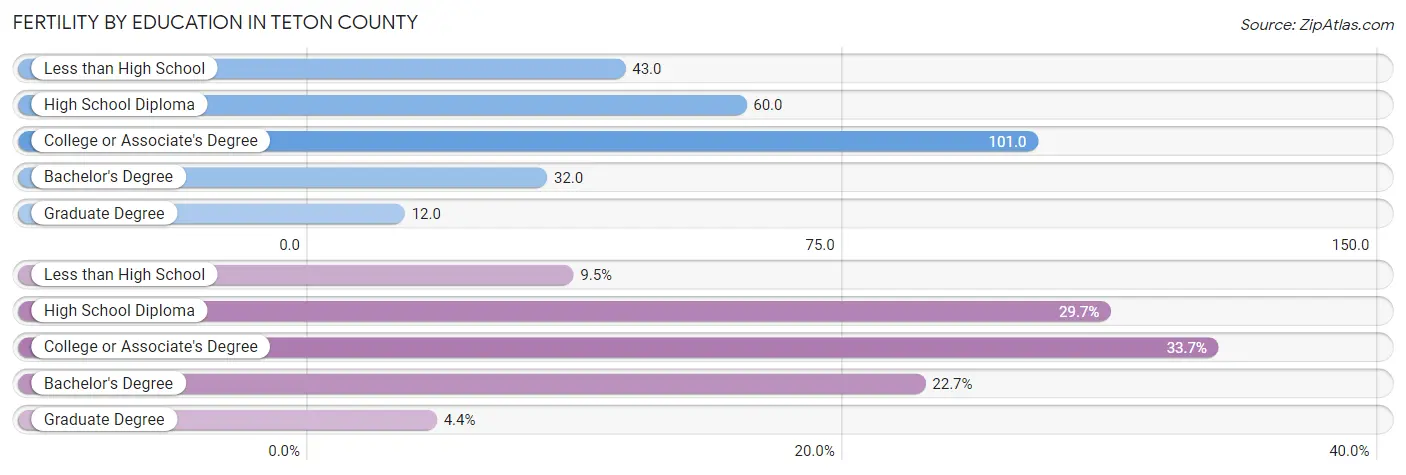
| Educational Attainment | Women with Births | Births / 1,000 Women |
| Less than High School | 26 (9.5%) | 43.0 |
| High School Diploma | 81 (29.7%) | 60.0 |
| College or Associate's Degree | 92 (33.7%) | 101.0 |
| Bachelor's Degree | 62 (22.7%) | 32.0 |
| Graduate Degree | 12 (4.4%) | 12.0 |
| Total | 273 (100.0%) | 47.0 |
Fertility by Education by Marriage Status in Teton County
7.7% of women with births in Teton County are unmarried. Women with the educational attainment of less than high school are most likely to be married with 100.0% of them married at childbirth, while women with the educational attainment of high school diploma are least likely to be married with 25.9% of them unmarried at childbirth.
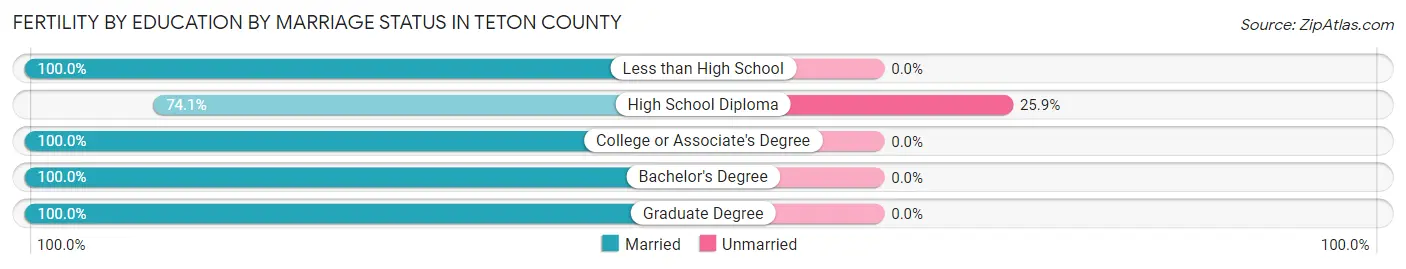
| Educational Attainment | Married | Unmarried |
| Less than High School | 26 (100.0%) | 0 (0.0%) |
| High School Diploma | 60 (74.1%) | 21 (25.9%) |
| College or Associate's Degree | 92 (100.0%) | 0 (0.0%) |
| Bachelor's Degree | 62 (100.0%) | 0 (0.0%) |
| Graduate Degree | 12 (100.0%) | 0 (0.0%) |
| Total | 252 (92.3%) | 21 (7.7%) |
Income in Teton County
Income Overview in Teton County
Per Capita Income in Teton County is $76,296, while median incomes of families and households are $125,325 and $108,279 respectively.
| Characteristic | Number | Measure |
| Per Capita Income | 23,346 | $76,296 |
| Median Family Income | 6,001 | $125,325 |
| Mean Family Income | 6,001 | $220,336 |
| Median Household Income | 9,645 | $108,279 |
| Mean Household Income | 9,645 | $182,050 |
| Income Deficit | 6,001 | $0 |
| Wage / Income Gap (%) | 23,346 | 26.99% |
| Wage / Income Gap ($) | 23,346 | 73.01¢ per $1 |
| Gini / Inequality Index | 23,346 | 0.54 |
Earnings by Sex in Teton County
Average Earnings in Teton County are $46,730, $53,314 for men and $38,924 for women, a difference of 27.0%.
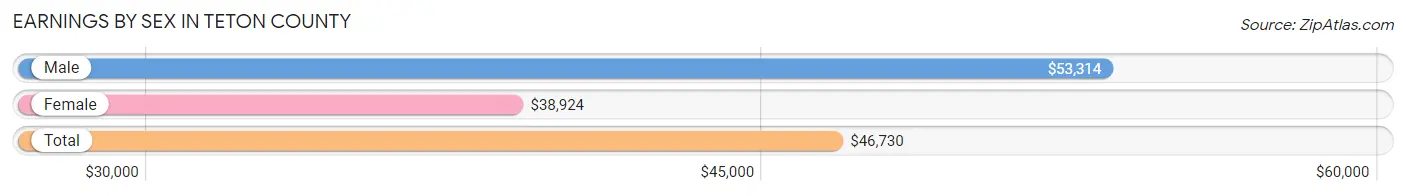
| Sex | Number | Average Earnings |
| Male | 8,677 (54.1%) | $53,314 |
| Female | 7,372 (45.9%) | $38,924 |
| Total | 16,049 (100.0%) | $46,730 |
Earnings by Sex by Income Bracket in Teton County
The most common earnings brackets in Teton County are $100,000+ for men (1,895 | 21.8%) and $75,000 to $99,999 for women (925 | 12.6%).
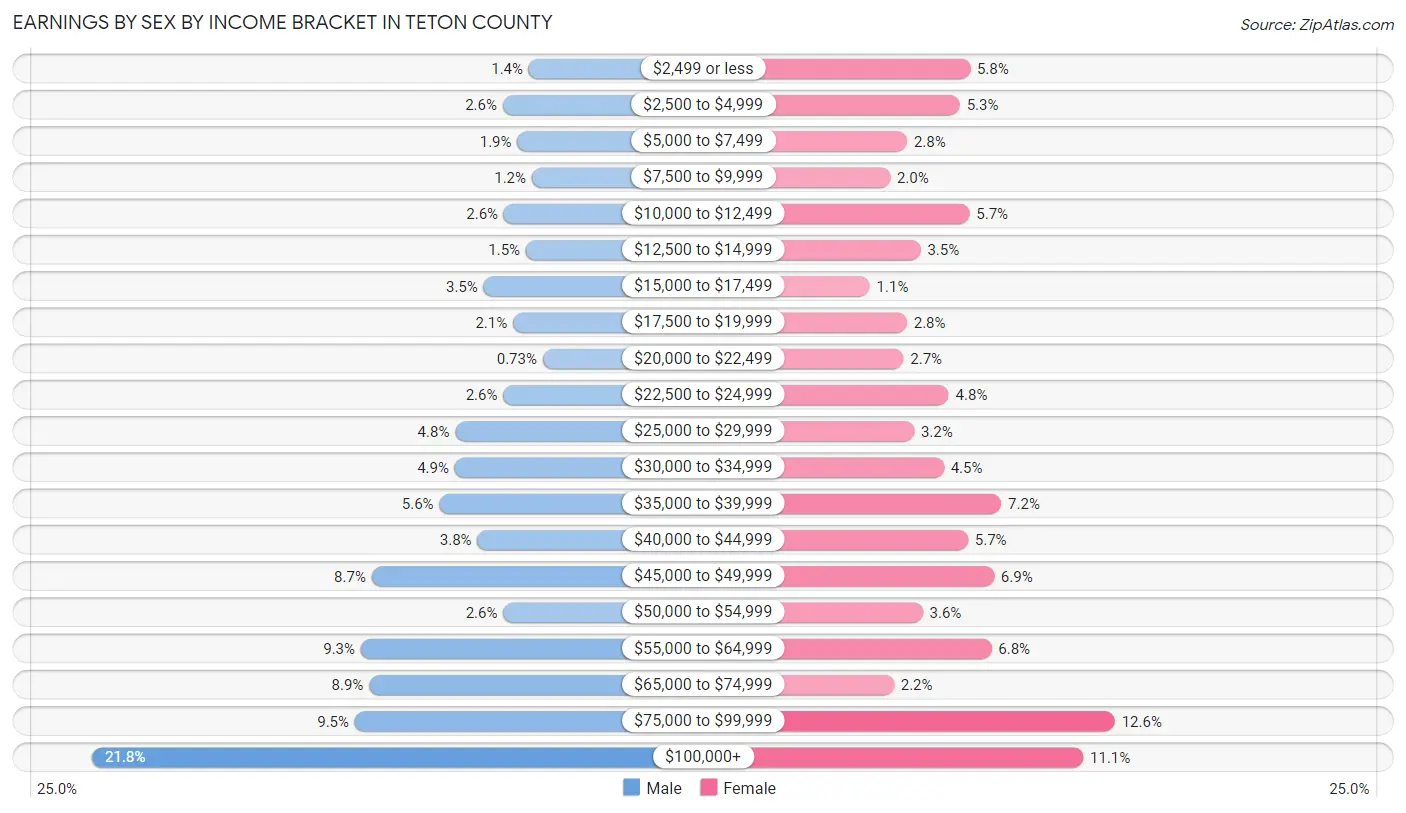
| Income | Male | Female |
| $2,499 or less | 120 (1.4%) | 425 (5.8%) |
| $2,500 to $4,999 | 226 (2.6%) | 390 (5.3%) |
| $5,000 to $7,499 | 167 (1.9%) | 208 (2.8%) |
| $7,500 to $9,999 | 108 (1.2%) | 149 (2.0%) |
| $10,000 to $12,499 | 221 (2.5%) | 423 (5.7%) |
| $12,500 to $14,999 | 132 (1.5%) | 254 (3.5%) |
| $15,000 to $17,499 | 304 (3.5%) | 79 (1.1%) |
| $17,500 to $19,999 | 184 (2.1%) | 207 (2.8%) |
| $20,000 to $22,499 | 63 (0.7%) | 195 (2.6%) |
| $22,500 to $24,999 | 224 (2.6%) | 352 (4.8%) |
| $25,000 to $29,999 | 419 (4.8%) | 232 (3.2%) |
| $30,000 to $34,999 | 421 (4.9%) | 335 (4.5%) |
| $35,000 to $39,999 | 483 (5.6%) | 533 (7.2%) |
| $40,000 to $44,999 | 329 (3.8%) | 418 (5.7%) |
| $45,000 to $49,999 | 758 (8.7%) | 508 (6.9%) |
| $50,000 to $54,999 | 224 (2.6%) | 262 (3.5%) |
| $55,000 to $64,999 | 803 (9.2%) | 499 (6.8%) |
| $65,000 to $74,999 | 769 (8.9%) | 162 (2.2%) |
| $75,000 to $99,999 | 827 (9.5%) | 925 (12.6%) |
| $100,000+ | 1,895 (21.8%) | 816 (11.1%) |
| Total | 8,677 (100.0%) | 7,372 (100.0%) |
Earnings by Sex by Educational Attainment in Teton County
Average earnings in Teton County are $58,108 for men and $42,831 for women, a difference of 26.3%. Men with an educational attainment of graduate degree enjoy the highest average annual earnings of $91,607, while those with high school diploma education earn the least with $43,480. Women with an educational attainment of graduate degree earn the most with the average annual earnings of $81,309, while those with less than high school education have the smallest earnings of $18,028.
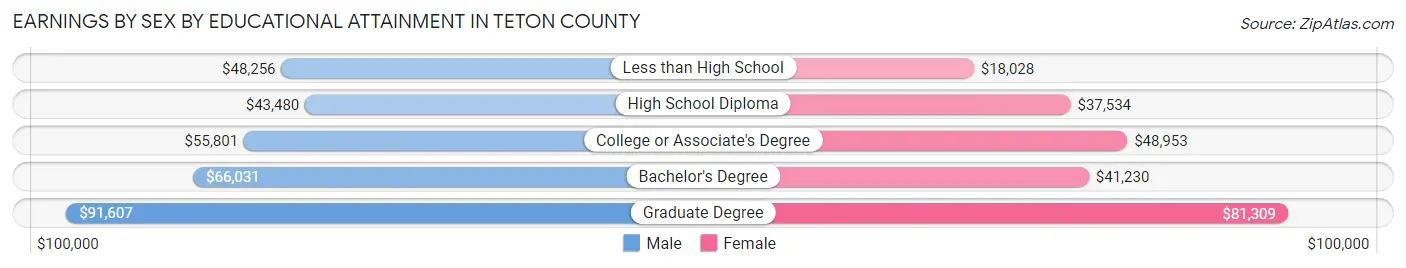
| Educational Attainment | Male Income | Female Income |
| Less than High School | $48,256 | $18,028 |
| High School Diploma | $43,480 | $37,534 |
| College or Associate's Degree | $55,801 | $48,953 |
| Bachelor's Degree | $66,031 | $41,230 |
| Graduate Degree | $91,607 | $81,309 |
| Total | $58,108 | $42,831 |
Family Income in Teton County
Family Income Brackets in Teton County
According to the Teton County family income data, there are 1,608 families falling into the $200,000+ income range, which is the most common income bracket and makes up 26.8% of all families. Conversely, the $10,000 to $14,999 income bracket is the least frequent group with only 30 families (0.5%) belonging to this category.
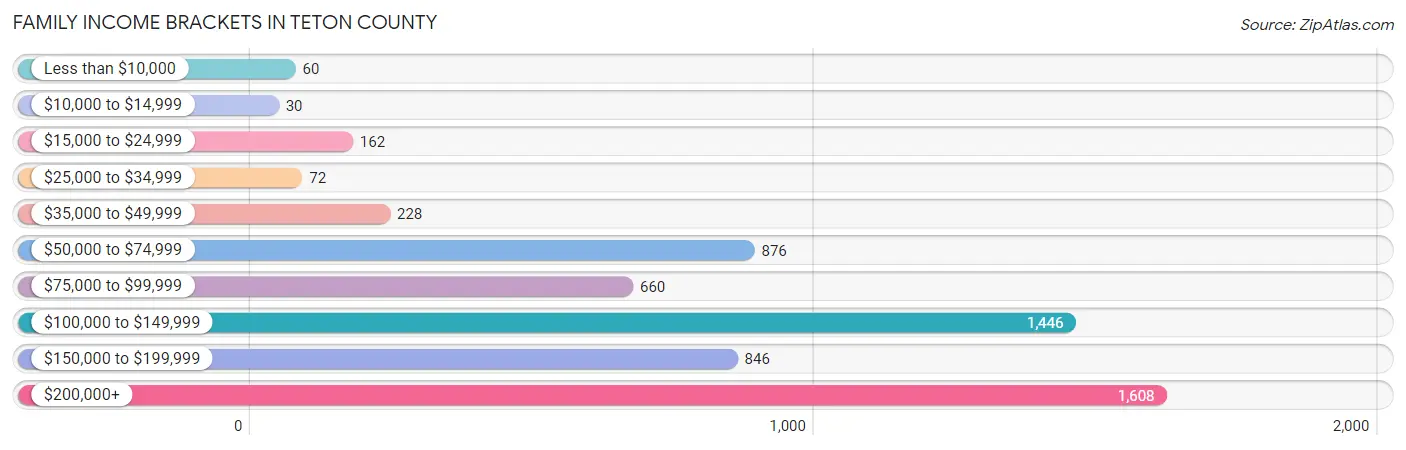
| Income Bracket | # Families | % Families |
| Less than $10,000 | 60 | 1.0% |
| $10,000 to $14,999 | 30 | 0.5% |
| $15,000 to $24,999 | 162 | 2.7% |
| $25,000 to $34,999 | 72 | 1.2% |
| $35,000 to $49,999 | 228 | 3.8% |
| $50,000 to $74,999 | 876 | 14.6% |
| $75,000 to $99,999 | 660 | 11.0% |
| $100,000 to $149,999 | 1,446 | 24.1% |
| $150,000 to $199,999 | 846 | 14.1% |
| $200,000+ | 1,608 | 26.8% |
Family Income by Famaliy Size in Teton County
4-person families (757 | 12.6%) account for the highest median family income in Teton County with $192,303 per family, while 2-person families (3,017 | 50.3%) have the highest median income of $56,149 per family member.

| Income Bracket | # Families | Median Income |
| 2-Person Families | 3,017 (50.3%) | $112,298 |
| 3-Person Families | 1,611 (26.9%) | $113,460 |
| 4-Person Families | 757 (12.6%) | $192,303 |
| 5-Person Families | 442 (7.4%) | $125,746 |
| 6-Person Families | 133 (2.2%) | $91,589 |
| 7+ Person Families | 41 (0.7%) | $0 |
| Total | 6,001 (100.0%) | $125,325 |
Family Income by Number of Earners in Teton County
The median family income in Teton County is $125,325, with families comprising 3+ earners (557) having the highest median family income of $155,579, while families with no earners (729) have the lowest median family income of $108,377, accounting for 9.3% and 12.1% of families, respectively.
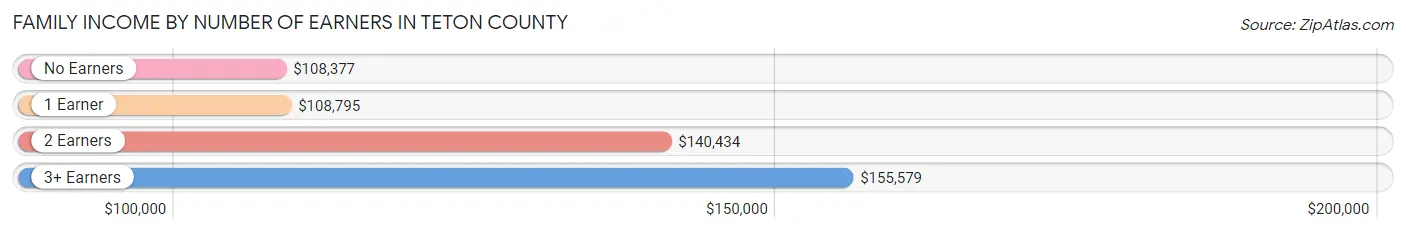
| Number of Earners | # Families | Median Income |
| No Earners | 729 (12.1%) | $108,377 |
| 1 Earner | 1,467 (24.4%) | $108,795 |
| 2 Earners | 3,248 (54.1%) | $140,434 |
| 3+ Earners | 557 (9.3%) | $155,579 |
| Total | 6,001 (100.0%) | $125,325 |
Household Income in Teton County
Household Income Brackets in Teton County
With 2,160 households falling in the category, the $200,000+ income range is the most frequent in Teton County, accounting for 22.4% of all households. In contrast, only 183 households (1.9%) fall into the less than $10,000 income bracket, making it the least populous group.
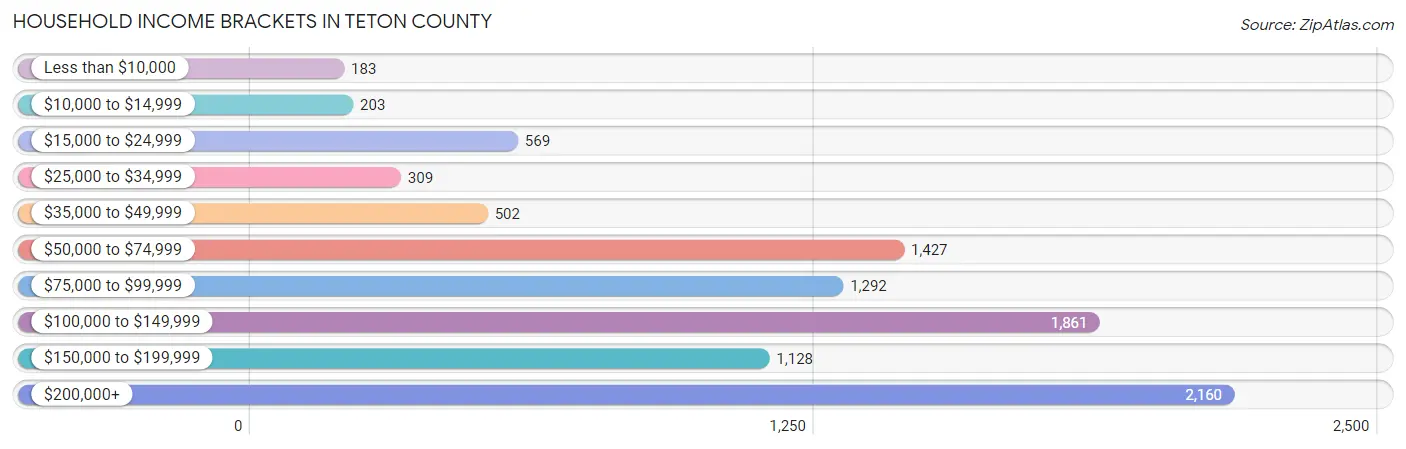
| Income Bracket | # Households | % Households |
| Less than $10,000 | 183 | 1.9% |
| $10,000 to $14,999 | 203 | 2.1% |
| $15,000 to $24,999 | 569 | 5.9% |
| $25,000 to $34,999 | 309 | 3.2% |
| $35,000 to $49,999 | 502 | 5.2% |
| $50,000 to $74,999 | 1,427 | 14.8% |
| $75,000 to $99,999 | 1,292 | 13.4% |
| $100,000 to $149,999 | 1,861 | 19.3% |
| $150,000 to $199,999 | 1,128 | 11.7% |
| $200,000+ | 2,160 | 22.4% |
Household Income by Householder Age in Teton County
The median household income in Teton County is $108,279, with the highest median household income of $116,809 found in the 45 to 64 years age bracket for the primary householder. A total of 3,346 households (34.7%) fall into this category. Meanwhile, the 15 to 24 years age bracket for the primary householder has the lowest median household income of $59,560, with 207 households (2.1%) in this group.
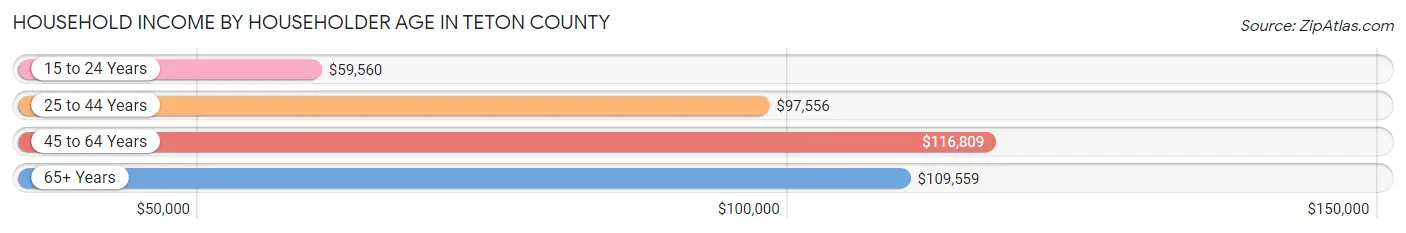
| Income Bracket | # Households | Median Income |
| 15 to 24 Years | 207 (2.1%) | $59,560 |
| 25 to 44 Years | 3,748 (38.9%) | $97,556 |
| 45 to 64 Years | 3,346 (34.7%) | $116,809 |
| 65+ Years | 2,344 (24.3%) | $109,559 |
| Total | 9,645 (100.0%) | $108,279 |
Poverty in Teton County
Income Below Poverty by Sex and Age in Teton County
With 5.8% poverty level for males and 8.1% for females among the residents of Teton County, 5 year old males and 18 to 24 year old females are the most vulnerable to poverty, with 46 males (45.5%) and 230 females (35.3%) in their respective age groups living below the poverty level.
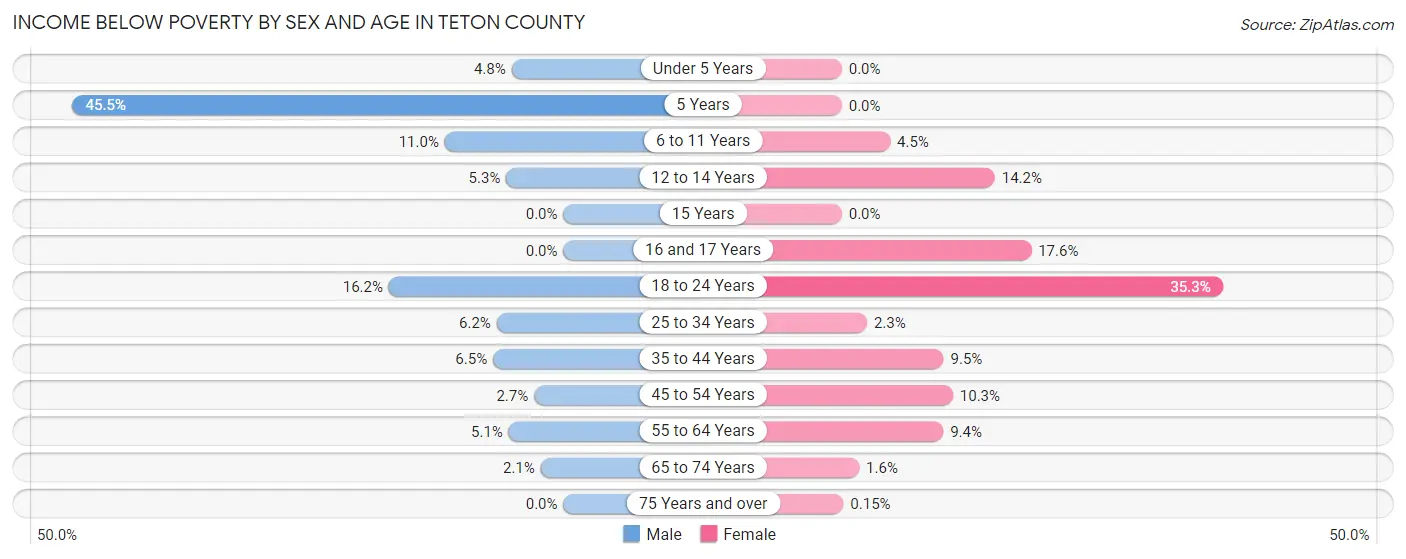
| Age Bracket | Male | Female |
| Under 5 Years | 26 (4.8%) | 0 (0.0%) |
| 5 Years | 46 (45.5%) | 0 (0.0%) |
| 6 to 11 Years | 83 (11.0%) | 33 (4.5%) |
| 12 to 14 Years | 23 (5.3%) | 68 (14.2%) |
| 15 Years | 0 (0.0%) | 0 (0.0%) |
| 16 and 17 Years | 0 (0.0%) | 45 (17.6%) |
| 18 to 24 Years | 109 (16.2%) | 230 (35.3%) |
| 25 to 34 Years | 139 (6.2%) | 44 (2.3%) |
| 35 to 44 Years | 139 (6.5%) | 191 (9.5%) |
| 45 to 54 Years | 44 (2.7%) | 141 (10.3%) |
| 55 to 64 Years | 69 (5.1%) | 127 (9.4%) |
| 65 to 74 Years | 28 (2.1%) | 20 (1.6%) |
| 75 Years and over | 0 (0.0%) | 1 (0.2%) |
| Total | 706 (5.8%) | 900 (8.1%) |
Income Above Poverty by Sex and Age in Teton County
According to the poverty statistics in Teton County, males aged 15 years and females aged under 5 years are the age groups that are most secure financially, with 100.0% of males and 100.0% of females in these age groups living above the poverty line.
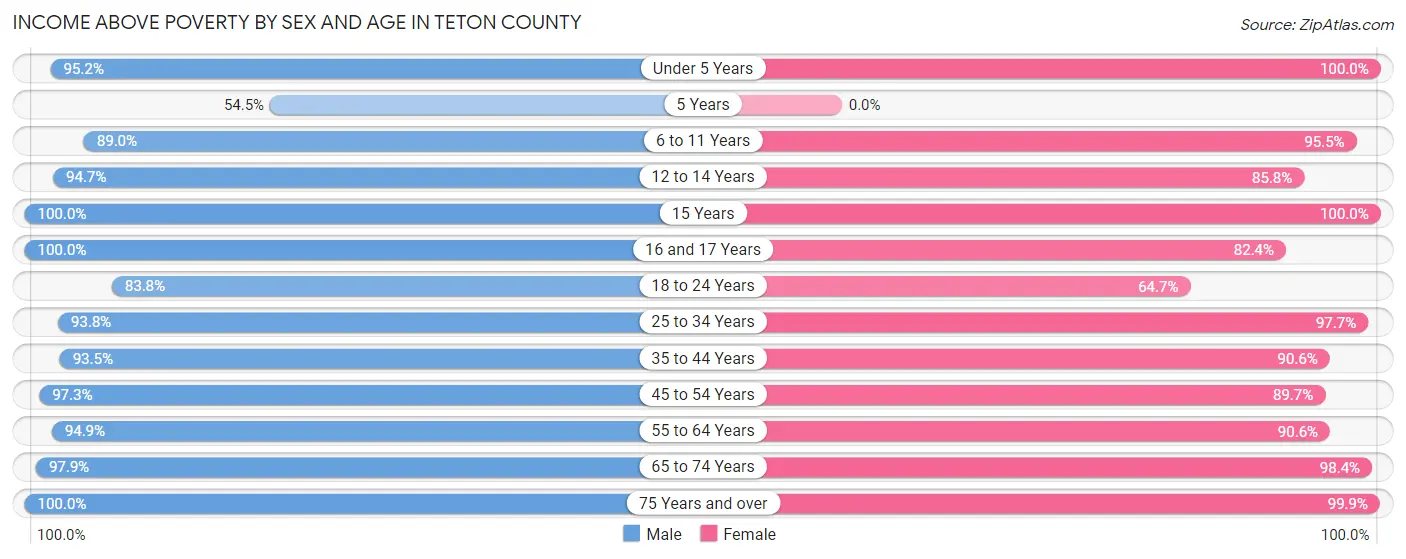
| Age Bracket | Male | Female |
| Under 5 Years | 515 (95.2%) | 421 (100.0%) |
| 5 Years | 55 (54.5%) | 0 (0.0%) |
| 6 to 11 Years | 671 (89.0%) | 703 (95.5%) |
| 12 to 14 Years | 411 (94.7%) | 411 (85.8%) |
| 15 Years | 99 (100.0%) | 86 (100.0%) |
| 16 and 17 Years | 198 (100.0%) | 211 (82.4%) |
| 18 to 24 Years | 564 (83.8%) | 421 (64.7%) |
| 25 to 34 Years | 2,107 (93.8%) | 1,833 (97.7%) |
| 35 to 44 Years | 1,989 (93.5%) | 1,830 (90.5%) |
| 45 to 54 Years | 1,574 (97.3%) | 1,227 (89.7%) |
| 55 to 64 Years | 1,291 (94.9%) | 1,223 (90.6%) |
| 65 to 74 Years | 1,297 (97.9%) | 1,223 (98.4%) |
| 75 Years and over | 602 (100.0%) | 662 (99.9%) |
| Total | 11,373 (94.2%) | 10,251 (91.9%) |
Income Below Poverty Among Married-Couple Families in Teton County
The poverty statistics for married-couple families in Teton County show that 2.0% or 101 of the total 5,019 families live below the poverty line. Families with 3 or 4 children have the highest poverty rate of 14.8%, comprising of 62 families. On the other hand, families with 1 or 2 children have the lowest poverty rate of 0.0%, which includes 0 families.
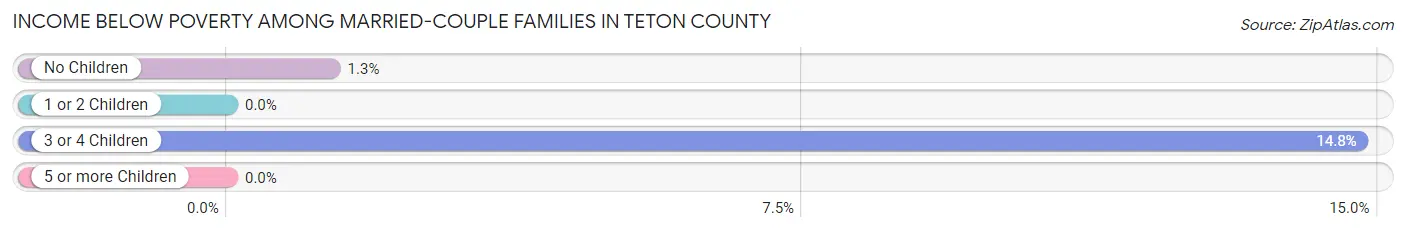
| Children | Above Poverty | Below Poverty |
| No Children | 2,861 (98.7%) | 39 (1.3%) |
| 1 or 2 Children | 1,658 (100.0%) | 0 (0.0%) |
| 3 or 4 Children | 358 (85.2%) | 62 (14.8%) |
| 5 or more Children | 41 (100.0%) | 0 (0.0%) |
| Total | 4,918 (98.0%) | 101 (2.0%) |
Income Below Poverty Among Single-Parent Households in Teton County
According to the poverty data in Teton County, 11.5% or 54 single-father households and 14.9% or 76 single-mother households are living below the poverty line. Among single-father households, those with 1 or 2 children have the highest poverty rate, with 54 households (23.1%) experiencing poverty. Likewise, among single-mother households, those with 3 or 4 children have the highest poverty rate, with 36 households (100.0%) falling below the poverty line.
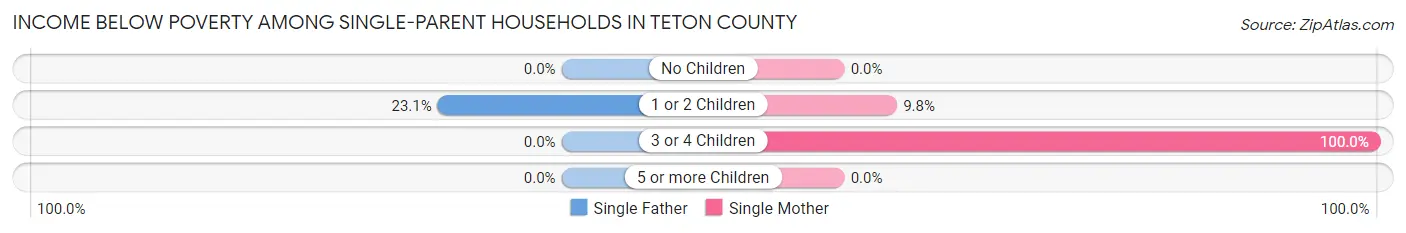
| Children | Single Father | Single Mother |
| No Children | 0 (0.0%) | 0 (0.0%) |
| 1 or 2 Children | 54 (23.1%) | 40 (9.8%) |
| 3 or 4 Children | 0 (0.0%) | 36 (100.0%) |
| 5 or more Children | 0 (0.0%) | 0 (0.0%) |
| Total | 54 (11.5%) | 76 (14.9%) |
Income Below Poverty Among Married-Couple vs Single-Parent Households in Teton County
The poverty data for Teton County shows that 101 of the married-couple family households (2.0%) and 130 of the single-parent households (13.2%) are living below the poverty level. Within the married-couple family households, those with 3 or 4 children have the highest poverty rate, with 62 households (14.8%) falling below the poverty line. Among the single-parent households, those with 3 or 4 children have the highest poverty rate, with 36 household (40.9%) living below poverty.
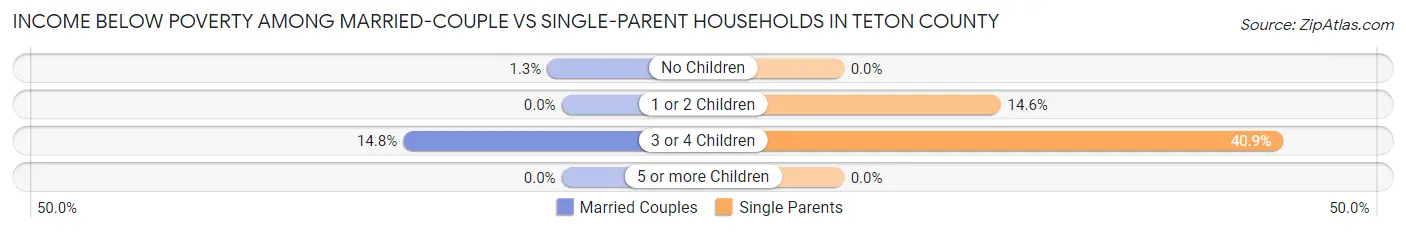
| Children | Married-Couple Families | Single-Parent Households |
| No Children | 39 (1.3%) | 0 (0.0%) |
| 1 or 2 Children | 0 (0.0%) | 94 (14.6%) |
| 3 or 4 Children | 62 (14.8%) | 36 (40.9%) |
| 5 or more Children | 0 (0.0%) | 0 (0.0%) |
| Total | 101 (2.0%) | 130 (13.2%) |
Employment Characteristics in Teton County
Employment by Class of Employer in Teton County
Among the 14,567 employed individuals in Teton County, private company employees (8,870 | 60.9%), self-employed (incorporated) (1,348 | 9.2%), and self-employed (not incorporated) (1,335 | 9.2%) make up the most common classes of employment.
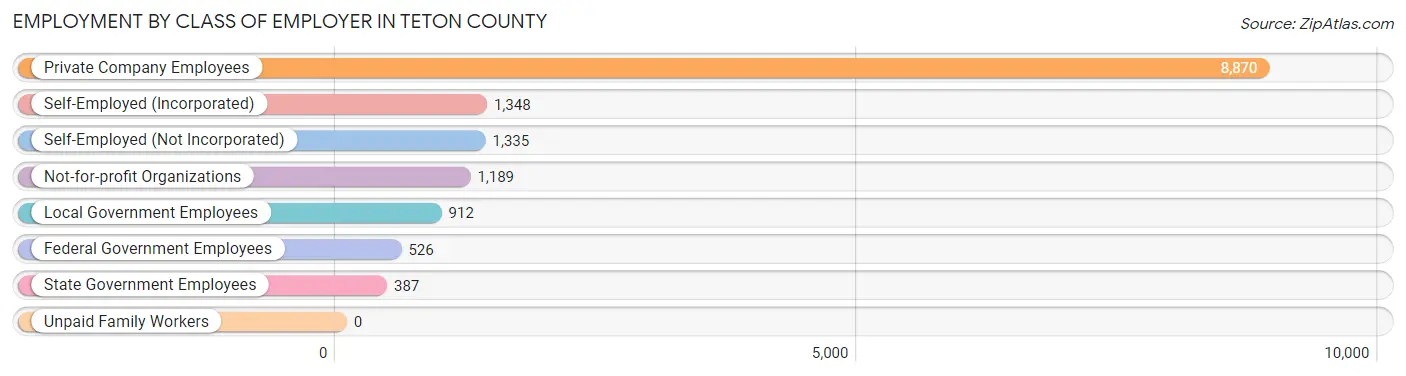
| Employer Class | # Employees | % Employees |
| Private Company Employees | 8,870 | 60.9% |
| Self-Employed (Incorporated) | 1,348 | 9.2% |
| Self-Employed (Not Incorporated) | 1,335 | 9.2% |
| Not-for-profit Organizations | 1,189 | 8.2% |
| Local Government Employees | 912 | 6.3% |
| State Government Employees | 387 | 2.7% |
| Federal Government Employees | 526 | 3.6% |
| Unpaid Family Workers | 0 | 0.0% |
| Total | 14,567 | 100.0% |
Employment Status by Age in Teton County
According to the labor force statistics for Teton County, out of the total population over 16 years of age (19,688), 78.6% or 15,475 individuals are in the labor force, with 2.1% or 325 of them unemployed. The age group with the highest labor force participation rate is 25 to 29 years, with 99.9% or 1,957 individuals in the labor force. Within the labor force, the 20 to 24 years age range has the highest percentage of unemployed individuals, with 12.7% or 105 of them being unemployed.

| Age Bracket | In Labor Force | Unemployed |
| 16 to 19 Years | 465 (55.5%) | 6 (1.3%) |
| 20 to 24 Years | 829 (84.9%) | 105 (12.7%) |
| 25 to 29 Years | 1,957 (99.9%) | 14 (0.7%) |
| 30 to 34 Years | 2,024 (93.4%) | 28 (1.4%) |
| 35 to 44 Years | 4,053 (97.6%) | 65 (1.6%) |
| 45 to 54 Years | 2,784 (93.2%) | 39 (1.4%) |
| 55 to 59 Years | 940 (79.9%) | 0 (0.0%) |
| 60 to 64 Years | 1,195 (77.4%) | 13 (1.1%) |
| 65 to 74 Years | 1,085 (42.2%) | 52 (4.8%) |
| 75 Years and over | 143 (10.9%) | 0 (0.0%) |
| Total | 15,475 (78.6%) | 325 (2.1%) |
Employment Status by Educational Attainment in Teton County
According to labor force statistics for Teton County, 92.6% of individuals (12,951) out of the total population between 25 and 64 years of age (13,986) are in the labor force, with 1.2% or 155 of them being unemployed. The group with the highest labor force participation rate are those with the educational attainment of less than high school, with 100.0% or 642 individuals in the labor force. Within the labor force, individuals with high school diploma education have the highest percentage of unemployment, with 2.0% or 47 of them being unemployed.
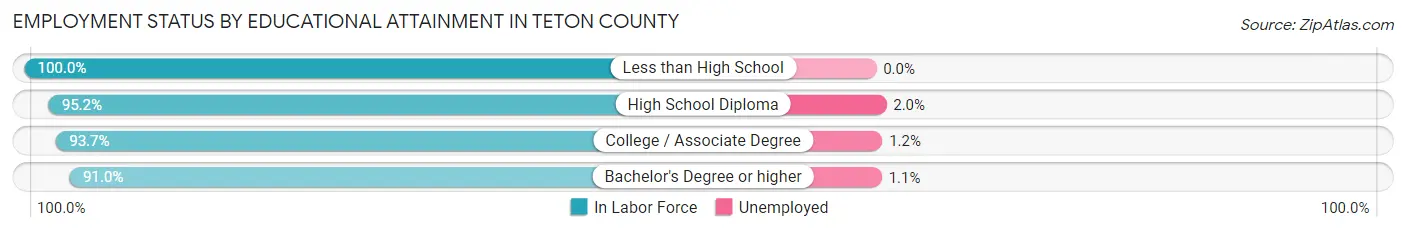
| Educational Attainment | In Labor Force | Unemployed |
| Less than High School | 642 (100.0%) | 0 (0.0%) |
| High School Diploma | 2,332 (95.2%) | 49 (2.0%) |
| College / Associate Degree | 2,342 (93.7%) | 30 (1.2%) |
| Bachelor's Degree or higher | 7,639 (91.0%) | 92 (1.1%) |
| Total | 12,951 (92.6%) | 168 (1.2%) |
Employment Occupations by Sex in Teton County
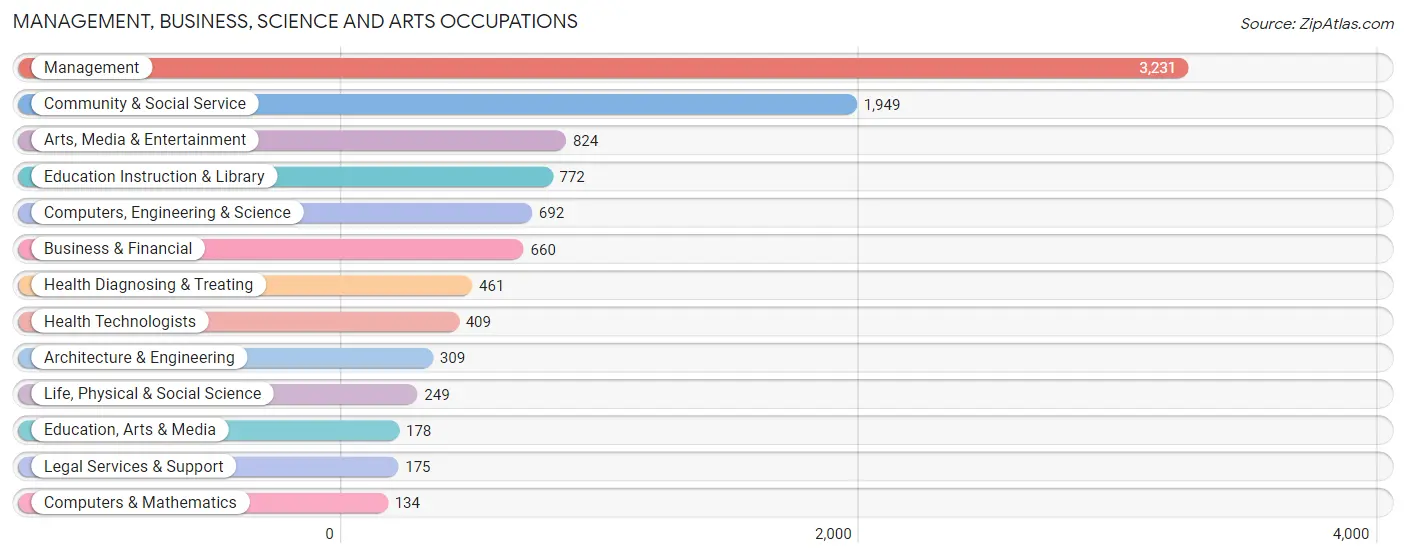
Management, Business, Science and Arts Occupations
The most common Management, Business, Science and Arts occupations in Teton County are Management (3,231 | 21.3%), Community & Social Service (1,949 | 12.9%), Arts, Media & Entertainment (824 | 5.4%), Education Instruction & Library (772 | 5.1%), and Computers, Engineering & Science (692 | 4.6%).
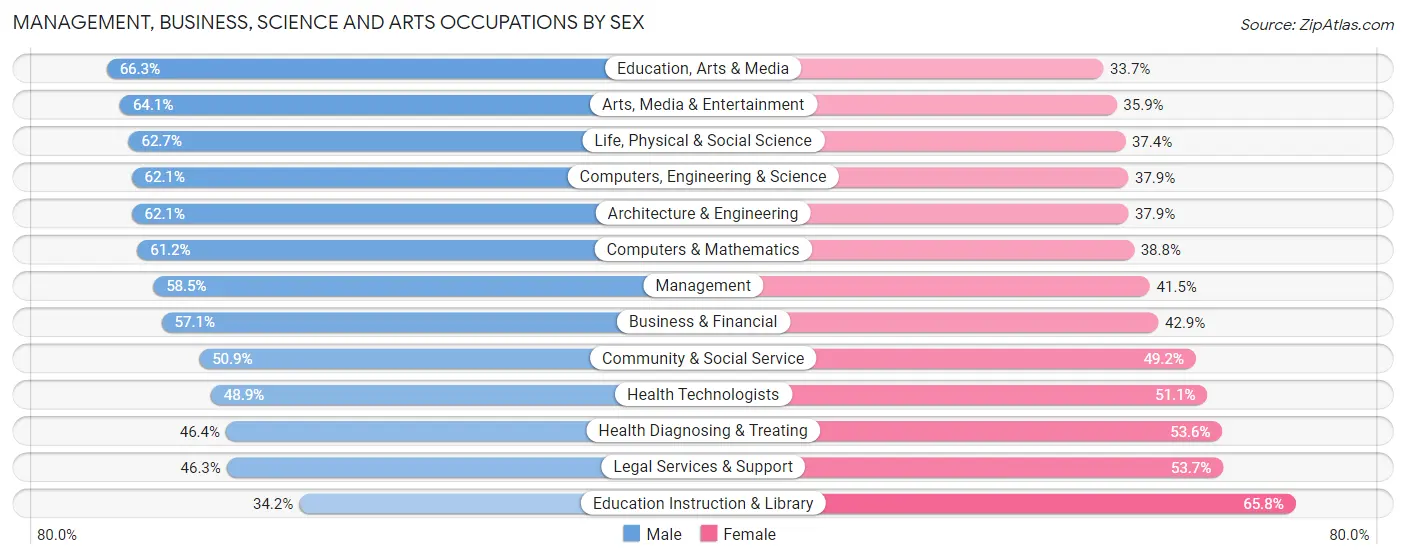
Management, Business, Science and Arts Occupations by Sex
Within the Management, Business, Science and Arts occupations in Teton County, the most male-oriented occupations are Education, Arts & Media (66.3%), Arts, Media & Entertainment (64.1%), and Life, Physical & Social Science (62.6%), while the most female-oriented occupations are Education Instruction & Library (65.8%), Legal Services & Support (53.7%), and Health Diagnosing & Treating (53.6%).
| Occupation | Male | Female |
| Management | 1,891 (58.5%) | 1,340 (41.5%) |
| Business & Financial | 377 (57.1%) | 283 (42.9%) |
| Computers, Engineering & Science | 430 (62.1%) | 262 (37.9%) |
| Computers & Mathematics | 82 (61.2%) | 52 (38.8%) |
| Architecture & Engineering | 192 (62.1%) | 117 (37.9%) |
| Life, Physical & Social Science | 156 (62.6%) | 93 (37.3%) |
| Community & Social Service | 991 (50.8%) | 958 (49.1%) |
| Education, Arts & Media | 118 (66.3%) | 60 (33.7%) |
| Legal Services & Support | 81 (46.3%) | 94 (53.7%) |
| Education Instruction & Library | 264 (34.2%) | 508 (65.8%) |
| Arts, Media & Entertainment | 528 (64.1%) | 296 (35.9%) |
| Health Diagnosing & Treating | 214 (46.4%) | 247 (53.6%) |
| Health Technologists | 200 (48.9%) | 209 (51.1%) |
| Total (Category) | 3,903 (55.8%) | 3,090 (44.2%) |
| Total (Overall) | 8,339 (55.0%) | 6,817 (45.0%) |
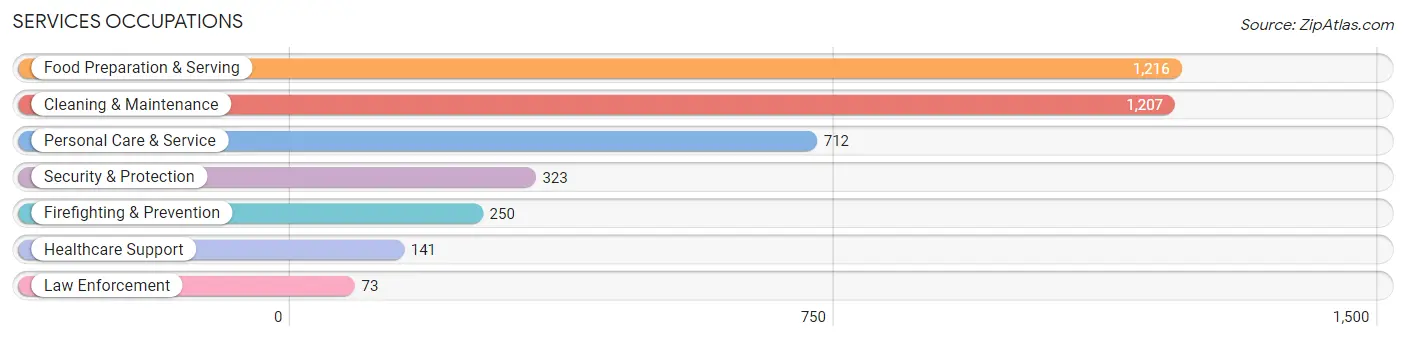
Services Occupations
The most common Services occupations in Teton County are Food Preparation & Serving (1,216 | 8.0%), Cleaning & Maintenance (1,207 | 8.0%), Personal Care & Service (712 | 4.7%), Security & Protection (323 | 2.1%), and Firefighting & Prevention (250 | 1.7%).
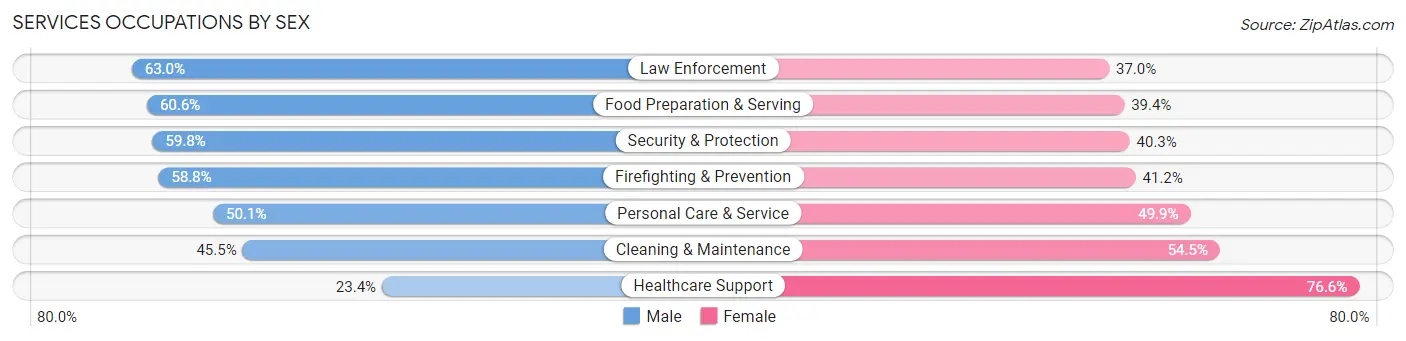
Services Occupations by Sex
Within the Services occupations in Teton County, the most male-oriented occupations are Law Enforcement (63.0%), Food Preparation & Serving (60.6%), and Security & Protection (59.8%), while the most female-oriented occupations are Healthcare Support (76.6%), Cleaning & Maintenance (54.5%), and Personal Care & Service (49.9%).
| Occupation | Male | Female |
| Healthcare Support | 33 (23.4%) | 108 (76.6%) |
| Security & Protection | 193 (59.8%) | 130 (40.3%) |
| Firefighting & Prevention | 147 (58.8%) | 103 (41.2%) |
| Law Enforcement | 46 (63.0%) | 27 (37.0%) |
| Food Preparation & Serving | 737 (60.6%) | 479 (39.4%) |
| Cleaning & Maintenance | 549 (45.5%) | 658 (54.5%) |
| Personal Care & Service | 357 (50.1%) | 355 (49.9%) |
| Total (Category) | 1,869 (51.9%) | 1,730 (48.1%) |
| Total (Overall) | 8,339 (55.0%) | 6,817 (45.0%) |
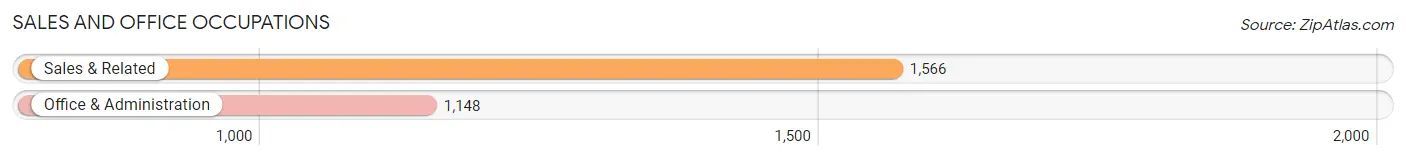
Sales and Office Occupations
The most common Sales and Office occupations in Teton County are Sales & Related (1,566 | 10.3%), and Office & Administration (1,148 | 7.6%).
Sales and Office Occupations by Sex
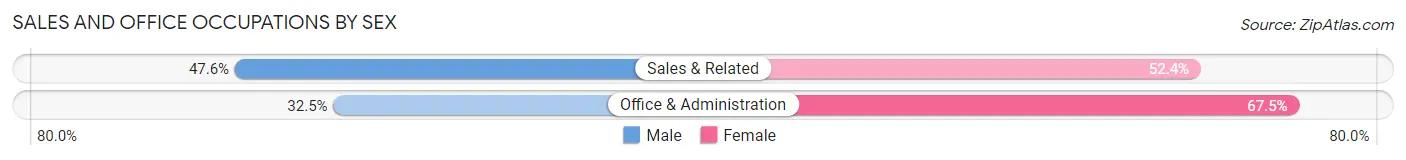
| Occupation | Male | Female |
| Sales & Related | 746 (47.6%) | 820 (52.4%) |
| Office & Administration | 373 (32.5%) | 775 (67.5%) |
| Total (Category) | 1,119 (41.2%) | 1,595 (58.8%) |
| Total (Overall) | 8,339 (55.0%) | 6,817 (45.0%) |
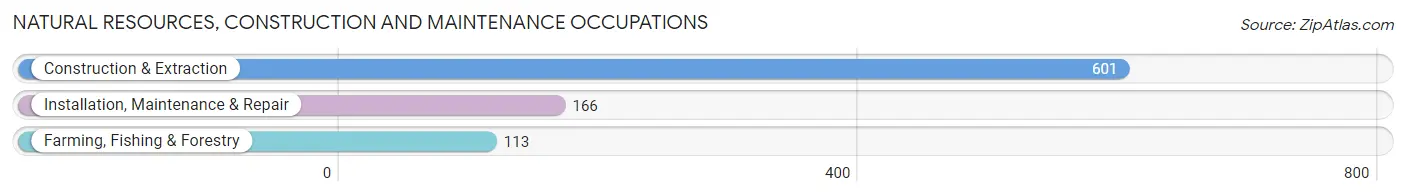
Natural Resources, Construction and Maintenance Occupations
The most common Natural Resources, Construction and Maintenance occupations in Teton County are Construction & Extraction (601 | 4.0%), Installation, Maintenance & Repair (166 | 1.1%), and Farming, Fishing & Forestry (113 | 0.7%).
Natural Resources, Construction and Maintenance Occupations by Sex
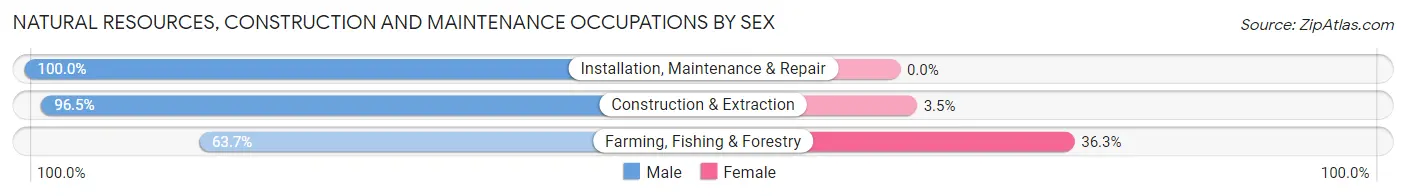
| Occupation | Male | Female |
| Farming, Fishing & Forestry | 72 (63.7%) | 41 (36.3%) |
| Construction & Extraction | 580 (96.5%) | 21 (3.5%) |
| Installation, Maintenance & Repair | 166 (100.0%) | 0 (0.0%) |
| Total (Category) | 818 (92.9%) | 62 (7.0%) |
| Total (Overall) | 8,339 (55.0%) | 6,817 (45.0%) |
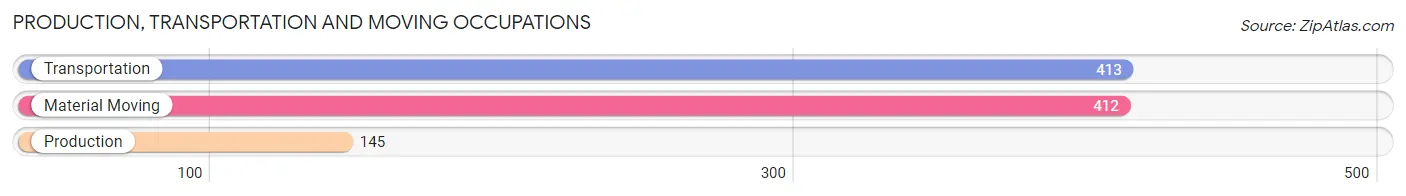
Production, Transportation and Moving Occupations
The most common Production, Transportation and Moving occupations in Teton County are Transportation (413 | 2.7%), Material Moving (412 | 2.7%), and Production (145 | 1.0%).
Production, Transportation and Moving Occupations by Sex
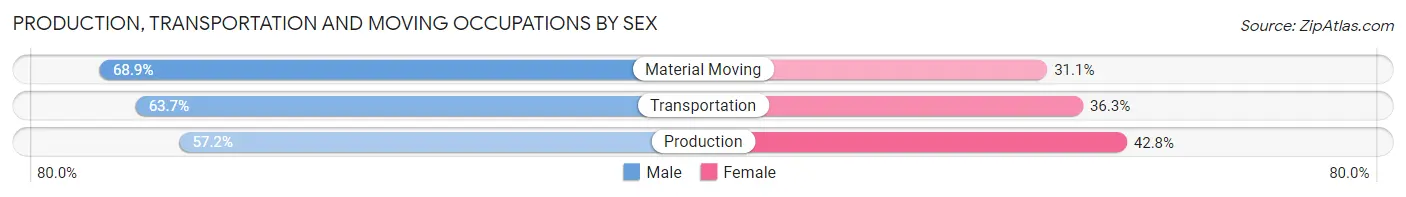
| Occupation | Male | Female |
| Production | 83 (57.2%) | 62 (42.8%) |
| Transportation | 263 (63.7%) | 150 (36.3%) |
| Material Moving | 284 (68.9%) | 128 (31.1%) |
| Total (Category) | 630 (64.9%) | 340 (35.0%) |
| Total (Overall) | 8,339 (55.0%) | 6,817 (45.0%) |
Employment Industries by Sex in Teton County
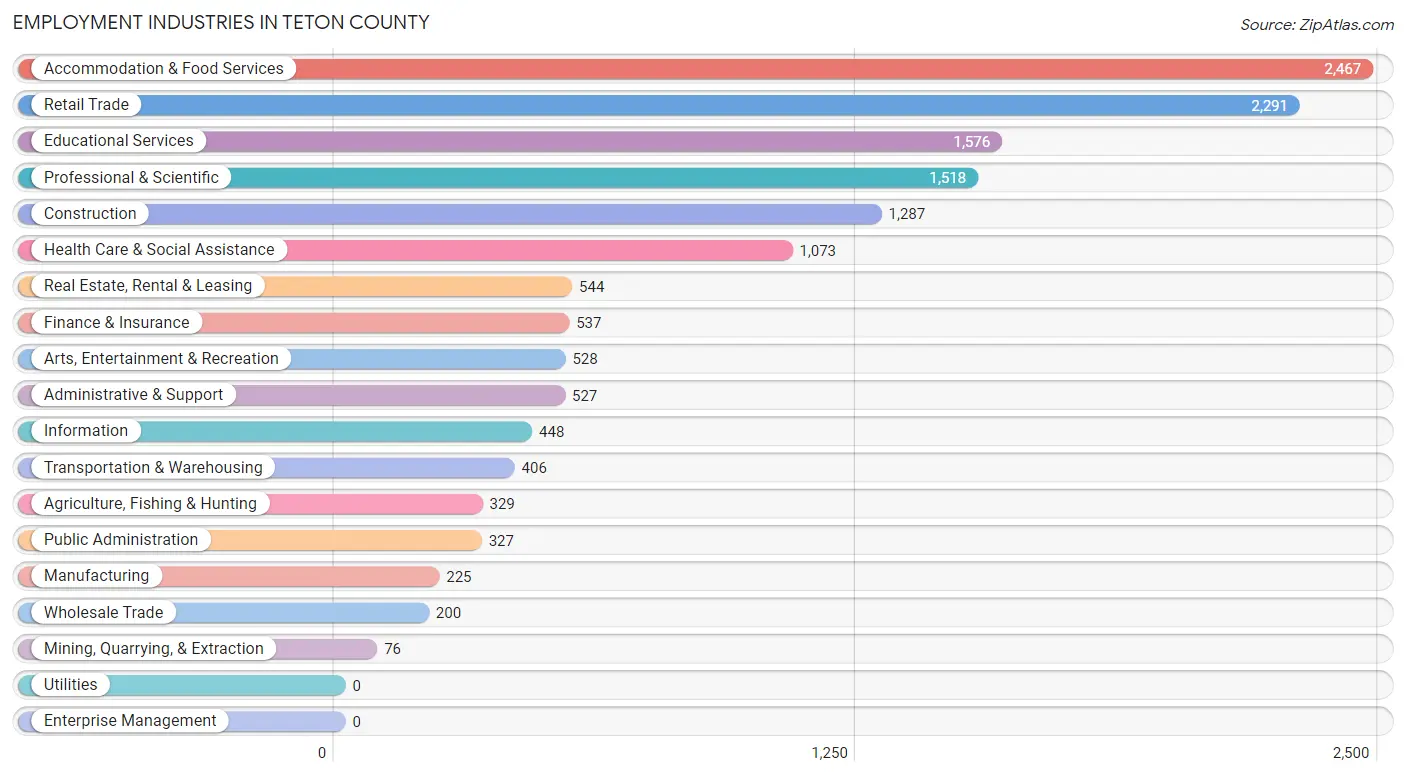
Employment Industries in Teton County
The major employment industries in Teton County include Accommodation & Food Services (2,467 | 16.3%), Retail Trade (2,291 | 15.1%), Educational Services (1,576 | 10.4%), Professional & Scientific (1,518 | 10.0%), and Construction (1,287 | 8.5%).
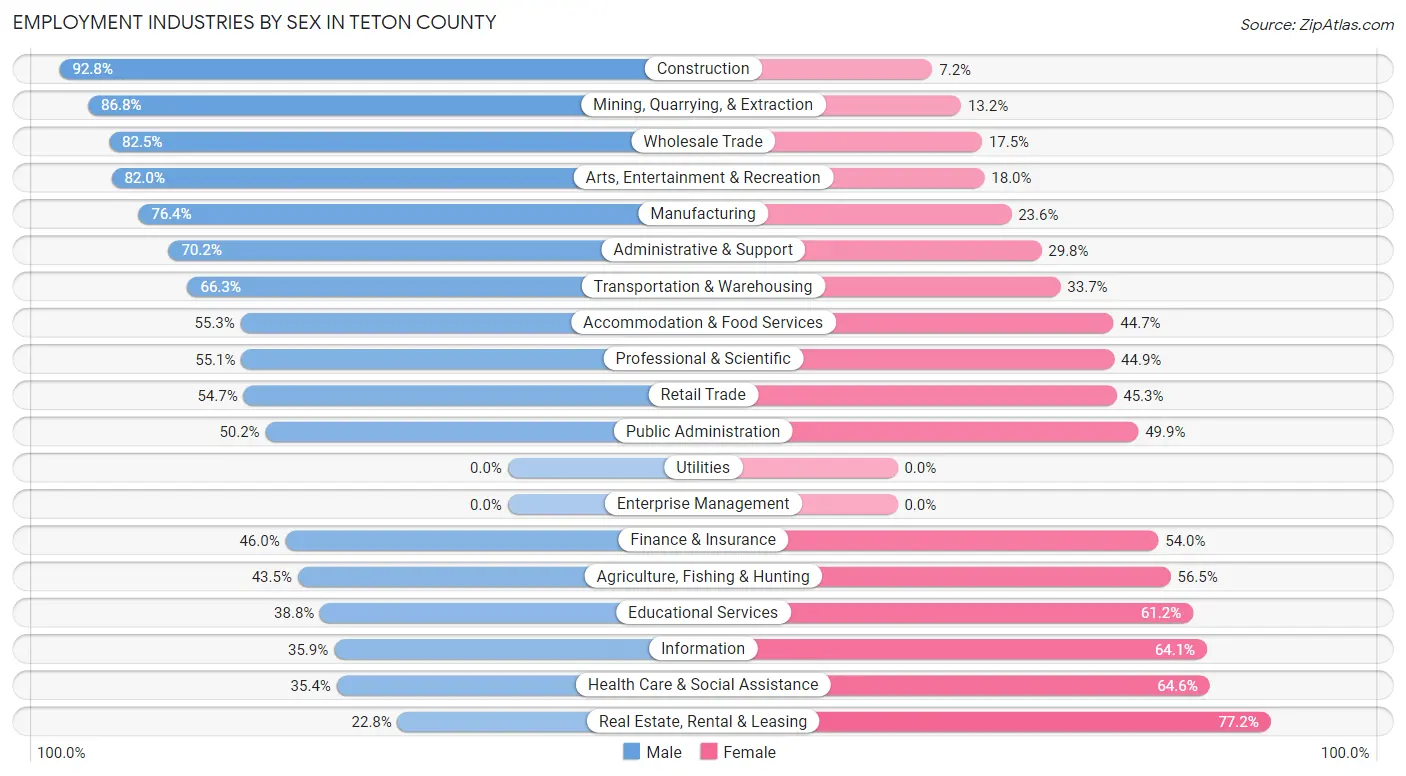
Employment Industries by Sex in Teton County
The Teton County industries that see more men than women are Construction (92.8%), Mining, Quarrying, & Extraction (86.8%), and Wholesale Trade (82.5%), whereas the industries that tend to have a higher number of women are Real Estate, Rental & Leasing (77.2%), Health Care & Social Assistance (64.6%), and Information (64.1%).
| Industry | Male | Female |
| Agriculture, Fishing & Hunting | 143 (43.5%) | 186 (56.5%) |
| Mining, Quarrying, & Extraction | 66 (86.8%) | 10 (13.2%) |
| Construction | 1,194 (92.8%) | 93 (7.2%) |
| Manufacturing | 172 (76.4%) | 53 (23.6%) |
| Wholesale Trade | 165 (82.5%) | 35 (17.5%) |
| Retail Trade | 1,253 (54.7%) | 1,038 (45.3%) |
| Transportation & Warehousing | 269 (66.3%) | 137 (33.7%) |
| Utilities | 0 (0.0%) | 0 (0.0%) |
| Information | 161 (35.9%) | 287 (64.1%) |
| Finance & Insurance | 247 (46.0%) | 290 (54.0%) |
| Real Estate, Rental & Leasing | 124 (22.8%) | 420 (77.2%) |
| Professional & Scientific | 837 (55.1%) | 681 (44.9%) |
| Enterprise Management | 0 (0.0%) | 0 (0.0%) |
| Administrative & Support | 370 (70.2%) | 157 (29.8%) |
| Educational Services | 612 (38.8%) | 964 (61.2%) |
| Health Care & Social Assistance | 380 (35.4%) | 693 (64.6%) |
| Arts, Entertainment & Recreation | 433 (82.0%) | 95 (18.0%) |
| Accommodation & Food Services | 1,364 (55.3%) | 1,103 (44.7%) |
| Public Administration | 164 (50.1%) | 163 (49.8%) |
| Total | 8,339 (55.0%) | 6,817 (45.0%) |
Education in Teton County
School Enrollment in Teton County
The most common levels of schooling among the 4,658 students in Teton County are middle school (1,020 | 21.9%), elementary school (1,004 | 21.5%), and high school (983 | 21.1%).
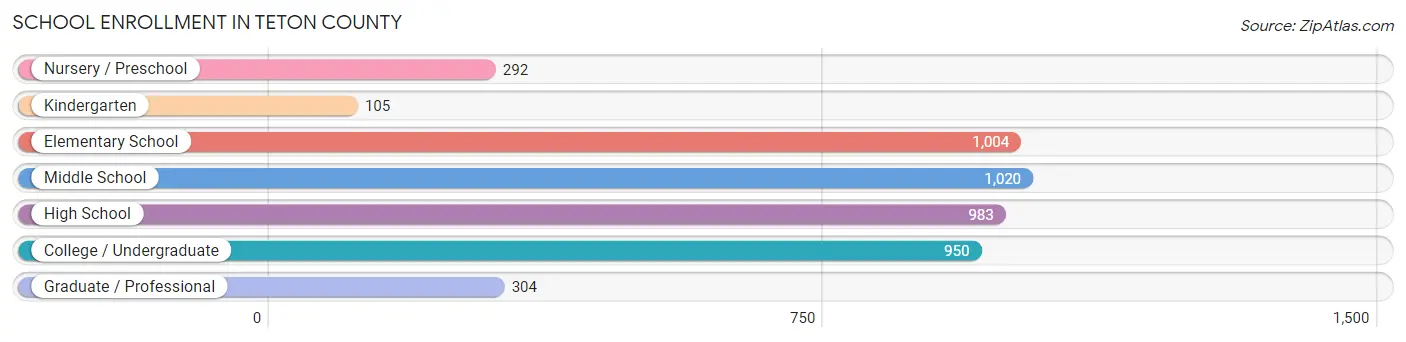
| School Level | # Students | % Students |
| Nursery / Preschool | 292 | 6.3% |
| Kindergarten | 105 | 2.2% |
| Elementary School | 1,004 | 21.5% |
| Middle School | 1,020 | 21.9% |
| High School | 983 | 21.1% |
| College / Undergraduate | 950 | 20.4% |
| Graduate / Professional | 304 | 6.5% |
| Total | 4,658 | 100.0% |
School Enrollment by Age by Funding Source in Teton County
Out of a total of 4,658 students who are enrolled in schools in Teton County, 666 (14.3%) attend a private institution, while the remaining 3,992 (85.7%) are enrolled in public schools. The age group of 20 to 24 year olds has the highest likelihood of being enrolled in private schools, with 109 (35.2% in the age bracket) enrolled. Conversely, the age group of 25 to 34 year olds has the lowest likelihood of being enrolled in a private school, with 247 (100.0% in the age bracket) attending a public institution.
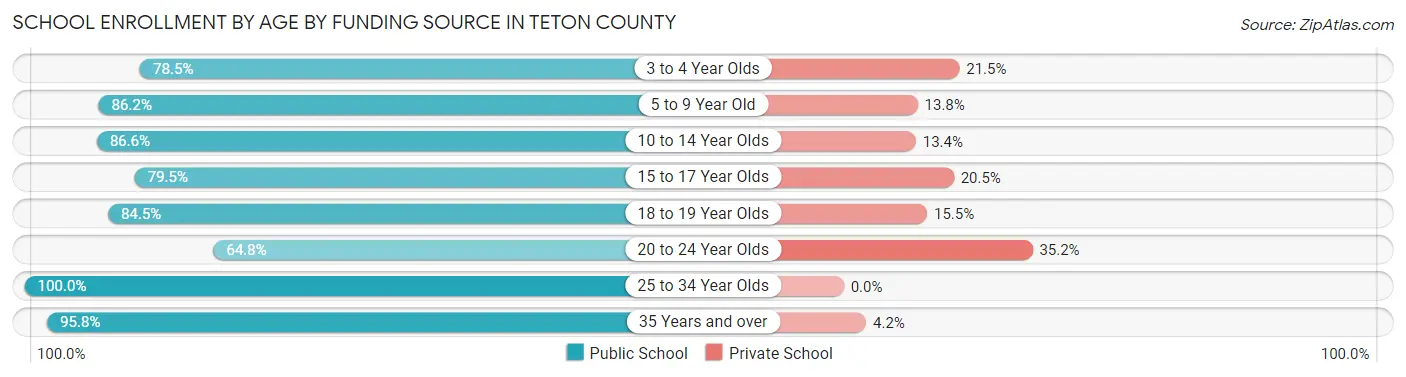
| Age Bracket | Public School | Private School |
| 3 to 4 Year Olds | 164 (78.5%) | 45 (21.5%) |
| 5 to 9 Year Old | 864 (86.2%) | 138 (13.8%) |
| 10 to 14 Year Olds | 1,185 (86.6%) | 184 (13.4%) |
| 15 to 17 Year Olds | 450 (79.5%) | 116 (20.5%) |
| 18 to 19 Year Olds | 261 (84.5%) | 48 (15.5%) |
| 20 to 24 Year Olds | 201 (64.8%) | 109 (35.2%) |
| 25 to 34 Year Olds | 247 (100.0%) | 0 (0.0%) |
| 35 Years and over | 619 (95.8%) | 27 (4.2%) |
| Total | 3,992 (85.7%) | 666 (14.3%) |
Educational Attainment by Field of Study in Teton County
Business (2,003 | 17.1%), social sciences (1,374 | 11.7%), bio, nature & agricultural (1,074 | 9.2%), science & technology (1,003 | 8.6%), and education (919 | 7.9%) are the most common fields of study among 11,704 individuals in Teton County who have obtained a bachelor's degree or higher.
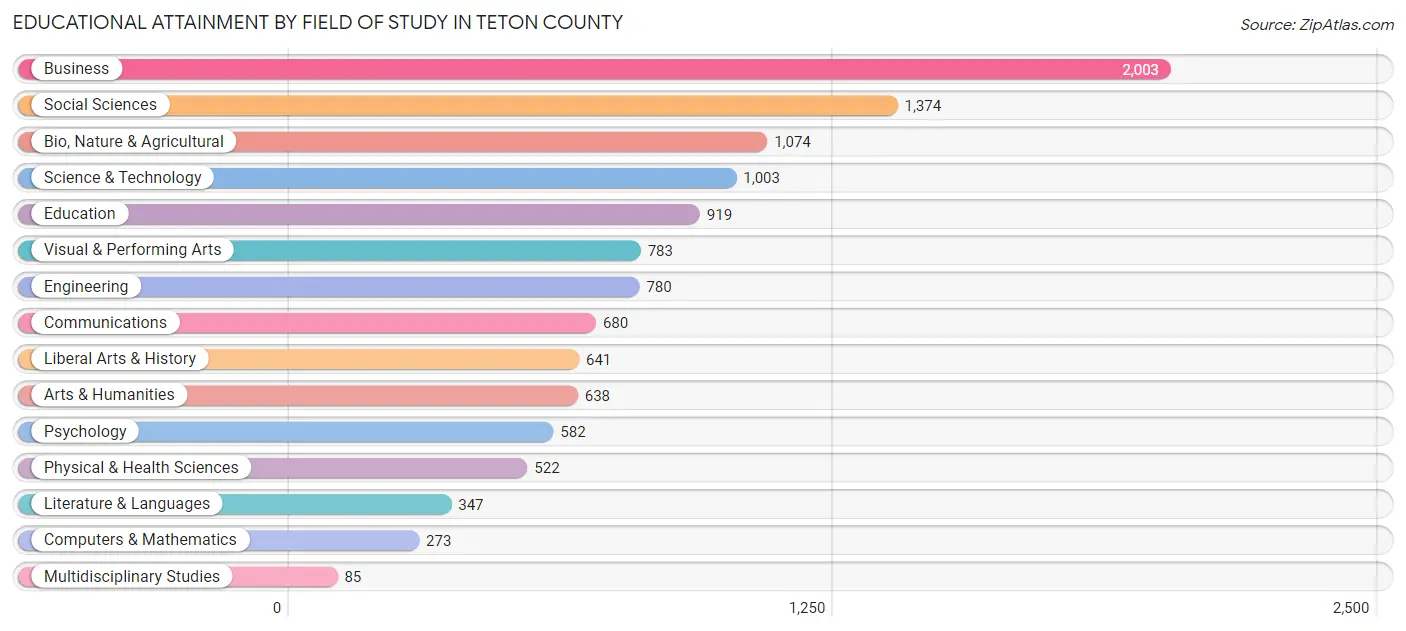
| Field of Study | # Graduates | % Graduates |
| Computers & Mathematics | 273 | 2.3% |
| Bio, Nature & Agricultural | 1,074 | 9.2% |
| Physical & Health Sciences | 522 | 4.5% |
| Psychology | 582 | 5.0% |
| Social Sciences | 1,374 | 11.7% |
| Engineering | 780 | 6.7% |
| Multidisciplinary Studies | 85 | 0.7% |
| Science & Technology | 1,003 | 8.6% |
| Business | 2,003 | 17.1% |
| Education | 919 | 7.9% |
| Literature & Languages | 347 | 3.0% |
| Liberal Arts & History | 641 | 5.5% |
| Visual & Performing Arts | 783 | 6.7% |
| Communications | 680 | 5.8% |
| Arts & Humanities | 638 | 5.4% |
| Total | 11,704 | 100.0% |
Transportation & Commute in Teton County
Vehicle Availability by Sex in Teton County
The most prevalent vehicle ownership categories in Teton County are males with 2 vehicles (3,592, accounting for 48.0%) and females with 2 vehicles (2,769, making up 57.0%).
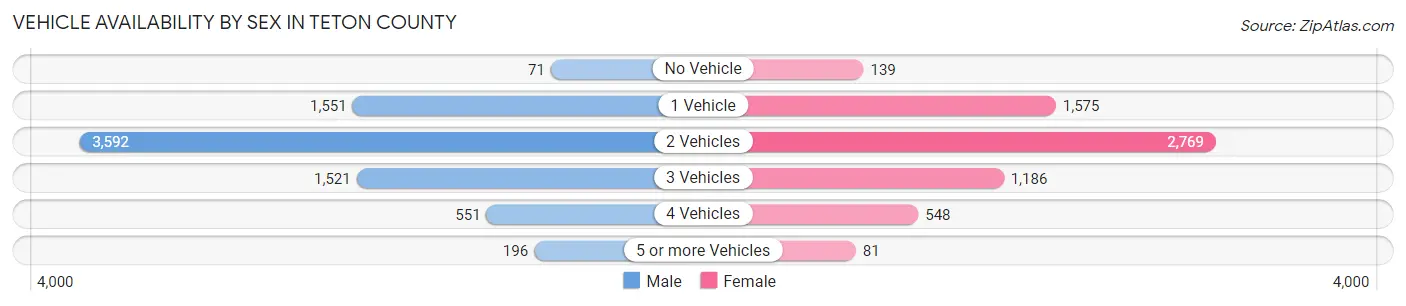
| Vehicles Available | Male | Female |
| No Vehicle | 71 (0.9%) | 139 (2.2%) |
| 1 Vehicle | 1,551 (20.7%) | 1,575 (25.0%) |
| 2 Vehicles | 3,592 (48.0%) | 2,769 (44.0%) |
| 3 Vehicles | 1,521 (20.3%) | 1,186 (18.8%) |
| 4 Vehicles | 551 (7.4%) | 548 (8.7%) |
| 5 or more Vehicles | 196 (2.6%) | 81 (1.3%) |
| Total | 7,482 (100.0%) | 6,298 (100.0%) |
Commute Time in Teton County
The most frequently occuring commute durations in Teton County are 10 to 14 minutes (2,779 commuters, 22.2%), 5 to 9 minutes (2,591 commuters, 20.7%), and 15 to 19 minutes (2,346 commuters, 18.7%).
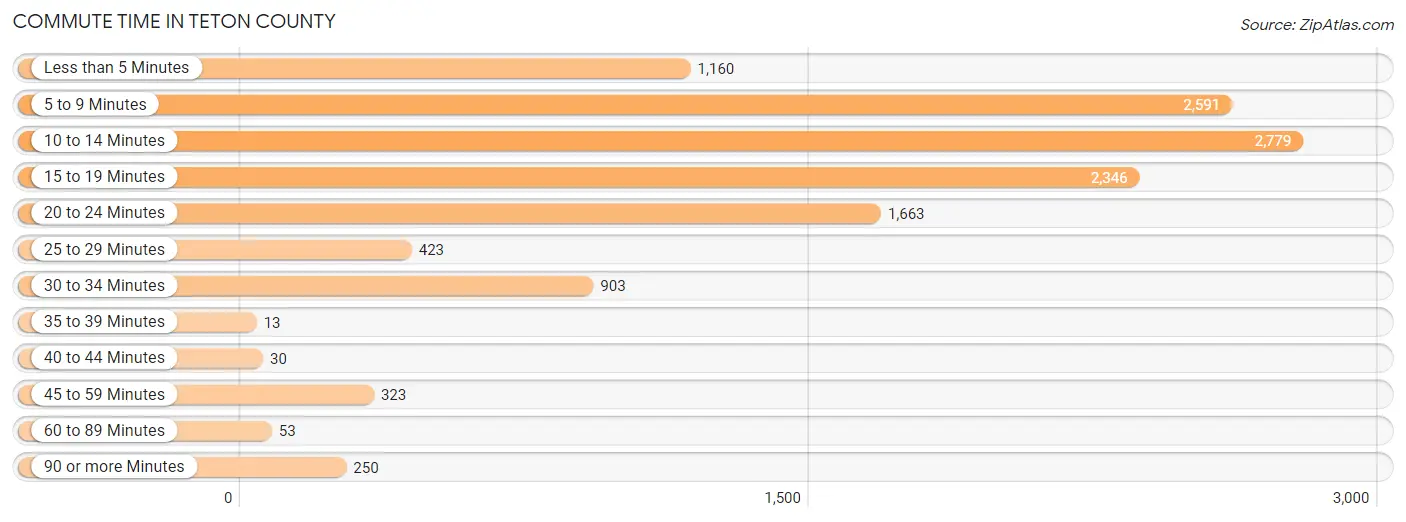
| Commute Time | # Commuters | % Commuters |
| Less than 5 Minutes | 1,160 | 9.2% |
| 5 to 9 Minutes | 2,591 | 20.7% |
| 10 to 14 Minutes | 2,779 | 22.2% |
| 15 to 19 Minutes | 2,346 | 18.7% |
| 20 to 24 Minutes | 1,663 | 13.3% |
| 25 to 29 Minutes | 423 | 3.4% |
| 30 to 34 Minutes | 903 | 7.2% |
| 35 to 39 Minutes | 13 | 0.1% |
| 40 to 44 Minutes | 30 | 0.2% |
| 45 to 59 Minutes | 323 | 2.6% |
| 60 to 89 Minutes | 53 | 0.4% |
| 90 or more Minutes | 250 | 2.0% |
Commute Time by Sex in Teton County
The most common commute times in Teton County are 5 to 9 minutes (1,358 commuters, 19.9%) for males and 10 to 14 minutes (1,533 commuters, 26.9%) for females.
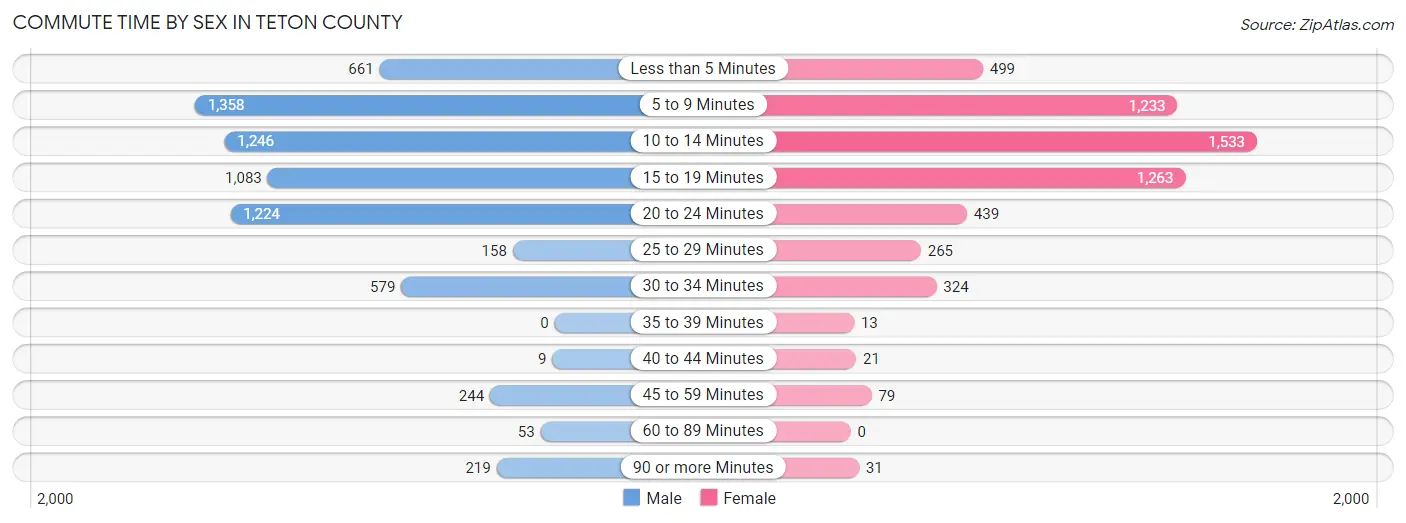
| Commute Time | Male | Female |
| Less than 5 Minutes | 661 (9.7%) | 499 (8.7%) |
| 5 to 9 Minutes | 1,358 (19.9%) | 1,233 (21.6%) |
| 10 to 14 Minutes | 1,246 (18.2%) | 1,533 (26.9%) |
| 15 to 19 Minutes | 1,083 (15.9%) | 1,263 (22.2%) |
| 20 to 24 Minutes | 1,224 (17.9%) | 439 (7.7%) |
| 25 to 29 Minutes | 158 (2.3%) | 265 (4.6%) |
| 30 to 34 Minutes | 579 (8.5%) | 324 (5.7%) |
| 35 to 39 Minutes | 0 (0.0%) | 13 (0.2%) |
| 40 to 44 Minutes | 9 (0.1%) | 21 (0.4%) |
| 45 to 59 Minutes | 244 (3.6%) | 79 (1.4%) |
| 60 to 89 Minutes | 53 (0.8%) | 0 (0.0%) |
| 90 or more Minutes | 219 (3.2%) | 31 (0.5%) |
Time of Departure to Work by Sex in Teton County
The most frequent times of departure to work in Teton County are 8:00 AM to 8:29 AM (1,249, 18.3%) for males and 7:30 AM to 7:59 AM (1,287, 22.6%) for females.
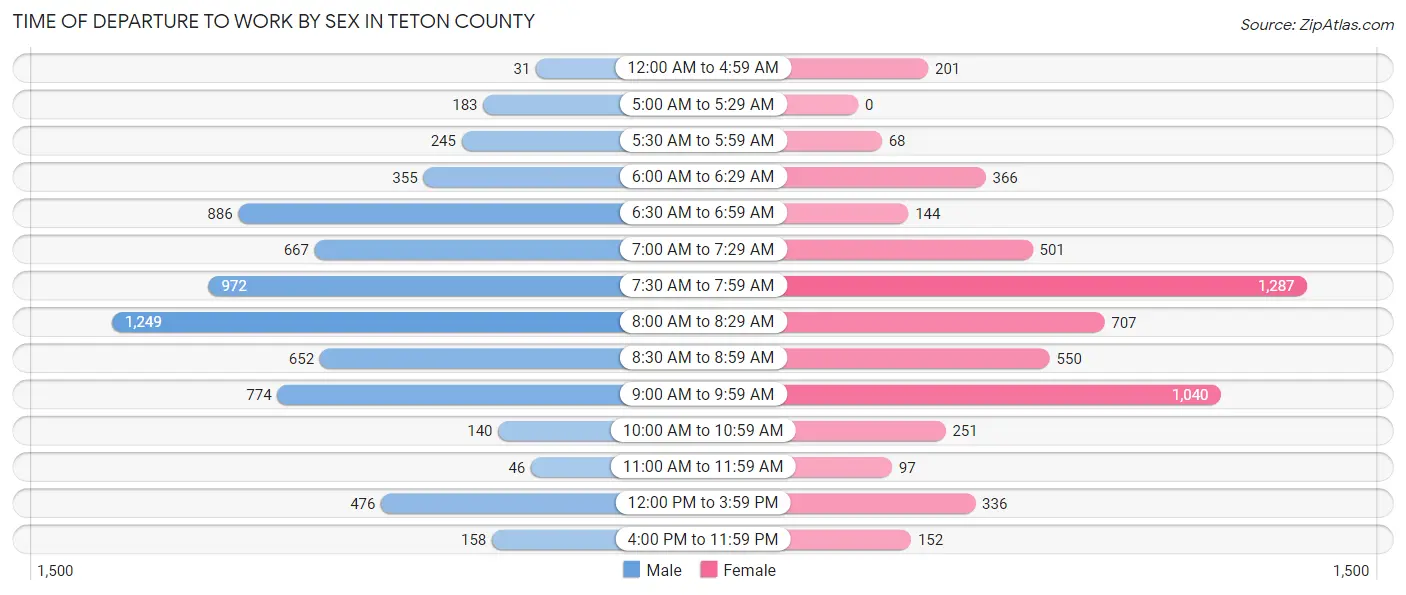
| Time of Departure | Male | Female |
| 12:00 AM to 4:59 AM | 31 (0.4%) | 201 (3.5%) |
| 5:00 AM to 5:29 AM | 183 (2.7%) | 0 (0.0%) |
| 5:30 AM to 5:59 AM | 245 (3.6%) | 68 (1.2%) |
| 6:00 AM to 6:29 AM | 355 (5.2%) | 366 (6.4%) |
| 6:30 AM to 6:59 AM | 886 (13.0%) | 144 (2.5%) |
| 7:00 AM to 7:29 AM | 667 (9.8%) | 501 (8.8%) |
| 7:30 AM to 7:59 AM | 972 (14.2%) | 1,287 (22.6%) |
| 8:00 AM to 8:29 AM | 1,249 (18.3%) | 707 (12.4%) |
| 8:30 AM to 8:59 AM | 652 (9.5%) | 550 (9.7%) |
| 9:00 AM to 9:59 AM | 774 (11.3%) | 1,040 (18.2%) |
| 10:00 AM to 10:59 AM | 140 (2.1%) | 251 (4.4%) |
| 11:00 AM to 11:59 AM | 46 (0.7%) | 97 (1.7%) |
| 12:00 PM to 3:59 PM | 476 (7.0%) | 336 (5.9%) |
| 4:00 PM to 11:59 PM | 158 (2.3%) | 152 (2.7%) |
| Total | 6,834 (100.0%) | 5,700 (100.0%) |
Housing Occupancy in Teton County
Occupancy by Ownership in Teton County
Of the total 9,645 dwellings in Teton County, owner-occupied units account for 6,003 (62.2%), while renter-occupied units make up 3,642 (37.8%).
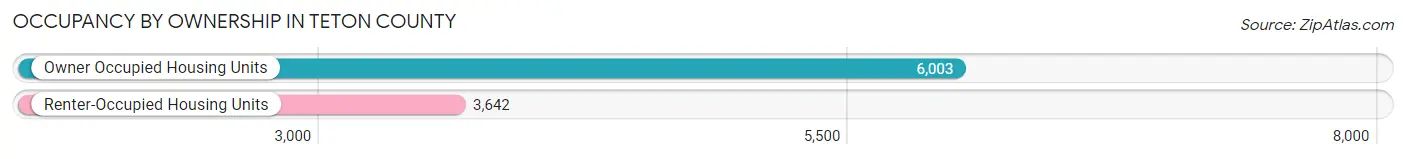
| Occupancy | # Housing Units | % Housing Units |
| Owner Occupied Housing Units | 6,003 | 62.2% |
| Renter-Occupied Housing Units | 3,642 | 37.8% |
| Total Occupied Housing Units | 9,645 | 100.0% |
Occupancy by Household Size in Teton County
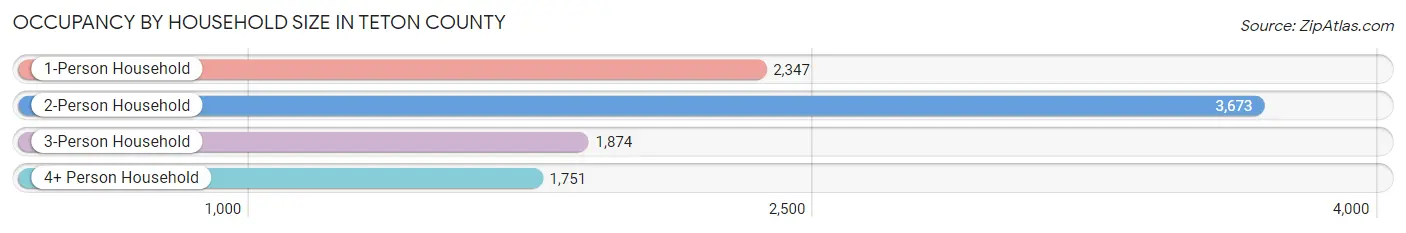
| Household Size | # Housing Units | % Housing Units |
| 1-Person Household | 2,347 | 24.3% |
| 2-Person Household | 3,673 | 38.1% |
| 3-Person Household | 1,874 | 19.4% |
| 4+ Person Household | 1,751 | 18.1% |
| Total Housing Units | 9,645 | 100.0% |
Occupancy by Ownership by Household Size in Teton County
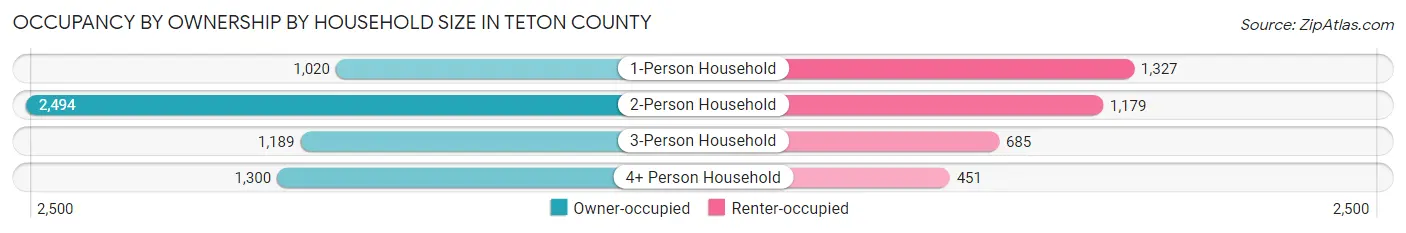
| Household Size | Owner-occupied | Renter-occupied |
| 1-Person Household | 1,020 (43.5%) | 1,327 (56.5%) |
| 2-Person Household | 2,494 (67.9%) | 1,179 (32.1%) |
| 3-Person Household | 1,189 (63.4%) | 685 (36.5%) |
| 4+ Person Household | 1,300 (74.2%) | 451 (25.8%) |
| Total Housing Units | 6,003 (62.2%) | 3,642 (37.8%) |
Occupancy by Educational Attainment in Teton County
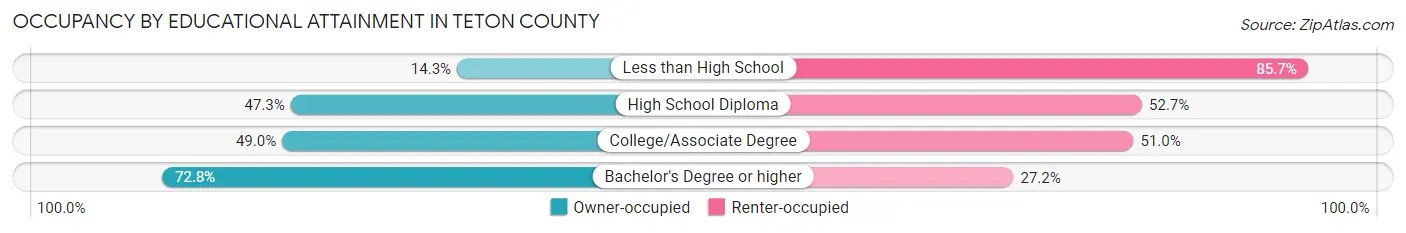
| Household Size | Owner-occupied | Renter-occupied |
| Less than High School | 54 (14.3%) | 324 (85.7%) |
| High School Diploma | 702 (47.3%) | 783 (52.7%) |
| College/Associate Degree | 855 (49.0%) | 891 (51.0%) |
| Bachelor's Degree or higher | 4,392 (72.8%) | 1,644 (27.2%) |
Occupancy by Age of Householder in Teton County
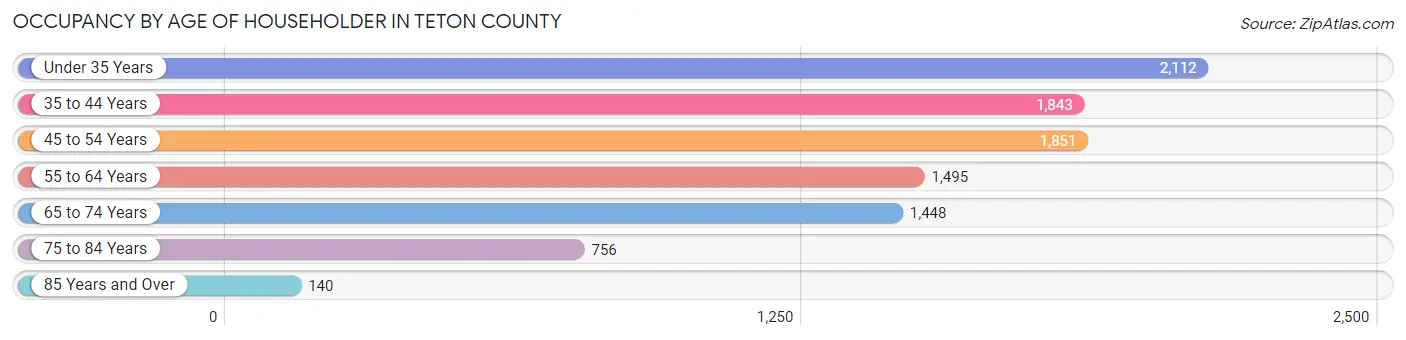
| Age Bracket | # Households | % Households |
| Under 35 Years | 2,112 | 21.9% |
| 35 to 44 Years | 1,843 | 19.1% |
| 45 to 54 Years | 1,851 | 19.2% |
| 55 to 64 Years | 1,495 | 15.5% |
| 65 to 74 Years | 1,448 | 15.0% |
| 75 to 84 Years | 756 | 7.8% |
| 85 Years and Over | 140 | 1.5% |
| Total | 9,645 | 100.0% |
Housing Finances in Teton County
Median Income by Occupancy in Teton County
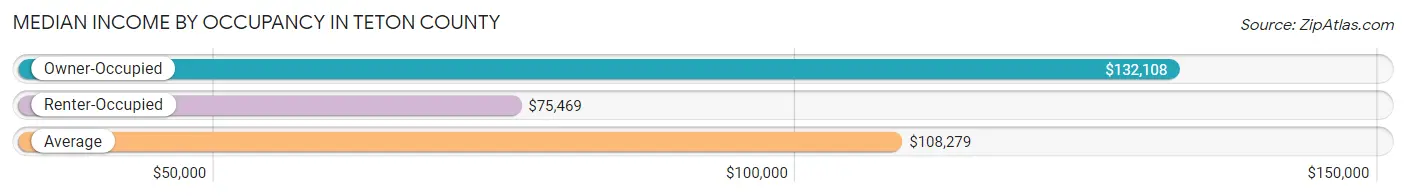
| Occupancy Type | # Households | Median Income |
| Owner-Occupied | 6,003 (62.2%) | $132,108 |
| Renter-Occupied | 3,642 (37.8%) | $75,469 |
| Average | 9,645 (100.0%) | $108,279 |
Occupancy by Householder Income Bracket in Teton County
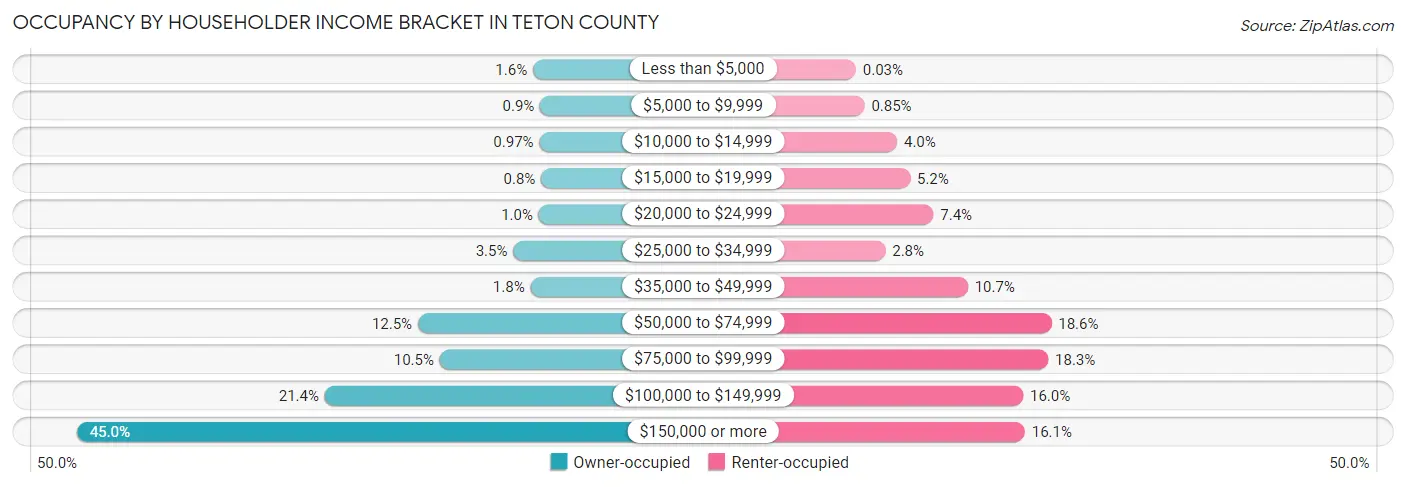
| Income Bracket | Owner-occupied | Renter-occupied |
| Less than $5,000 | 95 (1.6%) | 1 (0.0%) |
| $5,000 to $9,999 | 54 (0.9%) | 31 (0.9%) |
| $10,000 to $14,999 | 58 (1.0%) | 144 (4.0%) |
| $15,000 to $19,999 | 48 (0.8%) | 189 (5.2%) |
| $20,000 to $24,999 | 62 (1.0%) | 270 (7.4%) |
| $25,000 to $34,999 | 208 (3.5%) | 103 (2.8%) |
| $35,000 to $49,999 | 109 (1.8%) | 389 (10.7%) |
| $50,000 to $74,999 | 753 (12.5%) | 679 (18.6%) |
| $75,000 to $99,999 | 628 (10.5%) | 668 (18.3%) |
| $100,000 to $149,999 | 1,285 (21.4%) | 581 (16.0%) |
| $150,000 or more | 2,703 (45.0%) | 587 (16.1%) |
| Total | 6,003 (100.0%) | 3,642 (100.0%) |
Monthly Housing Cost Tiers in Teton County
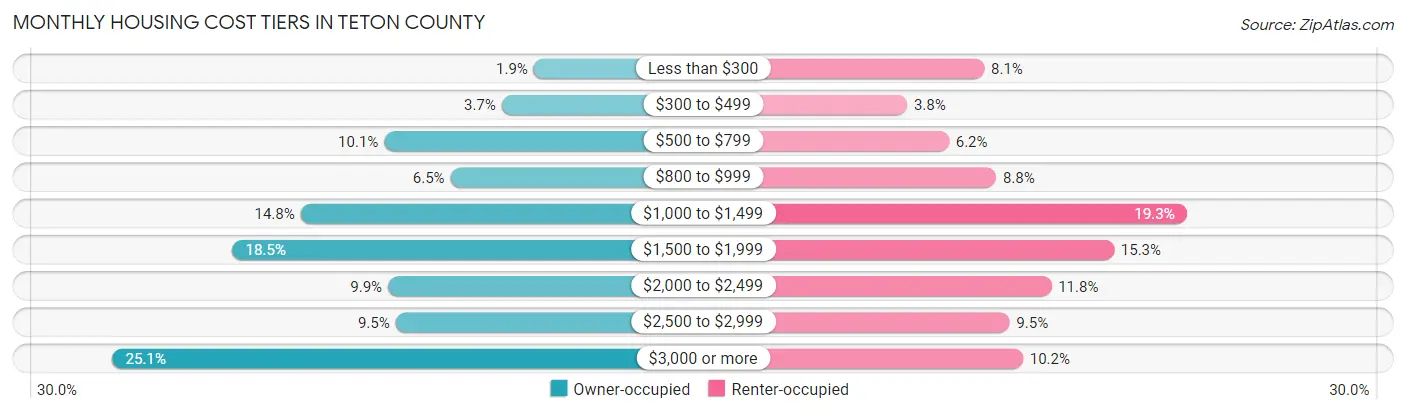
| Monthly Cost | Owner-occupied | Renter-occupied |
| Less than $300 | 113 (1.9%) | 295 (8.1%) |
| $300 to $499 | 219 (3.6%) | 140 (3.8%) |
| $500 to $799 | 609 (10.1%) | 224 (6.1%) |
| $800 to $999 | 389 (6.5%) | 319 (8.8%) |
| $1,000 to $1,499 | 886 (14.8%) | 702 (19.3%) |
| $1,500 to $1,999 | 1,111 (18.5%) | 556 (15.3%) |
| $2,000 to $2,499 | 596 (9.9%) | 430 (11.8%) |
| $2,500 to $2,999 | 571 (9.5%) | 346 (9.5%) |
| $3,000 or more | 1,509 (25.1%) | 373 (10.2%) |
| Total | 6,003 (100.0%) | 3,642 (100.0%) |
Physical Housing Characteristics in Teton County
Housing Structures in Teton County
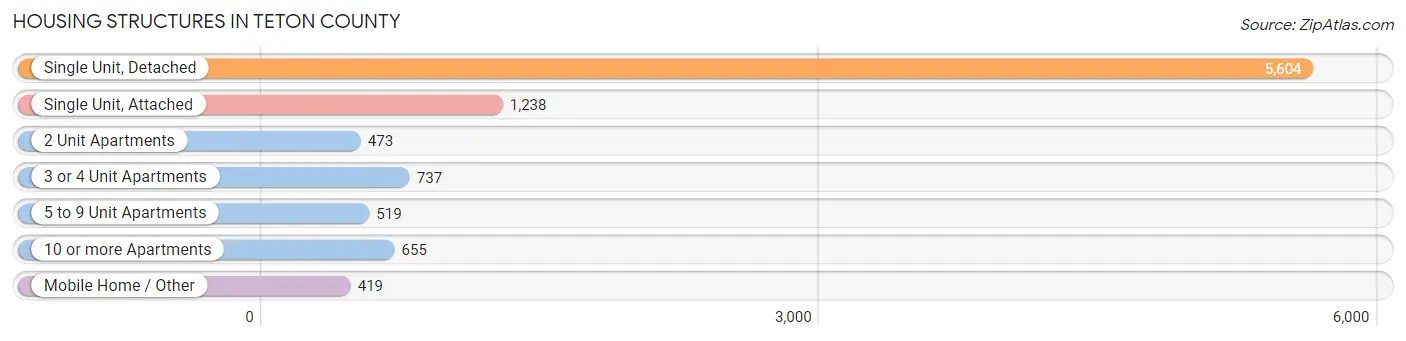
| Structure Type | # Housing Units | % Housing Units |
| Single Unit, Detached | 5,604 | 58.1% |
| Single Unit, Attached | 1,238 | 12.8% |
| 2 Unit Apartments | 473 | 4.9% |
| 3 or 4 Unit Apartments | 737 | 7.6% |
| 5 to 9 Unit Apartments | 519 | 5.4% |
| 10 or more Apartments | 655 | 6.8% |
| Mobile Home / Other | 419 | 4.3% |
| Total | 9,645 | 100.0% |
Housing Structures by Occupancy in Teton County
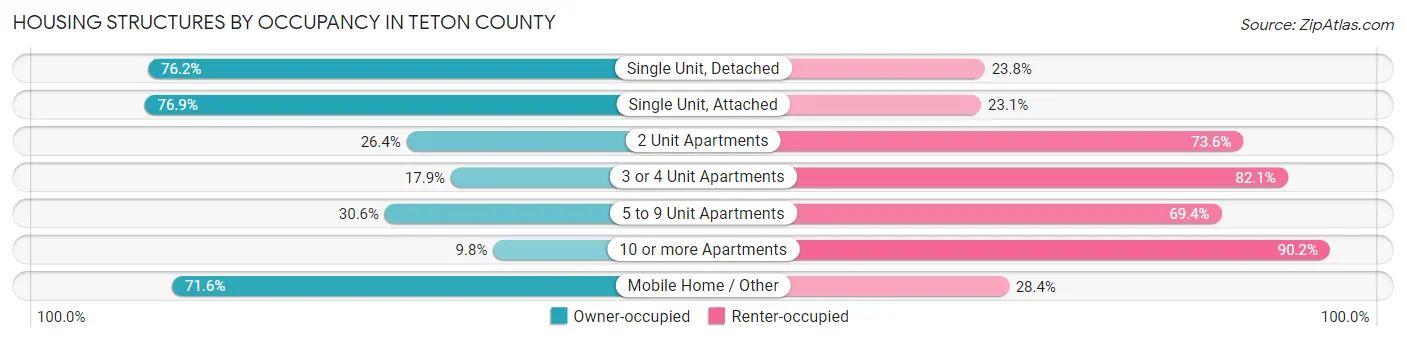
| Structure Type | Owner-occupied | Renter-occupied |
| Single Unit, Detached | 4,271 (76.2%) | 1,333 (23.8%) |
| Single Unit, Attached | 952 (76.9%) | 286 (23.1%) |
| 2 Unit Apartments | 125 (26.4%) | 348 (73.6%) |
| 3 or 4 Unit Apartments | 132 (17.9%) | 605 (82.1%) |
| 5 to 9 Unit Apartments | 159 (30.6%) | 360 (69.4%) |
| 10 or more Apartments | 64 (9.8%) | 591 (90.2%) |
| Mobile Home / Other | 300 (71.6%) | 119 (28.4%) |
| Total | 6,003 (62.2%) | 3,642 (37.8%) |
Housing Structures by Number of Rooms in Teton County
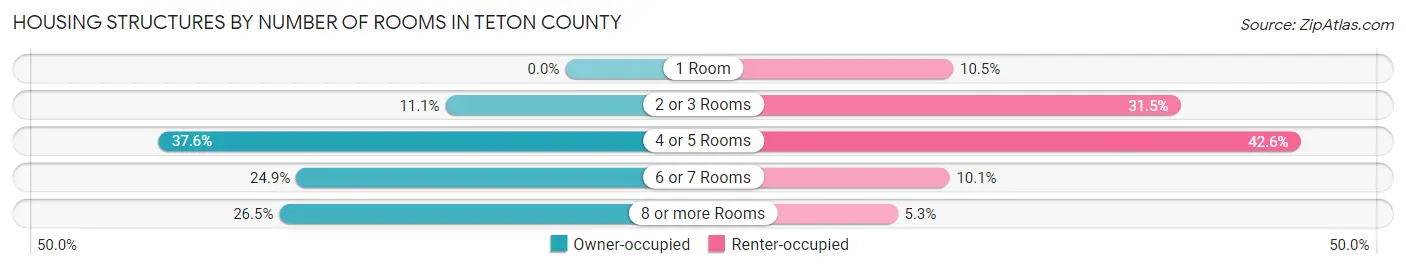
| Number of Rooms | Owner-occupied | Renter-occupied |
| 1 Room | 0 (0.0%) | 381 (10.5%) |
| 2 or 3 Rooms | 665 (11.1%) | 1,147 (31.5%) |
| 4 or 5 Rooms | 2,256 (37.6%) | 1,551 (42.6%) |
| 6 or 7 Rooms | 1,494 (24.9%) | 369 (10.1%) |
| 8 or more Rooms | 1,588 (26.5%) | 194 (5.3%) |
| Total | 6,003 (100.0%) | 3,642 (100.0%) |
Housing Structure by Heating Type in Teton County

| Heating Type | Owner-occupied | Renter-occupied |
| Utility Gas | 1,501 (25.0%) | 506 (13.9%) |
| Bottled, Tank, or LP Gas | 670 (11.2%) | 169 (4.6%) |
| Electricity | 3,473 (57.9%) | 2,802 (76.9%) |
| Fuel Oil or Kerosene | 32 (0.5%) | 7 (0.2%) |
| Coal or Coke | 0 (0.0%) | 0 (0.0%) |
| All other Fuels | 327 (5.4%) | 158 (4.3%) |
| No Fuel Used | 0 (0.0%) | 0 (0.0%) |
| Total | 6,003 (100.0%) | 3,642 (100.0%) |
Household Vehicle Usage in Teton County
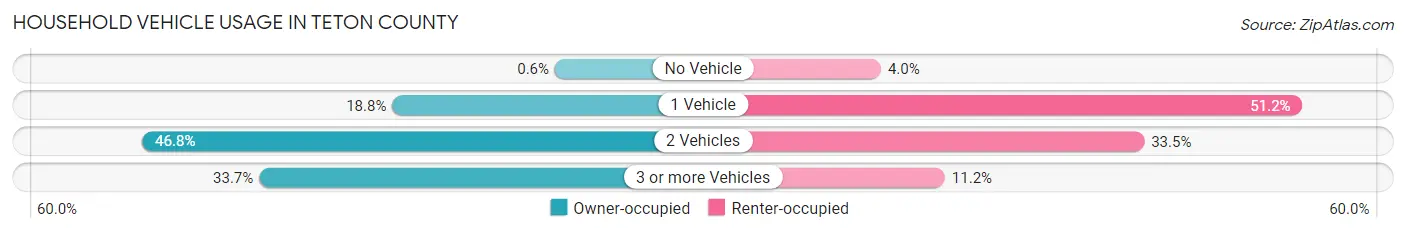
| Vehicles per Household | Owner-occupied | Renter-occupied |
| No Vehicle | 36 (0.6%) | 147 (4.0%) |
| 1 Vehicle | 1,130 (18.8%) | 1,866 (51.2%) |
| 2 Vehicles | 2,812 (46.8%) | 1,221 (33.5%) |
| 3 or more Vehicles | 2,025 (33.7%) | 408 (11.2%) |
| Total | 6,003 (100.0%) | 3,642 (100.0%) |
Real Estate & Mortgages in Teton County
Real Estate and Mortgage Overview in Teton County
| Characteristic | Without Mortgage | With Mortgage |
| Housing Units | 2,349 | 3,654 |
| Median Property Value | $1,373,700 | $975,100 |
| Median Household Income | $136,920 | $1,671 |
| Monthly Housing Costs | $1,060 | $1,417 |
| Real Estate Taxes | $6,166 | $67 |
Property Value by Mortgage Status in Teton County
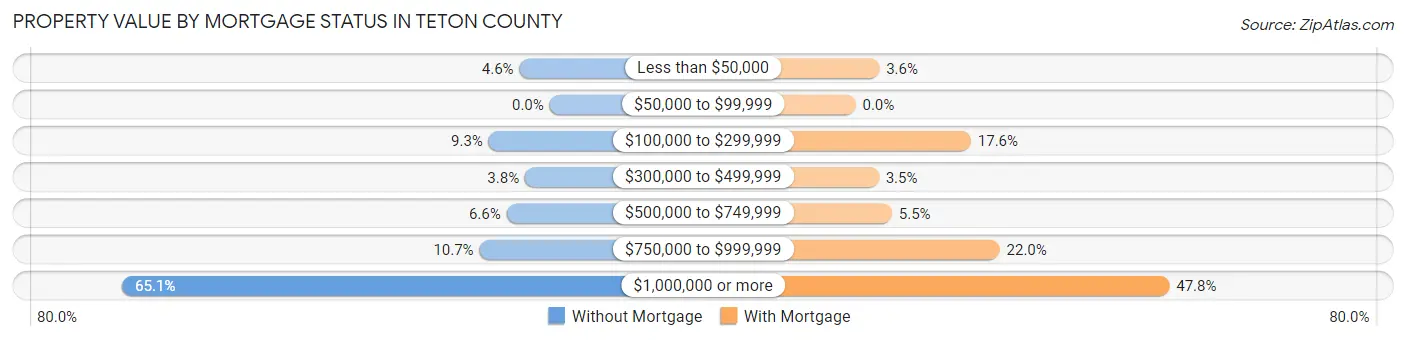
| Property Value | Without Mortgage | With Mortgage |
| Less than $50,000 | 108 (4.6%) | 132 (3.6%) |
| $50,000 to $99,999 | 0 (0.0%) | 0 (0.0%) |
| $100,000 to $299,999 | 218 (9.3%) | 642 (17.6%) |
| $300,000 to $499,999 | 88 (3.7%) | 129 (3.5%) |
| $500,000 to $749,999 | 154 (6.6%) | 202 (5.5%) |
| $750,000 to $999,999 | 251 (10.7%) | 802 (22.0%) |
| $1,000,000 or more | 1,530 (65.1%) | 1,747 (47.8%) |
| Total | 2,349 (100.0%) | 3,654 (100.0%) |
Household Income by Mortgage Status in Teton County

| Household Income | Without Mortgage | With Mortgage |
| Less than $10,000 | 63 (2.7%) | 16 (0.4%) |
| $10,000 to $24,999 | 62 (2.6%) | 86 (2.4%) |
| $25,000 to $34,999 | 111 (4.7%) | 106 (2.9%) |
| $35,000 to $49,999 | 0 (0.0%) | 97 (2.6%) |
| $50,000 to $74,999 | 326 (13.9%) | 109 (3.0%) |
| $75,000 to $99,999 | 343 (14.6%) | 427 (11.7%) |
| $100,000 to $149,999 | 412 (17.5%) | 285 (7.8%) |
| $150,000 or more | 1,032 (43.9%) | 873 (23.9%) |
| Total | 2,349 (100.0%) | 3,654 (100.0%) |
Property Value to Household Income Ratio in Teton County
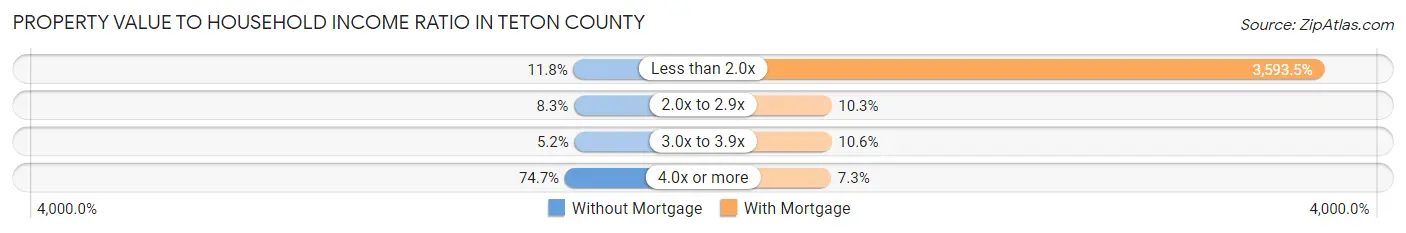
| Value-to-Income Ratio | Without Mortgage | With Mortgage |
| Less than 2.0x | 278 (11.8%) | 131,306 (3,593.5%) |
| 2.0x to 2.9x | 194 (8.3%) | 376 (10.3%) |
| 3.0x to 3.9x | 122 (5.2%) | 388 (10.6%) |
| 4.0x or more | 1,755 (74.7%) | 265 (7.2%) |
| Total | 2,349 (100.0%) | 3,654 (100.0%) |
Real Estate Taxes by Mortgage Status in Teton County
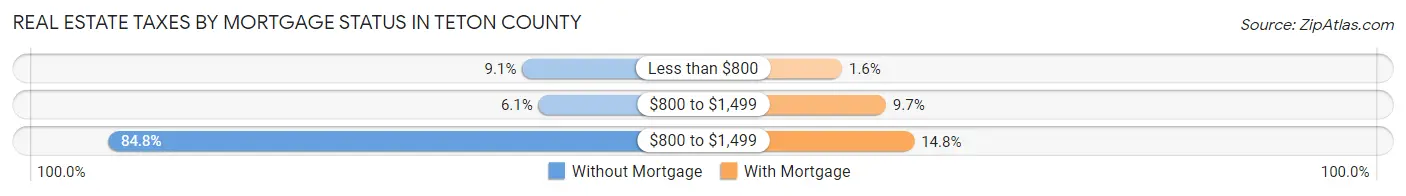
| Property Taxes | Without Mortgage | With Mortgage |
| Less than $800 | 214 (9.1%) | 60 (1.6%) |
| $800 to $1,499 | 144 (6.1%) | 353 (9.7%) |
| $800 to $1,499 | 1,991 (84.8%) | 542 (14.8%) |
| Total | 2,349 (100.0%) | 3,654 (100.0%) |
Health & Disability in Teton County
Health Insurance Coverage by Age in Teton County
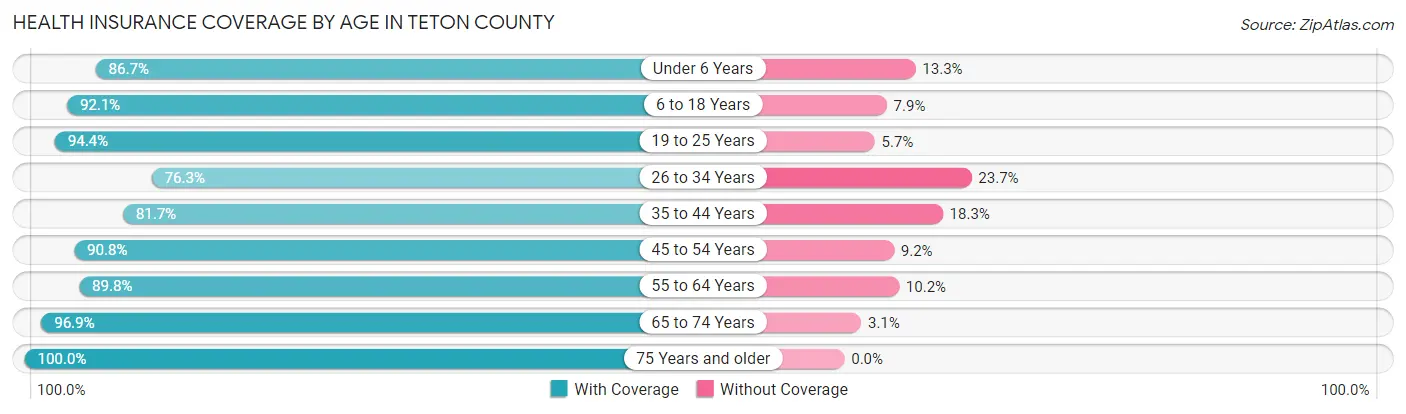
| Age Bracket | With Coverage | Without Coverage |
| Under 6 Years | 922 (86.7%) | 141 (13.3%) |
| 6 to 18 Years | 3,067 (92.1%) | 263 (7.9%) |
| 19 to 25 Years | 1,386 (94.4%) | 83 (5.7%) |
| 26 to 34 Years | 2,840 (76.3%) | 882 (23.7%) |
| 35 to 44 Years | 3,388 (81.7%) | 761 (18.3%) |
| 45 to 54 Years | 2,710 (90.8%) | 276 (9.2%) |
| 55 to 64 Years | 2,434 (89.8%) | 276 (10.2%) |
| 65 to 74 Years | 2,488 (96.9%) | 80 (3.1%) |
| 75 Years and older | 1,265 (100.0%) | 0 (0.0%) |
| Total | 20,500 (88.1%) | 2,762 (11.9%) |
Health Insurance Coverage by Citizenship Status in Teton County
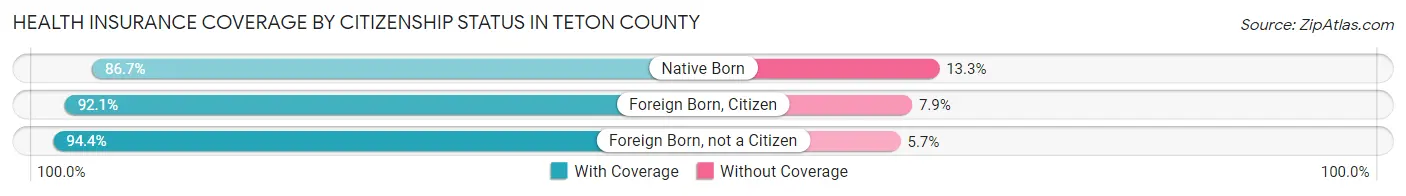
| Citizenship Status | With Coverage | Without Coverage |
| Native Born | 922 (86.7%) | 141 (13.3%) |
| Foreign Born, Citizen | 3,067 (92.1%) | 263 (7.9%) |
| Foreign Born, not a Citizen | 1,386 (94.4%) | 83 (5.7%) |
Health Insurance Coverage by Household Income in Teton County
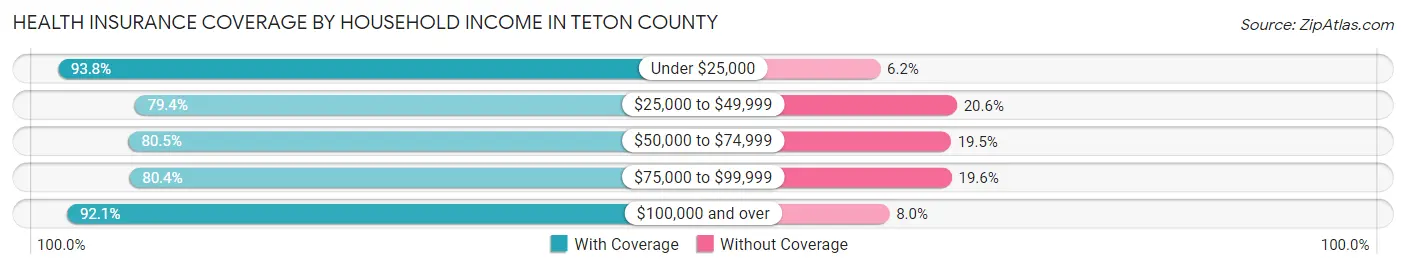
| Household Income | With Coverage | Without Coverage |
| Under $25,000 | 1,427 (93.8%) | 95 (6.2%) |
| $25,000 to $49,999 | 1,025 (79.4%) | 266 (20.6%) |
| $50,000 to $74,999 | 2,237 (80.5%) | 541 (19.5%) |
| $75,000 to $99,999 | 2,572 (80.4%) | 628 (19.6%) |
| $100,000 and over | 12,559 (92.0%) | 1,084 (8.0%) |
Public vs Private Health Insurance Coverage by Age in Teton County
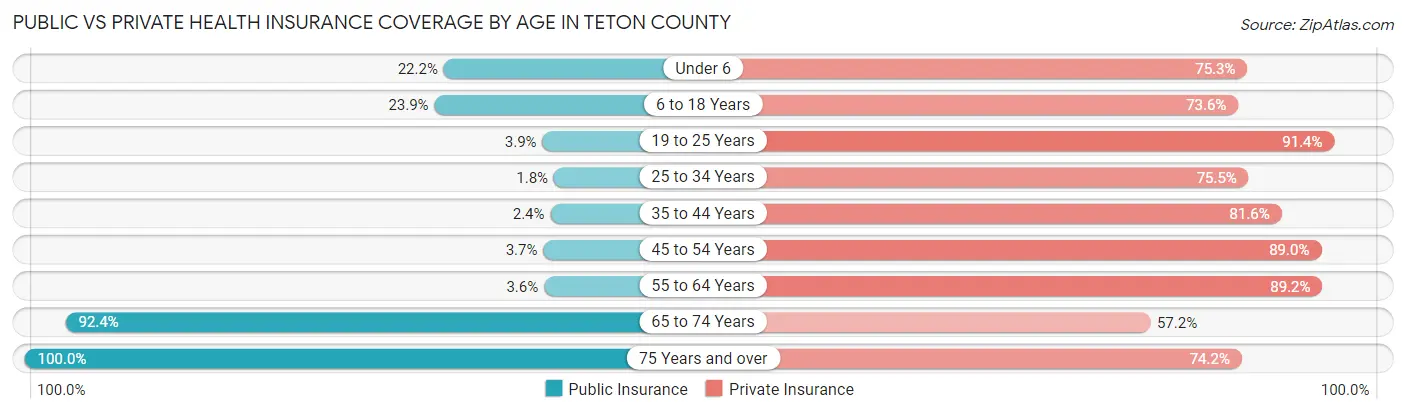
| Age Bracket | Public Insurance | Private Insurance |
| Under 6 | 236 (22.2%) | 800 (75.3%) |
| 6 to 18 Years | 797 (23.9%) | 2,450 (73.6%) |
| 19 to 25 Years | 57 (3.9%) | 1,343 (91.4%) |
| 25 to 34 Years | 65 (1.8%) | 2,811 (75.5%) |
| 35 to 44 Years | 100 (2.4%) | 3,387 (81.6%) |
| 45 to 54 Years | 111 (3.7%) | 2,657 (89.0%) |
| 55 to 64 Years | 97 (3.6%) | 2,417 (89.2%) |
| 65 to 74 Years | 2,373 (92.4%) | 1,469 (57.2%) |
| 75 Years and over | 1,265 (100.0%) | 939 (74.2%) |
| Total | 5,101 (21.9%) | 18,273 (78.5%) |
Disability Status by Sex by Age in Teton County
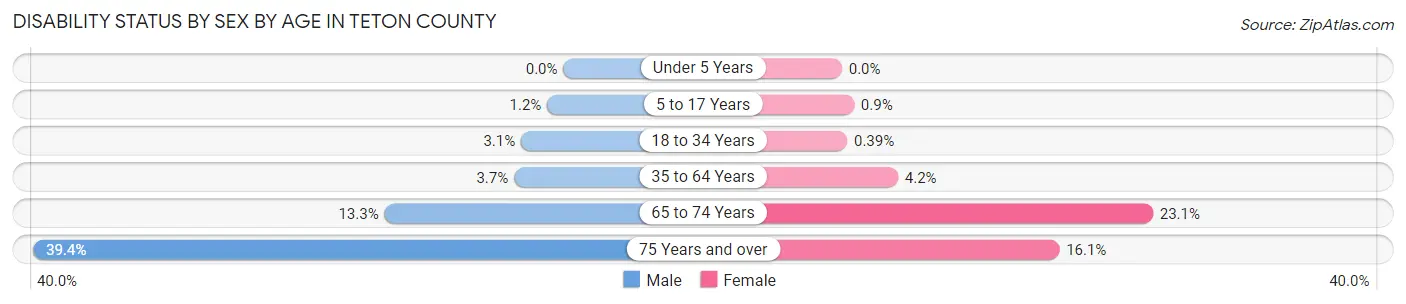
| Age Bracket | Male | Female |
| Under 5 Years | 0 (0.0%) | 0 (0.0%) |
| 5 to 17 Years | 19 (1.2%) | 14 (0.9%) |
| 18 to 34 Years | 92 (3.1%) | 10 (0.4%) |
| 35 to 64 Years | 187 (3.7%) | 197 (4.2%) |
| 65 to 74 Years | 176 (13.3%) | 287 (23.1%) |
| 75 Years and over | 237 (39.4%) | 107 (16.1%) |
Disability Class by Sex by Age in Teton County
Disability Class: Hearing Difficulty
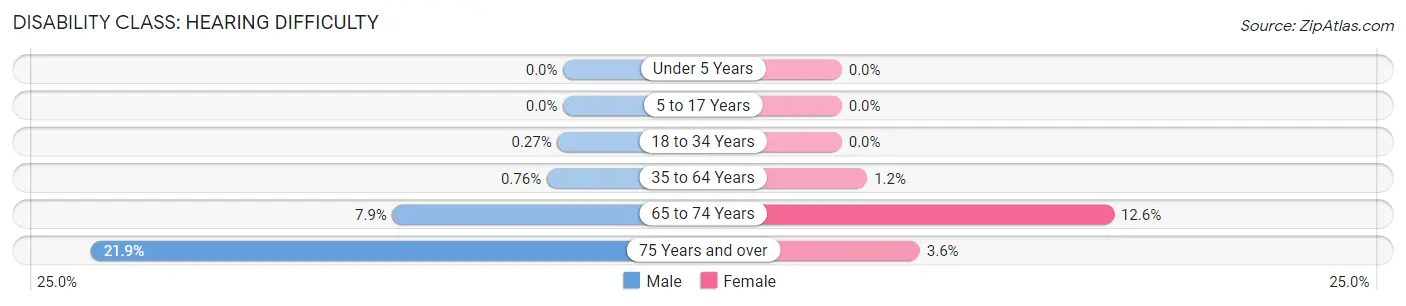
| Age Bracket | Male | Female |
| Under 5 Years | 0 (0.0%) | 0 (0.0%) |
| 5 to 17 Years | 0 (0.0%) | 0 (0.0%) |
| 18 to 34 Years | 8 (0.3%) | 0 (0.0%) |
| 35 to 64 Years | 39 (0.8%) | 56 (1.2%) |
| 65 to 74 Years | 105 (7.9%) | 157 (12.6%) |
| 75 Years and over | 132 (21.9%) | 24 (3.6%) |
Disability Class: Vision Difficulty
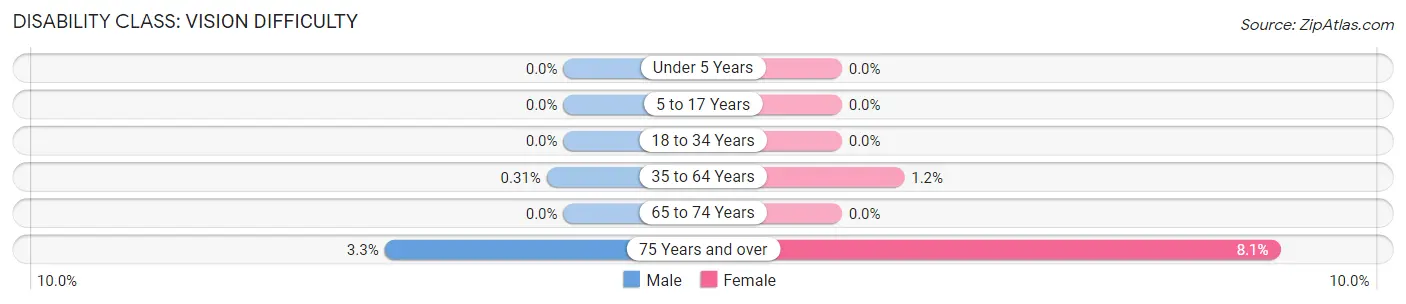
| Age Bracket | Male | Female |
| Under 5 Years | 0 (0.0%) | 0 (0.0%) |
| 5 to 17 Years | 0 (0.0%) | 0 (0.0%) |
| 18 to 34 Years | 0 (0.0%) | 0 (0.0%) |
| 35 to 64 Years | 16 (0.3%) | 55 (1.2%) |
| 65 to 74 Years | 0 (0.0%) | 0 (0.0%) |
| 75 Years and over | 20 (3.3%) | 54 (8.1%) |
Disability Class: Cognitive Difficulty
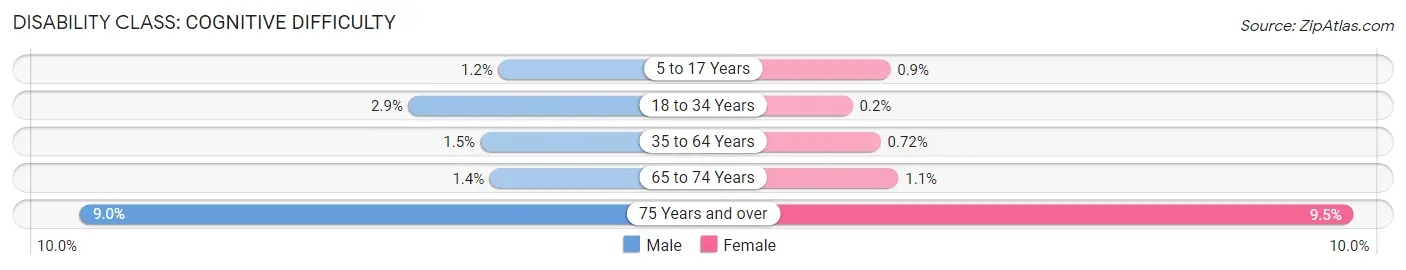
| Age Bracket | Male | Female |
| 5 to 17 Years | 19 (1.2%) | 14 (0.9%) |
| 18 to 34 Years | 84 (2.9%) | 5 (0.2%) |
| 35 to 64 Years | 78 (1.5%) | 34 (0.7%) |
| 65 to 74 Years | 18 (1.4%) | 13 (1.1%) |
| 75 Years and over | 54 (9.0%) | 63 (9.5%) |
Disability Class: Ambulatory Difficulty
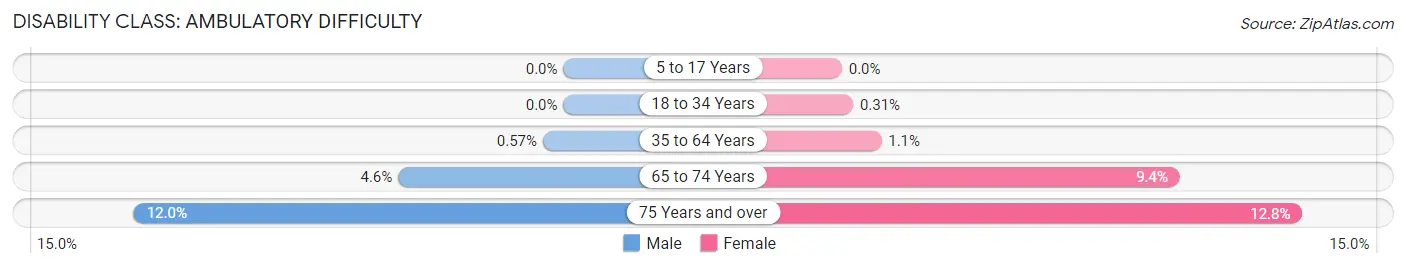
| Age Bracket | Male | Female |
| 5 to 17 Years | 0 (0.0%) | 0 (0.0%) |
| 18 to 34 Years | 0 (0.0%) | 8 (0.3%) |
| 35 to 64 Years | 29 (0.6%) | 52 (1.1%) |
| 65 to 74 Years | 61 (4.6%) | 117 (9.4%) |
| 75 Years and over | 72 (12.0%) | 85 (12.8%) |
Disability Class: Self-Care Difficulty
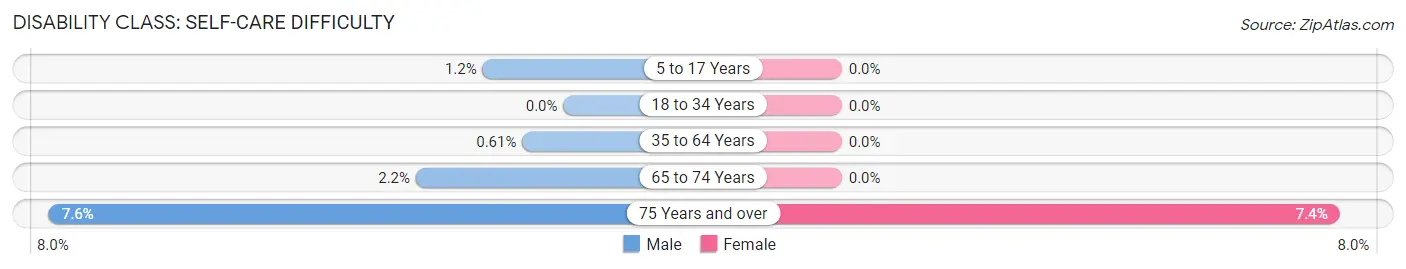
| Age Bracket | Male | Female |
| 5 to 17 Years | 19 (1.2%) | 0 (0.0%) |
| 18 to 34 Years | 0 (0.0%) | 0 (0.0%) |
| 35 to 64 Years | 31 (0.6%) | 0 (0.0%) |
| 65 to 74 Years | 29 (2.2%) | 0 (0.0%) |
| 75 Years and over | 46 (7.6%) | 49 (7.4%) |
Technology Access in Teton County
Computing Device Access in Teton County
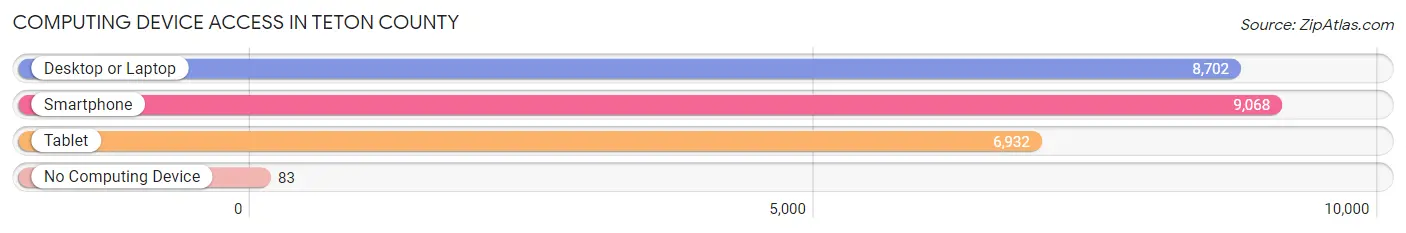
| Device Type | # Households | % Households |
| Desktop or Laptop | 8,702 | 90.2% |
| Smartphone | 9,068 | 94.0% |
| Tablet | 6,932 | 71.9% |
| No Computing Device | 83 | 0.9% |
| Total | 9,645 | 100.0% |
Internet Access in Teton County
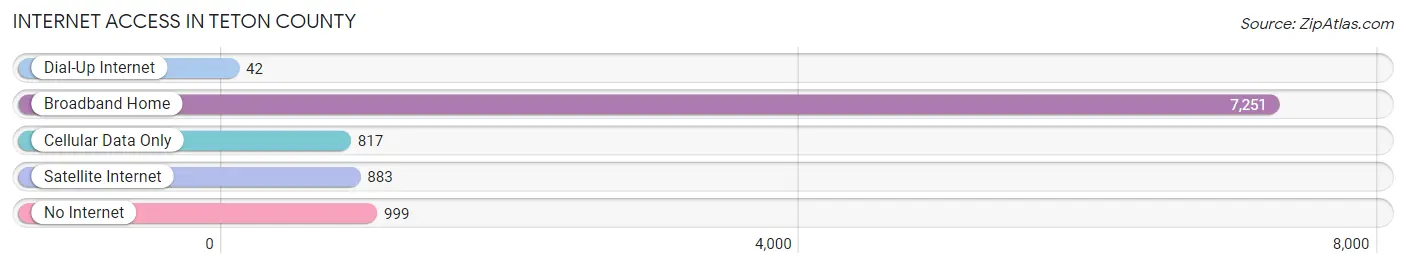
| Internet Type | # Households | % Households |
| Dial-Up Internet | 42 | 0.4% |
| Broadband Home | 7,251 | 75.2% |
| Cellular Data Only | 817 | 8.5% |
| Satellite Internet | 883 | 9.2% |
| No Internet | 999 | 10.4% |
| Total | 9,645 | 100.0% |
Teton County Summary
Teton County, Wyoming is located in the northwest corner of the state and is bordered by Idaho to the west and Montana to the north. It is the second least populous county in Wyoming, with a population of just over 22,000 people. The county seat is Jackson, which is the largest town in the county.
Teton County is known for its stunning natural beauty, with the Teton Range of the Rocky Mountains dominating the landscape. The county is home to Grand Teton National Park, which is one of the most popular tourist destinations in the United States. The park is home to a variety of wildlife, including grizzly bears, wolves, elk, and bison.
The county is also home to the Jackson Hole Ski Resort, which is one of the most popular ski resorts in the United States. The resort is located in the heart of the Teton Range and offers a variety of activities for visitors, including skiing, snowboarding, and snowmobiling.
The economy of Teton County is largely based on tourism, with the ski resort and national park being the main sources of income. The county also has a strong agricultural sector, with cattle ranching and hay production being the main industries. The county is also home to a number of small businesses, including restaurants, retail stores, and lodging.
The demographics of Teton County are largely white, with the majority of the population being of European descent. The county also has a small Native American population, with the Shoshone and Bannock tribes having a presence in the area. The median household income in the county is just over $60,000, which is slightly higher than the national average.
Teton County is a beautiful and unique place to live, with its stunning natural beauty and vibrant economy. The county is home to a variety of activities and attractions, making it a great place to visit or live. With its diverse population and strong economy, Teton County is a great place to call home.
Common Questions
What is the Total Population of Teton County?
Total Population of Teton County is 23,346.
What is the Total Male Population of Teton County?
Total Male Population of Teton County is 12,114.
What is the Total Female Population of Teton County?
Total Female Population of Teton County is 11,232.
What is the Ratio of Males per 100 Females in Teton County?
There are 107.85 Males per 100 Females in Teton County.
What is the Ratio of Females per 100 Males in Teton County?
There are 92.72 Females per 100 Males in Teton County.
What is the Median Population Age in Teton County?
Median Population Age in Teton County is 39.9 Years.
What is the Average Family Size in Teton County
Average Family Size in Teton County is 2.7 People.
What is the Average Household Size in Teton County
Average Household Size in Teton County is 2.3 People.
What is Per Capita Income in Teton County?
Per Capita income in Teton County is $76,296.
What is the Median Family Income in Teton County?
Median Family Income in Teton County is $125,325.
What is the Median Household income in Teton County?
Median Household Income in Teton County is $108,279.
What is Income or Wage Gap in Teton County?
Income or Wage Gap in Teton County is 27.0%.
Women in Teton County earn 73.0 cents for every dollar earned by a man.
What is Inequality or Gini Index in Teton County?
Inequality or Gini Index in Teton County is 0.54.
How Large is the Labor Force in Teton County?
There are 15,475 People in the Labor Forcein in Teton County.
What is the Percentage of People in the Labor Force in Teton County?
78.6% of People are in the Labor Force in Teton County.
What is the Unemployment Rate in Teton County?
Unemployment Rate in Teton County is 2.1%.