Sublette County, WY
Sublette County Overview
8,801
TOTAL POPULATION
4,769
MALE POPULATION
4,032
FEMALE POPULATION
118.28
MALES / 100 FEMALES
84.55
FEMALES / 100 MALES
41.7
MEDIAN AGE
3.1
AVG FAMILY SIZE
2.5
AVG HOUSEHOLD SIZE
$54,704
PER CAPITA INCOME
$97,425
AVG FAMILY INCOME
$85,960
AVG HOUSEHOLD INCOME
41.3%
WAGE / INCOME GAP [ % ]
58.7¢/ $1
WAGE / INCOME GAP [ $ ]
0.52
INEQUALITY / GINI INDEX
4,671
LABOR FORCE [ PEOPLE ]
66.5%
PERCENT IN LABOR FORCE
3.9%
UNEMPLOYMENT RATE
Sublette County Area Codes
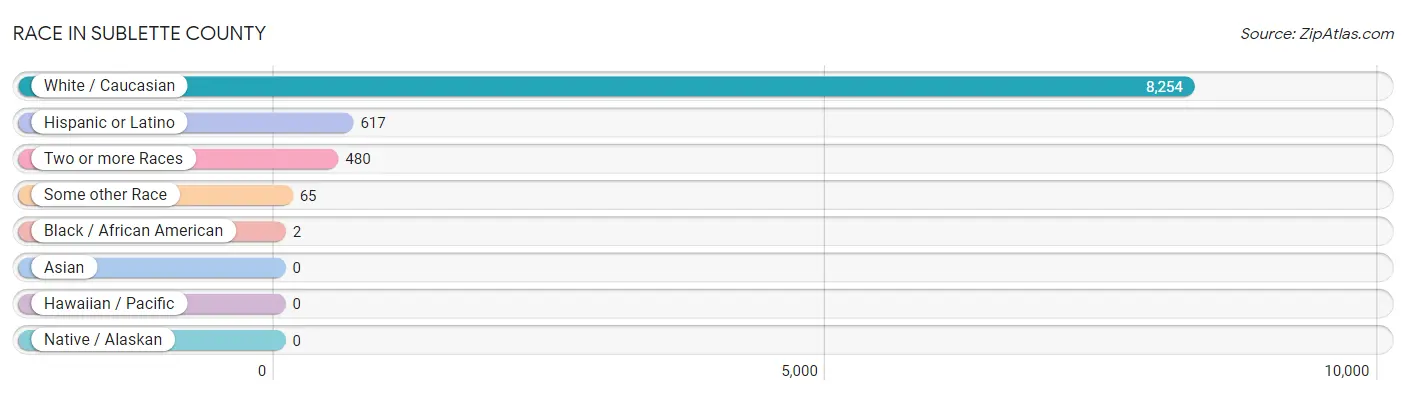
Race in Sublette County
The most populous races in Sublette County are White / Caucasian (8,254 | 93.8%), Hispanic or Latino (617 | 7.0%), and Two or more Races (480 | 5.4%).
| Race | # Population | % Population |
| Asian | 0 | 0.0% |
| Black / African American | 2 | 0.0% |
| Hawaiian / Pacific | 0 | 0.0% |
| Hispanic or Latino | 617 | 7.0% |
| Native / Alaskan | 0 | 0.0% |
| White / Caucasian | 8,254 | 93.8% |
| Two or more Races | 480 | 5.4% |
| Some other Race | 65 | 0.7% |
| Total | 8,801 | 100.0% |
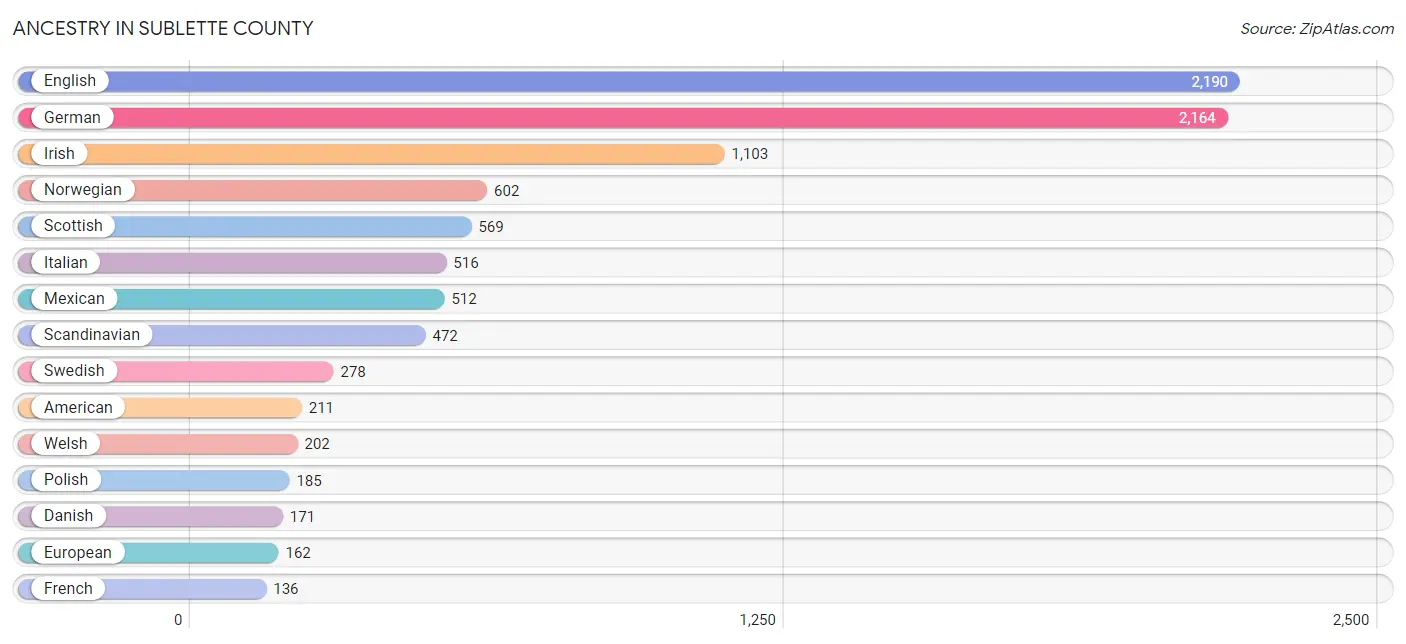
Ancestry in Sublette County
The most populous ancestries reported in Sublette County are English (2,190 | 24.9%), German (2,164 | 24.6%), Irish (1,103 | 12.5%), Norwegian (602 | 6.8%), and Scottish (569 | 6.5%), together accounting for 75.3% of all Sublette County residents.
| Ancestry | # Population | % Population |
| African | 3 | 0.0% |
| Alaskan Athabascan | 3 | 0.0% |
| American | 211 | 2.4% |
| Austrian | 34 | 0.4% |
| Belgian | 16 | 0.2% |
| Blackfeet | 2 | 0.0% |
| British | 6 | 0.1% |
| Canadian | 6 | 0.1% |
| Cherokee | 9 | 0.1% |
| Cheyenne | 5 | 0.1% |
| Comanche | 2 | 0.0% |
| Czech | 24 | 0.3% |
| Czechoslovakian | 13 | 0.2% |
| Danish | 171 | 1.9% |
| Dutch | 130 | 1.5% |
| Eastern European | 24 | 0.3% |
| English | 2,190 | 24.9% |
| European | 162 | 1.8% |
| Finnish | 49 | 0.6% |
| French | 136 | 1.5% |
| French Canadian | 55 | 0.6% |
| German | 2,164 | 24.6% |
| Greek | 77 | 0.9% |
| Irish | 1,103 | 12.5% |
| Italian | 516 | 5.9% |
| Jamaican | 1 | 0.0% |
| Korean | 17 | 0.2% |
| Mexican | 512 | 5.8% |
| Northern European | 38 | 0.4% |
| Norwegian | 602 | 6.8% |
| Pakistani | 18 | 0.2% |
| Polish | 185 | 2.1% |
| Russian | 2 | 0.0% |
| Scandinavian | 472 | 5.4% |
| Scotch-Irish | 116 | 1.3% |
| Scottish | 569 | 6.5% |
| Serbian | 32 | 0.4% |
| Slavic | 23 | 0.3% |
| South American | 57 | 0.6% |
| Spanish | 48 | 0.5% |
| Subsaharan African | 3 | 0.0% |
| Swedish | 278 | 3.2% |
| Swiss | 28 | 0.3% |
| Venezuelan | 57 | 0.6% |
| Welsh | 202 | 2.3% | View All 45 Rows |
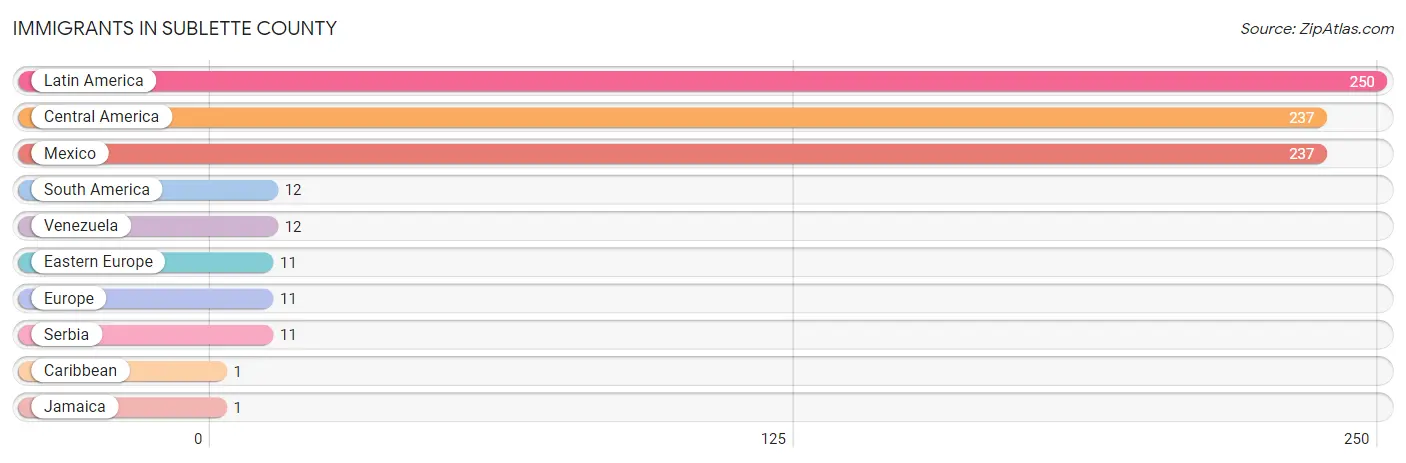
Immigrants in Sublette County
The most numerous immigrant groups reported in Sublette County came from Latin America (250 | 2.8%), Central America (237 | 2.7%), Mexico (237 | 2.7%), South America (12 | 0.1%), and Venezuela (12 | 0.1%), together accounting for 8.5% of all Sublette County residents.
| Immigration Origin | # Population | % Population |
| Caribbean | 1 | 0.0% |
| Central America | 237 | 2.7% |
| Eastern Europe | 11 | 0.1% |
| Europe | 11 | 0.1% |
| Jamaica | 1 | 0.0% |
| Latin America | 250 | 2.8% |
| Mexico | 237 | 2.7% |
| Serbia | 11 | 0.1% |
| South America | 12 | 0.1% |
| Venezuela | 12 | 0.1% | View All 10 Rows |
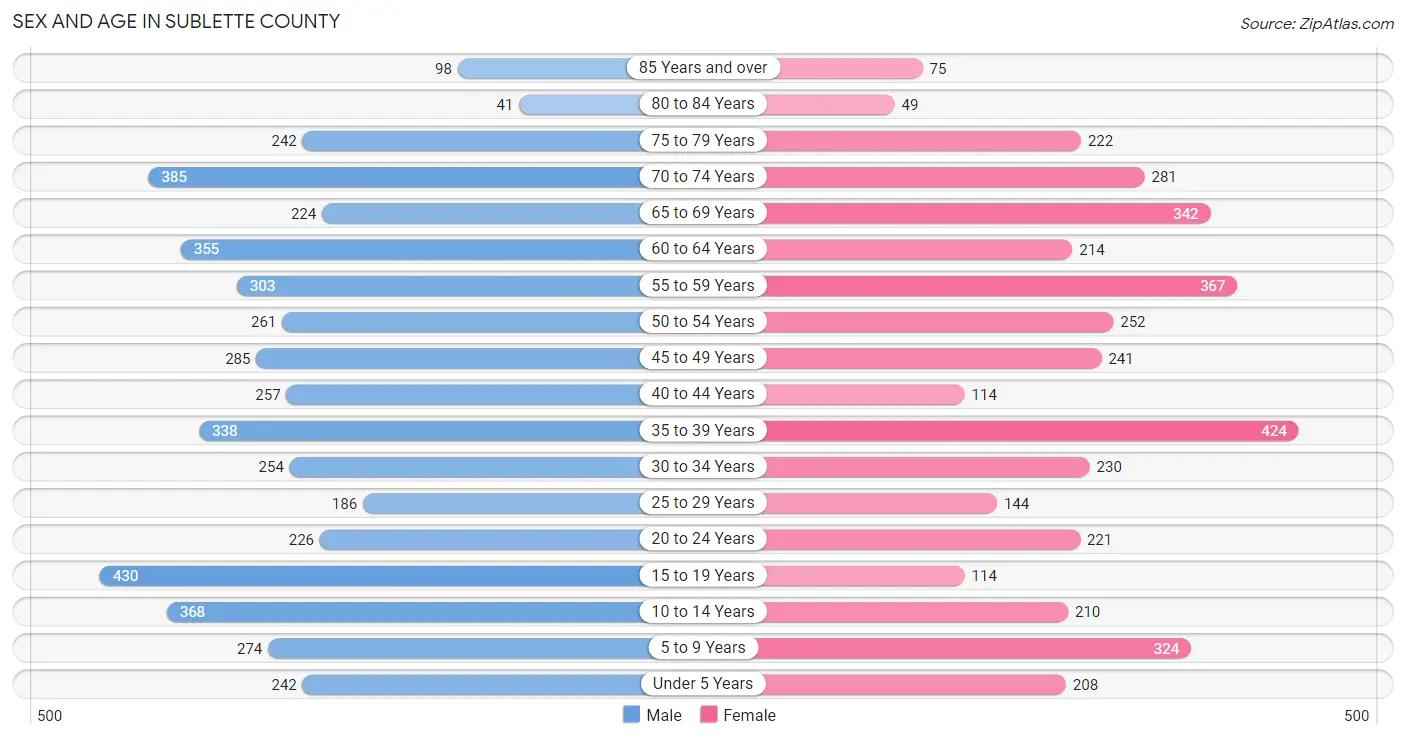
Sex and Age in Sublette County
Sex and Age in Sublette County
The most populous age groups in Sublette County are 15 to 19 Years (430 | 9.0%) for men and 35 to 39 Years (424 | 10.5%) for women.
| Age Bracket | Male | Female |
| Under 5 Years | 242 (5.1%) | 208 (5.2%) |
| 5 to 9 Years | 274 (5.8%) | 324 (8.0%) |
| 10 to 14 Years | 368 (7.7%) | 210 (5.2%) |
| 15 to 19 Years | 430 (9.0%) | 114 (2.8%) |
| 20 to 24 Years | 226 (4.7%) | 221 (5.5%) |
| 25 to 29 Years | 186 (3.9%) | 144 (3.6%) |
| 30 to 34 Years | 254 (5.3%) | 230 (5.7%) |
| 35 to 39 Years | 338 (7.1%) | 424 (10.5%) |
| 40 to 44 Years | 257 (5.4%) | 114 (2.8%) |
| 45 to 49 Years | 285 (6.0%) | 241 (6.0%) |
| 50 to 54 Years | 261 (5.5%) | 252 (6.2%) |
| 55 to 59 Years | 303 (6.4%) | 367 (9.1%) |
| 60 to 64 Years | 355 (7.4%) | 214 (5.3%) |
| 65 to 69 Years | 224 (4.7%) | 342 (8.5%) |
| 70 to 74 Years | 385 (8.1%) | 281 (7.0%) |
| 75 to 79 Years | 242 (5.1%) | 222 (5.5%) |
| 80 to 84 Years | 41 (0.9%) | 49 (1.2%) |
| 85 Years and over | 98 (2.1%) | 75 (1.9%) |
| Total | 4,769 (100.0%) | 4,032 (100.0%) |
Families and Households in Sublette County
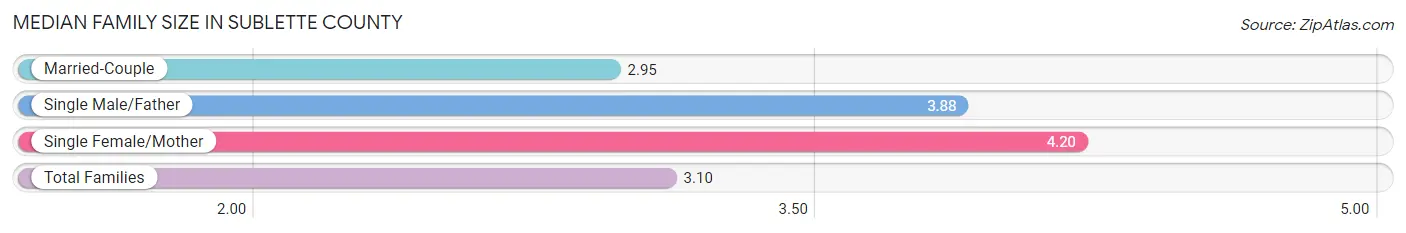
Median Family Size in Sublette County
The median family size in Sublette County is 3.10 persons per family, with single female/mother families (235 | 10.0%) accounting for the largest median family size of 4.2 persons per family. On the other hand, married-couple families (2,062 | 87.6%) represent the smallest median family size with 2.95 persons per family.
| Family Type | # Families | Family Size |
| Married-Couple | 2,062 (87.6%) | 2.95 |
| Single Male/Father | 57 (2.4%) | 3.88 |
| Single Female/Mother | 235 (10.0%) | 4.20 |
| Total Families | 2,354 (100.0%) | 3.10 |
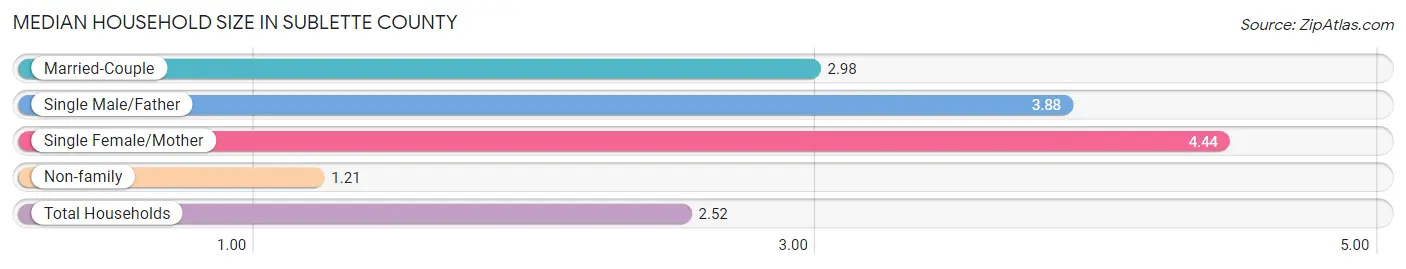
Median Household Size in Sublette County
The median household size in Sublette County is 2.52 persons per household, with single female/mother households (235 | 6.8%) accounting for the largest median household size of 4.44 persons per household. non-family households (1,123 | 32.3%) represent the smallest median household size with 1.21 persons per household.
| Household Type | # Households | Household Size |
| Married-Couple | 2,062 (59.3%) | 2.98 |
| Single Male/Father | 57 (1.6%) | 3.88 |
| Single Female/Mother | 235 (6.8%) | 4.44 |
| Non-family | 1,123 (32.3%) | 1.21 |
| Total Households | 3,477 (100.0%) | 2.52 |
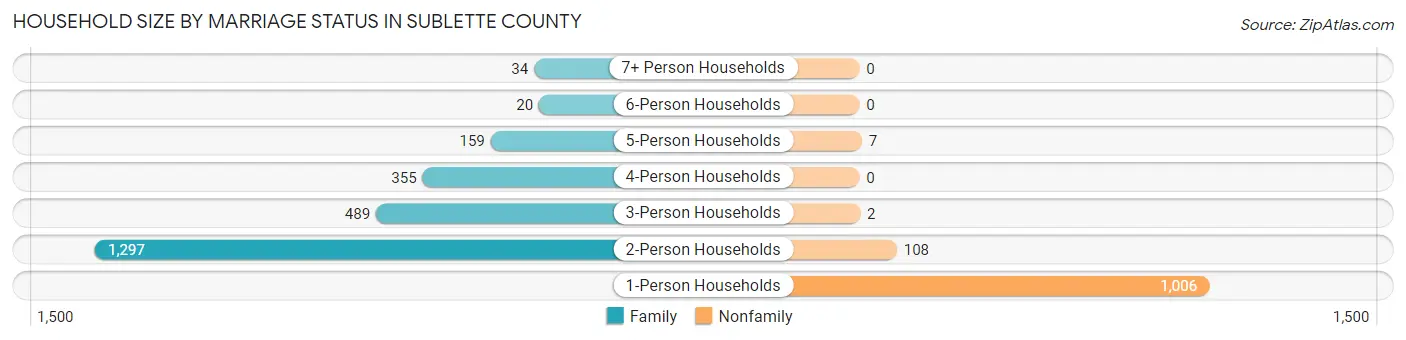
Household Size by Marriage Status in Sublette County
Out of a total of 3,477 households in Sublette County, 2,354 (67.7%) are family households, while 1,123 (32.3%) are nonfamily households. The most numerous type of family households are 2-person households, comprising 1,297, and the most common type of nonfamily households are 1-person households, comprising 1,006.
| Household Size | Family Households | Nonfamily Households |
| 1-Person Households | - | 1,006 (28.9%) |
| 2-Person Households | 1,297 (37.3%) | 108 (3.1%) |
| 3-Person Households | 489 (14.1%) | 2 (0.1%) |
| 4-Person Households | 355 (10.2%) | 0 (0.0%) |
| 5-Person Households | 159 (4.6%) | 7 (0.2%) |
| 6-Person Households | 20 (0.6%) | 0 (0.0%) |
| 7+ Person Households | 34 (1.0%) | 0 (0.0%) |
| Total | 2,354 (67.7%) | 1,123 (32.3%) |
Female Fertility in Sublette County
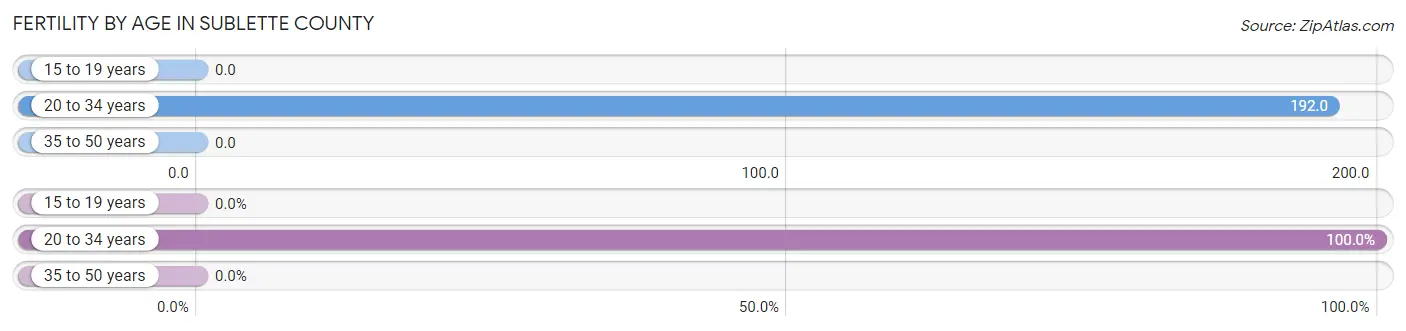
Fertility by Age in Sublette County
Average fertility rate in Sublette County is 73.0 births per 1,000 women. Women in the age bracket of 20 to 34 years have the highest fertility rate with 192.0 births per 1,000 women. Women in the age bracket of 20 to 34 years acount for 100.0% of all women with births.
| Age Bracket | Women with Births | Births / 1,000 Women |
| 15 to 19 years | 0 (0.0%) | 0.0 |
| 20 to 34 years | 114 (100.0%) | 192.0 |
| 35 to 50 years | 0 (0.0%) | 0.0 |
| Total | 114 (100.0%) | 73.0 |
Fertility by Age by Marriage Status in Sublette County
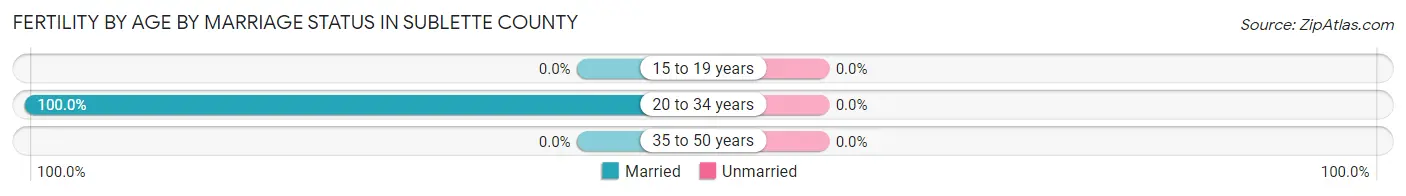
| Age Bracket | Married | Unmarried |
| 15 to 19 years | 0 (0.0%) | 0 (0.0%) |
| 20 to 34 years | 114 (100.0%) | 0 (0.0%) |
| 35 to 50 years | 0 (0.0%) | 0 (0.0%) |
| Total | 114 (100.0%) | 0 (0.0%) |
Fertility by Education in Sublette County
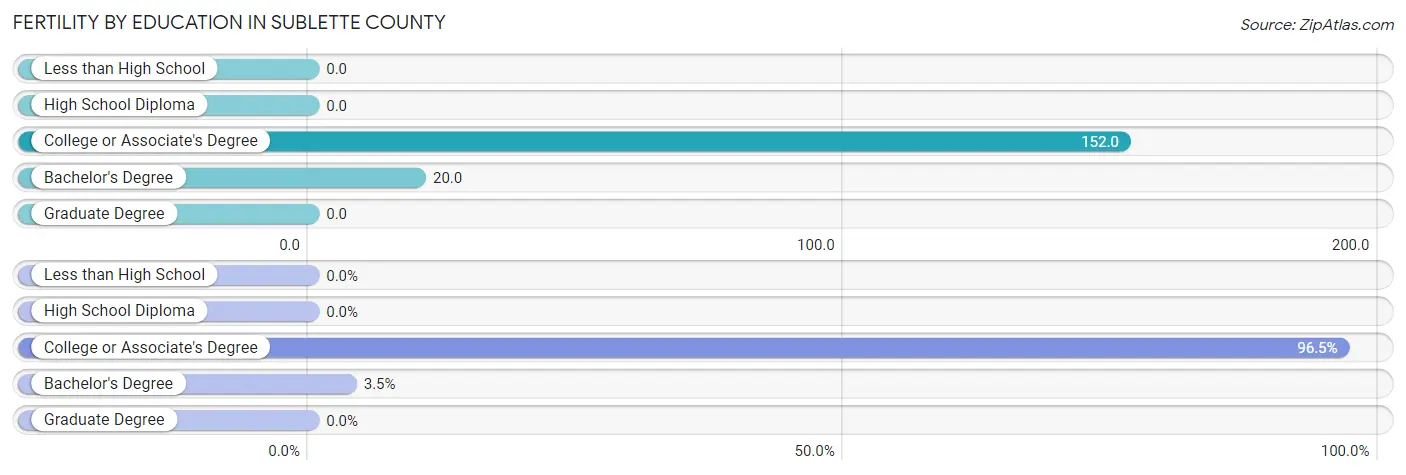
| Educational Attainment | Women with Births | Births / 1,000 Women |
| Less than High School | 0 (0.0%) | 0.0 |
| High School Diploma | 0 (0.0%) | 0.0 |
| College or Associate's Degree | 110 (96.5%) | 152.0 |
| Bachelor's Degree | 4 (3.5%) | 20.0 |
| Graduate Degree | 0 (0.0%) | 0.0 |
| Total | 114 (100.0%) | 73.0 |
Fertility by Education by Marriage Status in Sublette County
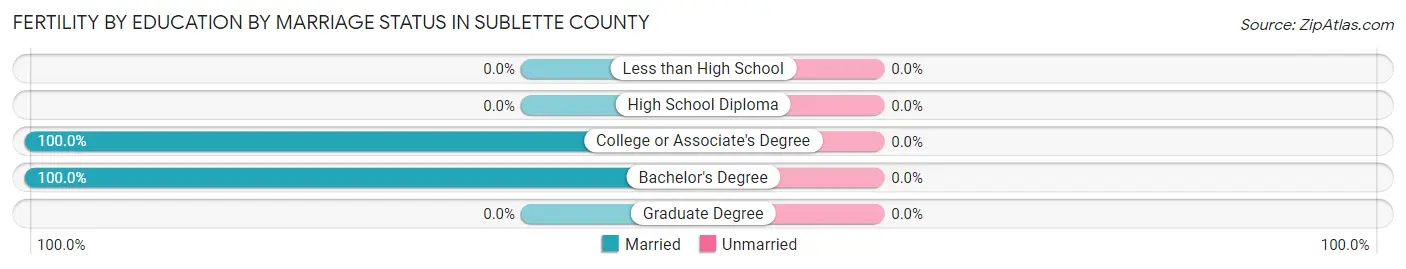
| Educational Attainment | Married | Unmarried |
| Less than High School | 0 (0.0%) | 0 (0.0%) |
| High School Diploma | 0 (0.0%) | 0 (0.0%) |
| College or Associate's Degree | 110 (100.0%) | 0 (0.0%) |
| Bachelor's Degree | 4 (100.0%) | 0 (0.0%) |
| Graduate Degree | 0 (0.0%) | 0 (0.0%) |
| Total | 114 (100.0%) | 0 (0.0%) |
Income in Sublette County
Income Overview in Sublette County
Per Capita Income in Sublette County is $54,704, while median incomes of families and households are $97,425 and $85,960 respectively.
| Characteristic | Number | Measure |
| Per Capita Income | 8,801 | $54,704 |
| Median Family Income | 2,354 | $97,425 |
| Mean Family Income | 2,354 | $116,942 |
| Median Household Income | 3,477 | $85,960 |
| Mean Household Income | 3,477 | $126,919 |
| Income Deficit | 2,354 | $0 |
| Wage / Income Gap (%) | 8,801 | 41.25% |
| Wage / Income Gap ($) | 8,801 | 58.75¢ per $1 |
| Gini / Inequality Index | 8,801 | 0.52 |
Earnings by Sex in Sublette County
Average Earnings in Sublette County are $47,770, $62,368 for men and $36,641 for women, a difference of 41.2%.
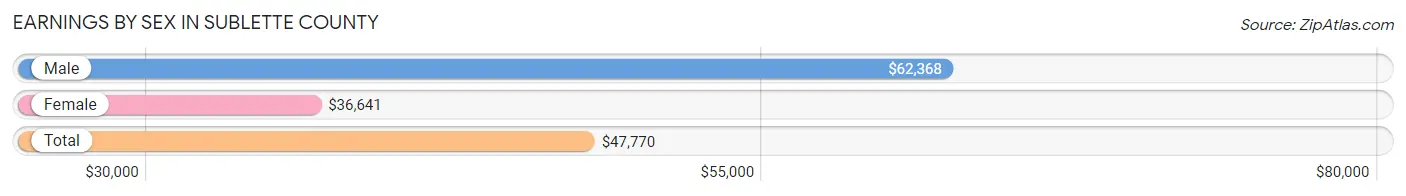
| Sex | Number | Average Earnings |
| Male | 2,807 (57.0%) | $62,368 |
| Female | 2,115 (43.0%) | $36,641 |
| Total | 4,922 (100.0%) | $47,770 |
Earnings by Sex by Income Bracket in Sublette County
The most common earnings brackets in Sublette County are $100,000+ for men (776 | 27.7%) and $40,000 to $44,999 for women (193 | 9.1%).
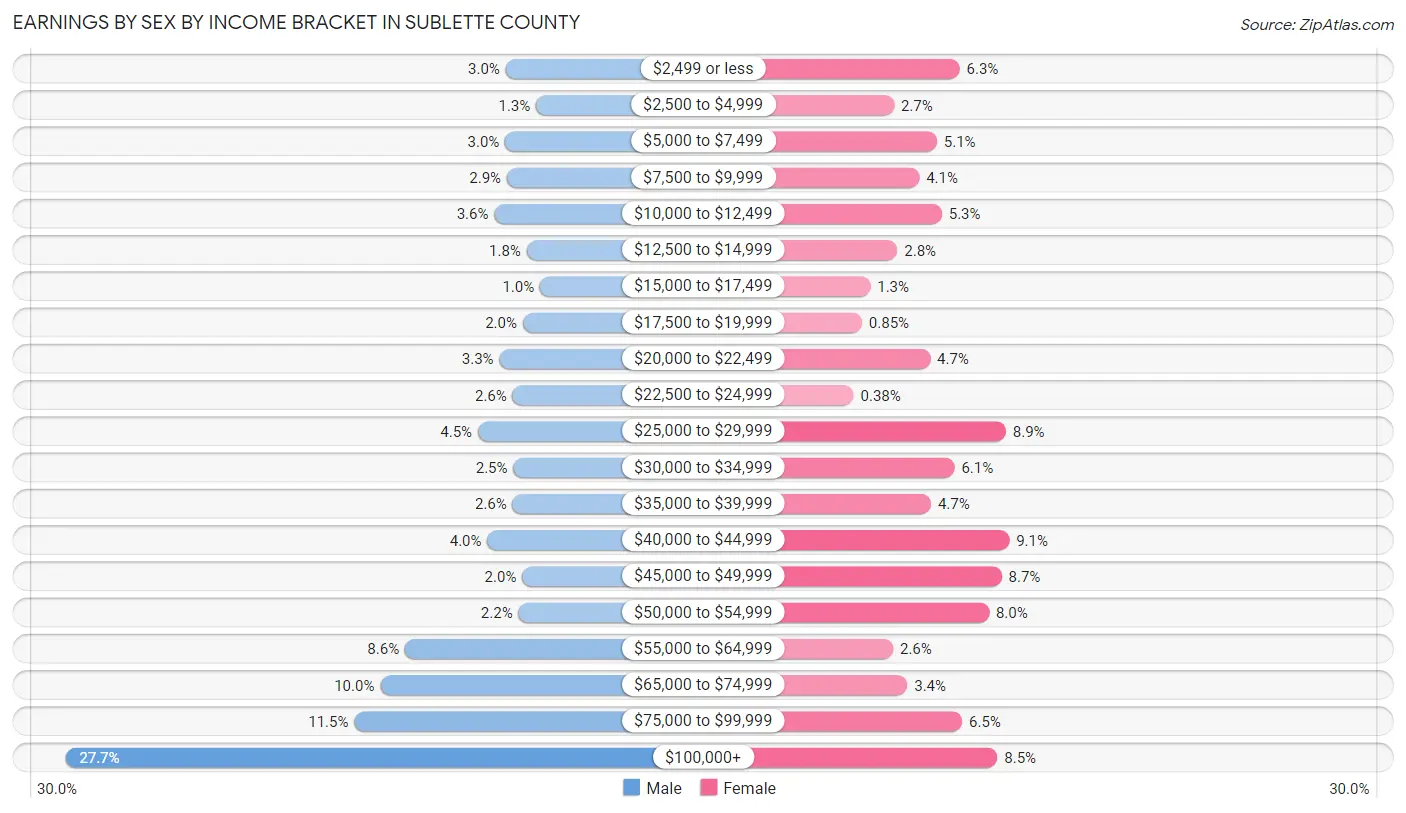
| Income | Male | Female |
| $2,499 or less | 83 (3.0%) | 134 (6.3%) |
| $2,500 to $4,999 | 35 (1.3%) | 56 (2.6%) |
| $5,000 to $7,499 | 84 (3.0%) | 107 (5.1%) |
| $7,500 to $9,999 | 81 (2.9%) | 86 (4.1%) |
| $10,000 to $12,499 | 101 (3.6%) | 113 (5.3%) |
| $12,500 to $14,999 | 50 (1.8%) | 60 (2.8%) |
| $15,000 to $17,499 | 29 (1.0%) | 28 (1.3%) |
| $17,500 to $19,999 | 56 (2.0%) | 18 (0.9%) |
| $20,000 to $22,499 | 93 (3.3%) | 99 (4.7%) |
| $22,500 to $24,999 | 72 (2.6%) | 8 (0.4%) |
| $25,000 to $29,999 | 127 (4.5%) | 189 (8.9%) |
| $30,000 to $34,999 | 71 (2.5%) | 128 (6.0%) |
| $35,000 to $39,999 | 72 (2.6%) | 100 (4.7%) |
| $40,000 to $44,999 | 112 (4.0%) | 193 (9.1%) |
| $45,000 to $49,999 | 57 (2.0%) | 184 (8.7%) |
| $50,000 to $54,999 | 63 (2.2%) | 169 (8.0%) |
| $55,000 to $64,999 | 242 (8.6%) | 55 (2.6%) |
| $65,000 to $74,999 | 281 (10.0%) | 72 (3.4%) |
| $75,000 to $99,999 | 322 (11.5%) | 137 (6.5%) |
| $100,000+ | 776 (27.7%) | 179 (8.5%) |
| Total | 2,807 (100.0%) | 2,115 (100.0%) |
Earnings by Sex by Educational Attainment in Sublette County
Average earnings in Sublette County are $69,805 for men and $37,551 for women, a difference of 46.2%. Men with an educational attainment of bachelor's degree enjoy the highest average annual earnings of $76,000, while those with less than high school education earn the least with $59,318. Women with an educational attainment of graduate degree earn the most with the average annual earnings of $56,364, while those with less than high school education have the smallest earnings of $17,788.
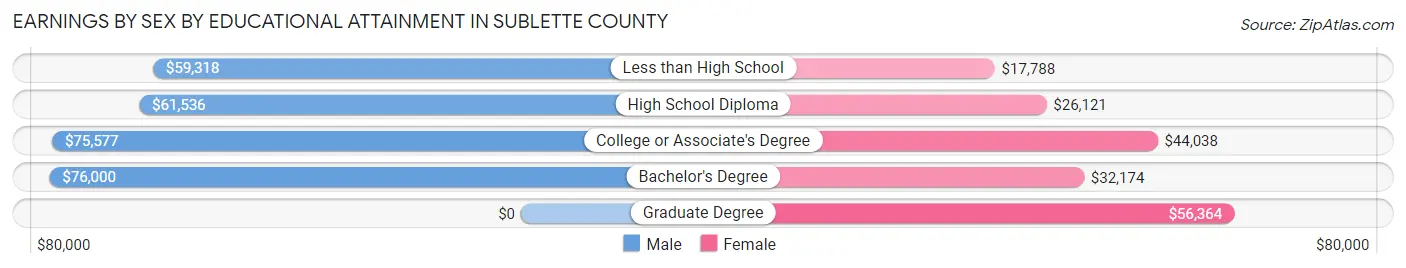
| Educational Attainment | Male Income | Female Income |
| Less than High School | $59,318 | $17,788 |
| High School Diploma | $61,536 | $26,121 |
| College or Associate's Degree | $75,577 | $44,038 |
| Bachelor's Degree | $76,000 | $32,174 |
| Graduate Degree | - | - |
| Total | $69,805 | $37,551 |
Family Income in Sublette County
Family Income Brackets in Sublette County
According to the Sublette County family income data, there are 647 families falling into the $100,000 to $149,999 income range, which is the most common income bracket and makes up 27.5% of all families.
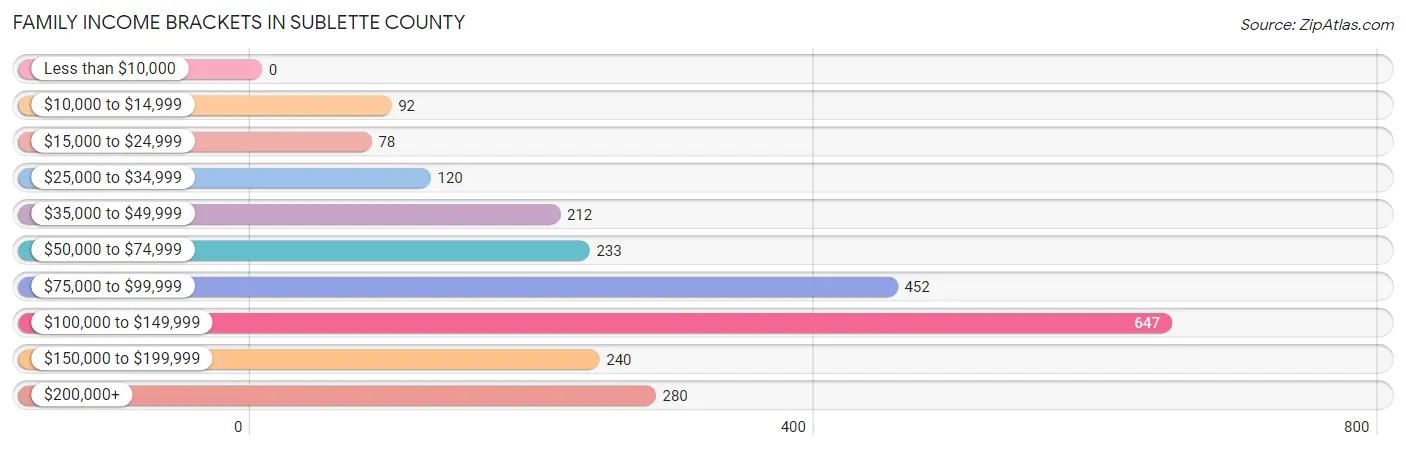
| Income Bracket | # Families | % Families |
| Less than $10,000 | 0 | 0.0% |
| $10,000 to $14,999 | 92 | 3.9% |
| $15,000 to $24,999 | 78 | 3.3% |
| $25,000 to $34,999 | 120 | 5.1% |
| $35,000 to $49,999 | 212 | 9.0% |
| $50,000 to $74,999 | 233 | 9.9% |
| $75,000 to $99,999 | 452 | 19.2% |
| $100,000 to $149,999 | 647 | 27.5% |
| $150,000 to $199,999 | 240 | 10.2% |
| $200,000+ | 280 | 11.9% |
Family Income by Famaliy Size in Sublette County
4-person families (346 | 14.7%) account for the highest median family income in Sublette County with $126,458 per family, while 3-person families (455 | 19.3%) have the highest median income of $41,250 per family member.
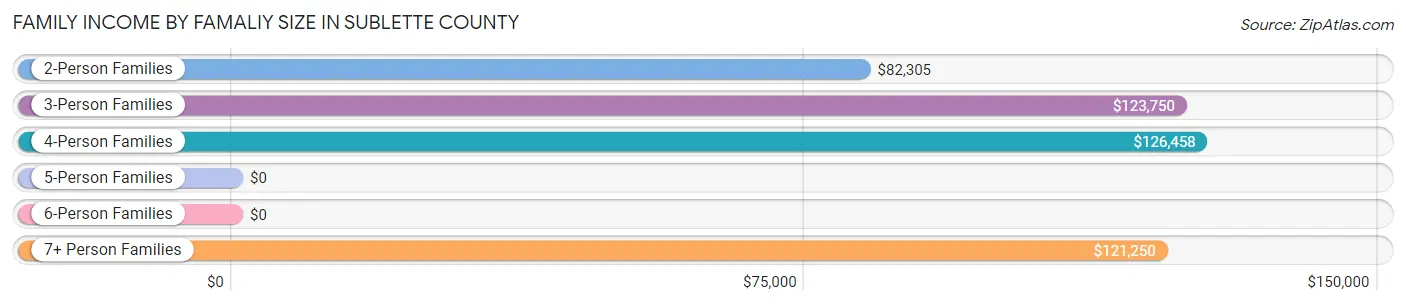
| Income Bracket | # Families | Median Income |
| 2-Person Families | 1,340 (56.9%) | $82,305 |
| 3-Person Families | 455 (19.3%) | $123,750 |
| 4-Person Families | 346 (14.7%) | $126,458 |
| 5-Person Families | 159 (6.8%) | $0 |
| 6-Person Families | 20 (0.9%) | $0 |
| 7+ Person Families | 34 (1.4%) | $121,250 |
| Total | 2,354 (100.0%) | $97,425 |
Family Income by Number of Earners in Sublette County
The median family income in Sublette County is $97,425, with families comprising 3+ earners (179) having the highest median family income of $155,781, while families with no earners (256) have the lowest median family income of $80,789, accounting for 7.6% and 10.9% of families, respectively.
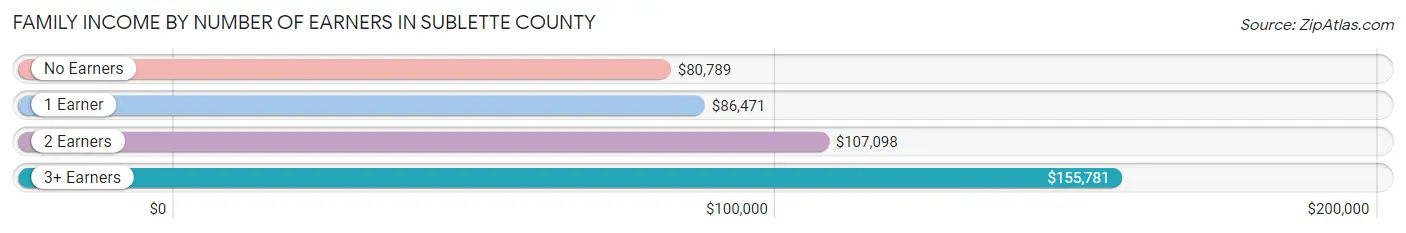
| Number of Earners | # Families | Median Income |
| No Earners | 256 (10.9%) | $80,789 |
| 1 Earner | 956 (40.6%) | $86,471 |
| 2 Earners | 963 (40.9%) | $107,098 |
| 3+ Earners | 179 (7.6%) | $155,781 |
| Total | 2,354 (100.0%) | $97,425 |
Household Income in Sublette County
Household Income Brackets in Sublette County
With 702 households falling in the category, the $100,000 to $149,999 income range is the most frequent in Sublette County, accounting for 20.2% of all households. In contrast, only 76 households (2.2%) fall into the less than $10,000 income bracket, making it the least populous group.
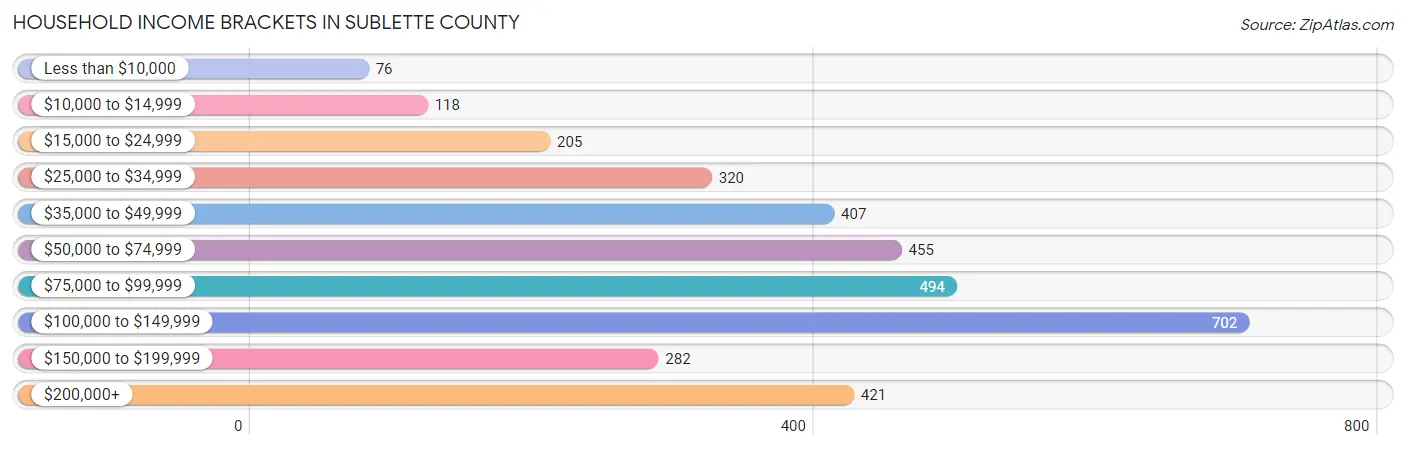
| Income Bracket | # Households | % Households |
| Less than $10,000 | 76 | 2.2% |
| $10,000 to $14,999 | 118 | 3.4% |
| $15,000 to $24,999 | 205 | 5.9% |
| $25,000 to $34,999 | 320 | 9.2% |
| $35,000 to $49,999 | 407 | 11.7% |
| $50,000 to $74,999 | 455 | 13.1% |
| $75,000 to $99,999 | 494 | 14.2% |
| $100,000 to $149,999 | 702 | 20.2% |
| $150,000 to $199,999 | 282 | 8.1% |
| $200,000+ | 421 | 12.1% |
Household Income by Householder Age in Sublette County
The median household income in Sublette County is $85,960, with the highest median household income of $104,714 found in the 25 to 44 years age bracket for the primary householder. A total of 942 households (27.1%) fall into this category. Meanwhile, the 15 to 24 years age bracket for the primary householder has the lowest median household income of $0, with 61 households (1.8%) in this group.
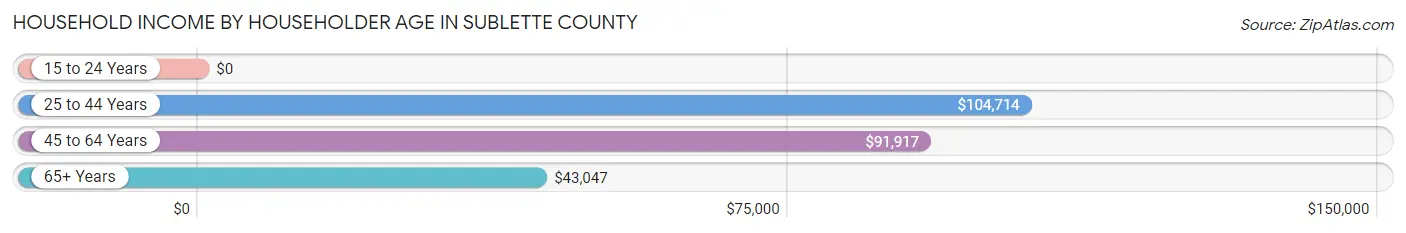
| Income Bracket | # Households | Median Income |
| 15 to 24 Years | 61 (1.8%) | $0 |
| 25 to 44 Years | 942 (27.1%) | $104,714 |
| 45 to 64 Years | 1,257 (36.1%) | $91,917 |
| 65+ Years | 1,217 (35.0%) | $43,047 |
| Total | 3,477 (100.0%) | $85,960 |
Poverty in Sublette County
Income Below Poverty by Sex and Age in Sublette County
With 8.8% poverty level for males and 7.2% for females among the residents of Sublette County, 18 to 24 year old males and 16 and 17 year old females are the most vulnerable to poverty, with 118 males (31.2%) and 33 females (60.0%) in their respective age groups living below the poverty level.
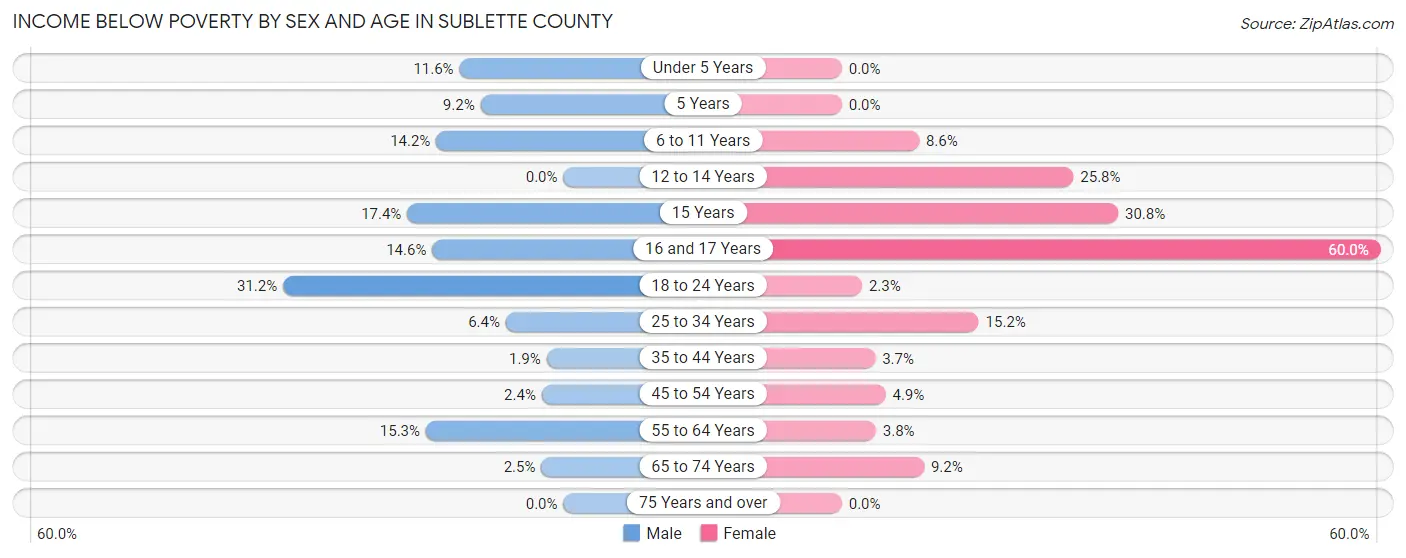
| Age Bracket | Male | Female |
| Under 5 Years | 28 (11.6%) | 0 (0.0%) |
| 5 Years | 12 (9.2%) | 0 (0.0%) |
| 6 to 11 Years | 48 (14.2%) | 25 (8.6%) |
| 12 to 14 Years | 0 (0.0%) | 41 (25.8%) |
| 15 Years | 24 (17.4%) | 4 (30.8%) |
| 16 and 17 Years | 20 (14.6%) | 33 (60.0%) |
| 18 to 24 Years | 118 (31.2%) | 6 (2.2%) |
| 25 to 34 Years | 28 (6.4%) | 57 (15.2%) |
| 35 to 44 Years | 11 (1.9%) | 20 (3.7%) |
| 45 to 54 Years | 13 (2.4%) | 24 (4.9%) |
| 55 to 64 Years | 100 (15.3%) | 22 (3.8%) |
| 65 to 74 Years | 15 (2.5%) | 57 (9.1%) |
| 75 Years and over | 0 (0.0%) | 0 (0.0%) |
| Total | 417 (8.8%) | 289 (7.2%) |
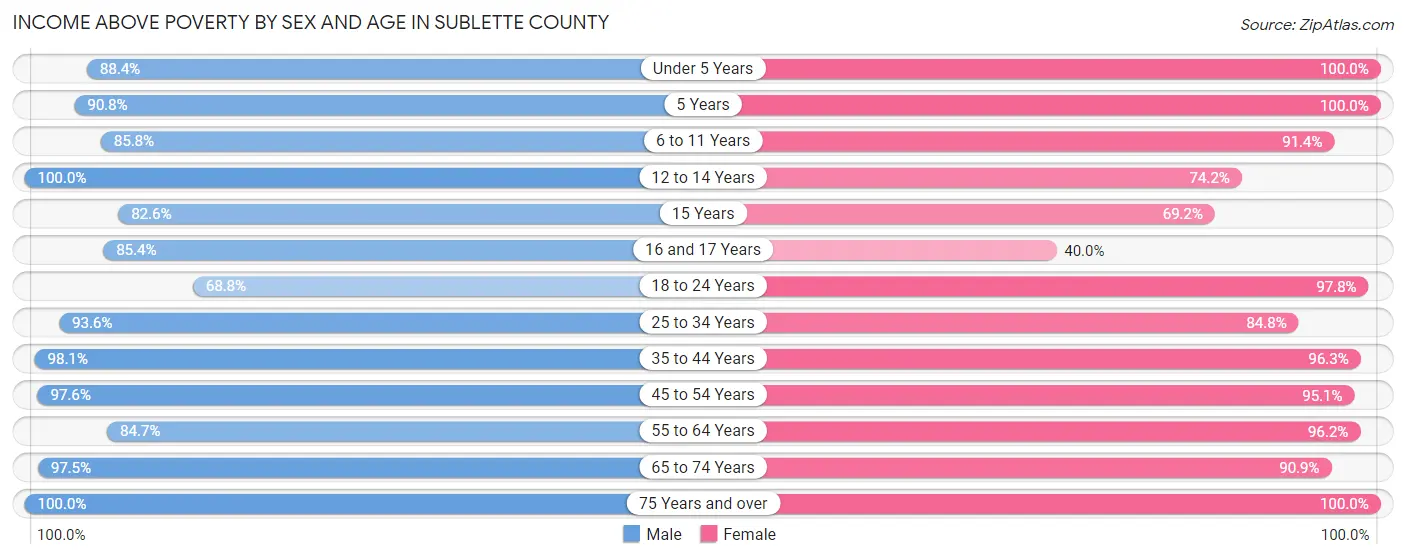
Income Above Poverty by Sex and Age in Sublette County
According to the poverty statistics in Sublette County, males aged 12 to 14 years and females aged under 5 years are the age groups that are most secure financially, with 100.0% of males and 100.0% of females in these age groups living above the poverty line.
| Age Bracket | Male | Female |
| Under 5 Years | 214 (88.4%) | 208 (100.0%) |
| 5 Years | 118 (90.8%) | 76 (100.0%) |
| 6 to 11 Years | 291 (85.8%) | 266 (91.4%) |
| 12 to 14 Years | 161 (100.0%) | 118 (74.2%) |
| 15 Years | 114 (82.6%) | 9 (69.2%) |
| 16 and 17 Years | 117 (85.4%) | 22 (40.0%) |
| 18 to 24 Years | 260 (68.8%) | 261 (97.8%) |
| 25 to 34 Years | 409 (93.6%) | 317 (84.8%) |
| 35 to 44 Years | 580 (98.1%) | 518 (96.3%) |
| 45 to 54 Years | 527 (97.6%) | 469 (95.1%) |
| 55 to 64 Years | 553 (84.7%) | 559 (96.2%) |
| 65 to 74 Years | 594 (97.5%) | 566 (90.8%) |
| 75 Years and over | 374 (100.0%) | 346 (100.0%) |
| Total | 4,312 (91.2%) | 3,735 (92.8%) |
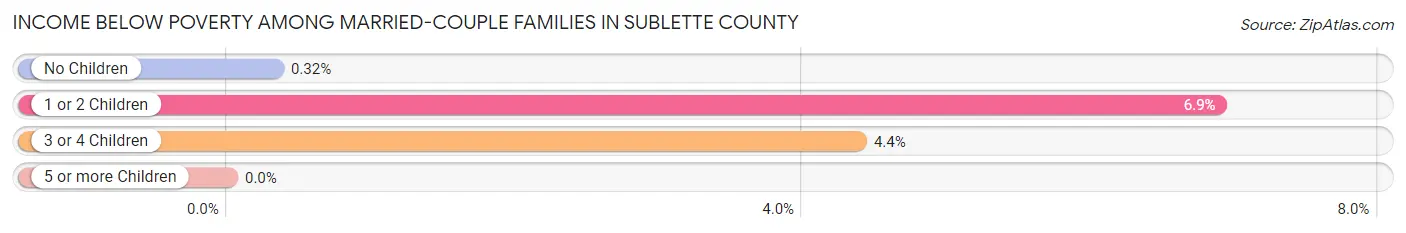
Income Below Poverty Among Married-Couple Families in Sublette County
The poverty statistics for married-couple families in Sublette County show that 2.7% or 55 of the total 2,062 families live below the poverty line. Families with 1 or 2 children have the highest poverty rate of 6.9%, comprising of 44 families. On the other hand, families with 5 or more children have the lowest poverty rate of 0.0%, which includes 0 families.
| Children | Above Poverty | Below Poverty |
| No Children | 1,233 (99.7%) | 4 (0.3%) |
| 1 or 2 Children | 595 (93.1%) | 44 (6.9%) |
| 3 or 4 Children | 153 (95.6%) | 7 (4.4%) |
| 5 or more Children | 26 (100.0%) | 0 (0.0%) |
| Total | 2,007 (97.3%) | 55 (2.7%) |
Income Below Poverty Among Single-Parent Households in Sublette County
According to the poverty data in Sublette County, 10.5% or 6 single-father households and 29.8% or 70 single-mother households are living below the poverty line. Among single-father households, those with no children have the highest poverty rate, with 3 households (15.0%) experiencing poverty. Likewise, among single-mother households, those with 3 or 4 children have the highest poverty rate, with 17 households (68.0%) falling below the poverty line.
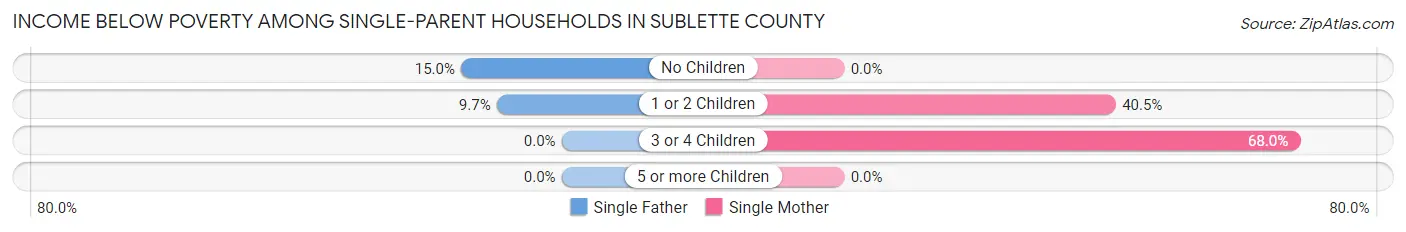
| Children | Single Father | Single Mother |
| No Children | 3 (15.0%) | 0 (0.0%) |
| 1 or 2 Children | 3 (9.7%) | 53 (40.5%) |
| 3 or 4 Children | 0 (0.0%) | 17 (68.0%) |
| 5 or more Children | 0 (0.0%) | 0 (0.0%) |
| Total | 6 (10.5%) | 70 (29.8%) |
Income Below Poverty Among Married-Couple vs Single-Parent Households in Sublette County
The poverty data for Sublette County shows that 55 of the married-couple family households (2.7%) and 76 of the single-parent households (26.0%) are living below the poverty level. Within the married-couple family households, those with 1 or 2 children have the highest poverty rate, with 44 households (6.9%) falling below the poverty line. Among the single-parent households, those with 3 or 4 children have the highest poverty rate, with 17 household (54.8%) living below poverty.
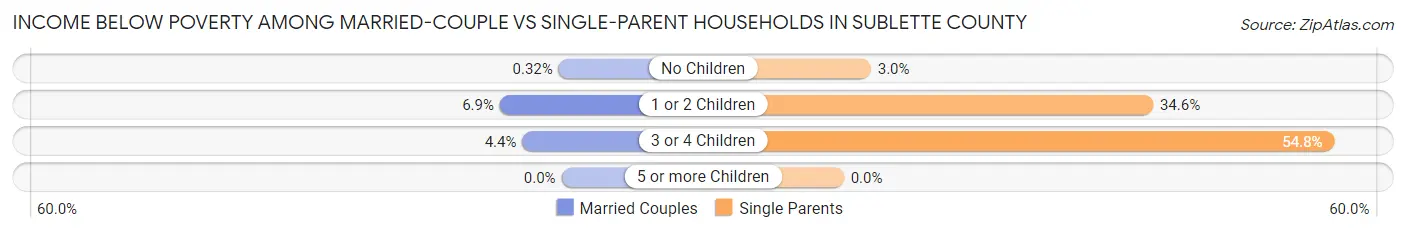
| Children | Married-Couple Families | Single-Parent Households |
| No Children | 4 (0.3%) | 3 (3.0%) |
| 1 or 2 Children | 44 (6.9%) | 56 (34.6%) |
| 3 or 4 Children | 7 (4.4%) | 17 (54.8%) |
| 5 or more Children | 0 (0.0%) | 0 (0.0%) |
| Total | 55 (2.7%) | 76 (26.0%) |
Employment Characteristics in Sublette County
Employment by Class of Employer in Sublette County
Among the 4,365 employed individuals in Sublette County, private company employees (2,899 | 66.4%), local government employees (342 | 7.8%), and self-employed (not incorporated) (334 | 7.6%) make up the most common classes of employment.
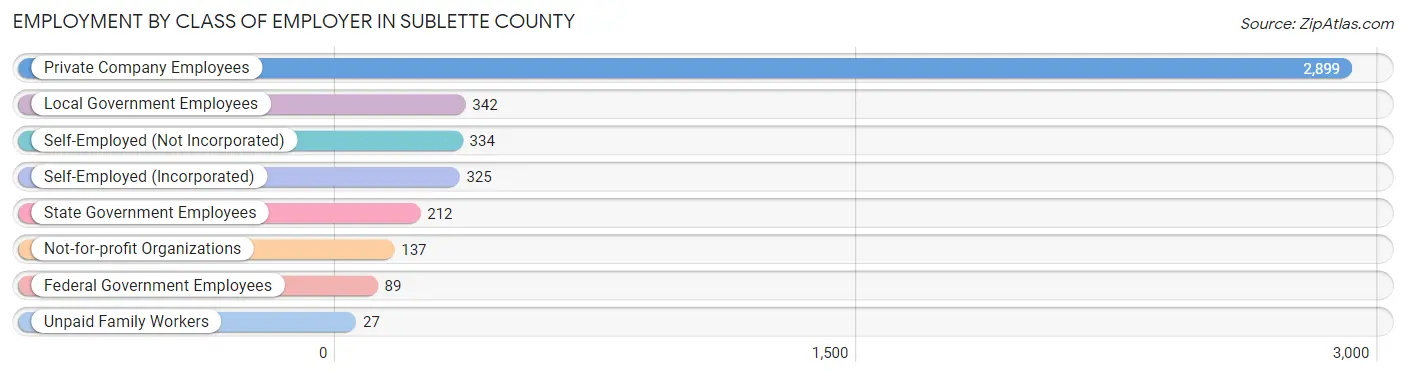
| Employer Class | # Employees | % Employees |
| Private Company Employees | 2,899 | 66.4% |
| Self-Employed (Incorporated) | 325 | 7.4% |
| Self-Employed (Not Incorporated) | 334 | 7.6% |
| Not-for-profit Organizations | 137 | 3.1% |
| Local Government Employees | 342 | 7.8% |
| State Government Employees | 212 | 4.9% |
| Federal Government Employees | 89 | 2.0% |
| Unpaid Family Workers | 27 | 0.6% |
| Total | 4,365 | 100.0% |
Employment Status by Age in Sublette County
According to the labor force statistics for Sublette County, out of the total population over 16 years of age (7,024), 66.5% or 4,671 individuals are in the labor force, with 3.9% or 182 of them unemployed. The age group with the highest labor force participation rate is 20 to 24 years, with 97.5% or 436 individuals in the labor force. Within the labor force, the 25 to 29 years age range has the highest percentage of unemployed individuals, with 31.5% or 92 of them being unemployed.
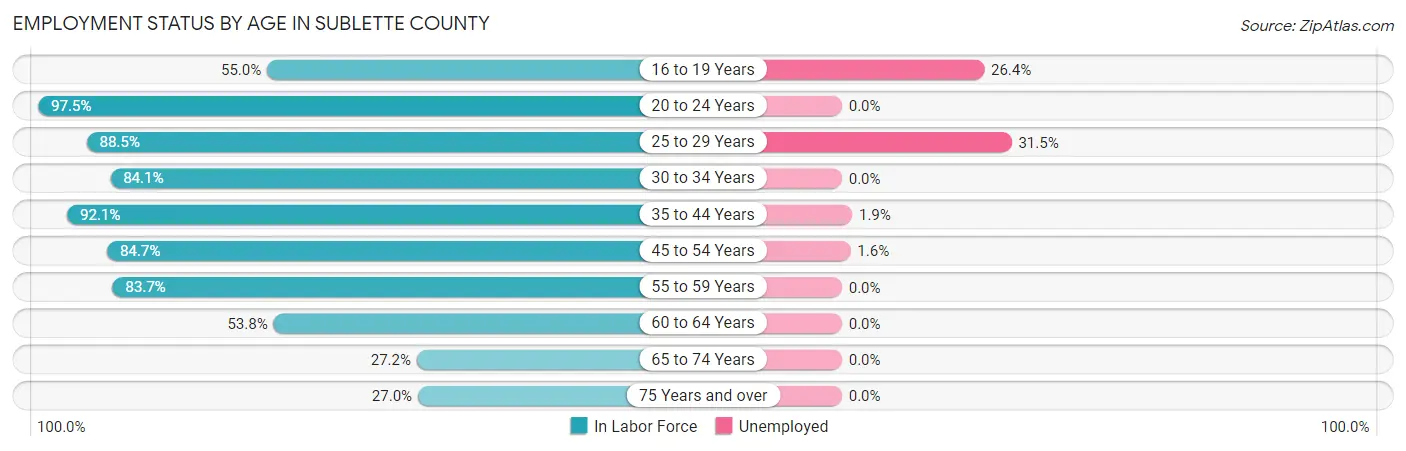
| Age Bracket | In Labor Force | Unemployed |
| 16 to 19 Years | 216 (55.0%) | 57 (26.4%) |
| 20 to 24 Years | 436 (97.5%) | 0 (0.0%) |
| 25 to 29 Years | 292 (88.5%) | 92 (31.5%) |
| 30 to 34 Years | 407 (84.1%) | 0 (0.0%) |
| 35 to 44 Years | 1,043 (92.1%) | 20 (1.9%) |
| 45 to 54 Years | 880 (84.7%) | 14 (1.6%) |
| 55 to 59 Years | 561 (83.7%) | 0 (0.0%) |
| 60 to 64 Years | 306 (53.8%) | 0 (0.0%) |
| 65 to 74 Years | 335 (27.2%) | 0 (0.0%) |
| 75 Years and over | 196 (27.0%) | 0 (0.0%) |
| Total | 4,671 (66.5%) | 182 (3.9%) |
Employment Status by Educational Attainment in Sublette County
According to labor force statistics for Sublette County, 82.6% of individuals (3,490) out of the total population between 25 and 64 years of age (4,225) are in the labor force, with 3.6% or 126 of them being unemployed. The group with the highest labor force participation rate are those with the educational attainment of high school diploma, with 88.6% or 905 individuals in the labor force. Within the labor force, individuals with high school diploma education have the highest percentage of unemployment, with 11.4% or 103 of them being unemployed.
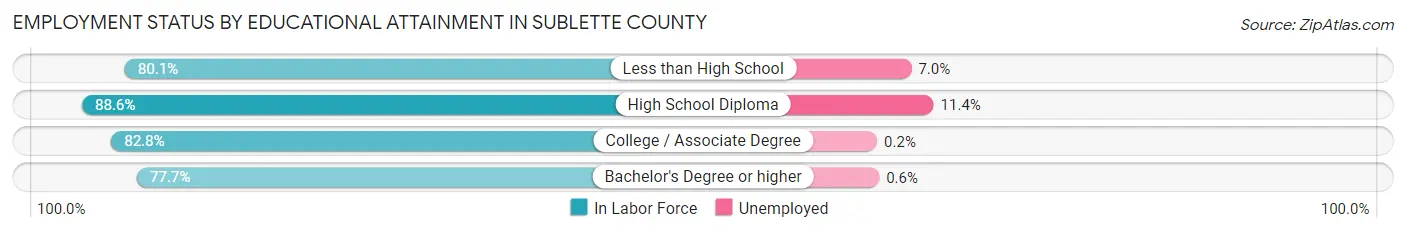
| Educational Attainment | In Labor Force | Unemployed |
| Less than High School | 201 (80.1%) | 18 (7.0%) |
| High School Diploma | 905 (88.6%) | 116 (11.4%) |
| College / Associate Degree | 1,455 (82.8%) | 4 (0.2%) |
| Bachelor's Degree or higher | 929 (77.7%) | 7 (0.6%) |
| Total | 3,490 (82.6%) | 152 (3.6%) |
Employment Occupations by Sex in Sublette County
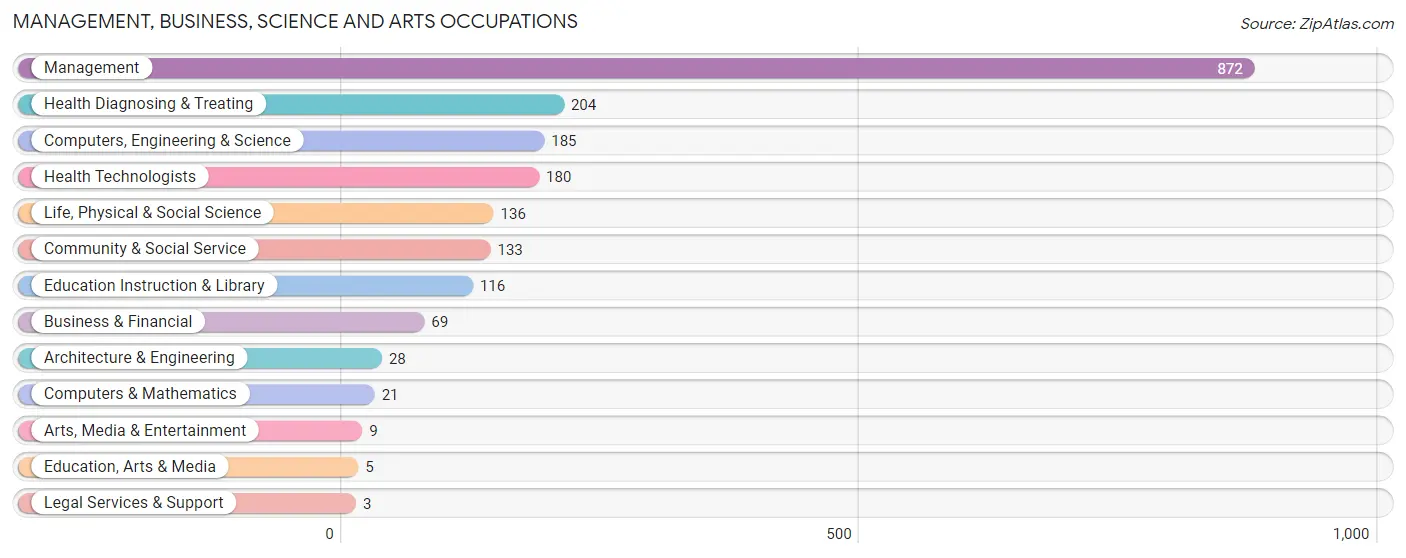
Management, Business, Science and Arts Occupations
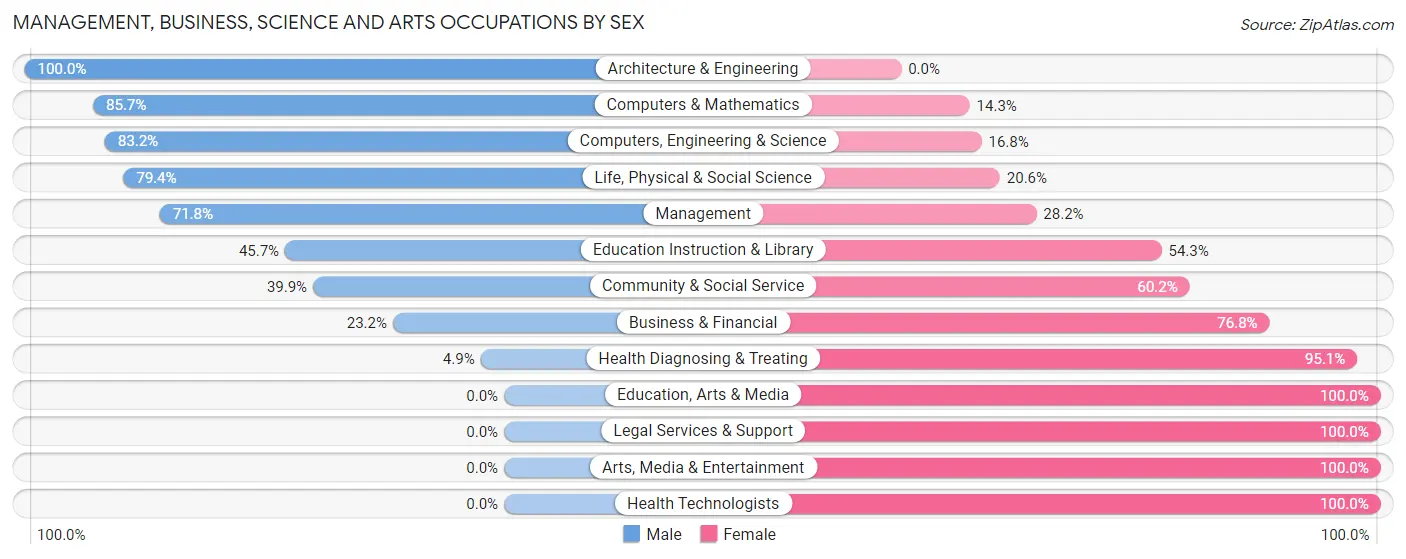
The most common Management, Business, Science and Arts occupations in Sublette County are Management (872 | 19.4%), Health Diagnosing & Treating (204 | 4.5%), Computers, Engineering & Science (185 | 4.1%), Health Technologists (180 | 4.0%), and Life, Physical & Social Science (136 | 3.0%).
Management, Business, Science and Arts Occupations by Sex
Within the Management, Business, Science and Arts occupations in Sublette County, the most male-oriented occupations are Architecture & Engineering (100.0%), Computers & Mathematics (85.7%), and Computers, Engineering & Science (83.2%), while the most female-oriented occupations are Education, Arts & Media (100.0%), Legal Services & Support (100.0%), and Arts, Media & Entertainment (100.0%).
| Occupation | Male | Female |
| Management | 626 (71.8%) | 246 (28.2%) |
| Business & Financial | 16 (23.2%) | 53 (76.8%) |
| Computers, Engineering & Science | 154 (83.2%) | 31 (16.8%) |
| Computers & Mathematics | 18 (85.7%) | 3 (14.3%) |
| Architecture & Engineering | 28 (100.0%) | 0 (0.0%) |
| Life, Physical & Social Science | 108 (79.4%) | 28 (20.6%) |
| Community & Social Service | 53 (39.9%) | 80 (60.2%) |
| Education, Arts & Media | 0 (0.0%) | 5 (100.0%) |
| Legal Services & Support | 0 (0.0%) | 3 (100.0%) |
| Education Instruction & Library | 53 (45.7%) | 63 (54.3%) |
| Arts, Media & Entertainment | 0 (0.0%) | 9 (100.0%) |
| Health Diagnosing & Treating | 10 (4.9%) | 194 (95.1%) |
| Health Technologists | 0 (0.0%) | 180 (100.0%) |
| Total (Category) | 859 (58.7%) | 604 (41.3%) |
| Total (Overall) | 2,457 (54.7%) | 2,032 (45.3%) |
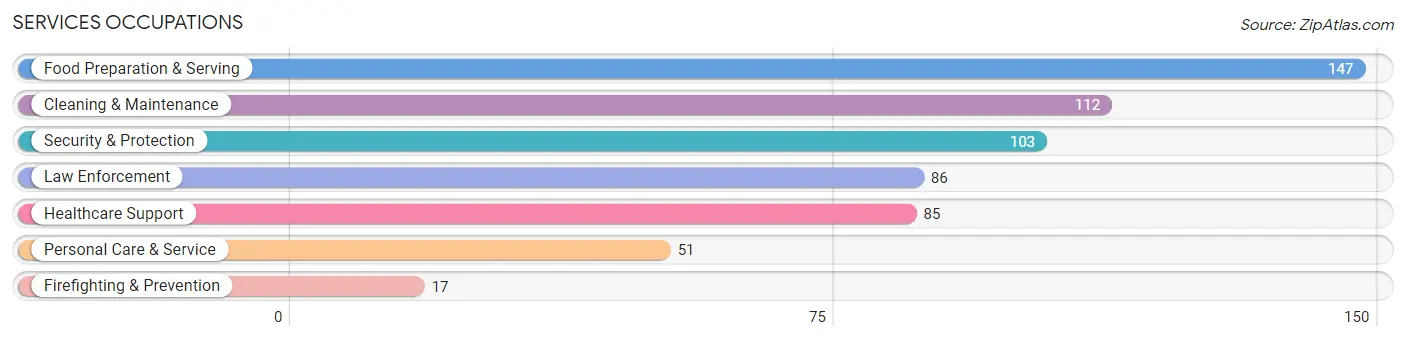
Services Occupations
The most common Services occupations in Sublette County are Food Preparation & Serving (147 | 3.3%), Cleaning & Maintenance (112 | 2.5%), Security & Protection (103 | 2.3%), Law Enforcement (86 | 1.9%), and Healthcare Support (85 | 1.9%).
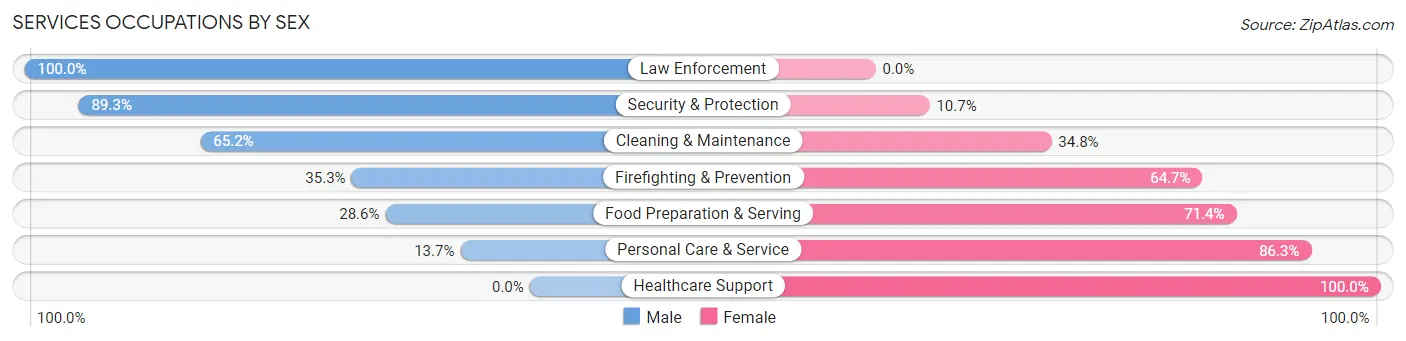
Services Occupations by Sex
Within the Services occupations in Sublette County, the most male-oriented occupations are Law Enforcement (100.0%), Security & Protection (89.3%), and Cleaning & Maintenance (65.2%), while the most female-oriented occupations are Healthcare Support (100.0%), Personal Care & Service (86.3%), and Food Preparation & Serving (71.4%).
| Occupation | Male | Female |
| Healthcare Support | 0 (0.0%) | 85 (100.0%) |
| Security & Protection | 92 (89.3%) | 11 (10.7%) |
| Firefighting & Prevention | 6 (35.3%) | 11 (64.7%) |
| Law Enforcement | 86 (100.0%) | 0 (0.0%) |
| Food Preparation & Serving | 42 (28.6%) | 105 (71.4%) |
| Cleaning & Maintenance | 73 (65.2%) | 39 (34.8%) |
| Personal Care & Service | 7 (13.7%) | 44 (86.3%) |
| Total (Category) | 214 (43.0%) | 284 (57.0%) |
| Total (Overall) | 2,457 (54.7%) | 2,032 (45.3%) |
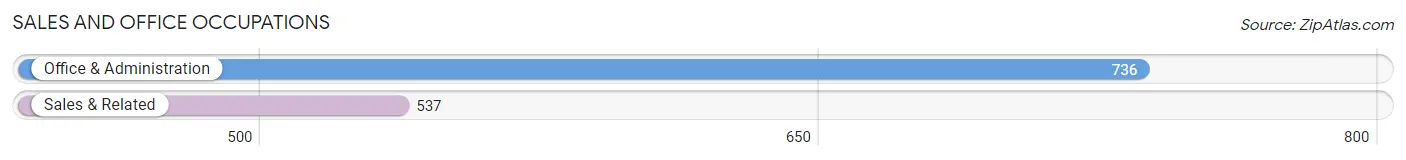
Sales and Office Occupations
The most common Sales and Office occupations in Sublette County are Office & Administration (736 | 16.4%), and Sales & Related (537 | 12.0%).
Sales and Office Occupations by Sex
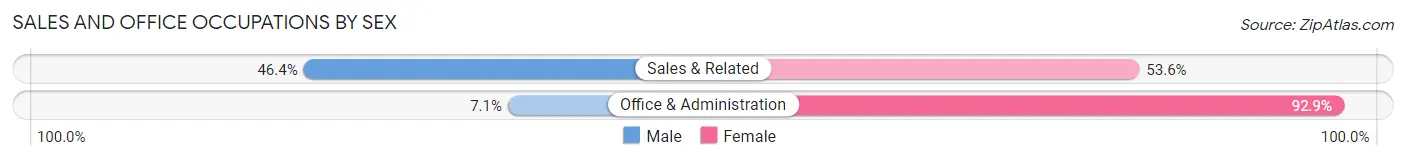
| Occupation | Male | Female |
| Sales & Related | 249 (46.4%) | 288 (53.6%) |
| Office & Administration | 52 (7.1%) | 684 (92.9%) |
| Total (Category) | 301 (23.6%) | 972 (76.4%) |
| Total (Overall) | 2,457 (54.7%) | 2,032 (45.3%) |
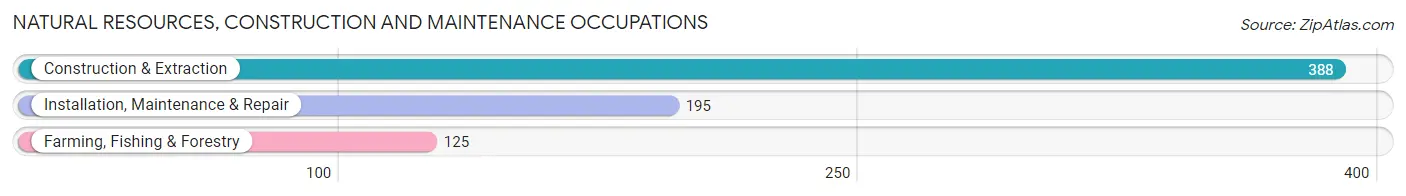
Natural Resources, Construction and Maintenance Occupations
The most common Natural Resources, Construction and Maintenance occupations in Sublette County are Construction & Extraction (388 | 8.6%), Installation, Maintenance & Repair (195 | 4.3%), and Farming, Fishing & Forestry (125 | 2.8%).
Natural Resources, Construction and Maintenance Occupations by Sex
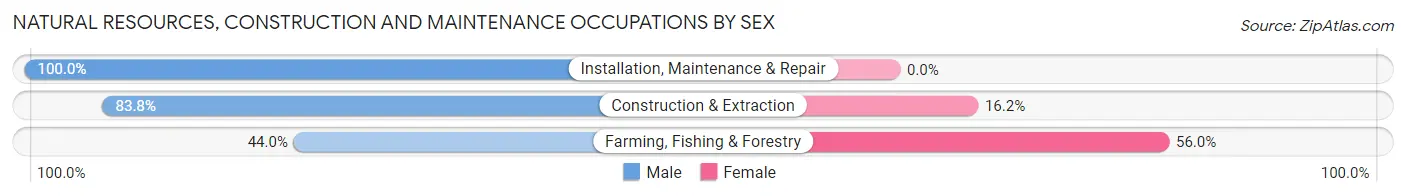
| Occupation | Male | Female |
| Farming, Fishing & Forestry | 55 (44.0%) | 70 (56.0%) |
| Construction & Extraction | 325 (83.8%) | 63 (16.2%) |
| Installation, Maintenance & Repair | 195 (100.0%) | 0 (0.0%) |
| Total (Category) | 575 (81.2%) | 133 (18.8%) |
| Total (Overall) | 2,457 (54.7%) | 2,032 (45.3%) |
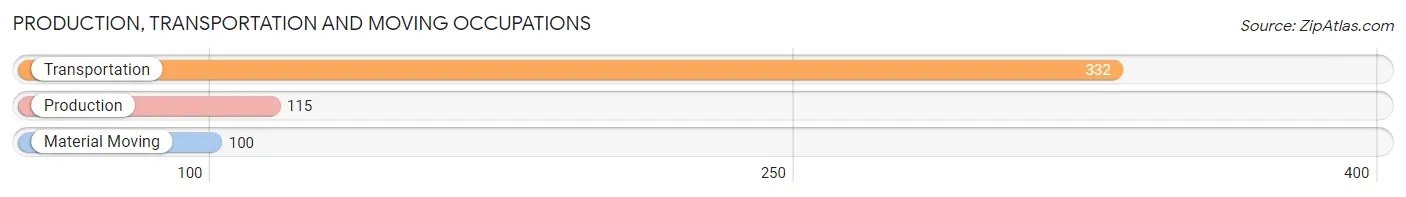
Production, Transportation and Moving Occupations
The most common Production, Transportation and Moving occupations in Sublette County are Transportation (332 | 7.4%), Production (115 | 2.6%), and Material Moving (100 | 2.2%).
Production, Transportation and Moving Occupations by Sex
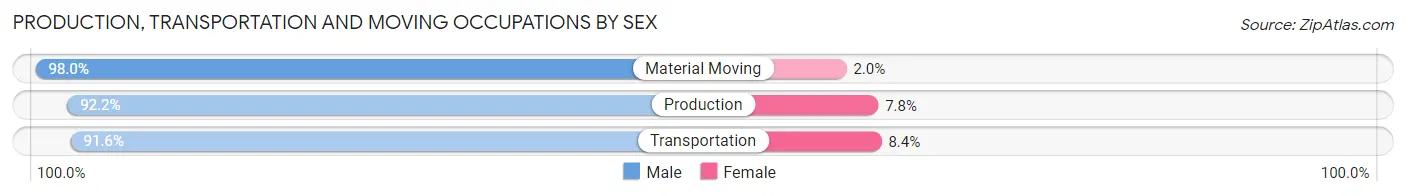
| Occupation | Male | Female |
| Production | 106 (92.2%) | 9 (7.8%) |
| Transportation | 304 (91.6%) | 28 (8.4%) |
| Material Moving | 98 (98.0%) | 2 (2.0%) |
| Total (Category) | 508 (92.9%) | 39 (7.1%) |
| Total (Overall) | 2,457 (54.7%) | 2,032 (45.3%) |
Employment Industries by Sex in Sublette County
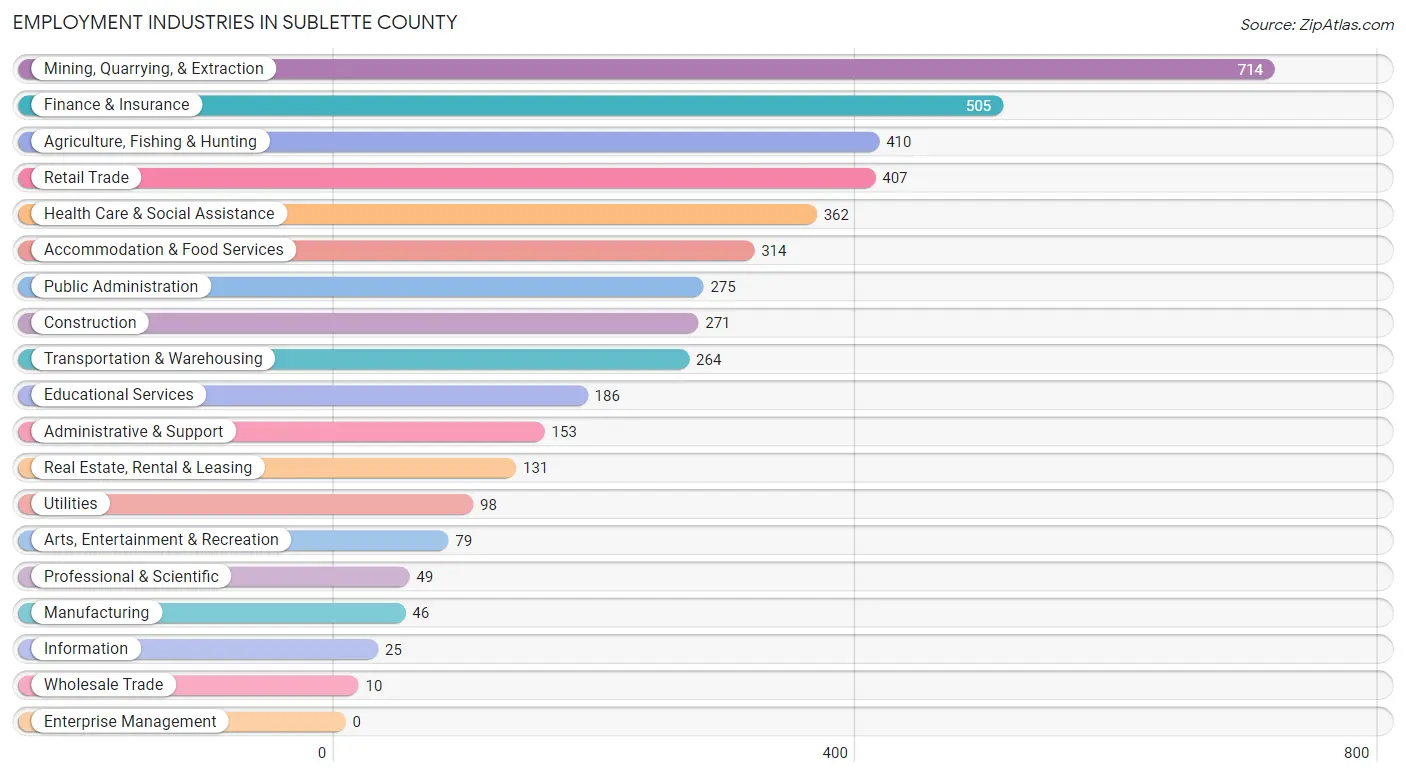
Employment Industries in Sublette County
The major employment industries in Sublette County include Mining, Quarrying, & Extraction (714 | 15.9%), Finance & Insurance (505 | 11.3%), Agriculture, Fishing & Hunting (410 | 9.1%), Retail Trade (407 | 9.1%), and Health Care & Social Assistance (362 | 8.1%).
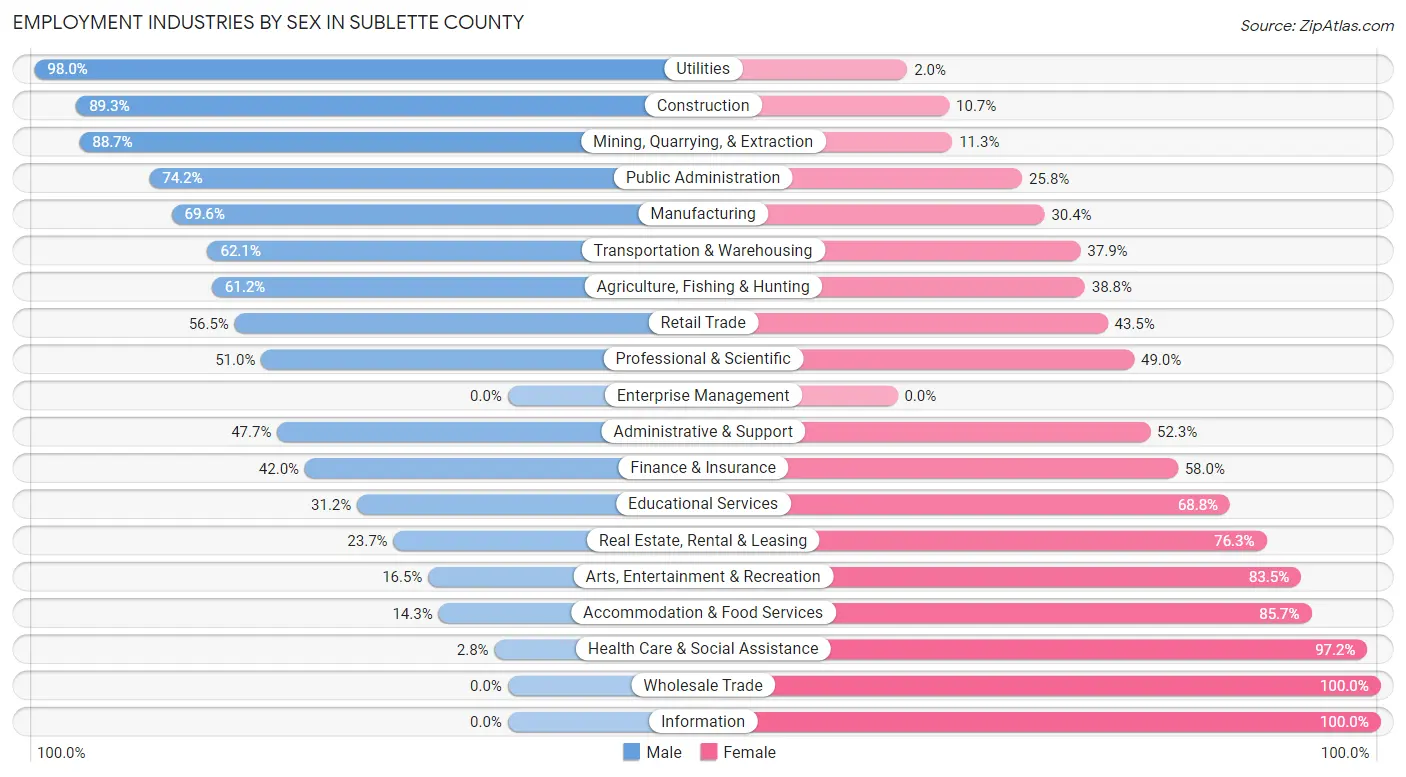
Employment Industries by Sex in Sublette County
The Sublette County industries that see more men than women are Utilities (98.0%), Construction (89.3%), and Mining, Quarrying, & Extraction (88.7%), whereas the industries that tend to have a higher number of women are Wholesale Trade (100.0%), Information (100.0%), and Health Care & Social Assistance (97.2%).
| Industry | Male | Female |
| Agriculture, Fishing & Hunting | 251 (61.2%) | 159 (38.8%) |
| Mining, Quarrying, & Extraction | 633 (88.7%) | 81 (11.3%) |
| Construction | 242 (89.3%) | 29 (10.7%) |
| Manufacturing | 32 (69.6%) | 14 (30.4%) |
| Wholesale Trade | 0 (0.0%) | 10 (100.0%) |
| Retail Trade | 230 (56.5%) | 177 (43.5%) |
| Transportation & Warehousing | 164 (62.1%) | 100 (37.9%) |
| Utilities | 96 (98.0%) | 2 (2.0%) |
| Information | 0 (0.0%) | 25 (100.0%) |
| Finance & Insurance | 212 (42.0%) | 293 (58.0%) |
| Real Estate, Rental & Leasing | 31 (23.7%) | 100 (76.3%) |
| Professional & Scientific | 25 (51.0%) | 24 (49.0%) |
| Enterprise Management | 0 (0.0%) | 0 (0.0%) |
| Administrative & Support | 73 (47.7%) | 80 (52.3%) |
| Educational Services | 58 (31.2%) | 128 (68.8%) |
| Health Care & Social Assistance | 10 (2.8%) | 352 (97.2%) |
| Arts, Entertainment & Recreation | 13 (16.5%) | 66 (83.5%) |
| Accommodation & Food Services | 45 (14.3%) | 269 (85.7%) |
| Public Administration | 204 (74.2%) | 71 (25.8%) |
| Total | 2,457 (54.7%) | 2,032 (45.3%) |
Education in Sublette County
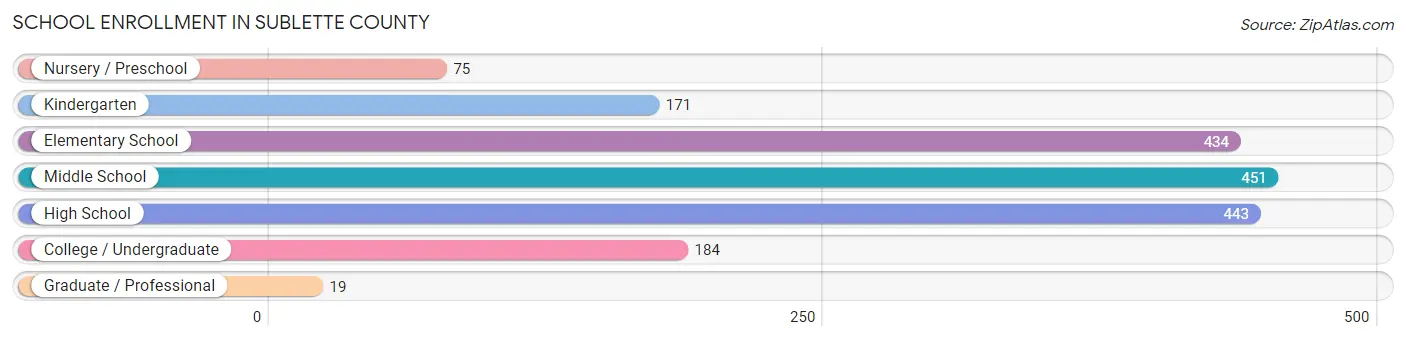
School Enrollment in Sublette County
The most common levels of schooling among the 1,777 students in Sublette County are middle school (451 | 25.4%), high school (443 | 24.9%), and elementary school (434 | 24.4%).
| School Level | # Students | % Students |
| Nursery / Preschool | 75 | 4.2% |
| Kindergarten | 171 | 9.6% |
| Elementary School | 434 | 24.4% |
| Middle School | 451 | 25.4% |
| High School | 443 | 24.9% |
| College / Undergraduate | 184 | 10.3% |
| Graduate / Professional | 19 | 1.1% |
| Total | 1,777 | 100.0% |
School Enrollment by Age by Funding Source in Sublette County
Out of a total of 1,777 students who are enrolled in schools in Sublette County, 238 (13.4%) attend a private institution, while the remaining 1,539 (86.6%) are enrolled in public schools. The age group of 18 to 19 year olds has the highest likelihood of being enrolled in private schools, with 57 (55.9% in the age bracket) enrolled. Conversely, the age group of 3 to 4 year olds has the lowest likelihood of being enrolled in a private school, with 53 (100.0% in the age bracket) attending a public institution.
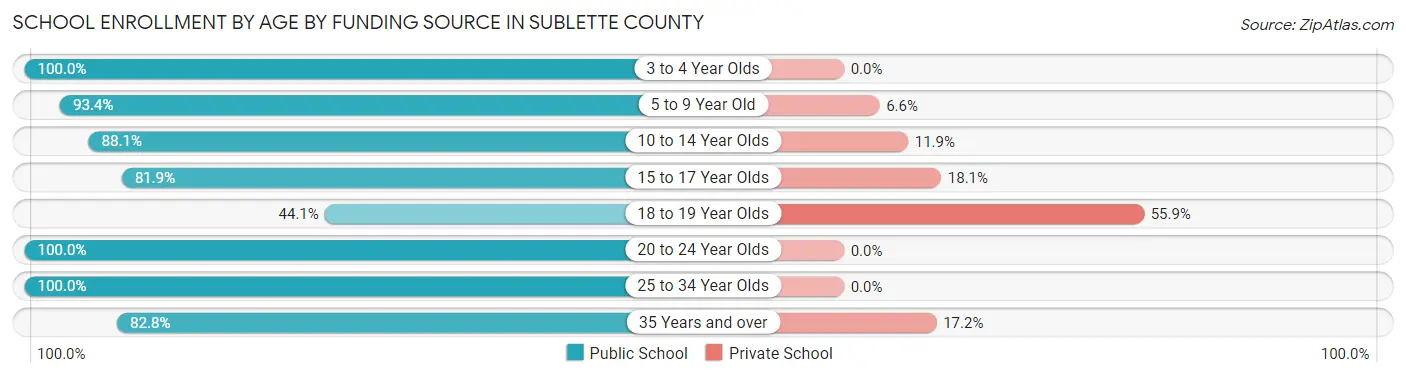
| Age Bracket | Public School | Private School |
| 3 to 4 Year Olds | 53 (100.0%) | 0 (0.0%) |
| 5 to 9 Year Old | 508 (93.4%) | 36 (6.6%) |
| 10 to 14 Year Olds | 509 (88.1%) | 69 (11.9%) |
| 15 to 17 Year Olds | 276 (81.9%) | 61 (18.1%) |
| 18 to 19 Year Olds | 45 (44.1%) | 57 (55.9%) |
| 20 to 24 Year Olds | 38 (100.0%) | 0 (0.0%) |
| 25 to 34 Year Olds | 38 (100.0%) | 0 (0.0%) |
| 35 Years and over | 72 (82.8%) | 15 (17.2%) |
| Total | 1,539 (86.6%) | 238 (13.4%) |
Educational Attainment by Field of Study in Sublette County
Bio, nature & agricultural (403 | 24.2%), business (348 | 20.9%), education (238 | 14.3%), arts & humanities (168 | 10.1%), and liberal arts & history (122 | 7.3%) are the most common fields of study among 1,663 individuals in Sublette County who have obtained a bachelor's degree or higher.
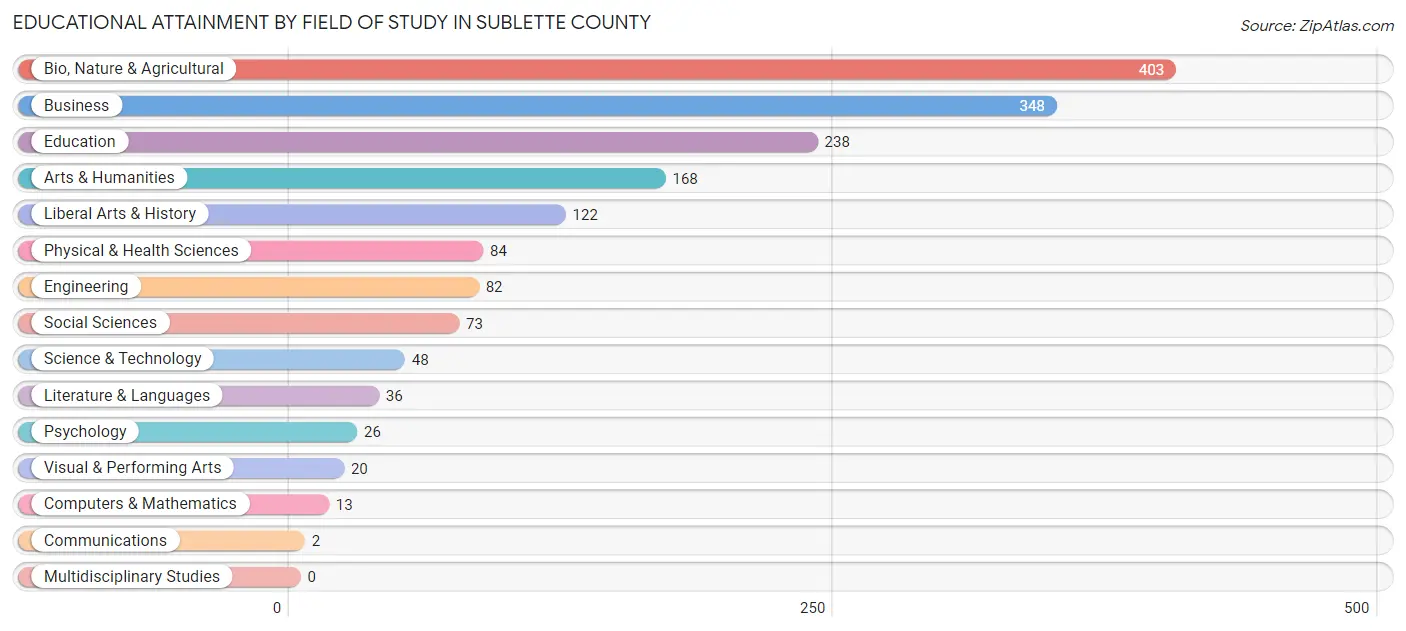
| Field of Study | # Graduates | % Graduates |
| Computers & Mathematics | 13 | 0.8% |
| Bio, Nature & Agricultural | 403 | 24.2% |
| Physical & Health Sciences | 84 | 5.1% |
| Psychology | 26 | 1.6% |
| Social Sciences | 73 | 4.4% |
| Engineering | 82 | 4.9% |
| Multidisciplinary Studies | 0 | 0.0% |
| Science & Technology | 48 | 2.9% |
| Business | 348 | 20.9% |
| Education | 238 | 14.3% |
| Literature & Languages | 36 | 2.2% |
| Liberal Arts & History | 122 | 7.3% |
| Visual & Performing Arts | 20 | 1.2% |
| Communications | 2 | 0.1% |
| Arts & Humanities | 168 | 10.1% |
| Total | 1,663 | 100.0% |
Transportation & Commute in Sublette County
Vehicle Availability by Sex in Sublette County
The most prevalent vehicle ownership categories in Sublette County are males with 2 vehicles (772, accounting for 31.9%) and females with 2 vehicles (574, making up 39.8%).
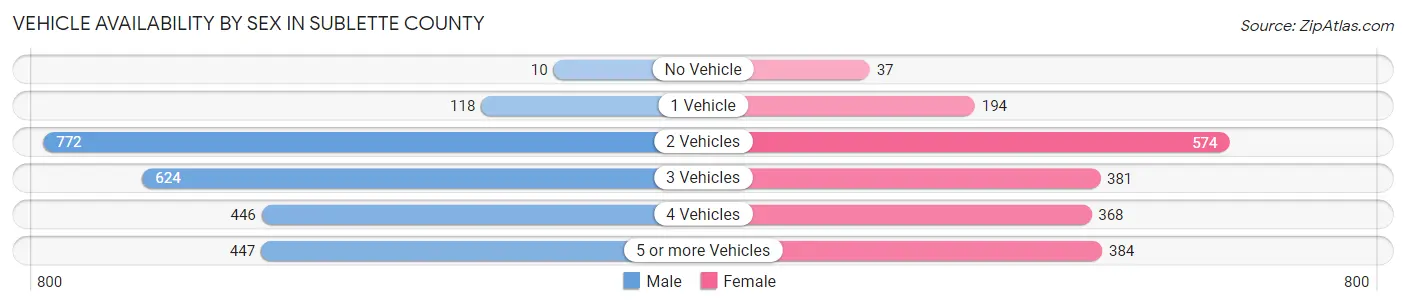
| Vehicles Available | Male | Female |
| No Vehicle | 10 (0.4%) | 37 (1.9%) |
| 1 Vehicle | 118 (4.9%) | 194 (10.0%) |
| 2 Vehicles | 772 (31.9%) | 574 (29.6%) |
| 3 Vehicles | 624 (25.8%) | 381 (19.7%) |
| 4 Vehicles | 446 (18.4%) | 368 (19.0%) |
| 5 or more Vehicles | 447 (18.5%) | 384 (19.8%) |
| Total | 2,417 (100.0%) | 1,938 (100.0%) |
Commute Time in Sublette County
The most frequently occuring commute durations in Sublette County are 5 to 9 minutes (911 commuters, 22.9%), 30 to 34 minutes (575 commuters, 14.4%), and 15 to 19 minutes (509 commuters, 12.8%).
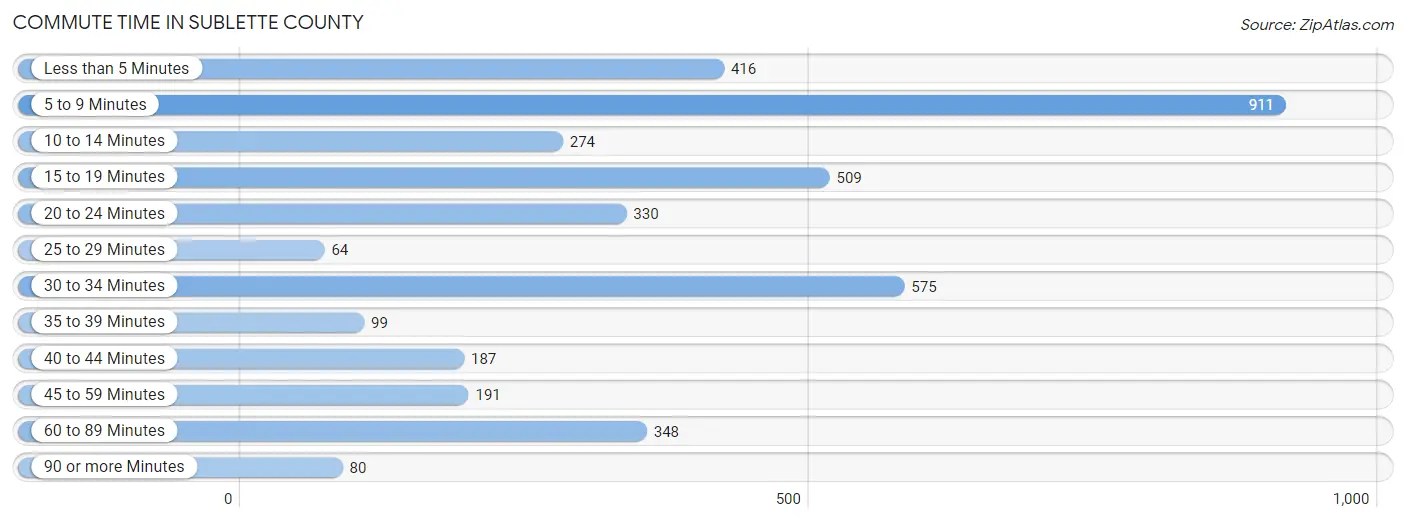
| Commute Time | # Commuters | % Commuters |
| Less than 5 Minutes | 416 | 10.4% |
| 5 to 9 Minutes | 911 | 22.9% |
| 10 to 14 Minutes | 274 | 6.9% |
| 15 to 19 Minutes | 509 | 12.8% |
| 20 to 24 Minutes | 330 | 8.3% |
| 25 to 29 Minutes | 64 | 1.6% |
| 30 to 34 Minutes | 575 | 14.4% |
| 35 to 39 Minutes | 99 | 2.5% |
| 40 to 44 Minutes | 187 | 4.7% |
| 45 to 59 Minutes | 191 | 4.8% |
| 60 to 89 Minutes | 348 | 8.7% |
| 90 or more Minutes | 80 | 2.0% |
Commute Time by Sex in Sublette County
The most common commute times in Sublette County are 30 to 34 minutes (437 commuters, 19.3%) for males and 5 to 9 minutes (563 commuters, 32.9%) for females.
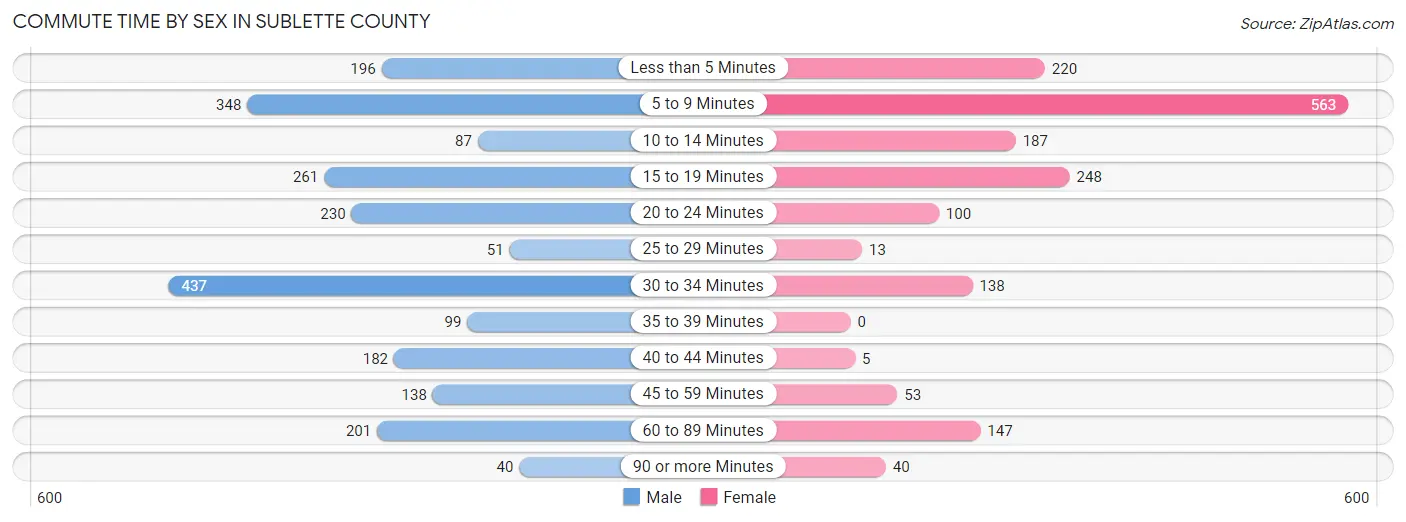
| Commute Time | Male | Female |
| Less than 5 Minutes | 196 (8.6%) | 220 (12.8%) |
| 5 to 9 Minutes | 348 (15.3%) | 563 (32.9%) |
| 10 to 14 Minutes | 87 (3.8%) | 187 (10.9%) |
| 15 to 19 Minutes | 261 (11.5%) | 248 (14.5%) |
| 20 to 24 Minutes | 230 (10.1%) | 100 (5.8%) |
| 25 to 29 Minutes | 51 (2.2%) | 13 (0.8%) |
| 30 to 34 Minutes | 437 (19.3%) | 138 (8.1%) |
| 35 to 39 Minutes | 99 (4.4%) | 0 (0.0%) |
| 40 to 44 Minutes | 182 (8.0%) | 5 (0.3%) |
| 45 to 59 Minutes | 138 (6.1%) | 53 (3.1%) |
| 60 to 89 Minutes | 201 (8.8%) | 147 (8.6%) |
| 90 or more Minutes | 40 (1.8%) | 40 (2.3%) |
Time of Departure to Work by Sex in Sublette County
The most frequent times of departure to work in Sublette County are 7:00 AM to 7:29 AM (363, 16.0%) for males and 7:30 AM to 7:59 AM (458, 26.7%) for females.
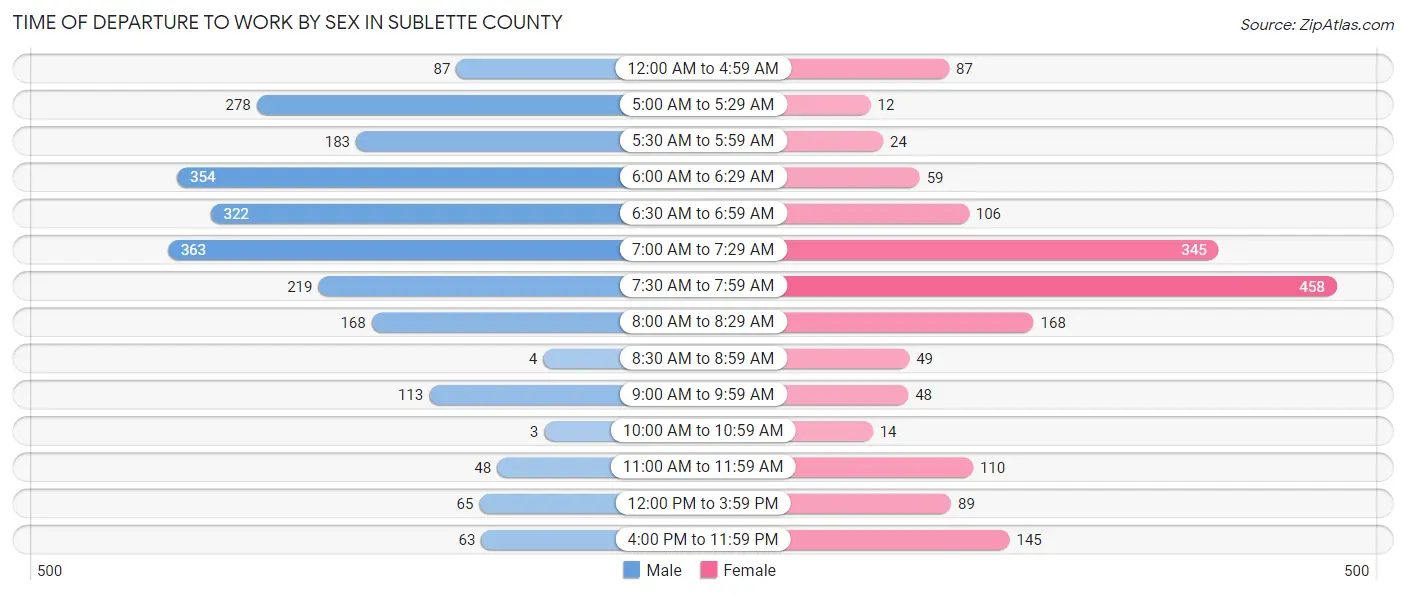
| Time of Departure | Male | Female |
| 12:00 AM to 4:59 AM | 87 (3.8%) | 87 (5.1%) |
| 5:00 AM to 5:29 AM | 278 (12.2%) | 12 (0.7%) |
| 5:30 AM to 5:59 AM | 183 (8.1%) | 24 (1.4%) |
| 6:00 AM to 6:29 AM | 354 (15.6%) | 59 (3.4%) |
| 6:30 AM to 6:59 AM | 322 (14.2%) | 106 (6.2%) |
| 7:00 AM to 7:29 AM | 363 (16.0%) | 345 (20.1%) |
| 7:30 AM to 7:59 AM | 219 (9.7%) | 458 (26.7%) |
| 8:00 AM to 8:29 AM | 168 (7.4%) | 168 (9.8%) |
| 8:30 AM to 8:59 AM | 4 (0.2%) | 49 (2.9%) |
| 9:00 AM to 9:59 AM | 113 (5.0%) | 48 (2.8%) |
| 10:00 AM to 10:59 AM | 3 (0.1%) | 14 (0.8%) |
| 11:00 AM to 11:59 AM | 48 (2.1%) | 110 (6.4%) |
| 12:00 PM to 3:59 PM | 65 (2.9%) | 89 (5.2%) |
| 4:00 PM to 11:59 PM | 63 (2.8%) | 145 (8.5%) |
| Total | 2,270 (100.0%) | 1,714 (100.0%) |
Housing Occupancy in Sublette County
Occupancy by Ownership in Sublette County
Of the total 3,477 dwellings in Sublette County, owner-occupied units account for 2,882 (82.9%), while renter-occupied units make up 595 (17.1%).
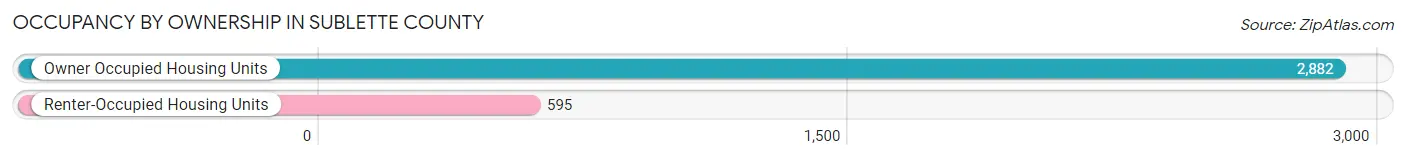
| Occupancy | # Housing Units | % Housing Units |
| Owner Occupied Housing Units | 2,882 | 82.9% |
| Renter-Occupied Housing Units | 595 | 17.1% |
| Total Occupied Housing Units | 3,477 | 100.0% |
Occupancy by Household Size in Sublette County
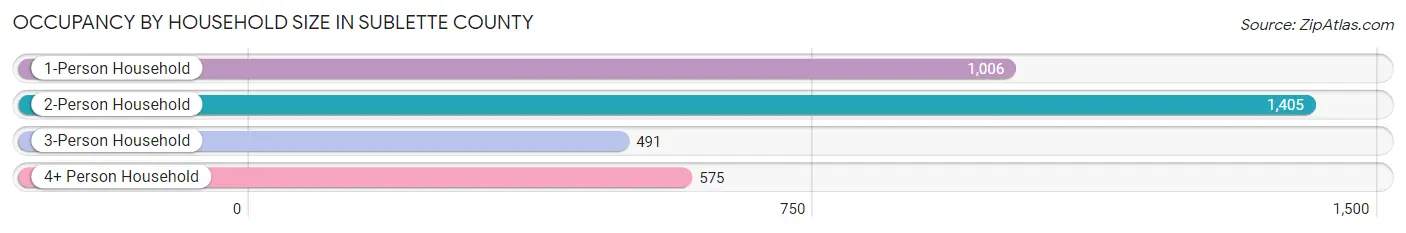
| Household Size | # Housing Units | % Housing Units |
| 1-Person Household | 1,006 | 28.9% |
| 2-Person Household | 1,405 | 40.4% |
| 3-Person Household | 491 | 14.1% |
| 4+ Person Household | 575 | 16.5% |
| Total Housing Units | 3,477 | 100.0% |
Occupancy by Ownership by Household Size in Sublette County
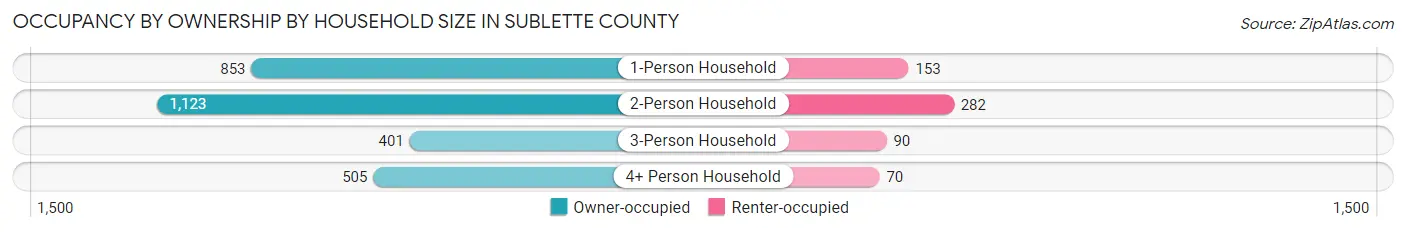
| Household Size | Owner-occupied | Renter-occupied |
| 1-Person Household | 853 (84.8%) | 153 (15.2%) |
| 2-Person Household | 1,123 (79.9%) | 282 (20.1%) |
| 3-Person Household | 401 (81.7%) | 90 (18.3%) |
| 4+ Person Household | 505 (87.8%) | 70 (12.2%) |
| Total Housing Units | 2,882 (82.9%) | 595 (17.1%) |
Occupancy by Educational Attainment in Sublette County
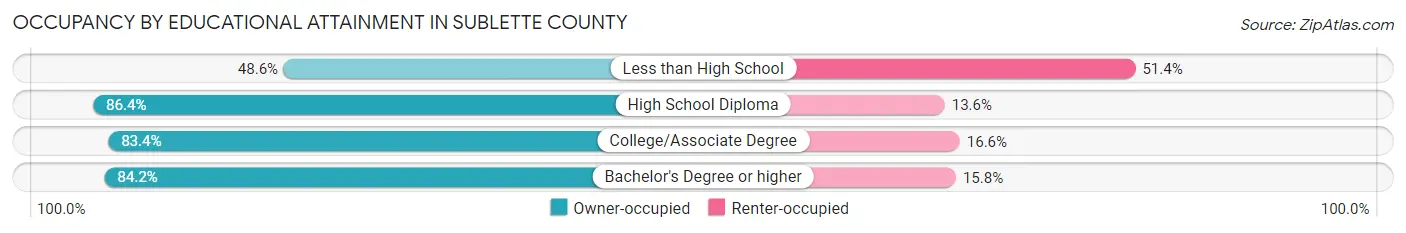
| Household Size | Owner-occupied | Renter-occupied |
| Less than High School | 69 (48.6%) | 73 (51.4%) |
| High School Diploma | 699 (86.4%) | 110 (13.6%) |
| College/Associate Degree | 1,322 (83.4%) | 263 (16.6%) |
| Bachelor's Degree or higher | 792 (84.2%) | 149 (15.8%) |
Occupancy by Age of Householder in Sublette County
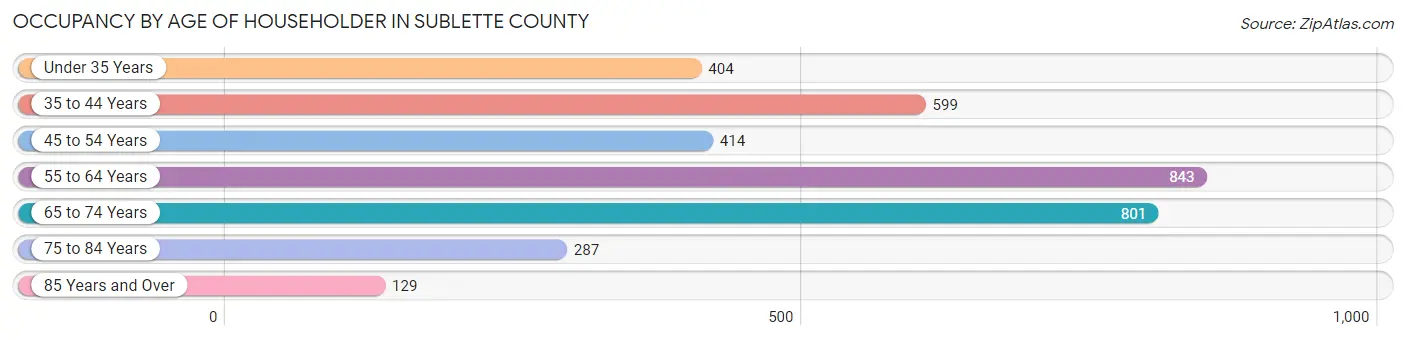
| Age Bracket | # Households | % Households |
| Under 35 Years | 404 | 11.6% |
| 35 to 44 Years | 599 | 17.2% |
| 45 to 54 Years | 414 | 11.9% |
| 55 to 64 Years | 843 | 24.2% |
| 65 to 74 Years | 801 | 23.0% |
| 75 to 84 Years | 287 | 8.3% |
| 85 Years and Over | 129 | 3.7% |
| Total | 3,477 | 100.0% |
Housing Finances in Sublette County
Median Income by Occupancy in Sublette County
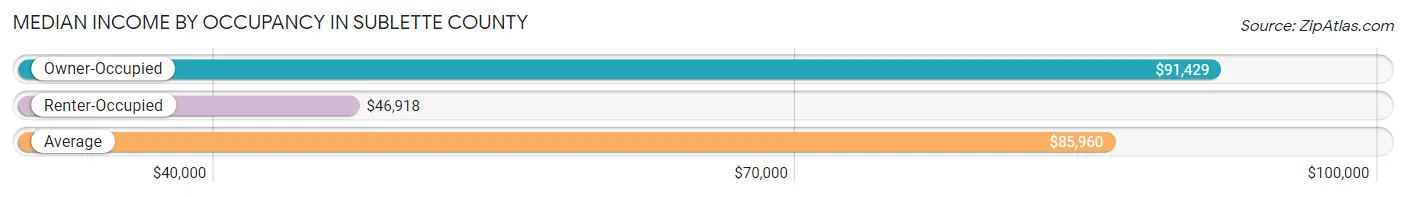
| Occupancy Type | # Households | Median Income |
| Owner-Occupied | 2,882 (82.9%) | $91,429 |
| Renter-Occupied | 595 (17.1%) | $46,918 |
| Average | 3,477 (100.0%) | $85,960 |
Occupancy by Householder Income Bracket in Sublette County
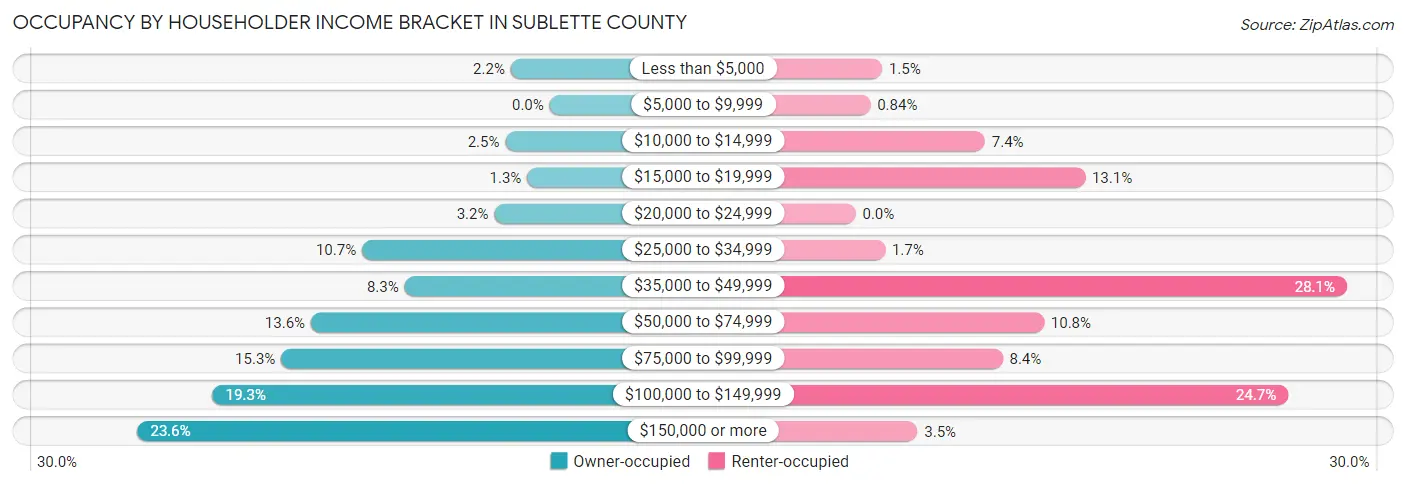
| Income Bracket | Owner-occupied | Renter-occupied |
| Less than $5,000 | 64 (2.2%) | 9 (1.5%) |
| $5,000 to $9,999 | 0 (0.0%) | 5 (0.8%) |
| $10,000 to $14,999 | 73 (2.5%) | 44 (7.4%) |
| $15,000 to $19,999 | 37 (1.3%) | 78 (13.1%) |
| $20,000 to $24,999 | 91 (3.2%) | 0 (0.0%) |
| $25,000 to $34,999 | 309 (10.7%) | 10 (1.7%) |
| $35,000 to $49,999 | 239 (8.3%) | 167 (28.1%) |
| $50,000 to $74,999 | 393 (13.6%) | 64 (10.8%) |
| $75,000 to $99,999 | 442 (15.3%) | 50 (8.4%) |
| $100,000 to $149,999 | 555 (19.3%) | 147 (24.7%) |
| $150,000 or more | 679 (23.6%) | 21 (3.5%) |
| Total | 2,882 (100.0%) | 595 (100.0%) |
Monthly Housing Cost Tiers in Sublette County
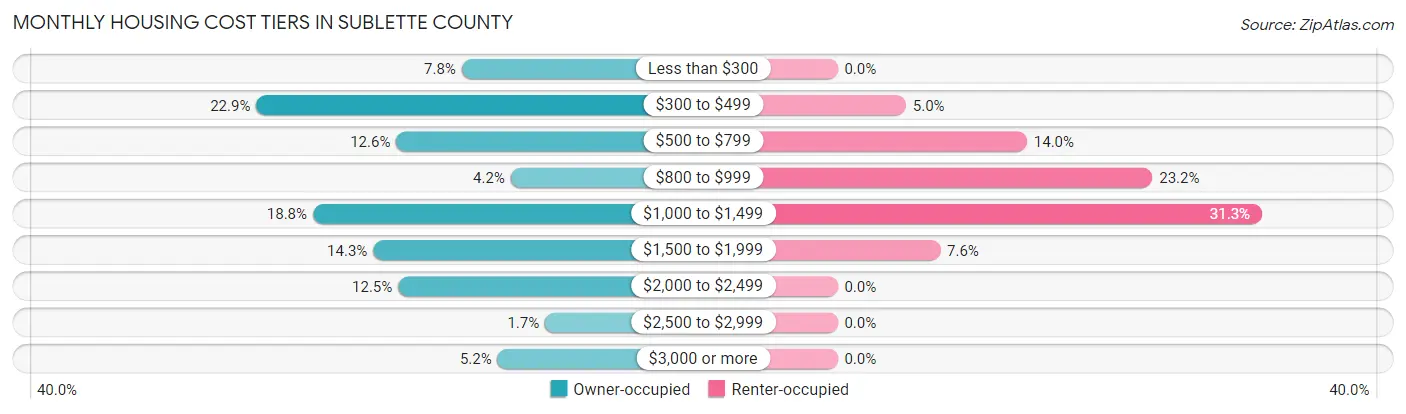
| Monthly Cost | Owner-occupied | Renter-occupied |
| Less than $300 | 225 (7.8%) | 0 (0.0%) |
| $300 to $499 | 661 (22.9%) | 30 (5.0%) |
| $500 to $799 | 364 (12.6%) | 83 (14.0%) |
| $800 to $999 | 121 (4.2%) | 138 (23.2%) |
| $1,000 to $1,499 | 541 (18.8%) | 186 (31.3%) |
| $1,500 to $1,999 | 413 (14.3%) | 45 (7.6%) |
| $2,000 to $2,499 | 360 (12.5%) | 0 (0.0%) |
| $2,500 to $2,999 | 48 (1.7%) | 0 (0.0%) |
| $3,000 or more | 149 (5.2%) | 0 (0.0%) |
| Total | 2,882 (100.0%) | 595 (100.0%) |
Physical Housing Characteristics in Sublette County
Housing Structures in Sublette County
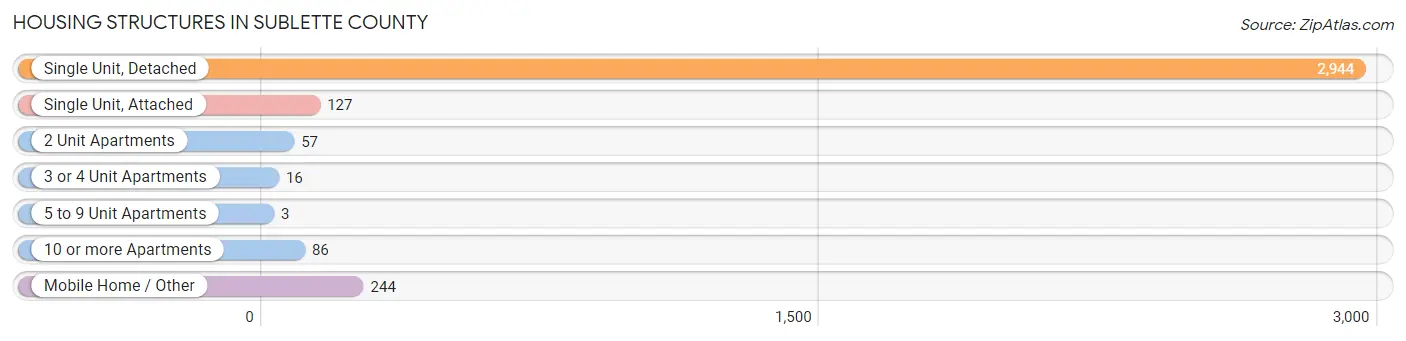
| Structure Type | # Housing Units | % Housing Units |
| Single Unit, Detached | 2,944 | 84.7% |
| Single Unit, Attached | 127 | 3.6% |
| 2 Unit Apartments | 57 | 1.6% |
| 3 or 4 Unit Apartments | 16 | 0.5% |
| 5 to 9 Unit Apartments | 3 | 0.1% |
| 10 or more Apartments | 86 | 2.5% |
| Mobile Home / Other | 244 | 7.0% |
| Total | 3,477 | 100.0% |
Housing Structures by Occupancy in Sublette County
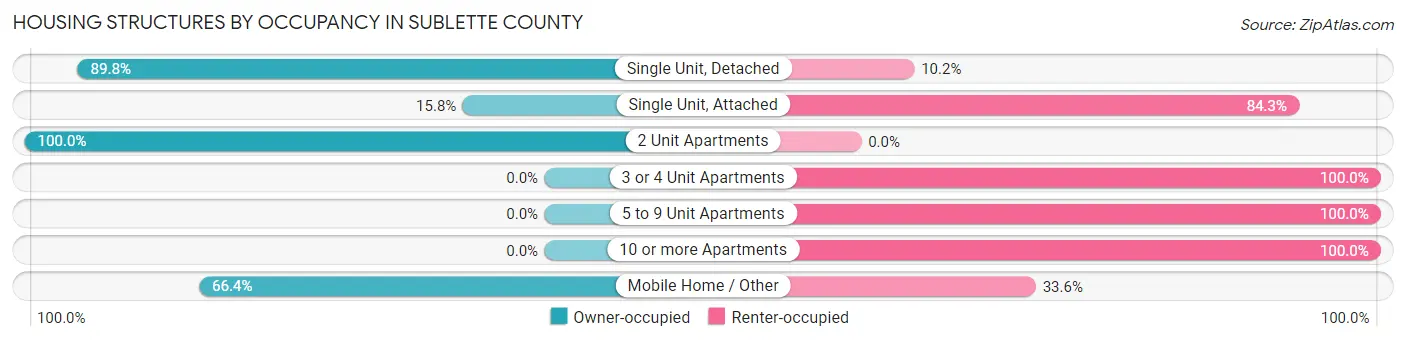
| Structure Type | Owner-occupied | Renter-occupied |
| Single Unit, Detached | 2,643 (89.8%) | 301 (10.2%) |
| Single Unit, Attached | 20 (15.8%) | 107 (84.3%) |
| 2 Unit Apartments | 57 (100.0%) | 0 (0.0%) |
| 3 or 4 Unit Apartments | 0 (0.0%) | 16 (100.0%) |
| 5 to 9 Unit Apartments | 0 (0.0%) | 3 (100.0%) |
| 10 or more Apartments | 0 (0.0%) | 86 (100.0%) |
| Mobile Home / Other | 162 (66.4%) | 82 (33.6%) |
| Total | 2,882 (82.9%) | 595 (17.1%) |
Housing Structures by Number of Rooms in Sublette County
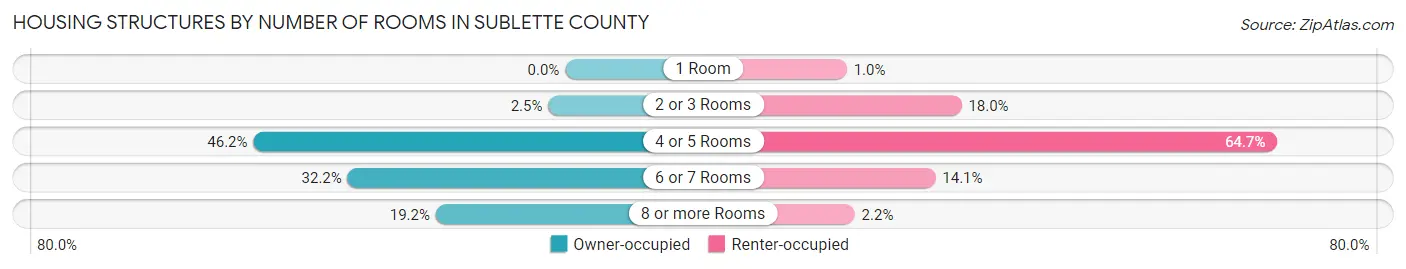
| Number of Rooms | Owner-occupied | Renter-occupied |
| 1 Room | 0 (0.0%) | 6 (1.0%) |
| 2 or 3 Rooms | 72 (2.5%) | 107 (18.0%) |
| 4 or 5 Rooms | 1,330 (46.2%) | 385 (64.7%) |
| 6 or 7 Rooms | 928 (32.2%) | 84 (14.1%) |
| 8 or more Rooms | 552 (19.2%) | 13 (2.2%) |
| Total | 2,882 (100.0%) | 595 (100.0%) |
Housing Structure by Heating Type in Sublette County
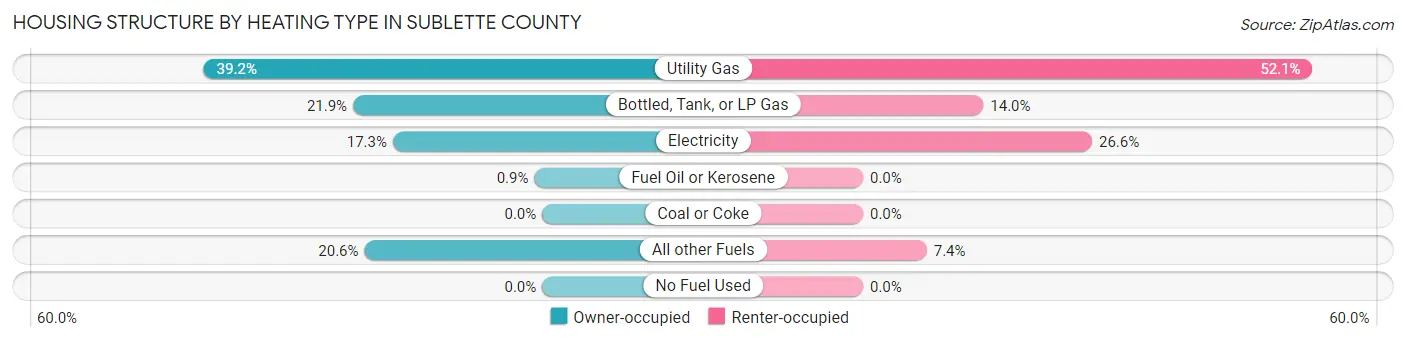
| Heating Type | Owner-occupied | Renter-occupied |
| Utility Gas | 1,131 (39.2%) | 310 (52.1%) |
| Bottled, Tank, or LP Gas | 632 (21.9%) | 83 (14.0%) |
| Electricity | 499 (17.3%) | 158 (26.6%) |
| Fuel Oil or Kerosene | 26 (0.9%) | 0 (0.0%) |
| Coal or Coke | 0 (0.0%) | 0 (0.0%) |
| All other Fuels | 594 (20.6%) | 44 (7.4%) |
| No Fuel Used | 0 (0.0%) | 0 (0.0%) |
| Total | 2,882 (100.0%) | 595 (100.0%) |
Household Vehicle Usage in Sublette County
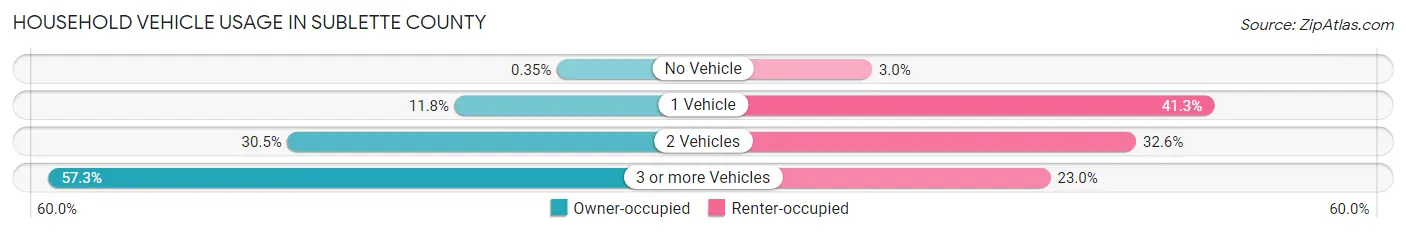
| Vehicles per Household | Owner-occupied | Renter-occupied |
| No Vehicle | 10 (0.4%) | 18 (3.0%) |
| 1 Vehicle | 340 (11.8%) | 246 (41.3%) |
| 2 Vehicles | 880 (30.5%) | 194 (32.6%) |
| 3 or more Vehicles | 1,652 (57.3%) | 137 (23.0%) |
| Total | 2,882 (100.0%) | 595 (100.0%) |
Real Estate & Mortgages in Sublette County
Real Estate and Mortgage Overview in Sublette County
| Characteristic | Without Mortgage | With Mortgage |
| Housing Units | 1,339 | 1,543 |
| Median Property Value | $337,400 | $340,100 |
| Median Household Income | $63,424 | $301 |
| Monthly Housing Costs | $416 | $149 |
| Real Estate Taxes | $1,304 | $5 |
Property Value by Mortgage Status in Sublette County
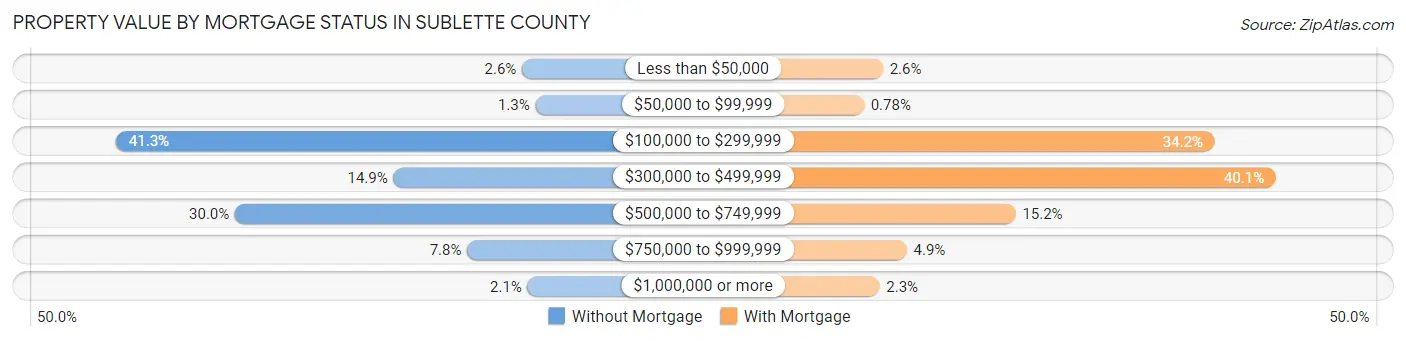
| Property Value | Without Mortgage | With Mortgage |
| Less than $50,000 | 35 (2.6%) | 40 (2.6%) |
| $50,000 to $99,999 | 18 (1.3%) | 12 (0.8%) |
| $100,000 to $299,999 | 553 (41.3%) | 528 (34.2%) |
| $300,000 to $499,999 | 199 (14.9%) | 618 (40.1%) |
| $500,000 to $749,999 | 401 (29.9%) | 235 (15.2%) |
| $750,000 to $999,999 | 105 (7.8%) | 75 (4.9%) |
| $1,000,000 or more | 28 (2.1%) | 35 (2.3%) |
| Total | 1,339 (100.0%) | 1,543 (100.0%) |
Household Income by Mortgage Status in Sublette County
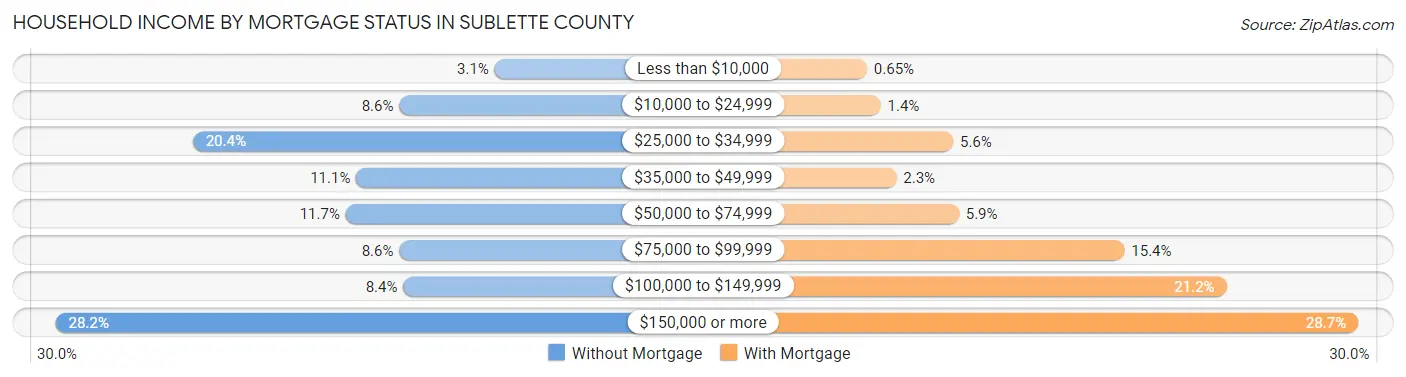
| Household Income | Without Mortgage | With Mortgage |
| Less than $10,000 | 42 (3.1%) | 10 (0.6%) |
| $10,000 to $24,999 | 115 (8.6%) | 22 (1.4%) |
| $25,000 to $34,999 | 273 (20.4%) | 86 (5.6%) |
| $35,000 to $49,999 | 148 (11.1%) | 36 (2.3%) |
| $50,000 to $74,999 | 156 (11.7%) | 91 (5.9%) |
| $75,000 to $99,999 | 115 (8.6%) | 237 (15.4%) |
| $100,000 to $149,999 | 112 (8.4%) | 327 (21.2%) |
| $150,000 or more | 378 (28.2%) | 443 (28.7%) |
| Total | 1,339 (100.0%) | 1,543 (100.0%) |
Property Value to Household Income Ratio in Sublette County
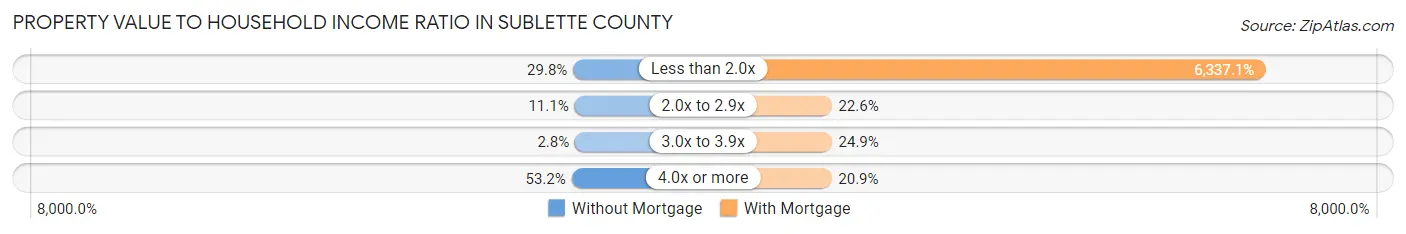
| Value-to-Income Ratio | Without Mortgage | With Mortgage |
| Less than 2.0x | 399 (29.8%) | 97,782 (6,337.1%) |
| 2.0x to 2.9x | 148 (11.1%) | 349 (22.6%) |
| 3.0x to 3.9x | 38 (2.8%) | 384 (24.9%) |
| 4.0x or more | 712 (53.2%) | 323 (20.9%) |
| Total | 1,339 (100.0%) | 1,543 (100.0%) |
Real Estate Taxes by Mortgage Status in Sublette County
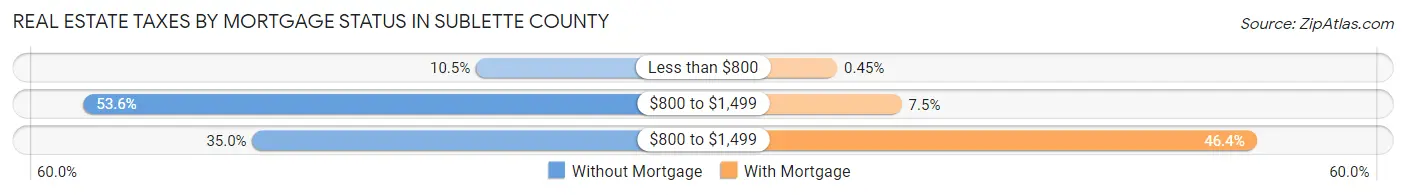
| Property Taxes | Without Mortgage | With Mortgage |
| Less than $800 | 141 (10.5%) | 7 (0.4%) |
| $800 to $1,499 | 717 (53.5%) | 116 (7.5%) |
| $800 to $1,499 | 469 (35.0%) | 716 (46.4%) |
| Total | 1,339 (100.0%) | 1,543 (100.0%) |
Health & Disability in Sublette County
Health Insurance Coverage by Age in Sublette County
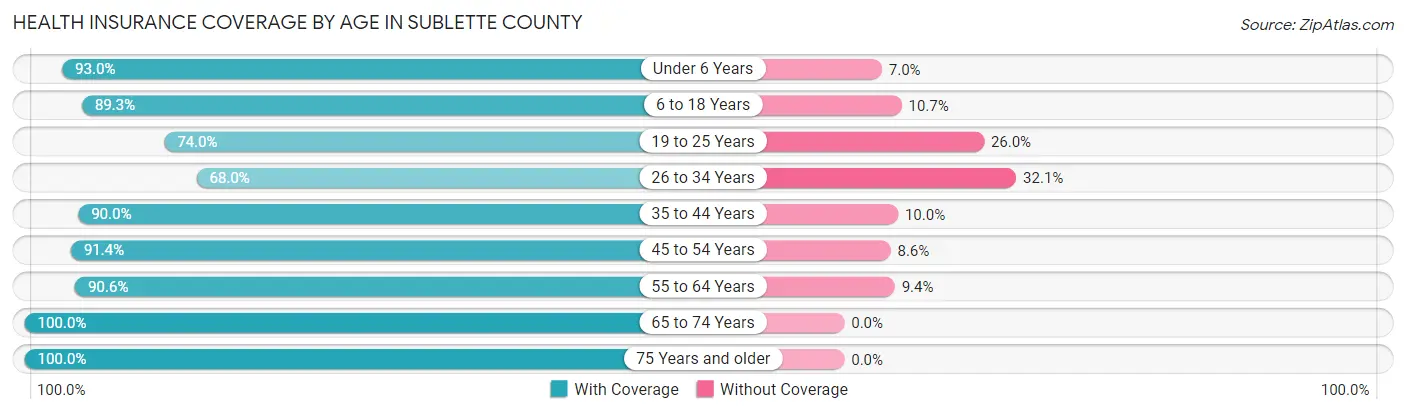
| Age Bracket | With Coverage | Without Coverage |
| Under 6 Years | 610 (93.0%) | 46 (7.0%) |
| 6 to 18 Years | 1,264 (89.3%) | 151 (10.7%) |
| 19 to 25 Years | 443 (74.0%) | 156 (26.0%) |
| 26 to 34 Years | 513 (67.9%) | 242 (32.1%) |
| 35 to 44 Years | 1,016 (90.0%) | 113 (10.0%) |
| 45 to 54 Years | 944 (91.4%) | 89 (8.6%) |
| 55 to 64 Years | 1,118 (90.6%) | 116 (9.4%) |
| 65 to 74 Years | 1,232 (100.0%) | 0 (0.0%) |
| 75 Years and older | 720 (100.0%) | 0 (0.0%) |
| Total | 7,860 (89.6%) | 913 (10.4%) |
Health Insurance Coverage by Citizenship Status in Sublette County
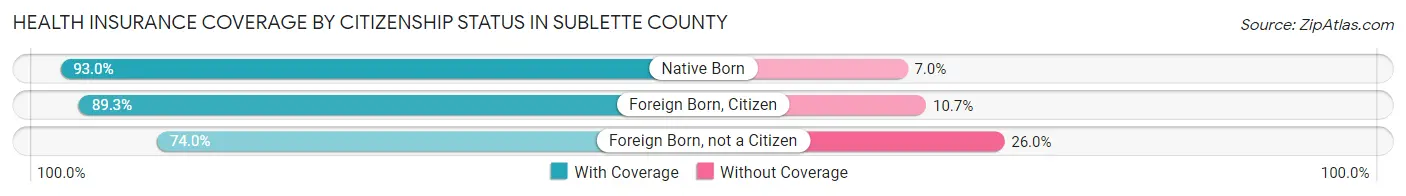
| Citizenship Status | With Coverage | Without Coverage |
| Native Born | 610 (93.0%) | 46 (7.0%) |
| Foreign Born, Citizen | 1,264 (89.3%) | 151 (10.7%) |
| Foreign Born, not a Citizen | 443 (74.0%) | 156 (26.0%) |
Health Insurance Coverage by Household Income in Sublette County
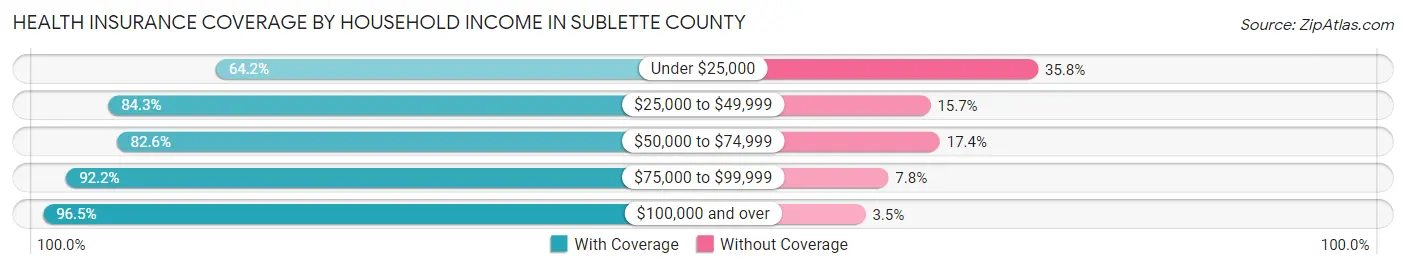
| Household Income | With Coverage | Without Coverage |
| Under $25,000 | 514 (64.2%) | 287 (35.8%) |
| $25,000 to $49,999 | 1,130 (84.3%) | 210 (15.7%) |
| $50,000 to $74,999 | 739 (82.6%) | 156 (17.4%) |
| $75,000 to $99,999 | 1,276 (92.2%) | 108 (7.8%) |
| $100,000 and over | 4,190 (96.5%) | 152 (3.5%) |
Public vs Private Health Insurance Coverage by Age in Sublette County
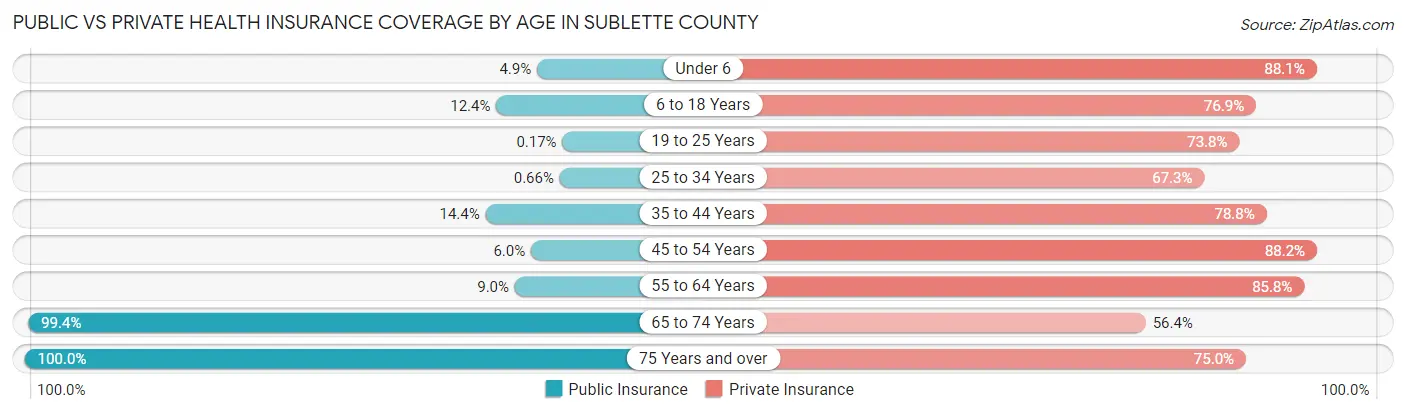
| Age Bracket | Public Insurance | Private Insurance |
| Under 6 | 32 (4.9%) | 578 (88.1%) |
| 6 to 18 Years | 176 (12.4%) | 1,088 (76.9%) |
| 19 to 25 Years | 1 (0.2%) | 442 (73.8%) |
| 25 to 34 Years | 5 (0.7%) | 508 (67.3%) |
| 35 to 44 Years | 163 (14.4%) | 890 (78.8%) |
| 45 to 54 Years | 62 (6.0%) | 911 (88.2%) |
| 55 to 64 Years | 111 (9.0%) | 1,059 (85.8%) |
| 65 to 74 Years | 1,224 (99.4%) | 695 (56.4%) |
| 75 Years and over | 720 (100.0%) | 540 (75.0%) |
| Total | 2,494 (28.4%) | 6,711 (76.5%) |
Disability Status by Sex by Age in Sublette County
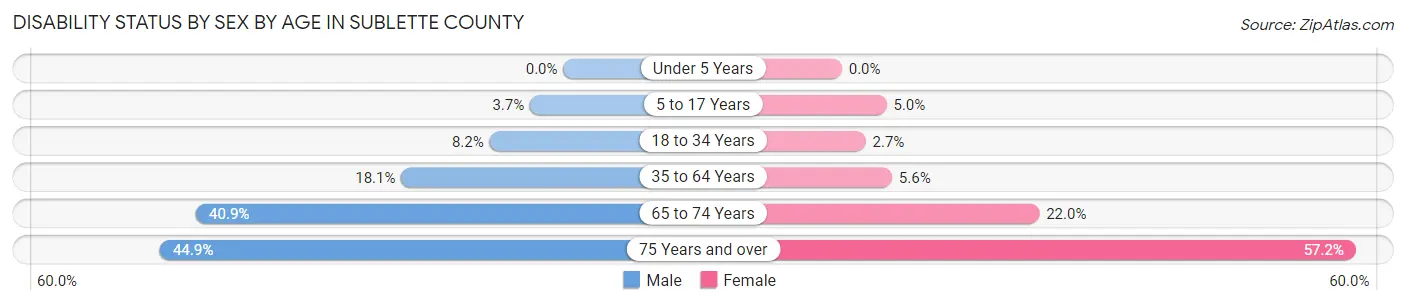
| Age Bracket | Male | Female |
| Under 5 Years | 0 (0.0%) | 0 (0.0%) |
| 5 to 17 Years | 34 (3.7%) | 30 (5.0%) |
| 18 to 34 Years | 67 (8.2%) | 17 (2.6%) |
| 35 to 64 Years | 322 (18.0%) | 90 (5.6%) |
| 65 to 74 Years | 249 (40.9%) | 137 (22.0%) |
| 75 Years and over | 168 (44.9%) | 198 (57.2%) |
Disability Class by Sex by Age in Sublette County
Disability Class: Hearing Difficulty
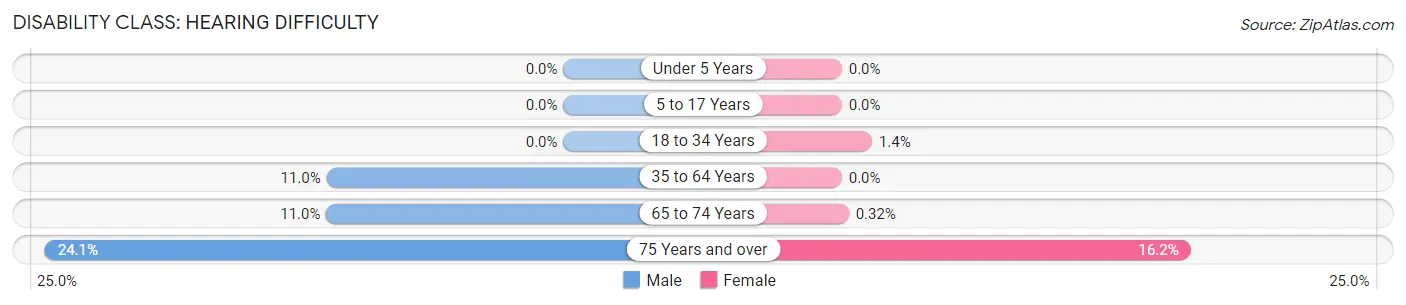
| Age Bracket | Male | Female |
| Under 5 Years | 0 (0.0%) | 0 (0.0%) |
| 5 to 17 Years | 0 (0.0%) | 0 (0.0%) |
| 18 to 34 Years | 0 (0.0%) | 9 (1.4%) |
| 35 to 64 Years | 196 (11.0%) | 0 (0.0%) |
| 65 to 74 Years | 67 (11.0%) | 2 (0.3%) |
| 75 Years and over | 90 (24.1%) | 56 (16.2%) |
Disability Class: Vision Difficulty
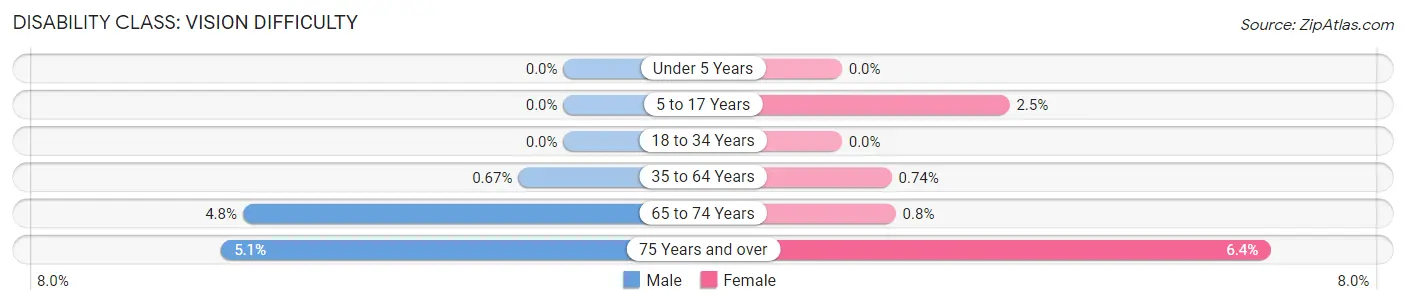
| Age Bracket | Male | Female |
| Under 5 Years | 0 (0.0%) | 0 (0.0%) |
| 5 to 17 Years | 0 (0.0%) | 15 (2.5%) |
| 18 to 34 Years | 0 (0.0%) | 0 (0.0%) |
| 35 to 64 Years | 12 (0.7%) | 12 (0.7%) |
| 65 to 74 Years | 29 (4.8%) | 5 (0.8%) |
| 75 Years and over | 19 (5.1%) | 22 (6.4%) |
Disability Class: Cognitive Difficulty
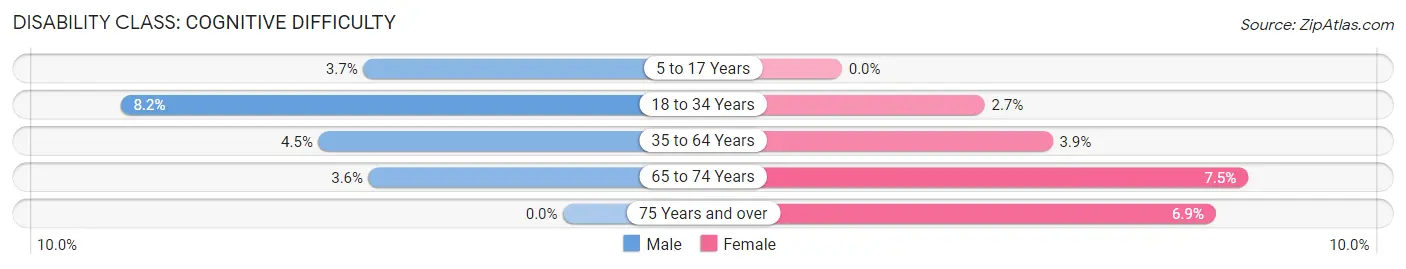
| Age Bracket | Male | Female |
| 5 to 17 Years | 34 (3.7%) | 0 (0.0%) |
| 18 to 34 Years | 67 (8.2%) | 17 (2.6%) |
| 35 to 64 Years | 81 (4.5%) | 63 (3.9%) |
| 65 to 74 Years | 22 (3.6%) | 47 (7.5%) |
| 75 Years and over | 0 (0.0%) | 24 (6.9%) |
Disability Class: Ambulatory Difficulty
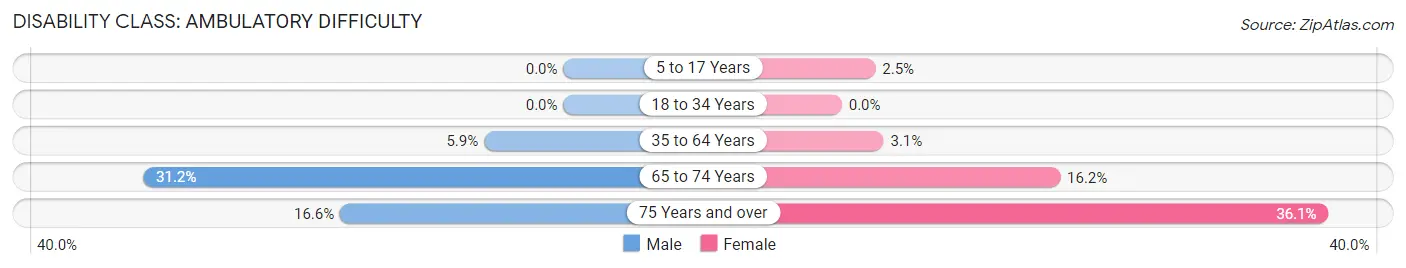
| Age Bracket | Male | Female |
| 5 to 17 Years | 0 (0.0%) | 15 (2.5%) |
| 18 to 34 Years | 0 (0.0%) | 0 (0.0%) |
| 35 to 64 Years | 105 (5.9%) | 50 (3.1%) |
| 65 to 74 Years | 190 (31.2%) | 101 (16.2%) |
| 75 Years and over | 62 (16.6%) | 125 (36.1%) |
Disability Class: Self-Care Difficulty
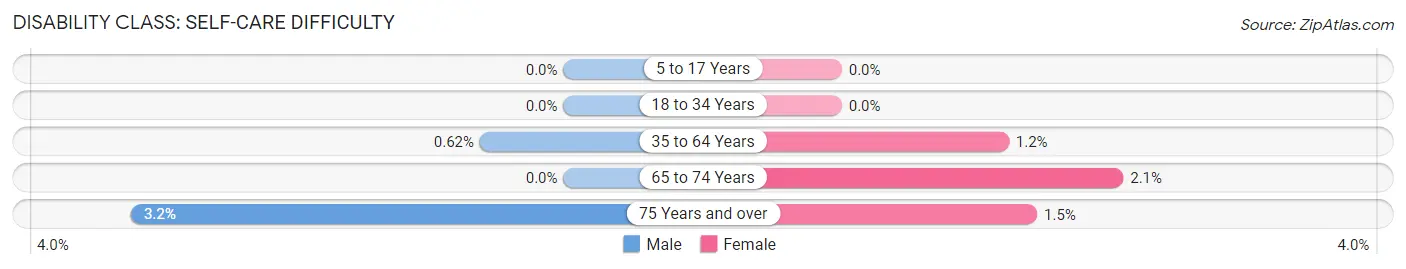
| Age Bracket | Male | Female |
| 5 to 17 Years | 0 (0.0%) | 0 (0.0%) |
| 18 to 34 Years | 0 (0.0%) | 0 (0.0%) |
| 35 to 64 Years | 11 (0.6%) | 20 (1.2%) |
| 65 to 74 Years | 0 (0.0%) | 13 (2.1%) |
| 75 Years and over | 12 (3.2%) | 5 (1.5%) |
Technology Access in Sublette County
Computing Device Access in Sublette County
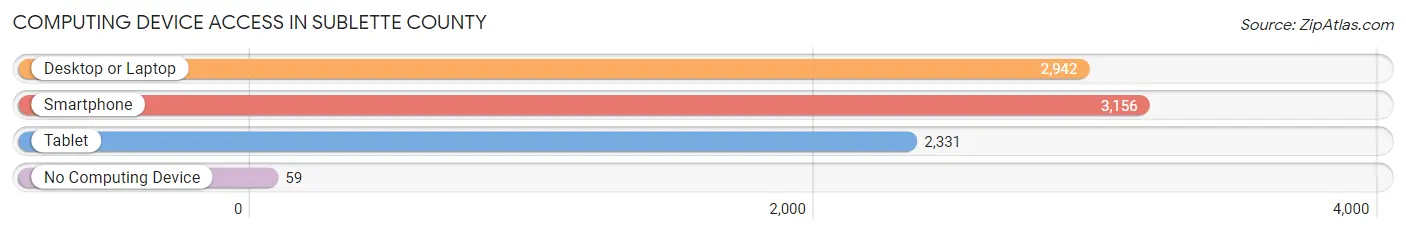
| Device Type | # Households | % Households |
| Desktop or Laptop | 2,942 | 84.6% |
| Smartphone | 3,156 | 90.8% |
| Tablet | 2,331 | 67.0% |
| No Computing Device | 59 | 1.7% |
| Total | 3,477 | 100.0% |
Internet Access in Sublette County
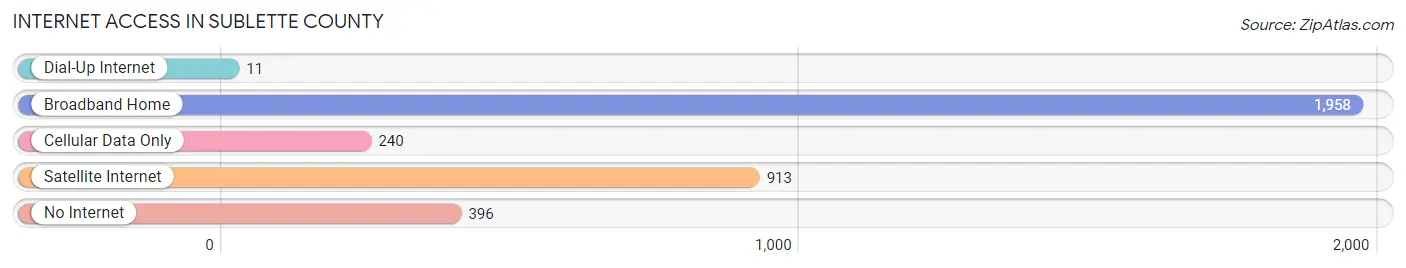
| Internet Type | # Households | % Households |
| Dial-Up Internet | 11 | 0.3% |
| Broadband Home | 1,958 | 56.3% |
| Cellular Data Only | 240 | 6.9% |
| Satellite Internet | 913 | 26.3% |
| No Internet | 396 | 11.4% |
| Total | 3,477 | 100.0% |
Sublette County Summary
Sublette County is located in the western part of Wyoming, and is bordered by Fremont County to the north, Sweetwater County to the east, Lincoln County to the south, and Teton County to the west. The county seat is Pinedale, and the largest city is Big Piney. The county was created in 1921 and named after William L. Sublette, a fur trader and explorer who was part of the famous Rocky Mountain Fur Company.
History
The area that is now Sublette County was first inhabited by Native American tribes, including the Shoshone, Arapaho, and Ute. The first Europeans to explore the area were fur traders, including William Sublette, who was part of the famous Rocky Mountain Fur Company. The area was part of the Oregon Territory until 1868, when it became part of the Wyoming Territory. Sublette County was officially established in 1921, and the county seat was established in Pinedale.
The area was largely rural until the 1950s, when oil and gas exploration began in the area. This led to an influx of people and businesses, and the county’s population grew rapidly. The county’s economy is still largely based on oil and gas, as well as tourism and ranching.
Geography
Sublette County is located in the western part of Wyoming, and is bordered by Fremont County to the north, Sweetwater County to the east, Lincoln County to the south, and Teton County to the west. The county covers an area of 4,902 square miles, making it the second largest county in Wyoming. The county is mostly mountainous, with the Wind River Range to the west and the Wyoming Range to the east. The highest point in the county is Gannett Peak, which is 13,804 feet above sea level.
The county is home to several lakes, including Fremont Lake, which is the largest natural lake in Wyoming. The county also contains several rivers, including the Green River, which is the longest river in Wyoming.
Economy
Sublette County’s economy is largely based on oil and gas, ranching, and tourism. Oil and gas exploration began in the 1950s, and the county is now home to several oil and gas fields. The county is also home to several ranches, which raise cattle and sheep. Tourism is also an important part of the county’s economy, as the county is home to several national parks and monuments, including the Grand Teton National Park and the Fossil Butte National Monument.
Demographics
As of the 2010 census, Sublette County had a population of 10,247. The population is largely white (93.3%), with small percentages of Native American (2.2%), Hispanic (2.1%), and Asian (0.7%) populations. The median household income is $60,945, and the median home value is $220,000. The county’s unemployment rate is 4.2%.
Common Questions
What is the Total Population of Sublette County?
Total Population of Sublette County is 8,801.
What is the Total Male Population of Sublette County?
Total Male Population of Sublette County is 4,769.
What is the Total Female Population of Sublette County?
Total Female Population of Sublette County is 4,032.
What is the Ratio of Males per 100 Females in Sublette County?
There are 118.28 Males per 100 Females in Sublette County.
What is the Ratio of Females per 100 Males in Sublette County?
There are 84.55 Females per 100 Males in Sublette County.
What is the Median Population Age in Sublette County?
Median Population Age in Sublette County is 41.7 Years.
What is the Average Family Size in Sublette County
Average Family Size in Sublette County is 3.1 People.
What is the Average Household Size in Sublette County
Average Household Size in Sublette County is 2.5 People.
What is Per Capita Income in Sublette County?
Per Capita income in Sublette County is $54,704.
What is the Median Family Income in Sublette County?
Median Family Income in Sublette County is $97,425.
What is the Median Household income in Sublette County?
Median Household Income in Sublette County is $85,960.
What is Income or Wage Gap in Sublette County?
Income or Wage Gap in Sublette County is 41.3%.
Women in Sublette County earn 58.7 cents for every dollar earned by a man.
What is Inequality or Gini Index in Sublette County?
Inequality or Gini Index in Sublette County is 0.52.
How Large is the Labor Force in Sublette County?
There are 4,671 People in the Labor Forcein in Sublette County.
What is the Percentage of People in the Labor Force in Sublette County?
66.5% of People are in the Labor Force in Sublette County.
What is the Unemployment Rate in Sublette County?
Unemployment Rate in Sublette County is 3.9%.