Sheridan County, WY
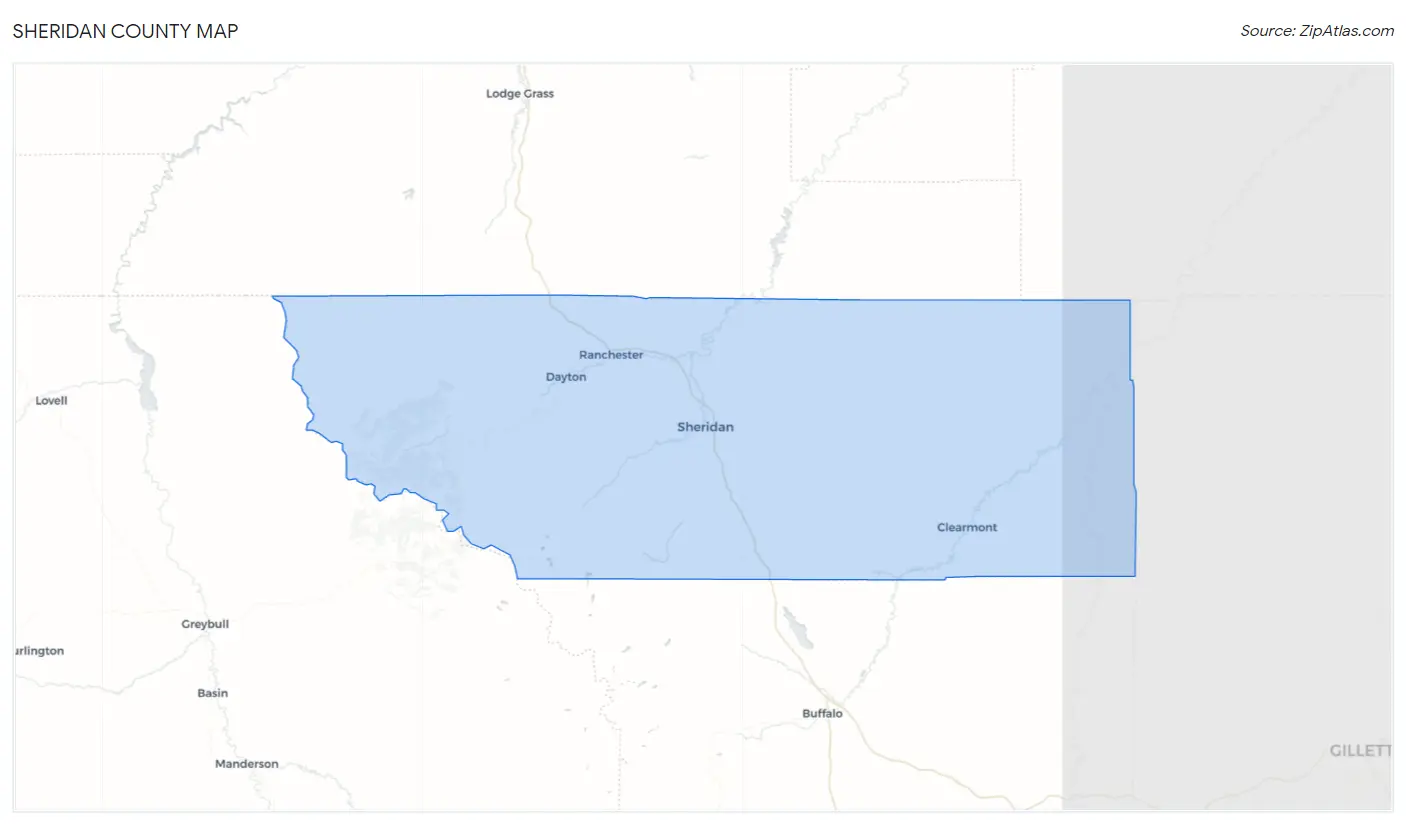
Sheridan County Map
Sheridan County Overview
31,176
TOTAL POPULATION
15,564
MALE POPULATION
15,612
FEMALE POPULATION
99.69
MALES / 100 FEMALES
100.31
FEMALES / 100 MALES
42.8
MEDIAN AGE
3.0
AVG FAMILY SIZE
2.3
AVG HOUSEHOLD SIZE
$39,656
PER CAPITA INCOME
$102,226
AVG FAMILY INCOME
$68,898
AVG HOUSEHOLD INCOME
43.7%
WAGE / INCOME GAP [ % ]
56.3¢/ $1
WAGE / INCOME GAP [ $ ]
$13,247
FAMILY INCOME DEFICIT
0.44
INEQUALITY / GINI INDEX
16,072
LABOR FORCE [ PEOPLE ]
63.8%
PERCENT IN LABOR FORCE
3.0%
UNEMPLOYMENT RATE
Sheridan County Area Codes
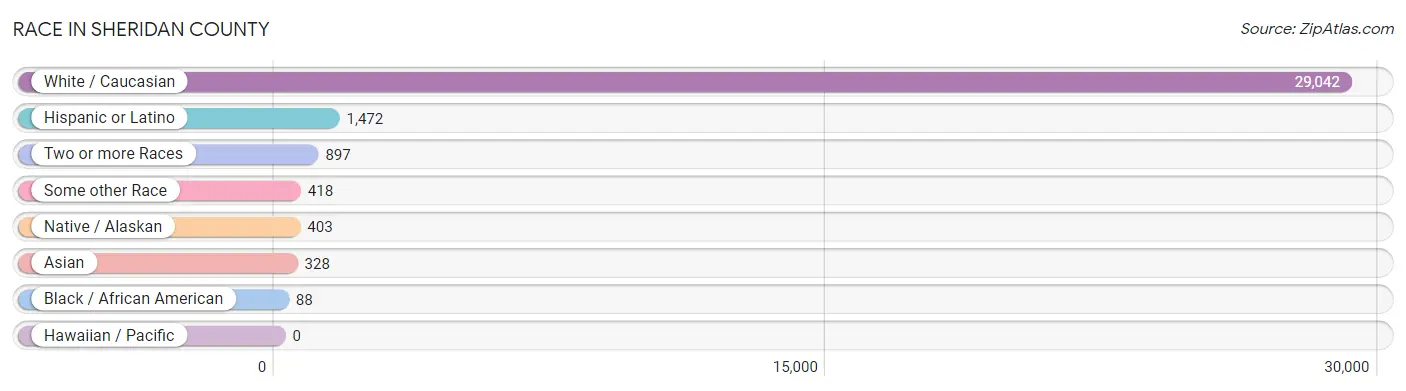
Race in Sheridan County
The most populous races in Sheridan County are White / Caucasian (29,042 | 93.1%), Hispanic or Latino (1,472 | 4.7%), and Two or more Races (897 | 2.9%).
| Race | # Population | % Population |
| Asian | 328 | 1.1% |
| Black / African American | 88 | 0.3% |
| Hawaiian / Pacific | 0 | 0.0% |
| Hispanic or Latino | 1,472 | 4.7% |
| Native / Alaskan | 403 | 1.3% |
| White / Caucasian | 29,042 | 93.1% |
| Two or more Races | 897 | 2.9% |
| Some other Race | 418 | 1.3% |
| Total | 31,176 | 100.0% |
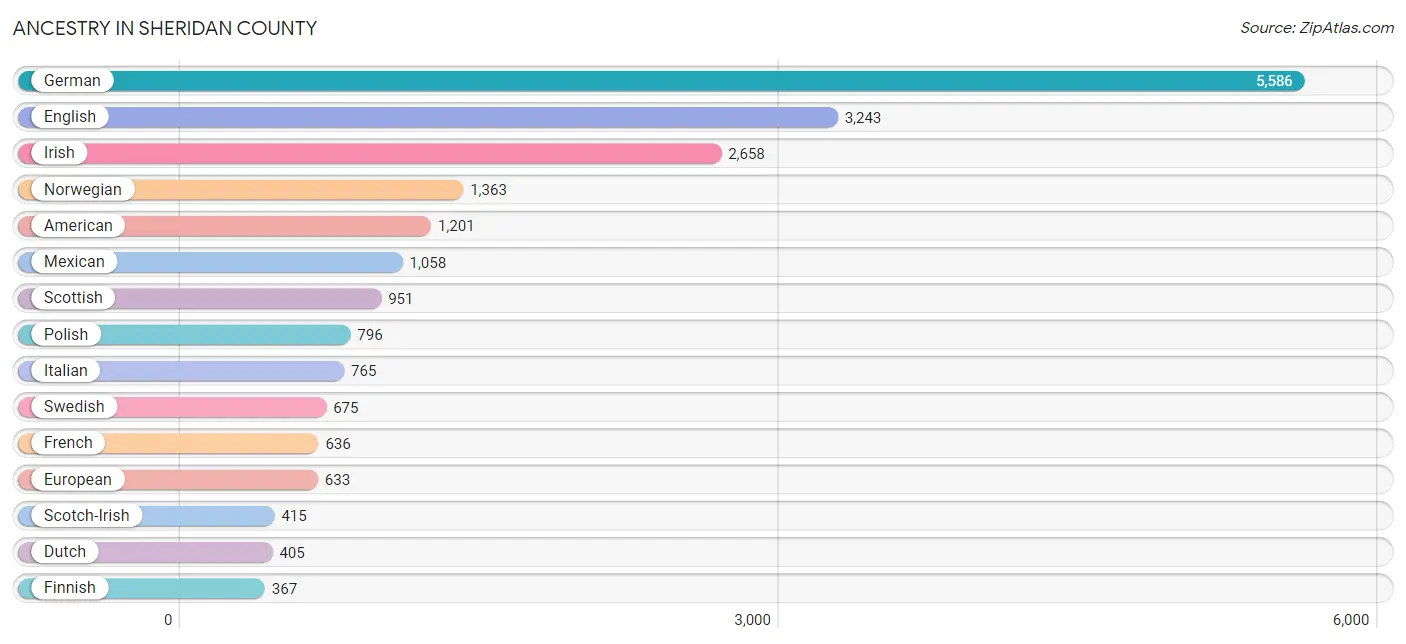
Ancestry in Sheridan County
The most populous ancestries reported in Sheridan County are German (5,586 | 17.9%), English (3,243 | 10.4%), Irish (2,658 | 8.5%), Norwegian (1,363 | 4.4%), and American (1,201 | 3.8%), together accounting for 45.1% of all Sheridan County residents.
| Ancestry | # Population | % Population |
| African | 49 | 0.2% |
| American | 1,201 | 3.8% |
| Apache | 7 | 0.0% |
| Arab | 3 | 0.0% |
| Arapaho | 64 | 0.2% |
| Argentinean | 11 | 0.0% |
| Armenian | 6 | 0.0% |
| Austrian | 92 | 0.3% |
| Basque | 72 | 0.2% |
| Belgian | 61 | 0.2% |
| Bhutanese | 72 | 0.2% |
| Blackfeet | 7 | 0.0% |
| British | 297 | 0.9% |
| Bulgarian | 18 | 0.1% |
| Burmese | 22 | 0.1% |
| Canadian | 69 | 0.2% |
| Central American | 40 | 0.1% |
| Cherokee | 109 | 0.4% |
| Cheyenne | 4 | 0.0% |
| Chippewa | 9 | 0.0% |
| Choctaw | 23 | 0.1% |
| Croatian | 86 | 0.3% |
| Crow | 37 | 0.1% |
| Cuban | 7 | 0.0% |
| Czech | 83 | 0.3% |
| Czechoslovakian | 21 | 0.1% |
| Danish | 236 | 0.8% |
| Dutch | 405 | 1.3% |
| Eastern European | 4 | 0.0% |
| English | 3,243 | 10.4% |
| European | 633 | 2.0% |
| Finnish | 367 | 1.2% |
| French | 636 | 2.0% |
| French Canadian | 73 | 0.2% |
| German | 5,586 | 17.9% |
| Ghanaian | 8 | 0.0% |
| Greek | 63 | 0.2% |
| Haitian | 1 | 0.0% |
| Hungarian | 16 | 0.1% |
| Indian (Asian) | 260 | 0.8% |
| Irish | 2,658 | 8.5% |
| Italian | 765 | 2.5% |
| Korean | 42 | 0.1% |
| Lebanese | 3 | 0.0% |
| Macedonian | 2 | 0.0% |
| Mexican | 1,058 | 3.4% |
| Mexican American Indian | 37 | 0.1% |
| Nigerian | 68 | 0.2% |
| Northern European | 145 | 0.5% |
| Norwegian | 1,363 | 4.4% |
| Pakistani | 14 | 0.0% |
| Panamanian | 24 | 0.1% |
| Pennsylvania German | 53 | 0.2% |
| Polish | 796 | 2.5% |
| Puerto Rican | 106 | 0.3% |
| Romanian | 3 | 0.0% |
| Russian | 199 | 0.6% |
| Salvadoran | 16 | 0.1% |
| Scandinavian | 230 | 0.7% |
| Scotch-Irish | 415 | 1.3% |
| Scottish | 951 | 3.0% |
| Serbian | 8 | 0.0% |
| Shoshone | 109 | 0.4% |
| Sioux | 68 | 0.2% |
| Slavic | 2 | 0.0% |
| Slovak | 2 | 0.0% |
| Slovene | 10 | 0.0% |
| South American | 82 | 0.3% |
| Spaniard | 47 | 0.2% |
| Spanish | 47 | 0.2% |
| Subsaharan African | 125 | 0.4% |
| Swedish | 675 | 2.2% |
| Swiss | 57 | 0.2% |
| Thai | 3 | 0.0% |
| Tlingit-Haida | 43 | 0.1% |
| Ukrainian | 21 | 0.1% |
| Welsh | 259 | 0.8% |
| West Indian | 2 | 0.0% |
| Yugoslavian | 75 | 0.2% | View All 79 Rows |
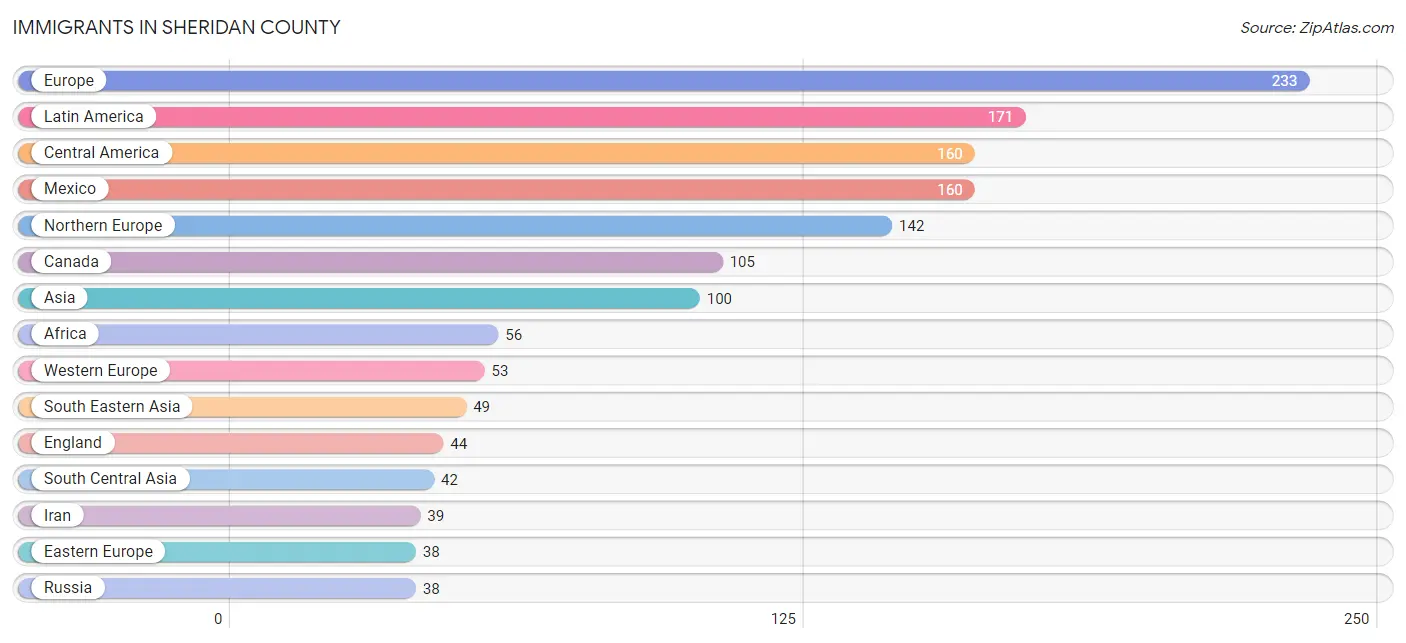
Immigrants in Sheridan County
The most numerous immigrant groups reported in Sheridan County came from Europe (233 | 0.7%), Latin America (171 | 0.5%), Central America (160 | 0.5%), Mexico (160 | 0.5%), and Northern Europe (142 | 0.5%), together accounting for 2.8% of all Sheridan County residents.
| Immigration Origin | # Population | % Population |
| Africa | 56 | 0.2% |
| Argentina | 11 | 0.0% |
| Asia | 100 | 0.3% |
| Canada | 105 | 0.3% |
| Central America | 160 | 0.5% |
| Eastern Africa | 13 | 0.0% |
| Eastern Asia | 9 | 0.0% |
| Eastern Europe | 38 | 0.1% |
| Egypt | 14 | 0.0% |
| England | 44 | 0.1% |
| Europe | 233 | 0.7% |
| France | 21 | 0.1% |
| Germany | 32 | 0.1% |
| India | 3 | 0.0% |
| Iran | 39 | 0.1% |
| Korea | 9 | 0.0% |
| Latin America | 171 | 0.5% |
| Mexico | 160 | 0.5% |
| Nigeria | 17 | 0.1% |
| Northern Africa | 26 | 0.1% |
| Northern Europe | 142 | 0.5% |
| Philippines | 35 | 0.1% |
| Russia | 38 | 0.1% |
| South America | 11 | 0.0% |
| South Central Asia | 42 | 0.1% |
| South Eastern Asia | 49 | 0.2% |
| Thailand | 14 | 0.0% |
| Uganda | 13 | 0.0% |
| Western Africa | 17 | 0.1% |
| Western Europe | 53 | 0.2% | View All 30 Rows |
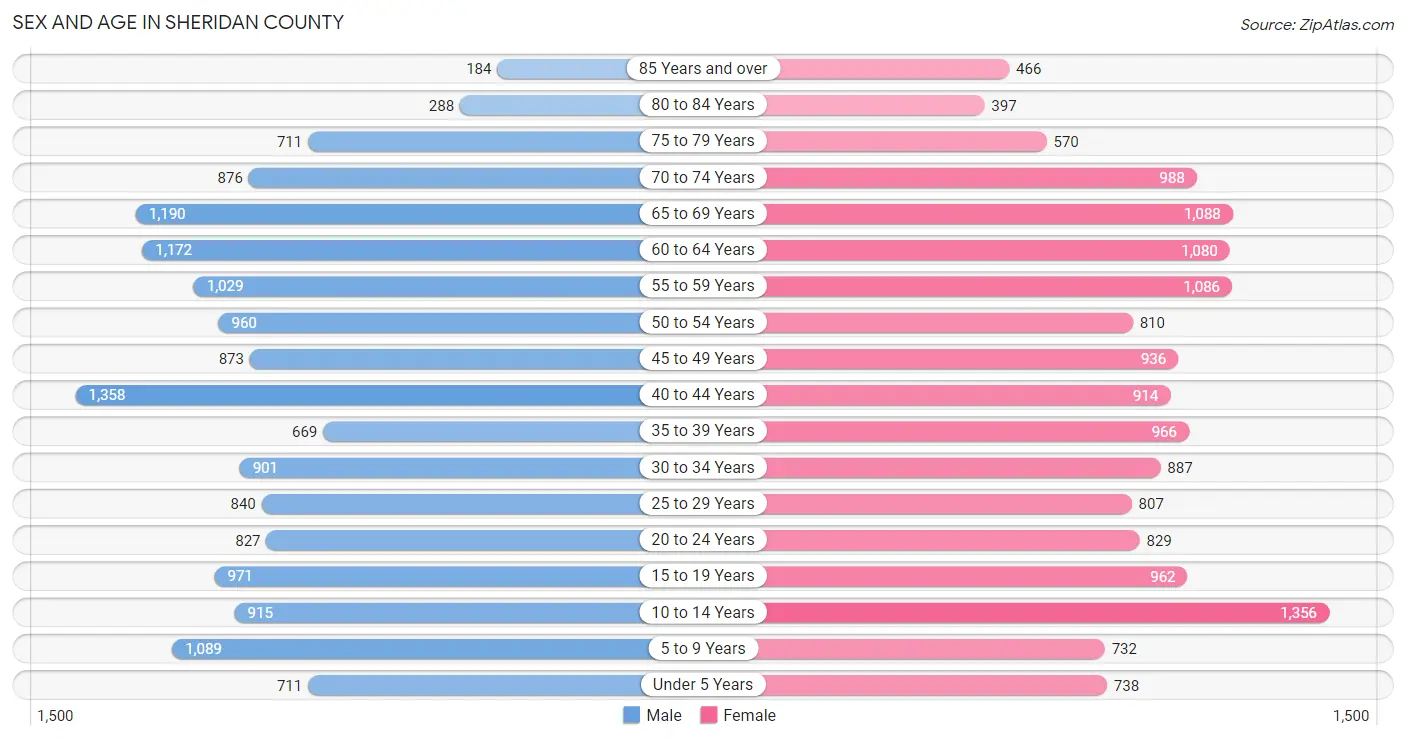
Sex and Age in Sheridan County
Sex and Age in Sheridan County
The most populous age groups in Sheridan County are 40 to 44 Years (1,358 | 8.7%) for men and 10 to 14 Years (1,356 | 8.7%) for women.
| Age Bracket | Male | Female |
| Under 5 Years | 711 (4.6%) | 738 (4.7%) |
| 5 to 9 Years | 1,089 (7.0%) | 732 (4.7%) |
| 10 to 14 Years | 915 (5.9%) | 1,356 (8.7%) |
| 15 to 19 Years | 971 (6.2%) | 962 (6.2%) |
| 20 to 24 Years | 827 (5.3%) | 829 (5.3%) |
| 25 to 29 Years | 840 (5.4%) | 807 (5.2%) |
| 30 to 34 Years | 901 (5.8%) | 887 (5.7%) |
| 35 to 39 Years | 669 (4.3%) | 966 (6.2%) |
| 40 to 44 Years | 1,358 (8.7%) | 914 (5.9%) |
| 45 to 49 Years | 873 (5.6%) | 936 (6.0%) |
| 50 to 54 Years | 960 (6.2%) | 810 (5.2%) |
| 55 to 59 Years | 1,029 (6.6%) | 1,086 (7.0%) |
| 60 to 64 Years | 1,172 (7.5%) | 1,080 (6.9%) |
| 65 to 69 Years | 1,190 (7.6%) | 1,088 (7.0%) |
| 70 to 74 Years | 876 (5.6%) | 988 (6.3%) |
| 75 to 79 Years | 711 (4.6%) | 570 (3.6%) |
| 80 to 84 Years | 288 (1.8%) | 397 (2.5%) |
| 85 Years and over | 184 (1.2%) | 466 (3.0%) |
| Total | 15,564 (100.0%) | 15,612 (100.0%) |
Families and Households in Sheridan County
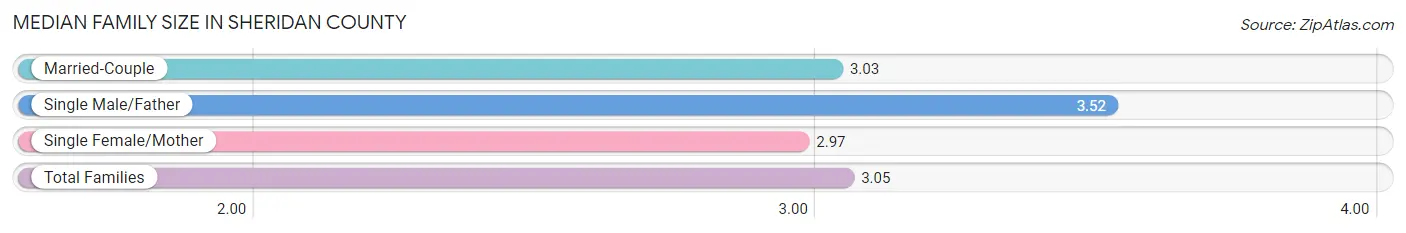
Median Family Size in Sheridan County
The median family size in Sheridan County is 3.05 persons per family, with single male/father families (285 | 3.7%) accounting for the largest median family size of 3.52 persons per family. On the other hand, single female/mother families (790 | 10.3%) represent the smallest median family size with 2.97 persons per family.
| Family Type | # Families | Family Size |
| Married-Couple | 6,572 (85.9%) | 3.03 |
| Single Male/Father | 285 (3.7%) | 3.52 |
| Single Female/Mother | 790 (10.3%) | 2.97 |
| Total Families | 7,647 (100.0%) | 3.05 |
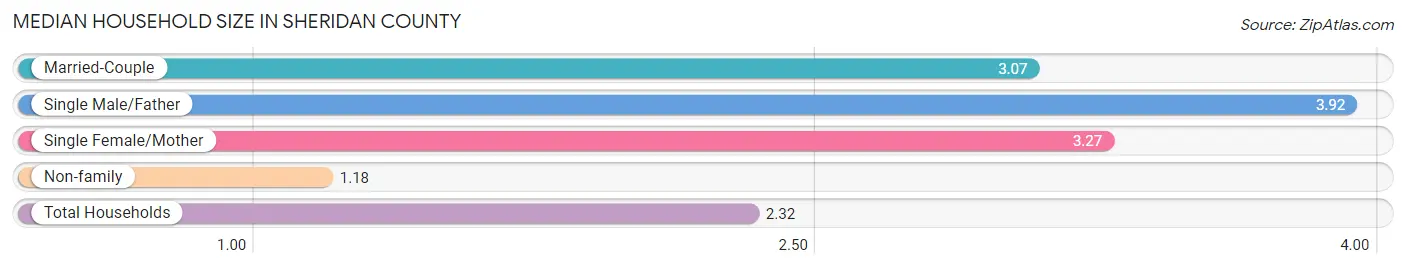
Median Household Size in Sheridan County
The median household size in Sheridan County is 2.32 persons per household, with single male/father households (285 | 2.2%) accounting for the largest median household size of 3.92 persons per household. non-family households (5,419 | 41.5%) represent the smallest median household size with 1.18 persons per household.
| Household Type | # Households | Household Size |
| Married-Couple | 6,572 (50.3%) | 3.07 |
| Single Male/Father | 285 (2.2%) | 3.92 |
| Single Female/Mother | 790 (6.0%) | 3.27 |
| Non-family | 5,419 (41.5%) | 1.18 |
| Total Households | 13,066 (100.0%) | 2.32 |
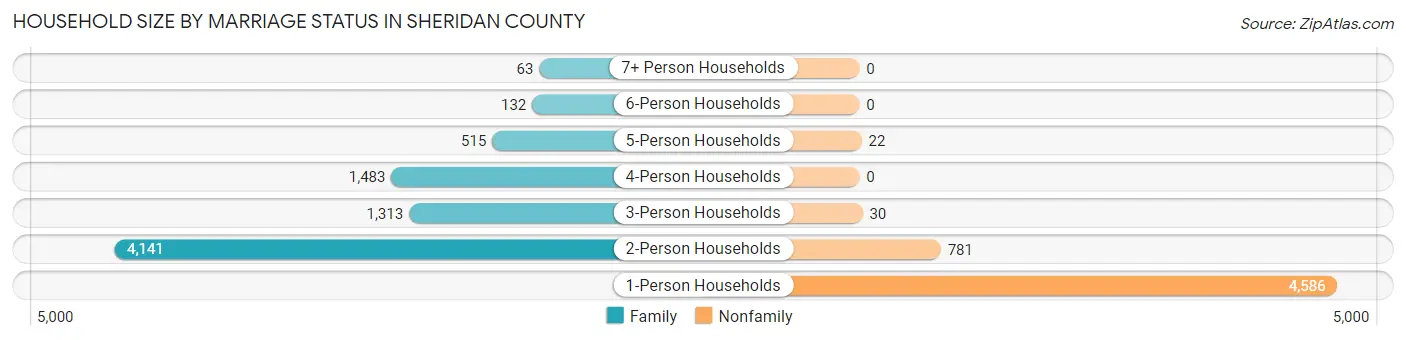
Household Size by Marriage Status in Sheridan County
Out of a total of 13,066 households in Sheridan County, 7,647 (58.5%) are family households, while 5,419 (41.5%) are nonfamily households. The most numerous type of family households are 2-person households, comprising 4,141, and the most common type of nonfamily households are 1-person households, comprising 4,586.
| Household Size | Family Households | Nonfamily Households |
| 1-Person Households | - | 4,586 (35.1%) |
| 2-Person Households | 4,141 (31.7%) | 781 (6.0%) |
| 3-Person Households | 1,313 (10.1%) | 30 (0.2%) |
| 4-Person Households | 1,483 (11.4%) | 0 (0.0%) |
| 5-Person Households | 515 (3.9%) | 22 (0.2%) |
| 6-Person Households | 132 (1.0%) | 0 (0.0%) |
| 7+ Person Households | 63 (0.5%) | 0 (0.0%) |
| Total | 7,647 (58.5%) | 5,419 (41.5%) |
Female Fertility in Sheridan County
Fertility by Age in Sheridan County
Average fertility rate in Sheridan County is 45.0 births per 1,000 women. Women in the age bracket of 20 to 34 years have the highest fertility rate with 86.0 births per 1,000 women. Women in the age bracket of 20 to 34 years acount for 74.2% of all women with births.
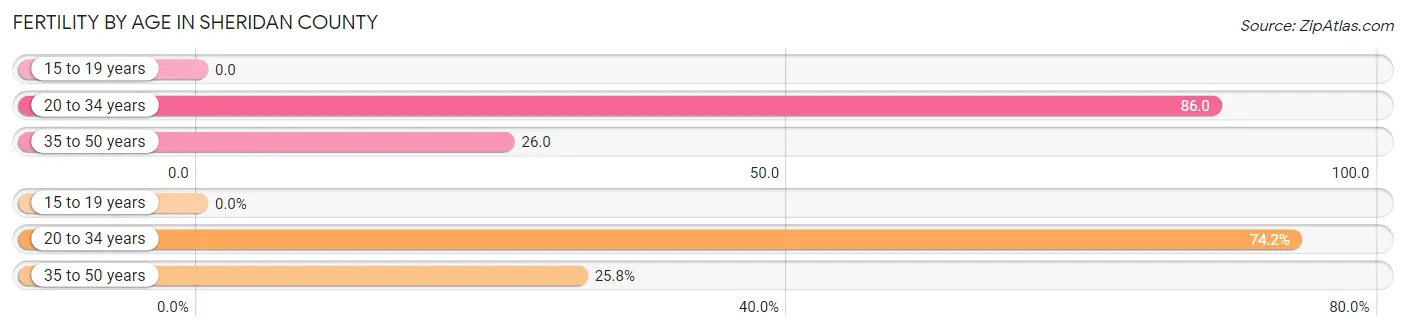
| Age Bracket | Women with Births | Births / 1,000 Women |
| 15 to 19 years | 0 (0.0%) | 0.0 |
| 20 to 34 years | 216 (74.2%) | 86.0 |
| 35 to 50 years | 75 (25.8%) | 26.0 |
| Total | 291 (100.0%) | 45.0 |
Fertility by Age by Marriage Status in Sheridan County
72.2% of women with births (291) in Sheridan County are married. The highest percentage of unmarried women with births falls into 20 to 34 years age bracket with 36.6% of them unmarried at the time of birth, while the lowest percentage of unmarried women with births belong to 35 to 50 years age bracket with 2.7% of them unmarried.
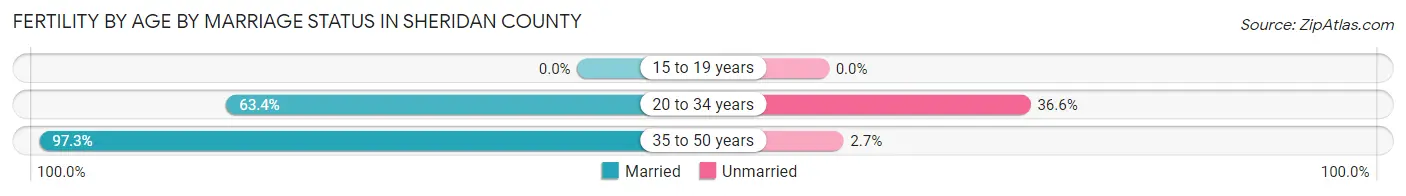
| Age Bracket | Married | Unmarried |
| 15 to 19 years | 0 (0.0%) | 0 (0.0%) |
| 20 to 34 years | 137 (63.4%) | 79 (36.6%) |
| 35 to 50 years | 73 (97.3%) | 2 (2.7%) |
| Total | 210 (72.2%) | 81 (27.8%) |
Fertility by Education in Sheridan County
Average fertility rate in Sheridan County is 45.0 births per 1,000 women. Women with the education attainment of bachelor's degree have the highest fertility rate of 106.0 births per 1,000 women, while women with the education attainment of high school diploma have the lowest fertility at 8.0 births per 1,000 women. Women with the education attainment of bachelor's degree represent 41.2% of all women with births.
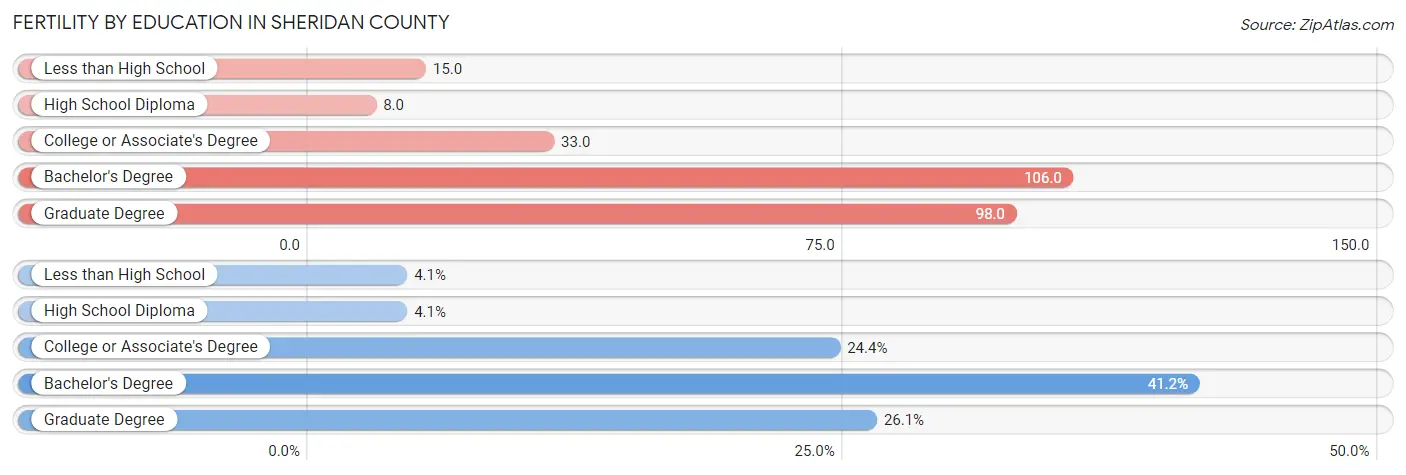
| Educational Attainment | Women with Births | Births / 1,000 Women |
| Less than High School | 12 (4.1%) | 15.0 |
| High School Diploma | 12 (4.1%) | 8.0 |
| College or Associate's Degree | 71 (24.4%) | 33.0 |
| Bachelor's Degree | 120 (41.2%) | 106.0 |
| Graduate Degree | 76 (26.1%) | 98.0 |
| Total | 291 (100.0%) | 45.0 |
Fertility by Education by Marriage Status in Sheridan County
27.8% of women with births in Sheridan County are unmarried. Women with the educational attainment of less than high school are most likely to be married with 100.0% of them married at childbirth, while women with the educational attainment of high school diploma are least likely to be married with 100.0% of them unmarried at childbirth.
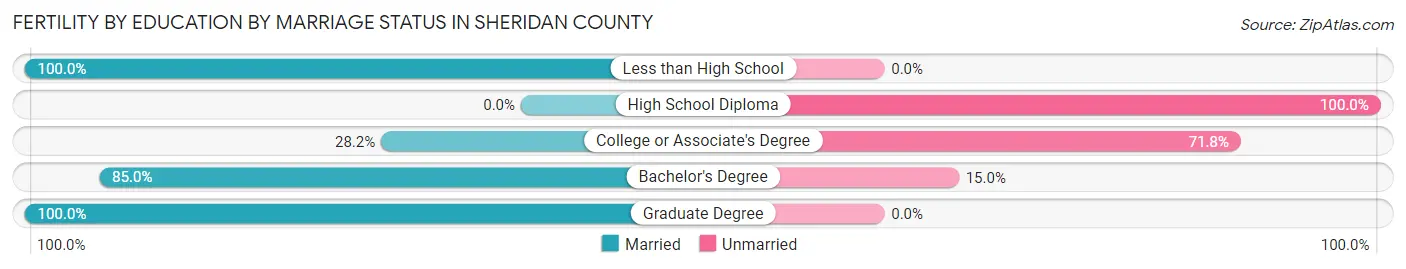
| Educational Attainment | Married | Unmarried |
| Less than High School | 12 (100.0%) | 0 (0.0%) |
| High School Diploma | 0 (0.0%) | 12 (100.0%) |
| College or Associate's Degree | 20 (28.2%) | 51 (71.8%) |
| Bachelor's Degree | 102 (85.0%) | 18 (15.0%) |
| Graduate Degree | 76 (100.0%) | 0 (0.0%) |
| Total | 210 (72.2%) | 81 (27.8%) |
Income in Sheridan County
Income Overview in Sheridan County
Per Capita Income in Sheridan County is $39,656, while median incomes of families and households are $102,226 and $68,898 respectively.
| Characteristic | Number | Measure |
| Per Capita Income | 31,176 | $39,656 |
| Median Family Income | 7,647 | $102,226 |
| Mean Family Income | 7,647 | $112,078 |
| Median Household Income | 13,066 | $68,898 |
| Mean Household Income | 13,066 | $89,453 |
| Income Deficit | 7,647 | $13,247 |
| Wage / Income Gap (%) | 31,176 | 43.71% |
| Wage / Income Gap ($) | 31,176 | 56.29¢ per $1 |
| Gini / Inequality Index | 31,176 | 0.44 |
Earnings by Sex in Sheridan County
Average Earnings in Sheridan County are $41,215, $57,546 for men and $32,390 for women, a difference of 43.7%.
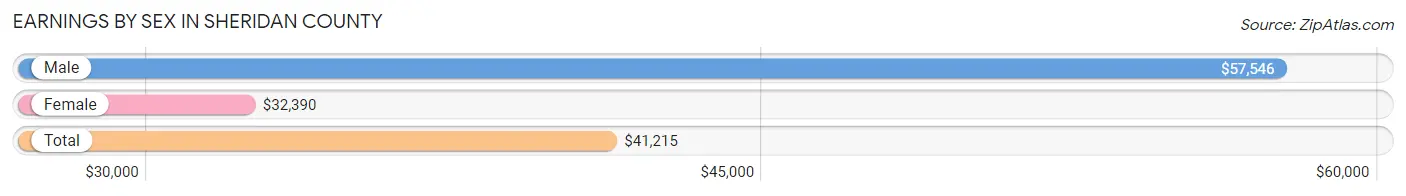
| Sex | Number | Average Earnings |
| Male | 9,126 (53.6%) | $57,546 |
| Female | 7,899 (46.4%) | $32,390 |
| Total | 17,025 (100.0%) | $41,215 |
Earnings by Sex by Income Bracket in Sheridan County
The most common earnings brackets in Sheridan County are $100,000+ for men (1,826 | 20.0%) and $25,000 to $29,999 for women (714 | 9.0%).
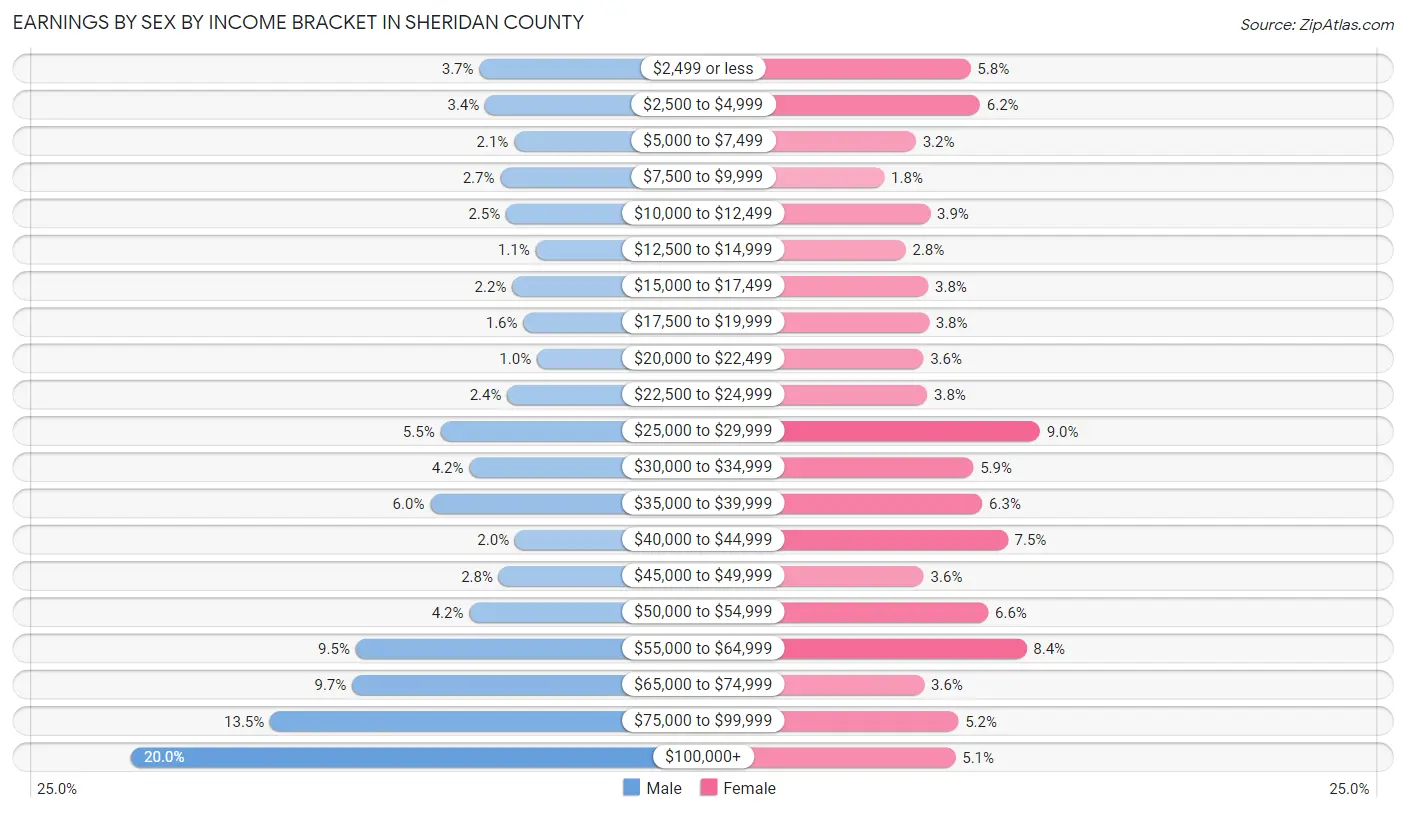
| Income | Male | Female |
| $2,499 or less | 338 (3.7%) | 457 (5.8%) |
| $2,500 to $4,999 | 313 (3.4%) | 492 (6.2%) |
| $5,000 to $7,499 | 189 (2.1%) | 255 (3.2%) |
| $7,500 to $9,999 | 248 (2.7%) | 138 (1.8%) |
| $10,000 to $12,499 | 224 (2.5%) | 308 (3.9%) |
| $12,500 to $14,999 | 98 (1.1%) | 217 (2.8%) |
| $15,000 to $17,499 | 197 (2.2%) | 301 (3.8%) |
| $17,500 to $19,999 | 150 (1.6%) | 303 (3.8%) |
| $20,000 to $22,499 | 91 (1.0%) | 283 (3.6%) |
| $22,500 to $24,999 | 218 (2.4%) | 297 (3.8%) |
| $25,000 to $29,999 | 504 (5.5%) | 714 (9.0%) |
| $30,000 to $34,999 | 381 (4.2%) | 468 (5.9%) |
| $35,000 to $39,999 | 548 (6.0%) | 501 (6.3%) |
| $40,000 to $44,999 | 185 (2.0%) | 595 (7.5%) |
| $45,000 to $49,999 | 255 (2.8%) | 284 (3.6%) |
| $50,000 to $54,999 | 381 (4.2%) | 523 (6.6%) |
| $55,000 to $64,999 | 866 (9.5%) | 664 (8.4%) |
| $65,000 to $74,999 | 882 (9.7%) | 286 (3.6%) |
| $75,000 to $99,999 | 1,232 (13.5%) | 412 (5.2%) |
| $100,000+ | 1,826 (20.0%) | 401 (5.1%) |
| Total | 9,126 (100.0%) | 7,899 (100.0%) |
Earnings by Sex by Educational Attainment in Sheridan County
Average earnings in Sheridan County are $64,951 for men and $37,786 for women, a difference of 41.8%. Men with an educational attainment of less than high school enjoy the highest average annual earnings of $103,324, while those with high school diploma education earn the least with $55,266. Women with an educational attainment of graduate degree earn the most with the average annual earnings of $63,475, while those with less than high school education have the smallest earnings of $24,028.
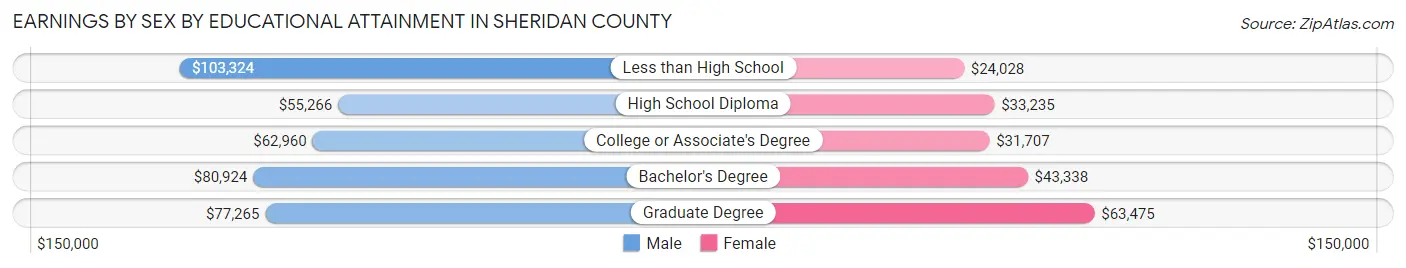
| Educational Attainment | Male Income | Female Income |
| Less than High School | $103,324 | $24,028 |
| High School Diploma | $55,266 | $33,235 |
| College or Associate's Degree | $62,960 | $31,707 |
| Bachelor's Degree | $80,924 | $43,338 |
| Graduate Degree | $77,265 | $63,475 |
| Total | $64,951 | $37,786 |
Family Income in Sheridan County
Family Income Brackets in Sheridan County
According to the Sheridan County family income data, there are 2,294 families falling into the $100,000 to $149,999 income range, which is the most common income bracket and makes up 30.0% of all families. Conversely, the less than $10,000 income bracket is the least frequent group with only 122 families (1.6%) belonging to this category.
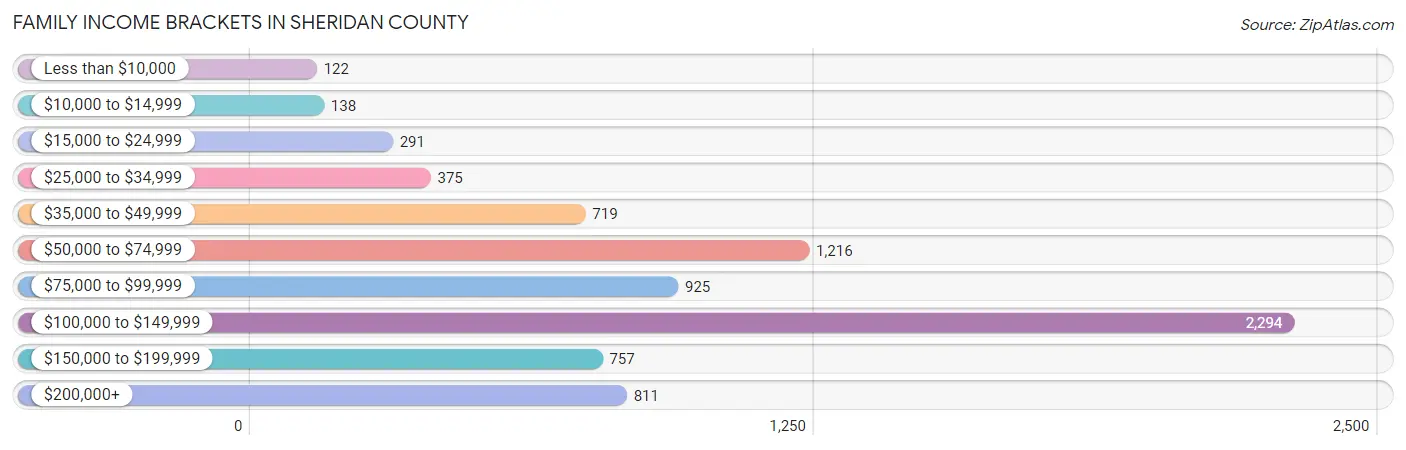
| Income Bracket | # Families | % Families |
| Less than $10,000 | 122 | 1.6% |
| $10,000 to $14,999 | 138 | 1.8% |
| $15,000 to $24,999 | 291 | 3.8% |
| $25,000 to $34,999 | 375 | 4.9% |
| $35,000 to $49,999 | 719 | 9.4% |
| $50,000 to $74,999 | 1,216 | 15.9% |
| $75,000 to $99,999 | 925 | 12.1% |
| $100,000 to $149,999 | 2,294 | 30.0% |
| $150,000 to $199,999 | 757 | 9.9% |
| $200,000+ | 811 | 10.6% |
Family Income by Famaliy Size in Sheridan County
6-person families (111 | 1.5%) account for the highest median family income in Sheridan County with $141,581 per family, while 2-person families (4,293 | 56.1%) have the highest median income of $40,161 per family member.
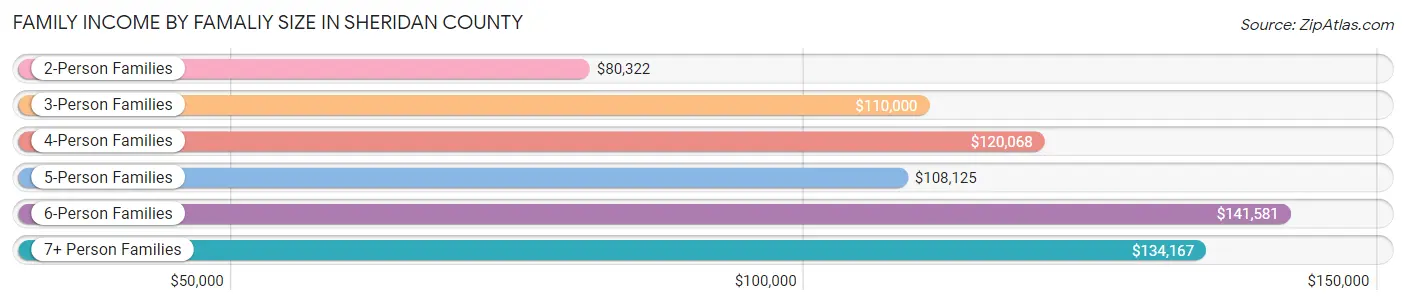
| Income Bracket | # Families | Median Income |
| 2-Person Families | 4,293 (56.1%) | $80,322 |
| 3-Person Families | 1,334 (17.4%) | $110,000 |
| 4-Person Families | 1,351 (17.7%) | $120,068 |
| 5-Person Families | 510 (6.7%) | $108,125 |
| 6-Person Families | 111 (1.5%) | $141,581 |
| 7+ Person Families | 48 (0.6%) | $134,167 |
| Total | 7,647 (100.0%) | $102,226 |
Family Income by Number of Earners in Sheridan County
The median family income in Sheridan County is $102,226, with families comprising 3+ earners (599) having the highest median family income of $165,469, while families with no earners (1,233) have the lowest median family income of $56,458, accounting for 7.8% and 16.1% of families, respectively.
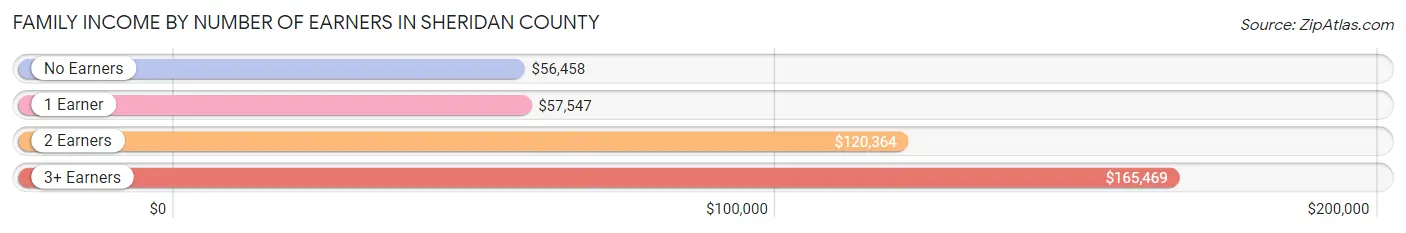
| Number of Earners | # Families | Median Income |
| No Earners | 1,233 (16.1%) | $56,458 |
| 1 Earner | 2,035 (26.6%) | $57,547 |
| 2 Earners | 3,780 (49.4%) | $120,364 |
| 3+ Earners | 599 (7.8%) | $165,469 |
| Total | 7,647 (100.0%) | $102,226 |
Household Income in Sheridan County
Household Income Brackets in Sheridan County
With 2,914 households falling in the category, the $100,000 to $149,999 income range is the most frequent in Sheridan County, accounting for 22.3% of all households. In contrast, only 549 households (4.2%) fall into the $10,000 to $14,999 income bracket, making it the least populous group.
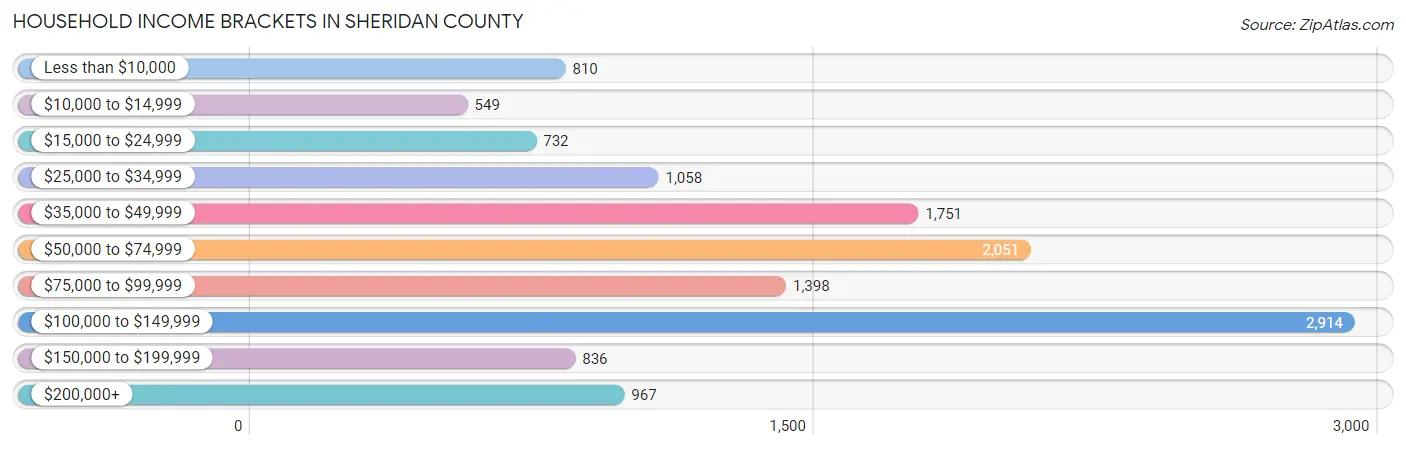
| Income Bracket | # Households | % Households |
| Less than $10,000 | 810 | 6.2% |
| $10,000 to $14,999 | 549 | 4.2% |
| $15,000 to $24,999 | 732 | 5.6% |
| $25,000 to $34,999 | 1,058 | 8.1% |
| $35,000 to $49,999 | 1,751 | 13.4% |
| $50,000 to $74,999 | 2,051 | 15.7% |
| $75,000 to $99,999 | 1,398 | 10.7% |
| $100,000 to $149,999 | 2,914 | 22.3% |
| $150,000 to $199,999 | 836 | 6.4% |
| $200,000+ | 967 | 7.4% |
Household Income by Householder Age in Sheridan County
The median household income in Sheridan County is $68,898, with the highest median household income of $88,741 found in the 25 to 44 years age bracket for the primary householder. A total of 3,776 households (28.9%) fall into this category. Meanwhile, the 15 to 24 years age bracket for the primary householder has the lowest median household income of $36,519, with 523 households (4.0%) in this group.
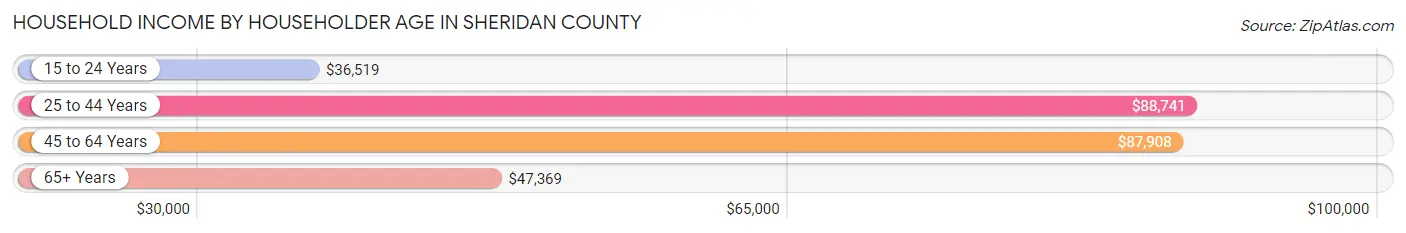
| Income Bracket | # Households | Median Income |
| 15 to 24 Years | 523 (4.0%) | $36,519 |
| 25 to 44 Years | 3,776 (28.9%) | $88,741 |
| 45 to 64 Years | 4,700 (36.0%) | $87,908 |
| 65+ Years | 4,067 (31.1%) | $47,369 |
| Total | 13,066 (100.0%) | $68,898 |
Poverty in Sheridan County
Income Below Poverty by Sex and Age in Sheridan County
With 7.1% poverty level for males and 10.3% for females among the residents of Sheridan County, 75 year old and over males and 18 to 24 year old females are the most vulnerable to poverty, with 177 males (16.0%) and 207 females (22.2%) in their respective age groups living below the poverty level.
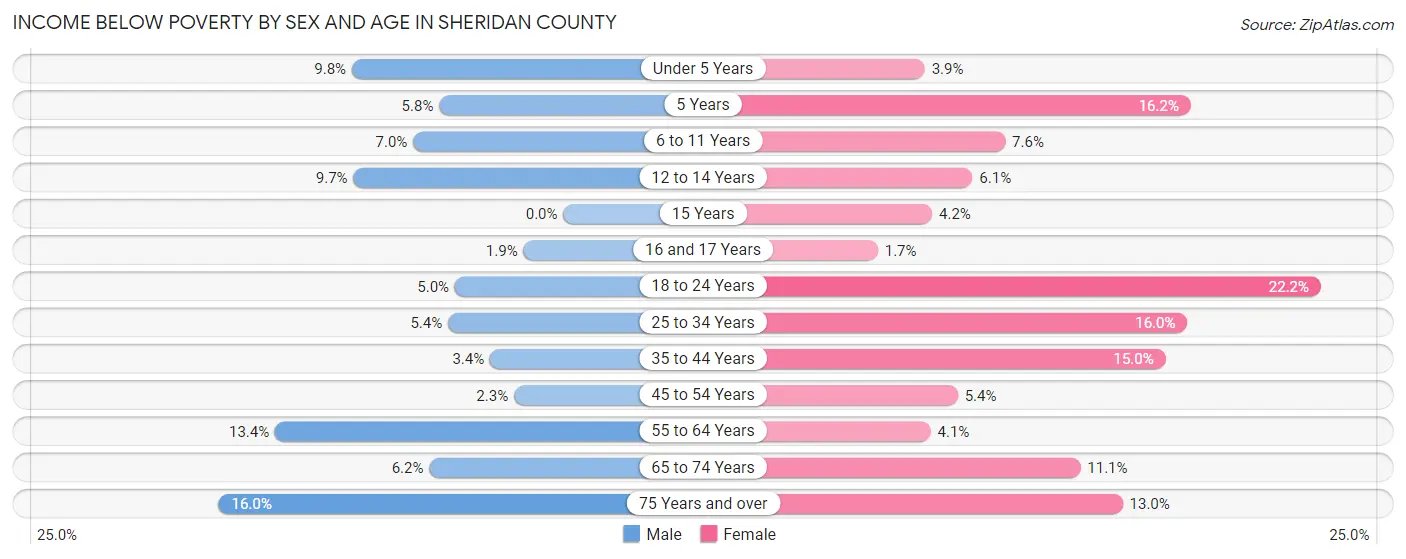
| Age Bracket | Male | Female |
| Under 5 Years | 68 (9.8%) | 27 (3.8%) |
| 5 Years | 8 (5.8%) | 34 (16.2%) |
| 6 to 11 Years | 92 (7.0%) | 106 (7.6%) |
| 12 to 14 Years | 53 (9.7%) | 28 (6.1%) |
| 15 Years | 0 (0.0%) | 9 (4.2%) |
| 16 and 17 Years | 7 (1.8%) | 6 (1.7%) |
| 18 to 24 Years | 50 (5.0%) | 207 (22.2%) |
| 25 to 34 Years | 92 (5.3%) | 271 (16.0%) |
| 35 to 44 Years | 69 (3.4%) | 282 (15.0%) |
| 45 to 54 Years | 42 (2.3%) | 94 (5.4%) |
| 55 to 64 Years | 294 (13.4%) | 89 (4.1%) |
| 65 to 74 Years | 126 (6.2%) | 228 (11.1%) |
| 75 Years and over | 177 (16.0%) | 174 (13.0%) |
| Total | 1,078 (7.1%) | 1,555 (10.3%) |
Income Above Poverty by Sex and Age in Sheridan County
According to the poverty statistics in Sheridan County, males aged 15 years and females aged 16 and 17 years are the age groups that are most secure financially, with 100.0% of males and 98.3% of females in these age groups living above the poverty line.
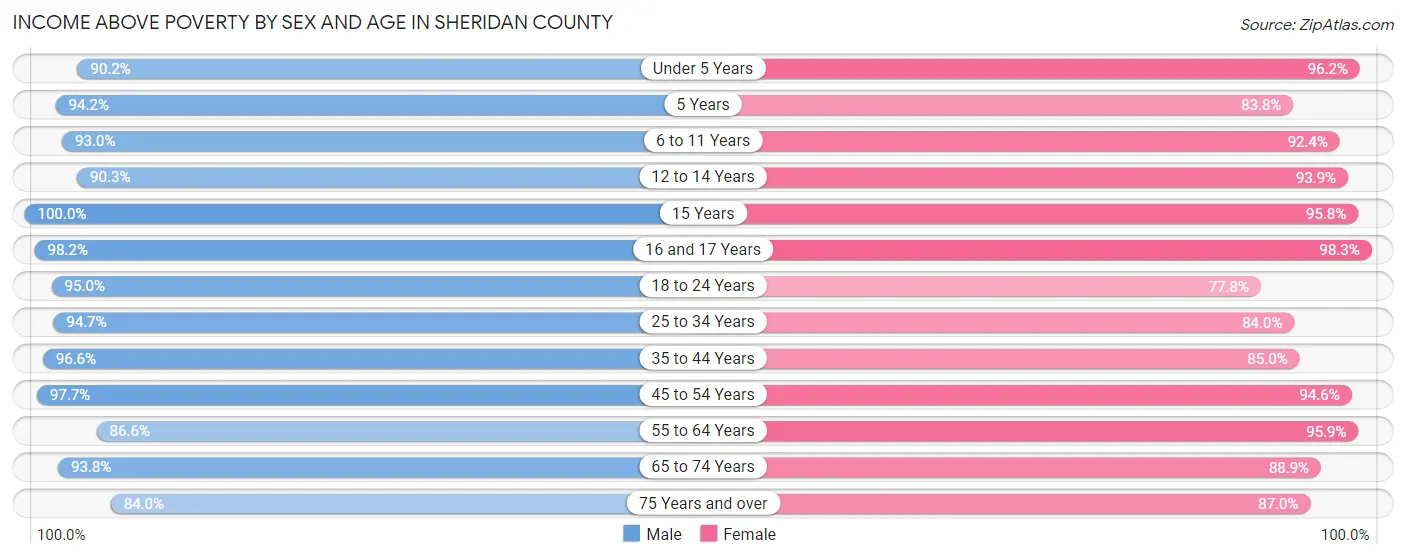
| Age Bracket | Male | Female |
| Under 5 Years | 625 (90.2%) | 674 (96.2%) |
| 5 Years | 131 (94.2%) | 176 (83.8%) |
| 6 to 11 Years | 1,228 (93.0%) | 1,293 (92.4%) |
| 12 to 14 Years | 491 (90.3%) | 434 (93.9%) |
| 15 Years | 206 (100.0%) | 206 (95.8%) |
| 16 and 17 Years | 372 (98.2%) | 354 (98.3%) |
| 18 to 24 Years | 944 (95.0%) | 724 (77.8%) |
| 25 to 34 Years | 1,628 (94.7%) | 1,420 (84.0%) |
| 35 to 44 Years | 1,958 (96.6%) | 1,596 (85.0%) |
| 45 to 54 Years | 1,789 (97.7%) | 1,652 (94.6%) |
| 55 to 64 Years | 1,903 (86.6%) | 2,073 (95.9%) |
| 65 to 74 Years | 1,901 (93.8%) | 1,832 (88.9%) |
| 75 Years and over | 929 (84.0%) | 1,161 (87.0%) |
| Total | 14,105 (92.9%) | 13,595 (89.7%) |
Income Below Poverty Among Married-Couple Families in Sheridan County
The poverty statistics for married-couple families in Sheridan County show that 1.8% or 121 of the total 6,572 families live below the poverty line. Families with 3 or 4 children have the highest poverty rate of 4.3%, comprising of 19 families. On the other hand, families with 5 or more children have the lowest poverty rate of 0.0%, which includes 0 families.
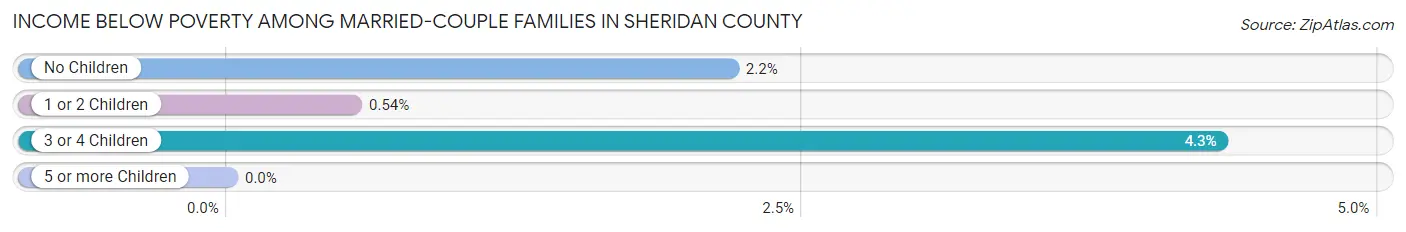
| Children | Above Poverty | Below Poverty |
| No Children | 4,136 (97.8%) | 92 (2.2%) |
| 1 or 2 Children | 1,859 (99.5%) | 10 (0.5%) |
| 3 or 4 Children | 422 (95.7%) | 19 (4.3%) |
| 5 or more Children | 34 (100.0%) | 0 (0.0%) |
| Total | 6,451 (98.2%) | 121 (1.8%) |
Income Below Poverty Among Single-Parent Households in Sheridan County
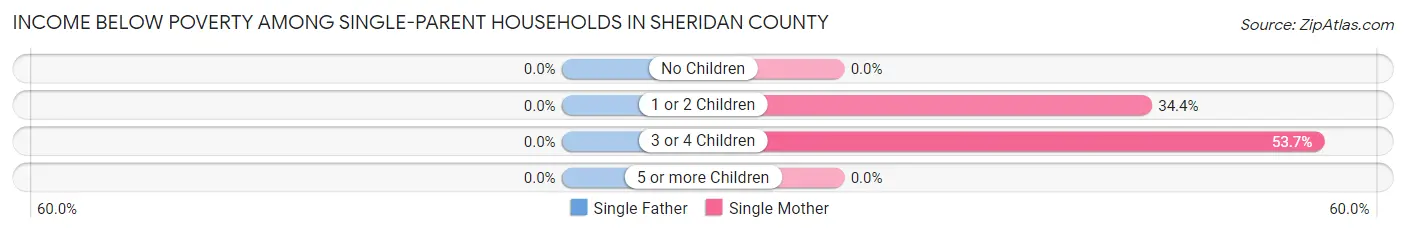
| Children | Single Father | Single Mother |
| No Children | 0 (0.0%) | 0 (0.0%) |
| 1 or 2 Children | 0 (0.0%) | 132 (34.4%) |
| 3 or 4 Children | 0 (0.0%) | 51 (53.7%) |
| 5 or more Children | 0 (0.0%) | 0 (0.0%) |
| Total | 0 (0.0%) | 183 (23.2%) |
Income Below Poverty Among Married-Couple vs Single-Parent Households in Sheridan County
The poverty data for Sheridan County shows that 121 of the married-couple family households (1.8%) and 183 of the single-parent households (17.0%) are living below the poverty level. Within the married-couple family households, those with 3 or 4 children have the highest poverty rate, with 19 households (4.3%) falling below the poverty line. Among the single-parent households, those with 3 or 4 children have the highest poverty rate, with 51 household (45.1%) living below poverty.
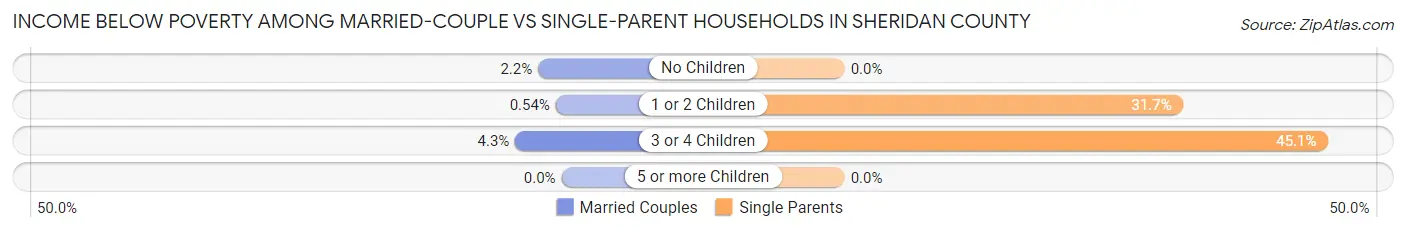
| Children | Married-Couple Families | Single-Parent Households |
| No Children | 92 (2.2%) | 0 (0.0%) |
| 1 or 2 Children | 10 (0.5%) | 132 (31.7%) |
| 3 or 4 Children | 19 (4.3%) | 51 (45.1%) |
| 5 or more Children | 0 (0.0%) | 0 (0.0%) |
| Total | 121 (1.8%) | 183 (17.0%) |
Employment Characteristics in Sheridan County
Employment by Class of Employer in Sheridan County
Among the 15,372 employed individuals in Sheridan County, private company employees (8,675 | 56.4%), not-for-profit organizations (1,552 | 10.1%), and local government employees (1,523 | 9.9%) make up the most common classes of employment.
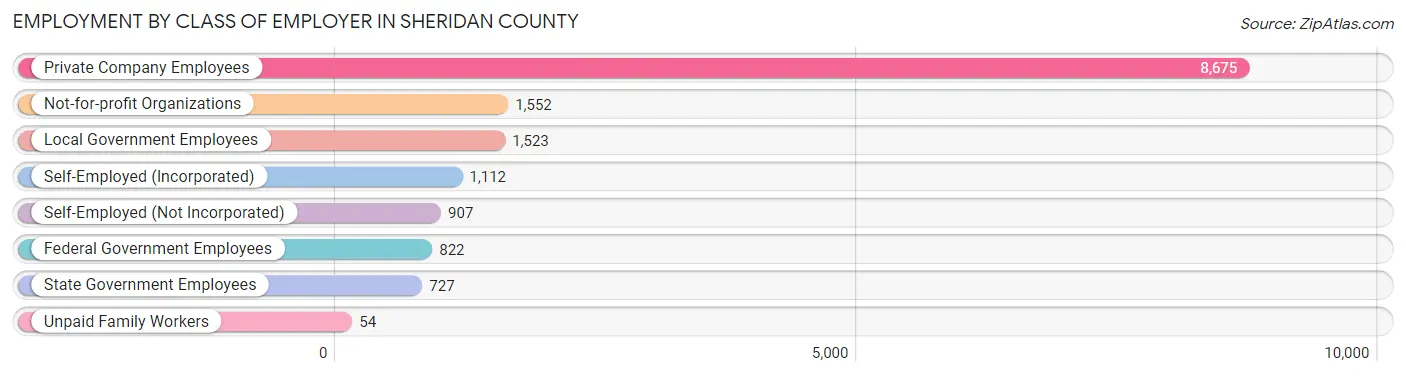
| Employer Class | # Employees | % Employees |
| Private Company Employees | 8,675 | 56.4% |
| Self-Employed (Incorporated) | 1,112 | 7.2% |
| Self-Employed (Not Incorporated) | 907 | 5.9% |
| Not-for-profit Organizations | 1,552 | 10.1% |
| Local Government Employees | 1,523 | 9.9% |
| State Government Employees | 727 | 4.7% |
| Federal Government Employees | 822 | 5.3% |
| Unpaid Family Workers | 54 | 0.4% |
| Total | 15,372 | 100.0% |
Employment Status by Age in Sheridan County
According to the labor force statistics for Sheridan County, out of the total population over 16 years of age (25,191), 63.8% or 16,072 individuals are in the labor force, with 3.0% or 482 of them unemployed. The age group with the highest labor force participation rate is 35 to 44 years, with 90.5% or 3,536 individuals in the labor force. Within the labor force, the 16 to 19 years age range has the highest percentage of unemployed individuals, with 9.7% or 74 of them being unemployed.
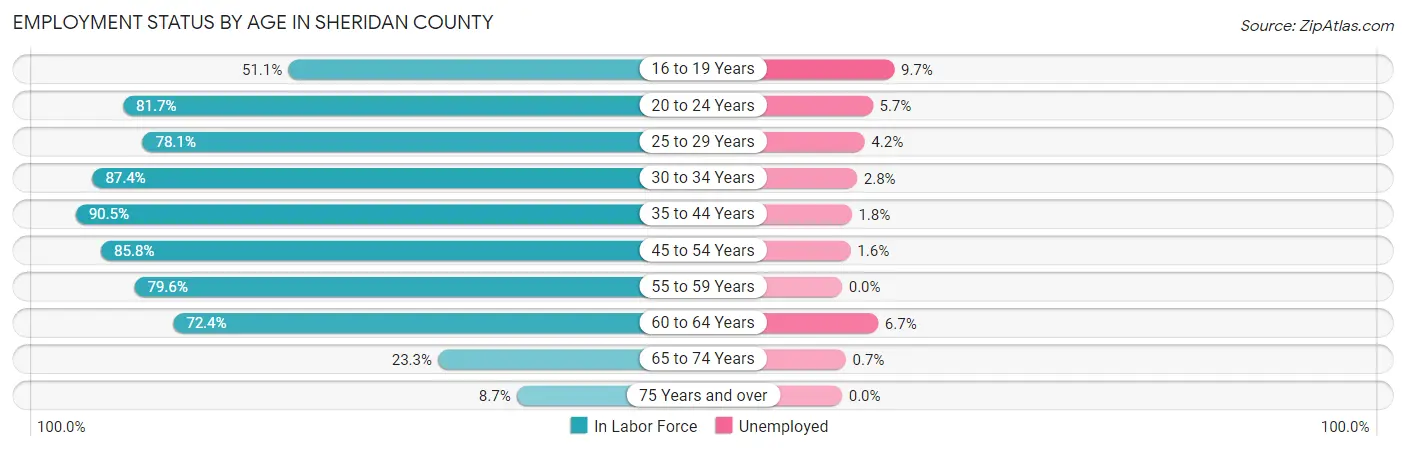
| Age Bracket | In Labor Force | Unemployed |
| 16 to 19 Years | 761 (51.1%) | 74 (9.7%) |
| 20 to 24 Years | 1,353 (81.7%) | 77 (5.7%) |
| 25 to 29 Years | 1,286 (78.1%) | 54 (4.2%) |
| 30 to 34 Years | 1,563 (87.4%) | 44 (2.8%) |
| 35 to 44 Years | 3,536 (90.5%) | 64 (1.8%) |
| 45 to 54 Years | 3,071 (85.8%) | 49 (1.6%) |
| 55 to 59 Years | 1,684 (79.6%) | 0 (0.0%) |
| 60 to 64 Years | 1,630 (72.4%) | 109 (6.7%) |
| 65 to 74 Years | 965 (23.3%) | 7 (0.7%) |
| 75 Years and over | 228 (8.7%) | 0 (0.0%) |
| Total | 16,072 (63.8%) | 482 (3.0%) |
Employment Status by Educational Attainment in Sheridan County
According to labor force statistics for Sheridan County, 83.5% of individuals (12,765) out of the total population between 25 and 64 years of age (15,288) are in the labor force, with 2.5% or 319 of them being unemployed. The group with the highest labor force participation rate are those with the educational attainment of bachelor's degree or higher, with 89.5% or 4,387 individuals in the labor force. Within the labor force, individuals with less than high school education have the highest percentage of unemployment, with 14.3% or 62 of them being unemployed.
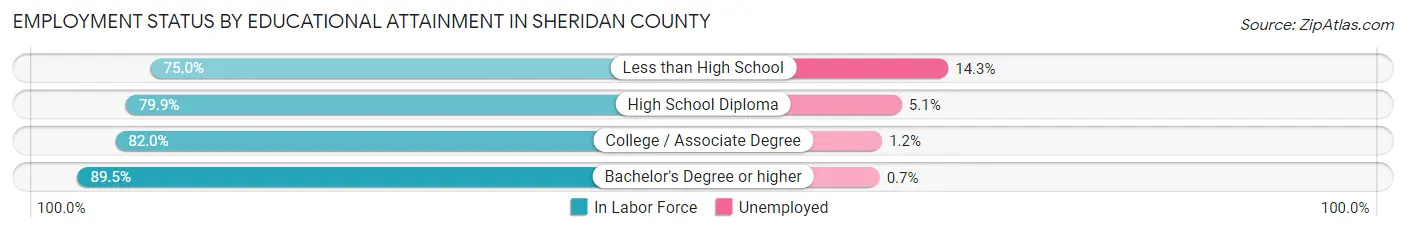
| Educational Attainment | In Labor Force | Unemployed |
| Less than High School | 433 (75.0%) | 83 (14.3%) |
| High School Diploma | 3,505 (79.9%) | 224 (5.1%) |
| College / Associate Degree | 4,446 (82.0%) | 65 (1.2%) |
| Bachelor's Degree or higher | 4,387 (89.5%) | 34 (0.7%) |
| Total | 12,765 (83.5%) | 382 (2.5%) |
Employment Occupations by Sex in Sheridan County
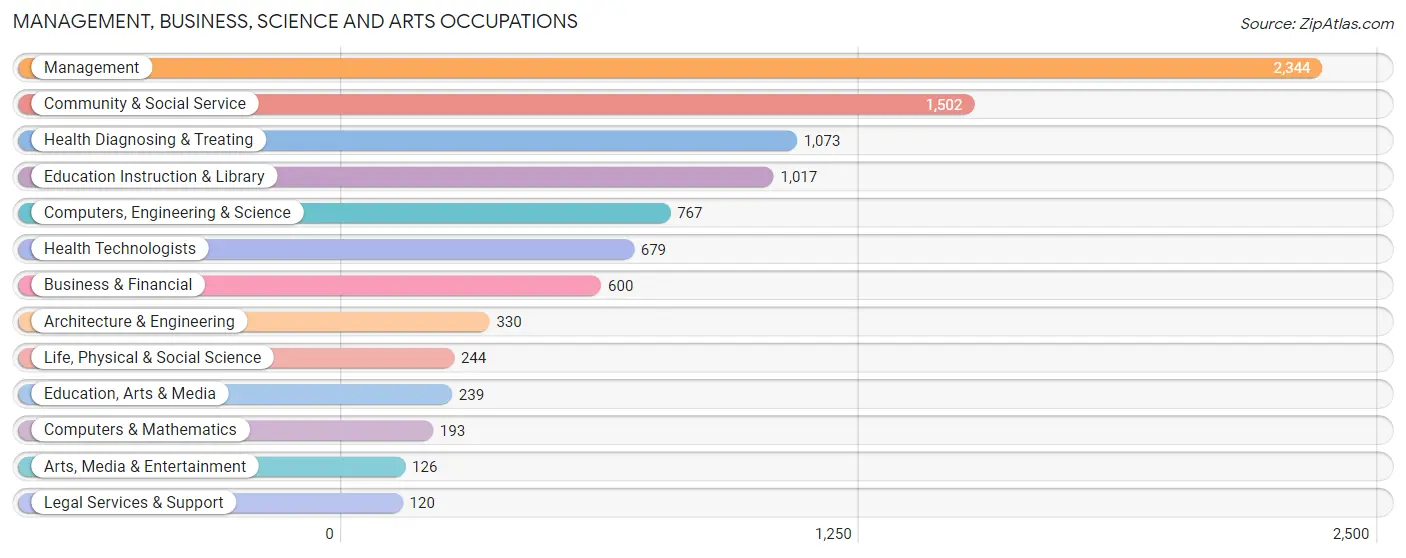
Management, Business, Science and Arts Occupations
The most common Management, Business, Science and Arts occupations in Sheridan County are Management (2,344 | 15.0%), Community & Social Service (1,502 | 9.6%), Health Diagnosing & Treating (1,073 | 6.9%), Education Instruction & Library (1,017 | 6.5%), and Computers, Engineering & Science (767 | 4.9%).
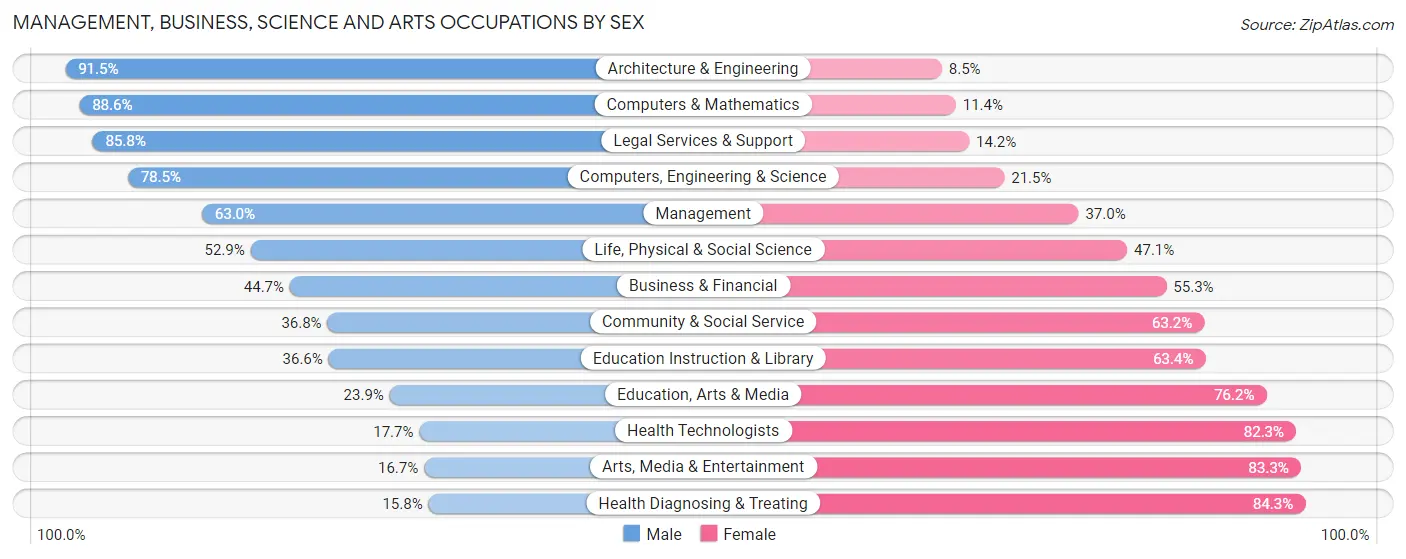
Management, Business, Science and Arts Occupations by Sex
Within the Management, Business, Science and Arts occupations in Sheridan County, the most male-oriented occupations are Architecture & Engineering (91.5%), Computers & Mathematics (88.6%), and Legal Services & Support (85.8%), while the most female-oriented occupations are Health Diagnosing & Treating (84.3%), Arts, Media & Entertainment (83.3%), and Health Technologists (82.3%).
| Occupation | Male | Female |
| Management | 1,477 (63.0%) | 867 (37.0%) |
| Business & Financial | 268 (44.7%) | 332 (55.3%) |
| Computers, Engineering & Science | 602 (78.5%) | 165 (21.5%) |
| Computers & Mathematics | 171 (88.6%) | 22 (11.4%) |
| Architecture & Engineering | 302 (91.5%) | 28 (8.5%) |
| Life, Physical & Social Science | 129 (52.9%) | 115 (47.1%) |
| Community & Social Service | 553 (36.8%) | 949 (63.2%) |
| Education, Arts & Media | 57 (23.8%) | 182 (76.1%) |
| Legal Services & Support | 103 (85.8%) | 17 (14.2%) |
| Education Instruction & Library | 372 (36.6%) | 645 (63.4%) |
| Arts, Media & Entertainment | 21 (16.7%) | 105 (83.3%) |
| Health Diagnosing & Treating | 169 (15.8%) | 904 (84.3%) |
| Health Technologists | 120 (17.7%) | 559 (82.3%) |
| Total (Category) | 3,069 (48.8%) | 3,217 (51.2%) |
| Total (Overall) | 8,321 (53.4%) | 7,258 (46.6%) |
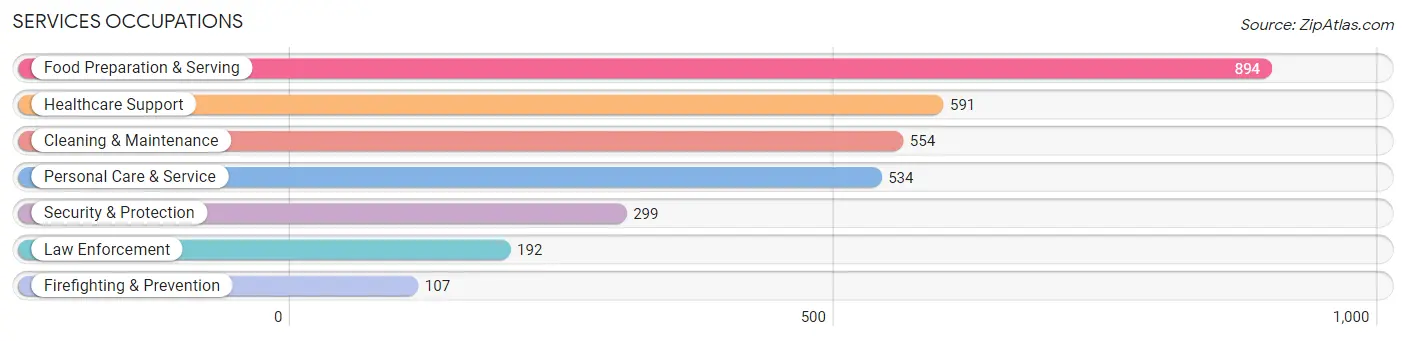
Services Occupations
The most common Services occupations in Sheridan County are Food Preparation & Serving (894 | 5.7%), Healthcare Support (591 | 3.8%), Cleaning & Maintenance (554 | 3.6%), Personal Care & Service (534 | 3.4%), and Security & Protection (299 | 1.9%).
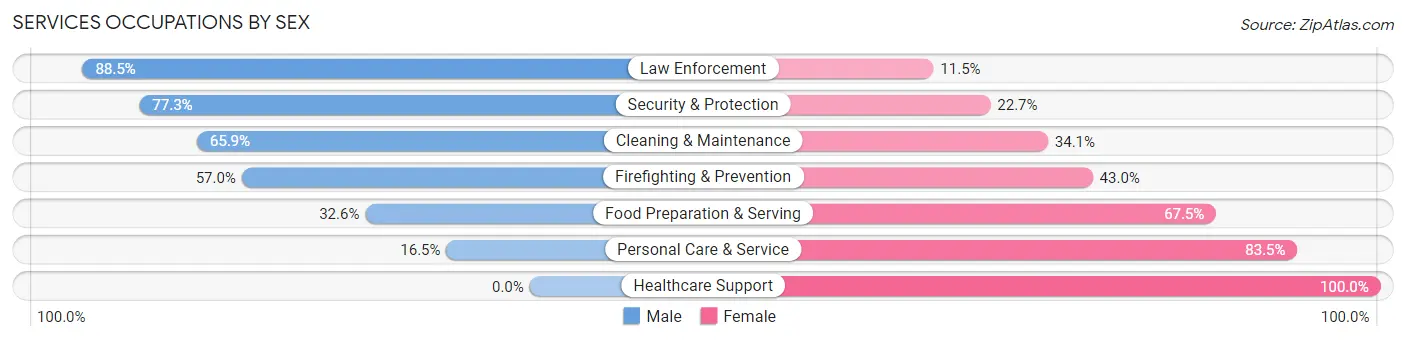
Services Occupations by Sex
Within the Services occupations in Sheridan County, the most male-oriented occupations are Law Enforcement (88.5%), Security & Protection (77.3%), and Cleaning & Maintenance (65.9%), while the most female-oriented occupations are Healthcare Support (100.0%), Personal Care & Service (83.5%), and Food Preparation & Serving (67.4%).
| Occupation | Male | Female |
| Healthcare Support | 0 (0.0%) | 591 (100.0%) |
| Security & Protection | 231 (77.3%) | 68 (22.7%) |
| Firefighting & Prevention | 61 (57.0%) | 46 (43.0%) |
| Law Enforcement | 170 (88.5%) | 22 (11.5%) |
| Food Preparation & Serving | 291 (32.6%) | 603 (67.4%) |
| Cleaning & Maintenance | 365 (65.9%) | 189 (34.1%) |
| Personal Care & Service | 88 (16.5%) | 446 (83.5%) |
| Total (Category) | 975 (34.0%) | 1,897 (66.0%) |
| Total (Overall) | 8,321 (53.4%) | 7,258 (46.6%) |
Sales and Office Occupations
The most common Sales and Office occupations in Sheridan County are Office & Administration (1,594 | 10.2%), and Sales & Related (880 | 5.7%).

Sales and Office Occupations by Sex
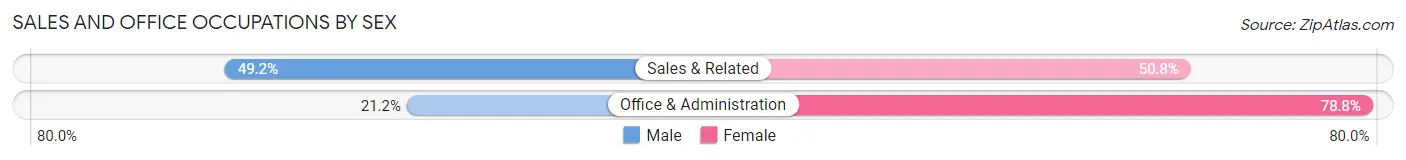
| Occupation | Male | Female |
| Sales & Related | 433 (49.2%) | 447 (50.8%) |
| Office & Administration | 338 (21.2%) | 1,256 (78.8%) |
| Total (Category) | 771 (31.2%) | 1,703 (68.8%) |
| Total (Overall) | 8,321 (53.4%) | 7,258 (46.6%) |
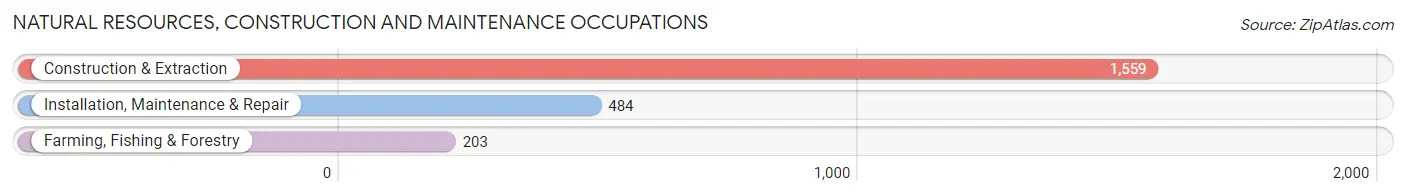
Natural Resources, Construction and Maintenance Occupations
The most common Natural Resources, Construction and Maintenance occupations in Sheridan County are Construction & Extraction (1,559 | 10.0%), Installation, Maintenance & Repair (484 | 3.1%), and Farming, Fishing & Forestry (203 | 1.3%).
Natural Resources, Construction and Maintenance Occupations by Sex
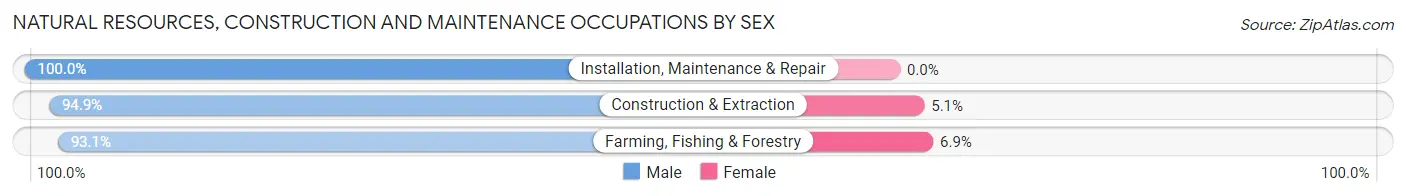
| Occupation | Male | Female |
| Farming, Fishing & Forestry | 189 (93.1%) | 14 (6.9%) |
| Construction & Extraction | 1,480 (94.9%) | 79 (5.1%) |
| Installation, Maintenance & Repair | 484 (100.0%) | 0 (0.0%) |
| Total (Category) | 2,153 (95.9%) | 93 (4.1%) |
| Total (Overall) | 8,321 (53.4%) | 7,258 (46.6%) |
Production, Transportation and Moving Occupations
The most common Production, Transportation and Moving occupations in Sheridan County are Transportation (810 | 5.2%), Production (541 | 3.5%), and Material Moving (350 | 2.2%).
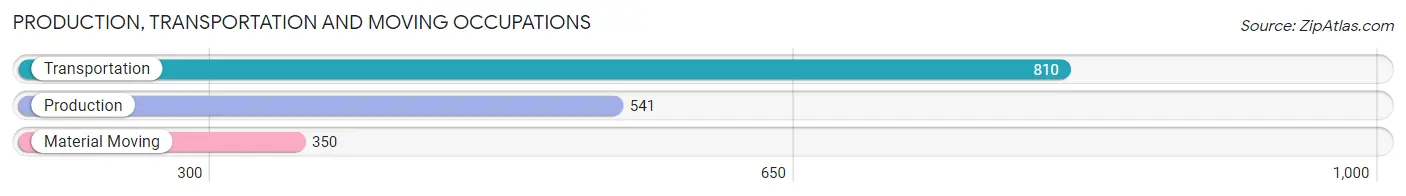
Production, Transportation and Moving Occupations by Sex
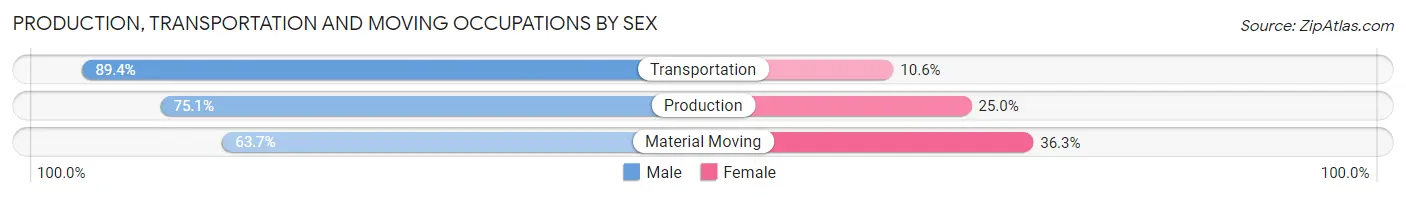
| Occupation | Male | Female |
| Production | 406 (75.0%) | 135 (24.9%) |
| Transportation | 724 (89.4%) | 86 (10.6%) |
| Material Moving | 223 (63.7%) | 127 (36.3%) |
| Total (Category) | 1,353 (79.5%) | 348 (20.5%) |
| Total (Overall) | 8,321 (53.4%) | 7,258 (46.6%) |
Employment Industries by Sex in Sheridan County
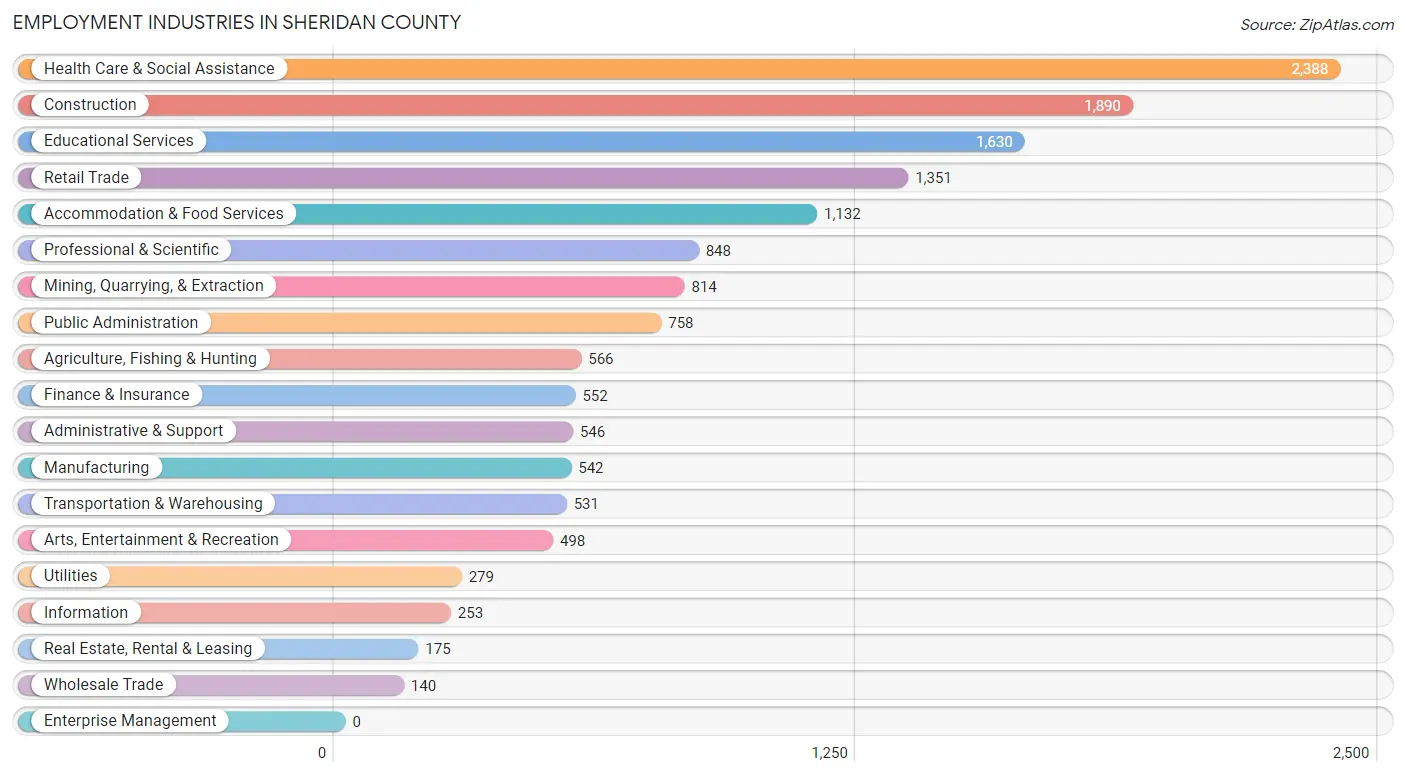
Employment Industries in Sheridan County
The major employment industries in Sheridan County include Health Care & Social Assistance (2,388 | 15.3%), Construction (1,890 | 12.1%), Educational Services (1,630 | 10.5%), Retail Trade (1,351 | 8.7%), and Accommodation & Food Services (1,132 | 7.3%).
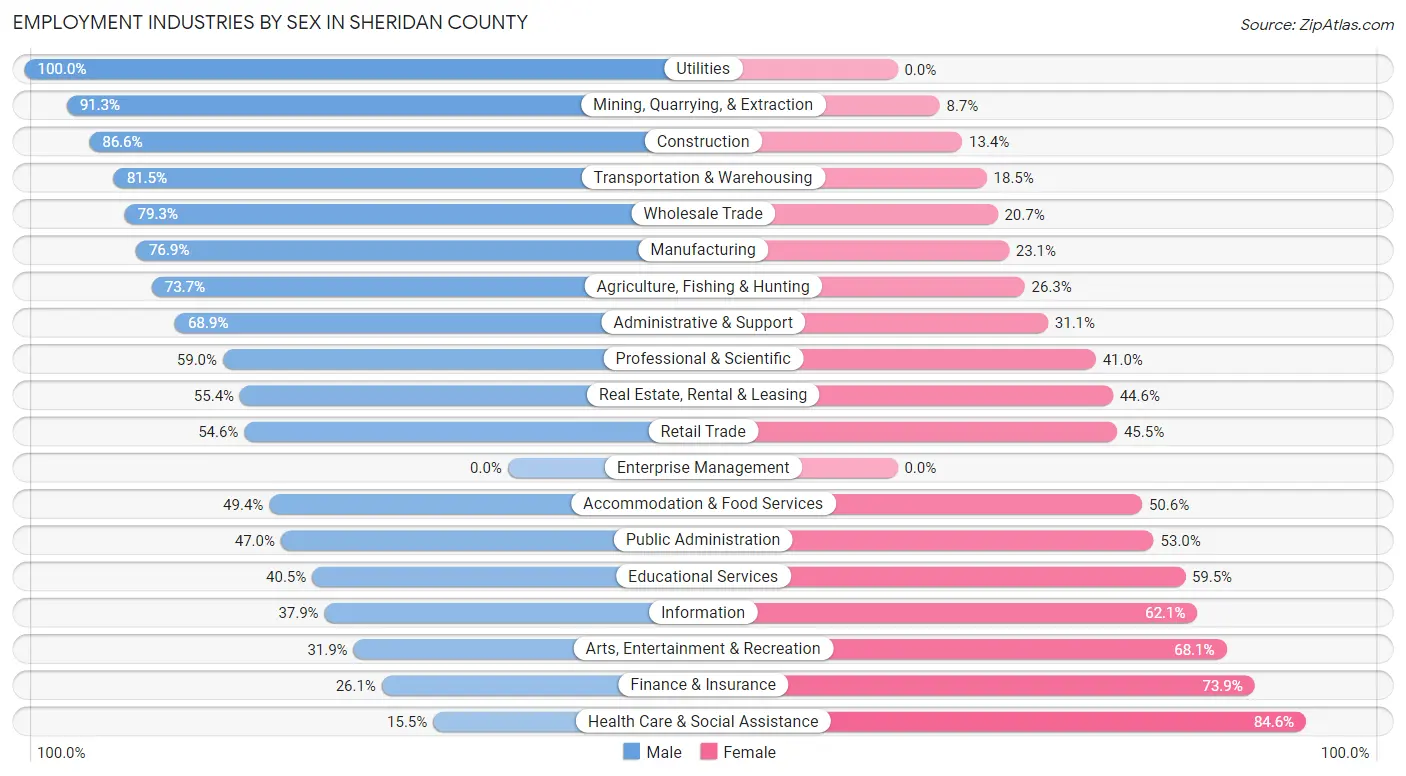
Employment Industries by Sex in Sheridan County
The Sheridan County industries that see more men than women are Utilities (100.0%), Mining, Quarrying, & Extraction (91.3%), and Construction (86.6%), whereas the industries that tend to have a higher number of women are Health Care & Social Assistance (84.6%), Finance & Insurance (73.9%), and Arts, Entertainment & Recreation (68.1%).
| Industry | Male | Female |
| Agriculture, Fishing & Hunting | 417 (73.7%) | 149 (26.3%) |
| Mining, Quarrying, & Extraction | 743 (91.3%) | 71 (8.7%) |
| Construction | 1,637 (86.6%) | 253 (13.4%) |
| Manufacturing | 417 (76.9%) | 125 (23.1%) |
| Wholesale Trade | 111 (79.3%) | 29 (20.7%) |
| Retail Trade | 737 (54.5%) | 614 (45.5%) |
| Transportation & Warehousing | 433 (81.5%) | 98 (18.5%) |
| Utilities | 279 (100.0%) | 0 (0.0%) |
| Information | 96 (37.9%) | 157 (62.1%) |
| Finance & Insurance | 144 (26.1%) | 408 (73.9%) |
| Real Estate, Rental & Leasing | 97 (55.4%) | 78 (44.6%) |
| Professional & Scientific | 500 (59.0%) | 348 (41.0%) |
| Enterprise Management | 0 (0.0%) | 0 (0.0%) |
| Administrative & Support | 376 (68.9%) | 170 (31.1%) |
| Educational Services | 660 (40.5%) | 970 (59.5%) |
| Health Care & Social Assistance | 369 (15.4%) | 2,019 (84.6%) |
| Arts, Entertainment & Recreation | 159 (31.9%) | 339 (68.1%) |
| Accommodation & Food Services | 559 (49.4%) | 573 (50.6%) |
| Public Administration | 356 (47.0%) | 402 (53.0%) |
| Total | 8,321 (53.4%) | 7,258 (46.6%) |
Education in Sheridan County
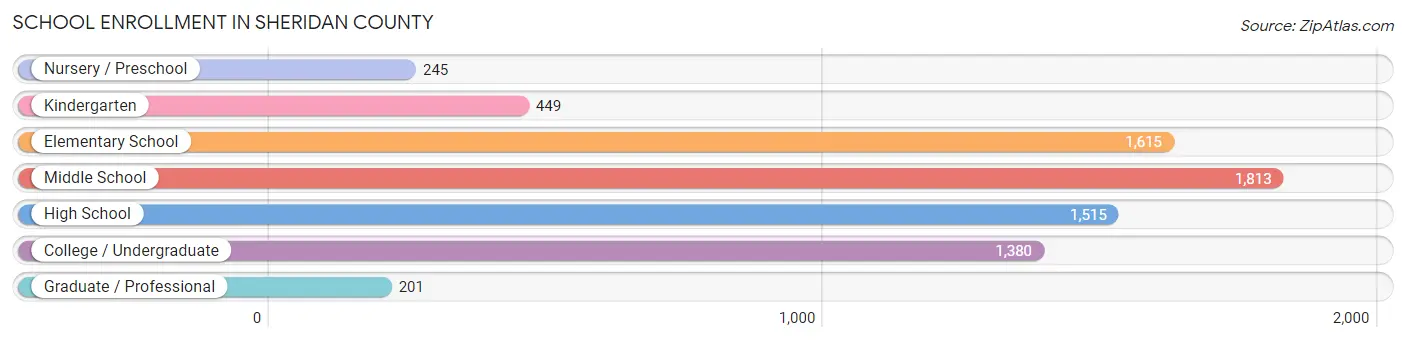
School Enrollment in Sheridan County
The most common levels of schooling among the 7,218 students in Sheridan County are middle school (1,813 | 25.1%), elementary school (1,615 | 22.4%), and high school (1,515 | 21.0%).
| School Level | # Students | % Students |
| Nursery / Preschool | 245 | 3.4% |
| Kindergarten | 449 | 6.2% |
| Elementary School | 1,615 | 22.4% |
| Middle School | 1,813 | 25.1% |
| High School | 1,515 | 21.0% |
| College / Undergraduate | 1,380 | 19.1% |
| Graduate / Professional | 201 | 2.8% |
| Total | 7,218 | 100.0% |
School Enrollment by Age by Funding Source in Sheridan County
Out of a total of 7,218 students who are enrolled in schools in Sheridan County, 621 (8.6%) attend a private institution, while the remaining 6,597 (91.4%) are enrolled in public schools. The age group of 3 to 4 year olds has the highest likelihood of being enrolled in private schools, with 162 (70.1% in the age bracket) enrolled. Conversely, the age group of 20 to 24 year olds has the lowest likelihood of being enrolled in a private school, with 781 (100.0% in the age bracket) attending a public institution.
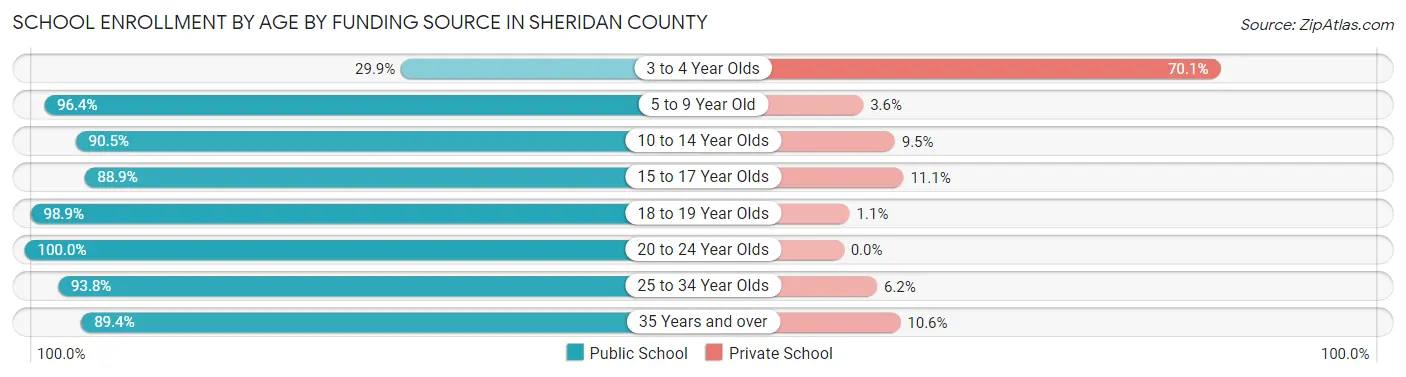
| Age Bracket | Public School | Private School |
| 3 to 4 Year Olds | 69 (29.9%) | 162 (70.1%) |
| 5 to 9 Year Old | 1,641 (96.4%) | 62 (3.6%) |
| 10 to 14 Year Olds | 2,053 (90.5%) | 216 (9.5%) |
| 15 to 17 Year Olds | 1,045 (88.9%) | 131 (11.1%) |
| 18 to 19 Year Olds | 534 (98.9%) | 6 (1.1%) |
| 20 to 24 Year Olds | 781 (100.0%) | 0 (0.0%) |
| 25 to 34 Year Olds | 166 (93.8%) | 11 (6.2%) |
| 35 Years and over | 305 (89.4%) | 36 (10.6%) |
| Total | 6,597 (91.4%) | 621 (8.6%) |
Educational Attainment by Field of Study in Sheridan County
Business (1,329 | 17.4%), education (1,276 | 16.7%), science & technology (728 | 9.5%), bio, nature & agricultural (692 | 9.1%), and social sciences (687 | 9.0%) are the most common fields of study among 7,634 individuals in Sheridan County who have obtained a bachelor's degree or higher.
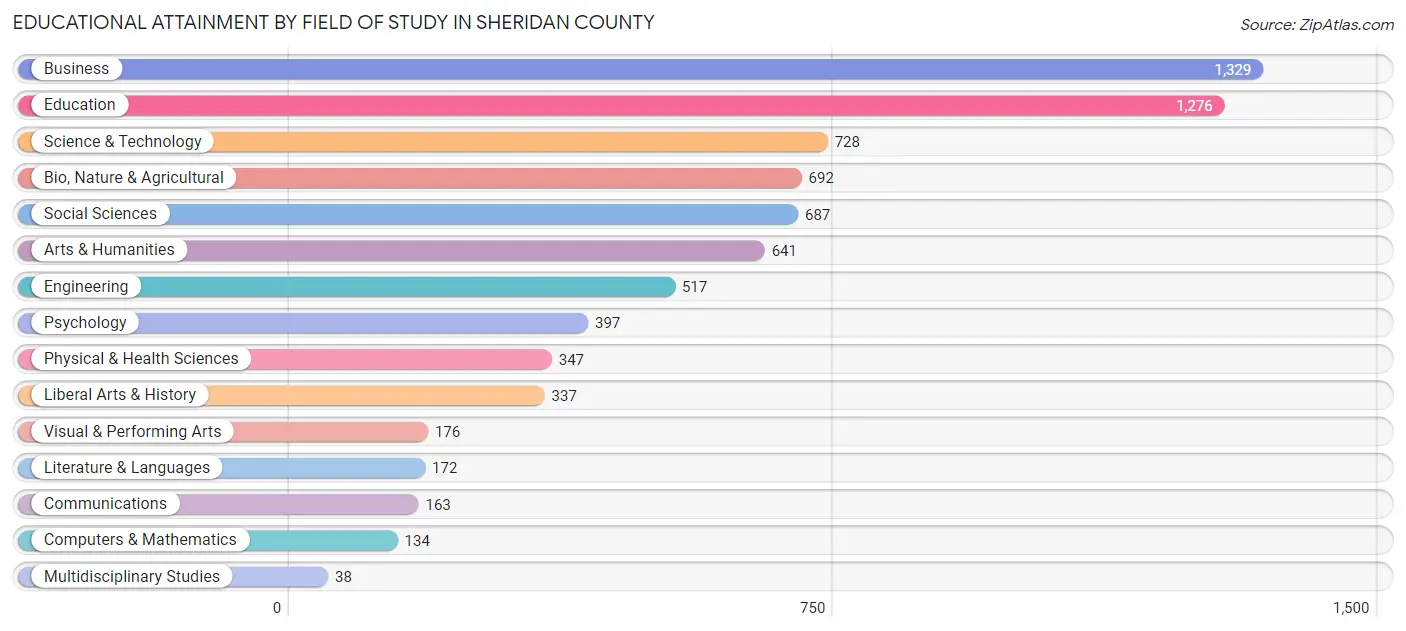
| Field of Study | # Graduates | % Graduates |
| Computers & Mathematics | 134 | 1.8% |
| Bio, Nature & Agricultural | 692 | 9.1% |
| Physical & Health Sciences | 347 | 4.5% |
| Psychology | 397 | 5.2% |
| Social Sciences | 687 | 9.0% |
| Engineering | 517 | 6.8% |
| Multidisciplinary Studies | 38 | 0.5% |
| Science & Technology | 728 | 9.5% |
| Business | 1,329 | 17.4% |
| Education | 1,276 | 16.7% |
| Literature & Languages | 172 | 2.2% |
| Liberal Arts & History | 337 | 4.4% |
| Visual & Performing Arts | 176 | 2.3% |
| Communications | 163 | 2.1% |
| Arts & Humanities | 641 | 8.4% |
| Total | 7,634 | 100.0% |
Transportation & Commute in Sheridan County
Vehicle Availability by Sex in Sheridan County
The most prevalent vehicle ownership categories in Sheridan County are males with 2 vehicles (3,273, accounting for 40.6%) and females with 2 vehicles (2,732, making up 46.4%).
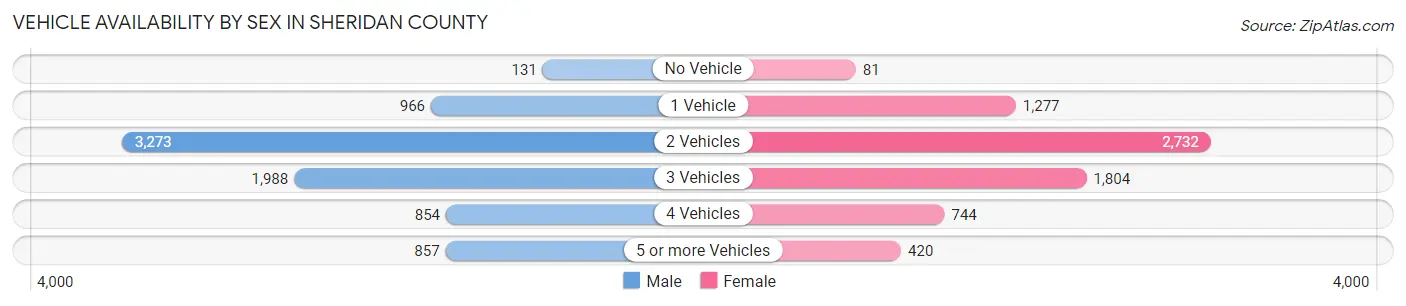
| Vehicles Available | Male | Female |
| No Vehicle | 131 (1.6%) | 81 (1.1%) |
| 1 Vehicle | 966 (12.0%) | 1,277 (18.1%) |
| 2 Vehicles | 3,273 (40.6%) | 2,732 (38.7%) |
| 3 Vehicles | 1,988 (24.6%) | 1,804 (25.6%) |
| 4 Vehicles | 854 (10.6%) | 744 (10.5%) |
| 5 or more Vehicles | 857 (10.6%) | 420 (5.9%) |
| Total | 8,069 (100.0%) | 7,058 (100.0%) |
Commute Time in Sheridan County
The most frequently occuring commute durations in Sheridan County are 5 to 9 minutes (4,005 commuters, 28.6%), 10 to 14 minutes (3,043 commuters, 21.7%), and 15 to 19 minutes (2,472 commuters, 17.6%).
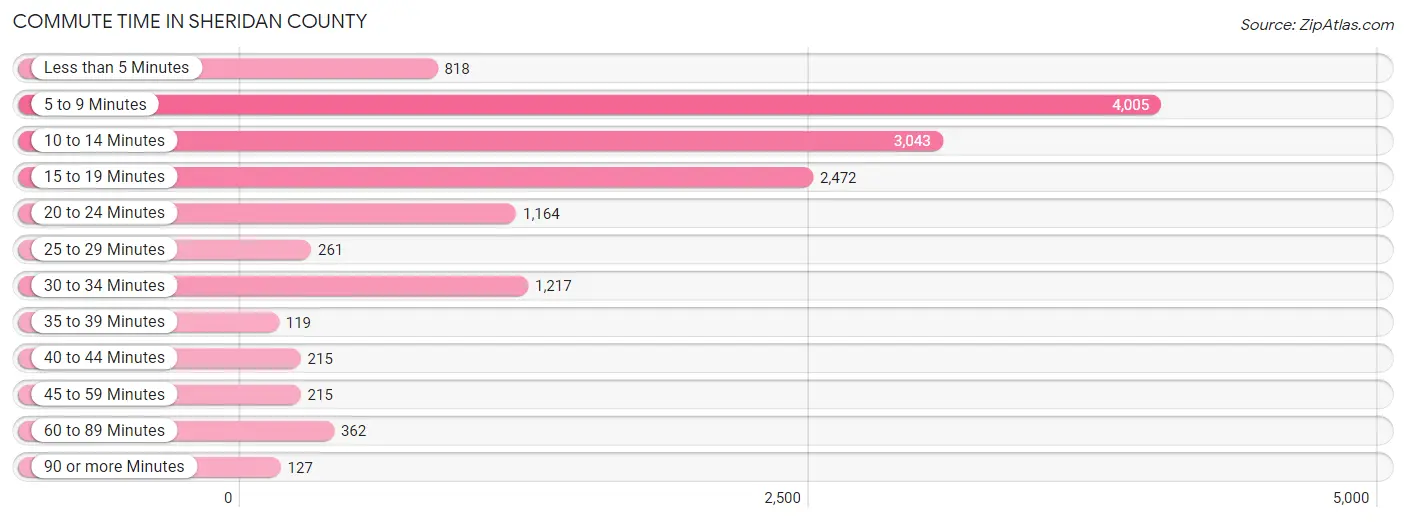
| Commute Time | # Commuters | % Commuters |
| Less than 5 Minutes | 818 | 5.8% |
| 5 to 9 Minutes | 4,005 | 28.6% |
| 10 to 14 Minutes | 3,043 | 21.7% |
| 15 to 19 Minutes | 2,472 | 17.6% |
| 20 to 24 Minutes | 1,164 | 8.3% |
| 25 to 29 Minutes | 261 | 1.9% |
| 30 to 34 Minutes | 1,217 | 8.7% |
| 35 to 39 Minutes | 119 | 0.9% |
| 40 to 44 Minutes | 215 | 1.5% |
| 45 to 59 Minutes | 215 | 1.5% |
| 60 to 89 Minutes | 362 | 2.6% |
| 90 or more Minutes | 127 | 0.9% |
Commute Time by Sex in Sheridan County
The most common commute times in Sheridan County are 5 to 9 minutes (1,923 commuters, 26.0%) for males and 5 to 9 minutes (2,082 commuters, 31.5%) for females.
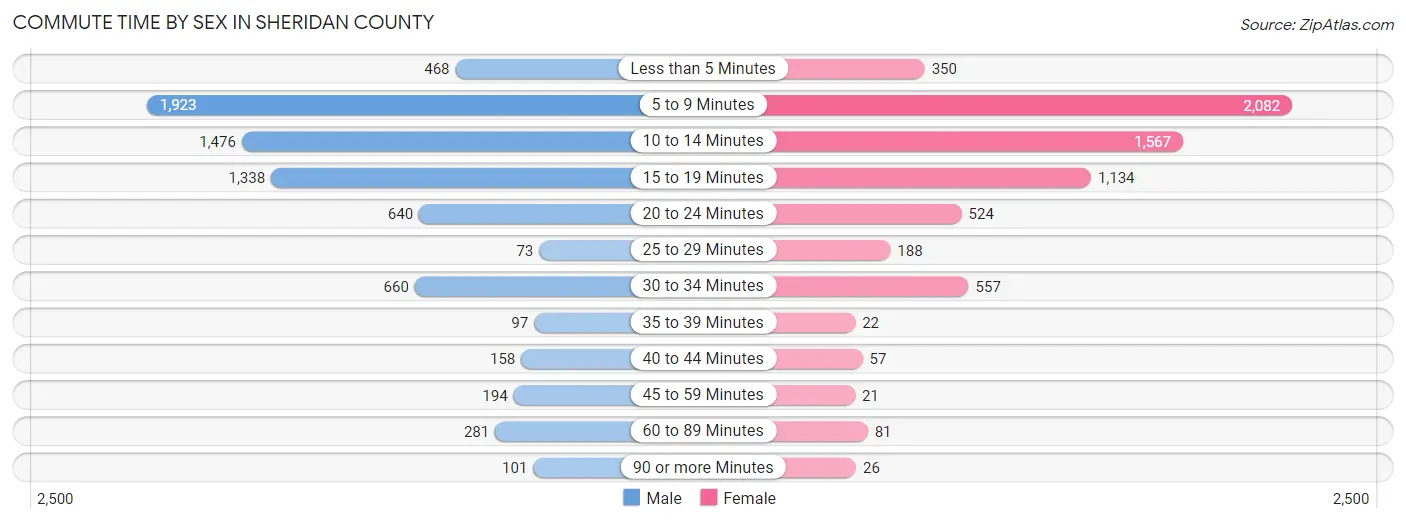
| Commute Time | Male | Female |
| Less than 5 Minutes | 468 (6.3%) | 350 (5.3%) |
| 5 to 9 Minutes | 1,923 (26.0%) | 2,082 (31.5%) |
| 10 to 14 Minutes | 1,476 (19.9%) | 1,567 (23.7%) |
| 15 to 19 Minutes | 1,338 (18.1%) | 1,134 (17.2%) |
| 20 to 24 Minutes | 640 (8.6%) | 524 (7.9%) |
| 25 to 29 Minutes | 73 (1.0%) | 188 (2.8%) |
| 30 to 34 Minutes | 660 (8.9%) | 557 (8.4%) |
| 35 to 39 Minutes | 97 (1.3%) | 22 (0.3%) |
| 40 to 44 Minutes | 158 (2.1%) | 57 (0.9%) |
| 45 to 59 Minutes | 194 (2.6%) | 21 (0.3%) |
| 60 to 89 Minutes | 281 (3.8%) | 81 (1.2%) |
| 90 or more Minutes | 101 (1.4%) | 26 (0.4%) |
Time of Departure to Work by Sex in Sheridan County
The most frequent times of departure to work in Sheridan County are 7:00 AM to 7:29 AM (1,342, 18.1%) for males and 7:00 AM to 7:29 AM (1,300, 19.7%) for females.
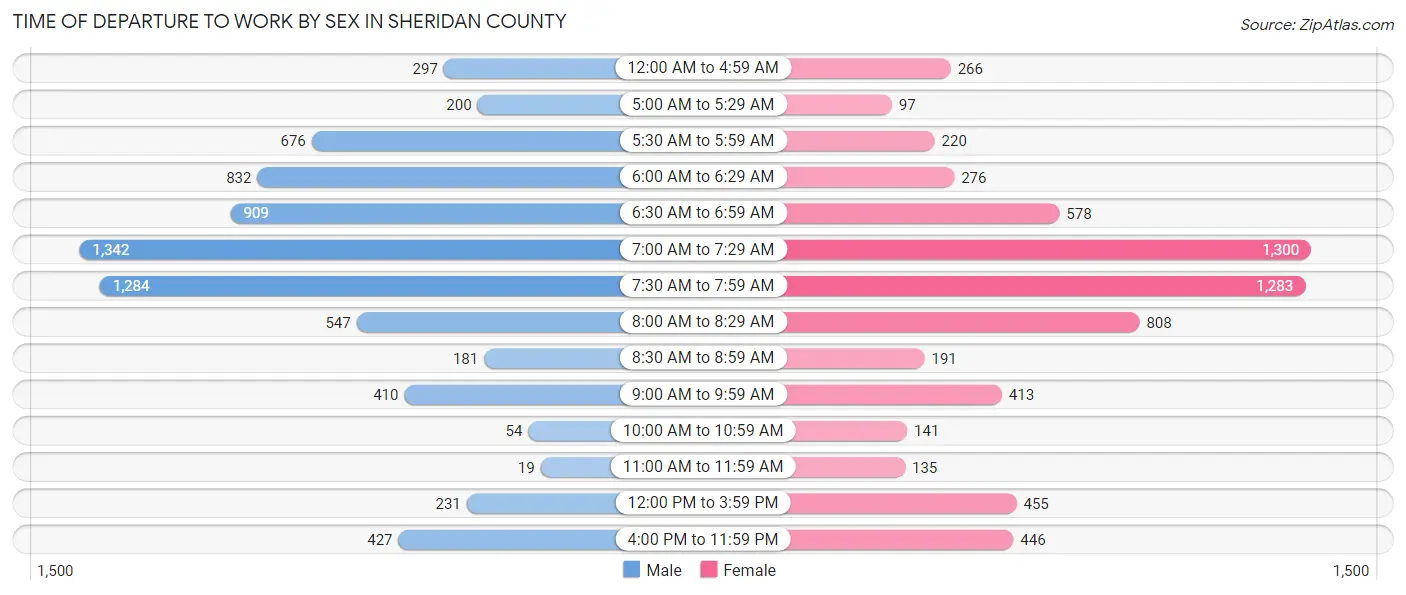
| Time of Departure | Male | Female |
| 12:00 AM to 4:59 AM | 297 (4.0%) | 266 (4.0%) |
| 5:00 AM to 5:29 AM | 200 (2.7%) | 97 (1.5%) |
| 5:30 AM to 5:59 AM | 676 (9.1%) | 220 (3.3%) |
| 6:00 AM to 6:29 AM | 832 (11.2%) | 276 (4.2%) |
| 6:30 AM to 6:59 AM | 909 (12.3%) | 578 (8.7%) |
| 7:00 AM to 7:29 AM | 1,342 (18.1%) | 1,300 (19.7%) |
| 7:30 AM to 7:59 AM | 1,284 (17.3%) | 1,283 (19.4%) |
| 8:00 AM to 8:29 AM | 547 (7.4%) | 808 (12.2%) |
| 8:30 AM to 8:59 AM | 181 (2.4%) | 191 (2.9%) |
| 9:00 AM to 9:59 AM | 410 (5.5%) | 413 (6.2%) |
| 10:00 AM to 10:59 AM | 54 (0.7%) | 141 (2.1%) |
| 11:00 AM to 11:59 AM | 19 (0.3%) | 135 (2.0%) |
| 12:00 PM to 3:59 PM | 231 (3.1%) | 455 (6.9%) |
| 4:00 PM to 11:59 PM | 427 (5.8%) | 446 (6.8%) |
| Total | 7,409 (100.0%) | 6,609 (100.0%) |
Housing Occupancy in Sheridan County
Occupancy by Ownership in Sheridan County
Of the total 13,066 dwellings in Sheridan County, owner-occupied units account for 9,011 (69.0%), while renter-occupied units make up 4,055 (31.0%).
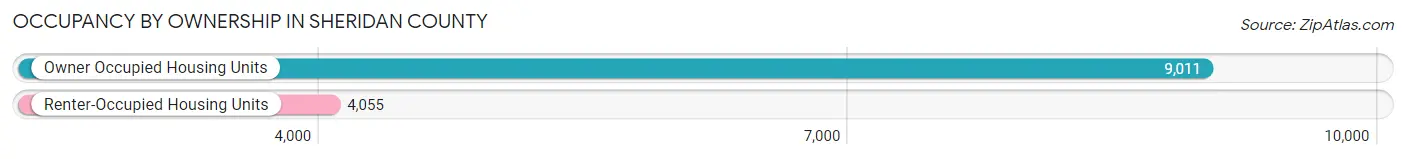
| Occupancy | # Housing Units | % Housing Units |
| Owner Occupied Housing Units | 9,011 | 69.0% |
| Renter-Occupied Housing Units | 4,055 | 31.0% |
| Total Occupied Housing Units | 13,066 | 100.0% |
Occupancy by Household Size in Sheridan County
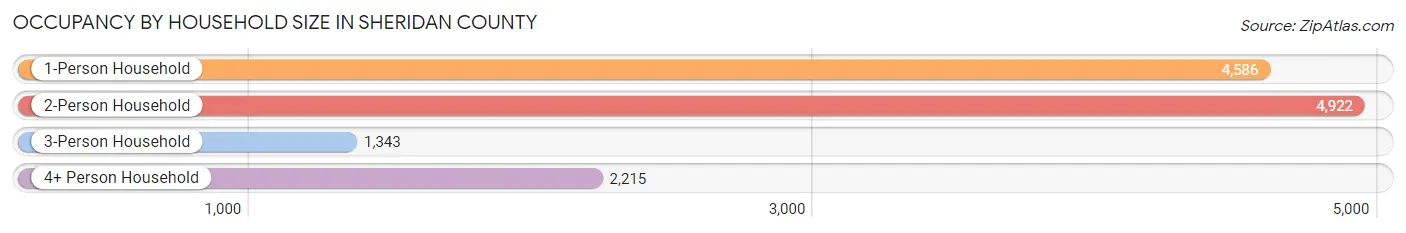
| Household Size | # Housing Units | % Housing Units |
| 1-Person Household | 4,586 | 35.1% |
| 2-Person Household | 4,922 | 37.7% |
| 3-Person Household | 1,343 | 10.3% |
| 4+ Person Household | 2,215 | 17.0% |
| Total Housing Units | 13,066 | 100.0% |
Occupancy by Ownership by Household Size in Sheridan County
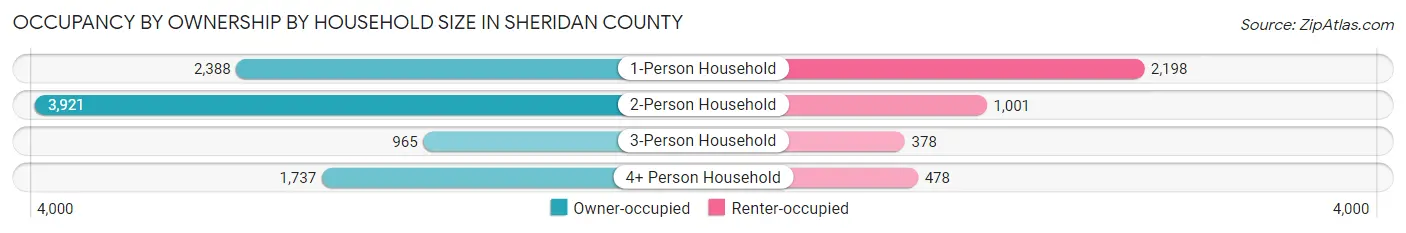
| Household Size | Owner-occupied | Renter-occupied |
| 1-Person Household | 2,388 (52.1%) | 2,198 (47.9%) |
| 2-Person Household | 3,921 (79.7%) | 1,001 (20.3%) |
| 3-Person Household | 965 (71.9%) | 378 (28.1%) |
| 4+ Person Household | 1,737 (78.4%) | 478 (21.6%) |
| Total Housing Units | 9,011 (69.0%) | 4,055 (31.0%) |
Occupancy by Educational Attainment in Sheridan County
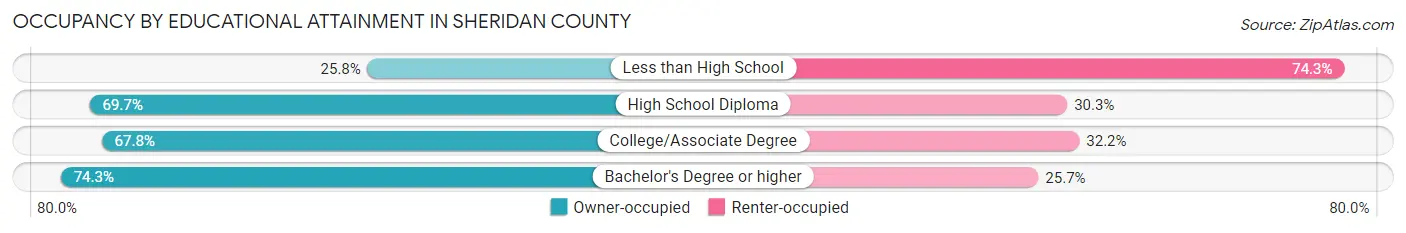
| Household Size | Owner-occupied | Renter-occupied |
| Less than High School | 128 (25.8%) | 369 (74.3%) |
| High School Diploma | 2,620 (69.7%) | 1,139 (30.3%) |
| College/Associate Degree | 2,923 (67.8%) | 1,390 (32.2%) |
| Bachelor's Degree or higher | 3,340 (74.3%) | 1,157 (25.7%) |
Occupancy by Age of Householder in Sheridan County
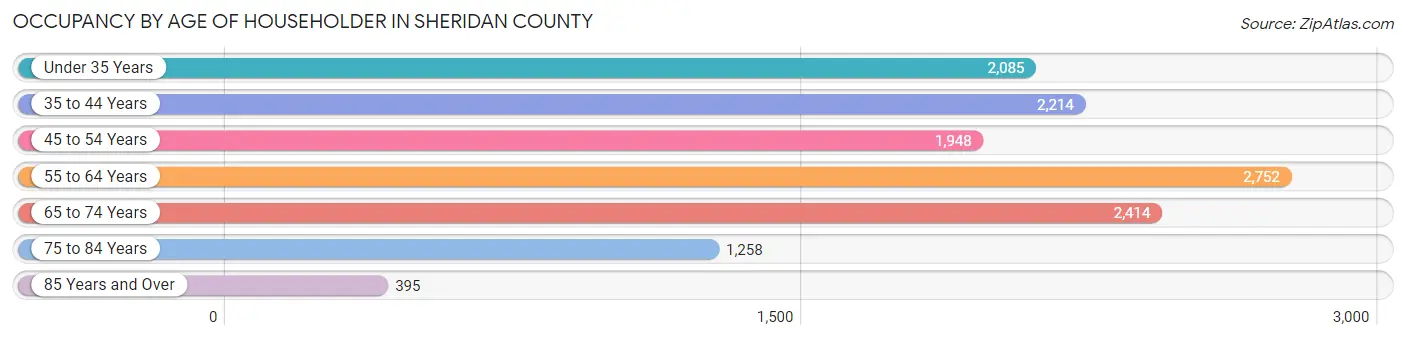
| Age Bracket | # Households | % Households |
| Under 35 Years | 2,085 | 16.0% |
| 35 to 44 Years | 2,214 | 16.9% |
| 45 to 54 Years | 1,948 | 14.9% |
| 55 to 64 Years | 2,752 | 21.1% |
| 65 to 74 Years | 2,414 | 18.5% |
| 75 to 84 Years | 1,258 | 9.6% |
| 85 Years and Over | 395 | 3.0% |
| Total | 13,066 | 100.0% |
Housing Finances in Sheridan County
Median Income by Occupancy in Sheridan County
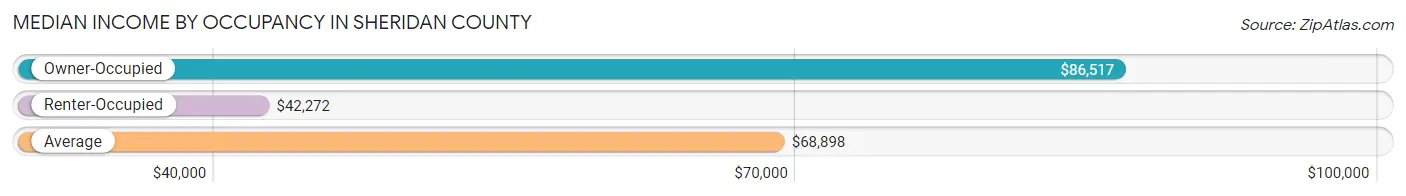
| Occupancy Type | # Households | Median Income |
| Owner-Occupied | 9,011 (69.0%) | $86,517 |
| Renter-Occupied | 4,055 (31.0%) | $42,272 |
| Average | 13,066 (100.0%) | $68,898 |
Occupancy by Householder Income Bracket in Sheridan County
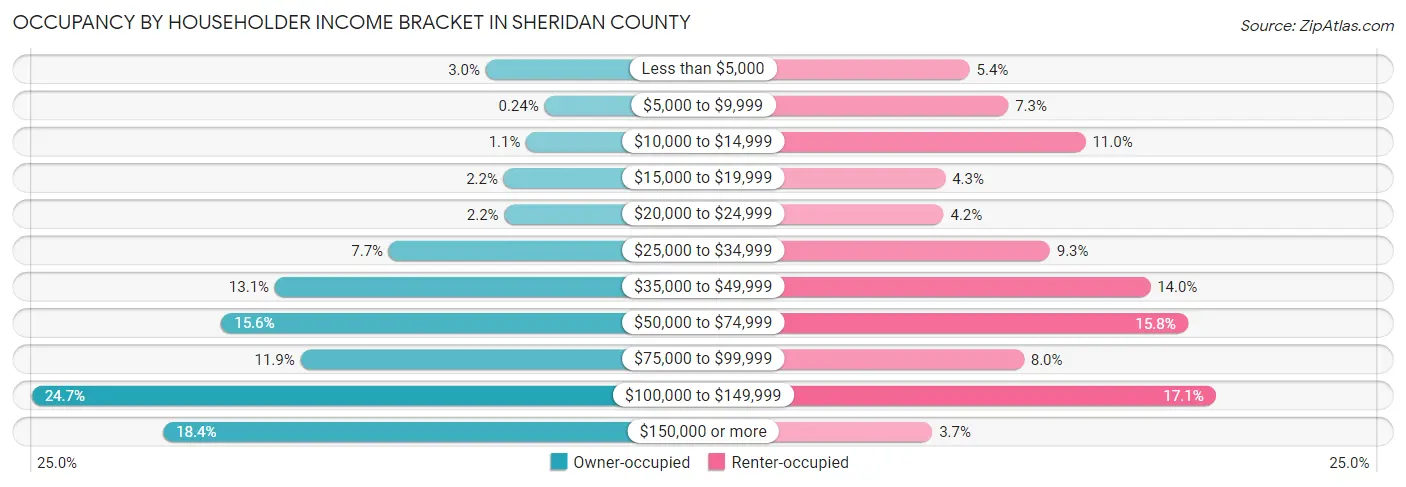
| Income Bracket | Owner-occupied | Renter-occupied |
| Less than $5,000 | 274 (3.0%) | 220 (5.4%) |
| $5,000 to $9,999 | 22 (0.2%) | 295 (7.3%) |
| $10,000 to $14,999 | 100 (1.1%) | 444 (11.0%) |
| $15,000 to $19,999 | 196 (2.2%) | 173 (4.3%) |
| $20,000 to $24,999 | 194 (2.1%) | 170 (4.2%) |
| $25,000 to $34,999 | 689 (7.6%) | 375 (9.2%) |
| $35,000 to $49,999 | 1,179 (13.1%) | 569 (14.0%) |
| $50,000 to $74,999 | 1,408 (15.6%) | 641 (15.8%) |
| $75,000 to $99,999 | 1,069 (11.9%) | 325 (8.0%) |
| $100,000 to $149,999 | 2,222 (24.7%) | 695 (17.1%) |
| $150,000 or more | 1,658 (18.4%) | 148 (3.6%) |
| Total | 9,011 (100.0%) | 4,055 (100.0%) |
Monthly Housing Cost Tiers in Sheridan County
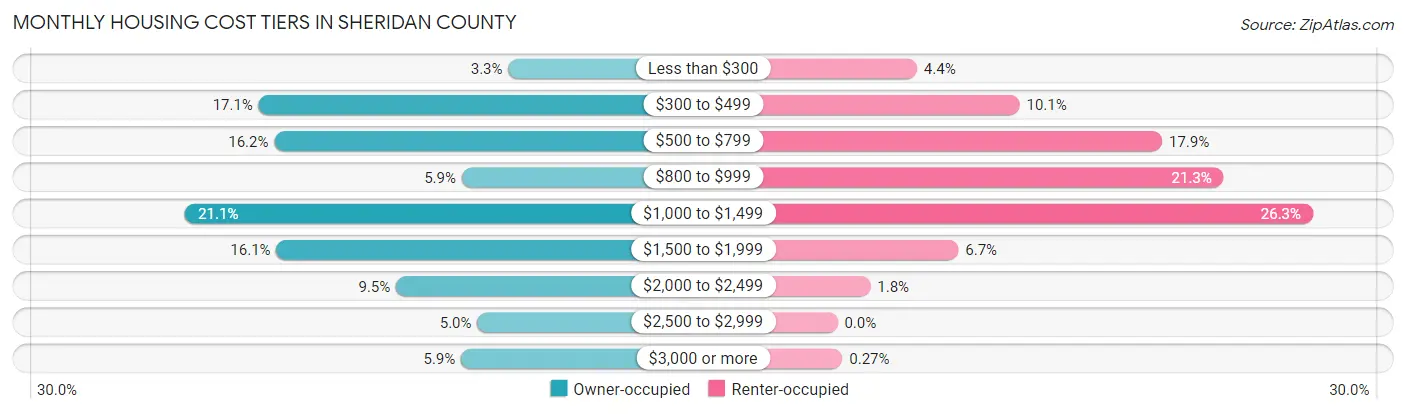
| Monthly Cost | Owner-occupied | Renter-occupied |
| Less than $300 | 296 (3.3%) | 178 (4.4%) |
| $300 to $499 | 1,538 (17.1%) | 408 (10.1%) |
| $500 to $799 | 1,461 (16.2%) | 727 (17.9%) |
| $800 to $999 | 527 (5.9%) | 865 (21.3%) |
| $1,000 to $1,499 | 1,904 (21.1%) | 1,065 (26.3%) |
| $1,500 to $1,999 | 1,450 (16.1%) | 271 (6.7%) |
| $2,000 to $2,499 | 854 (9.5%) | 74 (1.8%) |
| $2,500 to $2,999 | 450 (5.0%) | 0 (0.0%) |
| $3,000 or more | 531 (5.9%) | 11 (0.3%) |
| Total | 9,011 (100.0%) | 4,055 (100.0%) |
Physical Housing Characteristics in Sheridan County
Housing Structures in Sheridan County
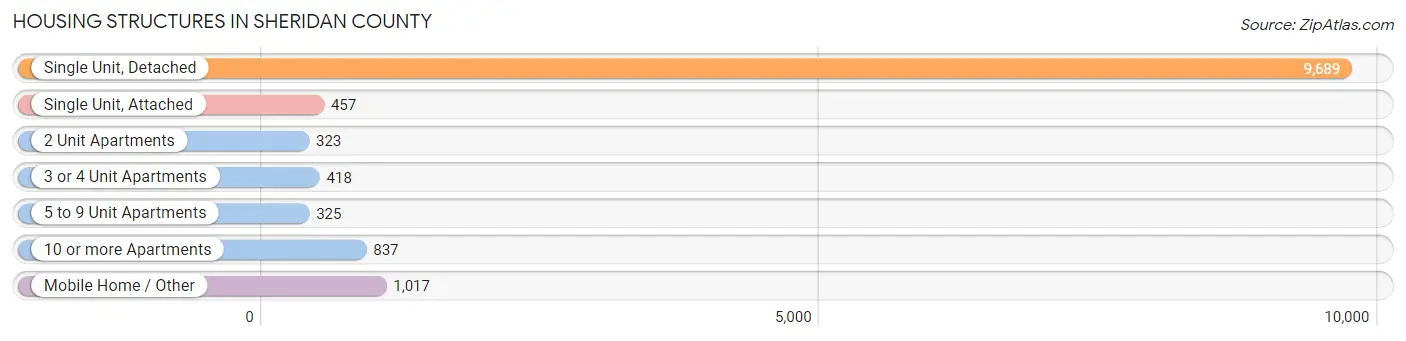
| Structure Type | # Housing Units | % Housing Units |
| Single Unit, Detached | 9,689 | 74.2% |
| Single Unit, Attached | 457 | 3.5% |
| 2 Unit Apartments | 323 | 2.5% |
| 3 or 4 Unit Apartments | 418 | 3.2% |
| 5 to 9 Unit Apartments | 325 | 2.5% |
| 10 or more Apartments | 837 | 6.4% |
| Mobile Home / Other | 1,017 | 7.8% |
| Total | 13,066 | 100.0% |
Housing Structures by Occupancy in Sheridan County
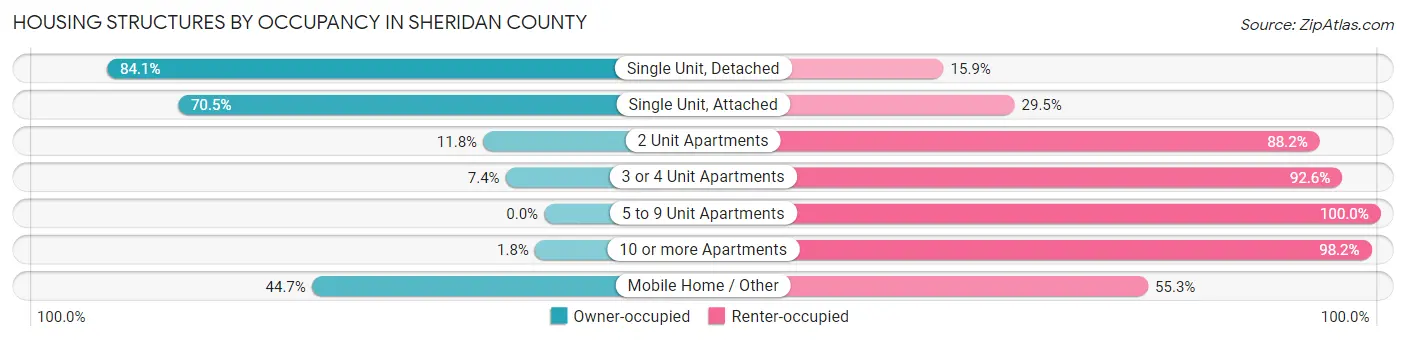
| Structure Type | Owner-occupied | Renter-occupied |
| Single Unit, Detached | 8,150 (84.1%) | 1,539 (15.9%) |
| Single Unit, Attached | 322 (70.5%) | 135 (29.5%) |
| 2 Unit Apartments | 38 (11.8%) | 285 (88.2%) |
| 3 or 4 Unit Apartments | 31 (7.4%) | 387 (92.6%) |
| 5 to 9 Unit Apartments | 0 (0.0%) | 325 (100.0%) |
| 10 or more Apartments | 15 (1.8%) | 822 (98.2%) |
| Mobile Home / Other | 455 (44.7%) | 562 (55.3%) |
| Total | 9,011 (69.0%) | 4,055 (31.0%) |
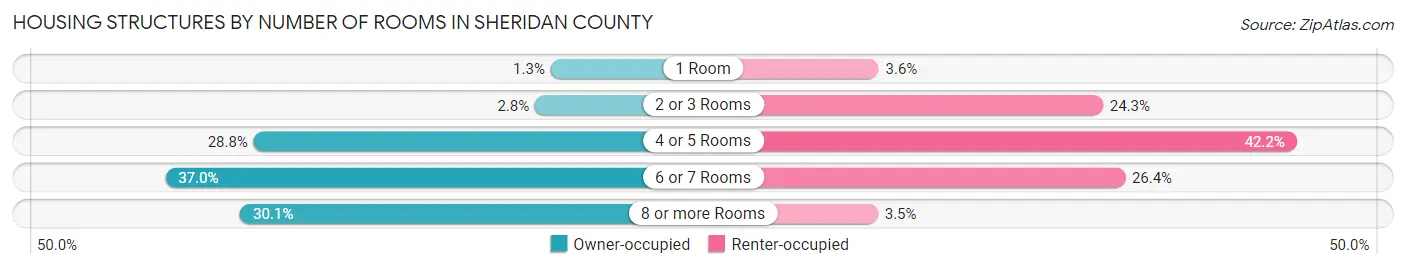
Housing Structures by Number of Rooms in Sheridan County
| Number of Rooms | Owner-occupied | Renter-occupied |
| 1 Room | 121 (1.3%) | 145 (3.6%) |
| 2 or 3 Rooms | 251 (2.8%) | 986 (24.3%) |
| 4 or 5 Rooms | 2,596 (28.8%) | 1,713 (42.2%) |
| 6 or 7 Rooms | 3,333 (37.0%) | 1,069 (26.4%) |
| 8 or more Rooms | 2,710 (30.1%) | 142 (3.5%) |
| Total | 9,011 (100.0%) | 4,055 (100.0%) |
Housing Structure by Heating Type in Sheridan County
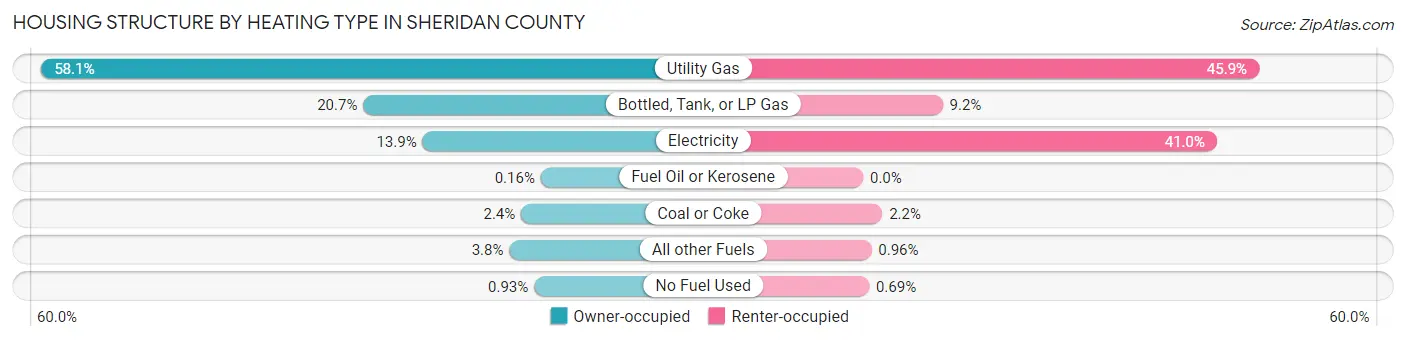
| Heating Type | Owner-occupied | Renter-occupied |
| Utility Gas | 5,233 (58.1%) | 1,861 (45.9%) |
| Bottled, Tank, or LP Gas | 1,869 (20.7%) | 374 (9.2%) |
| Electricity | 1,250 (13.9%) | 1,663 (41.0%) |
| Fuel Oil or Kerosene | 14 (0.2%) | 0 (0.0%) |
| Coal or Coke | 219 (2.4%) | 90 (2.2%) |
| All other Fuels | 342 (3.8%) | 39 (1.0%) |
| No Fuel Used | 84 (0.9%) | 28 (0.7%) |
| Total | 9,011 (100.0%) | 4,055 (100.0%) |
Household Vehicle Usage in Sheridan County
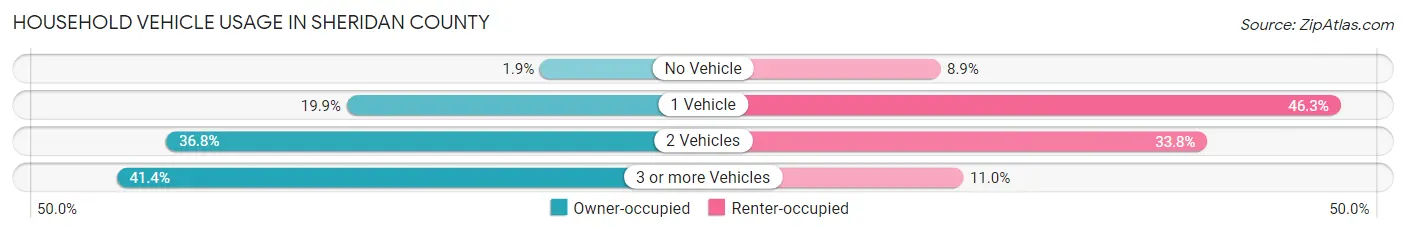
| Vehicles per Household | Owner-occupied | Renter-occupied |
| No Vehicle | 169 (1.9%) | 360 (8.9%) |
| 1 Vehicle | 1,795 (19.9%) | 1,876 (46.3%) |
| 2 Vehicles | 3,315 (36.8%) | 1,372 (33.8%) |
| 3 or more Vehicles | 3,732 (41.4%) | 447 (11.0%) |
| Total | 9,011 (100.0%) | 4,055 (100.0%) |
Real Estate & Mortgages in Sheridan County
Real Estate and Mortgage Overview in Sheridan County
| Characteristic | Without Mortgage | With Mortgage |
| Housing Units | 3,934 | 5,077 |
| Median Property Value | $283,400 | $369,400 |
| Median Household Income | $56,538 | $1,169 |
| Monthly Housing Costs | $530 | $531 |
| Real Estate Taxes | $1,721 | $180 |
Property Value by Mortgage Status in Sheridan County

| Property Value | Without Mortgage | With Mortgage |
| Less than $50,000 | 342 (8.7%) | 34 (0.7%) |
| $50,000 to $99,999 | 212 (5.4%) | 9 (0.2%) |
| $100,000 to $299,999 | 1,533 (39.0%) | 1,643 (32.4%) |
| $300,000 to $499,999 | 877 (22.3%) | 1,946 (38.3%) |
| $500,000 to $749,999 | 490 (12.5%) | 969 (19.1%) |
| $750,000 to $999,999 | 158 (4.0%) | 159 (3.1%) |
| $1,000,000 or more | 322 (8.2%) | 317 (6.2%) |
| Total | 3,934 (100.0%) | 5,077 (100.0%) |
Household Income by Mortgage Status in Sheridan County
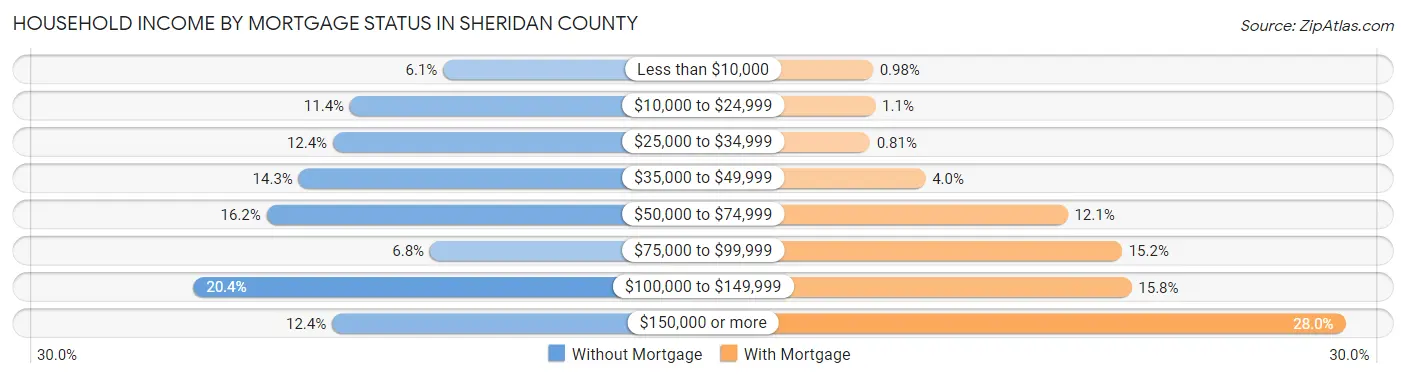
| Household Income | Without Mortgage | With Mortgage |
| Less than $10,000 | 239 (6.1%) | 50 (1.0%) |
| $10,000 to $24,999 | 449 (11.4%) | 57 (1.1%) |
| $25,000 to $34,999 | 487 (12.4%) | 41 (0.8%) |
| $35,000 to $49,999 | 564 (14.3%) | 202 (4.0%) |
| $50,000 to $74,999 | 636 (16.2%) | 615 (12.1%) |
| $75,000 to $99,999 | 269 (6.8%) | 772 (15.2%) |
| $100,000 to $149,999 | 801 (20.4%) | 800 (15.8%) |
| $150,000 or more | 489 (12.4%) | 1,421 (28.0%) |
| Total | 3,934 (100.0%) | 5,077 (100.0%) |
Property Value to Household Income Ratio in Sheridan County
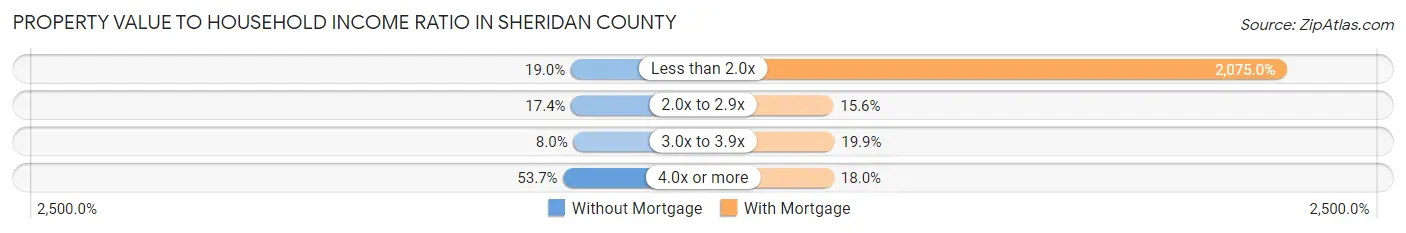
| Value-to-Income Ratio | Without Mortgage | With Mortgage |
| Less than 2.0x | 749 (19.0%) | 105,347 (2,075.0%) |
| 2.0x to 2.9x | 683 (17.4%) | 791 (15.6%) |
| 3.0x to 3.9x | 313 (8.0%) | 1,012 (19.9%) |
| 4.0x or more | 2,111 (53.7%) | 915 (18.0%) |
| Total | 3,934 (100.0%) | 5,077 (100.0%) |
Real Estate Taxes by Mortgage Status in Sheridan County
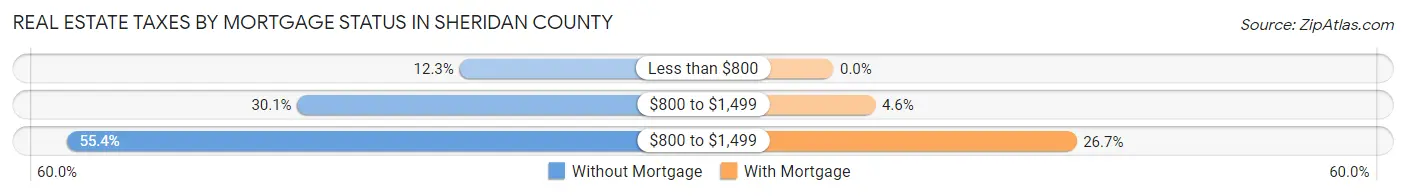
| Property Taxes | Without Mortgage | With Mortgage |
| Less than $800 | 485 (12.3%) | 0 (0.0%) |
| $800 to $1,499 | 1,184 (30.1%) | 233 (4.6%) |
| $800 to $1,499 | 2,180 (55.4%) | 1,353 (26.7%) |
| Total | 3,934 (100.0%) | 5,077 (100.0%) |
Health & Disability in Sheridan County
Health Insurance Coverage by Age in Sheridan County
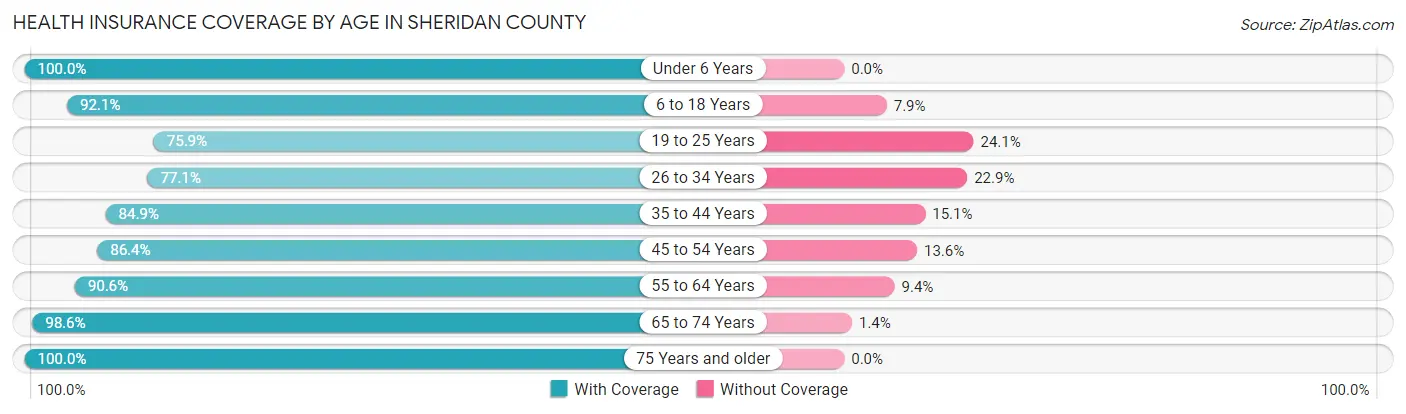
| Age Bracket | With Coverage | Without Coverage |
| Under 6 Years | 1,798 (100.0%) | 0 (0.0%) |
| 6 to 18 Years | 4,790 (92.1%) | 412 (7.9%) |
| 19 to 25 Years | 1,848 (75.9%) | 587 (24.1%) |
| 26 to 34 Years | 2,302 (77.1%) | 685 (22.9%) |
| 35 to 44 Years | 3,315 (84.9%) | 590 (15.1%) |
| 45 to 54 Years | 3,092 (86.4%) | 485 (13.6%) |
| 55 to 64 Years | 3,950 (90.6%) | 409 (9.4%) |
| 65 to 74 Years | 4,028 (98.6%) | 59 (1.4%) |
| 75 Years and older | 2,441 (100.0%) | 0 (0.0%) |
| Total | 27,564 (89.5%) | 3,227 (10.5%) |
Health Insurance Coverage by Citizenship Status in Sheridan County
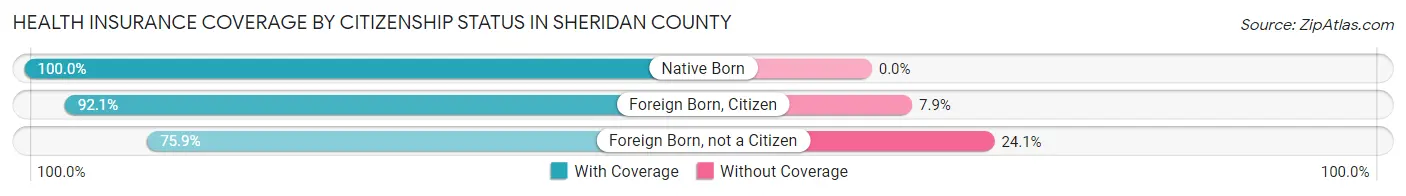
| Citizenship Status | With Coverage | Without Coverage |
| Native Born | 1,798 (100.0%) | 0 (0.0%) |
| Foreign Born, Citizen | 4,790 (92.1%) | 412 (7.9%) |
| Foreign Born, not a Citizen | 1,848 (75.9%) | 587 (24.1%) |
Health Insurance Coverage by Household Income in Sheridan County
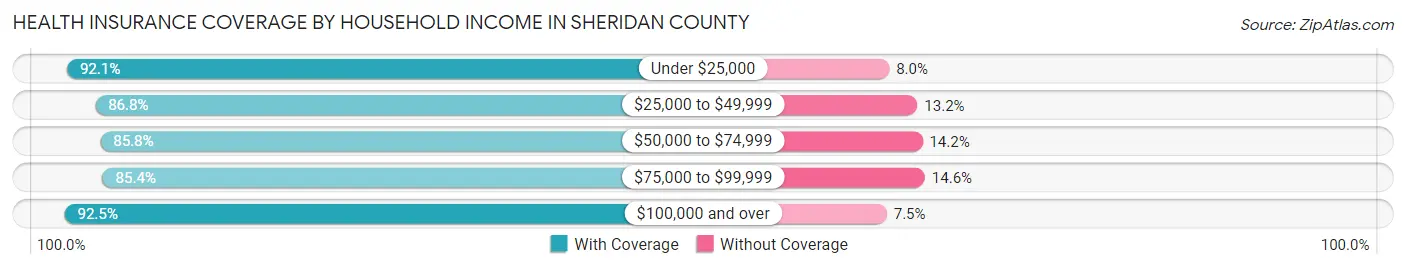
| Household Income | With Coverage | Without Coverage |
| Under $25,000 | 2,478 (92.0%) | 214 (8.0%) |
| $25,000 to $49,999 | 4,113 (86.8%) | 627 (13.2%) |
| $50,000 to $74,999 | 3,899 (85.8%) | 644 (14.2%) |
| $75,000 to $99,999 | 3,255 (85.4%) | 558 (14.6%) |
| $100,000 and over | 13,408 (92.5%) | 1,085 (7.5%) |
Public vs Private Health Insurance Coverage by Age in Sheridan County
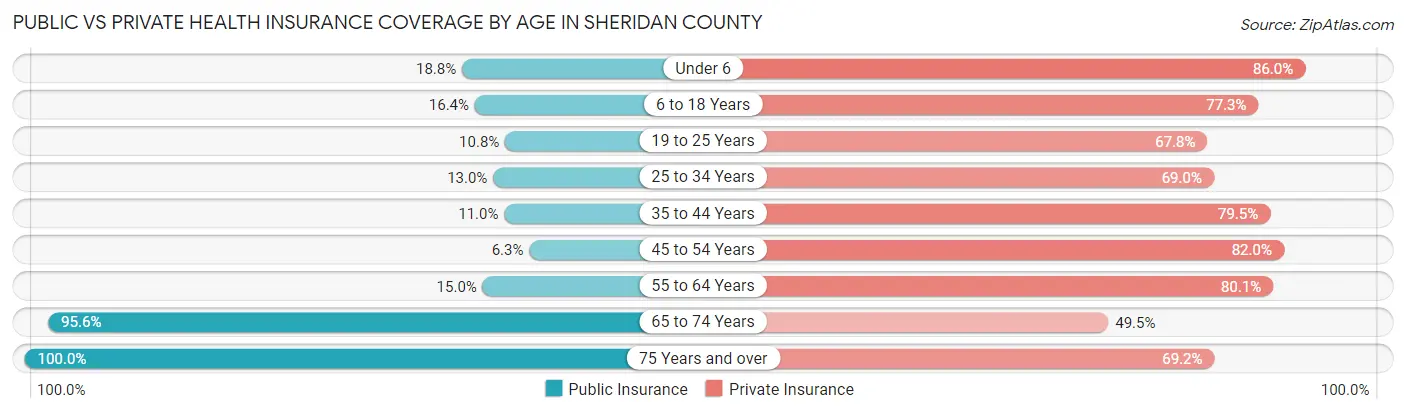
| Age Bracket | Public Insurance | Private Insurance |
| Under 6 | 338 (18.8%) | 1,546 (86.0%) |
| 6 to 18 Years | 854 (16.4%) | 4,022 (77.3%) |
| 19 to 25 Years | 263 (10.8%) | 1,652 (67.8%) |
| 25 to 34 Years | 389 (13.0%) | 2,062 (69.0%) |
| 35 to 44 Years | 428 (11.0%) | 3,104 (79.5%) |
| 45 to 54 Years | 226 (6.3%) | 2,934 (82.0%) |
| 55 to 64 Years | 653 (15.0%) | 3,490 (80.1%) |
| 65 to 74 Years | 3,908 (95.6%) | 2,022 (49.5%) |
| 75 Years and over | 2,441 (100.0%) | 1,688 (69.2%) |
| Total | 9,500 (30.8%) | 22,520 (73.1%) |
Disability Status by Sex by Age in Sheridan County
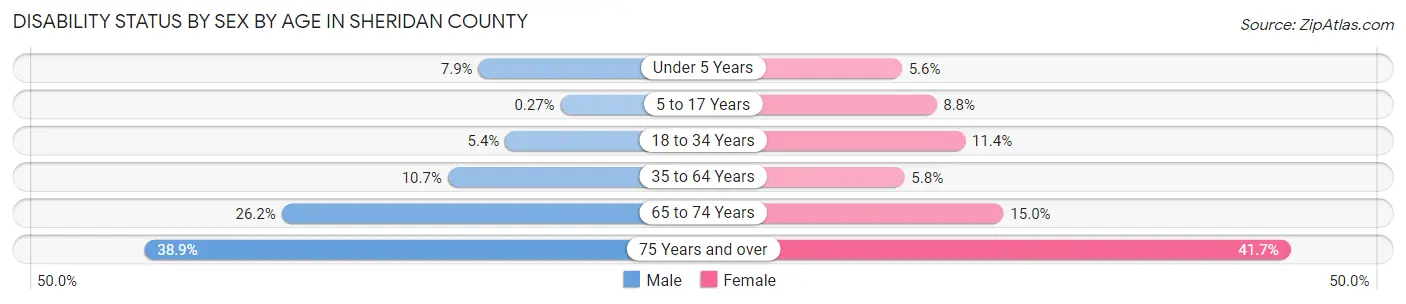
| Age Bracket | Male | Female |
| Under 5 Years | 56 (7.9%) | 41 (5.6%) |
| 5 to 17 Years | 7 (0.3%) | 232 (8.8%) |
| 18 to 34 Years | 156 (5.4%) | 326 (11.4%) |
| 35 to 64 Years | 650 (10.7%) | 336 (5.8%) |
| 65 to 74 Years | 530 (26.2%) | 309 (15.0%) |
| 75 Years and over | 430 (38.9%) | 556 (41.6%) |
Disability Class by Sex by Age in Sheridan County
Disability Class: Hearing Difficulty
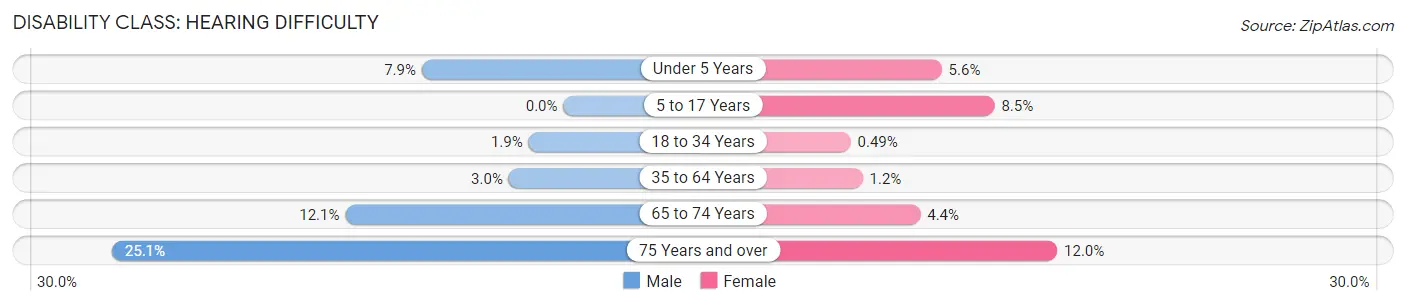
| Age Bracket | Male | Female |
| Under 5 Years | 56 (7.9%) | 41 (5.6%) |
| 5 to 17 Years | 0 (0.0%) | 225 (8.5%) |
| 18 to 34 Years | 56 (1.9%) | 14 (0.5%) |
| 35 to 64 Years | 184 (3.0%) | 67 (1.2%) |
| 65 to 74 Years | 246 (12.1%) | 90 (4.4%) |
| 75 Years and over | 278 (25.1%) | 160 (12.0%) |
Disability Class: Vision Difficulty
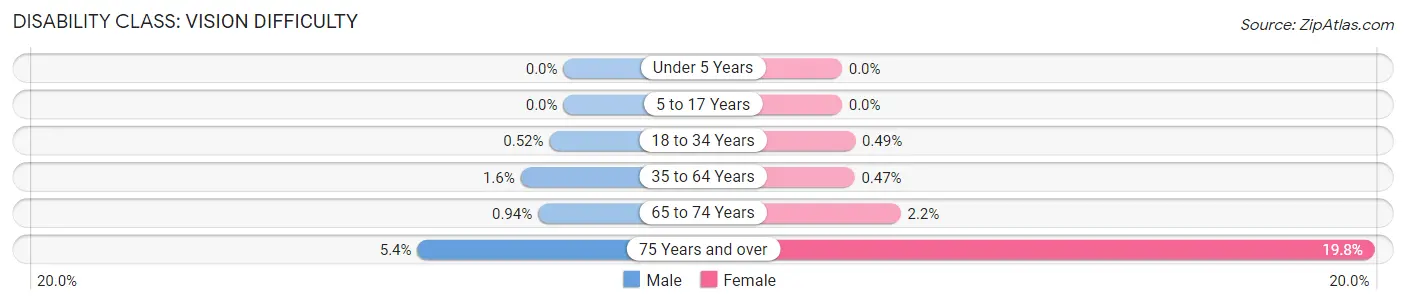
| Age Bracket | Male | Female |
| Under 5 Years | 0 (0.0%) | 0 (0.0%) |
| 5 to 17 Years | 0 (0.0%) | 0 (0.0%) |
| 18 to 34 Years | 15 (0.5%) | 14 (0.5%) |
| 35 to 64 Years | 96 (1.6%) | 27 (0.5%) |
| 65 to 74 Years | 19 (0.9%) | 45 (2.2%) |
| 75 Years and over | 60 (5.4%) | 264 (19.8%) |
Disability Class: Cognitive Difficulty
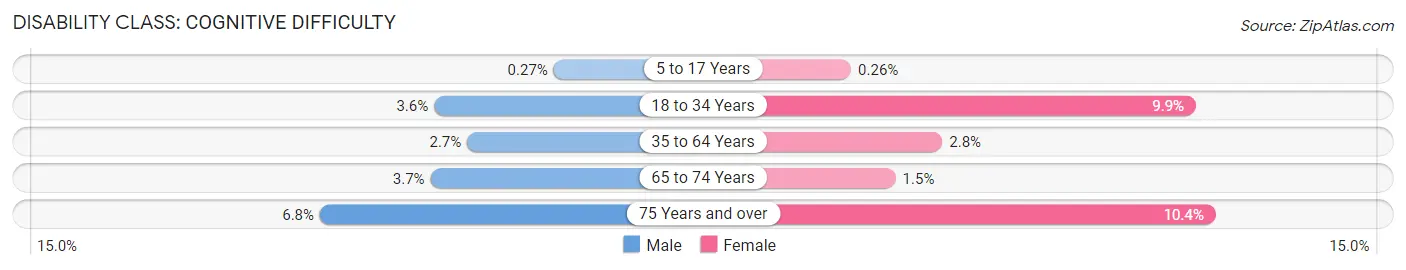
| Age Bracket | Male | Female |
| 5 to 17 Years | 7 (0.3%) | 7 (0.3%) |
| 18 to 34 Years | 104 (3.6%) | 281 (9.9%) |
| 35 to 64 Years | 162 (2.7%) | 162 (2.8%) |
| 65 to 74 Years | 75 (3.7%) | 31 (1.5%) |
| 75 Years and over | 75 (6.8%) | 139 (10.4%) |
Disability Class: Ambulatory Difficulty
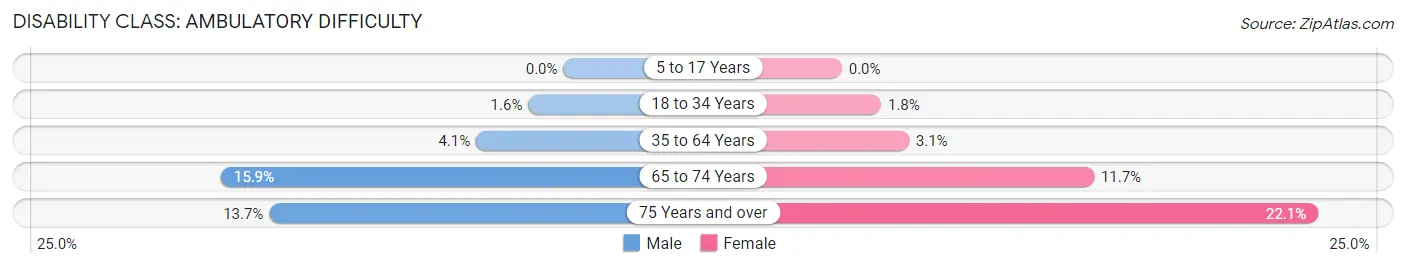
| Age Bracket | Male | Female |
| 5 to 17 Years | 0 (0.0%) | 0 (0.0%) |
| 18 to 34 Years | 47 (1.6%) | 52 (1.8%) |
| 35 to 64 Years | 245 (4.1%) | 180 (3.1%) |
| 65 to 74 Years | 322 (15.9%) | 241 (11.7%) |
| 75 Years and over | 151 (13.7%) | 295 (22.1%) |
Disability Class: Self-Care Difficulty
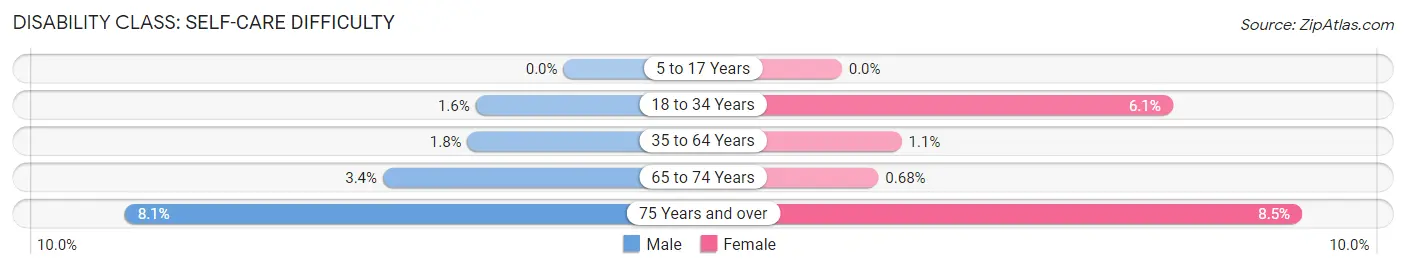
| Age Bracket | Male | Female |
| 5 to 17 Years | 0 (0.0%) | 0 (0.0%) |
| 18 to 34 Years | 47 (1.6%) | 175 (6.1%) |
| 35 to 64 Years | 108 (1.8%) | 64 (1.1%) |
| 65 to 74 Years | 68 (3.4%) | 14 (0.7%) |
| 75 Years and over | 90 (8.1%) | 114 (8.5%) |
Technology Access in Sheridan County
Computing Device Access in Sheridan County
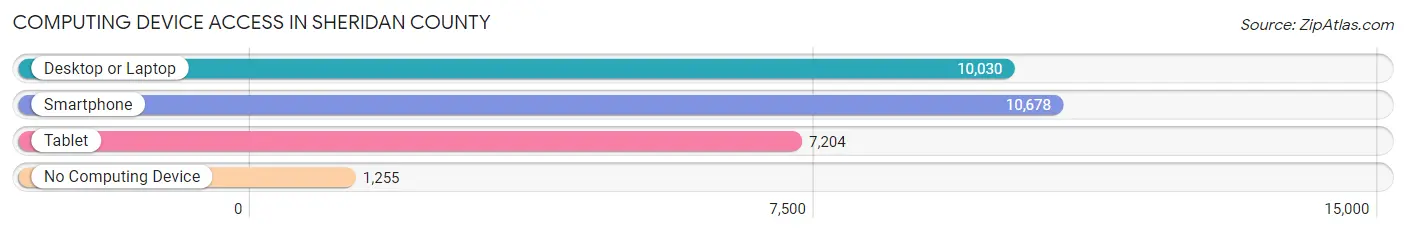
| Device Type | # Households | % Households |
| Desktop or Laptop | 10,030 | 76.8% |
| Smartphone | 10,678 | 81.7% |
| Tablet | 7,204 | 55.1% |
| No Computing Device | 1,255 | 9.6% |
| Total | 13,066 | 100.0% |
Internet Access in Sheridan County
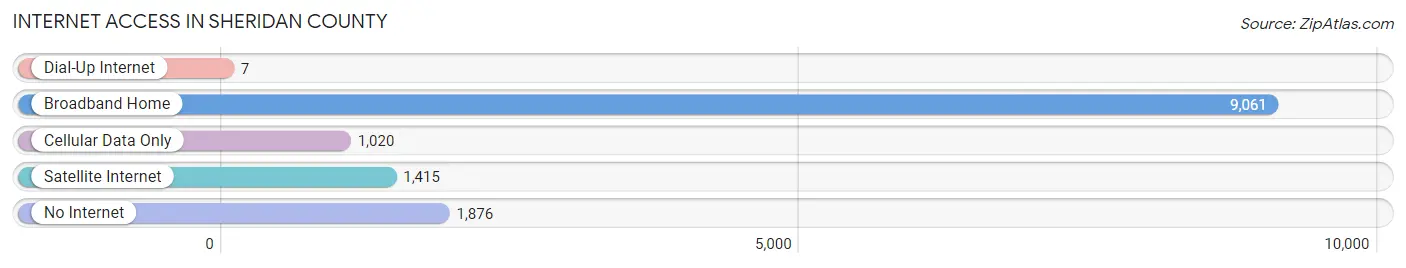
| Internet Type | # Households | % Households |
| Dial-Up Internet | 7 | 0.1% |
| Broadband Home | 9,061 | 69.4% |
| Cellular Data Only | 1,020 | 7.8% |
| Satellite Internet | 1,415 | 10.8% |
| No Internet | 1,876 | 14.4% |
| Total | 13,066 | 100.0% |
Sheridan County Summary
Sheridan County, Wyoming is located in the northern part of the state and is bordered by Johnson County to the north, Campbell County to the east, Big Horn County to the south, and Montana to the west. The county seat is Sheridan, and the county has a total area of 2,521 square miles. As of the 2010 census, the population was 29,116, making it the fifth most populous county in Wyoming.
History
Sheridan County was established in 1888 and named after General Philip Sheridan, a Civil War hero. The county was originally part of Johnson County, but was split off in 1888. The county was originally populated by Native American tribes, including the Crow, Cheyenne, and Sioux. The first settlers in the area were ranchers and farmers, who began arriving in the late 19th century.
The county was an important part of the cattle industry in the late 19th and early 20th centuries. The first railroad in the county was built in 1892, connecting Sheridan to Billings, Montana. The railroad allowed for the transportation of cattle and other goods to and from the county.
The county was also an important part of the oil industry in the early 20th century. Oil was discovered in the county in 1915, and the first oil well was drilled in 1916. The oil industry in the county continued to grow throughout the 20th century, and today the county is home to several oil and gas companies.
Geography
Sheridan County is located in the northern part of Wyoming, and is bordered by Johnson County to the north, Campbell County to the east, Big Horn County to the south, and Montana to the west. The county has a total area of 2,521 square miles, and is mostly covered by grasslands and rolling hills. The county is home to several mountain ranges, including the Bighorn Mountains, the Pryor Mountains, and the Wolf Mountains.
The county is home to several rivers and streams, including the Tongue River, the Little Bighorn River, and the Powder River. The county is also home to several lakes, including Lake DeSmet, Lake DeSmet, and Lake DeSmet.
Economy
The economy of Sheridan County is largely based on agriculture, oil and gas, and tourism. The county is home to several large agricultural operations, including cattle ranches, wheat farms, and hay farms. The county is also home to several oil and gas companies, and is an important part of the oil and gas industry in Wyoming.
The county is also home to several tourist attractions, including the Bighorn National Forest, the Bighorn Mountains, and the Tongue River. The county is also home to several museums, including the Sheridan County Museum and the Sheridan County Historical Society.
Demographics
As of the 2010 census, the population of Sheridan County was 29,116. The population is largely white (90.3%), with small percentages of Native American (2.2%), African American (1.2%), Asian (0.7%), and Hispanic or Latino (3.3%). The median household income in the county is $50,945, and the median home value is $179,400. The county has a poverty rate of 11.3%.
Common Questions
What is the Total Population of Sheridan County?
Total Population of Sheridan County is 31,176.
What is the Total Male Population of Sheridan County?
Total Male Population of Sheridan County is 15,564.
What is the Total Female Population of Sheridan County?
Total Female Population of Sheridan County is 15,612.
What is the Ratio of Males per 100 Females in Sheridan County?
There are 99.69 Males per 100 Females in Sheridan County.
What is the Ratio of Females per 100 Males in Sheridan County?
There are 100.31 Females per 100 Males in Sheridan County.
What is the Median Population Age in Sheridan County?
Median Population Age in Sheridan County is 42.8 Years.
What is the Average Family Size in Sheridan County
Average Family Size in Sheridan County is 3.0 People.
What is the Average Household Size in Sheridan County
Average Household Size in Sheridan County is 2.3 People.
What is Per Capita Income in Sheridan County?
Per Capita income in Sheridan County is $39,656.
What is the Median Family Income in Sheridan County?
Median Family Income in Sheridan County is $102,226.
What is the Median Household income in Sheridan County?
Median Household Income in Sheridan County is $68,898.
What is Income or Wage Gap in Sheridan County?
Income or Wage Gap in Sheridan County is 43.7%.
Women in Sheridan County earn 56.3 cents for every dollar earned by a man.
What is Family Income Deficit in Sheridan County?
Family Income Deficit in Sheridan County is $13,247.
Families that are below poverty line in Sheridan County earn $13,247 less on average than the poverty threshold level.
What is Inequality or Gini Index in Sheridan County?
Inequality or Gini Index in Sheridan County is 0.44.
How Large is the Labor Force in Sheridan County?
There are 16,072 People in the Labor Forcein in Sheridan County.
What is the Percentage of People in the Labor Force in Sheridan County?
63.8% of People are in the Labor Force in Sheridan County.
What is the Unemployment Rate in Sheridan County?
Unemployment Rate in Sheridan County is 3.0%.