Platte County, WY
Platte County Map
Platte County Overview
8,618
TOTAL POPULATION
4,406
MALE POPULATION
4,212
FEMALE POPULATION
104.61
MALES / 100 FEMALES
95.60
FEMALES / 100 MALES
49.1
MEDIAN AGE
2.8
AVG FAMILY SIZE
2.2
AVG HOUSEHOLD SIZE
$37,756
PER CAPITA INCOME
$87,321
AVG FAMILY INCOME
$64,753
AVG HOUSEHOLD INCOME
34.4%
WAGE / INCOME GAP [ % ]
65.6¢/ $1
WAGE / INCOME GAP [ $ ]
$8,164
FAMILY INCOME DEFICIT
0.44
INEQUALITY / GINI INDEX
3,854
LABOR FORCE [ PEOPLE ]
53.6%
PERCENT IN LABOR FORCE
4.0%
UNEMPLOYMENT RATE
Platte County Area Codes
Race in Platte County
The most populous races in Platte County are White / Caucasian (7,564 | 87.8%), Two or more Races (933 | 10.8%), and Hispanic or Latino (727 | 8.4%).

| Race | # Population | % Population |
| Asian | 0 | 0.0% |
| Black / African American | 47 | 0.5% |
| Hawaiian / Pacific | 42 | 0.5% |
| Hispanic or Latino | 727 | 8.4% |
| Native / Alaskan | 6 | 0.1% |
| White / Caucasian | 7,564 | 87.8% |
| Two or more Races | 933 | 10.8% |
| Some other Race | 26 | 0.3% |
| Total | 8,618 | 100.0% |
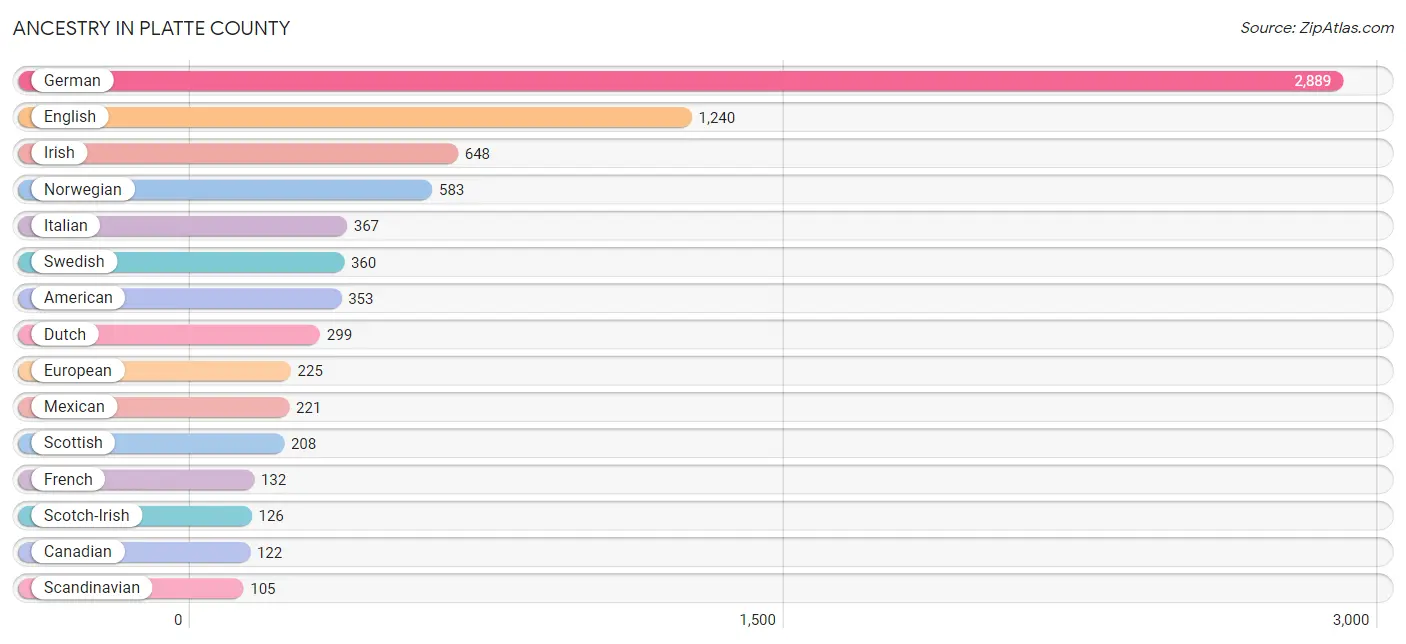
Ancestry in Platte County
The most populous ancestries reported in Platte County are German (2,889 | 33.5%), English (1,240 | 14.4%), Irish (648 | 7.5%), Norwegian (583 | 6.8%), and Italian (367 | 4.3%), together accounting for 66.4% of all Platte County residents.
| Ancestry | # Population | % Population |
| American | 353 | 4.1% |
| Arapaho | 6 | 0.1% |
| Basque | 4 | 0.1% |
| Belgian | 36 | 0.4% |
| Blackfeet | 8 | 0.1% |
| British | 4 | 0.1% |
| Canadian | 122 | 1.4% |
| Central American | 46 | 0.5% |
| Cherokee | 95 | 1.1% |
| Czech | 40 | 0.5% |
| Czechoslovakian | 2 | 0.0% |
| Danish | 100 | 1.2% |
| Dutch | 299 | 3.5% |
| Eastern European | 79 | 0.9% |
| English | 1,240 | 14.4% |
| European | 225 | 2.6% |
| French | 132 | 1.5% |
| French Canadian | 41 | 0.5% |
| German | 2,889 | 33.5% |
| Greek | 37 | 0.4% |
| Guatemalan | 46 | 0.5% |
| Irish | 648 | 7.5% |
| Italian | 367 | 4.3% |
| Korean | 3 | 0.0% |
| Latvian | 9 | 0.1% |
| Mexican | 221 | 2.6% |
| Native Hawaiian | 42 | 0.5% |
| Norwegian | 583 | 6.8% |
| Pennsylvania German | 9 | 0.1% |
| Polish | 66 | 0.8% |
| Russian | 4 | 0.1% |
| Scandinavian | 105 | 1.2% |
| Scotch-Irish | 126 | 1.5% |
| Scottish | 208 | 2.4% |
| Sioux | 12 | 0.1% |
| Slavic | 2 | 0.0% |
| Slovene | 16 | 0.2% |
| Spanish | 53 | 0.6% |
| Swedish | 360 | 4.2% |
| Swiss | 18 | 0.2% |
| Ukrainian | 13 | 0.2% |
| Welsh | 20 | 0.2% | View All 42 Rows |
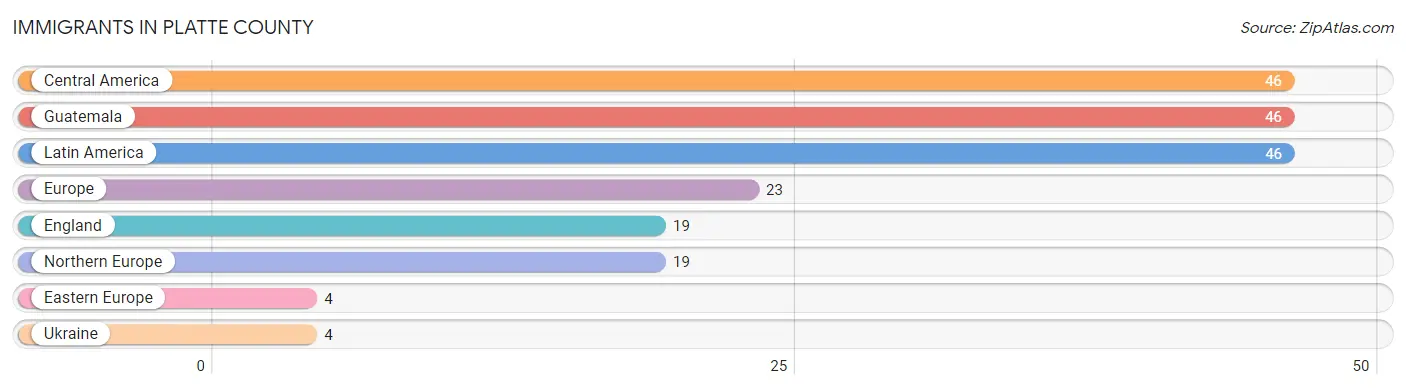
Immigrants in Platte County
The most numerous immigrant groups reported in Platte County came from Central America (46 | 0.5%), Guatemala (46 | 0.5%), Latin America (46 | 0.5%), Europe (23 | 0.3%), and England (19 | 0.2%), together accounting for 2.1% of all Platte County residents.
| Immigration Origin | # Population | % Population |
| Central America | 46 | 0.5% |
| Eastern Europe | 4 | 0.1% |
| England | 19 | 0.2% |
| Europe | 23 | 0.3% |
| Guatemala | 46 | 0.5% |
| Latin America | 46 | 0.5% |
| Northern Europe | 19 | 0.2% |
| Ukraine | 4 | 0.1% | View All 8 Rows |
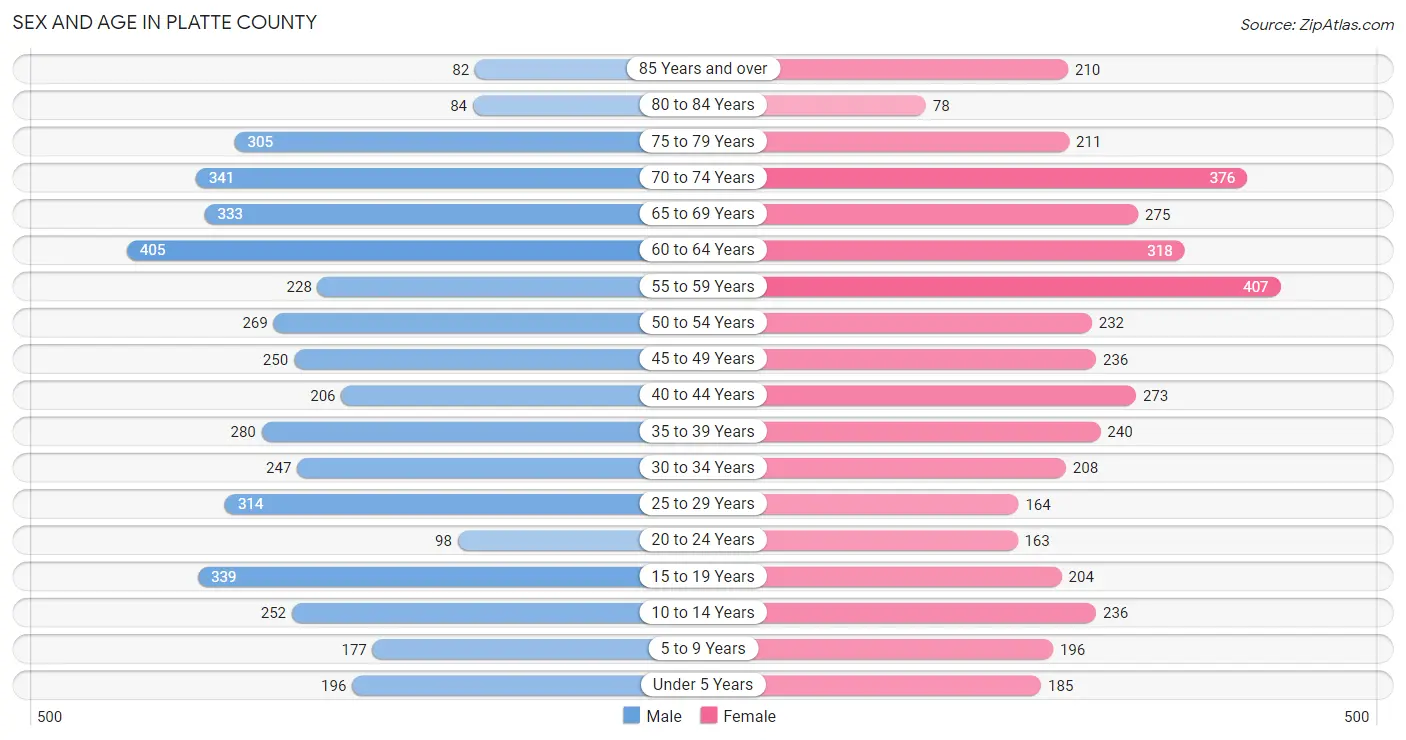
Sex and Age in Platte County
Sex and Age in Platte County
The most populous age groups in Platte County are 60 to 64 Years (405 | 9.2%) for men and 55 to 59 Years (407 | 9.7%) for women.
| Age Bracket | Male | Female |
| Under 5 Years | 196 (4.4%) | 185 (4.4%) |
| 5 to 9 Years | 177 (4.0%) | 196 (4.6%) |
| 10 to 14 Years | 252 (5.7%) | 236 (5.6%) |
| 15 to 19 Years | 339 (7.7%) | 204 (4.8%) |
| 20 to 24 Years | 98 (2.2%) | 163 (3.9%) |
| 25 to 29 Years | 314 (7.1%) | 164 (3.9%) |
| 30 to 34 Years | 247 (5.6%) | 208 (4.9%) |
| 35 to 39 Years | 280 (6.4%) | 240 (5.7%) |
| 40 to 44 Years | 206 (4.7%) | 273 (6.5%) |
| 45 to 49 Years | 250 (5.7%) | 236 (5.6%) |
| 50 to 54 Years | 269 (6.1%) | 232 (5.5%) |
| 55 to 59 Years | 228 (5.2%) | 407 (9.7%) |
| 60 to 64 Years | 405 (9.2%) | 318 (7.5%) |
| 65 to 69 Years | 333 (7.6%) | 275 (6.5%) |
| 70 to 74 Years | 341 (7.7%) | 376 (8.9%) |
| 75 to 79 Years | 305 (6.9%) | 211 (5.0%) |
| 80 to 84 Years | 84 (1.9%) | 78 (1.8%) |
| 85 Years and over | 82 (1.9%) | 210 (5.0%) |
| Total | 4,406 (100.0%) | 4,212 (100.0%) |
Families and Households in Platte County
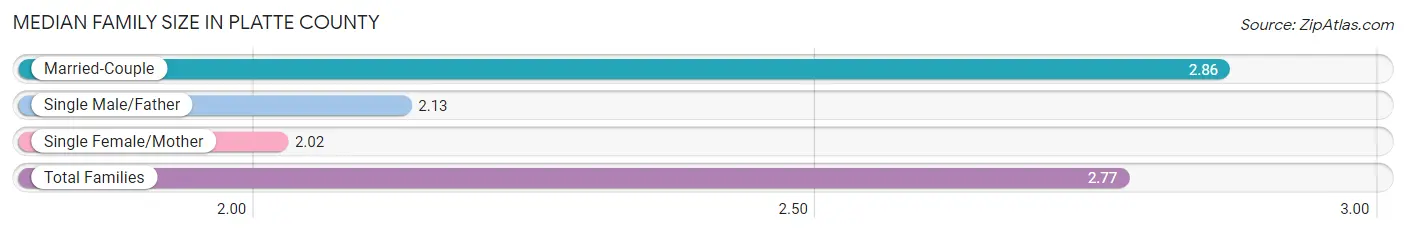
Median Family Size in Platte County
The median family size in Platte County is 2.77 persons per family, with married-couple families (2,089 | 88.8%) accounting for the largest median family size of 2.86 persons per family. On the other hand, single female/mother families (188 | 8.0%) represent the smallest median family size with 2.02 persons per family.
| Family Type | # Families | Family Size |
| Married-Couple | 2,089 (88.8%) | 2.86 |
| Single Male/Father | 75 (3.2%) | 2.13 |
| Single Female/Mother | 188 (8.0%) | 2.02 |
| Total Families | 2,352 (100.0%) | 2.77 |
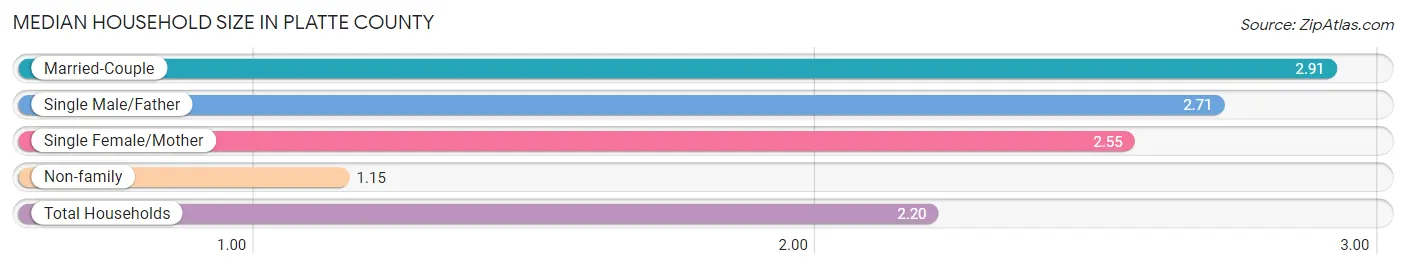
Median Household Size in Platte County
The median household size in Platte County is 2.20 persons per household, with married-couple households (2,089 | 54.1%) accounting for the largest median household size of 2.91 persons per household. non-family households (1,509 | 39.1%) represent the smallest median household size with 1.15 persons per household.
| Household Type | # Households | Household Size |
| Married-Couple | 2,089 (54.1%) | 2.91 |
| Single Male/Father | 75 (1.9%) | 2.71 |
| Single Female/Mother | 188 (4.9%) | 2.55 |
| Non-family | 1,509 (39.1%) | 1.15 |
| Total Households | 3,861 (100.0%) | 2.20 |
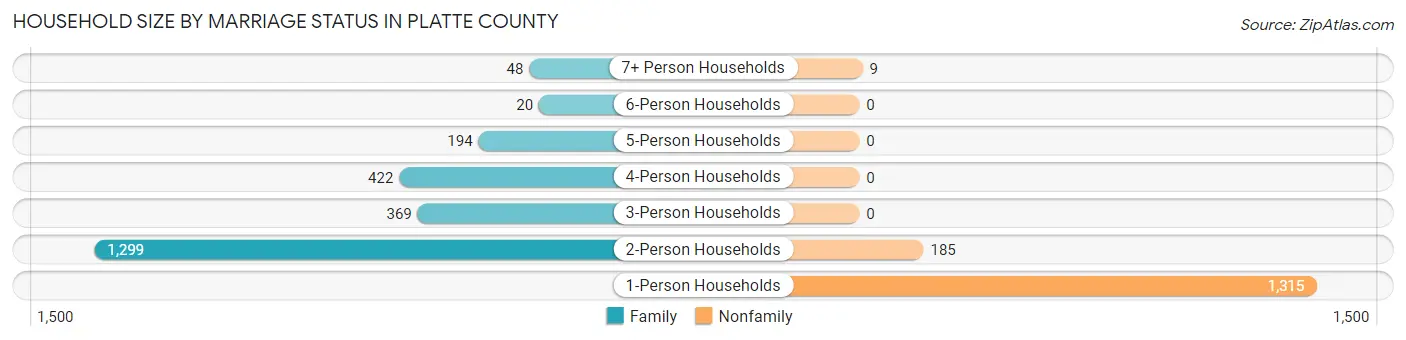
Household Size by Marriage Status in Platte County
Out of a total of 3,861 households in Platte County, 2,352 (60.9%) are family households, while 1,509 (39.1%) are nonfamily households. The most numerous type of family households are 2-person households, comprising 1,299, and the most common type of nonfamily households are 1-person households, comprising 1,315.
| Household Size | Family Households | Nonfamily Households |
| 1-Person Households | - | 1,315 (34.1%) |
| 2-Person Households | 1,299 (33.6%) | 185 (4.8%) |
| 3-Person Households | 369 (9.6%) | 0 (0.0%) |
| 4-Person Households | 422 (10.9%) | 0 (0.0%) |
| 5-Person Households | 194 (5.0%) | 0 (0.0%) |
| 6-Person Households | 20 (0.5%) | 0 (0.0%) |
| 7+ Person Households | 48 (1.2%) | 9 (0.2%) |
| Total | 2,352 (60.9%) | 1,509 (39.1%) |
Female Fertility in Platte County
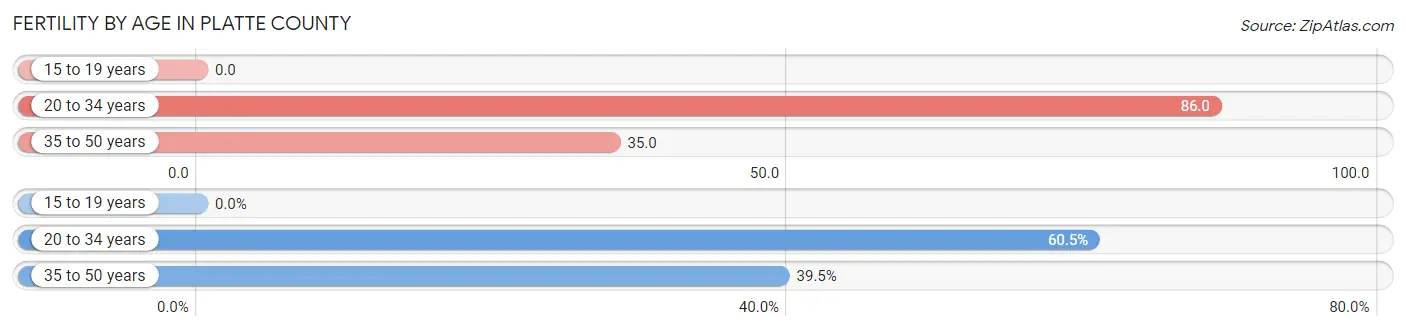
Fertility by Age in Platte County
Average fertility rate in Platte County is 48.0 births per 1,000 women. Women in the age bracket of 20 to 34 years have the highest fertility rate with 86.0 births per 1,000 women. Women in the age bracket of 20 to 34 years acount for 60.5% of all women with births.
| Age Bracket | Women with Births | Births / 1,000 Women |
| 15 to 19 years | 0 (0.0%) | 0.0 |
| 20 to 34 years | 46 (60.5%) | 86.0 |
| 35 to 50 years | 30 (39.5%) | 35.0 |
| Total | 76 (100.0%) | 48.0 |
Fertility by Age by Marriage Status in Platte County
90.8% of women with births (76) in Platte County are married. The highest percentage of unmarried women with births falls into 35 to 50 years age bracket with 23.3% of them unmarried at the time of birth, while the lowest percentage of unmarried women with births belong to 20 to 34 years age bracket with 0.0% of them unmarried.
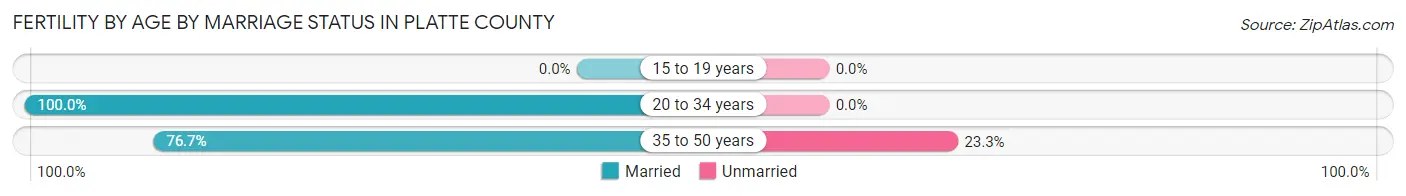
| Age Bracket | Married | Unmarried |
| 15 to 19 years | 0 (0.0%) | 0 (0.0%) |
| 20 to 34 years | 46 (100.0%) | 0 (0.0%) |
| 35 to 50 years | 23 (76.7%) | 7 (23.3%) |
| Total | 69 (90.8%) | 7 (9.2%) |
Fertility by Education in Platte County
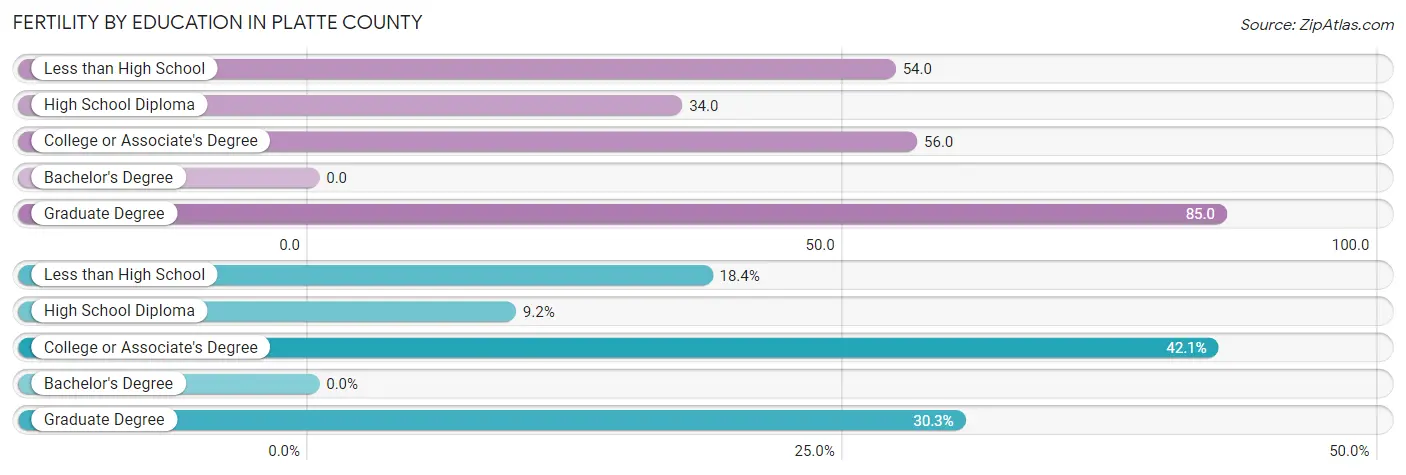
| Educational Attainment | Women with Births | Births / 1,000 Women |
| Less than High School | 14 (18.4%) | 54.0 |
| High School Diploma | 7 (9.2%) | 34.0 |
| College or Associate's Degree | 32 (42.1%) | 56.0 |
| Bachelor's Degree | 0 (0.0%) | 0.0 |
| Graduate Degree | 23 (30.3%) | 85.0 |
| Total | 76 (100.0%) | 48.0 |
Fertility by Education by Marriage Status in Platte County
9.2% of women with births in Platte County are unmarried. Women with the educational attainment of less than high school are most likely to be married with 100.0% of them married at childbirth, while women with the educational attainment of high school diploma are least likely to be married with 100.0% of them unmarried at childbirth.
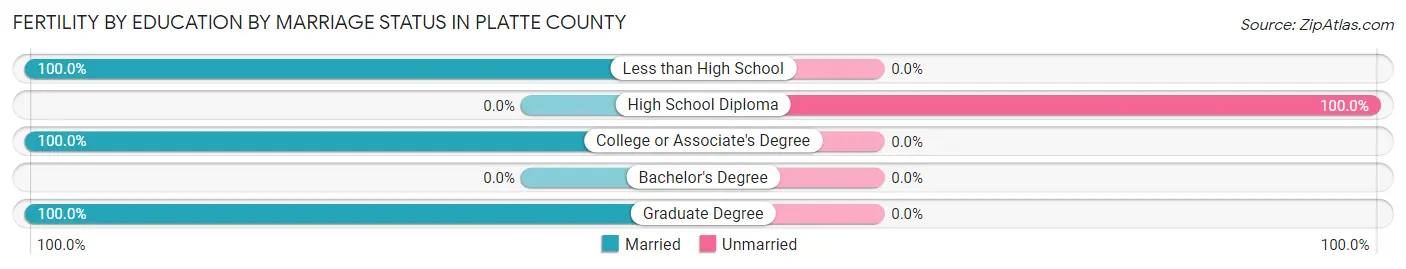
| Educational Attainment | Married | Unmarried |
| Less than High School | 14 (100.0%) | 0 (0.0%) |
| High School Diploma | 0 (0.0%) | 7 (100.0%) |
| College or Associate's Degree | 32 (100.0%) | 0 (0.0%) |
| Bachelor's Degree | 0 (0.0%) | 0 (0.0%) |
| Graduate Degree | 23 (100.0%) | 0 (0.0%) |
| Total | 69 (90.8%) | 7 (9.2%) |
Income in Platte County
Income Overview in Platte County
Per Capita Income in Platte County is $37,756, while median incomes of families and households are $87,321 and $64,753 respectively.
| Characteristic | Number | Measure |
| Per Capita Income | 8,618 | $37,756 |
| Median Family Income | 2,352 | $87,321 |
| Mean Family Income | 2,352 | $99,038 |
| Median Household Income | 3,861 | $64,753 |
| Mean Household Income | 3,861 | $85,301 |
| Income Deficit | 2,352 | $8,164 |
| Wage / Income Gap (%) | 8,618 | 34.35% |
| Wage / Income Gap ($) | 8,618 | 65.65¢ per $1 |
| Gini / Inequality Index | 8,618 | 0.44 |
Earnings by Sex in Platte County
Average Earnings in Platte County are $41,509, $45,195 for men and $29,670 for women, a difference of 34.4%.

| Sex | Number | Average Earnings |
| Male | 2,362 (55.0%) | $45,195 |
| Female | 1,934 (45.0%) | $29,670 |
| Total | 4,296 (100.0%) | $41,509 |
Earnings by Sex by Income Bracket in Platte County
The most common earnings brackets in Platte County are $100,000+ for men (329 | 13.9%) and $100,000+ for women (216 | 11.2%).
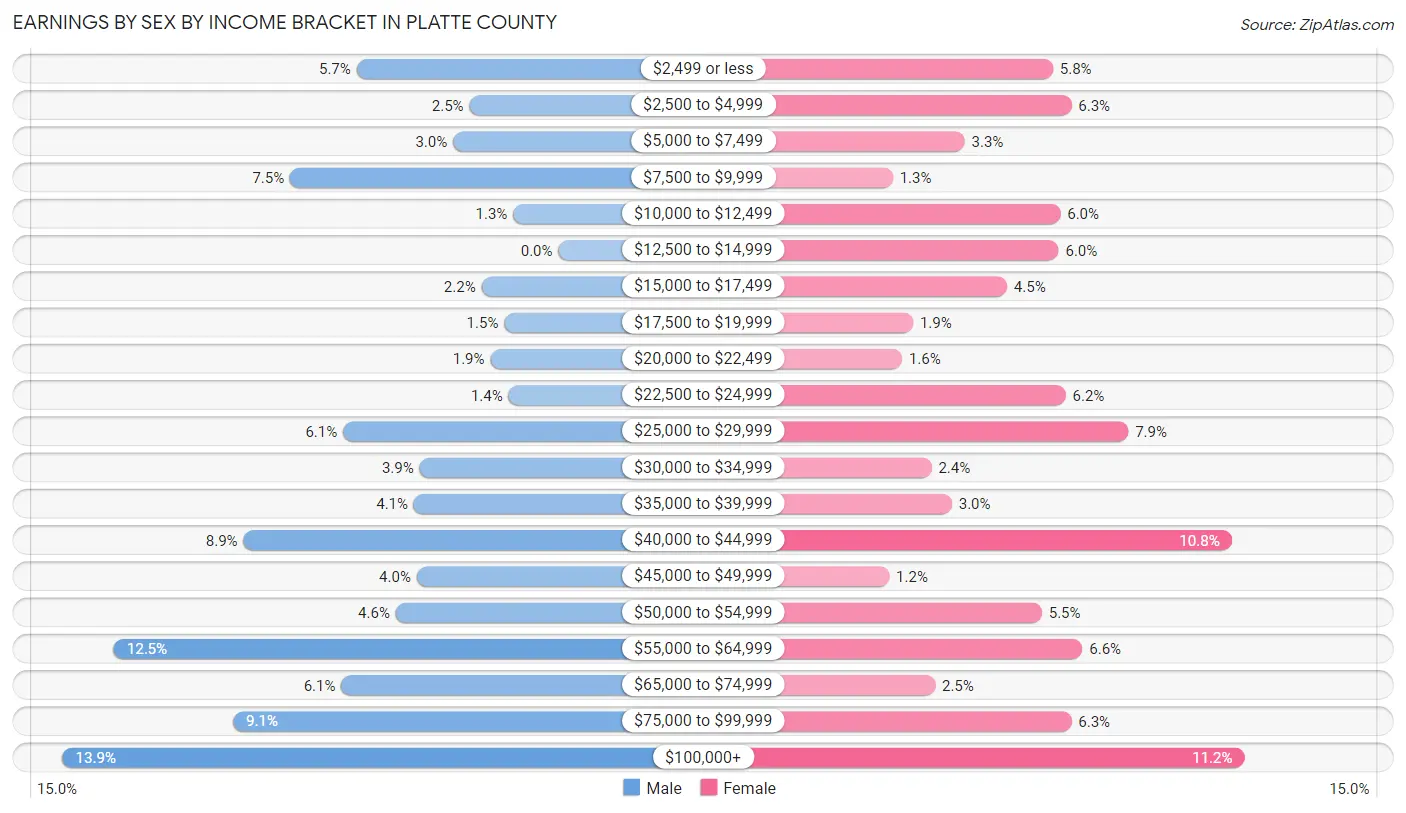
| Income | Male | Female |
| $2,499 or less | 134 (5.7%) | 112 (5.8%) |
| $2,500 to $4,999 | 59 (2.5%) | 122 (6.3%) |
| $5,000 to $7,499 | 70 (3.0%) | 64 (3.3%) |
| $7,500 to $9,999 | 178 (7.5%) | 25 (1.3%) |
| $10,000 to $12,499 | 30 (1.3%) | 116 (6.0%) |
| $12,500 to $14,999 | 0 (0.0%) | 115 (5.9%) |
| $15,000 to $17,499 | 51 (2.2%) | 87 (4.5%) |
| $17,500 to $19,999 | 36 (1.5%) | 36 (1.9%) |
| $20,000 to $22,499 | 45 (1.9%) | 30 (1.5%) |
| $22,500 to $24,999 | 33 (1.4%) | 119 (6.1%) |
| $25,000 to $29,999 | 143 (6.0%) | 153 (7.9%) |
| $30,000 to $34,999 | 92 (3.9%) | 46 (2.4%) |
| $35,000 to $39,999 | 96 (4.1%) | 57 (2.9%) |
| $40,000 to $44,999 | 209 (8.8%) | 209 (10.8%) |
| $45,000 to $49,999 | 94 (4.0%) | 23 (1.2%) |
| $50,000 to $54,999 | 108 (4.6%) | 106 (5.5%) |
| $55,000 to $64,999 | 295 (12.5%) | 128 (6.6%) |
| $65,000 to $74,999 | 144 (6.1%) | 48 (2.5%) |
| $75,000 to $99,999 | 216 (9.1%) | 122 (6.3%) |
| $100,000+ | 329 (13.9%) | 216 (11.2%) |
| Total | 2,362 (100.0%) | 1,934 (100.0%) |
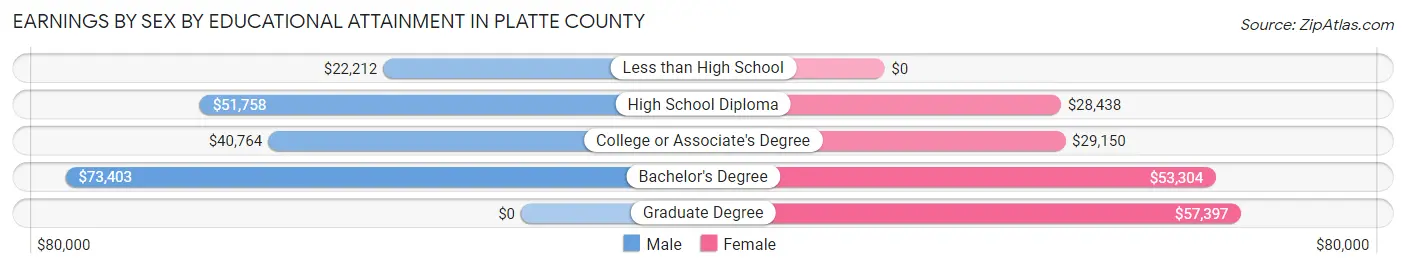
Earnings by Sex by Educational Attainment in Platte County
Average earnings in Platte County are $49,667 for men and $37,581 for women, a difference of 24.3%. Men with an educational attainment of bachelor's degree enjoy the highest average annual earnings of $73,403, while those with less than high school education earn the least with $22,212. Women with an educational attainment of graduate degree earn the most with the average annual earnings of $57,397, while those with high school diploma education have the smallest earnings of $28,438.
| Educational Attainment | Male Income | Female Income |
| Less than High School | $22,212 | $0 |
| High School Diploma | $51,758 | $28,438 |
| College or Associate's Degree | $40,764 | $29,150 |
| Bachelor's Degree | $73,403 | $53,304 |
| Graduate Degree | - | - |
| Total | $49,667 | $37,581 |
Family Income in Platte County
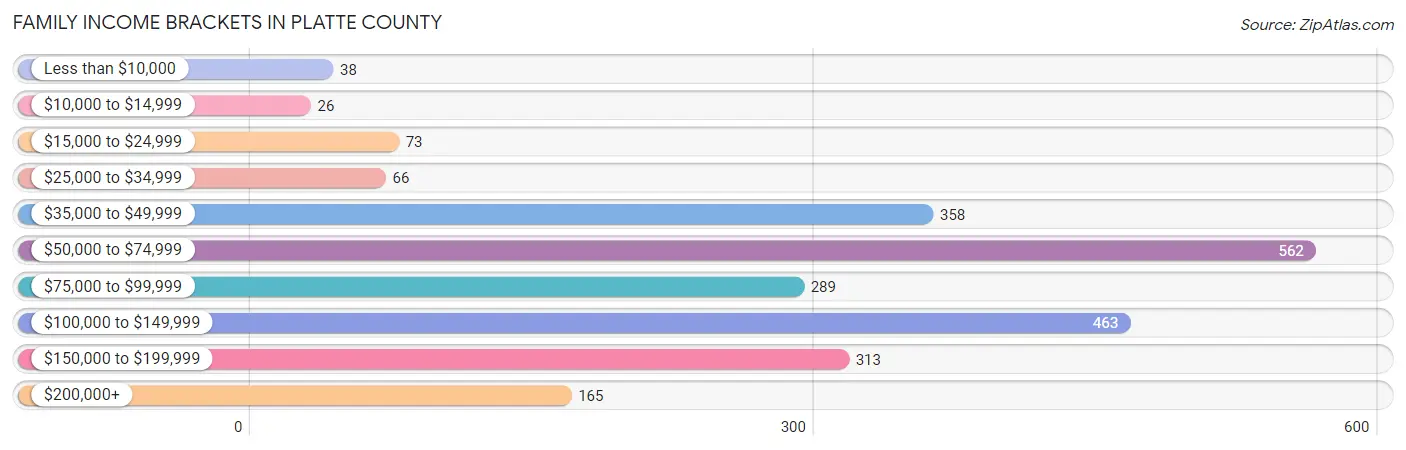
Family Income Brackets in Platte County
According to the Platte County family income data, there are 562 families falling into the $50,000 to $74,999 income range, which is the most common income bracket and makes up 23.9% of all families. Conversely, the $10,000 to $14,999 income bracket is the least frequent group with only 26 families (1.1%) belonging to this category.
| Income Bracket | # Families | % Families |
| Less than $10,000 | 38 | 1.6% |
| $10,000 to $14,999 | 26 | 1.1% |
| $15,000 to $24,999 | 73 | 3.1% |
| $25,000 to $34,999 | 66 | 2.8% |
| $35,000 to $49,999 | 358 | 15.2% |
| $50,000 to $74,999 | 562 | 23.9% |
| $75,000 to $99,999 | 289 | 12.3% |
| $100,000 to $149,999 | 463 | 19.7% |
| $150,000 to $199,999 | 313 | 13.3% |
| $200,000+ | 165 | 7.0% |
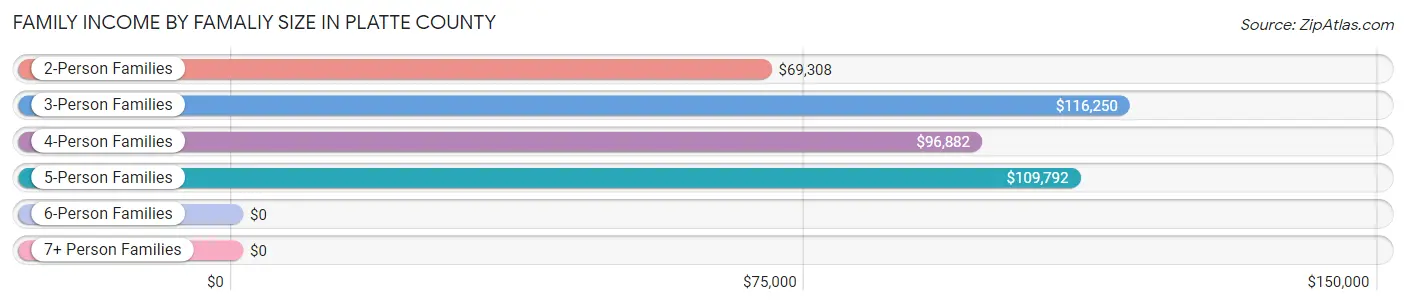
Family Income by Famaliy Size in Platte County
3-person families (358 | 15.2%) account for the highest median family income in Platte County with $116,250 per family, while 3-person families (358 | 15.2%) have the highest median income of $38,750 per family member.
| Income Bracket | # Families | Median Income |
| 2-Person Families | 1,409 (59.9%) | $69,308 |
| 3-Person Families | 358 (15.2%) | $116,250 |
| 4-Person Families | 343 (14.6%) | $96,882 |
| 5-Person Families | 175 (7.4%) | $109,792 |
| 6-Person Families | 20 (0.9%) | $0 |
| 7+ Person Families | 47 (2.0%) | $0 |
| Total | 2,352 (100.0%) | $87,321 |
Family Income by Number of Earners in Platte County
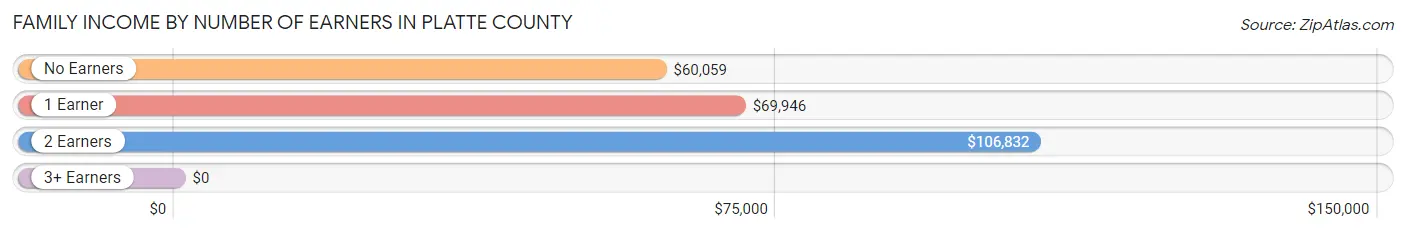
| Number of Earners | # Families | Median Income |
| No Earners | 390 (16.6%) | $60,059 |
| 1 Earner | 932 (39.6%) | $69,946 |
| 2 Earners | 829 (35.2%) | $106,832 |
| 3+ Earners | 201 (8.6%) | $0 |
| Total | 2,352 (100.0%) | $87,321 |
Household Income in Platte County
Household Income Brackets in Platte County
With 819 households falling in the category, the $50,000 to $74,999 income range is the most frequent in Platte County, accounting for 21.2% of all households. In contrast, only 166 households (4.3%) fall into the $10,000 to $14,999 income bracket, making it the least populous group.
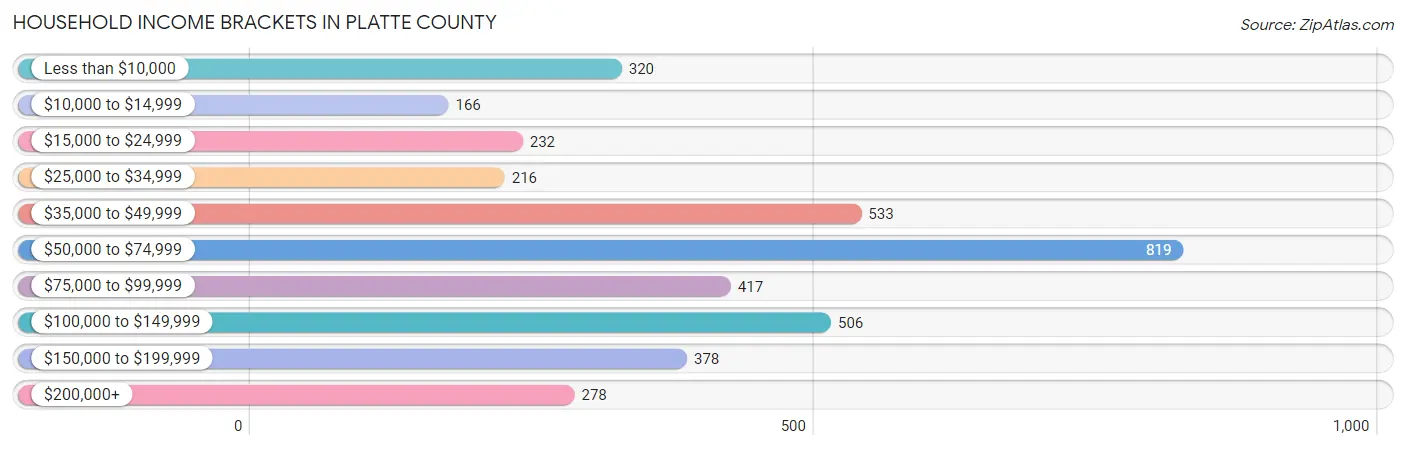
| Income Bracket | # Households | % Households |
| Less than $10,000 | 320 | 8.3% |
| $10,000 to $14,999 | 166 | 4.3% |
| $15,000 to $24,999 | 232 | 6.0% |
| $25,000 to $34,999 | 216 | 5.6% |
| $35,000 to $49,999 | 533 | 13.8% |
| $50,000 to $74,999 | 819 | 21.2% |
| $75,000 to $99,999 | 417 | 10.8% |
| $100,000 to $149,999 | 506 | 13.1% |
| $150,000 to $199,999 | 378 | 9.8% |
| $200,000+ | 278 | 7.2% |
Household Income by Householder Age in Platte County
The median household income in Platte County is $64,753, with the highest median household income of $89,375 found in the 25 to 44 years age bracket for the primary householder. A total of 1,030 households (26.7%) fall into this category. Meanwhile, the 15 to 24 years age bracket for the primary householder has the lowest median household income of $0, with 39 households (1.0%) in this group.
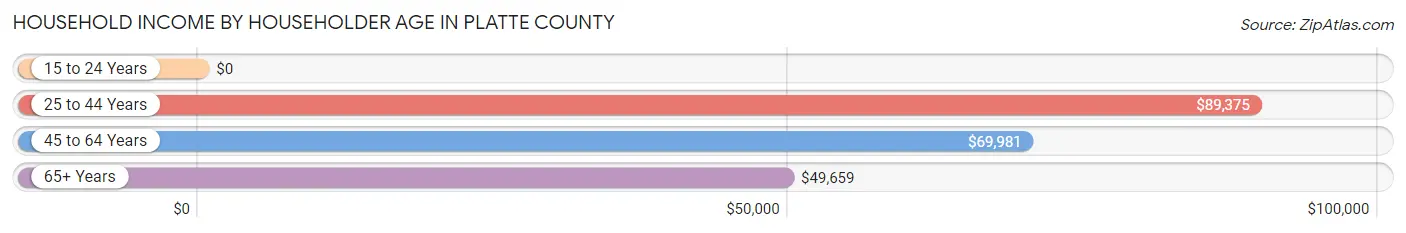
| Income Bracket | # Households | Median Income |
| 15 to 24 Years | 39 (1.0%) | $0 |
| 25 to 44 Years | 1,030 (26.7%) | $89,375 |
| 45 to 64 Years | 1,259 (32.6%) | $69,981 |
| 65+ Years | 1,533 (39.7%) | $49,659 |
| Total | 3,861 (100.0%) | $64,753 |
Poverty in Platte County
Income Below Poverty by Sex and Age in Platte County
With 13.9% poverty level for males and 10.0% for females among the residents of Platte County, 18 to 24 year old males and 6 to 11 year old females are the most vulnerable to poverty, with 101 males (67.8%) and 92 females (28.6%) in their respective age groups living below the poverty level.
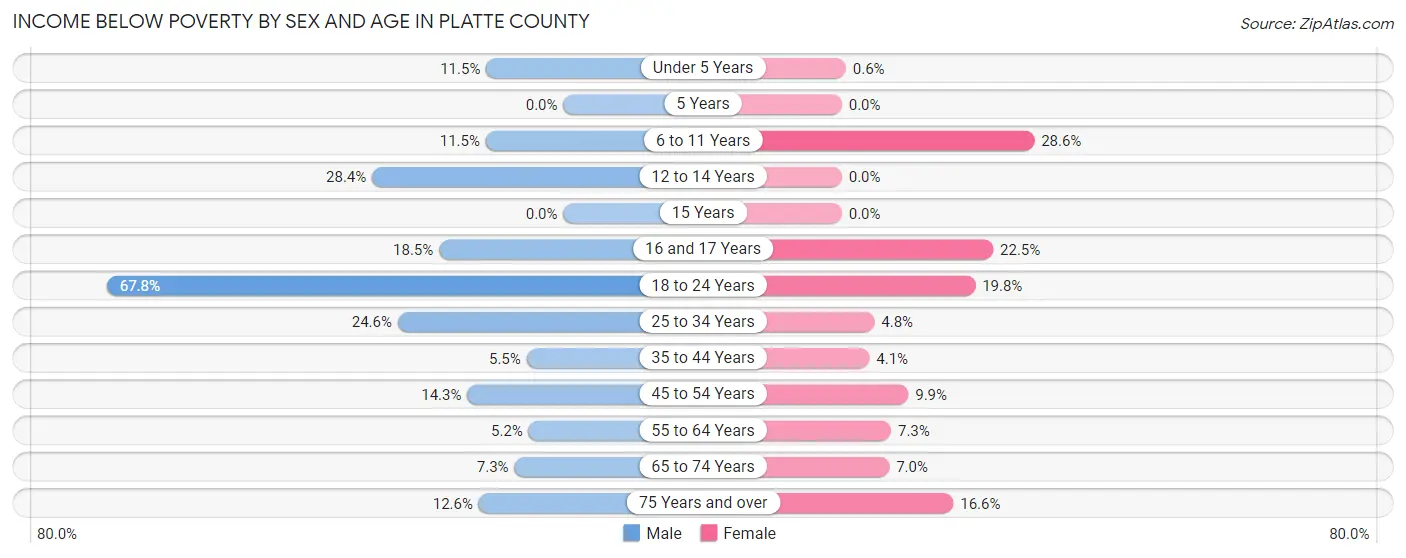
| Age Bracket | Male | Female |
| Under 5 Years | 15 (11.5%) | 1 (0.6%) |
| 5 Years | 0 (0.0%) | 0 (0.0%) |
| 6 to 11 Years | 28 (11.5%) | 92 (28.6%) |
| 12 to 14 Years | 48 (28.4%) | 0 (0.0%) |
| 15 Years | 0 (0.0%) | 0 (0.0%) |
| 16 and 17 Years | 31 (18.4%) | 20 (22.5%) |
| 18 to 24 Years | 101 (67.8%) | 41 (19.8%) |
| 25 to 34 Years | 132 (24.6%) | 18 (4.8%) |
| 35 to 44 Years | 26 (5.4%) | 21 (4.1%) |
| 45 to 54 Years | 73 (14.3%) | 46 (9.9%) |
| 55 to 64 Years | 32 (5.1%) | 53 (7.3%) |
| 65 to 74 Years | 49 (7.3%) | 45 (7.0%) |
| 75 Years and over | 58 (12.6%) | 78 (16.6%) |
| Total | 593 (13.9%) | 415 (10.0%) |
Income Above Poverty by Sex and Age in Platte County
According to the poverty statistics in Platte County, males aged 5 years and females aged 5 years are the age groups that are most secure financially, with 100.0% of males and 100.0% of females in these age groups living above the poverty line.
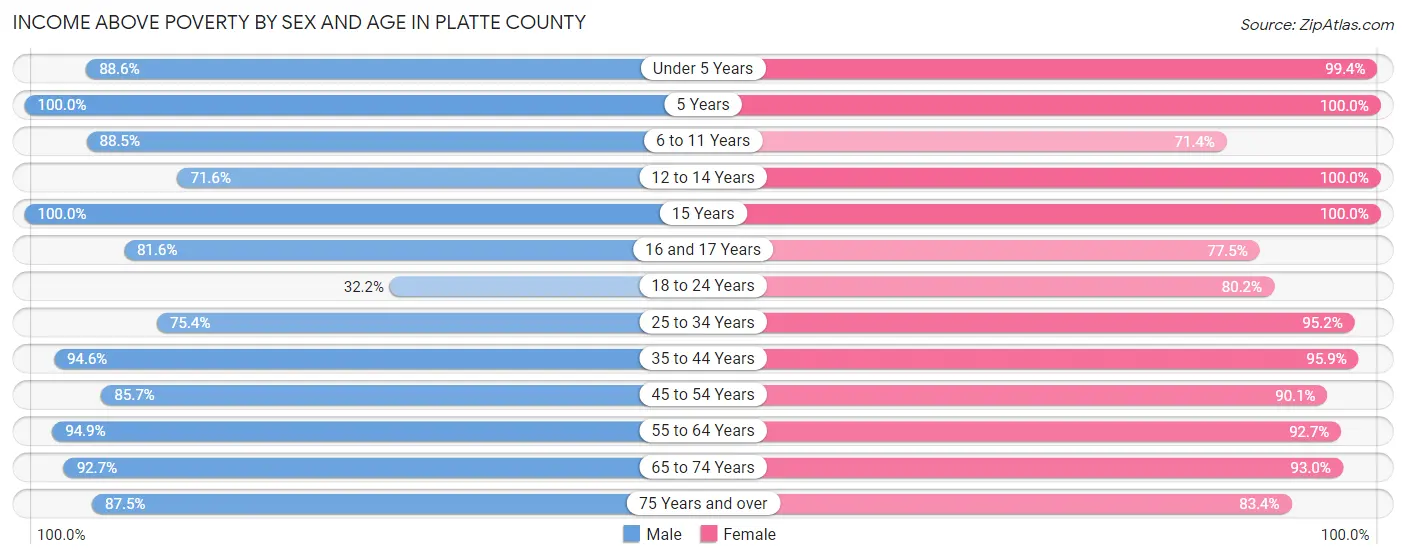
| Age Bracket | Male | Female |
| Under 5 Years | 116 (88.5%) | 165 (99.4%) |
| 5 Years | 17 (100.0%) | 2 (100.0%) |
| 6 to 11 Years | 215 (88.5%) | 230 (71.4%) |
| 12 to 14 Years | 121 (71.6%) | 108 (100.0%) |
| 15 Years | 115 (100.0%) | 70 (100.0%) |
| 16 and 17 Years | 137 (81.6%) | 69 (77.5%) |
| 18 to 24 Years | 48 (32.2%) | 166 (80.2%) |
| 25 to 34 Years | 405 (75.4%) | 354 (95.2%) |
| 35 to 44 Years | 451 (94.6%) | 492 (95.9%) |
| 45 to 54 Years | 439 (85.7%) | 420 (90.1%) |
| 55 to 64 Years | 589 (94.9%) | 672 (92.7%) |
| 65 to 74 Years | 625 (92.7%) | 594 (93.0%) |
| 75 Years and over | 404 (87.5%) | 393 (83.4%) |
| Total | 3,682 (86.1%) | 3,735 (90.0%) |
Income Below Poverty Among Married-Couple Families in Platte County
The poverty statistics for married-couple families in Platte County show that 4.3% or 90 of the total 2,089 families live below the poverty line. Families with 3 or 4 children have the highest poverty rate of 9.5%, comprising of 8 families. On the other hand, families with 5 or more children have the lowest poverty rate of 0.0%, which includes 0 families.
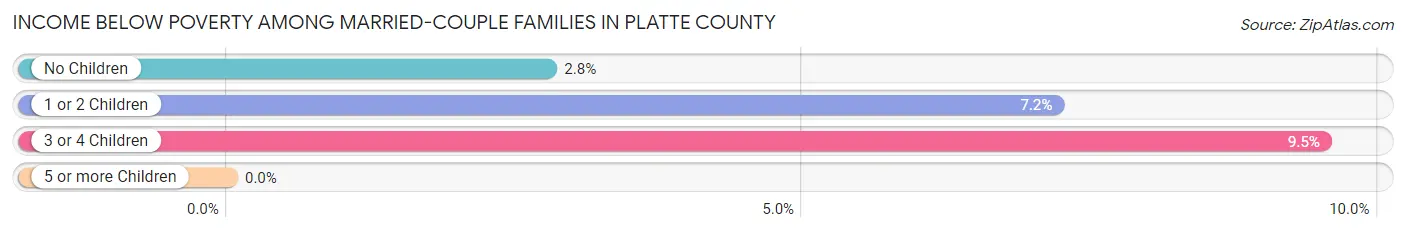
| Children | Above Poverty | Below Poverty |
| No Children | 1,364 (97.2%) | 39 (2.8%) |
| 1 or 2 Children | 555 (92.8%) | 43 (7.2%) |
| 3 or 4 Children | 76 (90.5%) | 8 (9.5%) |
| 5 or more Children | 4 (100.0%) | 0 (0.0%) |
| Total | 1,999 (95.7%) | 90 (4.3%) |
Income Below Poverty Among Single-Parent Households in Platte County

| Children | Single Father | Single Mother |
| No Children | 0 (0.0%) | 0 (0.0%) |
| 1 or 2 Children | 0 (0.0%) | 16 (11.9%) |
| 3 or 4 Children | 0 (0.0%) | 0 (0.0%) |
| 5 or more Children | 0 (0.0%) | 0 (0.0%) |
| Total | 0 (0.0%) | 16 (8.5%) |
Income Below Poverty Among Married-Couple vs Single-Parent Households in Platte County
The poverty data for Platte County shows that 90 of the married-couple family households (4.3%) and 16 of the single-parent households (6.1%) are living below the poverty level. Within the married-couple family households, those with 3 or 4 children have the highest poverty rate, with 8 households (9.5%) falling below the poverty line. Among the single-parent households, those with 1 or 2 children have the highest poverty rate, with 16 household (8.0%) living below poverty.
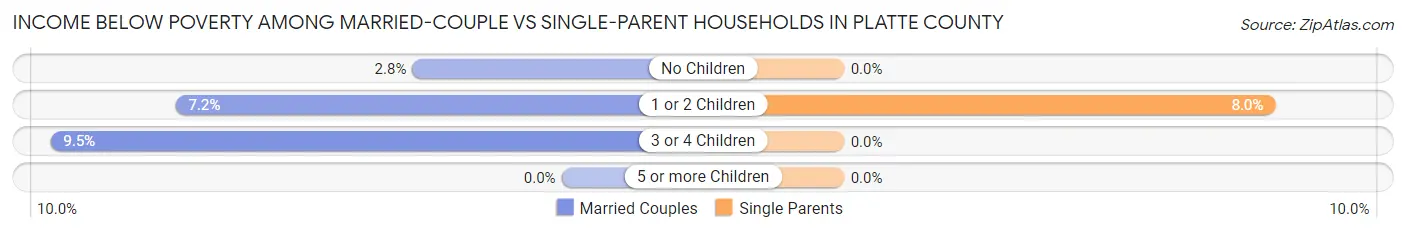
| Children | Married-Couple Families | Single-Parent Households |
| No Children | 39 (2.8%) | 0 (0.0%) |
| 1 or 2 Children | 43 (7.2%) | 16 (8.0%) |
| 3 or 4 Children | 8 (9.5%) | 0 (0.0%) |
| 5 or more Children | 0 (0.0%) | 0 (0.0%) |
| Total | 90 (4.3%) | 16 (6.1%) |
Employment Characteristics in Platte County
Employment by Class of Employer in Platte County
Among the 3,494 employed individuals in Platte County, private company employees (1,756 | 50.3%), self-employed (not incorporated) (534 | 15.3%), and not-for-profit organizations (379 | 10.8%) make up the most common classes of employment.
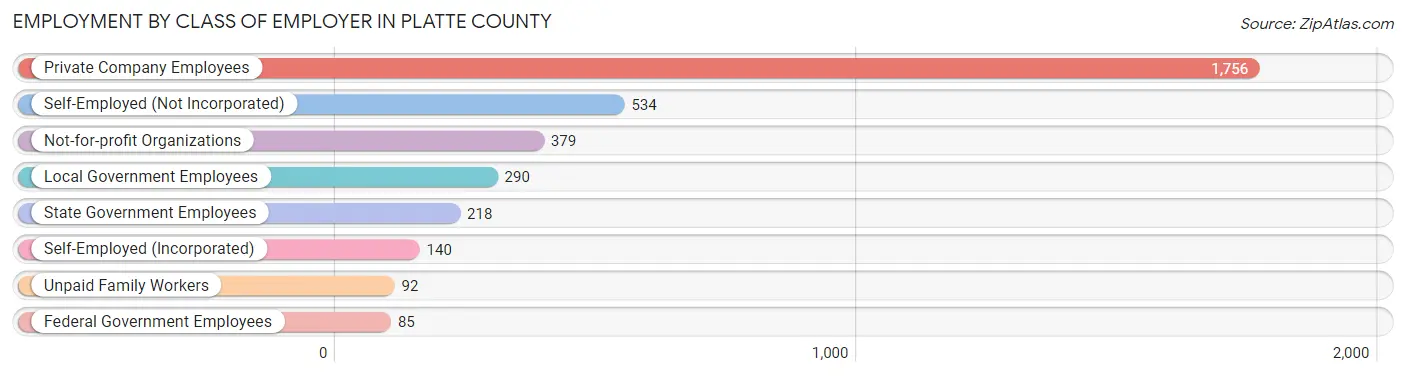
| Employer Class | # Employees | % Employees |
| Private Company Employees | 1,756 | 50.3% |
| Self-Employed (Incorporated) | 140 | 4.0% |
| Self-Employed (Not Incorporated) | 534 | 15.3% |
| Not-for-profit Organizations | 379 | 10.8% |
| Local Government Employees | 290 | 8.3% |
| State Government Employees | 218 | 6.2% |
| Federal Government Employees | 85 | 2.4% |
| Unpaid Family Workers | 92 | 2.6% |
| Total | 3,494 | 100.0% |
Employment Status by Age in Platte County
According to the labor force statistics for Platte County, out of the total population over 16 years of age (7,191), 53.6% or 3,854 individuals are in the labor force, with 4.0% or 154 of them unemployed. The age group with the highest labor force participation rate is 45 to 54 years, with 93.0% or 918 individuals in the labor force. Within the labor force, the 45 to 54 years age range has the highest percentage of unemployed individuals, with 10.2% or 94 of them being unemployed.
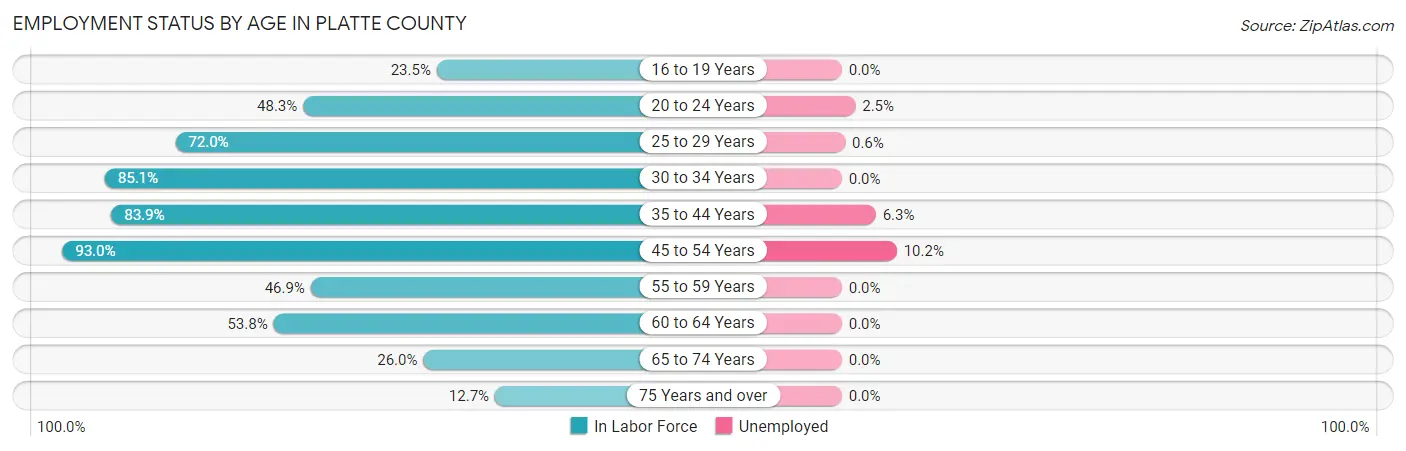
| Age Bracket | In Labor Force | Unemployed |
| 16 to 19 Years | 84 (23.5%) | 0 (0.0%) |
| 20 to 24 Years | 126 (48.3%) | 3 (2.5%) |
| 25 to 29 Years | 344 (72.0%) | 2 (0.6%) |
| 30 to 34 Years | 387 (85.1%) | 0 (0.0%) |
| 35 to 44 Years | 838 (83.9%) | 53 (6.3%) |
| 45 to 54 Years | 918 (93.0%) | 94 (10.2%) |
| 55 to 59 Years | 298 (46.9%) | 0 (0.0%) |
| 60 to 64 Years | 389 (53.8%) | 0 (0.0%) |
| 65 to 74 Years | 344 (26.0%) | 0 (0.0%) |
| 75 Years and over | 123 (12.7%) | 0 (0.0%) |
| Total | 3,854 (53.6%) | 154 (4.0%) |
Employment Status by Educational Attainment in Platte County
According to labor force statistics for Platte County, 74.2% of individuals (3,174) out of the total population between 25 and 64 years of age (4,277) are in the labor force, with 4.7% or 149 of them being unemployed. The group with the highest labor force participation rate are those with the educational attainment of high school diploma, with 77.9% or 968 individuals in the labor force. Within the labor force, individuals with college / associate degree education have the highest percentage of unemployment, with 11.3% or 149 of them being unemployed.
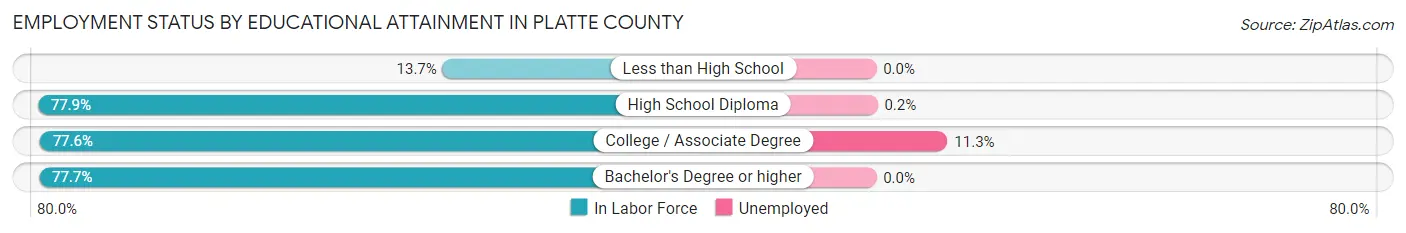
| Educational Attainment | In Labor Force | Unemployed |
| Less than High School | 32 (13.7%) | 0 (0.0%) |
| High School Diploma | 968 (77.9%) | 2 (0.2%) |
| College / Associate Degree | 1,319 (77.6%) | 192 (11.3%) |
| Bachelor's Degree or higher | 856 (77.7%) | 0 (0.0%) |
| Total | 3,174 (74.2%) | 201 (4.7%) |
Employment Occupations by Sex in Platte County
Management, Business, Science and Arts Occupations
The most common Management, Business, Science and Arts occupations in Platte County are Management (750 | 20.5%), Community & Social Service (332 | 9.1%), Education Instruction & Library (243 | 6.6%), Computers, Engineering & Science (100 | 2.7%), and Business & Financial (96 | 2.6%).

Management, Business, Science and Arts Occupations by Sex
Within the Management, Business, Science and Arts occupations in Platte County, the most male-oriented occupations are Computers & Mathematics (100.0%), Arts, Media & Entertainment (100.0%), and Education, Arts & Media (75.4%), while the most female-oriented occupations are Health Diagnosing & Treating (90.1%), Health Technologists (85.3%), and Education Instruction & Library (73.3%).
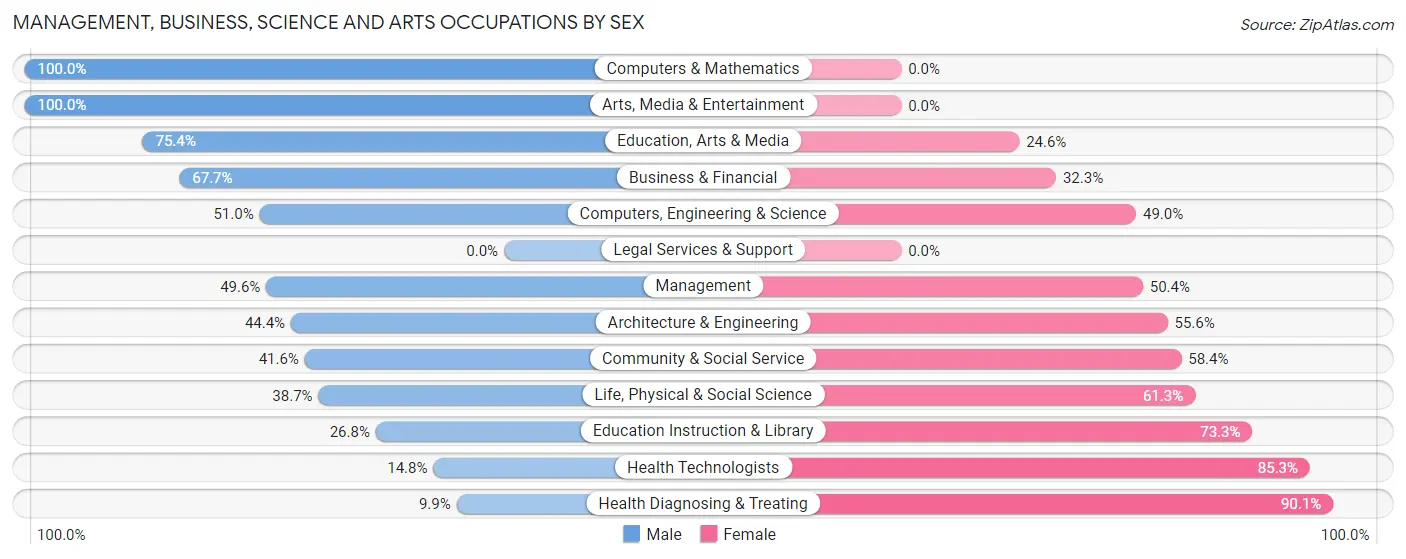
| Occupation | Male | Female |
| Management | 372 (49.6%) | 378 (50.4%) |
| Business & Financial | 65 (67.7%) | 31 (32.3%) |
| Computers, Engineering & Science | 51 (51.0%) | 49 (49.0%) |
| Computers & Mathematics | 15 (100.0%) | 0 (0.0%) |
| Architecture & Engineering | 24 (44.4%) | 30 (55.6%) |
| Life, Physical & Social Science | 12 (38.7%) | 19 (61.3%) |
| Community & Social Service | 138 (41.6%) | 194 (58.4%) |
| Education, Arts & Media | 49 (75.4%) | 16 (24.6%) |
| Legal Services & Support | 0 (0.0%) | 0 (0.0%) |
| Education Instruction & Library | 65 (26.8%) | 178 (73.3%) |
| Arts, Media & Entertainment | 24 (100.0%) | 0 (0.0%) |
| Health Diagnosing & Treating | 9 (9.9%) | 82 (90.1%) |
| Health Technologists | 9 (14.7%) | 52 (85.3%) |
| Total (Category) | 635 (46.4%) | 734 (53.6%) |
| Total (Overall) | 2,069 (56.5%) | 1,593 (43.5%) |
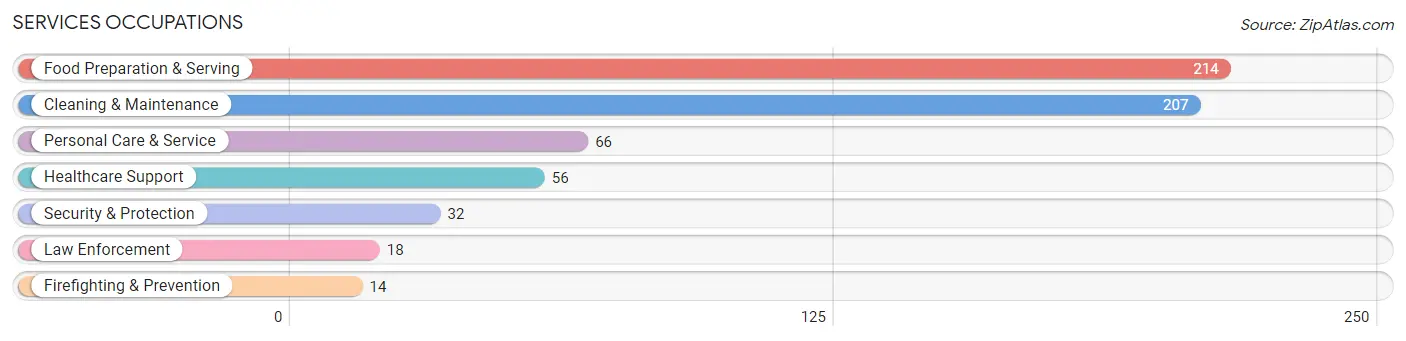
Services Occupations
The most common Services occupations in Platte County are Food Preparation & Serving (214 | 5.8%), Cleaning & Maintenance (207 | 5.7%), Personal Care & Service (66 | 1.8%), Healthcare Support (56 | 1.5%), and Security & Protection (32 | 0.9%).
Services Occupations by Sex
Within the Services occupations in Platte County, the most male-oriented occupations are Law Enforcement (100.0%), Personal Care & Service (74.2%), and Cleaning & Maintenance (56.5%), while the most female-oriented occupations are Healthcare Support (100.0%), Firefighting & Prevention (100.0%), and Food Preparation & Serving (75.7%).
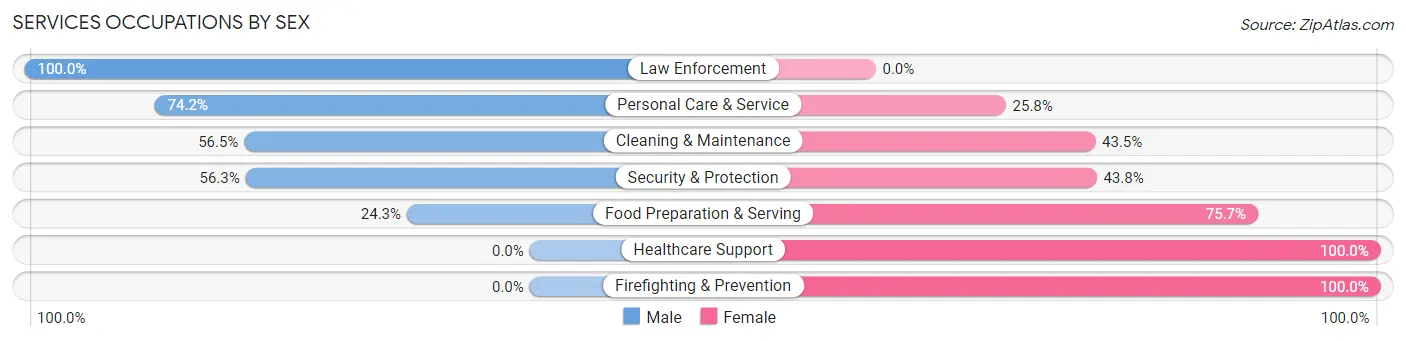
| Occupation | Male | Female |
| Healthcare Support | 0 (0.0%) | 56 (100.0%) |
| Security & Protection | 18 (56.2%) | 14 (43.8%) |
| Firefighting & Prevention | 0 (0.0%) | 14 (100.0%) |
| Law Enforcement | 18 (100.0%) | 0 (0.0%) |
| Food Preparation & Serving | 52 (24.3%) | 162 (75.7%) |
| Cleaning & Maintenance | 117 (56.5%) | 90 (43.5%) |
| Personal Care & Service | 49 (74.2%) | 17 (25.8%) |
| Total (Category) | 236 (41.0%) | 339 (59.0%) |
| Total (Overall) | 2,069 (56.5%) | 1,593 (43.5%) |
Sales and Office Occupations
The most common Sales and Office occupations in Platte County are Office & Administration (367 | 10.0%), and Sales & Related (271 | 7.4%).
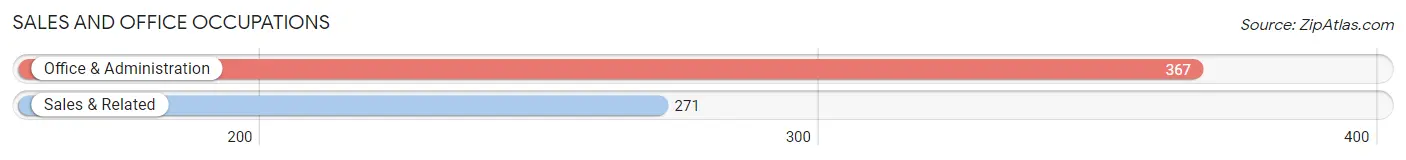
Sales and Office Occupations by Sex
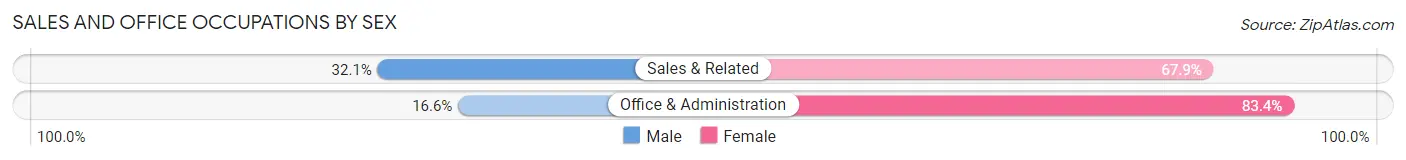
| Occupation | Male | Female |
| Sales & Related | 87 (32.1%) | 184 (67.9%) |
| Office & Administration | 61 (16.6%) | 306 (83.4%) |
| Total (Category) | 148 (23.2%) | 490 (76.8%) |
| Total (Overall) | 2,069 (56.5%) | 1,593 (43.5%) |
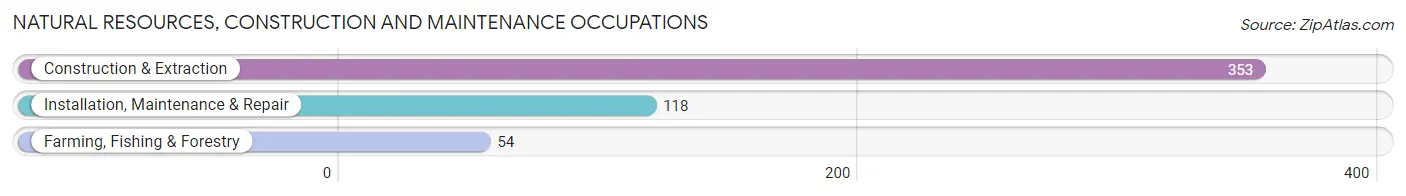
Natural Resources, Construction and Maintenance Occupations
The most common Natural Resources, Construction and Maintenance occupations in Platte County are Construction & Extraction (353 | 9.6%), Installation, Maintenance & Repair (118 | 3.2%), and Farming, Fishing & Forestry (54 | 1.5%).
Natural Resources, Construction and Maintenance Occupations by Sex
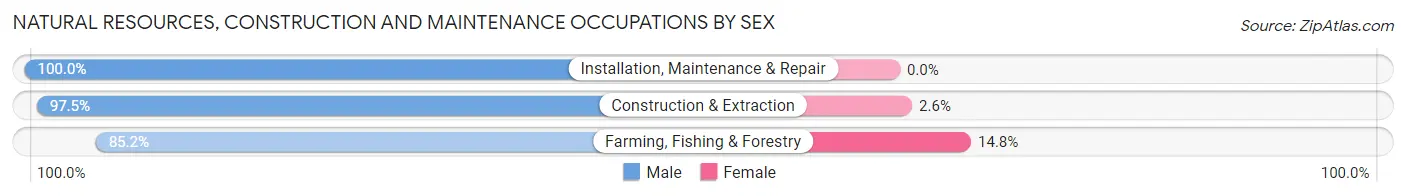
| Occupation | Male | Female |
| Farming, Fishing & Forestry | 46 (85.2%) | 8 (14.8%) |
| Construction & Extraction | 344 (97.5%) | 9 (2.5%) |
| Installation, Maintenance & Repair | 118 (100.0%) | 0 (0.0%) |
| Total (Category) | 508 (96.8%) | 17 (3.2%) |
| Total (Overall) | 2,069 (56.5%) | 1,593 (43.5%) |
Production, Transportation and Moving Occupations
The most common Production, Transportation and Moving occupations in Platte County are Transportation (373 | 10.2%), Production (110 | 3.0%), and Material Moving (72 | 2.0%).

Production, Transportation and Moving Occupations by Sex
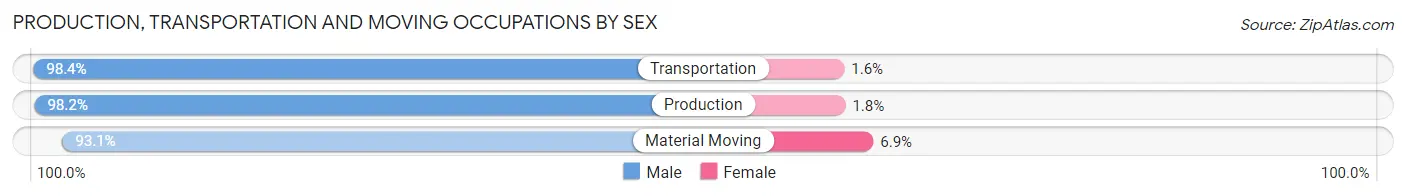
| Occupation | Male | Female |
| Production | 108 (98.2%) | 2 (1.8%) |
| Transportation | 367 (98.4%) | 6 (1.6%) |
| Material Moving | 67 (93.1%) | 5 (6.9%) |
| Total (Category) | 542 (97.7%) | 13 (2.3%) |
| Total (Overall) | 2,069 (56.5%) | 1,593 (43.5%) |
Employment Industries by Sex in Platte County
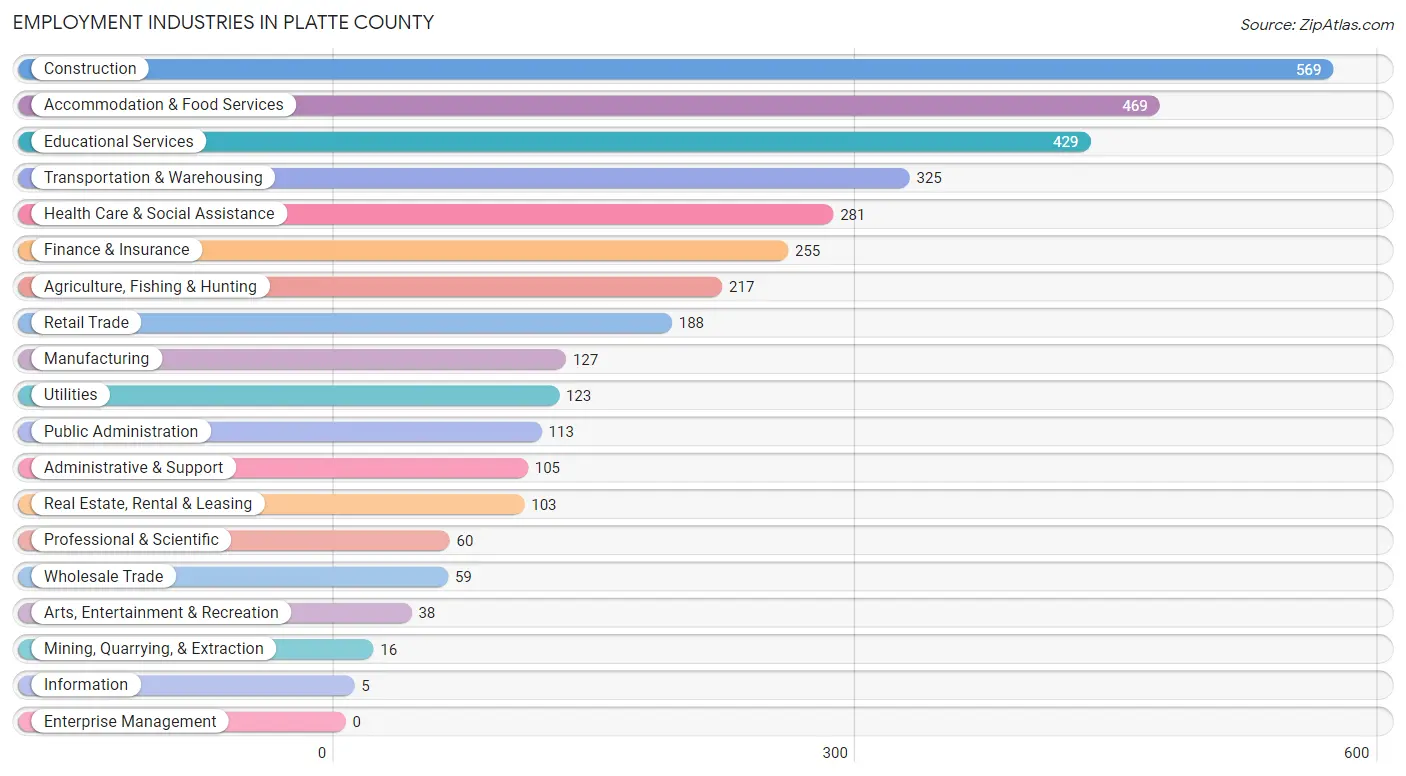
Employment Industries in Platte County
The major employment industries in Platte County include Construction (569 | 15.5%), Accommodation & Food Services (469 | 12.8%), Educational Services (429 | 11.7%), Transportation & Warehousing (325 | 8.9%), and Health Care & Social Assistance (281 | 7.7%).
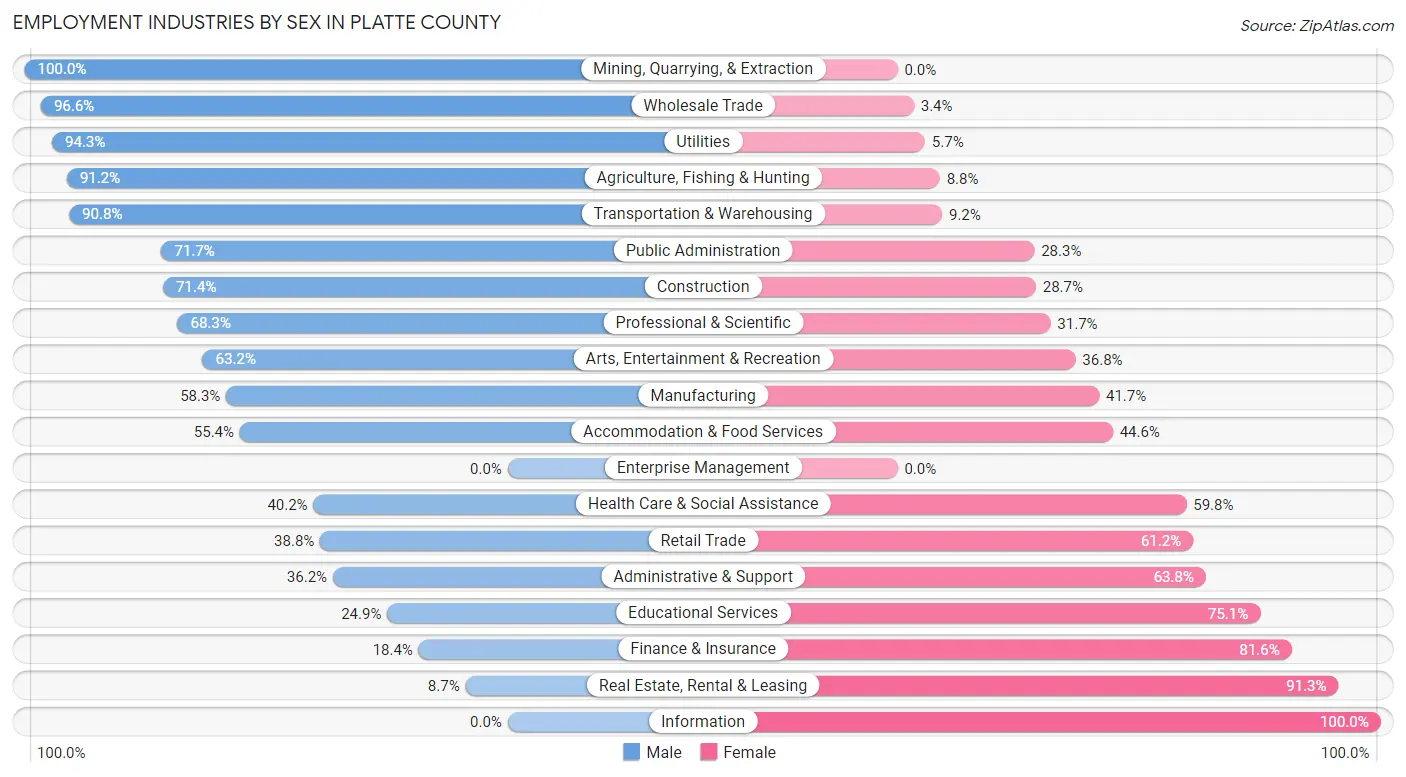
Employment Industries by Sex in Platte County
The Platte County industries that see more men than women are Mining, Quarrying, & Extraction (100.0%), Wholesale Trade (96.6%), and Utilities (94.3%), whereas the industries that tend to have a higher number of women are Information (100.0%), Real Estate, Rental & Leasing (91.3%), and Finance & Insurance (81.6%).
| Industry | Male | Female |
| Agriculture, Fishing & Hunting | 198 (91.2%) | 19 (8.8%) |
| Mining, Quarrying, & Extraction | 16 (100.0%) | 0 (0.0%) |
| Construction | 406 (71.4%) | 163 (28.6%) |
| Manufacturing | 74 (58.3%) | 53 (41.7%) |
| Wholesale Trade | 57 (96.6%) | 2 (3.4%) |
| Retail Trade | 73 (38.8%) | 115 (61.2%) |
| Transportation & Warehousing | 295 (90.8%) | 30 (9.2%) |
| Utilities | 116 (94.3%) | 7 (5.7%) |
| Information | 0 (0.0%) | 5 (100.0%) |
| Finance & Insurance | 47 (18.4%) | 208 (81.6%) |
| Real Estate, Rental & Leasing | 9 (8.7%) | 94 (91.3%) |
| Professional & Scientific | 41 (68.3%) | 19 (31.7%) |
| Enterprise Management | 0 (0.0%) | 0 (0.0%) |
| Administrative & Support | 38 (36.2%) | 67 (63.8%) |
| Educational Services | 107 (24.9%) | 322 (75.1%) |
| Health Care & Social Assistance | 113 (40.2%) | 168 (59.8%) |
| Arts, Entertainment & Recreation | 24 (63.2%) | 14 (36.8%) |
| Accommodation & Food Services | 260 (55.4%) | 209 (44.6%) |
| Public Administration | 81 (71.7%) | 32 (28.3%) |
| Total | 2,069 (56.5%) | 1,593 (43.5%) |
Education in Platte County
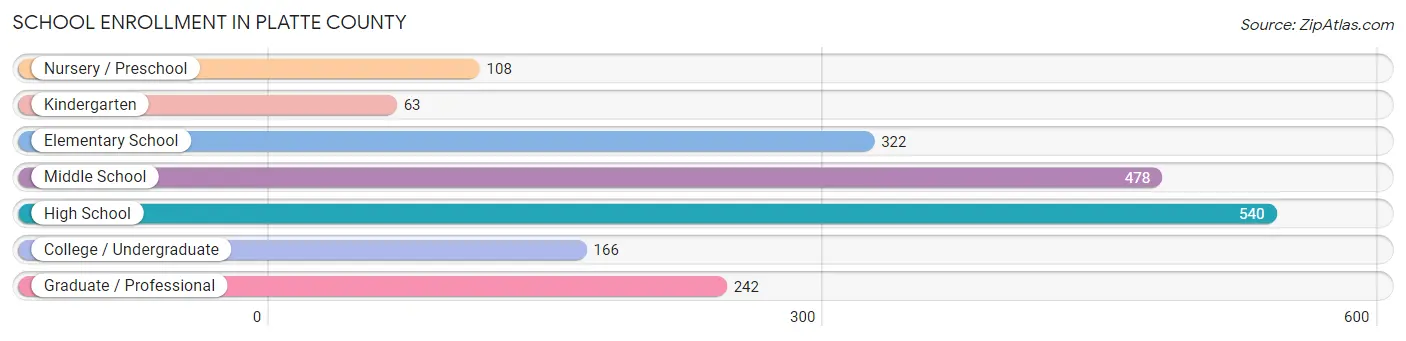
School Enrollment in Platte County
The most common levels of schooling among the 1,919 students in Platte County are high school (540 | 28.1%), middle school (478 | 24.9%), and elementary school (322 | 16.8%).
| School Level | # Students | % Students |
| Nursery / Preschool | 108 | 5.6% |
| Kindergarten | 63 | 3.3% |
| Elementary School | 322 | 16.8% |
| Middle School | 478 | 24.9% |
| High School | 540 | 28.1% |
| College / Undergraduate | 166 | 8.6% |
| Graduate / Professional | 242 | 12.6% |
| Total | 1,919 | 100.0% |
School Enrollment by Age by Funding Source in Platte County
Out of a total of 1,919 students who are enrolled in schools in Platte County, 232 (12.1%) attend a private institution, while the remaining 1,687 (87.9%) are enrolled in public schools. The age group of 35 years and over has the highest likelihood of being enrolled in private schools, with 74 (35.9% in the age bracket) enrolled. Conversely, the age group of 15 to 17 year olds has the lowest likelihood of being enrolled in a private school, with 442 (100.0% in the age bracket) attending a public institution.
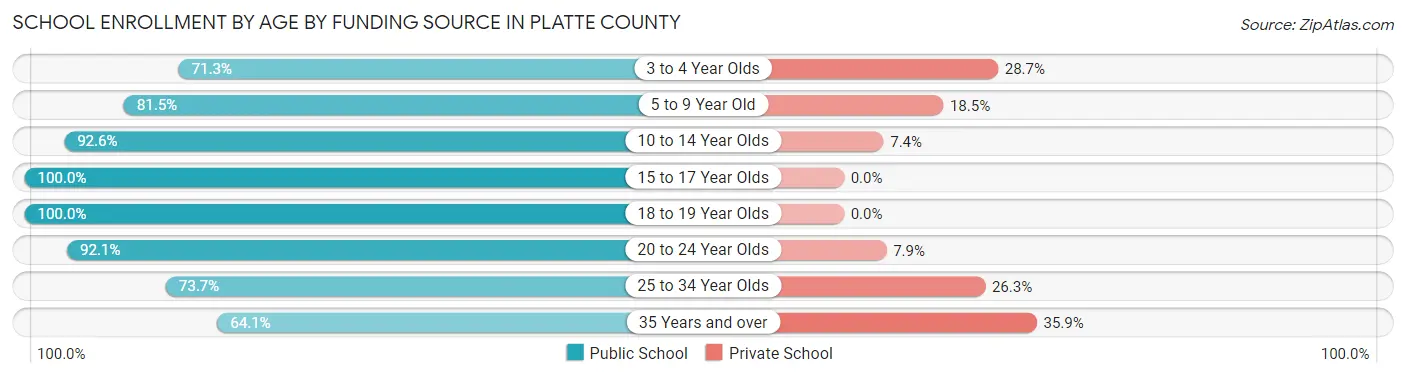
| Age Bracket | Public School | Private School |
| 3 to 4 Year Olds | 77 (71.3%) | 31 (28.7%) |
| 5 to 9 Year Old | 304 (81.5%) | 69 (18.5%) |
| 10 to 14 Year Olds | 452 (92.6%) | 36 (7.4%) |
| 15 to 17 Year Olds | 442 (100.0%) | 0 (0.0%) |
| 18 to 19 Year Olds | 100 (100.0%) | 0 (0.0%) |
| 20 to 24 Year Olds | 151 (92.1%) | 13 (7.9%) |
| 25 to 34 Year Olds | 28 (73.7%) | 10 (26.3%) |
| 35 Years and over | 132 (64.1%) | 74 (35.9%) |
| Total | 1,687 (87.9%) | 232 (12.1%) |
Educational Attainment by Field of Study in Platte County
Education (393 | 23.9%), bio, nature & agricultural (301 | 18.3%), science & technology (259 | 15.7%), business (160 | 9.7%), and psychology (110 | 6.7%) are the most common fields of study among 1,646 individuals in Platte County who have obtained a bachelor's degree or higher.
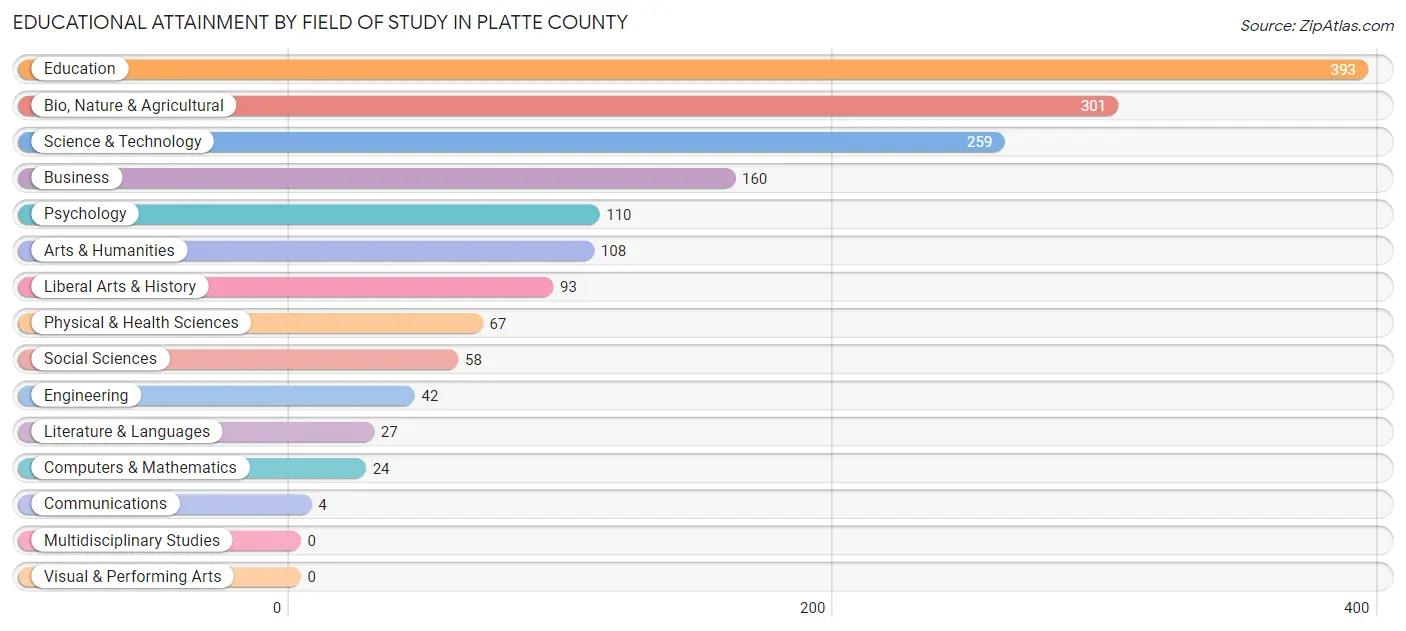
| Field of Study | # Graduates | % Graduates |
| Computers & Mathematics | 24 | 1.5% |
| Bio, Nature & Agricultural | 301 | 18.3% |
| Physical & Health Sciences | 67 | 4.1% |
| Psychology | 110 | 6.7% |
| Social Sciences | 58 | 3.5% |
| Engineering | 42 | 2.5% |
| Multidisciplinary Studies | 0 | 0.0% |
| Science & Technology | 259 | 15.7% |
| Business | 160 | 9.7% |
| Education | 393 | 23.9% |
| Literature & Languages | 27 | 1.6% |
| Liberal Arts & History | 93 | 5.7% |
| Visual & Performing Arts | 0 | 0.0% |
| Communications | 4 | 0.2% |
| Arts & Humanities | 108 | 6.6% |
| Total | 1,646 | 100.0% |
Transportation & Commute in Platte County
Vehicle Availability by Sex in Platte County
The most prevalent vehicle ownership categories in Platte County are males with 2 vehicles (670, accounting for 34.4%) and females with 2 vehicles (576, making up 43.4%).

| Vehicles Available | Male | Female |
| No Vehicle | 0 (0.0%) | 4 (0.3%) |
| 1 Vehicle | 428 (22.0%) | 218 (14.1%) |
| 2 Vehicles | 670 (34.4%) | 576 (37.3%) |
| 3 Vehicles | 509 (26.2%) | 440 (28.5%) |
| 4 Vehicles | 203 (10.4%) | 207 (13.4%) |
| 5 or more Vehicles | 136 (7.0%) | 97 (6.3%) |
| Total | 1,946 (100.0%) | 1,542 (100.0%) |
Commute Time in Platte County
The most frequently occuring commute durations in Platte County are less than 5 minutes (930 commuters, 28.7%), 5 to 9 minutes (809 commuters, 25.0%), and 10 to 14 minutes (358 commuters, 11.1%).
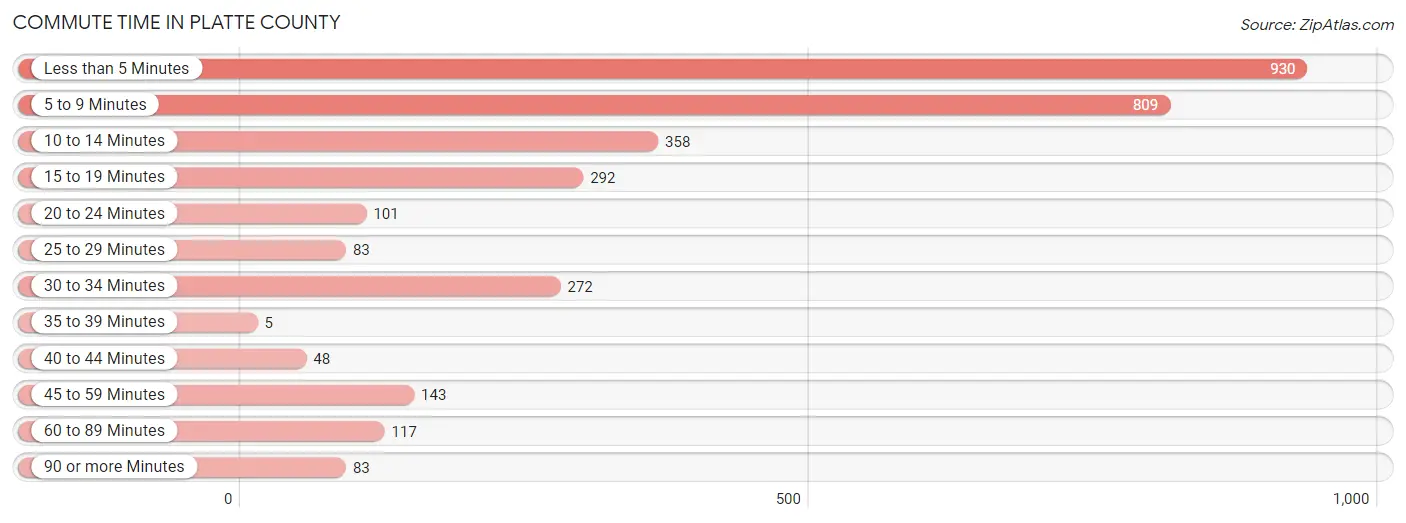
| Commute Time | # Commuters | % Commuters |
| Less than 5 Minutes | 930 | 28.7% |
| 5 to 9 Minutes | 809 | 25.0% |
| 10 to 14 Minutes | 358 | 11.1% |
| 15 to 19 Minutes | 292 | 9.0% |
| 20 to 24 Minutes | 101 | 3.1% |
| 25 to 29 Minutes | 83 | 2.6% |
| 30 to 34 Minutes | 272 | 8.4% |
| 35 to 39 Minutes | 5 | 0.2% |
| 40 to 44 Minutes | 48 | 1.5% |
| 45 to 59 Minutes | 143 | 4.4% |
| 60 to 89 Minutes | 117 | 3.6% |
| 90 or more Minutes | 83 | 2.6% |
Commute Time by Sex in Platte County
The most common commute times in Platte County are less than 5 minutes (468 commuters, 25.4%) for males and less than 5 minutes (462 commuters, 33.1%) for females.
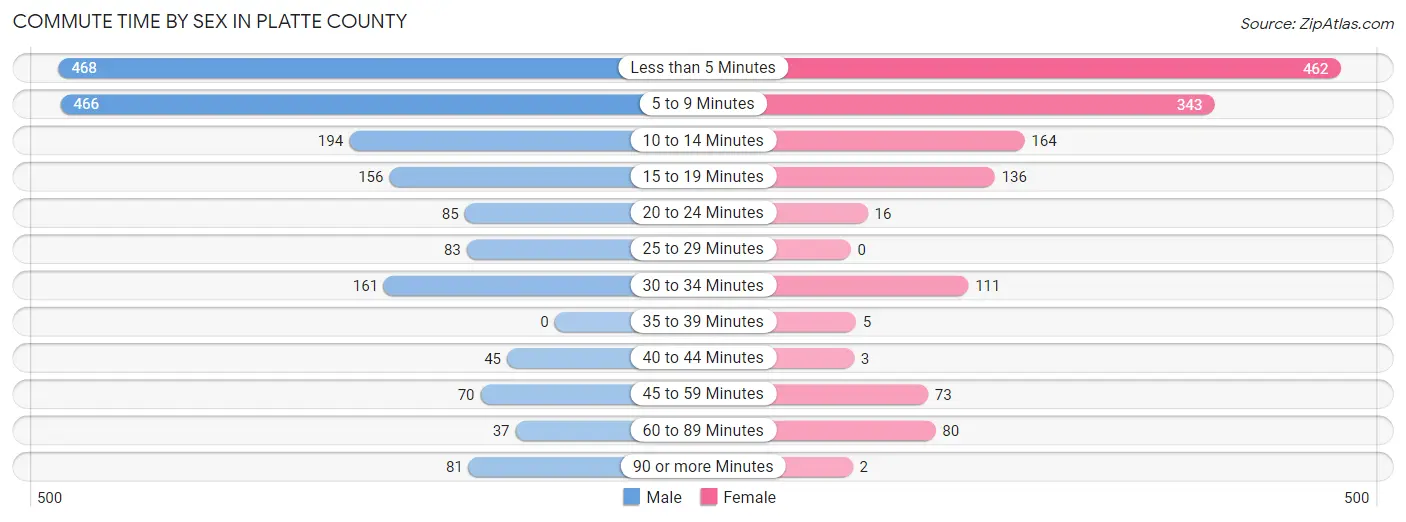
| Commute Time | Male | Female |
| Less than 5 Minutes | 468 (25.4%) | 462 (33.1%) |
| 5 to 9 Minutes | 466 (25.2%) | 343 (24.6%) |
| 10 to 14 Minutes | 194 (10.5%) | 164 (11.8%) |
| 15 to 19 Minutes | 156 (8.5%) | 136 (9.8%) |
| 20 to 24 Minutes | 85 (4.6%) | 16 (1.1%) |
| 25 to 29 Minutes | 83 (4.5%) | 0 (0.0%) |
| 30 to 34 Minutes | 161 (8.7%) | 111 (8.0%) |
| 35 to 39 Minutes | 0 (0.0%) | 5 (0.4%) |
| 40 to 44 Minutes | 45 (2.4%) | 3 (0.2%) |
| 45 to 59 Minutes | 70 (3.8%) | 73 (5.2%) |
| 60 to 89 Minutes | 37 (2.0%) | 80 (5.7%) |
| 90 or more Minutes | 81 (4.4%) | 2 (0.1%) |
Time of Departure to Work by Sex in Platte County
The most frequent times of departure to work in Platte County are 6:00 AM to 6:29 AM (390, 21.1%) for males and 7:00 AM to 7:29 AM (272, 19.5%) for females.
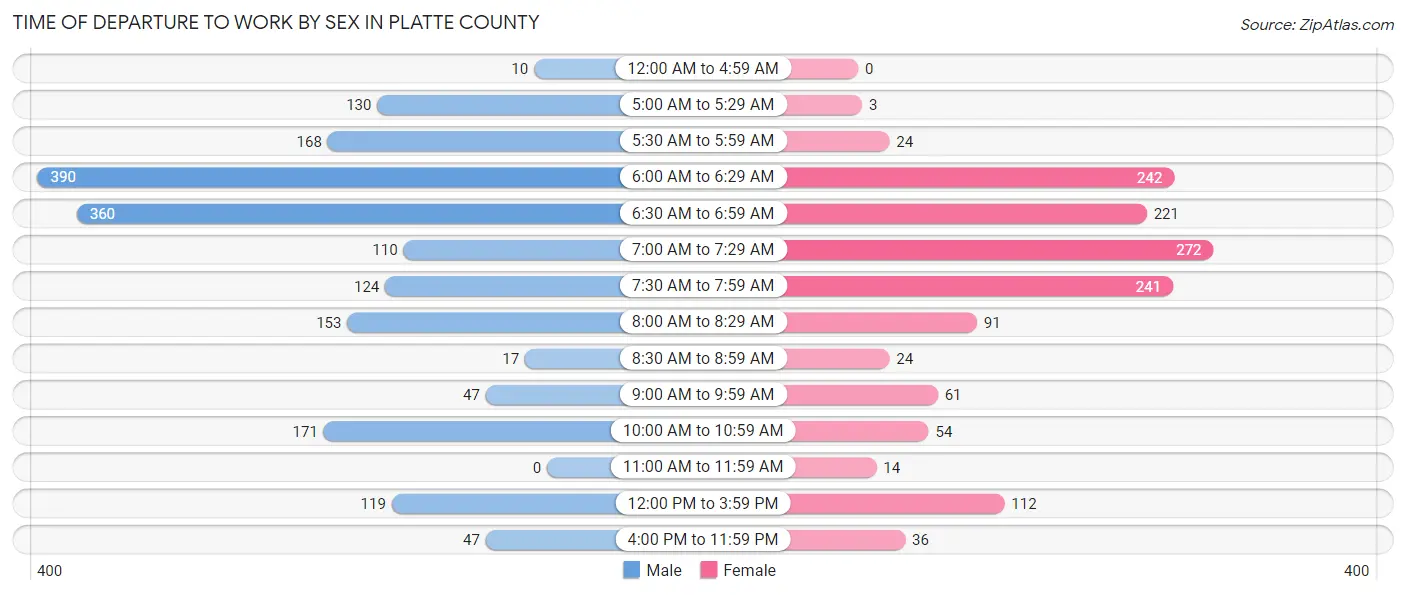
| Time of Departure | Male | Female |
| 12:00 AM to 4:59 AM | 10 (0.5%) | 0 (0.0%) |
| 5:00 AM to 5:29 AM | 130 (7.0%) | 3 (0.2%) |
| 5:30 AM to 5:59 AM | 168 (9.1%) | 24 (1.7%) |
| 6:00 AM to 6:29 AM | 390 (21.1%) | 242 (17.3%) |
| 6:30 AM to 6:59 AM | 360 (19.5%) | 221 (15.8%) |
| 7:00 AM to 7:29 AM | 110 (6.0%) | 272 (19.5%) |
| 7:30 AM to 7:59 AM | 124 (6.7%) | 241 (17.3%) |
| 8:00 AM to 8:29 AM | 153 (8.3%) | 91 (6.5%) |
| 8:30 AM to 8:59 AM | 17 (0.9%) | 24 (1.7%) |
| 9:00 AM to 9:59 AM | 47 (2.5%) | 61 (4.4%) |
| 10:00 AM to 10:59 AM | 171 (9.3%) | 54 (3.9%) |
| 11:00 AM to 11:59 AM | 0 (0.0%) | 14 (1.0%) |
| 12:00 PM to 3:59 PM | 119 (6.5%) | 112 (8.0%) |
| 4:00 PM to 11:59 PM | 47 (2.5%) | 36 (2.6%) |
| Total | 1,846 (100.0%) | 1,395 (100.0%) |
Housing Occupancy in Platte County
Occupancy by Ownership in Platte County
Of the total 3,861 dwellings in Platte County, owner-occupied units account for 2,860 (74.1%), while renter-occupied units make up 1,001 (25.9%).
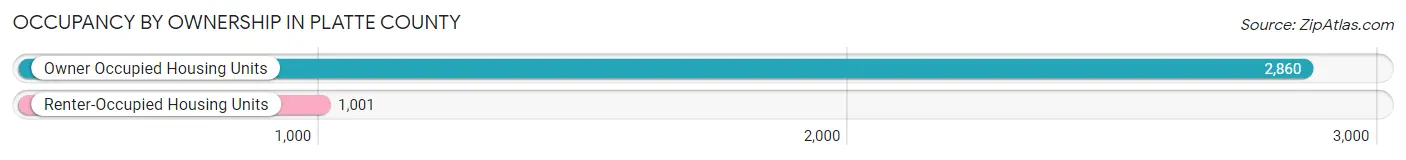
| Occupancy | # Housing Units | % Housing Units |
| Owner Occupied Housing Units | 2,860 | 74.1% |
| Renter-Occupied Housing Units | 1,001 | 25.9% |
| Total Occupied Housing Units | 3,861 | 100.0% |
Occupancy by Household Size in Platte County
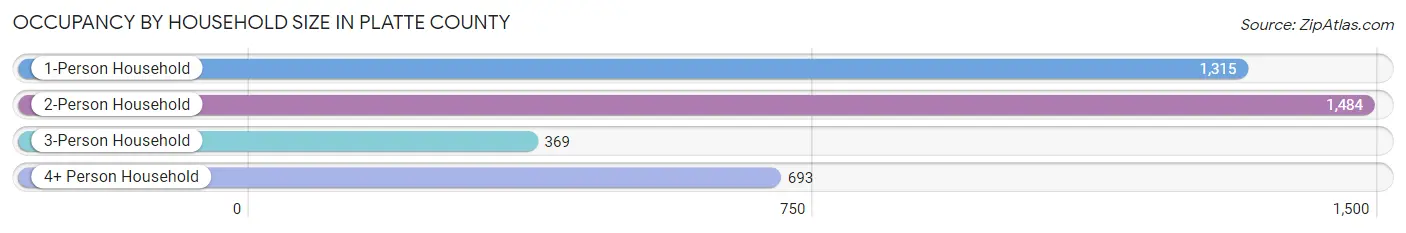
| Household Size | # Housing Units | % Housing Units |
| 1-Person Household | 1,315 | 34.1% |
| 2-Person Household | 1,484 | 38.4% |
| 3-Person Household | 369 | 9.6% |
| 4+ Person Household | 693 | 17.9% |
| Total Housing Units | 3,861 | 100.0% |
Occupancy by Ownership by Household Size in Platte County
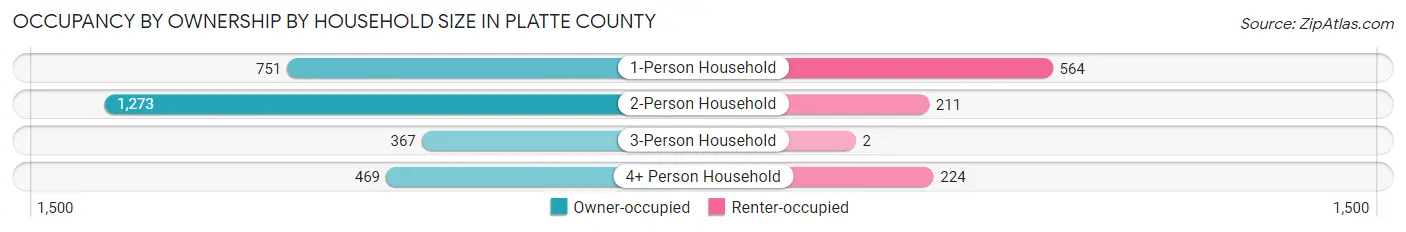
| Household Size | Owner-occupied | Renter-occupied |
| 1-Person Household | 751 (57.1%) | 564 (42.9%) |
| 2-Person Household | 1,273 (85.8%) | 211 (14.2%) |
| 3-Person Household | 367 (99.5%) | 2 (0.5%) |
| 4+ Person Household | 469 (67.7%) | 224 (32.3%) |
| Total Housing Units | 2,860 (74.1%) | 1,001 (25.9%) |
Occupancy by Educational Attainment in Platte County
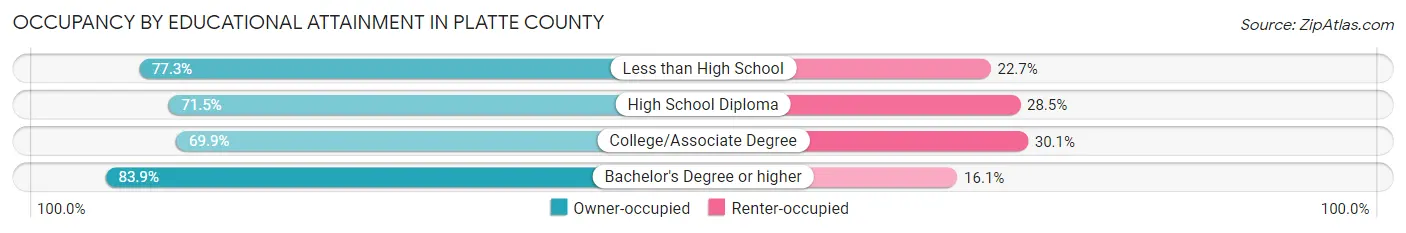
| Household Size | Owner-occupied | Renter-occupied |
| Less than High School | 75 (77.3%) | 22 (22.7%) |
| High School Diploma | 970 (71.5%) | 387 (28.5%) |
| College/Associate Degree | 1,026 (69.9%) | 441 (30.1%) |
| Bachelor's Degree or higher | 789 (83.9%) | 151 (16.1%) |
Occupancy by Age of Householder in Platte County
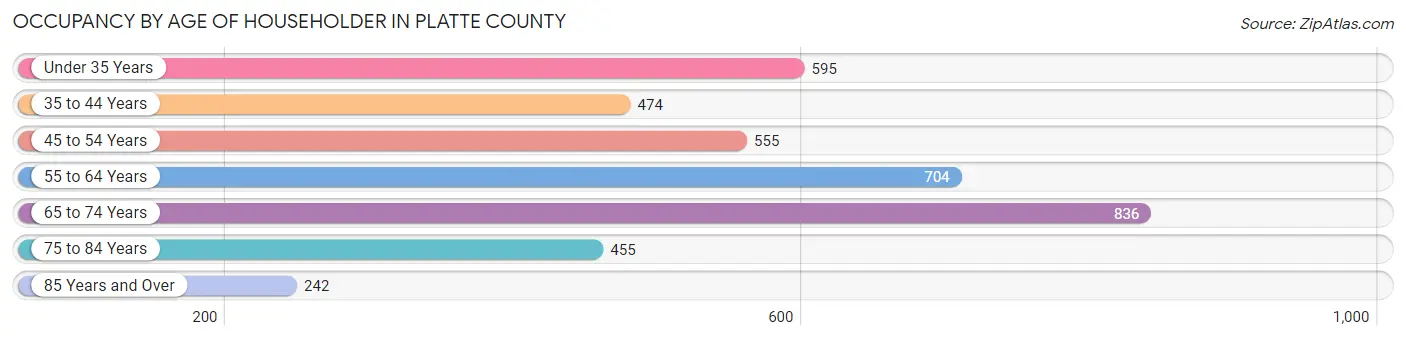
| Age Bracket | # Households | % Households |
| Under 35 Years | 595 | 15.4% |
| 35 to 44 Years | 474 | 12.3% |
| 45 to 54 Years | 555 | 14.4% |
| 55 to 64 Years | 704 | 18.2% |
| 65 to 74 Years | 836 | 21.6% |
| 75 to 84 Years | 455 | 11.8% |
| 85 Years and Over | 242 | 6.3% |
| Total | 3,861 | 100.0% |
Housing Finances in Platte County
Median Income by Occupancy in Platte County
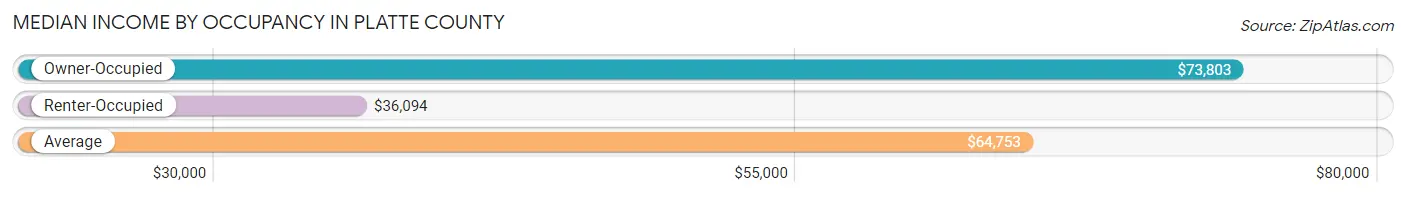
| Occupancy Type | # Households | Median Income |
| Owner-Occupied | 2,860 (74.1%) | $73,803 |
| Renter-Occupied | 1,001 (25.9%) | $36,094 |
| Average | 3,861 (100.0%) | $64,753 |
Occupancy by Householder Income Bracket in Platte County
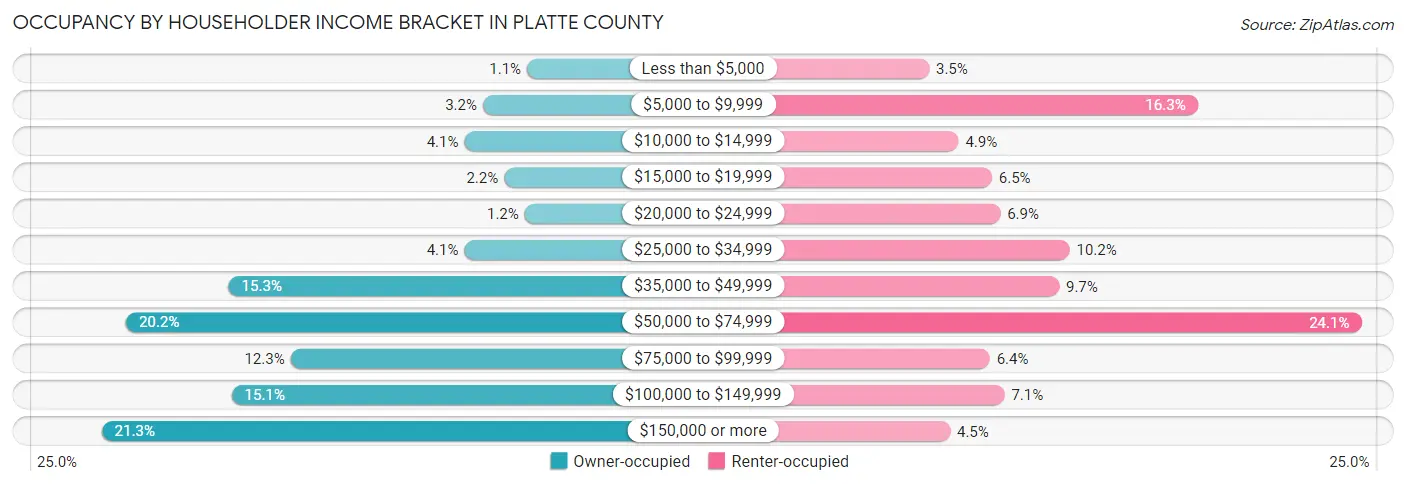
| Income Bracket | Owner-occupied | Renter-occupied |
| Less than $5,000 | 31 (1.1%) | 35 (3.5%) |
| $5,000 to $9,999 | 91 (3.2%) | 163 (16.3%) |
| $10,000 to $14,999 | 116 (4.1%) | 49 (4.9%) |
| $15,000 to $19,999 | 62 (2.2%) | 65 (6.5%) |
| $20,000 to $24,999 | 34 (1.2%) | 69 (6.9%) |
| $25,000 to $34,999 | 116 (4.1%) | 102 (10.2%) |
| $35,000 to $49,999 | 437 (15.3%) | 97 (9.7%) |
| $50,000 to $74,999 | 577 (20.2%) | 241 (24.1%) |
| $75,000 to $99,999 | 353 (12.3%) | 64 (6.4%) |
| $100,000 to $149,999 | 433 (15.1%) | 71 (7.1%) |
| $150,000 or more | 610 (21.3%) | 45 (4.5%) |
| Total | 2,860 (100.0%) | 1,001 (100.0%) |
Monthly Housing Cost Tiers in Platte County
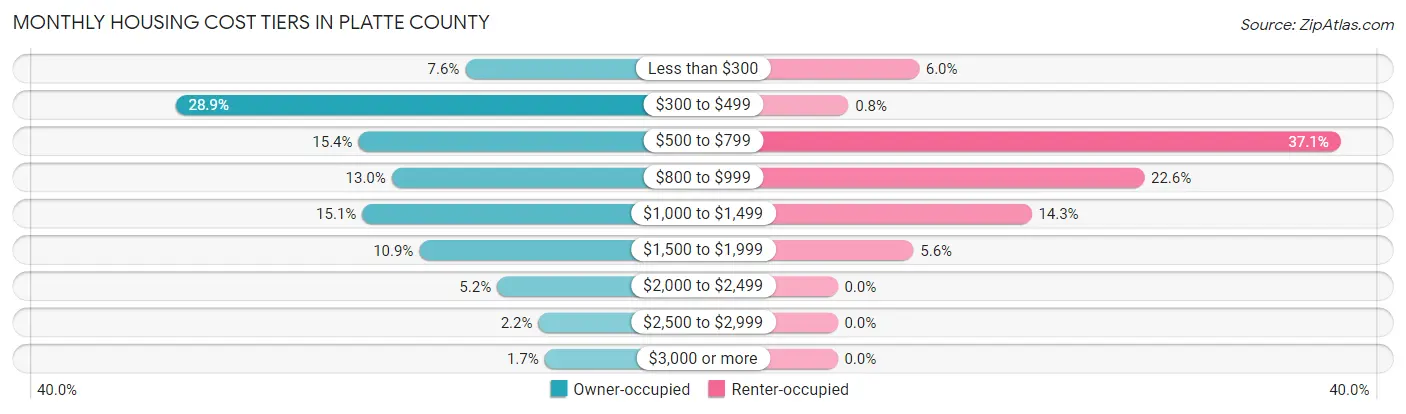
| Monthly Cost | Owner-occupied | Renter-occupied |
| Less than $300 | 216 (7.5%) | 60 (6.0%) |
| $300 to $499 | 826 (28.9%) | 8 (0.8%) |
| $500 to $799 | 441 (15.4%) | 371 (37.1%) |
| $800 to $999 | 371 (13.0%) | 226 (22.6%) |
| $1,000 to $1,499 | 433 (15.1%) | 143 (14.3%) |
| $1,500 to $1,999 | 313 (10.9%) | 56 (5.6%) |
| $2,000 to $2,499 | 149 (5.2%) | 0 (0.0%) |
| $2,500 to $2,999 | 62 (2.2%) | 0 (0.0%) |
| $3,000 or more | 49 (1.7%) | 0 (0.0%) |
| Total | 2,860 (100.0%) | 1,001 (100.0%) |
Physical Housing Characteristics in Platte County
Housing Structures in Platte County
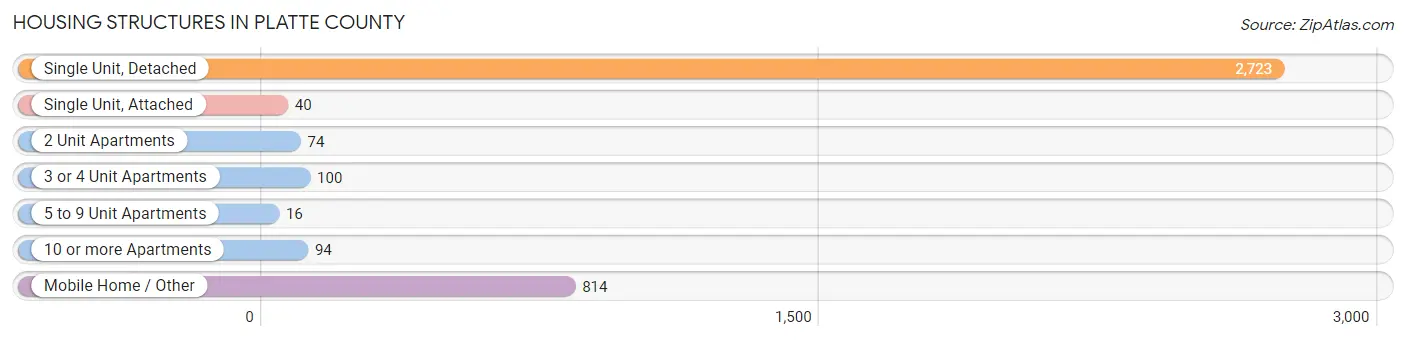
| Structure Type | # Housing Units | % Housing Units |
| Single Unit, Detached | 2,723 | 70.5% |
| Single Unit, Attached | 40 | 1.0% |
| 2 Unit Apartments | 74 | 1.9% |
| 3 or 4 Unit Apartments | 100 | 2.6% |
| 5 to 9 Unit Apartments | 16 | 0.4% |
| 10 or more Apartments | 94 | 2.4% |
| Mobile Home / Other | 814 | 21.1% |
| Total | 3,861 | 100.0% |
Housing Structures by Occupancy in Platte County
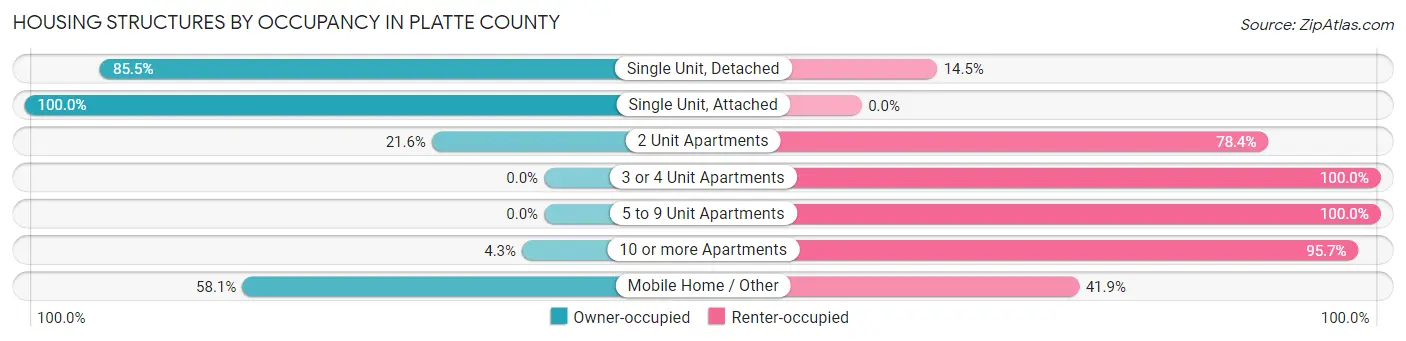
| Structure Type | Owner-occupied | Renter-occupied |
| Single Unit, Detached | 2,327 (85.5%) | 396 (14.5%) |
| Single Unit, Attached | 40 (100.0%) | 0 (0.0%) |
| 2 Unit Apartments | 16 (21.6%) | 58 (78.4%) |
| 3 or 4 Unit Apartments | 0 (0.0%) | 100 (100.0%) |
| 5 to 9 Unit Apartments | 0 (0.0%) | 16 (100.0%) |
| 10 or more Apartments | 4 (4.3%) | 90 (95.7%) |
| Mobile Home / Other | 473 (58.1%) | 341 (41.9%) |
| Total | 2,860 (74.1%) | 1,001 (25.9%) |
Housing Structures by Number of Rooms in Platte County
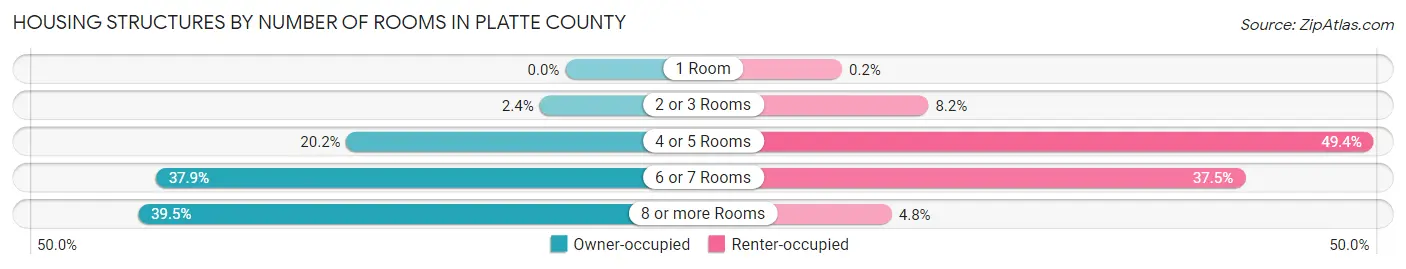
| Number of Rooms | Owner-occupied | Renter-occupied |
| 1 Room | 0 (0.0%) | 2 (0.2%) |
| 2 or 3 Rooms | 68 (2.4%) | 82 (8.2%) |
| 4 or 5 Rooms | 579 (20.2%) | 494 (49.3%) |
| 6 or 7 Rooms | 1,083 (37.9%) | 375 (37.5%) |
| 8 or more Rooms | 1,130 (39.5%) | 48 (4.8%) |
| Total | 2,860 (100.0%) | 1,001 (100.0%) |
Housing Structure by Heating Type in Platte County
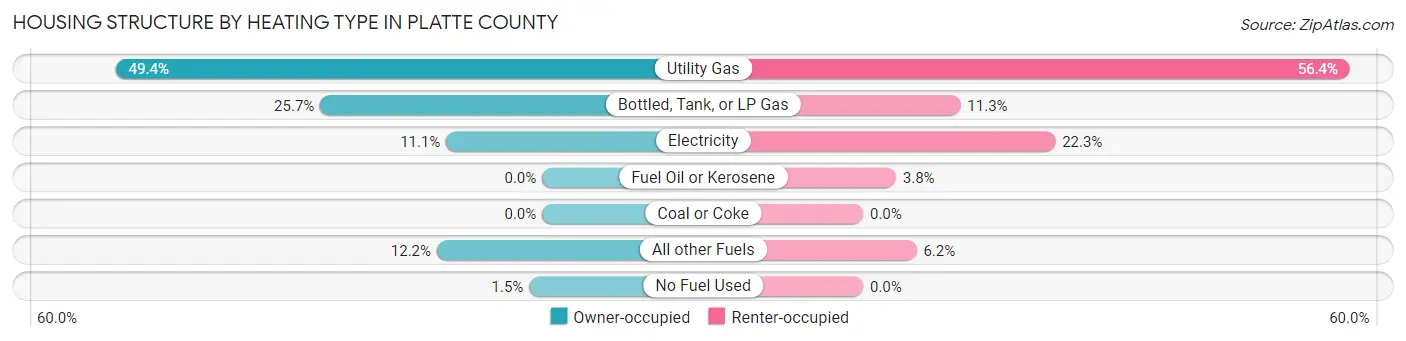
| Heating Type | Owner-occupied | Renter-occupied |
| Utility Gas | 1,414 (49.4%) | 565 (56.4%) |
| Bottled, Tank, or LP Gas | 736 (25.7%) | 113 (11.3%) |
| Electricity | 318 (11.1%) | 223 (22.3%) |
| Fuel Oil or Kerosene | 0 (0.0%) | 38 (3.8%) |
| Coal or Coke | 0 (0.0%) | 0 (0.0%) |
| All other Fuels | 349 (12.2%) | 62 (6.2%) |
| No Fuel Used | 43 (1.5%) | 0 (0.0%) |
| Total | 2,860 (100.0%) | 1,001 (100.0%) |
Household Vehicle Usage in Platte County
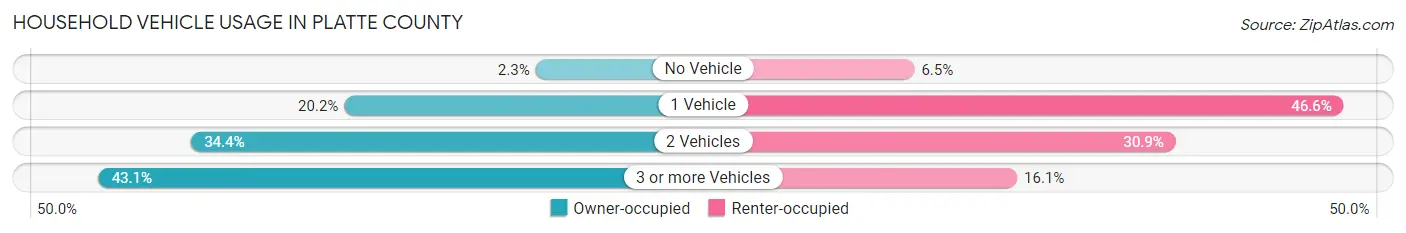
| Vehicles per Household | Owner-occupied | Renter-occupied |
| No Vehicle | 66 (2.3%) | 65 (6.5%) |
| 1 Vehicle | 577 (20.2%) | 466 (46.6%) |
| 2 Vehicles | 985 (34.4%) | 309 (30.9%) |
| 3 or more Vehicles | 1,232 (43.1%) | 161 (16.1%) |
| Total | 2,860 (100.0%) | 1,001 (100.0%) |
Real Estate & Mortgages in Platte County
Real Estate and Mortgage Overview in Platte County
| Characteristic | Without Mortgage | With Mortgage |
| Housing Units | 1,754 | 1,106 |
| Median Property Value | $222,900 | $254,000 |
| Median Household Income | $62,552 | $260 |
| Monthly Housing Costs | $469 | $49 |
| Real Estate Taxes | $1,226 | $13 |
Property Value by Mortgage Status in Platte County
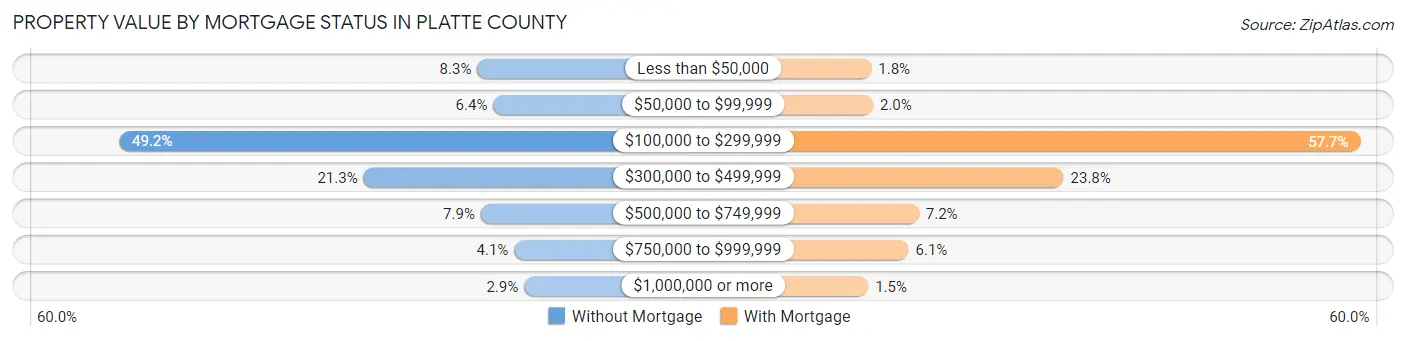
| Property Value | Without Mortgage | With Mortgage |
| Less than $50,000 | 145 (8.3%) | 20 (1.8%) |
| $50,000 to $99,999 | 113 (6.4%) | 22 (2.0%) |
| $100,000 to $299,999 | 863 (49.2%) | 638 (57.7%) |
| $300,000 to $499,999 | 373 (21.3%) | 263 (23.8%) |
| $500,000 to $749,999 | 138 (7.9%) | 80 (7.2%) |
| $750,000 to $999,999 | 71 (4.1%) | 67 (6.1%) |
| $1,000,000 or more | 51 (2.9%) | 16 (1.5%) |
| Total | 1,754 (100.0%) | 1,106 (100.0%) |
Household Income by Mortgage Status in Platte County
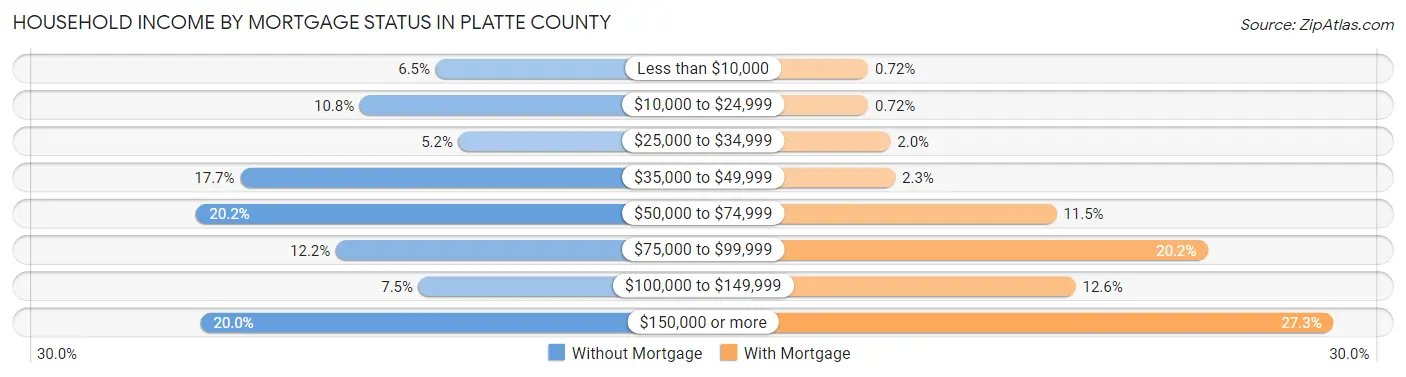
| Household Income | Without Mortgage | With Mortgage |
| Less than $10,000 | 114 (6.5%) | 8 (0.7%) |
| $10,000 to $24,999 | 190 (10.8%) | 8 (0.7%) |
| $25,000 to $34,999 | 91 (5.2%) | 22 (2.0%) |
| $35,000 to $49,999 | 310 (17.7%) | 25 (2.3%) |
| $50,000 to $74,999 | 354 (20.2%) | 127 (11.5%) |
| $75,000 to $99,999 | 214 (12.2%) | 223 (20.2%) |
| $100,000 to $149,999 | 131 (7.5%) | 139 (12.6%) |
| $150,000 or more | 350 (20.0%) | 302 (27.3%) |
| Total | 1,754 (100.0%) | 1,106 (100.0%) |
Property Value to Household Income Ratio in Platte County
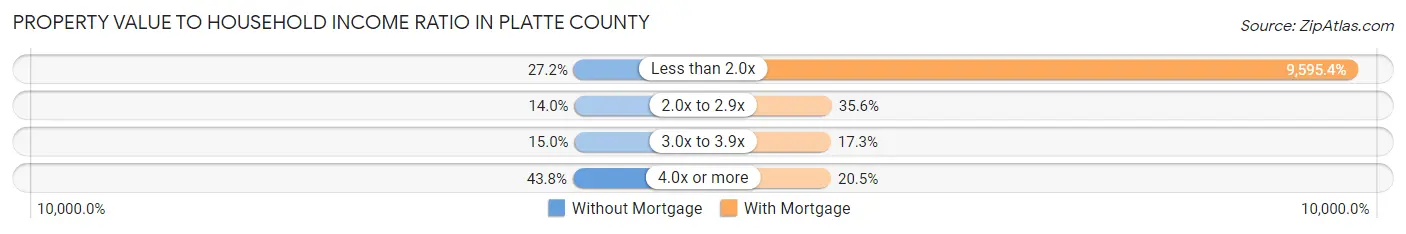
| Value-to-Income Ratio | Without Mortgage | With Mortgage |
| Less than 2.0x | 477 (27.2%) | 106,125 (9,595.4%) |
| 2.0x to 2.9x | 246 (14.0%) | 394 (35.6%) |
| 3.0x to 3.9x | 263 (15.0%) | 191 (17.3%) |
| 4.0x or more | 768 (43.8%) | 227 (20.5%) |
| Total | 1,754 (100.0%) | 1,106 (100.0%) |
Real Estate Taxes by Mortgage Status in Platte County
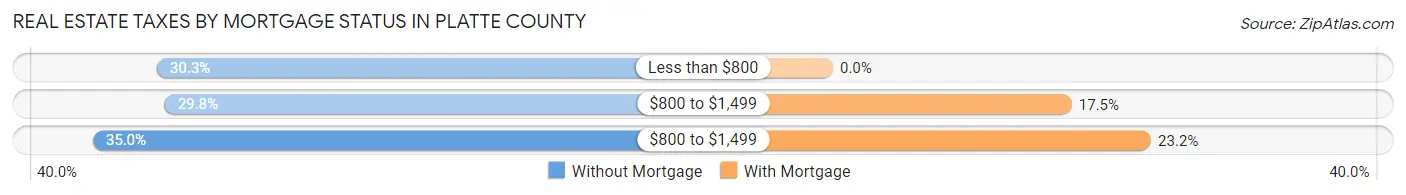
| Property Taxes | Without Mortgage | With Mortgage |
| Less than $800 | 532 (30.3%) | 0 (0.0%) |
| $800 to $1,499 | 522 (29.8%) | 193 (17.4%) |
| $800 to $1,499 | 614 (35.0%) | 257 (23.2%) |
| Total | 1,754 (100.0%) | 1,106 (100.0%) |
Health & Disability in Platte County
Health Insurance Coverage by Age in Platte County
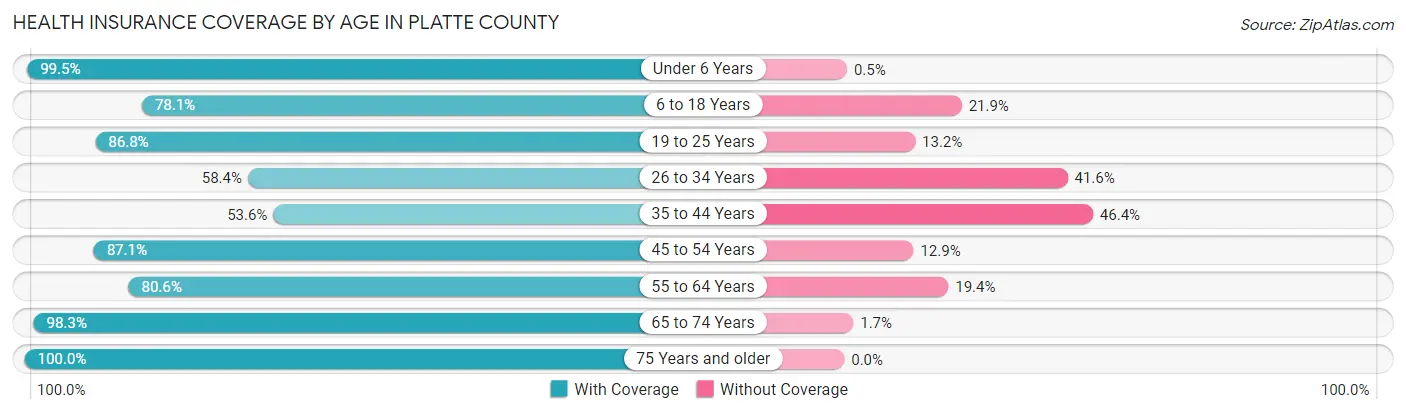
| Age Bracket | With Coverage | Without Coverage |
| Under 6 Years | 398 (99.5%) | 2 (0.5%) |
| 6 to 18 Years | 1,081 (78.1%) | 303 (21.9%) |
| 19 to 25 Years | 322 (86.8%) | 49 (13.2%) |
| 26 to 34 Years | 450 (58.4%) | 321 (41.6%) |
| 35 to 44 Years | 531 (53.6%) | 459 (46.4%) |
| 45 to 54 Years | 844 (87.1%) | 125 (12.9%) |
| 55 to 64 Years | 1,085 (80.6%) | 261 (19.4%) |
| 65 to 74 Years | 1,291 (98.3%) | 22 (1.7%) |
| 75 Years and older | 933 (100.0%) | 0 (0.0%) |
| Total | 6,935 (81.8%) | 1,542 (18.2%) |
Health Insurance Coverage by Citizenship Status in Platte County
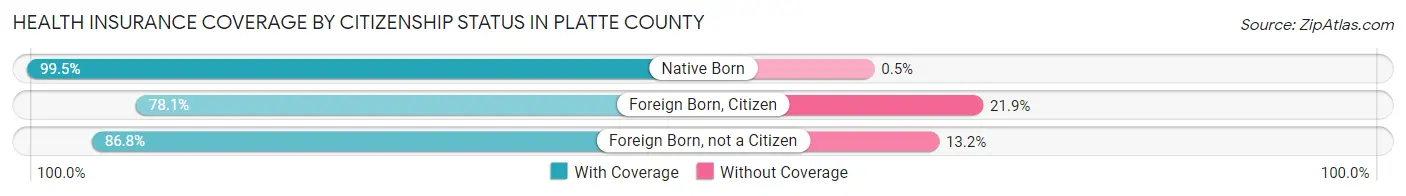
| Citizenship Status | With Coverage | Without Coverage |
| Native Born | 398 (99.5%) | 2 (0.5%) |
| Foreign Born, Citizen | 1,081 (78.1%) | 303 (21.9%) |
| Foreign Born, not a Citizen | 322 (86.8%) | 49 (13.2%) |
Health Insurance Coverage by Household Income in Platte County
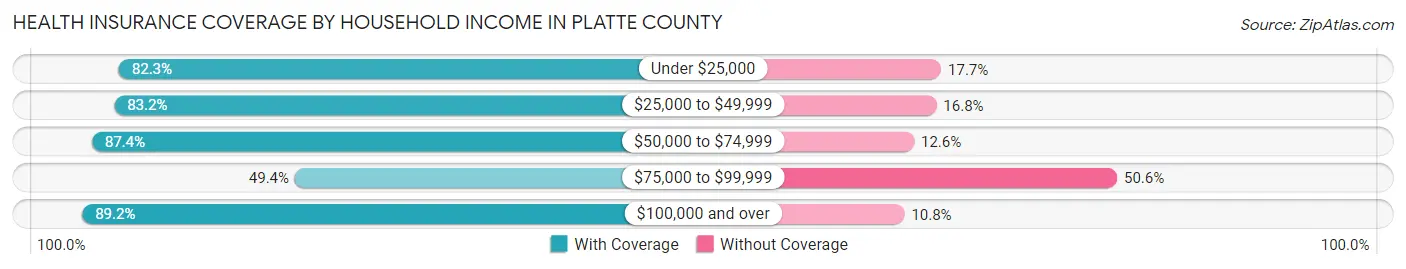
| Household Income | With Coverage | Without Coverage |
| Under $25,000 | 699 (82.3%) | 150 (17.7%) |
| $25,000 to $49,999 | 1,313 (83.2%) | 265 (16.8%) |
| $50,000 to $74,999 | 1,429 (87.4%) | 206 (12.6%) |
| $75,000 to $99,999 | 551 (49.4%) | 565 (50.6%) |
| $100,000 and over | 2,941 (89.2%) | 356 (10.8%) |
Public vs Private Health Insurance Coverage by Age in Platte County
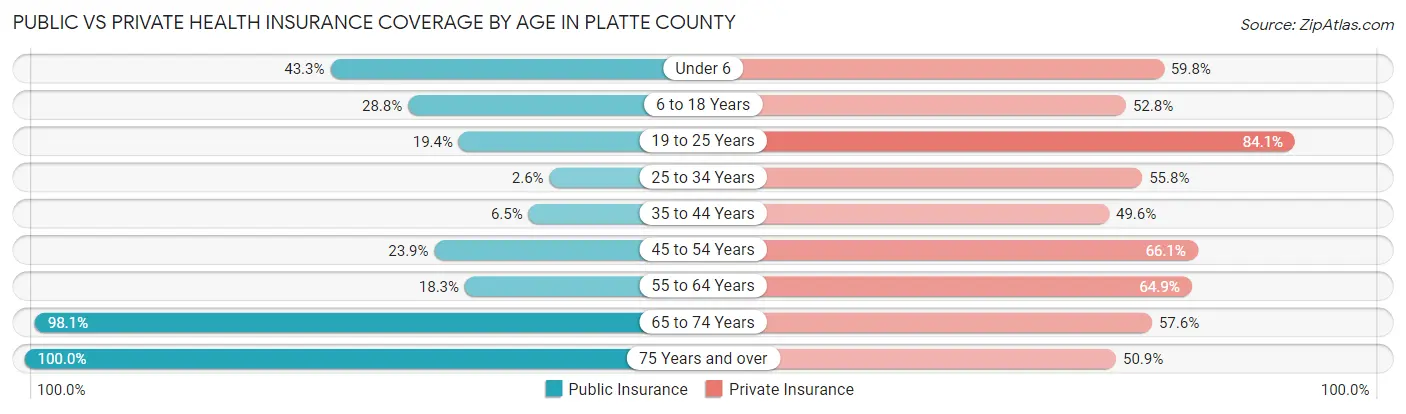
| Age Bracket | Public Insurance | Private Insurance |
| Under 6 | 173 (43.2%) | 239 (59.8%) |
| 6 to 18 Years | 399 (28.8%) | 730 (52.7%) |
| 19 to 25 Years | 72 (19.4%) | 312 (84.1%) |
| 25 to 34 Years | 20 (2.6%) | 430 (55.8%) |
| 35 to 44 Years | 64 (6.5%) | 491 (49.6%) |
| 45 to 54 Years | 232 (23.9%) | 640 (66.0%) |
| 55 to 64 Years | 246 (18.3%) | 874 (64.9%) |
| 65 to 74 Years | 1,288 (98.1%) | 756 (57.6%) |
| 75 Years and over | 933 (100.0%) | 475 (50.9%) |
| Total | 3,427 (40.4%) | 4,947 (58.4%) |
Disability Status by Sex by Age in Platte County
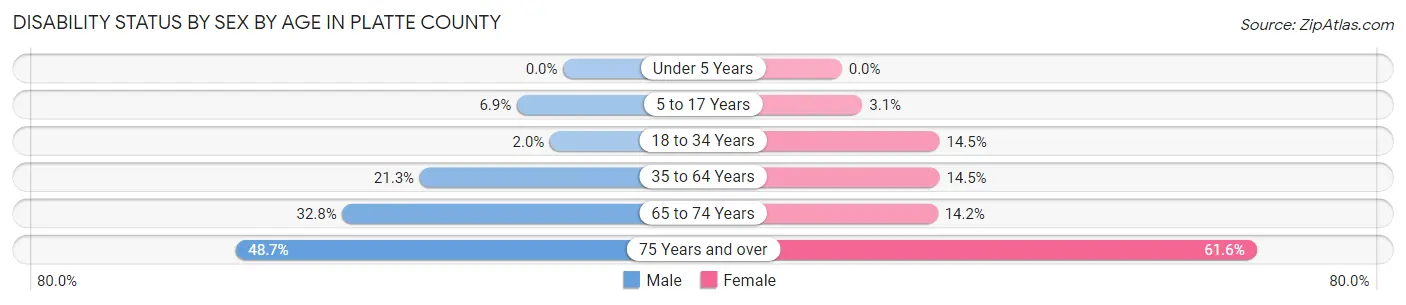
| Age Bracket | Male | Female |
| Under 5 Years | 0 (0.0%) | 0 (0.0%) |
| 5 to 17 Years | 49 (6.9%) | 18 (3.0%) |
| 18 to 34 Years | 13 (2.0%) | 84 (14.5%) |
| 35 to 64 Years | 341 (21.3%) | 247 (14.5%) |
| 65 to 74 Years | 221 (32.8%) | 91 (14.2%) |
| 75 Years and over | 225 (48.7%) | 290 (61.6%) |
Disability Class by Sex by Age in Platte County
Disability Class: Hearing Difficulty
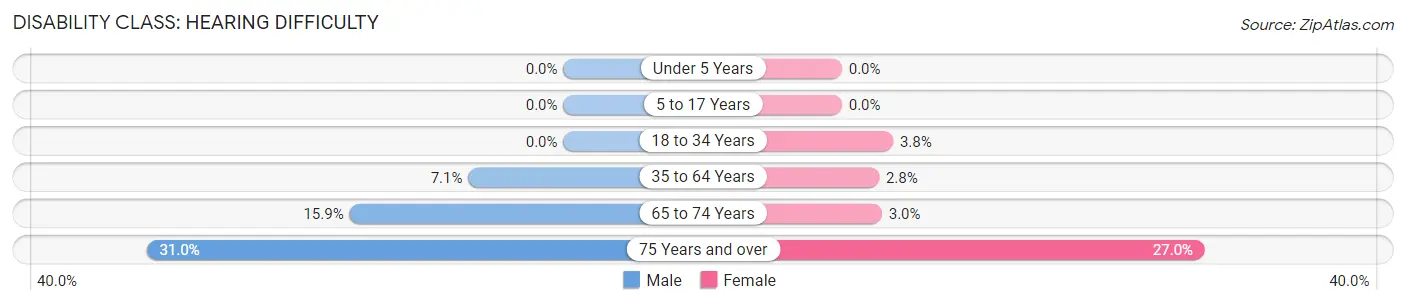
| Age Bracket | Male | Female |
| Under 5 Years | 0 (0.0%) | 0 (0.0%) |
| 5 to 17 Years | 0 (0.0%) | 0 (0.0%) |
| 18 to 34 Years | 0 (0.0%) | 22 (3.8%) |
| 35 to 64 Years | 113 (7.1%) | 47 (2.8%) |
| 65 to 74 Years | 107 (15.9%) | 19 (3.0%) |
| 75 Years and over | 143 (30.9%) | 127 (27.0%) |
Disability Class: Vision Difficulty
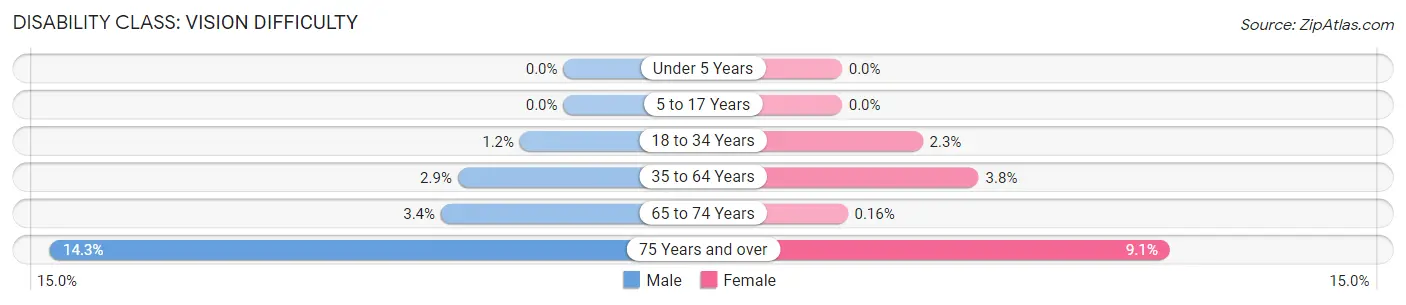
| Age Bracket | Male | Female |
| Under 5 Years | 0 (0.0%) | 0 (0.0%) |
| 5 to 17 Years | 0 (0.0%) | 0 (0.0%) |
| 18 to 34 Years | 8 (1.2%) | 13 (2.2%) |
| 35 to 64 Years | 47 (2.9%) | 65 (3.8%) |
| 65 to 74 Years | 23 (3.4%) | 1 (0.2%) |
| 75 Years and over | 66 (14.3%) | 43 (9.1%) |
Disability Class: Cognitive Difficulty
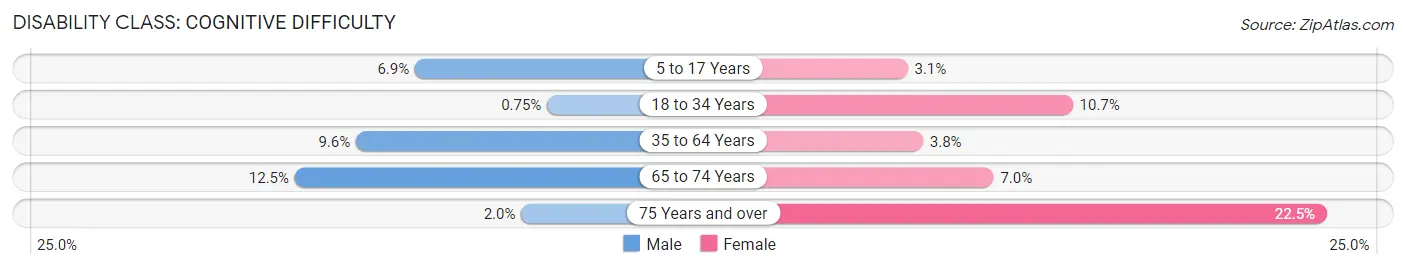
| Age Bracket | Male | Female |
| 5 to 17 Years | 49 (6.9%) | 18 (3.0%) |
| 18 to 34 Years | 5 (0.7%) | 62 (10.7%) |
| 35 to 64 Years | 154 (9.6%) | 64 (3.8%) |
| 65 to 74 Years | 84 (12.5%) | 45 (7.0%) |
| 75 Years and over | 9 (1.9%) | 106 (22.5%) |
Disability Class: Ambulatory Difficulty
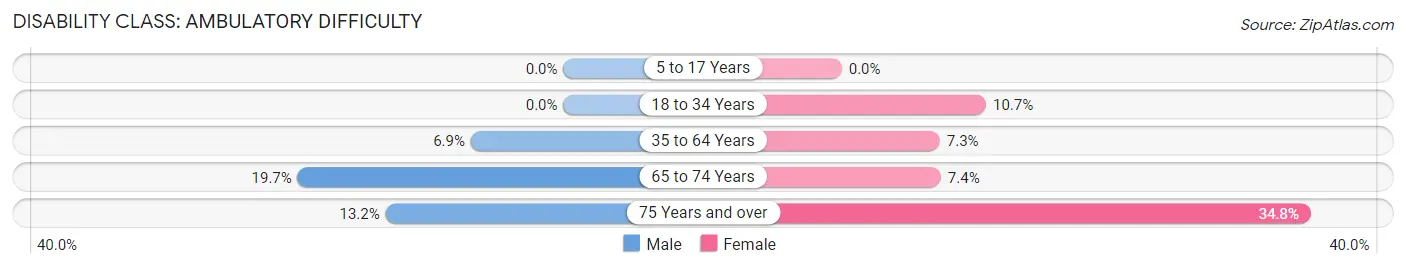
| Age Bracket | Male | Female |
| 5 to 17 Years | 0 (0.0%) | 0 (0.0%) |
| 18 to 34 Years | 0 (0.0%) | 62 (10.7%) |
| 35 to 64 Years | 110 (6.9%) | 124 (7.3%) |
| 65 to 74 Years | 133 (19.7%) | 47 (7.4%) |
| 75 Years and over | 61 (13.2%) | 164 (34.8%) |
Disability Class: Self-Care Difficulty

| Age Bracket | Male | Female |
| 5 to 17 Years | 0 (0.0%) | 0 (0.0%) |
| 18 to 34 Years | 0 (0.0%) | 62 (10.7%) |
| 35 to 64 Years | 27 (1.7%) | 26 (1.5%) |
| 65 to 74 Years | 24 (3.6%) | 6 (0.9%) |
| 75 Years and over | 29 (6.3%) | 32 (6.8%) |
Technology Access in Platte County
Computing Device Access in Platte County
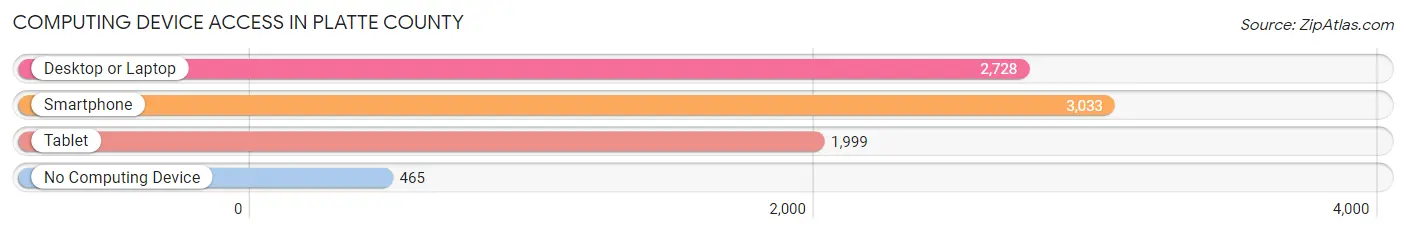
| Device Type | # Households | % Households |
| Desktop or Laptop | 2,728 | 70.7% |
| Smartphone | 3,033 | 78.5% |
| Tablet | 1,999 | 51.8% |
| No Computing Device | 465 | 12.0% |
| Total | 3,861 | 100.0% |
Internet Access in Platte County
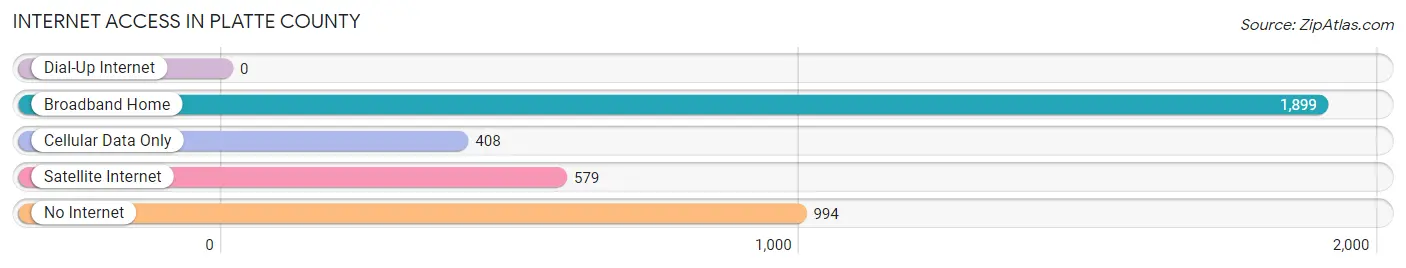
| Internet Type | # Households | % Households |
| Dial-Up Internet | 0 | 0.0% |
| Broadband Home | 1,899 | 49.2% |
| Cellular Data Only | 408 | 10.6% |
| Satellite Internet | 579 | 15.0% |
| No Internet | 994 | 25.7% |
| Total | 3,861 | 100.0% |
Platte County Summary
Platte County, Wyoming is located in the southeastern corner of the state and is bordered by Goshen County to the north, Laramie County to the west, and Converse County to the south. The county seat is Wheatland, and the county has a total area of 1,845 square miles. As of the 2010 census, the population was 8,607, making it the least populous county in Wyoming.
History
Platte County was created in 1911 from parts of Laramie and Goshen counties. It was named for the North Platte River, which flows through the county. The county was originally inhabited by Native American tribes, including the Arapaho, Cheyenne, and Sioux.
In the late 19th century, the area was settled by ranchers and farmers, and the county was organized in 1911. The county seat was established in Wheatland, which was named for the wheat fields that surrounded the town.
Geography
Platte County is located in the southeastern corner of Wyoming and is bordered by Goshen County to the north, Laramie County to the west, and Converse County to the south. The county has a total area of 1,845 square miles, of which 1,837 square miles is land and 8 square miles is water.
The county is mostly flat, with rolling hills in the north and east. The North Platte River flows through the county, and there are several small lakes and reservoirs. The county is also home to several wildlife refuges, including the Guernsey State Park and the Pathfinder National Wildlife Refuge.
Economy
The economy of Platte County is largely based on agriculture and ranching. The county is home to several large cattle ranches, and wheat, corn, and hay are the main crops grown in the area.
The county is also home to several oil and gas fields, and there are several coal mines in the area. The county is also home to several manufacturing companies, including a plastics plant and a paper mill.
Demographics
As of the 2010 census, the population of Platte County was 8,607, making it the least populous county in Wyoming. The population is spread out with a median age of 38.7 years. The racial makeup of the county is 94.3% White, 0.7% Native American, 0.3% Asian, 0.2% Black or African American, 0.1% Pacific Islander, and 4.4% from other races.
The median household income in Platte County is $50,945, and the median family income is $58,958. The per capita income is $25,845. The unemployment rate is 4.2%.
Conclusion
Platte County, Wyoming is located in the southeastern corner of the state and is bordered by Goshen County to the north, Laramie County to the west, and Converse County to the south. The county has a total area of 1,845 square miles, and the population was 8,607 as of the 2010 census. The economy of Platte County is largely based on agriculture and ranching, and the county is also home to several oil and gas fields, coal mines, and manufacturing companies. The median household income in Platte County is $50,945, and the unemployment rate is 4.2%.
Common Questions
What is the Total Population of Platte County?
Total Population of Platte County is 8,618.
What is the Total Male Population of Platte County?
Total Male Population of Platte County is 4,406.
What is the Total Female Population of Platte County?
Total Female Population of Platte County is 4,212.
What is the Ratio of Males per 100 Females in Platte County?
There are 104.61 Males per 100 Females in Platte County.
What is the Ratio of Females per 100 Males in Platte County?
There are 95.60 Females per 100 Males in Platte County.
What is the Median Population Age in Platte County?
Median Population Age in Platte County is 49.1 Years.
What is the Average Family Size in Platte County
Average Family Size in Platte County is 2.8 People.
What is the Average Household Size in Platte County
Average Household Size in Platte County is 2.2 People.
What is Per Capita Income in Platte County?
Per Capita income in Platte County is $37,756.
What is the Median Family Income in Platte County?
Median Family Income in Platte County is $87,321.
What is the Median Household income in Platte County?
Median Household Income in Platte County is $64,753.
What is Income or Wage Gap in Platte County?
Income or Wage Gap in Platte County is 34.4%.
Women in Platte County earn 65.6 cents for every dollar earned by a man.
What is Family Income Deficit in Platte County?
Family Income Deficit in Platte County is $8,164.
Families that are below poverty line in Platte County earn $8,164 less on average than the poverty threshold level.
What is Inequality or Gini Index in Platte County?
Inequality or Gini Index in Platte County is 0.44.
How Large is the Labor Force in Platte County?
There are 3,854 People in the Labor Forcein in Platte County.
What is the Percentage of People in the Labor Force in Platte County?
53.6% of People are in the Labor Force in Platte County.
What is the Unemployment Rate in Platte County?
Unemployment Rate in Platte County is 4.0%.