Park County, WY
Park County Map
Park County Overview
29,878
TOTAL POPULATION
14,832
MALE POPULATION
15,046
FEMALE POPULATION
98.58
MALES / 100 FEMALES
101.44
FEMALES / 100 MALES
45.0
MEDIAN AGE
2.8
AVG FAMILY SIZE
2.2
AVG HOUSEHOLD SIZE
$37,544
PER CAPITA INCOME
$83,265
AVG FAMILY INCOME
$66,754
AVG HOUSEHOLD INCOME
42.5%
WAGE / INCOME GAP [ % ]
57.5¢/ $1
WAGE / INCOME GAP [ $ ]
$7,877
FAMILY INCOME DEFICIT
0.42
INEQUALITY / GINI INDEX
14,974
LABOR FORCE [ PEOPLE ]
61.2%
PERCENT IN LABOR FORCE
2.7%
UNEMPLOYMENT RATE
Park County Area Codes
Race in Park County
The most populous races in Park County are White / Caucasian (26,908 | 90.1%), Hispanic or Latino (1,797 | 6.0%), and Two or more Races (1,717 | 5.8%).
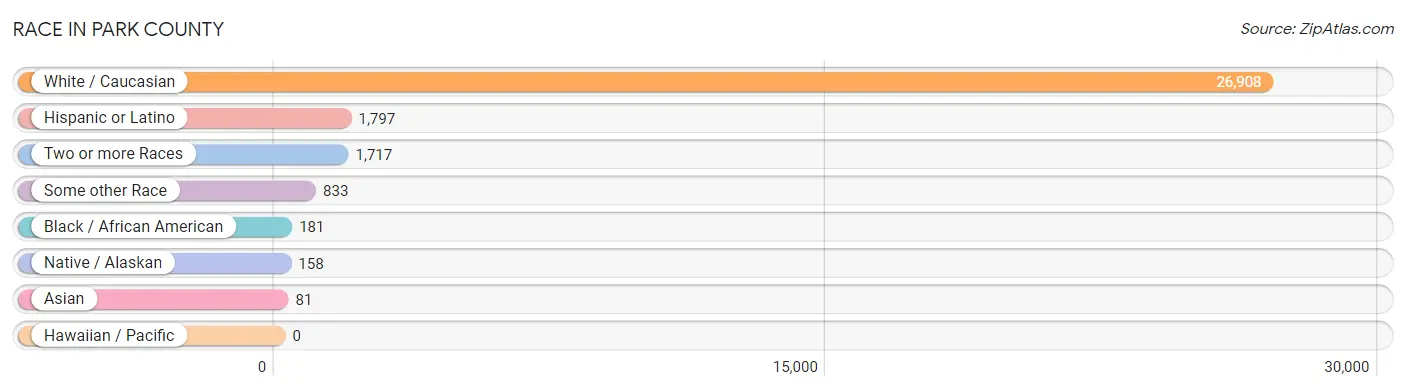
| Race | # Population | % Population |
| Asian | 81 | 0.3% |
| Black / African American | 181 | 0.6% |
| Hawaiian / Pacific | 0 | 0.0% |
| Hispanic or Latino | 1,797 | 6.0% |
| Native / Alaskan | 158 | 0.5% |
| White / Caucasian | 26,908 | 90.1% |
| Two or more Races | 1,717 | 5.8% |
| Some other Race | 833 | 2.8% |
| Total | 29,878 | 100.0% |
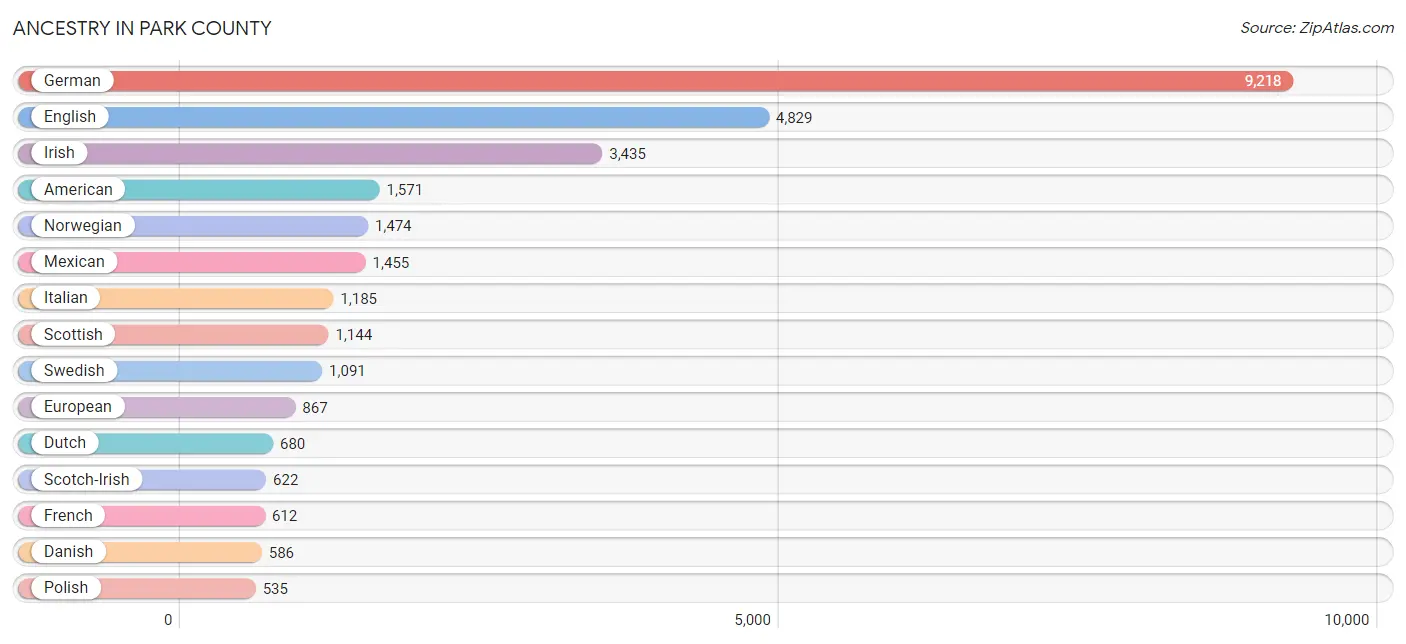
Ancestry in Park County
The most populous ancestries reported in Park County are German (9,218 | 30.8%), English (4,829 | 16.2%), Irish (3,435 | 11.5%), American (1,571 | 5.3%), and Norwegian (1,474 | 4.9%), together accounting for 68.7% of all Park County residents.
| Ancestry | # Population | % Population |
| African | 8 | 0.0% |
| American | 1,571 | 5.3% |
| Apache | 23 | 0.1% |
| Arab | 2 | 0.0% |
| Arapaho | 2 | 0.0% |
| Argentinean | 12 | 0.0% |
| Armenian | 25 | 0.1% |
| Australian | 26 | 0.1% |
| Austrian | 98 | 0.3% |
| Basque | 8 | 0.0% |
| Belgian | 37 | 0.1% |
| Bhutanese | 198 | 0.7% |
| Blackfeet | 1 | 0.0% |
| Bolivian | 11 | 0.0% |
| Brazilian | 2 | 0.0% |
| British | 381 | 1.3% |
| Burmese | 14 | 0.1% |
| Canadian | 101 | 0.3% |
| Central American | 42 | 0.1% |
| Cherokee | 14 | 0.1% |
| Cheyenne | 2 | 0.0% |
| Chilean | 10 | 0.0% |
| Chippewa | 35 | 0.1% |
| Choctaw | 18 | 0.1% |
| Colombian | 22 | 0.1% |
| Cree | 11 | 0.0% |
| Croatian | 93 | 0.3% |
| Crow | 7 | 0.0% |
| Cuban | 41 | 0.1% |
| Czech | 206 | 0.7% |
| Danish | 586 | 2.0% |
| Dutch | 680 | 2.3% |
| Dutch West Indian | 2 | 0.0% |
| Eastern European | 111 | 0.4% |
| English | 4,829 | 16.2% |
| European | 867 | 2.9% |
| Finnish | 104 | 0.4% |
| French | 612 | 2.1% |
| French Canadian | 158 | 0.5% |
| German | 9,218 | 30.8% |
| German Russian | 48 | 0.2% |
| Greek | 128 | 0.4% |
| Guatemalan | 7 | 0.0% |
| Hungarian | 42 | 0.1% |
| Indian (Asian) | 112 | 0.4% |
| Irish | 3,435 | 11.5% |
| Italian | 1,185 | 4.0% |
| Jamaican | 1 | 0.0% |
| Kenyan | 26 | 0.1% |
| Korean | 47 | 0.2% |
| Lebanese | 2 | 0.0% |
| Lithuanian | 40 | 0.1% |
| Mexican | 1,455 | 4.9% |
| Native Hawaiian | 54 | 0.2% |
| Northern European | 55 | 0.2% |
| Norwegian | 1,474 | 4.9% |
| Panamanian | 35 | 0.1% |
| Pennsylvania German | 38 | 0.1% |
| Polish | 535 | 1.8% |
| Portuguese | 14 | 0.1% |
| Pueblo | 18 | 0.1% |
| Puerto Rican | 11 | 0.0% |
| Russian | 396 | 1.3% |
| Samoan | 2 | 0.0% |
| Scandinavian | 366 | 1.2% |
| Scotch-Irish | 622 | 2.1% |
| Scottish | 1,144 | 3.8% |
| Serbian | 10 | 0.0% |
| Shoshone | 9 | 0.0% |
| Sioux | 43 | 0.1% |
| Slavic | 31 | 0.1% |
| Slovak | 90 | 0.3% |
| Slovene | 107 | 0.4% |
| South American | 55 | 0.2% |
| Spaniard | 25 | 0.1% |
| Spanish | 12 | 0.0% |
| Subsaharan African | 53 | 0.2% |
| Swedish | 1,091 | 3.6% |
| Swiss | 133 | 0.4% |
| Tlingit-Haida | 9 | 0.0% |
| Turkish | 10 | 0.0% |
| Ugandan | 17 | 0.1% |
| Ukrainian | 1 | 0.0% |
| Welsh | 340 | 1.1% |
| Yugoslavian | 33 | 0.1% | View All 85 Rows |
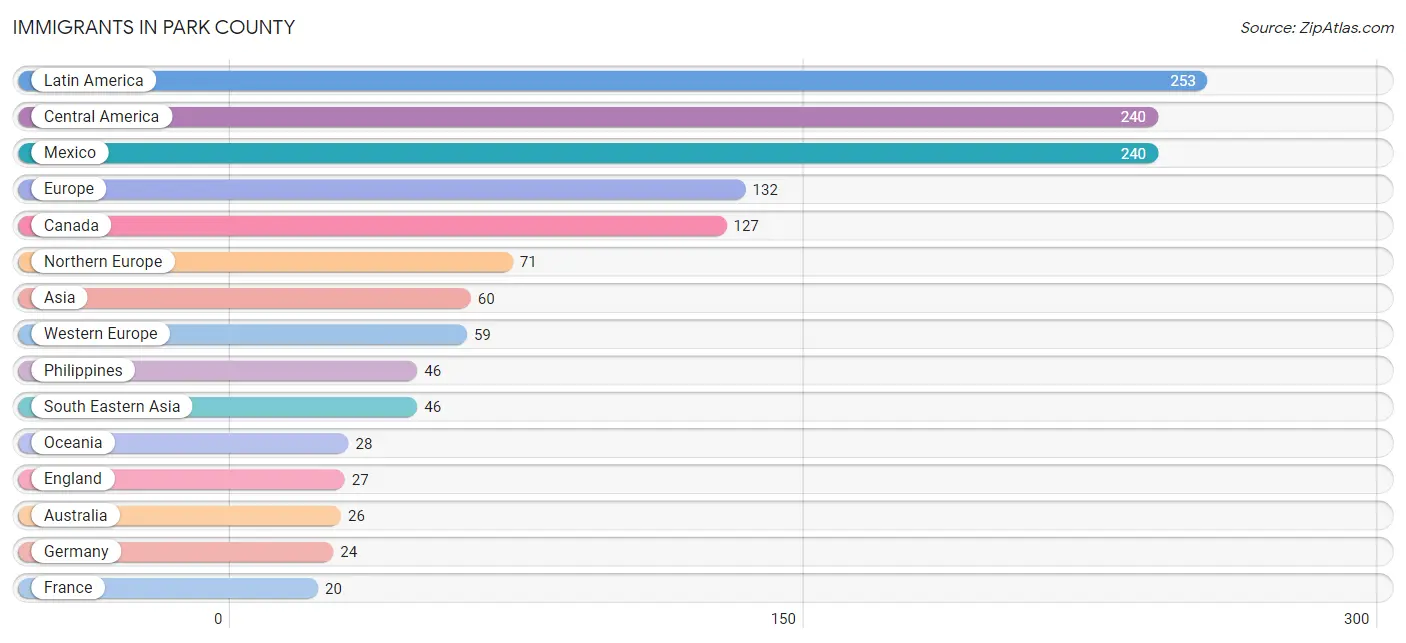
Immigrants in Park County
The most numerous immigrant groups reported in Park County came from Latin America (253 | 0.9%), Central America (240 | 0.8%), Mexico (240 | 0.8%), Europe (132 | 0.4%), and Canada (127 | 0.4%), together accounting for 3.3% of all Park County residents.
| Immigration Origin | # Population | % Population |
| Africa | 19 | 0.1% |
| Asia | 60 | 0.2% |
| Australia | 26 | 0.1% |
| Belgium | 15 | 0.1% |
| Brazil | 2 | 0.0% |
| Canada | 127 | 0.4% |
| Caribbean | 1 | 0.0% |
| Central America | 240 | 0.8% |
| Chile | 10 | 0.0% |
| Eastern Africa | 19 | 0.1% |
| Eastern Asia | 11 | 0.0% |
| England | 27 | 0.1% |
| Europe | 132 | 0.4% |
| France | 20 | 0.1% |
| Germany | 24 | 0.1% |
| Ireland | 18 | 0.1% |
| Italy | 2 | 0.0% |
| Jamaica | 1 | 0.0% |
| Japan | 6 | 0.0% |
| Korea | 5 | 0.0% |
| Latin America | 253 | 0.9% |
| Mexico | 240 | 0.8% |
| Northern Europe | 71 | 0.2% |
| Oceania | 28 | 0.1% |
| Philippines | 46 | 0.2% |
| South America | 12 | 0.0% |
| South Central Asia | 3 | 0.0% |
| South Eastern Asia | 46 | 0.2% |
| Southern Europe | 2 | 0.0% |
| Sri Lanka | 3 | 0.0% |
| Uganda | 17 | 0.1% |
| Western Europe | 59 | 0.2% | View All 32 Rows |
Sex and Age in Park County
Sex and Age in Park County
The most populous age groups in Park County are 10 to 14 Years (1,341 | 9.0%) for men and 60 to 64 Years (1,486 | 9.9%) for women.
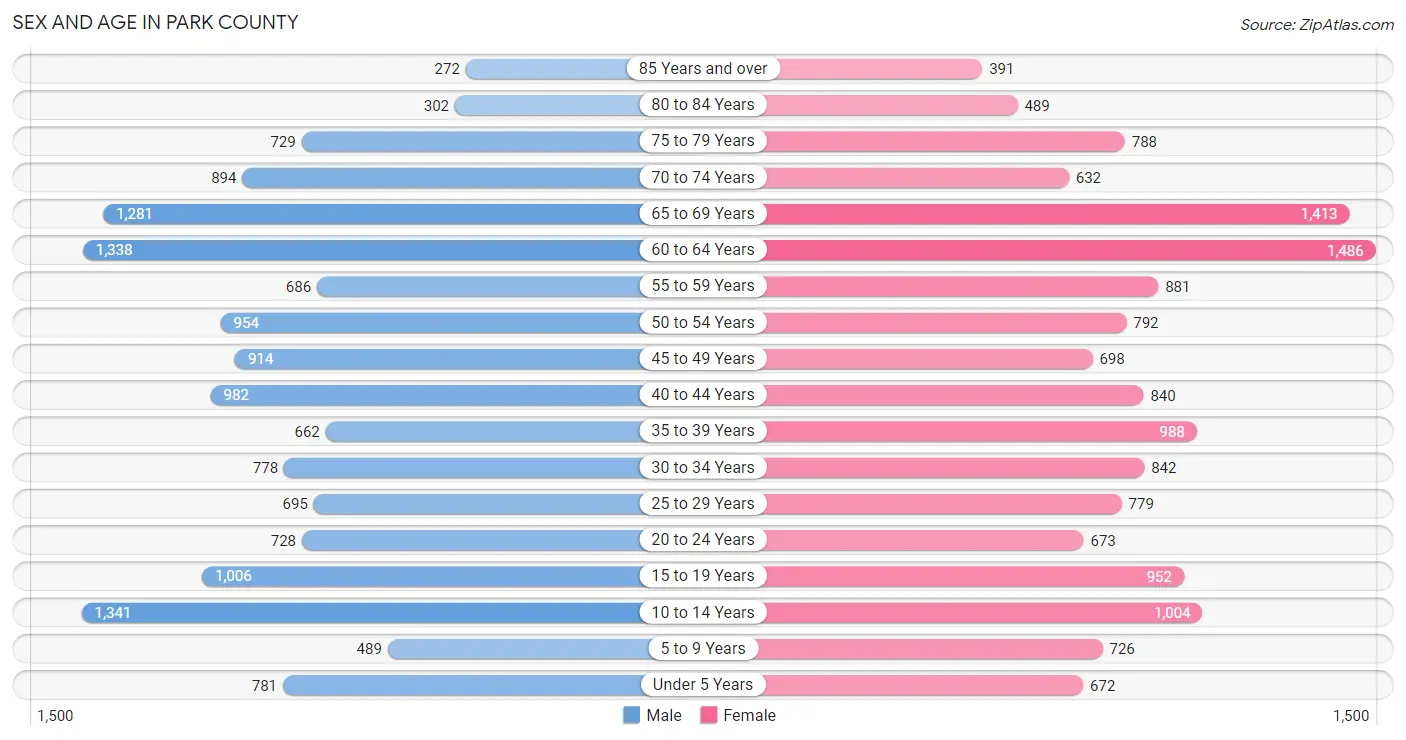
| Age Bracket | Male | Female |
| Under 5 Years | 781 (5.3%) | 672 (4.5%) |
| 5 to 9 Years | 489 (3.3%) | 726 (4.8%) |
| 10 to 14 Years | 1,341 (9.0%) | 1,004 (6.7%) |
| 15 to 19 Years | 1,006 (6.8%) | 952 (6.3%) |
| 20 to 24 Years | 728 (4.9%) | 673 (4.5%) |
| 25 to 29 Years | 695 (4.7%) | 779 (5.2%) |
| 30 to 34 Years | 778 (5.2%) | 842 (5.6%) |
| 35 to 39 Years | 662 (4.5%) | 988 (6.6%) |
| 40 to 44 Years | 982 (6.6%) | 840 (5.6%) |
| 45 to 49 Years | 914 (6.2%) | 698 (4.6%) |
| 50 to 54 Years | 954 (6.4%) | 792 (5.3%) |
| 55 to 59 Years | 686 (4.6%) | 881 (5.9%) |
| 60 to 64 Years | 1,338 (9.0%) | 1,486 (9.9%) |
| 65 to 69 Years | 1,281 (8.6%) | 1,413 (9.4%) |
| 70 to 74 Years | 894 (6.0%) | 632 (4.2%) |
| 75 to 79 Years | 729 (4.9%) | 788 (5.2%) |
| 80 to 84 Years | 302 (2.0%) | 489 (3.3%) |
| 85 Years and over | 272 (1.8%) | 391 (2.6%) |
| Total | 14,832 (100.0%) | 15,046 (100.0%) |
Families and Households in Park County
Median Family Size in Park County
The median family size in Park County is 2.82 persons per family, with single female/mother families (688 | 8.4%) accounting for the largest median family size of 2.9 persons per family. On the other hand, single male/father families (664 | 8.1%) represent the smallest median family size with 2.55 persons per family.
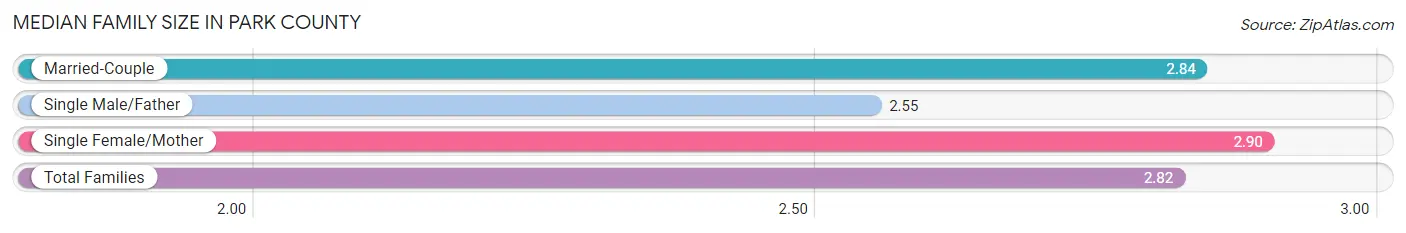
| Family Type | # Families | Family Size |
| Married-Couple | 6,847 (83.5%) | 2.84 |
| Single Male/Father | 664 (8.1%) | 2.55 |
| Single Female/Mother | 688 (8.4%) | 2.90 |
| Total Families | 8,199 (100.0%) | 2.82 |
Median Household Size in Park County
The median household size in Park County is 2.23 persons per household, with single female/mother households (688 | 5.3%) accounting for the largest median household size of 3.04 persons per household. non-family households (4,851 | 37.2%) represent the smallest median household size with 1.13 persons per household.
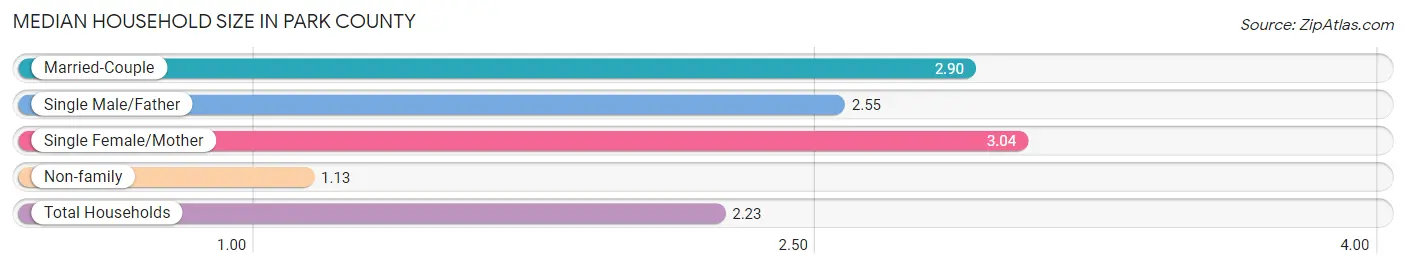
| Household Type | # Households | Household Size |
| Married-Couple | 6,847 (52.5%) | 2.90 |
| Single Male/Father | 664 (5.1%) | 2.55 |
| Single Female/Mother | 688 (5.3%) | 3.04 |
| Non-family | 4,851 (37.2%) | 1.13 |
| Total Households | 13,050 (100.0%) | 2.23 |
Household Size by Marriage Status in Park County
Out of a total of 13,050 households in Park County, 8,199 (62.8%) are family households, while 4,851 (37.2%) are nonfamily households. The most numerous type of family households are 2-person households, comprising 4,828, and the most common type of nonfamily households are 1-person households, comprising 4,307.
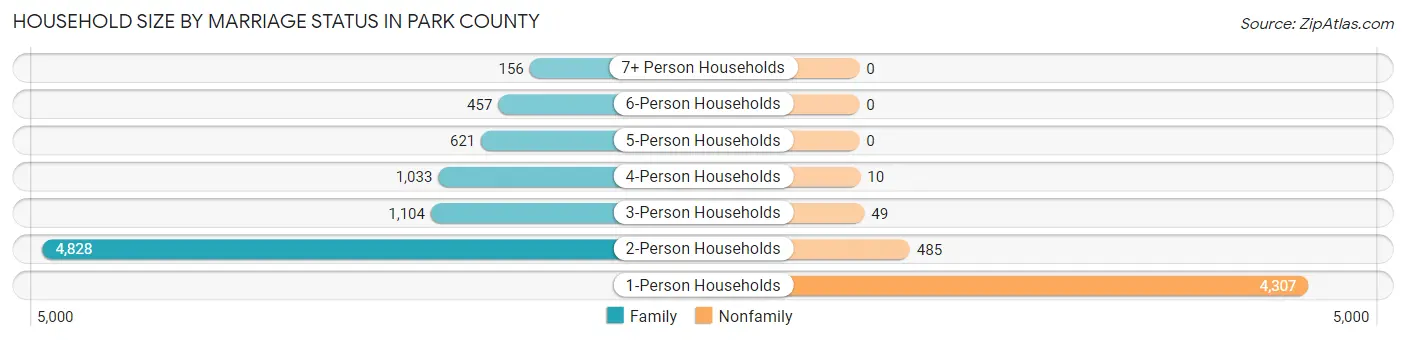
| Household Size | Family Households | Nonfamily Households |
| 1-Person Households | - | 4,307 (33.0%) |
| 2-Person Households | 4,828 (37.0%) | 485 (3.7%) |
| 3-Person Households | 1,104 (8.5%) | 49 (0.4%) |
| 4-Person Households | 1,033 (7.9%) | 10 (0.1%) |
| 5-Person Households | 621 (4.8%) | 0 (0.0%) |
| 6-Person Households | 457 (3.5%) | 0 (0.0%) |
| 7+ Person Households | 156 (1.2%) | 0 (0.0%) |
| Total | 8,199 (62.8%) | 4,851 (37.2%) |
Female Fertility in Park County
Fertility by Age in Park County
Average fertility rate in Park County is 88.0 births per 1,000 women. Women in the age bracket of 20 to 34 years have the highest fertility rate with 113.0 births per 1,000 women. Women in the age bracket of 20 to 34 years acount for 50.1% of all women with births.
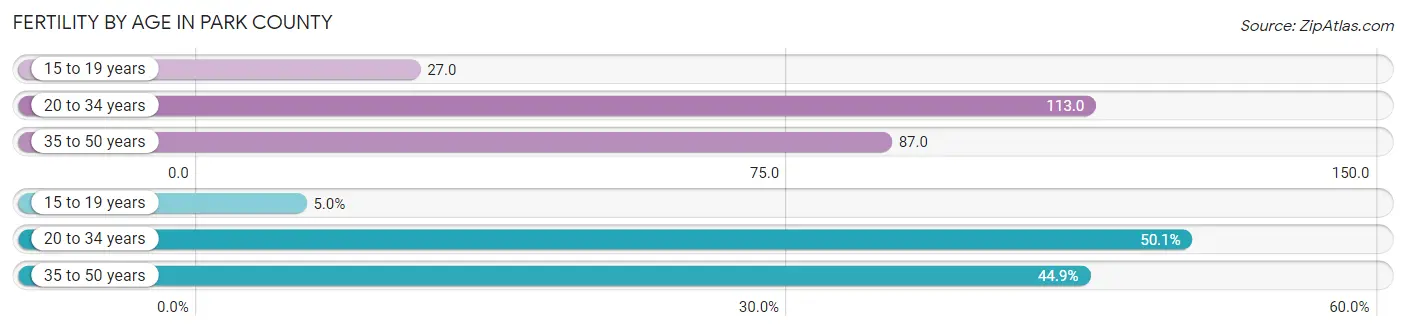
| Age Bracket | Women with Births | Births / 1,000 Women |
| 15 to 19 years | 26 (5.0%) | 27.0 |
| 20 to 34 years | 260 (50.1%) | 113.0 |
| 35 to 50 years | 233 (44.9%) | 87.0 |
| Total | 519 (100.0%) | 88.0 |
Fertility by Age by Marriage Status in Park County
80.2% of women with births (519) in Park County are married. The highest percentage of unmarried women with births falls into 15 to 19 years age bracket with 100.0% of them unmarried at the time of birth, while the lowest percentage of unmarried women with births belong to 35 to 50 years age bracket with 6.4% of them unmarried.
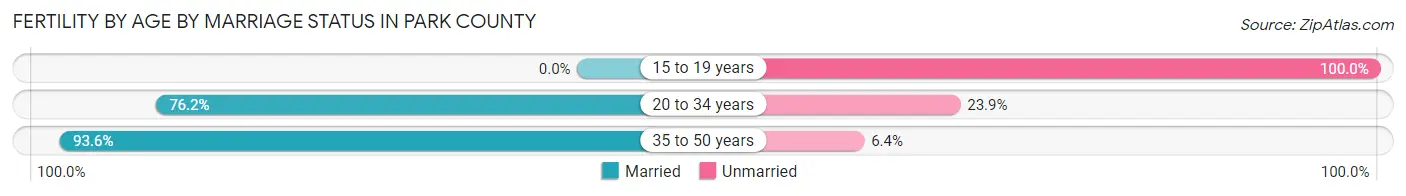
| Age Bracket | Married | Unmarried |
| 15 to 19 years | 0 (0.0%) | 26 (100.0%) |
| 20 to 34 years | 198 (76.1%) | 62 (23.8%) |
| 35 to 50 years | 218 (93.6%) | 15 (6.4%) |
| Total | 416 (80.1%) | 103 (19.9%) |
Fertility by Education in Park County
Average fertility rate in Park County is 88.0 births per 1,000 women. Women with the education attainment of bachelor's degree have the highest fertility rate of 105.0 births per 1,000 women, while women with the education attainment of less than high school have the lowest fertility at 33.0 births per 1,000 women. Women with the education attainment of college or associate's degree represent 45.3% of all women with births.
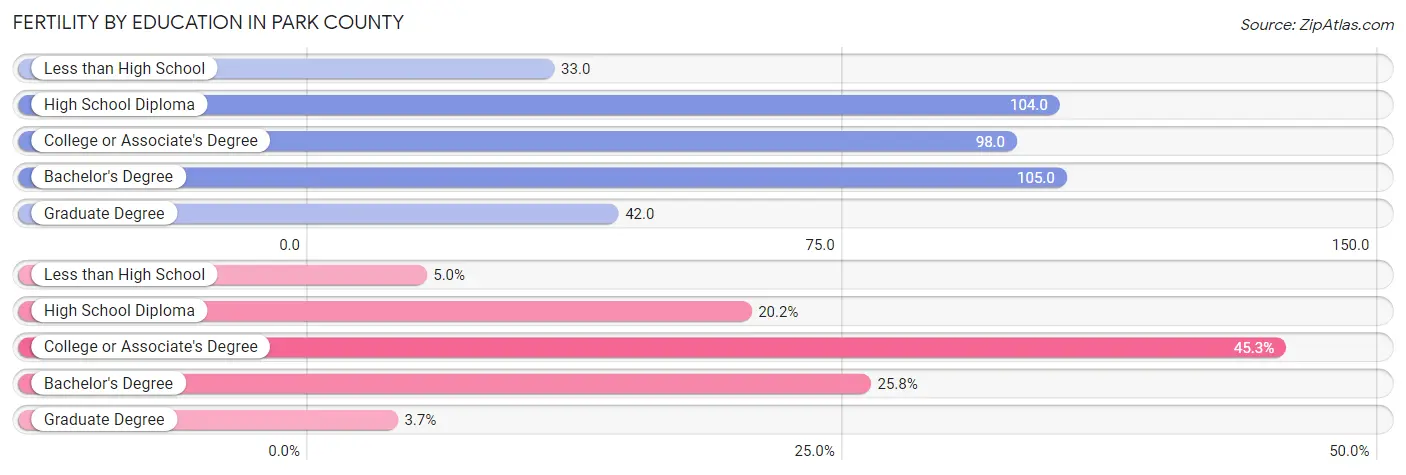
| Educational Attainment | Women with Births | Births / 1,000 Women |
| Less than High School | 26 (5.0%) | 33.0 |
| High School Diploma | 105 (20.2%) | 104.0 |
| College or Associate's Degree | 235 (45.3%) | 98.0 |
| Bachelor's Degree | 134 (25.8%) | 105.0 |
| Graduate Degree | 19 (3.7%) | 42.0 |
| Total | 519 (100.0%) | 88.0 |
Fertility by Education by Marriage Status in Park County
19.9% of women with births in Park County are unmarried. Women with the educational attainment of bachelor's degree are most likely to be married with 100.0% of them married at childbirth, while women with the educational attainment of less than high school are least likely to be married with 100.0% of them unmarried at childbirth.
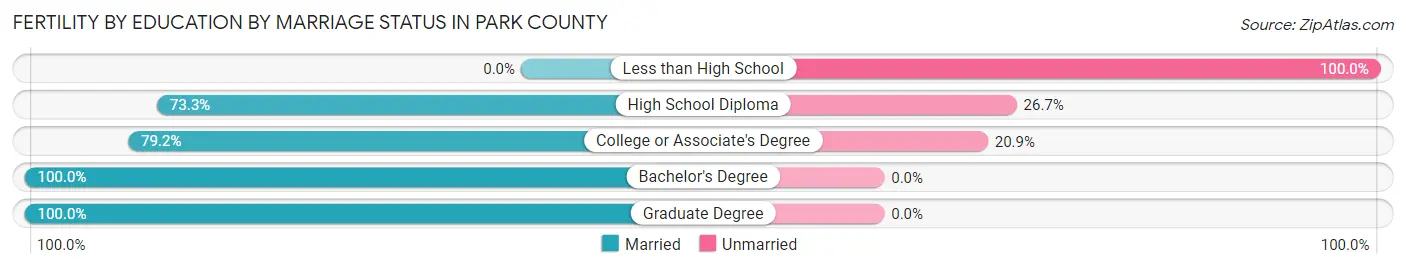
| Educational Attainment | Married | Unmarried |
| Less than High School | 0 (0.0%) | 26 (100.0%) |
| High School Diploma | 77 (73.3%) | 28 (26.7%) |
| College or Associate's Degree | 186 (79.1%) | 49 (20.8%) |
| Bachelor's Degree | 134 (100.0%) | 0 (0.0%) |
| Graduate Degree | 19 (100.0%) | 0 (0.0%) |
| Total | 416 (80.1%) | 103 (19.9%) |
Income in Park County
Income Overview in Park County
Per Capita Income in Park County is $37,544, while median incomes of families and households are $83,265 and $66,754 respectively.
| Characteristic | Number | Measure |
| Per Capita Income | 29,878 | $37,544 |
| Median Family Income | 8,199 | $83,265 |
| Mean Family Income | 8,199 | $103,053 |
| Median Household Income | 13,050 | $66,754 |
| Mean Household Income | 13,050 | $85,040 |
| Income Deficit | 8,199 | $7,877 |
| Wage / Income Gap (%) | 29,878 | 42.47% |
| Wage / Income Gap ($) | 29,878 | 57.53¢ per $1 |
| Gini / Inequality Index | 29,878 | 0.42 |
Earnings by Sex in Park County
Average Earnings in Park County are $33,630, $45,615 for men and $26,241 for women, a difference of 42.5%.
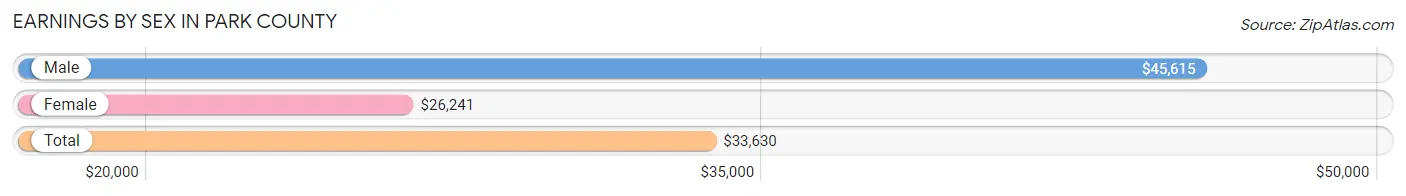
| Sex | Number | Average Earnings |
| Male | 8,307 (51.0%) | $45,615 |
| Female | 7,986 (49.0%) | $26,241 |
| Total | 16,293 (100.0%) | $33,630 |
Earnings by Sex by Income Bracket in Park County
The most common earnings brackets in Park County are $100,000+ for men (1,254 | 15.1%) and $2,499 or less for women (743 | 9.3%).
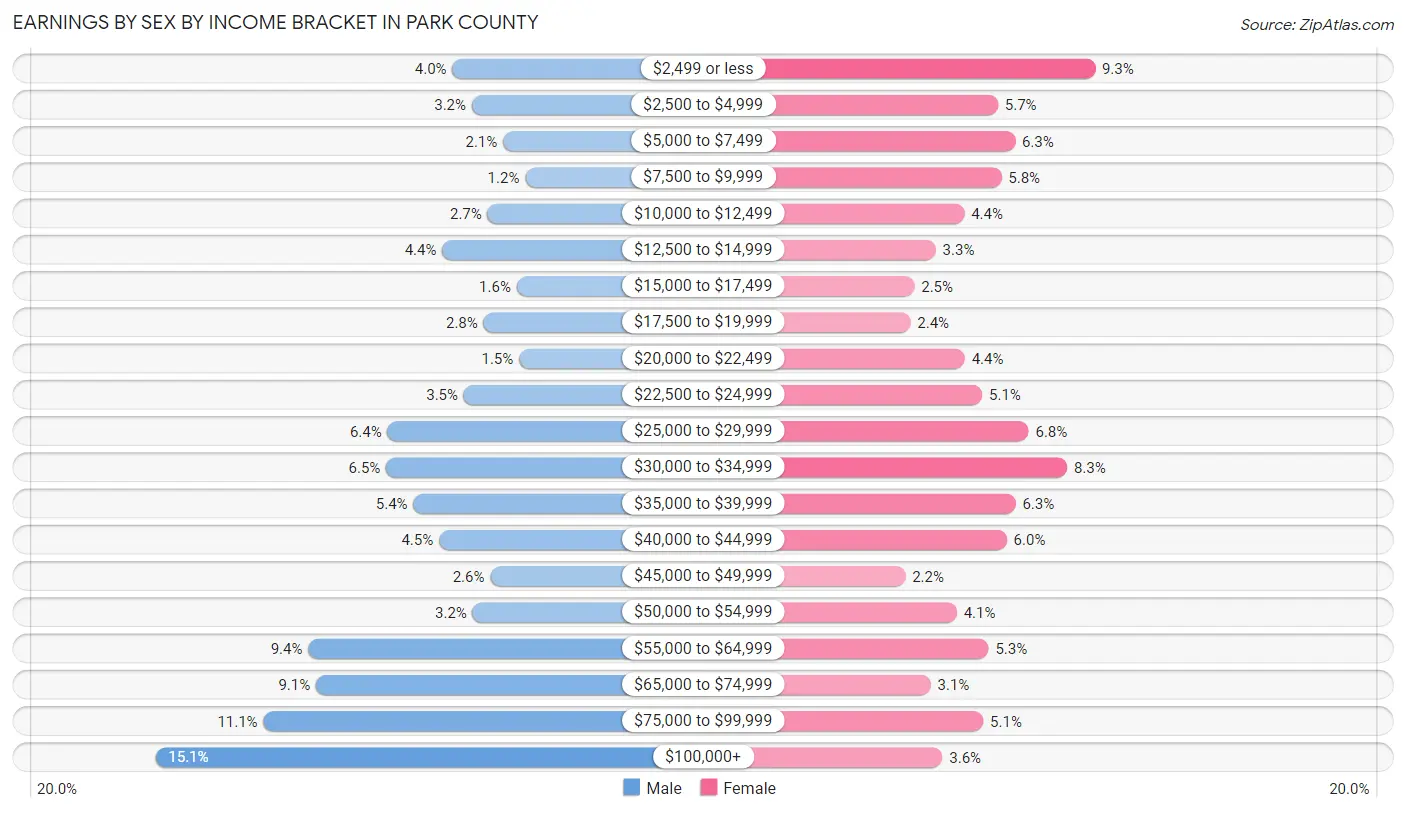
| Income | Male | Female |
| $2,499 or less | 330 (4.0%) | 743 (9.3%) |
| $2,500 to $4,999 | 269 (3.2%) | 452 (5.7%) |
| $5,000 to $7,499 | 172 (2.1%) | 503 (6.3%) |
| $7,500 to $9,999 | 103 (1.2%) | 462 (5.8%) |
| $10,000 to $12,499 | 220 (2.6%) | 351 (4.4%) |
| $12,500 to $14,999 | 361 (4.3%) | 266 (3.3%) |
| $15,000 to $17,499 | 130 (1.6%) | 202 (2.5%) |
| $17,500 to $19,999 | 233 (2.8%) | 190 (2.4%) |
| $20,000 to $22,499 | 122 (1.5%) | 353 (4.4%) |
| $22,500 to $24,999 | 294 (3.5%) | 405 (5.1%) |
| $25,000 to $29,999 | 532 (6.4%) | 544 (6.8%) |
| $30,000 to $34,999 | 536 (6.5%) | 659 (8.3%) |
| $35,000 to $39,999 | 451 (5.4%) | 505 (6.3%) |
| $40,000 to $44,999 | 371 (4.5%) | 478 (6.0%) |
| $45,000 to $49,999 | 212 (2.5%) | 175 (2.2%) |
| $50,000 to $54,999 | 267 (3.2%) | 329 (4.1%) |
| $55,000 to $64,999 | 778 (9.4%) | 424 (5.3%) |
| $65,000 to $74,999 | 754 (9.1%) | 251 (3.1%) |
| $75,000 to $99,999 | 918 (11.1%) | 408 (5.1%) |
| $100,000+ | 1,254 (15.1%) | 286 (3.6%) |
| Total | 8,307 (100.0%) | 7,986 (100.0%) |
Earnings by Sex by Educational Attainment in Park County
Average earnings in Park County are $56,042 for men and $29,765 for women, a difference of 46.9%. Men with an educational attainment of graduate degree enjoy the highest average annual earnings of $85,427, while those with high school diploma education earn the least with $41,745. Women with an educational attainment of graduate degree earn the most with the average annual earnings of $44,025, while those with college or associate's degree education have the smallest earnings of $25,517.
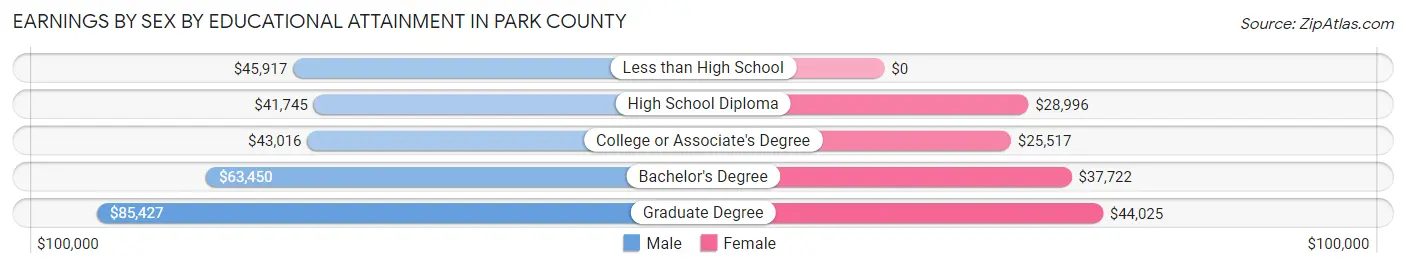
| Educational Attainment | Male Income | Female Income |
| Less than High School | $45,917 | $0 |
| High School Diploma | $41,745 | $28,996 |
| College or Associate's Degree | $43,016 | $25,517 |
| Bachelor's Degree | $63,450 | $37,722 |
| Graduate Degree | $85,427 | $44,025 |
| Total | $56,042 | $29,765 |
Family Income in Park County
Family Income Brackets in Park County
According to the Park County family income data, there are 1,837 families falling into the $50,000 to $74,999 income range, which is the most common income bracket and makes up 22.4% of all families. Conversely, the $10,000 to $14,999 income bracket is the least frequent group with only 74 families (0.9%) belonging to this category.
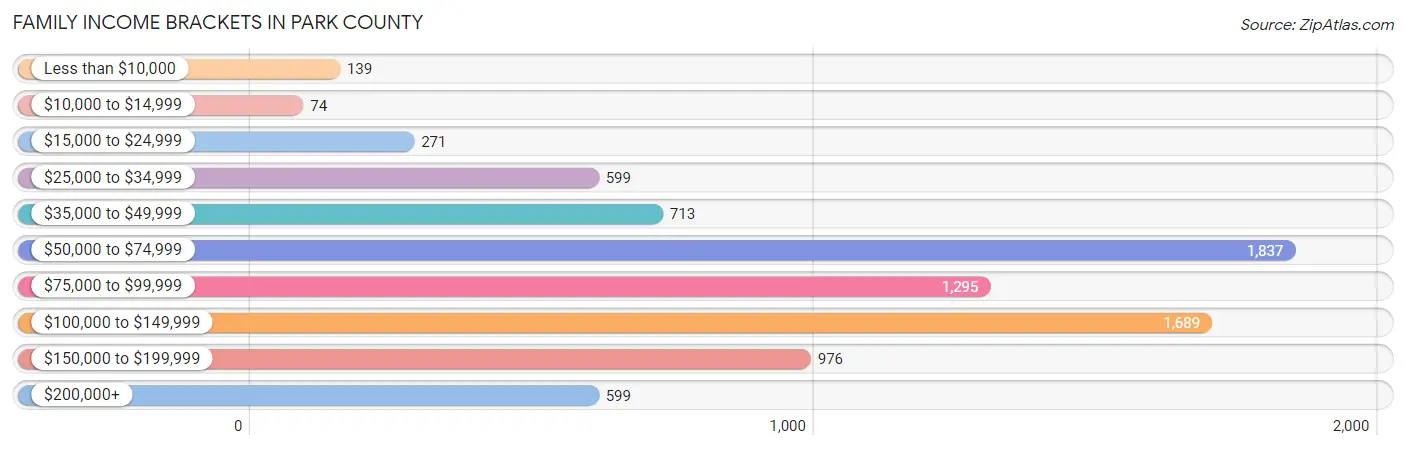
| Income Bracket | # Families | % Families |
| Less than $10,000 | 139 | 1.7% |
| $10,000 to $14,999 | 74 | 0.9% |
| $15,000 to $24,999 | 271 | 3.3% |
| $25,000 to $34,999 | 599 | 7.3% |
| $35,000 to $49,999 | 713 | 8.7% |
| $50,000 to $74,999 | 1,837 | 22.4% |
| $75,000 to $99,999 | 1,295 | 15.8% |
| $100,000 to $149,999 | 1,689 | 20.6% |
| $150,000 to $199,999 | 976 | 11.9% |
| $200,000+ | 599 | 7.3% |
Family Income by Famaliy Size in Park County
7+ person families (156 | 1.9%) account for the highest median family income in Park County with $175,824 per family, while 2-person families (4,876 | 59.5%) have the highest median income of $37,396 per family member.
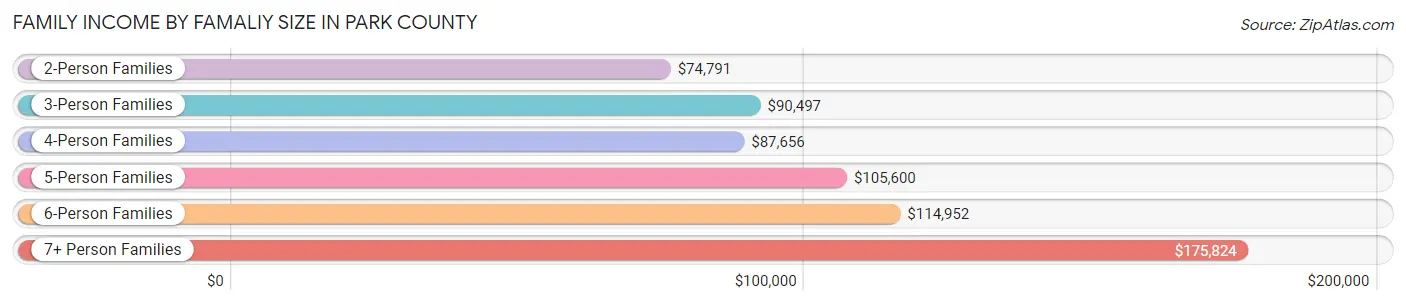
| Income Bracket | # Families | Median Income |
| 2-Person Families | 4,876 (59.5%) | $74,791 |
| 3-Person Families | 1,165 (14.2%) | $90,497 |
| 4-Person Families | 1,051 (12.8%) | $87,656 |
| 5-Person Families | 528 (6.4%) | $105,600 |
| 6-Person Families | 423 (5.2%) | $114,952 |
| 7+ Person Families | 156 (1.9%) | $175,824 |
| Total | 8,199 (100.0%) | $83,265 |
Family Income by Number of Earners in Park County
The median family income in Park County is $83,265, with families comprising 3+ earners (796) having the highest median family income of $141,667, while families with no earners (1,626) have the lowest median family income of $58,964, accounting for 9.7% and 19.8% of families, respectively.
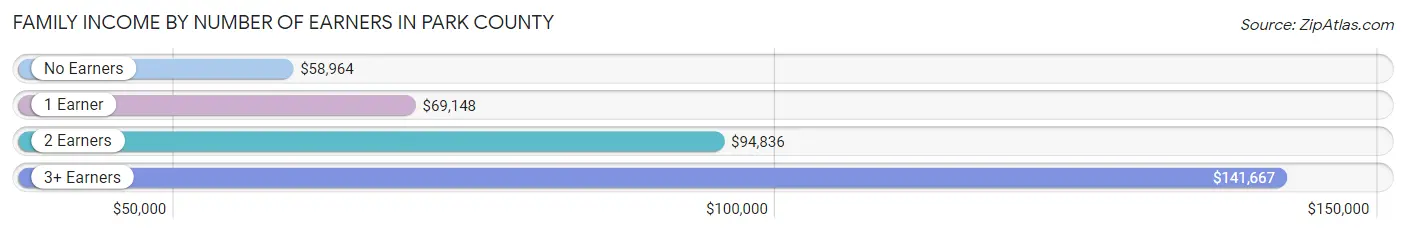
| Number of Earners | # Families | Median Income |
| No Earners | 1,626 (19.8%) | $58,964 |
| 1 Earner | 2,129 (26.0%) | $69,148 |
| 2 Earners | 3,648 (44.5%) | $94,836 |
| 3+ Earners | 796 (9.7%) | $141,667 |
| Total | 8,199 (100.0%) | $83,265 |
Household Income in Park County
Household Income Brackets in Park County
With 2,714 households falling in the category, the $50,000 to $74,999 income range is the most frequent in Park County, accounting for 20.8% of all households. In contrast, only 339 households (2.6%) fall into the $10,000 to $14,999 income bracket, making it the least populous group.
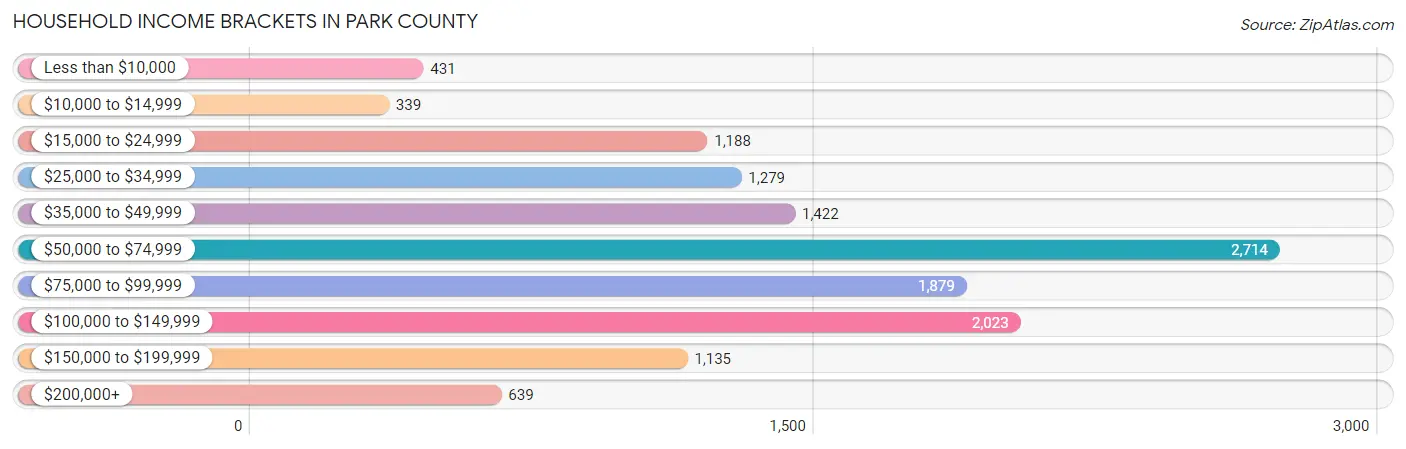
| Income Bracket | # Households | % Households |
| Less than $10,000 | 431 | 3.3% |
| $10,000 to $14,999 | 339 | 2.6% |
| $15,000 to $24,999 | 1,188 | 9.1% |
| $25,000 to $34,999 | 1,279 | 9.8% |
| $35,000 to $49,999 | 1,422 | 10.9% |
| $50,000 to $74,999 | 2,714 | 20.8% |
| $75,000 to $99,999 | 1,879 | 14.4% |
| $100,000 to $149,999 | 2,023 | 15.5% |
| $150,000 to $199,999 | 1,135 | 8.7% |
| $200,000+ | 639 | 4.9% |
Household Income by Householder Age in Park County
The median household income in Park County is $66,754, with the highest median household income of $80,394 found in the 25 to 44 years age bracket for the primary householder. A total of 3,199 households (24.5%) fall into this category. Meanwhile, the 65+ years age bracket for the primary householder has the lowest median household income of $50,741, with 4,866 households (37.3%) in this group.
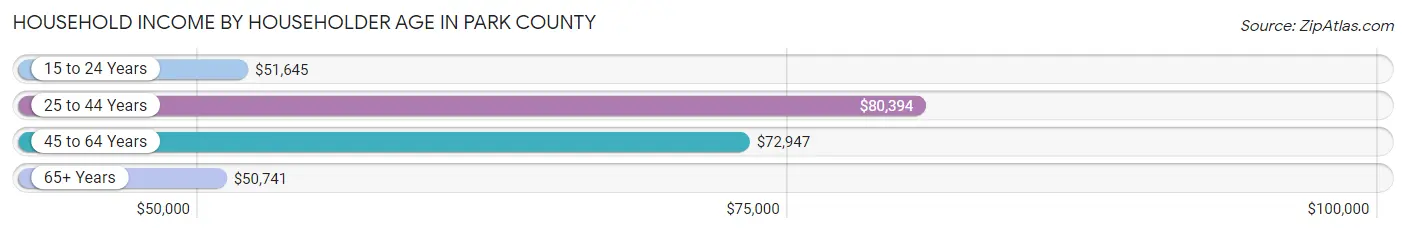
| Income Bracket | # Households | Median Income |
| 15 to 24 Years | 377 (2.9%) | $51,645 |
| 25 to 44 Years | 3,199 (24.5%) | $80,394 |
| 45 to 64 Years | 4,608 (35.3%) | $72,947 |
| 65+ Years | 4,866 (37.3%) | $50,741 |
| Total | 13,050 (100.0%) | $66,754 |
Poverty in Park County
Income Below Poverty by Sex and Age in Park County
With 8.1% poverty level for males and 11.1% for females among the residents of Park County, under 5 year old males and 5 year old females are the most vulnerable to poverty, with 145 males (19.4%) and 64 females (46.0%) in their respective age groups living below the poverty level.
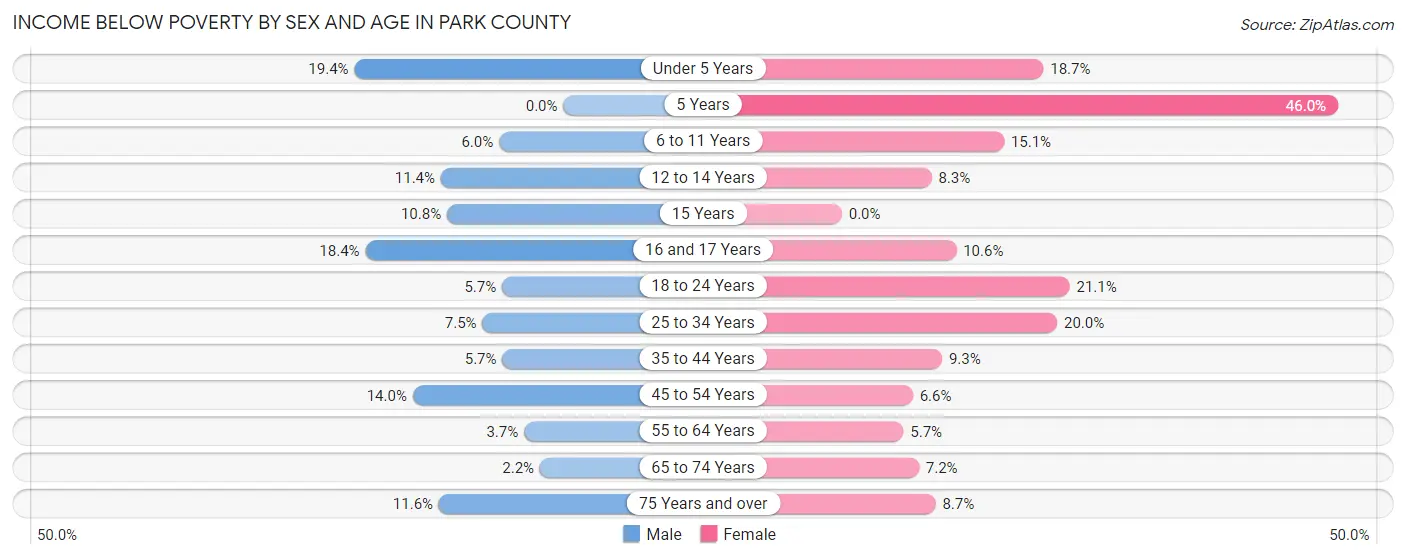
| Age Bracket | Male | Female |
| Under 5 Years | 145 (19.4%) | 124 (18.7%) |
| 5 Years | 0 (0.0%) | 64 (46.0%) |
| 6 to 11 Years | 55 (6.0%) | 163 (15.0%) |
| 12 to 14 Years | 98 (11.4%) | 42 (8.3%) |
| 15 Years | 27 (10.8%) | 0 (0.0%) |
| 16 and 17 Years | 63 (18.4%) | 41 (10.6%) |
| 18 to 24 Years | 53 (5.7%) | 182 (21.1%) |
| 25 to 34 Years | 110 (7.5%) | 323 (20.0%) |
| 35 to 44 Years | 93 (5.7%) | 170 (9.3%) |
| 45 to 54 Years | 261 (14.0%) | 98 (6.6%) |
| 55 to 64 Years | 73 (3.6%) | 135 (5.7%) |
| 65 to 74 Years | 47 (2.2%) | 146 (7.1%) |
| 75 Years and over | 146 (11.6%) | 137 (8.7%) |
| Total | 1,171 (8.1%) | 1,625 (11.1%) |
Income Above Poverty by Sex and Age in Park County
According to the poverty statistics in Park County, males aged 5 years and females aged 15 years are the age groups that are most secure financially, with 100.0% of males and 100.0% of females in these age groups living above the poverty line.
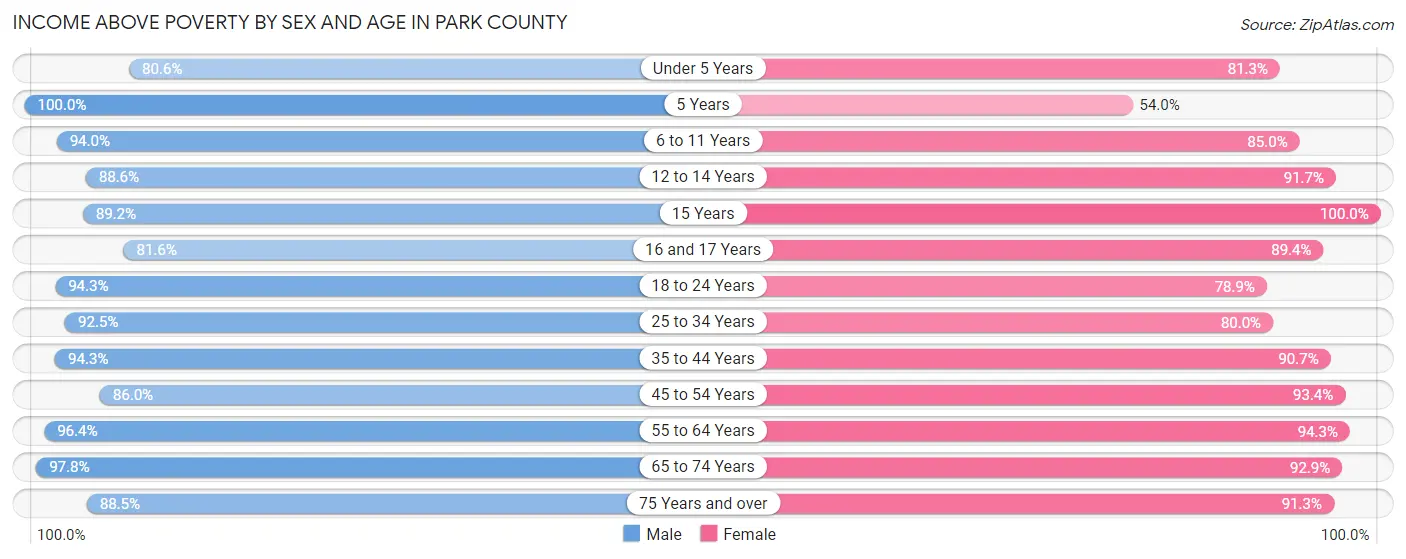
| Age Bracket | Male | Female |
| Under 5 Years | 603 (80.6%) | 539 (81.3%) |
| 5 Years | 44 (100.0%) | 75 (54.0%) |
| 6 to 11 Years | 867 (94.0%) | 920 (85.0%) |
| 12 to 14 Years | 764 (88.6%) | 463 (91.7%) |
| 15 Years | 223 (89.2%) | 145 (100.0%) |
| 16 and 17 Years | 280 (81.6%) | 345 (89.4%) |
| 18 to 24 Years | 879 (94.3%) | 679 (78.9%) |
| 25 to 34 Years | 1,354 (92.5%) | 1,294 (80.0%) |
| 35 to 44 Years | 1,550 (94.3%) | 1,658 (90.7%) |
| 45 to 54 Years | 1,606 (86.0%) | 1,392 (93.4%) |
| 55 to 64 Years | 1,926 (96.4%) | 2,231 (94.3%) |
| 65 to 74 Years | 2,122 (97.8%) | 1,895 (92.8%) |
| 75 Years and over | 1,118 (88.4%) | 1,439 (91.3%) |
| Total | 13,336 (91.9%) | 13,075 (88.9%) |
Income Below Poverty Among Married-Couple Families in Park County
The poverty statistics for married-couple families in Park County show that 3.7% or 254 of the total 6,847 families live below the poverty line. Families with 1 or 2 children have the highest poverty rate of 7.9%, comprising of 126 families. On the other hand, families with 5 or more children have the lowest poverty rate of 0.0%, which includes 0 families.
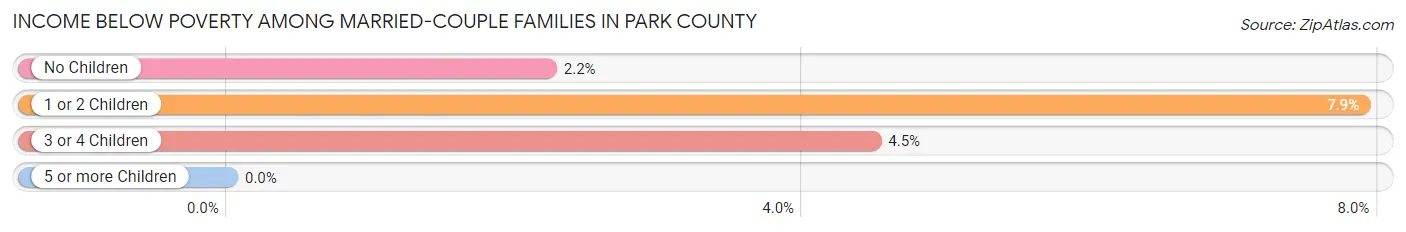
| Children | Above Poverty | Below Poverty |
| No Children | 4,361 (97.8%) | 99 (2.2%) |
| 1 or 2 Children | 1,471 (92.1%) | 126 (7.9%) |
| 3 or 4 Children | 618 (95.5%) | 29 (4.5%) |
| 5 or more Children | 143 (100.0%) | 0 (0.0%) |
| Total | 6,593 (96.3%) | 254 (3.7%) |
Income Below Poverty Among Single-Parent Households in Park County
According to the poverty data in Park County, 21.1% or 140 single-father households and 21.5% or 148 single-mother households are living below the poverty line. Among single-father households, those with 1 or 2 children have the highest poverty rate, with 115 households (40.2%) experiencing poverty. Likewise, among single-mother households, those with 3 or 4 children have the highest poverty rate, with 70 households (51.5%) falling below the poverty line.
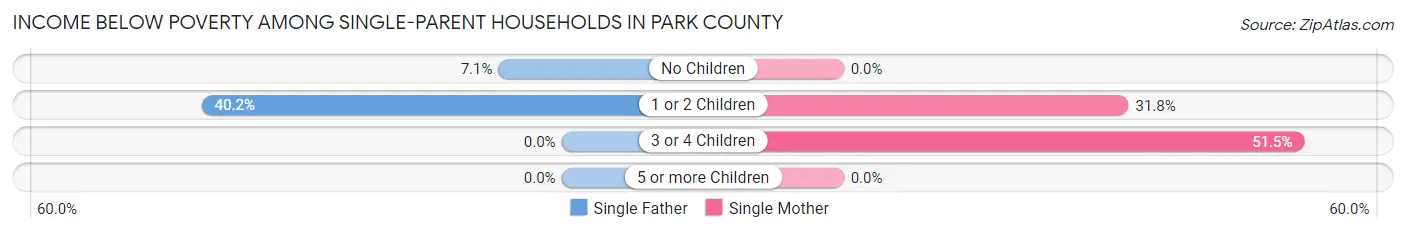
| Children | Single Father | Single Mother |
| No Children | 25 (7.1%) | 0 (0.0%) |
| 1 or 2 Children | 115 (40.2%) | 78 (31.8%) |
| 3 or 4 Children | 0 (0.0%) | 70 (51.5%) |
| 5 or more Children | 0 (0.0%) | 0 (0.0%) |
| Total | 140 (21.1%) | 148 (21.5%) |
Income Below Poverty Among Married-Couple vs Single-Parent Households in Park County
The poverty data for Park County shows that 254 of the married-couple family households (3.7%) and 288 of the single-parent households (21.3%) are living below the poverty level. Within the married-couple family households, those with 1 or 2 children have the highest poverty rate, with 126 households (7.9%) falling below the poverty line. Among the single-parent households, those with 3 or 4 children have the highest poverty rate, with 70 household (43.8%) living below poverty.
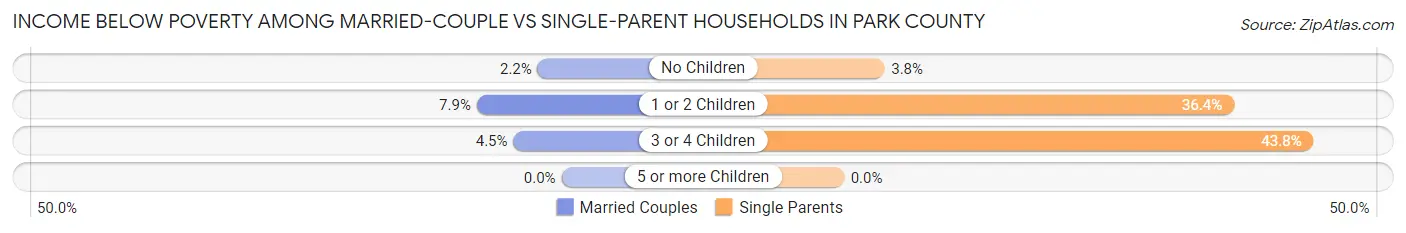
| Children | Married-Couple Families | Single-Parent Households |
| No Children | 99 (2.2%) | 25 (3.8%) |
| 1 or 2 Children | 126 (7.9%) | 193 (36.3%) |
| 3 or 4 Children | 29 (4.5%) | 70 (43.8%) |
| 5 or more Children | 0 (0.0%) | 0 (0.0%) |
| Total | 254 (3.7%) | 288 (21.3%) |
Employment Characteristics in Park County
Employment by Class of Employer in Park County
Among the 14,351 employed individuals in Park County, private company employees (8,171 | 56.9%), self-employed (not incorporated) (1,222 | 8.5%), and local government employees (1,208 | 8.4%) make up the most common classes of employment.
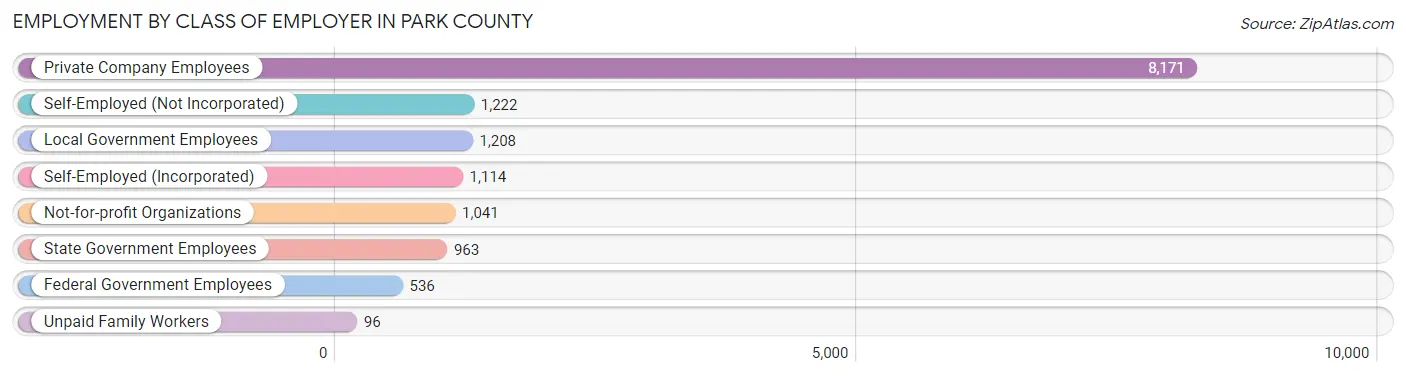
| Employer Class | # Employees | % Employees |
| Private Company Employees | 8,171 | 56.9% |
| Self-Employed (Incorporated) | 1,114 | 7.8% |
| Self-Employed (Not Incorporated) | 1,222 | 8.5% |
| Not-for-profit Organizations | 1,041 | 7.2% |
| Local Government Employees | 1,208 | 8.4% |
| State Government Employees | 963 | 6.7% |
| Federal Government Employees | 536 | 3.7% |
| Unpaid Family Workers | 96 | 0.7% |
| Total | 14,351 | 100.0% |
Employment Status by Age in Park County
According to the labor force statistics for Park County, out of the total population over 16 years of age (24,467), 61.2% or 14,974 individuals are in the labor force, with 2.7% or 404 of them unemployed. The age group with the highest labor force participation rate is 25 to 29 years, with 94.8% or 1,397 individuals in the labor force. Within the labor force, the 16 to 19 years age range has the highest percentage of unemployed individuals, with 21.6% or 156 of them being unemployed.
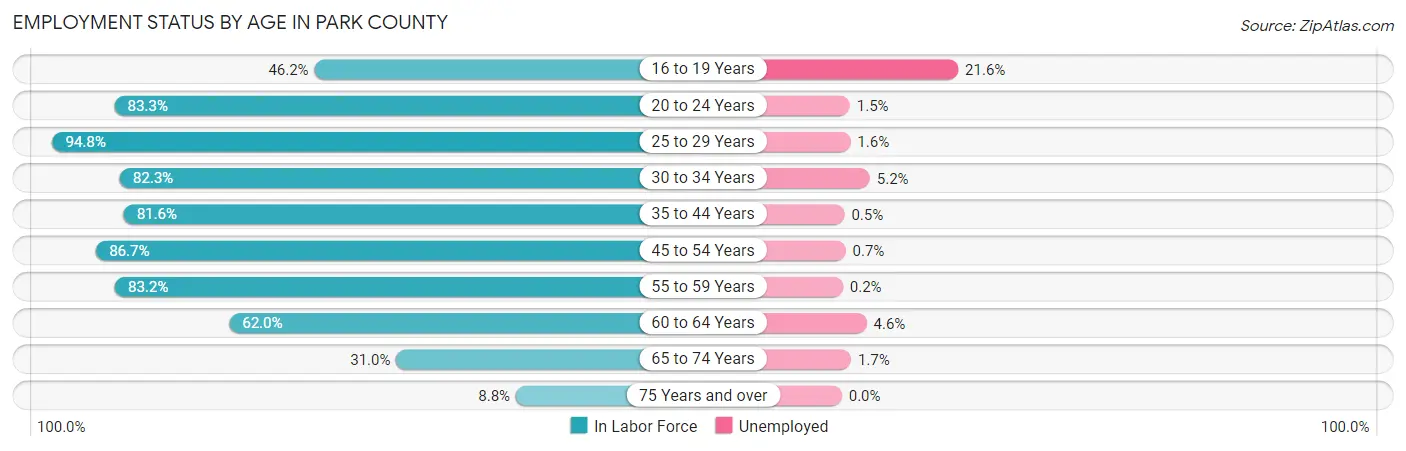
| Age Bracket | In Labor Force | Unemployed |
| 16 to 19 Years | 721 (46.2%) | 156 (21.6%) |
| 20 to 24 Years | 1,167 (83.3%) | 18 (1.5%) |
| 25 to 29 Years | 1,397 (94.8%) | 22 (1.6%) |
| 30 to 34 Years | 1,333 (82.3%) | 69 (5.2%) |
| 35 to 44 Years | 2,833 (81.6%) | 14 (0.5%) |
| 45 to 54 Years | 2,911 (86.7%) | 20 (0.7%) |
| 55 to 59 Years | 1,304 (83.2%) | 3 (0.2%) |
| 60 to 64 Years | 1,751 (62.0%) | 81 (4.6%) |
| 65 to 74 Years | 1,308 (31.0%) | 22 (1.7%) |
| 75 Years and over | 261 (8.8%) | 0 (0.0%) |
| Total | 14,974 (61.2%) | 404 (2.7%) |
Employment Status by Educational Attainment in Park County
According to labor force statistics for Park County, 80.5% of individuals (11,524) out of the total population between 25 and 64 years of age (14,315) are in the labor force, with 1.8% or 207 of them being unemployed. The group with the highest labor force participation rate are those with the educational attainment of less than high school, with 94.9% or 504 individuals in the labor force. Within the labor force, individuals with less than high school education have the highest percentage of unemployment, with 13.7% or 69 of them being unemployed.
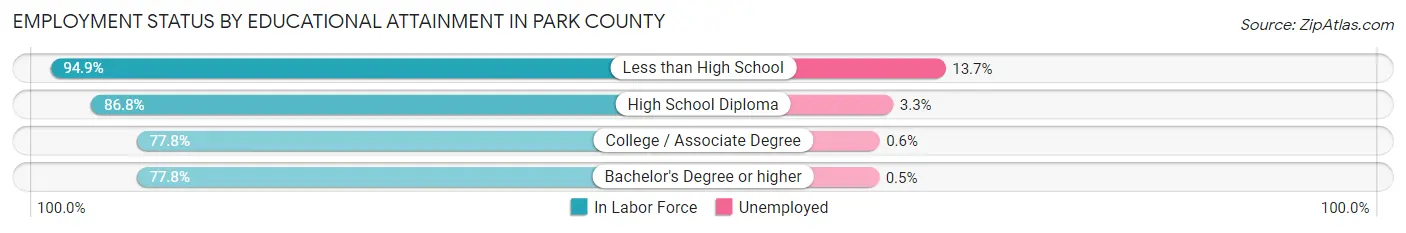
| Educational Attainment | In Labor Force | Unemployed |
| Less than High School | 504 (94.9%) | 73 (13.7%) |
| High School Diploma | 2,919 (86.8%) | 111 (3.3%) |
| College / Associate Degree | 4,228 (77.8%) | 33 (0.6%) |
| Bachelor's Degree or higher | 3,879 (77.8%) | 25 (0.5%) |
| Total | 11,524 (80.5%) | 258 (1.8%) |
Employment Occupations by Sex in Park County
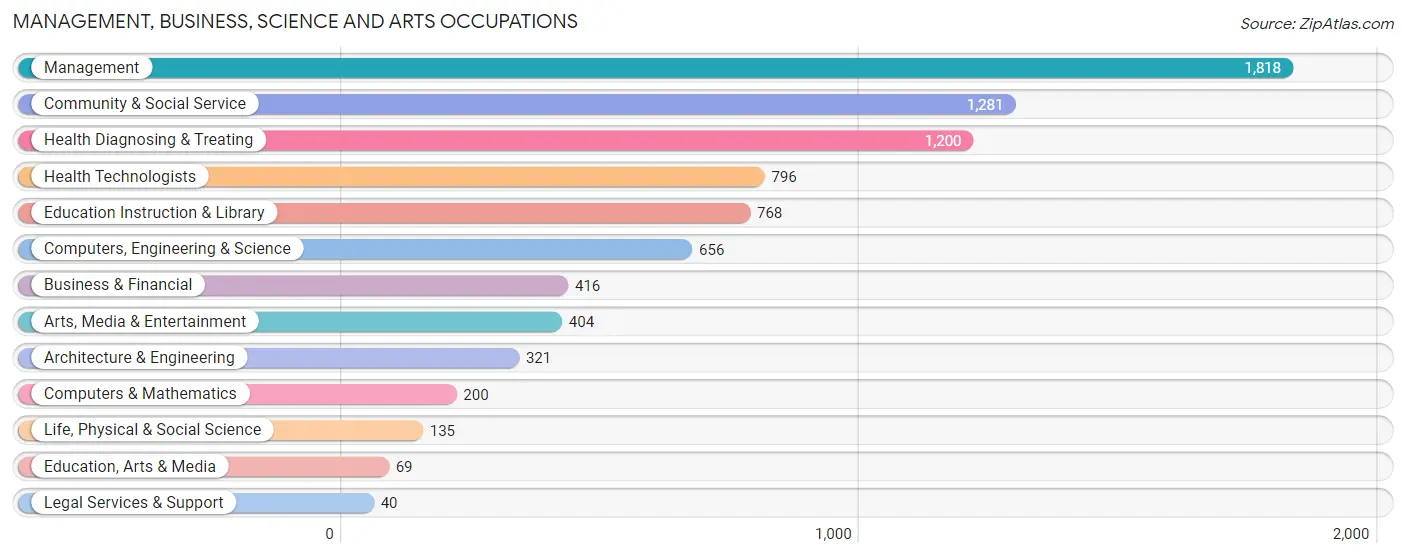
Management, Business, Science and Arts Occupations
The most common Management, Business, Science and Arts occupations in Park County are Management (1,818 | 12.5%), Community & Social Service (1,281 | 8.8%), Health Diagnosing & Treating (1,200 | 8.2%), Health Technologists (796 | 5.5%), and Education Instruction & Library (768 | 5.3%).
Management, Business, Science and Arts Occupations by Sex
Within the Management, Business, Science and Arts occupations in Park County, the most male-oriented occupations are Architecture & Engineering (85.4%), Life, Physical & Social Science (81.5%), and Computers, Engineering & Science (73.6%), while the most female-oriented occupations are Education Instruction & Library (88.8%), Community & Social Service (69.4%), and Education, Arts & Media (55.1%).
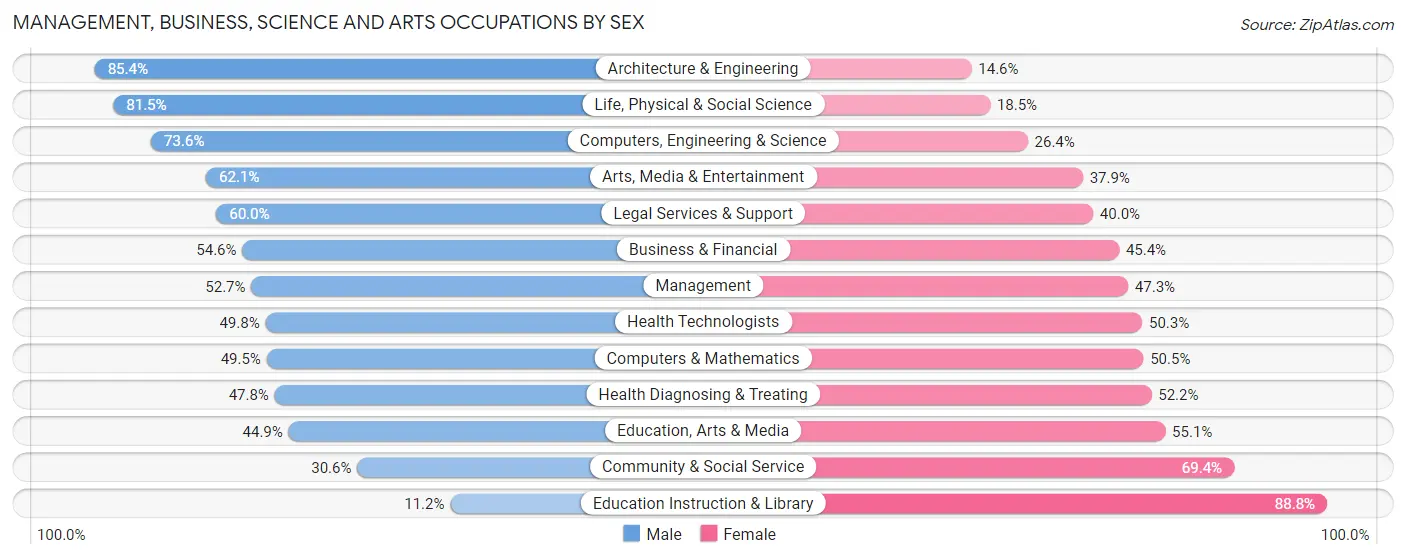
| Occupation | Male | Female |
| Management | 958 (52.7%) | 860 (47.3%) |
| Business & Financial | 227 (54.6%) | 189 (45.4%) |
| Computers, Engineering & Science | 483 (73.6%) | 173 (26.4%) |
| Computers & Mathematics | 99 (49.5%) | 101 (50.5%) |
| Architecture & Engineering | 274 (85.4%) | 47 (14.6%) |
| Life, Physical & Social Science | 110 (81.5%) | 25 (18.5%) |
| Community & Social Service | 392 (30.6%) | 889 (69.4%) |
| Education, Arts & Media | 31 (44.9%) | 38 (55.1%) |
| Legal Services & Support | 24 (60.0%) | 16 (40.0%) |
| Education Instruction & Library | 86 (11.2%) | 682 (88.8%) |
| Arts, Media & Entertainment | 251 (62.1%) | 153 (37.9%) |
| Health Diagnosing & Treating | 574 (47.8%) | 626 (52.2%) |
| Health Technologists | 396 (49.7%) | 400 (50.2%) |
| Total (Category) | 2,634 (49.0%) | 2,737 (51.0%) |
| Total (Overall) | 7,530 (51.6%) | 7,049 (48.3%) |
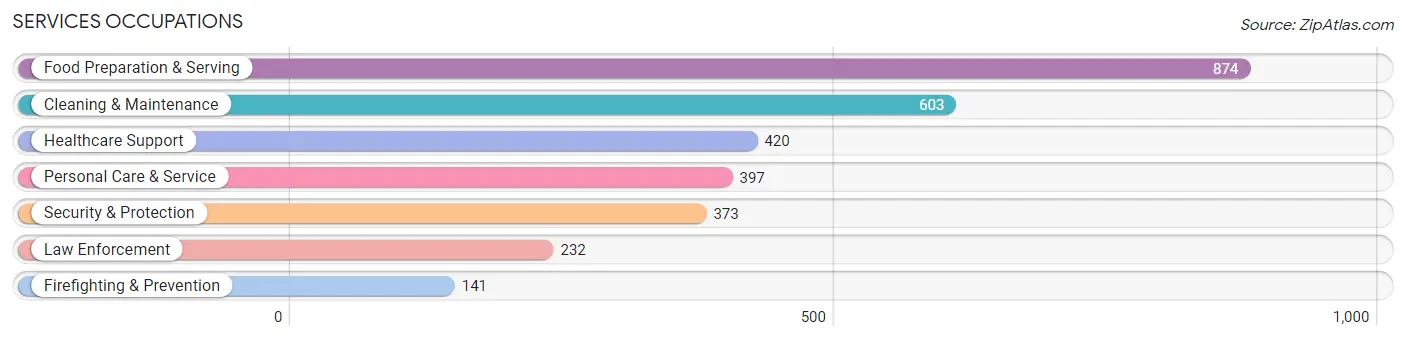
Services Occupations
The most common Services occupations in Park County are Food Preparation & Serving (874 | 6.0%), Cleaning & Maintenance (603 | 4.1%), Healthcare Support (420 | 2.9%), Personal Care & Service (397 | 2.7%), and Security & Protection (373 | 2.6%).
Services Occupations by Sex
Within the Services occupations in Park County, the most male-oriented occupations are Law Enforcement (100.0%), Security & Protection (92.5%), and Firefighting & Prevention (80.1%), while the most female-oriented occupations are Healthcare Support (88.8%), Personal Care & Service (79.1%), and Food Preparation & Serving (69.6%).
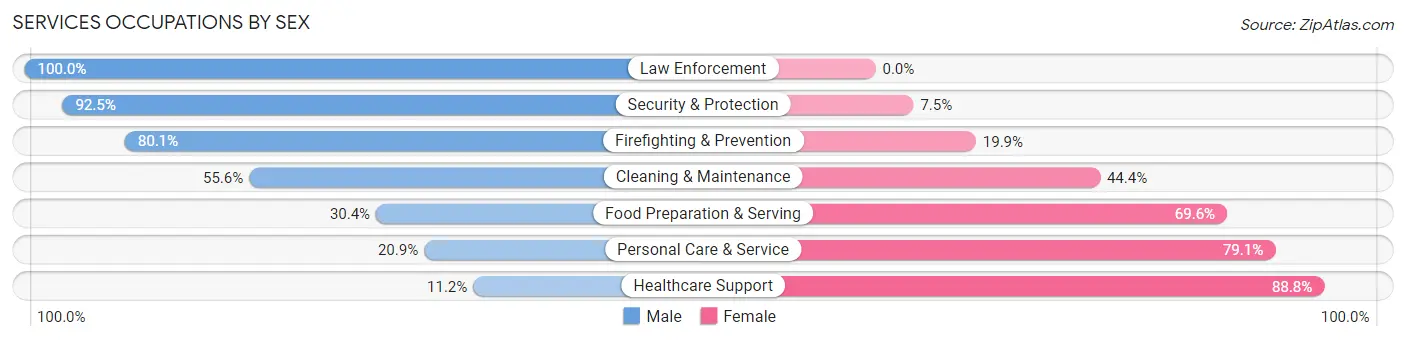
| Occupation | Male | Female |
| Healthcare Support | 47 (11.2%) | 373 (88.8%) |
| Security & Protection | 345 (92.5%) | 28 (7.5%) |
| Firefighting & Prevention | 113 (80.1%) | 28 (19.9%) |
| Law Enforcement | 232 (100.0%) | 0 (0.0%) |
| Food Preparation & Serving | 266 (30.4%) | 608 (69.6%) |
| Cleaning & Maintenance | 335 (55.6%) | 268 (44.4%) |
| Personal Care & Service | 83 (20.9%) | 314 (79.1%) |
| Total (Category) | 1,076 (40.3%) | 1,591 (59.7%) |
| Total (Overall) | 7,530 (51.6%) | 7,049 (48.3%) |
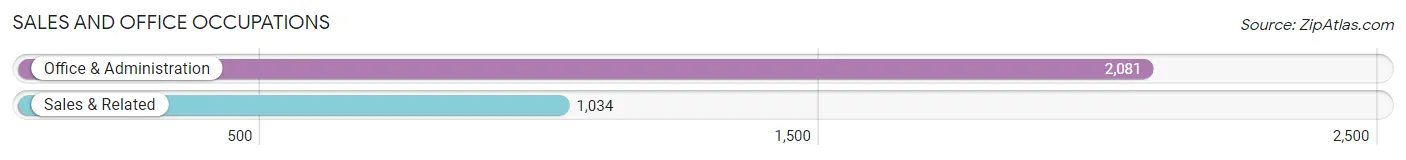
Sales and Office Occupations
The most common Sales and Office occupations in Park County are Office & Administration (2,081 | 14.3%), and Sales & Related (1,034 | 7.1%).
Sales and Office Occupations by Sex
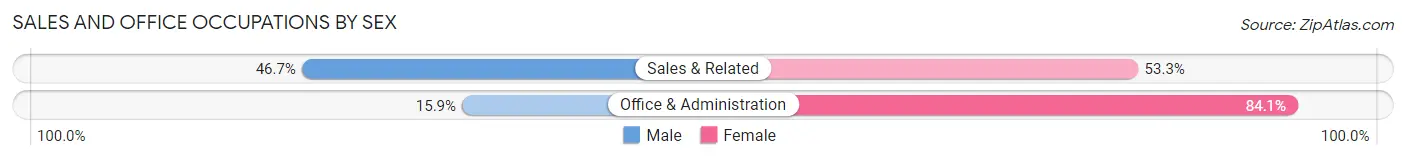
| Occupation | Male | Female |
| Sales & Related | 483 (46.7%) | 551 (53.3%) |
| Office & Administration | 331 (15.9%) | 1,750 (84.1%) |
| Total (Category) | 814 (26.1%) | 2,301 (73.9%) |
| Total (Overall) | 7,530 (51.6%) | 7,049 (48.3%) |
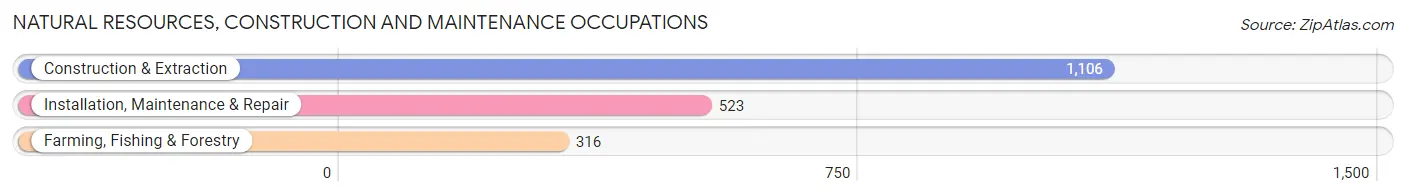
Natural Resources, Construction and Maintenance Occupations
The most common Natural Resources, Construction and Maintenance occupations in Park County are Construction & Extraction (1,106 | 7.6%), Installation, Maintenance & Repair (523 | 3.6%), and Farming, Fishing & Forestry (316 | 2.2%).
Natural Resources, Construction and Maintenance Occupations by Sex
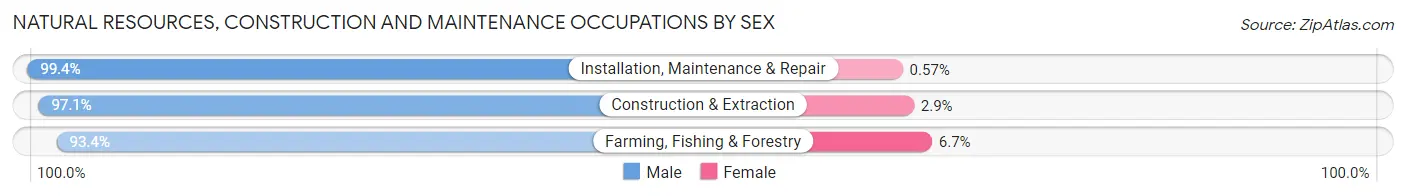
| Occupation | Male | Female |
| Farming, Fishing & Forestry | 295 (93.3%) | 21 (6.7%) |
| Construction & Extraction | 1,074 (97.1%) | 32 (2.9%) |
| Installation, Maintenance & Repair | 520 (99.4%) | 3 (0.6%) |
| Total (Category) | 1,889 (97.1%) | 56 (2.9%) |
| Total (Overall) | 7,530 (51.6%) | 7,049 (48.3%) |
Production, Transportation and Moving Occupations
The most common Production, Transportation and Moving occupations in Park County are Production (621 | 4.3%), Material Moving (431 | 3.0%), and Transportation (429 | 2.9%).
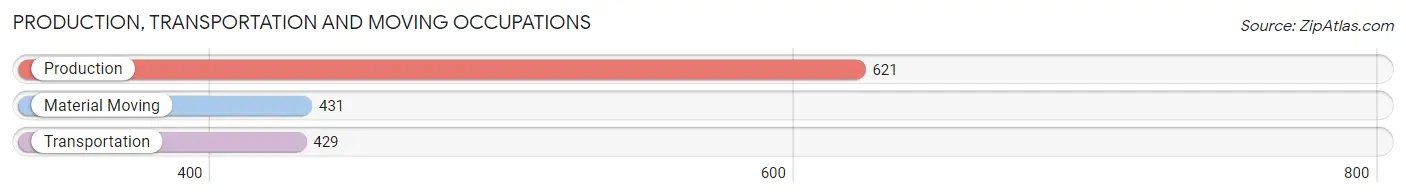
Production, Transportation and Moving Occupations by Sex

| Occupation | Male | Female |
| Production | 407 (65.5%) | 214 (34.5%) |
| Transportation | 372 (86.7%) | 57 (13.3%) |
| Material Moving | 338 (78.4%) | 93 (21.6%) |
| Total (Category) | 1,117 (75.4%) | 364 (24.6%) |
| Total (Overall) | 7,530 (51.6%) | 7,049 (48.3%) |
Employment Industries by Sex in Park County
Employment Industries in Park County
The major employment industries in Park County include Health Care & Social Assistance (2,188 | 15.0%), Retail Trade (1,655 | 11.4%), Educational Services (1,484 | 10.2%), Construction (1,228 | 8.4%), and Accommodation & Food Services (1,086 | 7.4%).

Employment Industries by Sex in Park County
The Park County industries that see more men than women are Mining, Quarrying, & Extraction (92.7%), Construction (85.4%), and Transportation & Warehousing (79.4%), whereas the industries that tend to have a higher number of women are Health Care & Social Assistance (81.1%), Finance & Insurance (75.9%), and Real Estate, Rental & Leasing (69.4%).
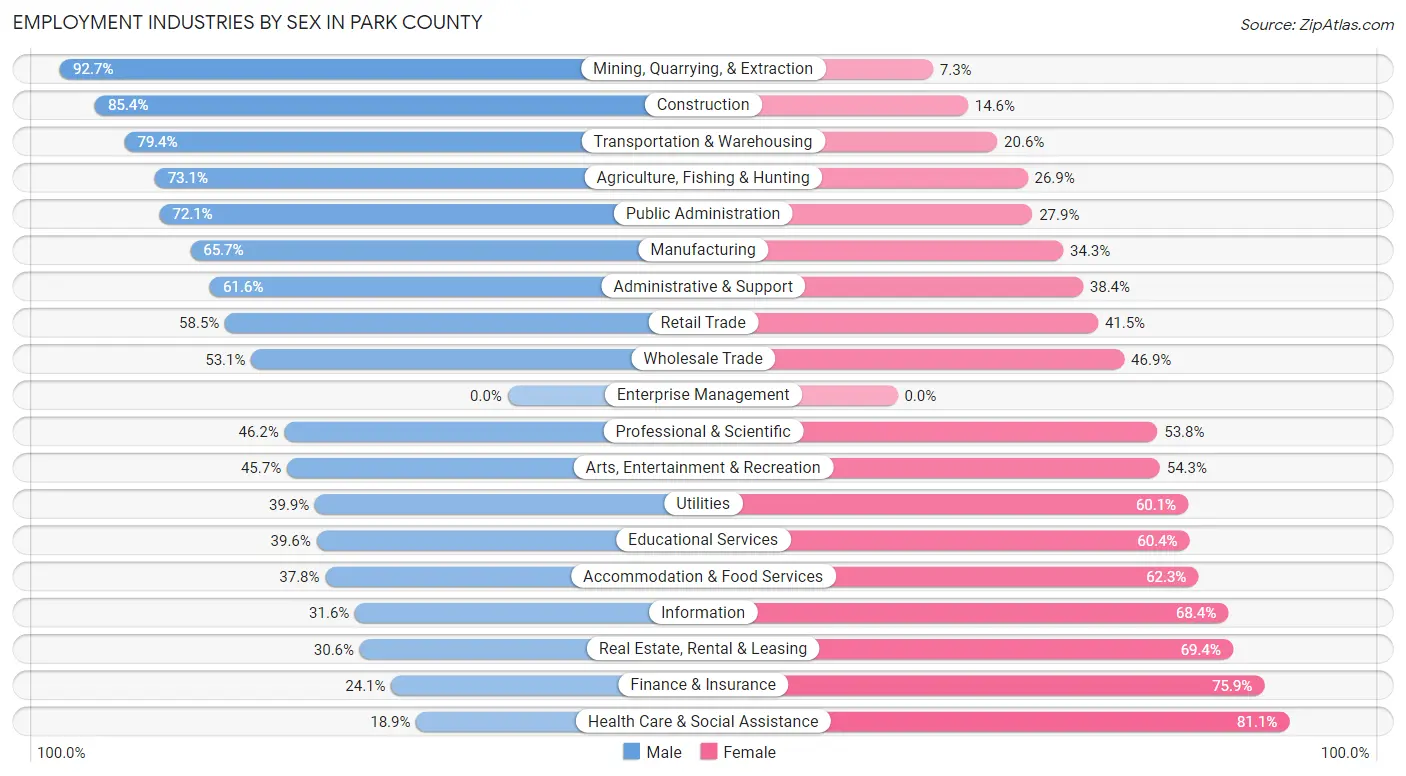
| Industry | Male | Female |
| Agriculture, Fishing & Hunting | 442 (73.1%) | 163 (26.9%) |
| Mining, Quarrying, & Extraction | 556 (92.7%) | 44 (7.3%) |
| Construction | 1,049 (85.4%) | 179 (14.6%) |
| Manufacturing | 475 (65.7%) | 248 (34.3%) |
| Wholesale Trade | 121 (53.1%) | 107 (46.9%) |
| Retail Trade | 968 (58.5%) | 687 (41.5%) |
| Transportation & Warehousing | 496 (79.4%) | 129 (20.6%) |
| Utilities | 61 (39.9%) | 92 (60.1%) |
| Information | 36 (31.6%) | 78 (68.4%) |
| Finance & Insurance | 132 (24.1%) | 416 (75.9%) |
| Real Estate, Rental & Leasing | 82 (30.6%) | 186 (69.4%) |
| Professional & Scientific | 304 (46.2%) | 354 (53.8%) |
| Enterprise Management | 0 (0.0%) | 0 (0.0%) |
| Administrative & Support | 334 (61.6%) | 208 (38.4%) |
| Educational Services | 587 (39.6%) | 897 (60.4%) |
| Health Care & Social Assistance | 414 (18.9%) | 1,774 (81.1%) |
| Arts, Entertainment & Recreation | 233 (45.7%) | 277 (54.3%) |
| Accommodation & Food Services | 410 (37.8%) | 676 (62.3%) |
| Public Administration | 532 (72.1%) | 206 (27.9%) |
| Total | 7,530 (51.6%) | 7,049 (48.3%) |
Education in Park County
School Enrollment in Park County
The most common levels of schooling among the 6,806 students in Park County are middle school (1,791 | 26.3%), high school (1,649 | 24.2%), and college / undergraduate (1,456 | 21.4%).
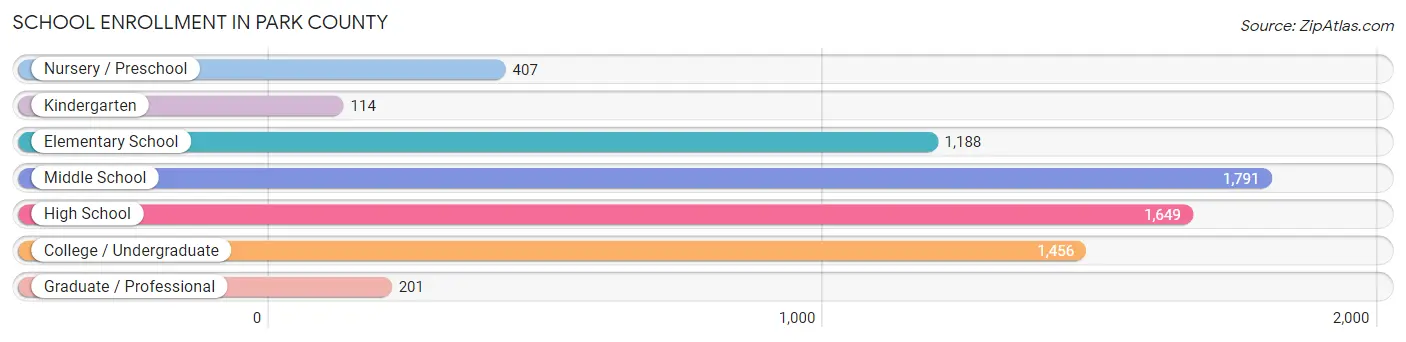
| School Level | # Students | % Students |
| Nursery / Preschool | 407 | 6.0% |
| Kindergarten | 114 | 1.7% |
| Elementary School | 1,188 | 17.5% |
| Middle School | 1,791 | 26.3% |
| High School | 1,649 | 24.2% |
| College / Undergraduate | 1,456 | 21.4% |
| Graduate / Professional | 201 | 2.9% |
| Total | 6,806 | 100.0% |
School Enrollment by Age by Funding Source in Park County
Out of a total of 6,806 students who are enrolled in schools in Park County, 898 (13.2%) attend a private institution, while the remaining 5,908 (86.8%) are enrolled in public schools. The age group of 3 to 4 year olds has the highest likelihood of being enrolled in private schools, with 185 (58.2% in the age bracket) enrolled. Conversely, the age group of 18 to 19 year olds has the lowest likelihood of being enrolled in a private school, with 635 (96.5% in the age bracket) attending a public institution.
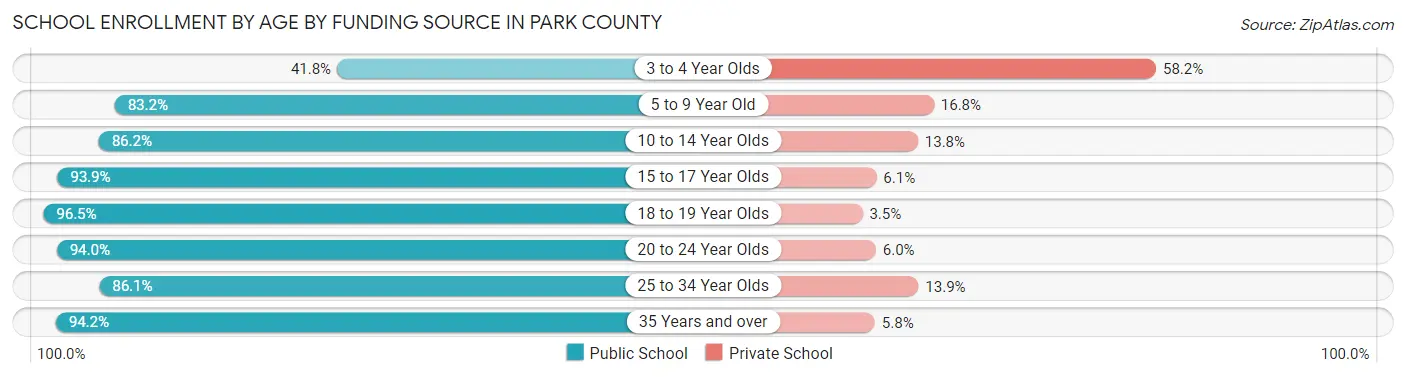
| Age Bracket | Public School | Private School |
| 3 to 4 Year Olds | 133 (41.8%) | 185 (58.2%) |
| 5 to 9 Year Old | 946 (83.2%) | 191 (16.8%) |
| 10 to 14 Year Olds | 2,021 (86.2%) | 324 (13.8%) |
| 15 to 17 Year Olds | 1,047 (93.9%) | 68 (6.1%) |
| 18 to 19 Year Olds | 635 (96.5%) | 23 (3.5%) |
| 20 to 24 Year Olds | 455 (94.0%) | 29 (6.0%) |
| 25 to 34 Year Olds | 334 (86.1%) | 54 (13.9%) |
| 35 Years and over | 340 (94.2%) | 21 (5.8%) |
| Total | 5,908 (86.8%) | 898 (13.2%) |
Educational Attainment by Field of Study in Park County
Education (1,352 | 18.1%), business (1,114 | 14.9%), science & technology (1,113 | 14.9%), bio, nature & agricultural (979 | 13.1%), and engineering (462 | 6.2%) are the most common fields of study among 7,467 individuals in Park County who have obtained a bachelor's degree or higher.
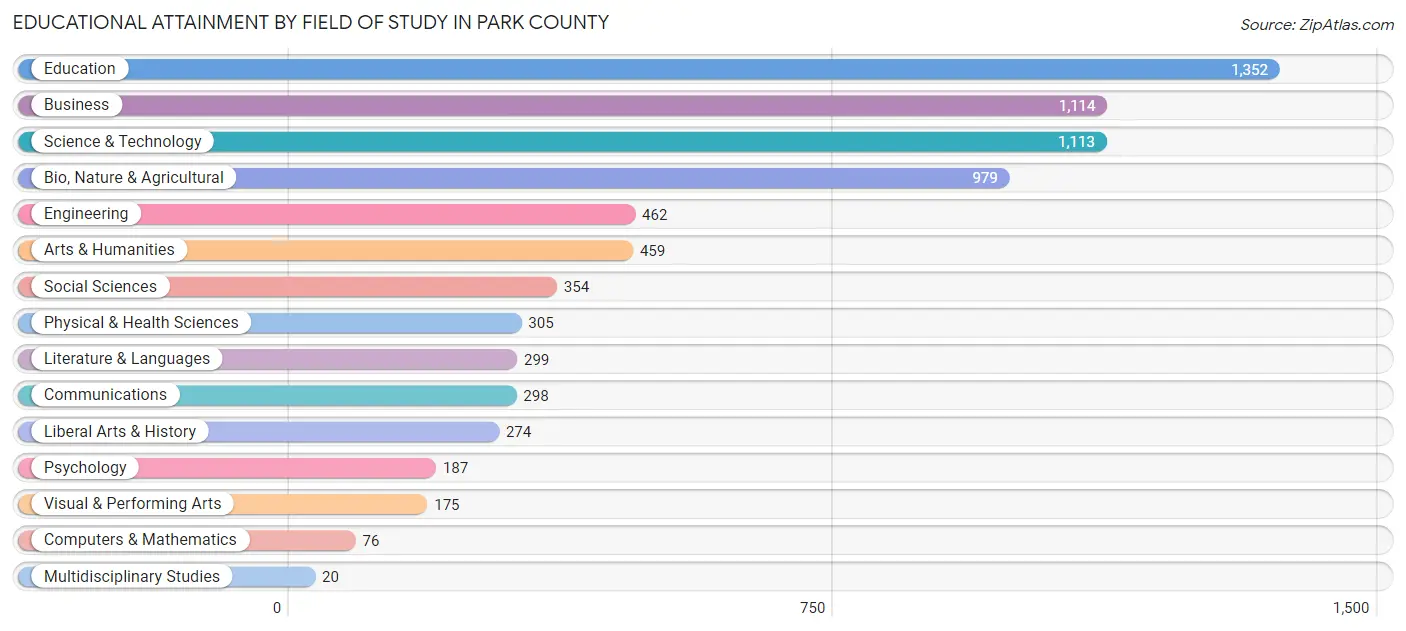
| Field of Study | # Graduates | % Graduates |
| Computers & Mathematics | 76 | 1.0% |
| Bio, Nature & Agricultural | 979 | 13.1% |
| Physical & Health Sciences | 305 | 4.1% |
| Psychology | 187 | 2.5% |
| Social Sciences | 354 | 4.7% |
| Engineering | 462 | 6.2% |
| Multidisciplinary Studies | 20 | 0.3% |
| Science & Technology | 1,113 | 14.9% |
| Business | 1,114 | 14.9% |
| Education | 1,352 | 18.1% |
| Literature & Languages | 299 | 4.0% |
| Liberal Arts & History | 274 | 3.7% |
| Visual & Performing Arts | 175 | 2.3% |
| Communications | 298 | 4.0% |
| Arts & Humanities | 459 | 6.1% |
| Total | 7,467 | 100.0% |
Transportation & Commute in Park County
Vehicle Availability by Sex in Park County
The most prevalent vehicle ownership categories in Park County are males with 2 vehicles (2,554, accounting for 35.3%) and females with 2 vehicles (2,319, making up 37.6%).
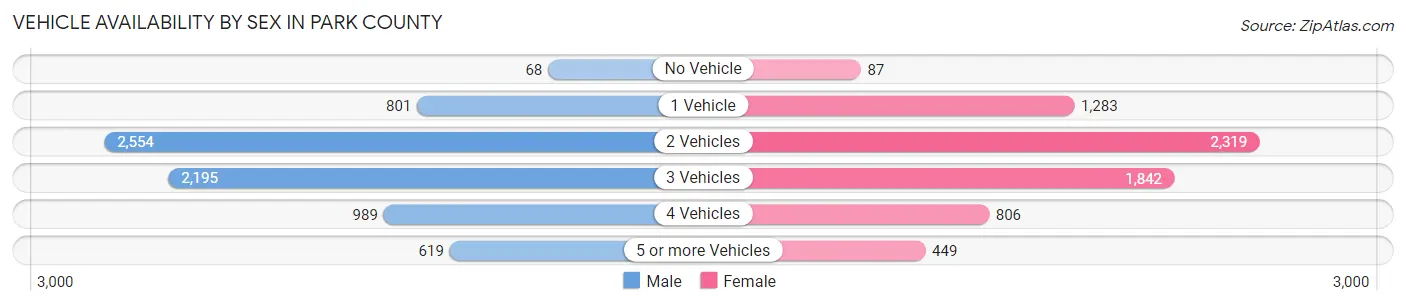
| Vehicles Available | Male | Female |
| No Vehicle | 68 (0.9%) | 87 (1.3%) |
| 1 Vehicle | 801 (11.1%) | 1,283 (18.9%) |
| 2 Vehicles | 2,554 (35.3%) | 2,319 (34.2%) |
| 3 Vehicles | 2,195 (30.4%) | 1,842 (27.1%) |
| 4 Vehicles | 989 (13.7%) | 806 (11.9%) |
| 5 or more Vehicles | 619 (8.6%) | 449 (6.6%) |
| Total | 7,226 (100.0%) | 6,786 (100.0%) |
Commute Time in Park County
The most frequently occuring commute durations in Park County are 5 to 9 minutes (4,032 commuters, 31.2%), 10 to 14 minutes (2,855 commuters, 22.1%), and less than 5 minutes (1,801 commuters, 13.9%).
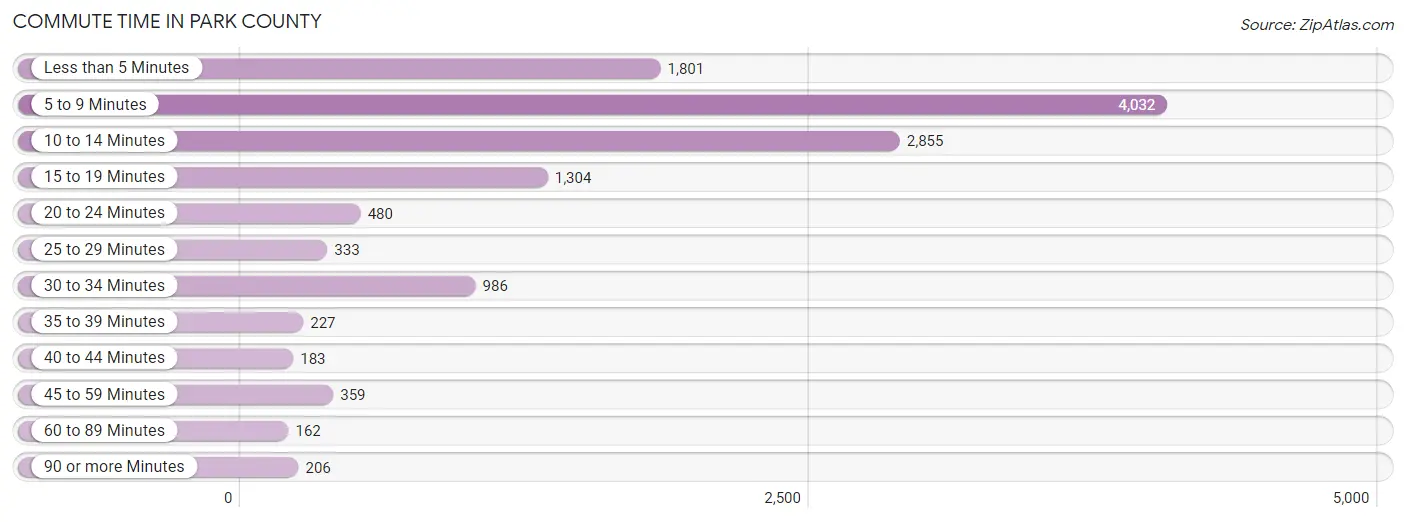
| Commute Time | # Commuters | % Commuters |
| Less than 5 Minutes | 1,801 | 13.9% |
| 5 to 9 Minutes | 4,032 | 31.2% |
| 10 to 14 Minutes | 2,855 | 22.1% |
| 15 to 19 Minutes | 1,304 | 10.1% |
| 20 to 24 Minutes | 480 | 3.7% |
| 25 to 29 Minutes | 333 | 2.6% |
| 30 to 34 Minutes | 986 | 7.6% |
| 35 to 39 Minutes | 227 | 1.8% |
| 40 to 44 Minutes | 183 | 1.4% |
| 45 to 59 Minutes | 359 | 2.8% |
| 60 to 89 Minutes | 162 | 1.3% |
| 90 or more Minutes | 206 | 1.6% |
Commute Time by Sex in Park County
The most common commute times in Park County are 5 to 9 minutes (1,915 commuters, 28.4%) for males and 5 to 9 minutes (2,117 commuters, 34.2%) for females.
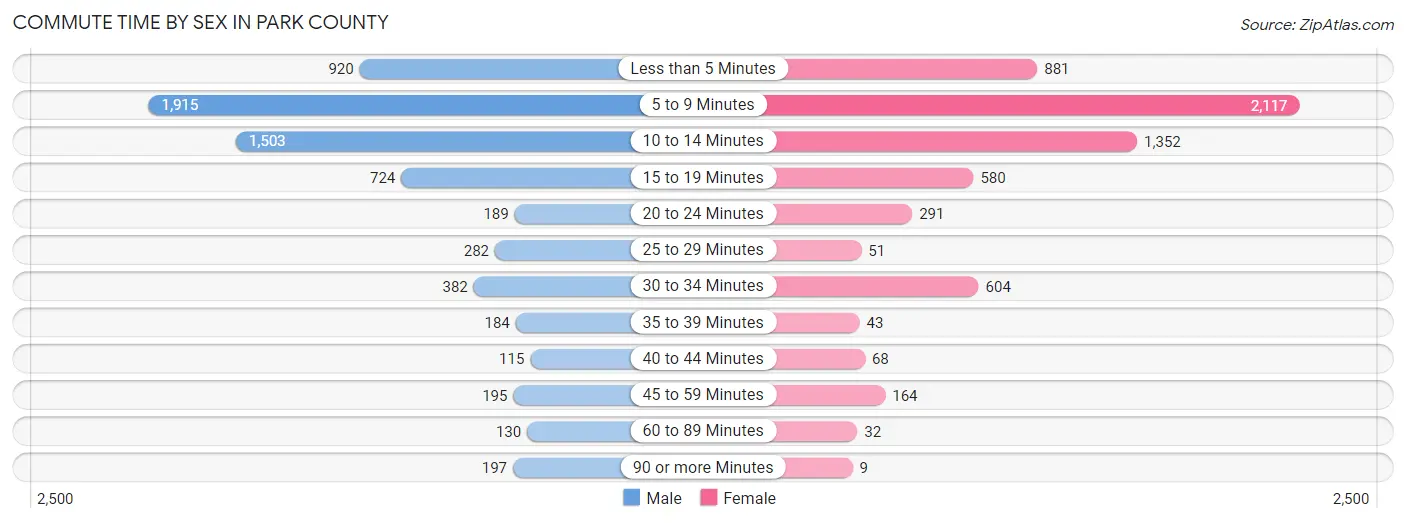
| Commute Time | Male | Female |
| Less than 5 Minutes | 920 (13.7%) | 881 (14.2%) |
| 5 to 9 Minutes | 1,915 (28.4%) | 2,117 (34.2%) |
| 10 to 14 Minutes | 1,503 (22.3%) | 1,352 (21.8%) |
| 15 to 19 Minutes | 724 (10.7%) | 580 (9.4%) |
| 20 to 24 Minutes | 189 (2.8%) | 291 (4.7%) |
| 25 to 29 Minutes | 282 (4.2%) | 51 (0.8%) |
| 30 to 34 Minutes | 382 (5.7%) | 604 (9.8%) |
| 35 to 39 Minutes | 184 (2.7%) | 43 (0.7%) |
| 40 to 44 Minutes | 115 (1.7%) | 68 (1.1%) |
| 45 to 59 Minutes | 195 (2.9%) | 164 (2.6%) |
| 60 to 89 Minutes | 130 (1.9%) | 32 (0.5%) |
| 90 or more Minutes | 197 (2.9%) | 9 (0.2%) |
Time of Departure to Work by Sex in Park County
The most frequent times of departure to work in Park County are 7:30 AM to 7:59 AM (1,273, 18.9%) for males and 7:30 AM to 7:59 AM (1,301, 21.0%) for females.
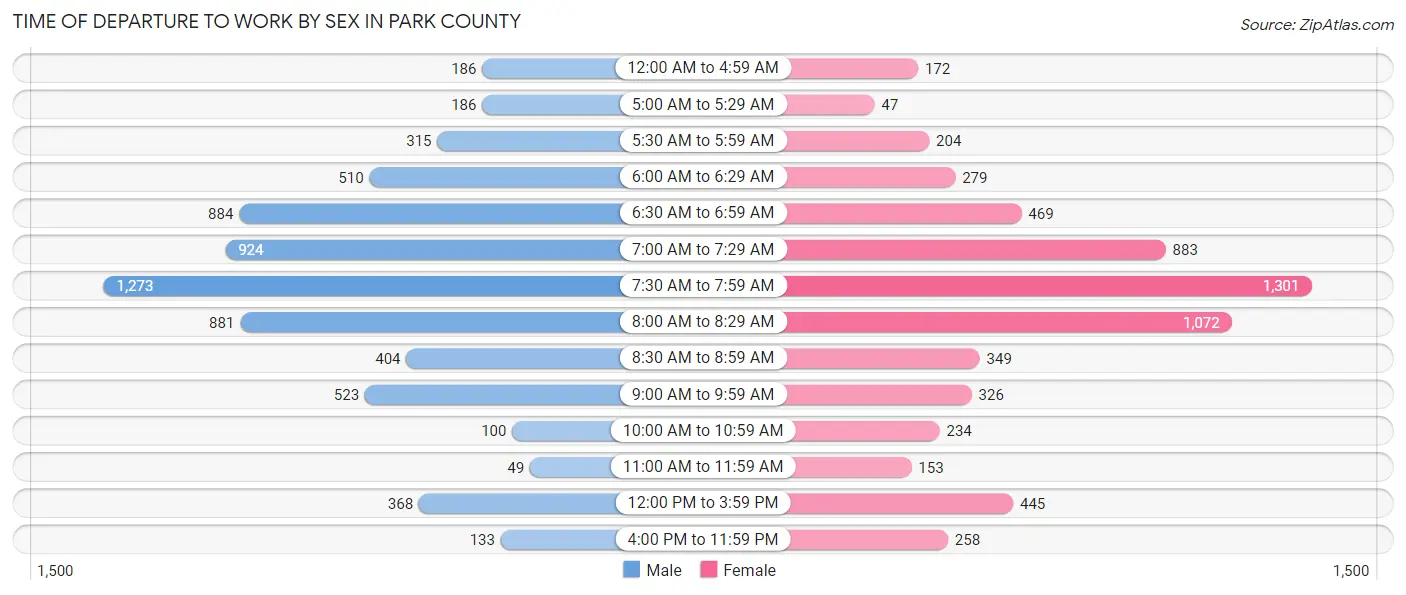
| Time of Departure | Male | Female |
| 12:00 AM to 4:59 AM | 186 (2.8%) | 172 (2.8%) |
| 5:00 AM to 5:29 AM | 186 (2.8%) | 47 (0.8%) |
| 5:30 AM to 5:59 AM | 315 (4.7%) | 204 (3.3%) |
| 6:00 AM to 6:29 AM | 510 (7.6%) | 279 (4.5%) |
| 6:30 AM to 6:59 AM | 884 (13.1%) | 469 (7.6%) |
| 7:00 AM to 7:29 AM | 924 (13.7%) | 883 (14.3%) |
| 7:30 AM to 7:59 AM | 1,273 (18.9%) | 1,301 (21.0%) |
| 8:00 AM to 8:29 AM | 881 (13.1%) | 1,072 (17.3%) |
| 8:30 AM to 8:59 AM | 404 (6.0%) | 349 (5.6%) |
| 9:00 AM to 9:59 AM | 523 (7.8%) | 326 (5.3%) |
| 10:00 AM to 10:59 AM | 100 (1.5%) | 234 (3.8%) |
| 11:00 AM to 11:59 AM | 49 (0.7%) | 153 (2.5%) |
| 12:00 PM to 3:59 PM | 368 (5.5%) | 445 (7.2%) |
| 4:00 PM to 11:59 PM | 133 (2.0%) | 258 (4.2%) |
| Total | 6,736 (100.0%) | 6,192 (100.0%) |
Housing Occupancy in Park County
Occupancy by Ownership in Park County
Of the total 13,050 dwellings in Park County, owner-occupied units account for 9,599 (73.6%), while renter-occupied units make up 3,451 (26.4%).
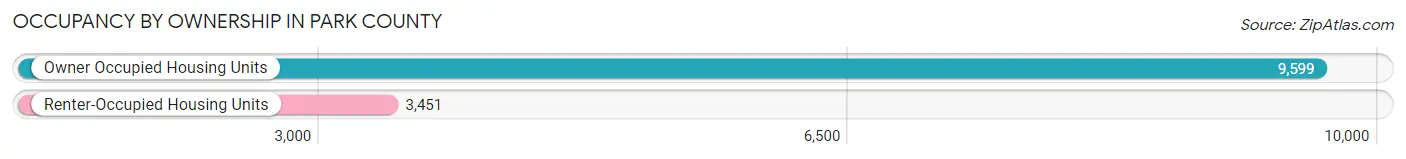
| Occupancy | # Housing Units | % Housing Units |
| Owner Occupied Housing Units | 9,599 | 73.6% |
| Renter-Occupied Housing Units | 3,451 | 26.4% |
| Total Occupied Housing Units | 13,050 | 100.0% |
Occupancy by Household Size in Park County
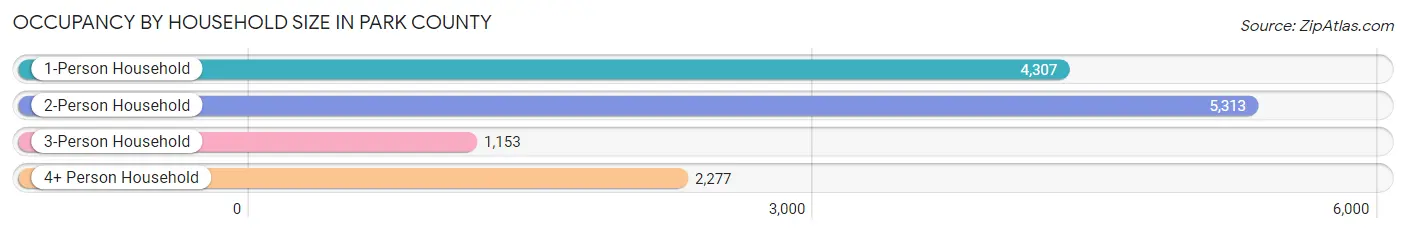
| Household Size | # Housing Units | % Housing Units |
| 1-Person Household | 4,307 | 33.0% |
| 2-Person Household | 5,313 | 40.7% |
| 3-Person Household | 1,153 | 8.8% |
| 4+ Person Household | 2,277 | 17.4% |
| Total Housing Units | 13,050 | 100.0% |
Occupancy by Ownership by Household Size in Park County
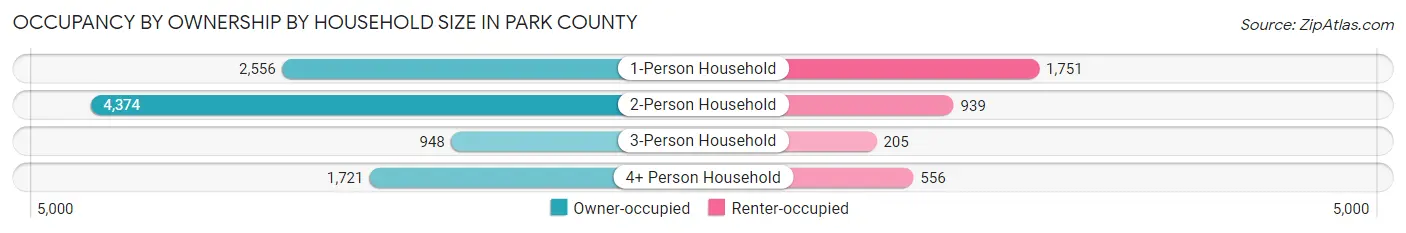
| Household Size | Owner-occupied | Renter-occupied |
| 1-Person Household | 2,556 (59.4%) | 1,751 (40.6%) |
| 2-Person Household | 4,374 (82.3%) | 939 (17.7%) |
| 3-Person Household | 948 (82.2%) | 205 (17.8%) |
| 4+ Person Household | 1,721 (75.6%) | 556 (24.4%) |
| Total Housing Units | 9,599 (73.6%) | 3,451 (26.4%) |
Occupancy by Educational Attainment in Park County
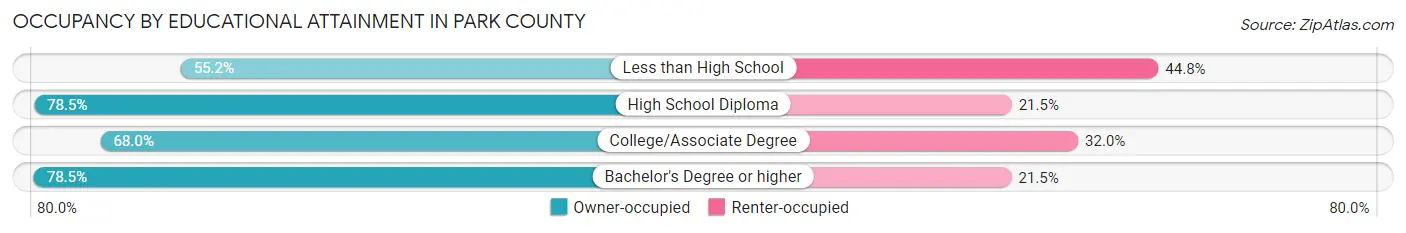
| Household Size | Owner-occupied | Renter-occupied |
| Less than High School | 285 (55.2%) | 231 (44.8%) |
| High School Diploma | 2,293 (78.5%) | 628 (21.5%) |
| College/Associate Degree | 3,393 (68.0%) | 1,600 (32.0%) |
| Bachelor's Degree or higher | 3,628 (78.5%) | 992 (21.5%) |
Occupancy by Age of Householder in Park County
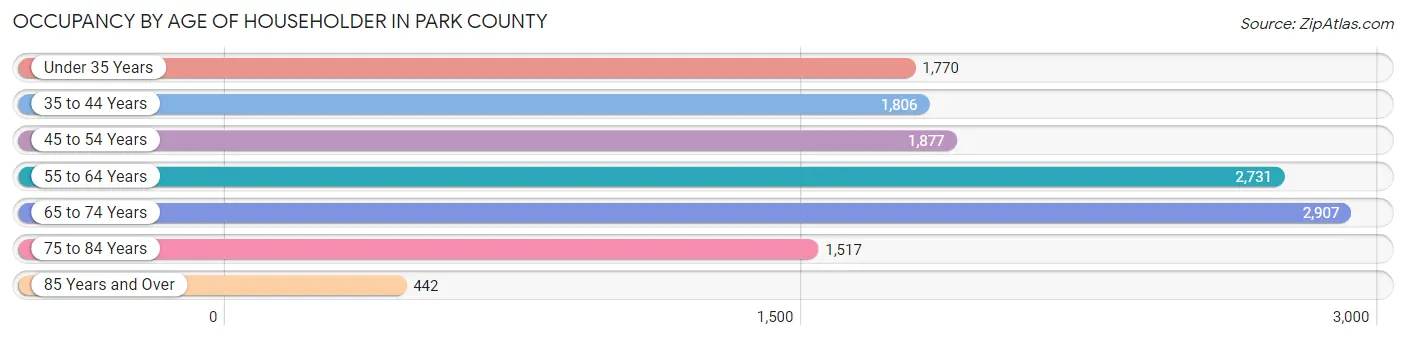
| Age Bracket | # Households | % Households |
| Under 35 Years | 1,770 | 13.6% |
| 35 to 44 Years | 1,806 | 13.8% |
| 45 to 54 Years | 1,877 | 14.4% |
| 55 to 64 Years | 2,731 | 20.9% |
| 65 to 74 Years | 2,907 | 22.3% |
| 75 to 84 Years | 1,517 | 11.6% |
| 85 Years and Over | 442 | 3.4% |
| Total | 13,050 | 100.0% |
Housing Finances in Park County
Median Income by Occupancy in Park County
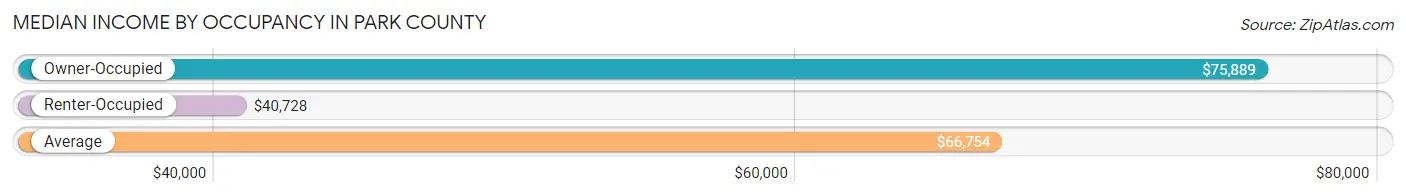
| Occupancy Type | # Households | Median Income |
| Owner-Occupied | 9,599 (73.6%) | $75,889 |
| Renter-Occupied | 3,451 (26.4%) | $40,728 |
| Average | 13,050 (100.0%) | $66,754 |
Occupancy by Householder Income Bracket in Park County
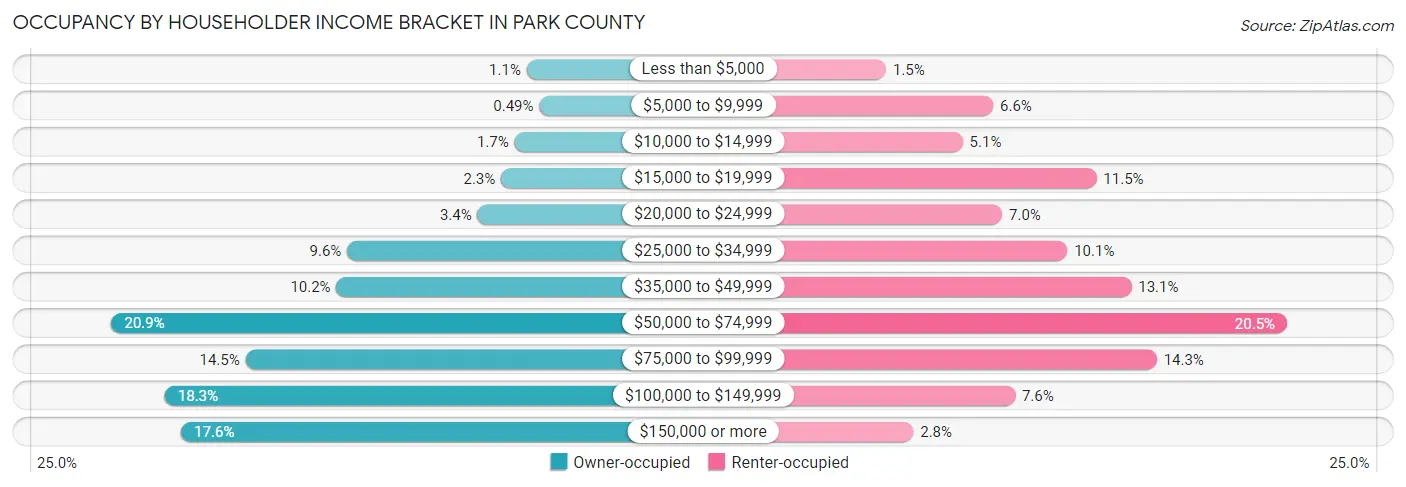
| Income Bracket | Owner-occupied | Renter-occupied |
| Less than $5,000 | 105 (1.1%) | 50 (1.5%) |
| $5,000 to $9,999 | 47 (0.5%) | 226 (6.6%) |
| $10,000 to $14,999 | 160 (1.7%) | 176 (5.1%) |
| $15,000 to $19,999 | 222 (2.3%) | 396 (11.5%) |
| $20,000 to $24,999 | 329 (3.4%) | 241 (7.0%) |
| $25,000 to $34,999 | 925 (9.6%) | 348 (10.1%) |
| $35,000 to $49,999 | 974 (10.2%) | 453 (13.1%) |
| $50,000 to $74,999 | 2,003 (20.9%) | 709 (20.5%) |
| $75,000 to $99,999 | 1,390 (14.5%) | 495 (14.3%) |
| $100,000 to $149,999 | 1,759 (18.3%) | 262 (7.6%) |
| $150,000 or more | 1,685 (17.5%) | 95 (2.8%) |
| Total | 9,599 (100.0%) | 3,451 (100.0%) |
Monthly Housing Cost Tiers in Park County
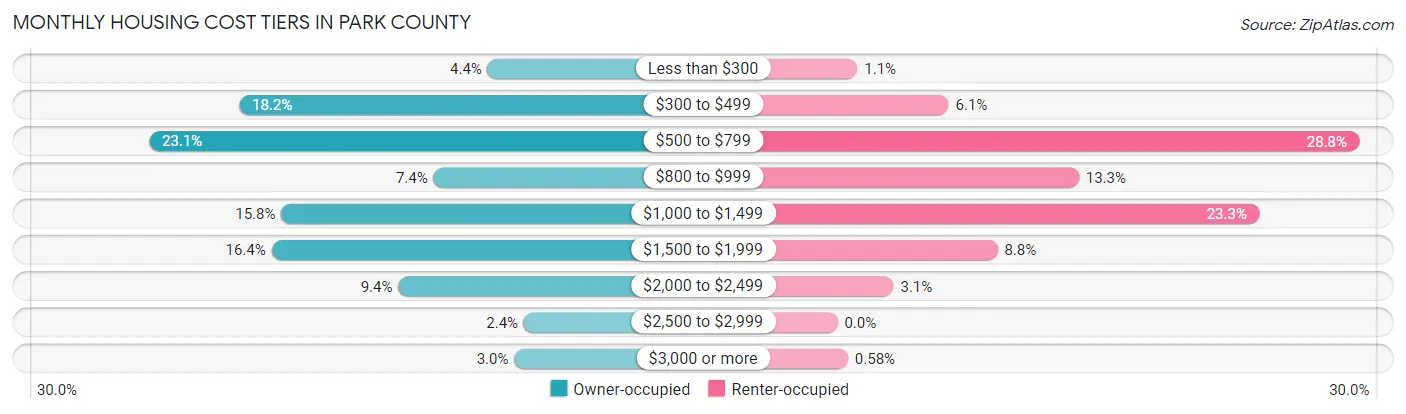
| Monthly Cost | Owner-occupied | Renter-occupied |
| Less than $300 | 424 (4.4%) | 38 (1.1%) |
| $300 to $499 | 1,742 (18.1%) | 212 (6.1%) |
| $500 to $799 | 2,220 (23.1%) | 994 (28.8%) |
| $800 to $999 | 711 (7.4%) | 460 (13.3%) |
| $1,000 to $1,499 | 1,519 (15.8%) | 803 (23.3%) |
| $1,500 to $1,999 | 1,570 (16.4%) | 305 (8.8%) |
| $2,000 to $2,499 | 898 (9.4%) | 107 (3.1%) |
| $2,500 to $2,999 | 232 (2.4%) | 0 (0.0%) |
| $3,000 or more | 283 (2.9%) | 20 (0.6%) |
| Total | 9,599 (100.0%) | 3,451 (100.0%) |
Physical Housing Characteristics in Park County
Housing Structures in Park County
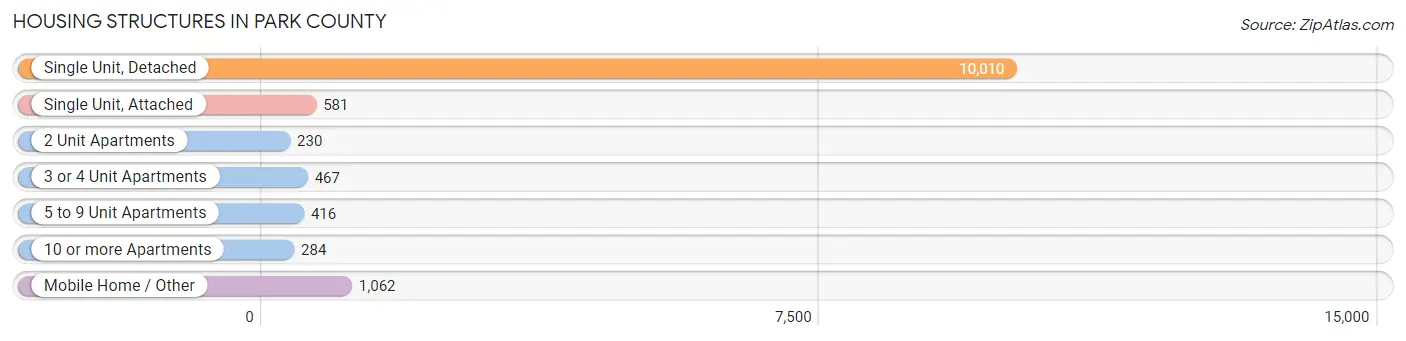
| Structure Type | # Housing Units | % Housing Units |
| Single Unit, Detached | 10,010 | 76.7% |
| Single Unit, Attached | 581 | 4.4% |
| 2 Unit Apartments | 230 | 1.8% |
| 3 or 4 Unit Apartments | 467 | 3.6% |
| 5 to 9 Unit Apartments | 416 | 3.2% |
| 10 or more Apartments | 284 | 2.2% |
| Mobile Home / Other | 1,062 | 8.1% |
| Total | 13,050 | 100.0% |
Housing Structures by Occupancy in Park County
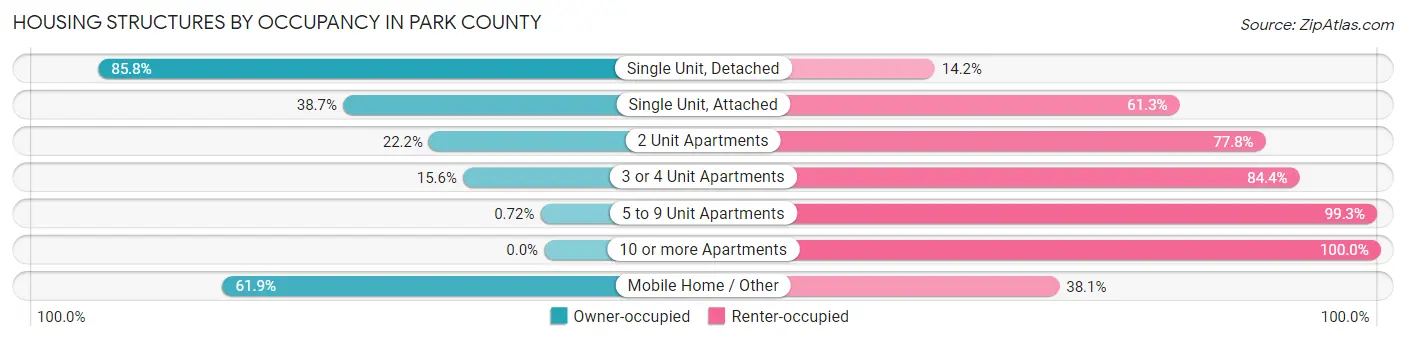
| Structure Type | Owner-occupied | Renter-occupied |
| Single Unit, Detached | 8,590 (85.8%) | 1,420 (14.2%) |
| Single Unit, Attached | 225 (38.7%) | 356 (61.3%) |
| 2 Unit Apartments | 51 (22.2%) | 179 (77.8%) |
| 3 or 4 Unit Apartments | 73 (15.6%) | 394 (84.4%) |
| 5 to 9 Unit Apartments | 3 (0.7%) | 413 (99.3%) |
| 10 or more Apartments | 0 (0.0%) | 284 (100.0%) |
| Mobile Home / Other | 657 (61.9%) | 405 (38.1%) |
| Total | 9,599 (73.6%) | 3,451 (26.4%) |
Housing Structures by Number of Rooms in Park County
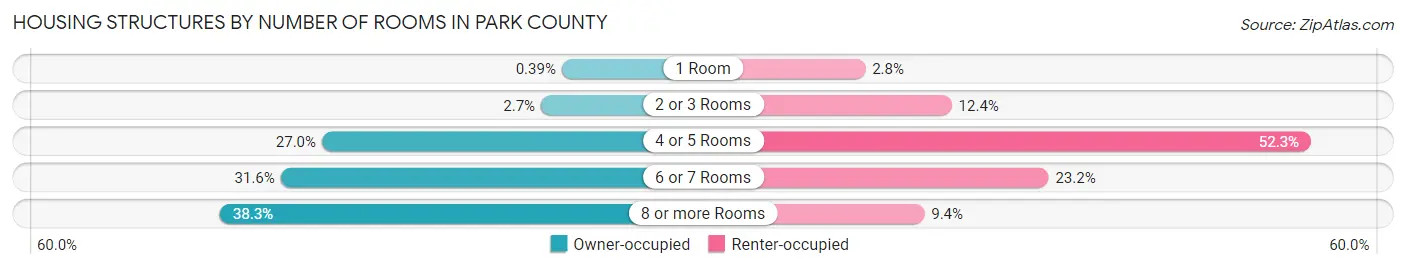
| Number of Rooms | Owner-occupied | Renter-occupied |
| 1 Room | 37 (0.4%) | 97 (2.8%) |
| 2 or 3 Rooms | 259 (2.7%) | 428 (12.4%) |
| 4 or 5 Rooms | 2,593 (27.0%) | 1,804 (52.3%) |
| 6 or 7 Rooms | 3,032 (31.6%) | 799 (23.2%) |
| 8 or more Rooms | 3,678 (38.3%) | 323 (9.4%) |
| Total | 9,599 (100.0%) | 3,451 (100.0%) |
Housing Structure by Heating Type in Park County
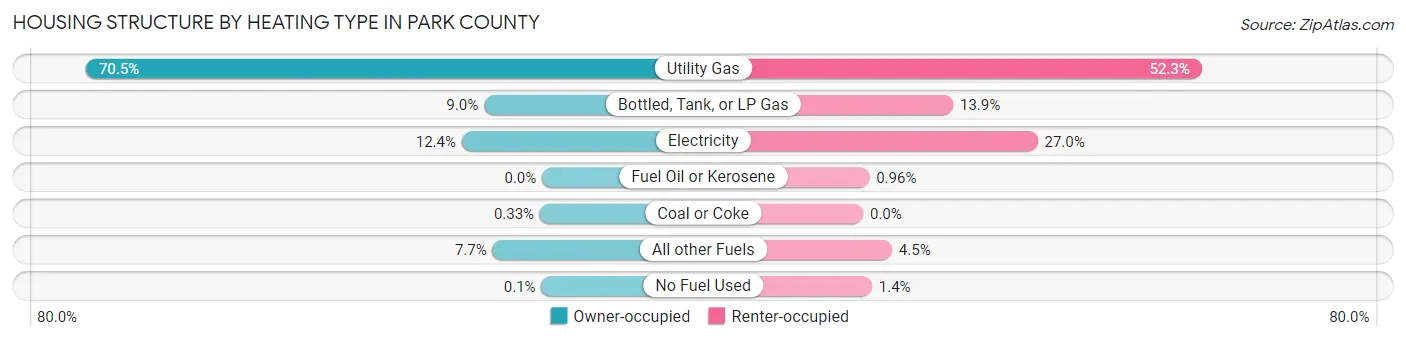
| Heating Type | Owner-occupied | Renter-occupied |
| Utility Gas | 6,768 (70.5%) | 1,806 (52.3%) |
| Bottled, Tank, or LP Gas | 862 (9.0%) | 480 (13.9%) |
| Electricity | 1,192 (12.4%) | 931 (27.0%) |
| Fuel Oil or Kerosene | 0 (0.0%) | 33 (1.0%) |
| Coal or Coke | 32 (0.3%) | 0 (0.0%) |
| All other Fuels | 735 (7.7%) | 154 (4.5%) |
| No Fuel Used | 10 (0.1%) | 47 (1.4%) |
| Total | 9,599 (100.0%) | 3,451 (100.0%) |
Household Vehicle Usage in Park County
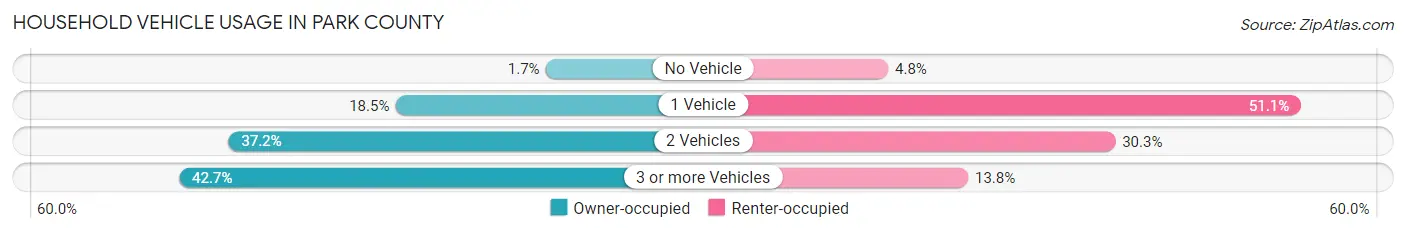
| Vehicles per Household | Owner-occupied | Renter-occupied |
| No Vehicle | 159 (1.7%) | 167 (4.8%) |
| 1 Vehicle | 1,774 (18.5%) | 1,763 (51.1%) |
| 2 Vehicles | 3,568 (37.2%) | 1,045 (30.3%) |
| 3 or more Vehicles | 4,098 (42.7%) | 476 (13.8%) |
| Total | 9,599 (100.0%) | 3,451 (100.0%) |
Real Estate & Mortgages in Park County
Real Estate and Mortgage Overview in Park County
| Characteristic | Without Mortgage | With Mortgage |
| Housing Units | 4,367 | 5,232 |
| Median Property Value | $333,700 | $326,800 |
| Median Household Income | $60,202 | $1,088 |
| Monthly Housing Costs | $517 | $257 |
| Real Estate Taxes | $2,026 | $97 |
Property Value by Mortgage Status in Park County
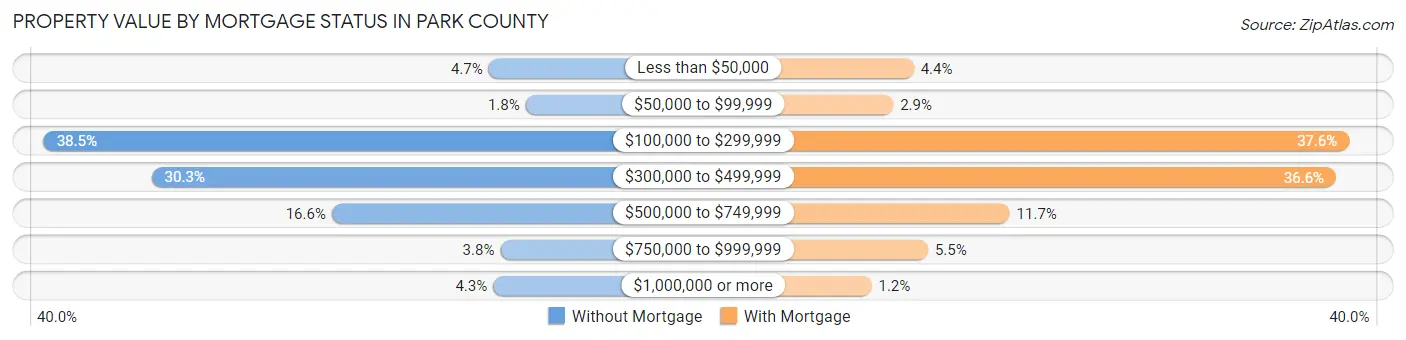
| Property Value | Without Mortgage | With Mortgage |
| Less than $50,000 | 203 (4.6%) | 232 (4.4%) |
| $50,000 to $99,999 | 80 (1.8%) | 150 (2.9%) |
| $100,000 to $299,999 | 1,683 (38.5%) | 1,968 (37.6%) |
| $300,000 to $499,999 | 1,324 (30.3%) | 1,915 (36.6%) |
| $500,000 to $749,999 | 725 (16.6%) | 614 (11.7%) |
| $750,000 to $999,999 | 164 (3.8%) | 289 (5.5%) |
| $1,000,000 or more | 188 (4.3%) | 64 (1.2%) |
| Total | 4,367 (100.0%) | 5,232 (100.0%) |
Household Income by Mortgage Status in Park County
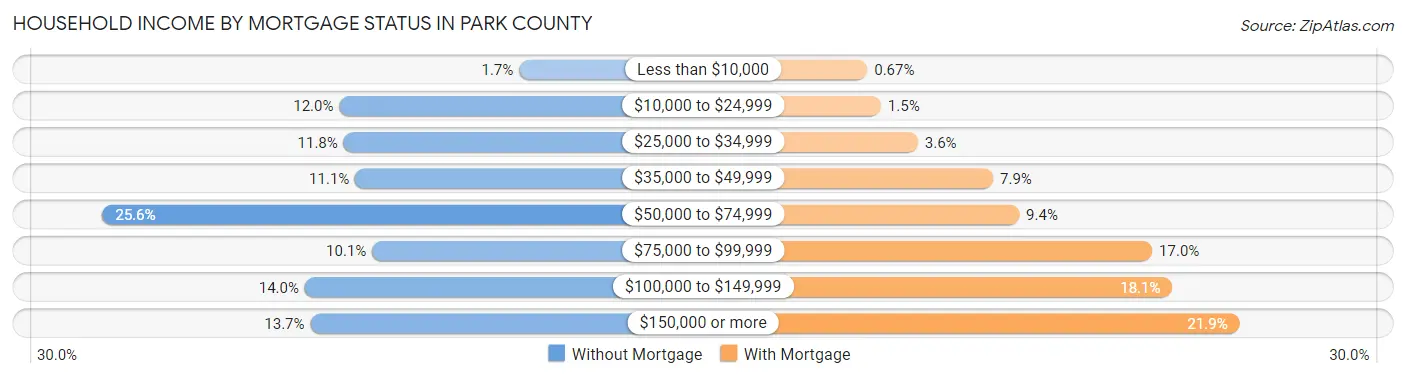
| Household Income | Without Mortgage | With Mortgage |
| Less than $10,000 | 76 (1.7%) | 35 (0.7%) |
| $10,000 to $24,999 | 525 (12.0%) | 76 (1.5%) |
| $25,000 to $34,999 | 514 (11.8%) | 186 (3.6%) |
| $35,000 to $49,999 | 485 (11.1%) | 411 (7.9%) |
| $50,000 to $74,999 | 1,116 (25.6%) | 489 (9.3%) |
| $75,000 to $99,999 | 443 (10.1%) | 887 (17.0%) |
| $100,000 to $149,999 | 611 (14.0%) | 947 (18.1%) |
| $150,000 or more | 597 (13.7%) | 1,148 (21.9%) |
| Total | 4,367 (100.0%) | 5,232 (100.0%) |
Property Value to Household Income Ratio in Park County
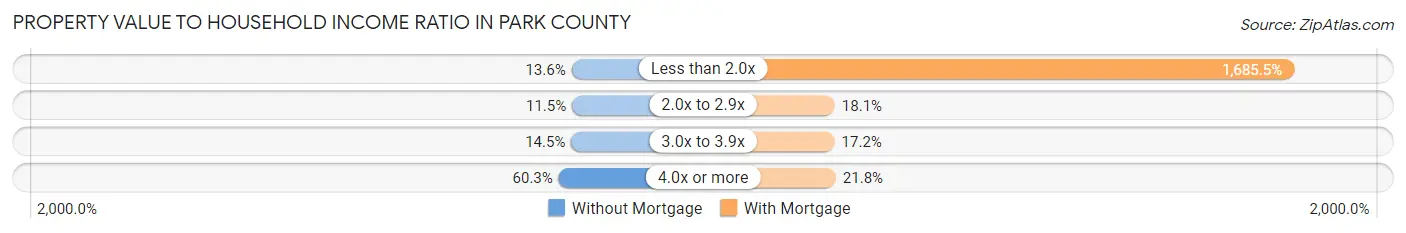
| Value-to-Income Ratio | Without Mortgage | With Mortgage |
| Less than 2.0x | 593 (13.6%) | 88,186 (1,685.5%) |
| 2.0x to 2.9x | 501 (11.5%) | 949 (18.1%) |
| 3.0x to 3.9x | 632 (14.5%) | 900 (17.2%) |
| 4.0x or more | 2,632 (60.3%) | 1,142 (21.8%) |
| Total | 4,367 (100.0%) | 5,232 (100.0%) |
Real Estate Taxes by Mortgage Status in Park County
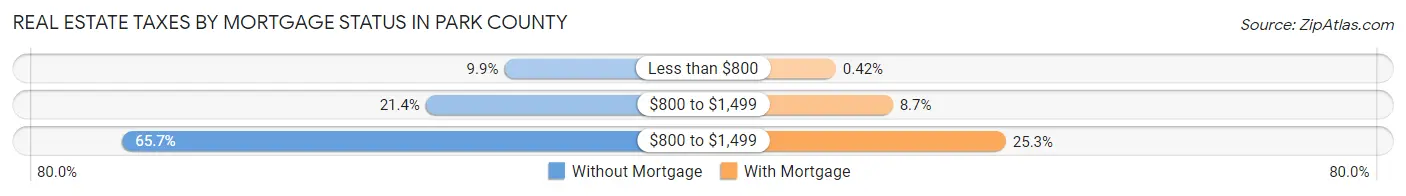
| Property Taxes | Without Mortgage | With Mortgage |
| Less than $800 | 433 (9.9%) | 22 (0.4%) |
| $800 to $1,499 | 934 (21.4%) | 456 (8.7%) |
| $800 to $1,499 | 2,869 (65.7%) | 1,321 (25.3%) |
| Total | 4,367 (100.0%) | 5,232 (100.0%) |
Health & Disability in Park County
Health Insurance Coverage by Age in Park County
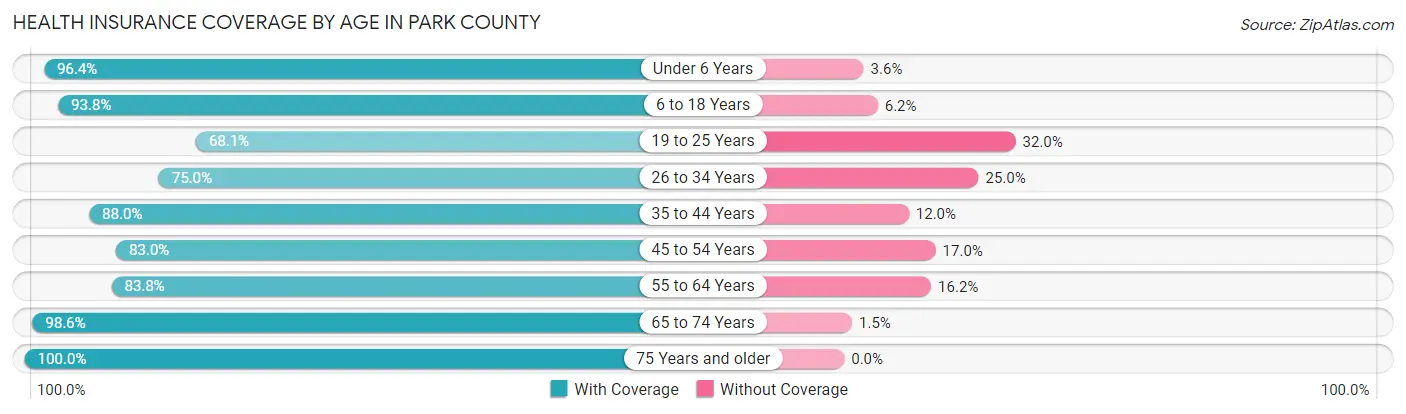
| Age Bracket | With Coverage | Without Coverage |
| Under 6 Years | 1,577 (96.4%) | 59 (3.6%) |
| 6 to 18 Years | 4,719 (93.8%) | 314 (6.2%) |
| 19 to 25 Years | 1,340 (68.0%) | 629 (32.0%) |
| 26 to 34 Years | 2,101 (75.0%) | 702 (25.0%) |
| 35 to 44 Years | 3,053 (88.0%) | 418 (12.0%) |
| 45 to 54 Years | 2,785 (83.0%) | 572 (17.0%) |
| 55 to 64 Years | 3,658 (83.8%) | 707 (16.2%) |
| 65 to 74 Years | 4,149 (98.6%) | 61 (1.5%) |
| 75 Years and older | 2,840 (100.0%) | 0 (0.0%) |
| Total | 26,222 (88.3%) | 3,462 (11.7%) |
Health Insurance Coverage by Citizenship Status in Park County
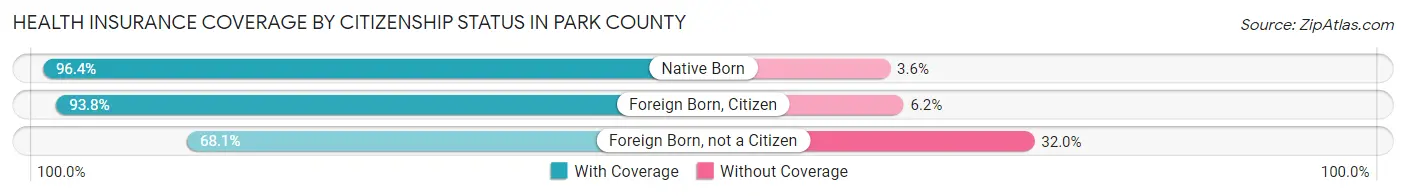
| Citizenship Status | With Coverage | Without Coverage |
| Native Born | 1,577 (96.4%) | 59 (3.6%) |
| Foreign Born, Citizen | 4,719 (93.8%) | 314 (6.2%) |
| Foreign Born, not a Citizen | 1,340 (68.0%) | 629 (32.0%) |
Health Insurance Coverage by Household Income in Park County
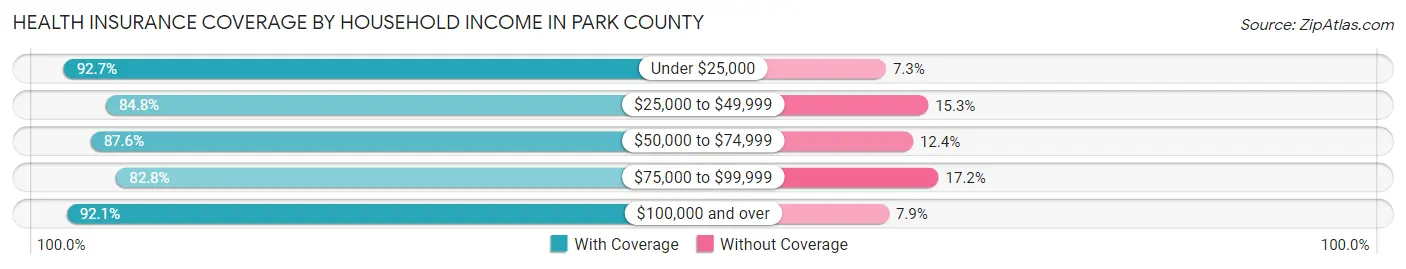
| Household Income | With Coverage | Without Coverage |
| Under $25,000 | 2,587 (92.7%) | 205 (7.3%) |
| $25,000 to $49,999 | 4,112 (84.8%) | 740 (15.2%) |
| $50,000 to $74,999 | 5,297 (87.6%) | 750 (12.4%) |
| $75,000 to $99,999 | 4,086 (82.8%) | 849 (17.2%) |
| $100,000 and over | 9,626 (92.1%) | 826 (7.9%) |
Public vs Private Health Insurance Coverage by Age in Park County
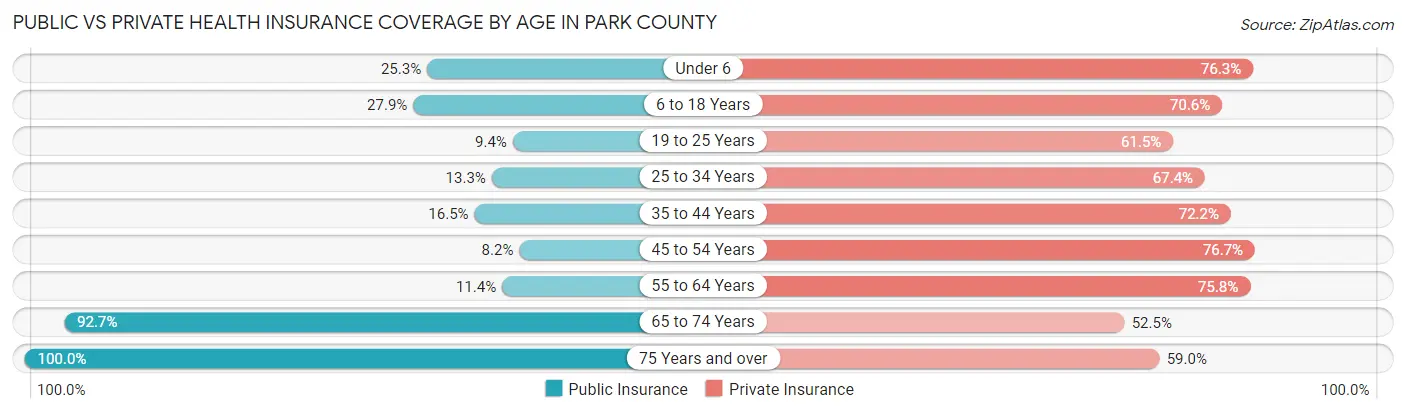
| Age Bracket | Public Insurance | Private Insurance |
| Under 6 | 414 (25.3%) | 1,249 (76.3%) |
| 6 to 18 Years | 1,403 (27.9%) | 3,553 (70.6%) |
| 19 to 25 Years | 185 (9.4%) | 1,211 (61.5%) |
| 25 to 34 Years | 373 (13.3%) | 1,889 (67.4%) |
| 35 to 44 Years | 573 (16.5%) | 2,506 (72.2%) |
| 45 to 54 Years | 275 (8.2%) | 2,574 (76.7%) |
| 55 to 64 Years | 497 (11.4%) | 3,308 (75.8%) |
| 65 to 74 Years | 3,901 (92.7%) | 2,211 (52.5%) |
| 75 Years and over | 2,840 (100.0%) | 1,676 (59.0%) |
| Total | 10,461 (35.2%) | 20,177 (68.0%) |
Disability Status by Sex by Age in Park County
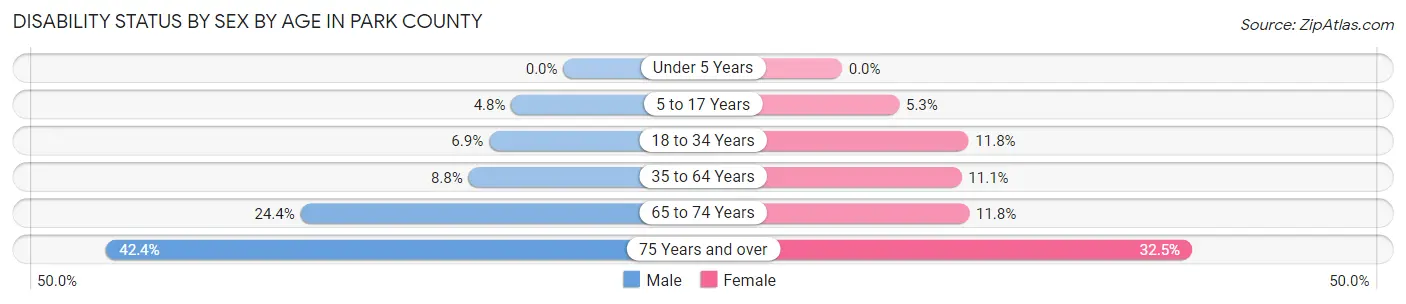
| Age Bracket | Male | Female |
| Under 5 Years | 0 (0.0%) | 0 (0.0%) |
| 5 to 17 Years | 117 (4.8%) | 120 (5.3%) |
| 18 to 34 Years | 179 (6.9%) | 319 (11.7%) |
| 35 to 64 Years | 485 (8.8%) | 631 (11.1%) |
| 65 to 74 Years | 529 (24.4%) | 241 (11.8%) |
| 75 Years and over | 536 (42.4%) | 512 (32.5%) |
Disability Class by Sex by Age in Park County
Disability Class: Hearing Difficulty
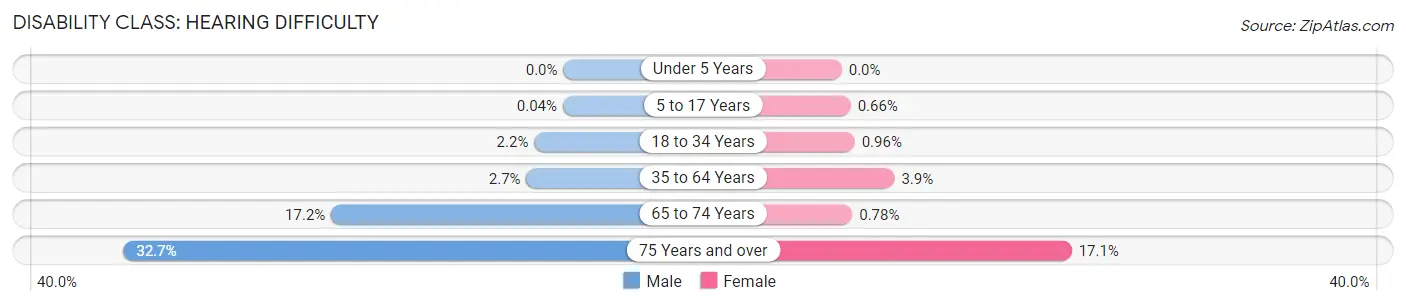
| Age Bracket | Male | Female |
| Under 5 Years | 0 (0.0%) | 0 (0.0%) |
| 5 to 17 Years | 1 (0.0%) | 15 (0.7%) |
| 18 to 34 Years | 56 (2.2%) | 26 (1.0%) |
| 35 to 64 Years | 151 (2.7%) | 222 (3.9%) |
| 65 to 74 Years | 374 (17.2%) | 16 (0.8%) |
| 75 Years and over | 413 (32.7%) | 269 (17.1%) |
Disability Class: Vision Difficulty
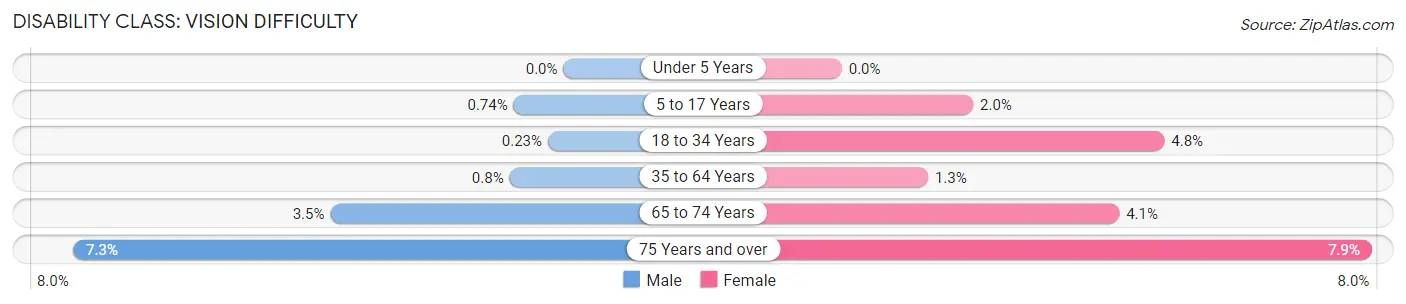
| Age Bracket | Male | Female |
| Under 5 Years | 0 (0.0%) | 0 (0.0%) |
| 5 to 17 Years | 18 (0.7%) | 44 (1.9%) |
| 18 to 34 Years | 6 (0.2%) | 130 (4.8%) |
| 35 to 64 Years | 44 (0.8%) | 73 (1.3%) |
| 65 to 74 Years | 75 (3.5%) | 84 (4.1%) |
| 75 Years and over | 92 (7.3%) | 124 (7.9%) |
Disability Class: Cognitive Difficulty
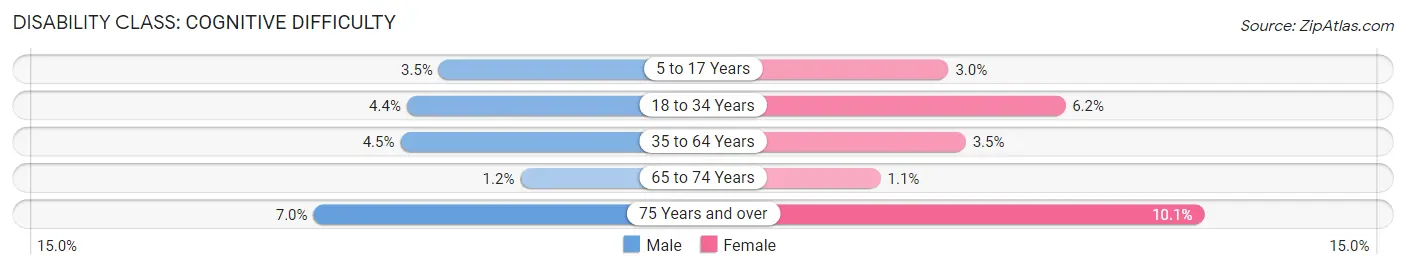
| Age Bracket | Male | Female |
| 5 to 17 Years | 84 (3.5%) | 67 (3.0%) |
| 18 to 34 Years | 113 (4.4%) | 169 (6.2%) |
| 35 to 64 Years | 250 (4.5%) | 196 (3.5%) |
| 65 to 74 Years | 26 (1.2%) | 22 (1.1%) |
| 75 Years and over | 88 (7.0%) | 159 (10.1%) |
Disability Class: Ambulatory Difficulty
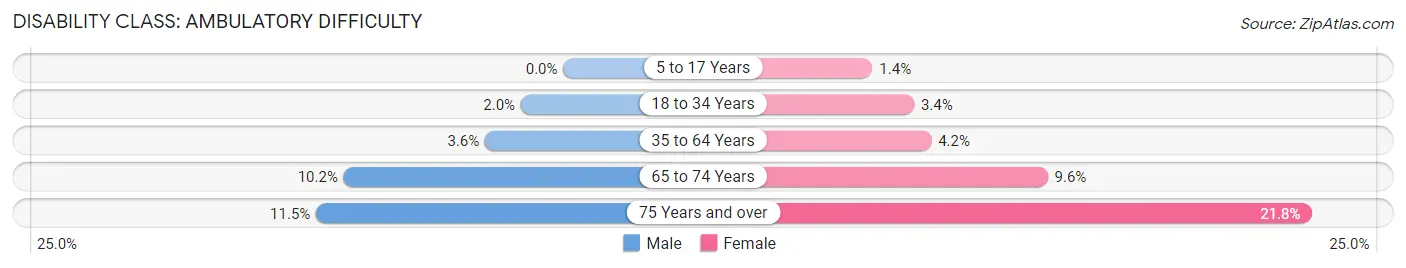
| Age Bracket | Male | Female |
| 5 to 17 Years | 0 (0.0%) | 32 (1.4%) |
| 18 to 34 Years | 51 (2.0%) | 91 (3.4%) |
| 35 to 64 Years | 200 (3.6%) | 236 (4.2%) |
| 65 to 74 Years | 221 (10.2%) | 195 (9.6%) |
| 75 Years and over | 145 (11.5%) | 344 (21.8%) |
Disability Class: Self-Care Difficulty
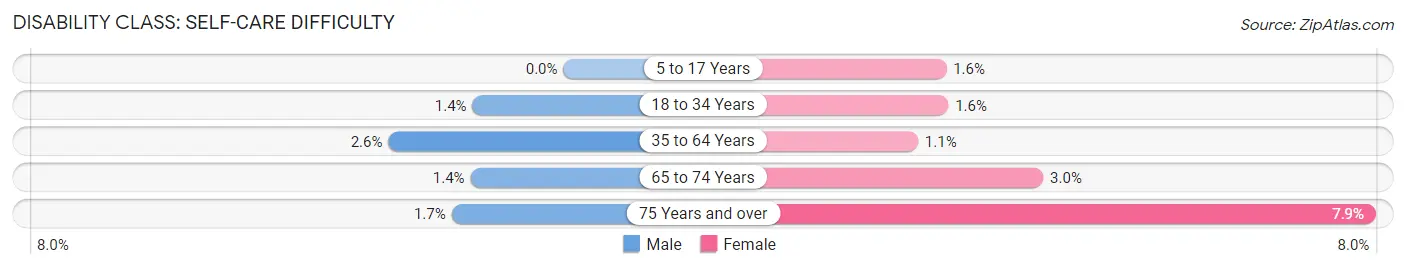
| Age Bracket | Male | Female |
| 5 to 17 Years | 0 (0.0%) | 35 (1.5%) |
| 18 to 34 Years | 35 (1.3%) | 43 (1.6%) |
| 35 to 64 Years | 143 (2.6%) | 64 (1.1%) |
| 65 to 74 Years | 30 (1.4%) | 61 (3.0%) |
| 75 Years and over | 21 (1.7%) | 125 (7.9%) |
Technology Access in Park County
Computing Device Access in Park County
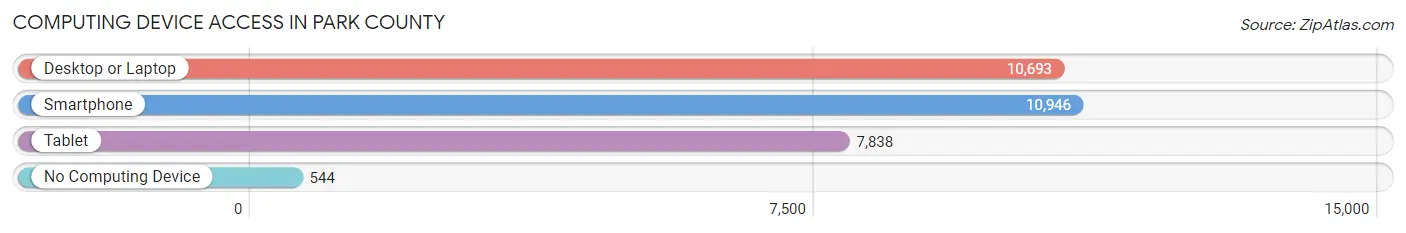
| Device Type | # Households | % Households |
| Desktop or Laptop | 10,693 | 81.9% |
| Smartphone | 10,946 | 83.9% |
| Tablet | 7,838 | 60.1% |
| No Computing Device | 544 | 4.2% |
| Total | 13,050 | 100.0% |
Internet Access in Park County
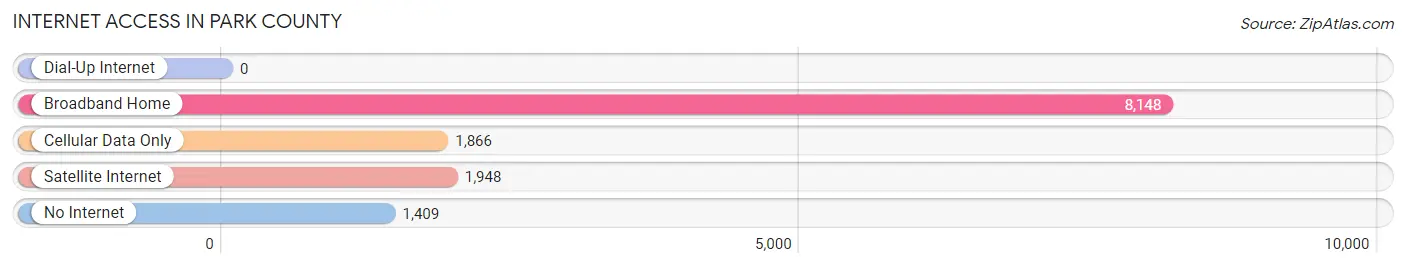
| Internet Type | # Households | % Households |
| Dial-Up Internet | 0 | 0.0% |
| Broadband Home | 8,148 | 62.4% |
| Cellular Data Only | 1,866 | 14.3% |
| Satellite Internet | 1,948 | 14.9% |
| No Internet | 1,409 | 10.8% |
| Total | 13,050 | 100.0% |
Park County Summary
Park County is a county located in the state of Wyoming in the United States. As of the 2010 census, the population was 28,205. The county seat is Cody. Park County is home to the world-famous Yellowstone National Park, the first national park in the United States.
Geography
Park County is located in the northwestern corner of Wyoming, bordered by Montana to the north and Idaho to the west. It is the second-largest county in Wyoming, covering an area of 5,379 square miles. The county is divided into two distinct regions: the Absaroka Range to the east and the Beartooth Mountains to the west. The county is home to the Shoshone National Forest, the first national forest in the United States.
The county is home to the Yellowstone River, which flows through the county from north to south. The river is a major source of recreation for the county, with fishing, boating, and rafting being popular activities. The county is also home to several lakes, including Buffalo Bill Reservoir, Heart Mountain Reservoir, and Yellowstone Lake.
The county is home to several mountain ranges, including the Absaroka Range, the Beartooth Mountains, the Wind River Range, and the Teton Range. The county is also home to several peaks, including Mount Washburn, Mount Sheridan, and Mount Moran.
History
Park County was created in 1909 from parts of Big Horn and Hot Springs counties. The county was named after Yellowstone National Park, which was established in 1872.
The county was originally inhabited by Native American tribes, including the Shoshone, Crow, and Arapaho. The first white settlers arrived in the area in the late 1800s, and the county was officially established in 1909.
The county was largely rural until the 1950s, when the construction of the Buffalo Bill Dam and Reservoir brought an influx of people to the area. The dam was completed in 1955, and the reservoir was filled in 1956.
The county has since become a popular tourist destination, with visitors coming to the area to visit Yellowstone National Park and the many other attractions in the county.
Economy
The economy of Park County is largely based on tourism, with visitors coming to the area to visit Yellowstone National Park and the many other attractions in the county. The county is also home to several large ranches, which provide beef and other agricultural products to the local economy.
The county is home to several large employers, including the Cody Regional Health Center, the Cody Regional Airport, and the Buffalo Bill Dam and Reservoir.
Demographics
As of the 2010 census, there were 28,205 people, 11,845 households, and 7,845 families living in the county. The population density was 5.2 people per square mile. There were 13,845 housing units at an average density of 2.6 per square mile.
The racial makeup of the county was 95.2% White, 0.5% Black or African American, 0.7% Native American, 0.5% Asian, 0.1% Pacific Islander, 1.7% from other races, and 1.4% from two or more races. Hispanic or Latino of any race were 4.2% of the population.
The median income for a household in the county was $41,945, and the median income for a family was $50,945. The per capita income for the county was $21,945. About 11.2% of families and 14.7% of the population were below the poverty line, including 19.2% of those under age 18 and 8.2% of those age 65 or over.
Common Questions
What is the Total Population of Park County?
Total Population of Park County is 29,878.
What is the Total Male Population of Park County?
Total Male Population of Park County is 14,832.
What is the Total Female Population of Park County?
Total Female Population of Park County is 15,046.
What is the Ratio of Males per 100 Females in Park County?
There are 98.58 Males per 100 Females in Park County.
What is the Ratio of Females per 100 Males in Park County?
There are 101.44 Females per 100 Males in Park County.
What is the Median Population Age in Park County?
Median Population Age in Park County is 45.0 Years.
What is the Average Family Size in Park County
Average Family Size in Park County is 2.8 People.
What is the Average Household Size in Park County
Average Household Size in Park County is 2.2 People.
What is Per Capita Income in Park County?
Per Capita income in Park County is $37,544.
What is the Median Family Income in Park County?
Median Family Income in Park County is $83,265.
What is the Median Household income in Park County?
Median Household Income in Park County is $66,754.
What is Income or Wage Gap in Park County?
Income or Wage Gap in Park County is 42.5%.
Women in Park County earn 57.5 cents for every dollar earned by a man.
What is Family Income Deficit in Park County?
Family Income Deficit in Park County is $7,877.
Families that are below poverty line in Park County earn $7,877 less on average than the poverty threshold level.
What is Inequality or Gini Index in Park County?
Inequality or Gini Index in Park County is 0.42.
How Large is the Labor Force in Park County?
There are 14,974 People in the Labor Forcein in Park County.
What is the Percentage of People in the Labor Force in Park County?
61.2% of People are in the Labor Force in Park County.
What is the Unemployment Rate in Park County?
Unemployment Rate in Park County is 2.7%.