Niobrara County, WY
Niobrara County Map
Niobrara County Overview
2,460
TOTAL POPULATION
1,056
MALE POPULATION
1,404
FEMALE POPULATION
75.21
MALES / 100 FEMALES
132.95
FEMALES / 100 MALES
43.6
MEDIAN AGE
2.7
AVG FAMILY SIZE
2.1
AVG HOUSEHOLD SIZE
$29,442
PER CAPITA INCOME
$62,434
AVG FAMILY INCOME
$54,375
AVG HOUSEHOLD INCOME
48.8%
WAGE / INCOME GAP [ % ]
51.2¢/ $1
WAGE / INCOME GAP [ $ ]
0.44
INEQUALITY / GINI INDEX
1,166
LABOR FORCE [ PEOPLE ]
55.9%
PERCENT IN LABOR FORCE
5.3%
UNEMPLOYMENT RATE
Niobrara County Area Codes
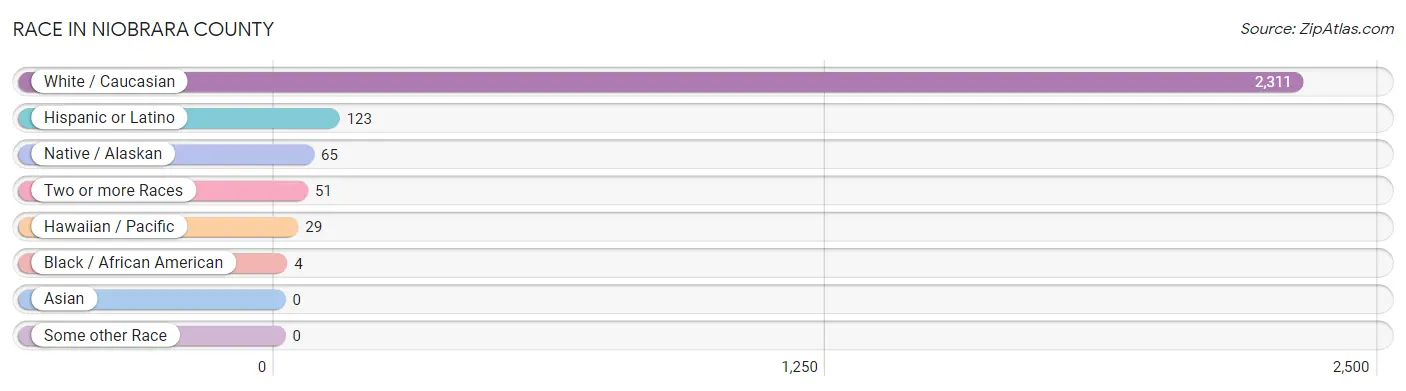
Race in Niobrara County
The most populous races in Niobrara County are White / Caucasian (2,311 | 93.9%), Hispanic or Latino (123 | 5.0%), and Native / Alaskan (65 | 2.6%).
| Race | # Population | % Population |
| Asian | 0 | 0.0% |
| Black / African American | 4 | 0.2% |
| Hawaiian / Pacific | 29 | 1.2% |
| Hispanic or Latino | 123 | 5.0% |
| Native / Alaskan | 65 | 2.6% |
| White / Caucasian | 2,311 | 93.9% |
| Two or more Races | 51 | 2.1% |
| Some other Race | 0 | 0.0% |
| Total | 2,460 | 100.0% |
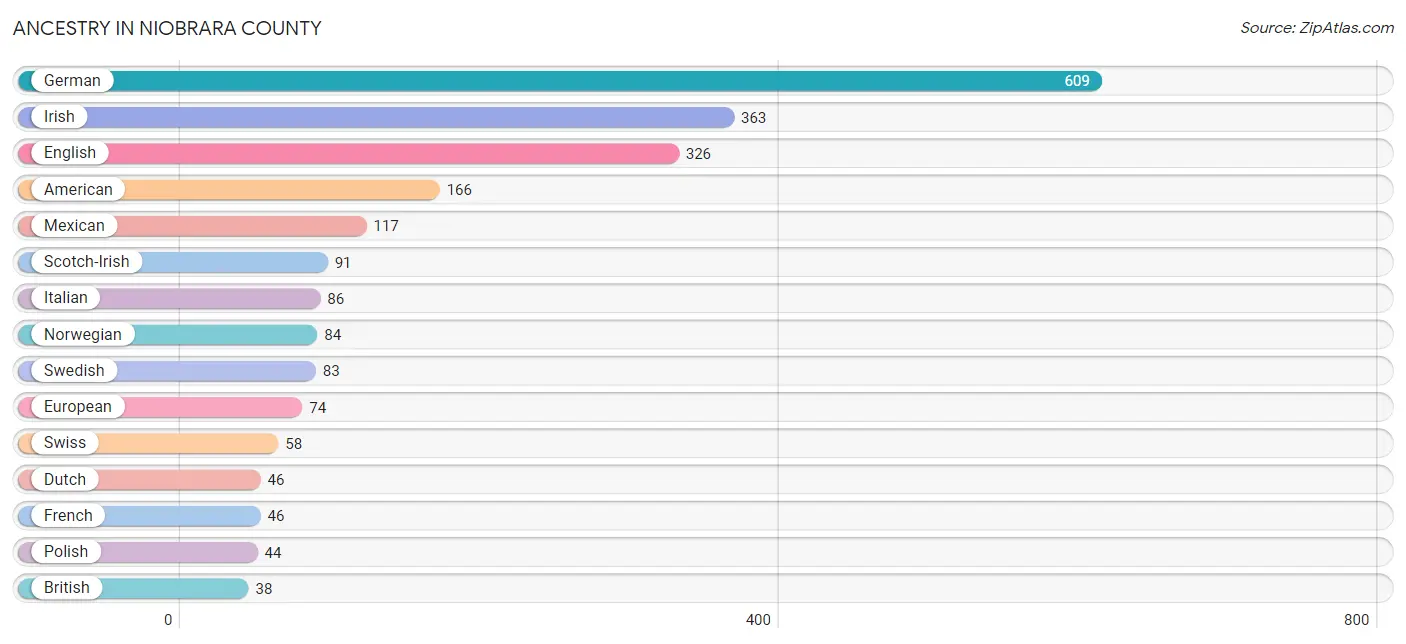
Ancestry in Niobrara County
The most populous ancestries reported in Niobrara County are German (609 | 24.8%), Irish (363 | 14.8%), English (326 | 13.3%), American (166 | 6.8%), and Mexican (117 | 4.8%), together accounting for 64.3% of all Niobrara County residents.
| Ancestry | # Population | % Population |
| American | 166 | 6.8% |
| Arapaho | 21 | 0.9% |
| Blackfeet | 4 | 0.2% |
| British | 38 | 1.5% |
| Celtic | 13 | 0.5% |
| Central American | 4 | 0.2% |
| Cherokee | 8 | 0.3% |
| Creek | 6 | 0.2% |
| Czech | 29 | 1.2% |
| Danish | 20 | 0.8% |
| Dutch | 46 | 1.9% |
| English | 326 | 13.3% |
| European | 74 | 3.0% |
| Finnish | 7 | 0.3% |
| French | 46 | 1.9% |
| German | 609 | 24.8% |
| Guamanian / Chamorro | 29 | 1.2% |
| Honduran | 4 | 0.2% |
| Hungarian | 1 | 0.0% |
| Indian (Asian) | 29 | 1.2% |
| Inupiat | 3 | 0.1% |
| Irish | 363 | 14.8% |
| Italian | 86 | 3.5% |
| Mexican | 117 | 4.8% |
| Northern European | 13 | 0.5% |
| Norwegian | 84 | 3.4% |
| Polish | 44 | 1.8% |
| Puerto Rican | 2 | 0.1% |
| Russian | 32 | 1.3% |
| Scandinavian | 7 | 0.3% |
| Scotch-Irish | 91 | 3.7% |
| Scottish | 23 | 0.9% |
| Sioux | 8 | 0.3% |
| Swedish | 83 | 3.4% |
| Swiss | 58 | 2.4% |
| Welsh | 5 | 0.2% | View All 36 Rows |
Immigrants in Niobrara County

| Immigration Origin | # Population | % Population | View All 0 Rows |
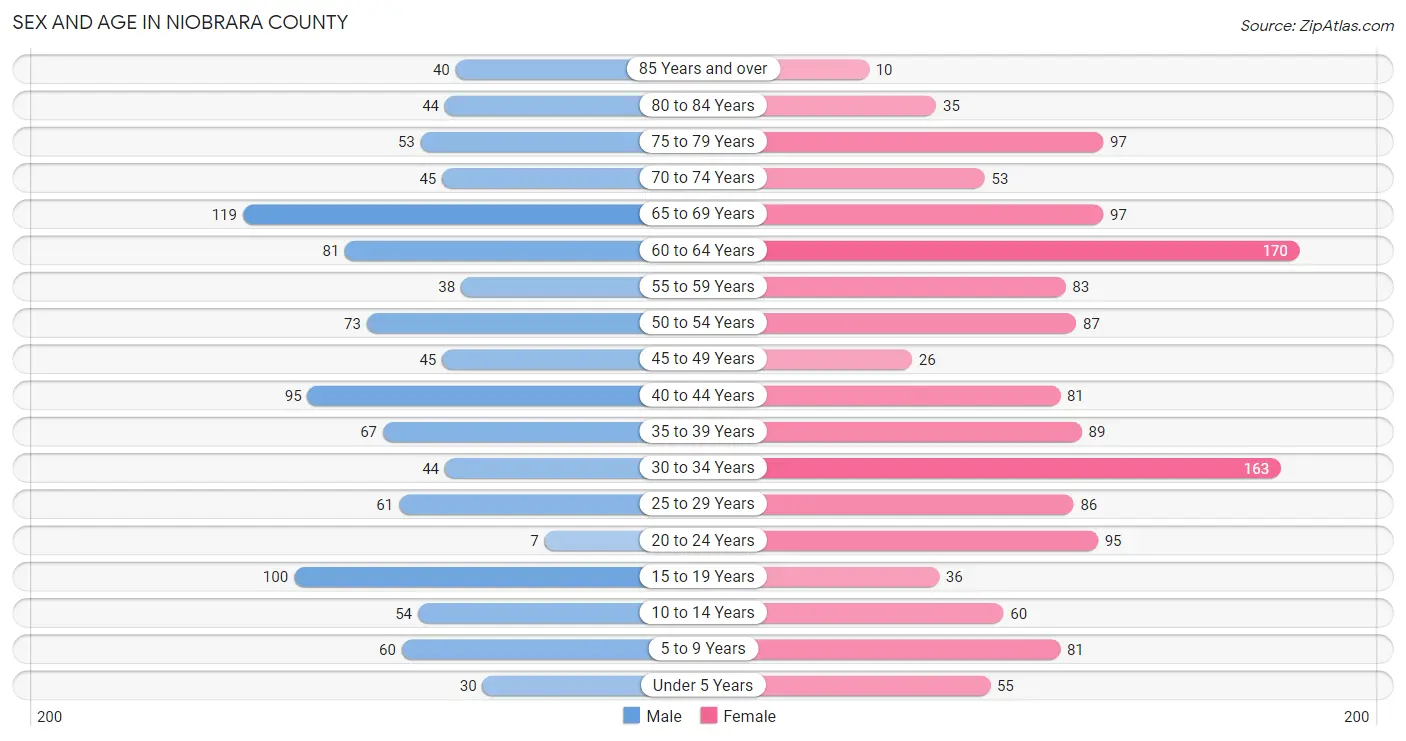
Sex and Age in Niobrara County
Sex and Age in Niobrara County
The most populous age groups in Niobrara County are 65 to 69 Years (119 | 11.3%) for men and 60 to 64 Years (170 | 12.1%) for women.
| Age Bracket | Male | Female |
| Under 5 Years | 30 (2.8%) | 55 (3.9%) |
| 5 to 9 Years | 60 (5.7%) | 81 (5.8%) |
| 10 to 14 Years | 54 (5.1%) | 60 (4.3%) |
| 15 to 19 Years | 100 (9.5%) | 36 (2.6%) |
| 20 to 24 Years | 7 (0.7%) | 95 (6.8%) |
| 25 to 29 Years | 61 (5.8%) | 86 (6.1%) |
| 30 to 34 Years | 44 (4.2%) | 163 (11.6%) |
| 35 to 39 Years | 67 (6.3%) | 89 (6.3%) |
| 40 to 44 Years | 95 (9.0%) | 81 (5.8%) |
| 45 to 49 Years | 45 (4.3%) | 26 (1.8%) |
| 50 to 54 Years | 73 (6.9%) | 87 (6.2%) |
| 55 to 59 Years | 38 (3.6%) | 83 (5.9%) |
| 60 to 64 Years | 81 (7.7%) | 170 (12.1%) |
| 65 to 69 Years | 119 (11.3%) | 97 (6.9%) |
| 70 to 74 Years | 45 (4.3%) | 53 (3.8%) |
| 75 to 79 Years | 53 (5.0%) | 97 (6.9%) |
| 80 to 84 Years | 44 (4.2%) | 35 (2.5%) |
| 85 Years and over | 40 (3.8%) | 10 (0.7%) |
| Total | 1,056 (100.0%) | 1,404 (100.0%) |
Families and Households in Niobrara County
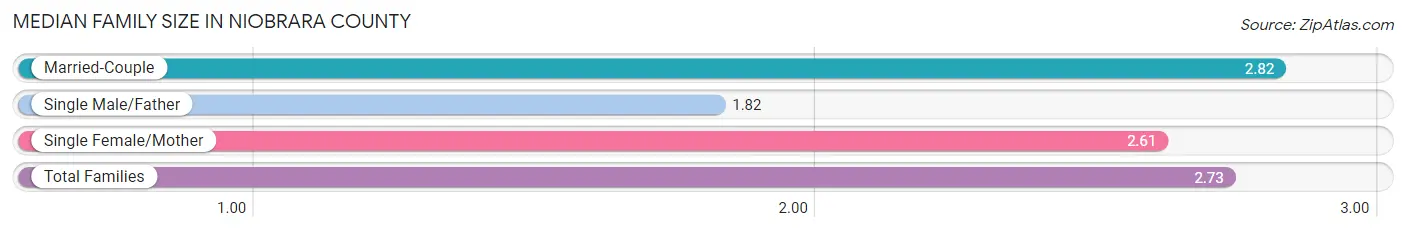
Median Family Size in Niobrara County
The median family size in Niobrara County is 2.73 persons per family, with married-couple families (492 | 81.6%) accounting for the largest median family size of 2.82 persons per family. On the other hand, single male/father families (34 | 5.6%) represent the smallest median family size with 1.82 persons per family.
| Family Type | # Families | Family Size |
| Married-Couple | 492 (81.6%) | 2.82 |
| Single Male/Father | 34 (5.6%) | 1.82 |
| Single Female/Mother | 77 (12.8%) | 2.61 |
| Total Families | 603 (100.0%) | 2.73 |
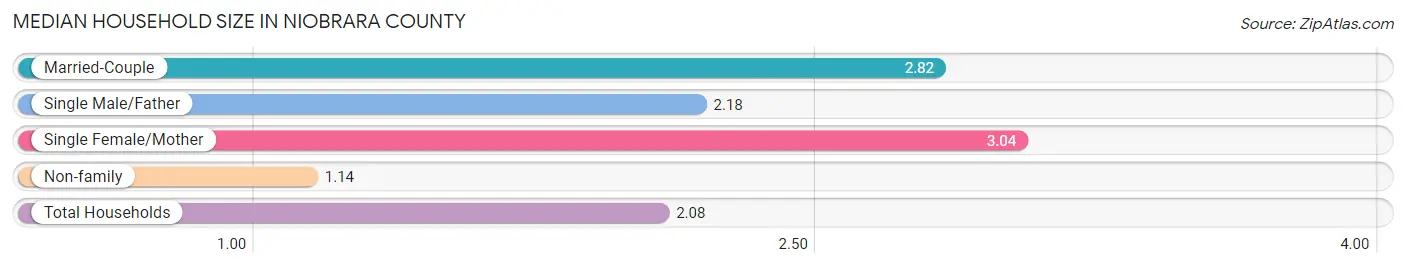
Median Household Size in Niobrara County
The median household size in Niobrara County is 2.08 persons per household, with single female/mother households (77 | 7.2%) accounting for the largest median household size of 3.04 persons per household. non-family households (469 | 43.8%) represent the smallest median household size with 1.14 persons per household.
| Household Type | # Households | Household Size |
| Married-Couple | 492 (45.9%) | 2.82 |
| Single Male/Father | 34 (3.2%) | 2.18 |
| Single Female/Mother | 77 (7.2%) | 3.04 |
| Non-family | 469 (43.8%) | 1.14 |
| Total Households | 1,072 (100.0%) | 2.08 |
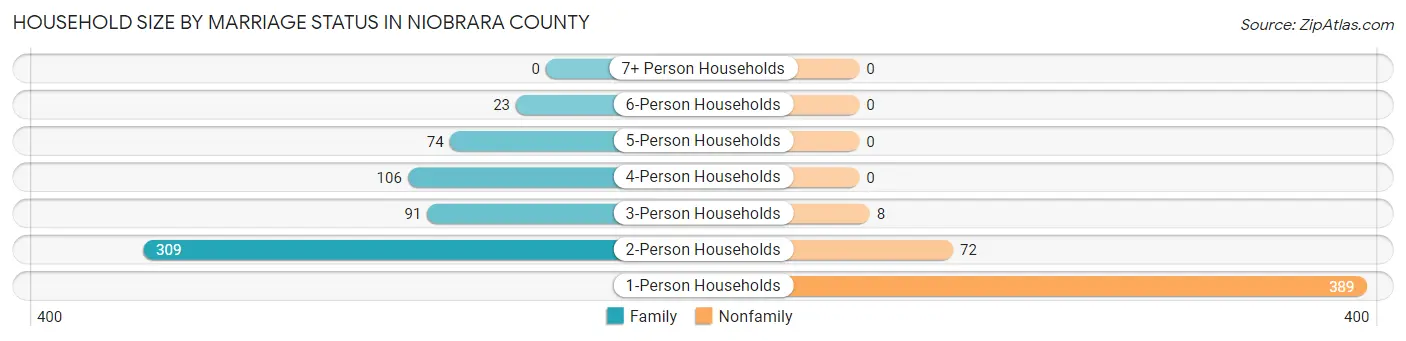
Household Size by Marriage Status in Niobrara County
Out of a total of 1,072 households in Niobrara County, 603 (56.2%) are family households, while 469 (43.8%) are nonfamily households. The most numerous type of family households are 2-person households, comprising 309, and the most common type of nonfamily households are 1-person households, comprising 389.
| Household Size | Family Households | Nonfamily Households |
| 1-Person Households | - | 389 (36.3%) |
| 2-Person Households | 309 (28.8%) | 72 (6.7%) |
| 3-Person Households | 91 (8.5%) | 8 (0.7%) |
| 4-Person Households | 106 (9.9%) | 0 (0.0%) |
| 5-Person Households | 74 (6.9%) | 0 (0.0%) |
| 6-Person Households | 23 (2.1%) | 0 (0.0%) |
| 7+ Person Households | 0 (0.0%) | 0 (0.0%) |
| Total | 603 (56.2%) | 469 (43.8%) |
Female Fertility in Niobrara County
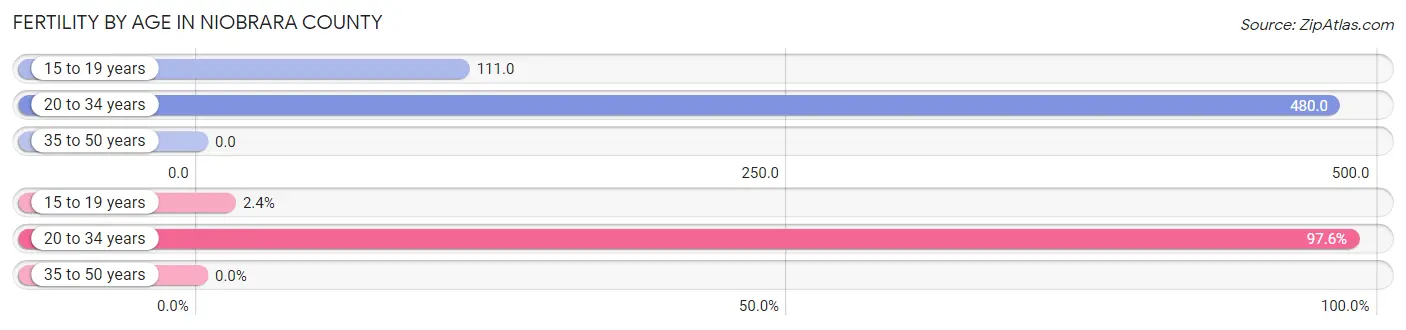
Fertility by Age in Niobrara County
Average fertility rate in Niobrara County is 283.0 births per 1,000 women. Women in the age bracket of 20 to 34 years have the highest fertility rate with 480.0 births per 1,000 women. Women in the age bracket of 20 to 34 years acount for 97.6% of all women with births.
| Age Bracket | Women with Births | Births / 1,000 Women |
| 15 to 19 years | 4 (2.4%) | 111.0 |
| 20 to 34 years | 165 (97.6%) | 480.0 |
| 35 to 50 years | 0 (0.0%) | 0.0 |
| Total | 169 (100.0%) | 283.0 |
Fertility by Age by Marriage Status in Niobrara County
58.0% of women with births (169) in Niobrara County are married. The highest percentage of unmarried women with births falls into 15 to 19 years age bracket with 100.0% of them unmarried at the time of birth, while the lowest percentage of unmarried women with births belong to 20 to 34 years age bracket with 40.6% of them unmarried.
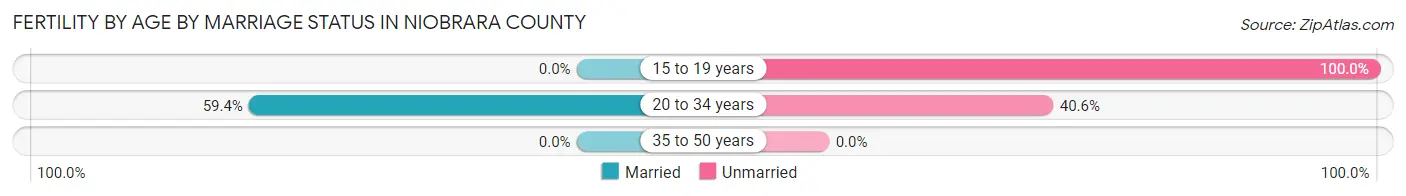
| Age Bracket | Married | Unmarried |
| 15 to 19 years | 0 (0.0%) | 4 (100.0%) |
| 20 to 34 years | 98 (59.4%) | 67 (40.6%) |
| 35 to 50 years | 0 (0.0%) | 0 (0.0%) |
| Total | 98 (58.0%) | 71 (42.0%) |
Fertility by Education in Niobrara County
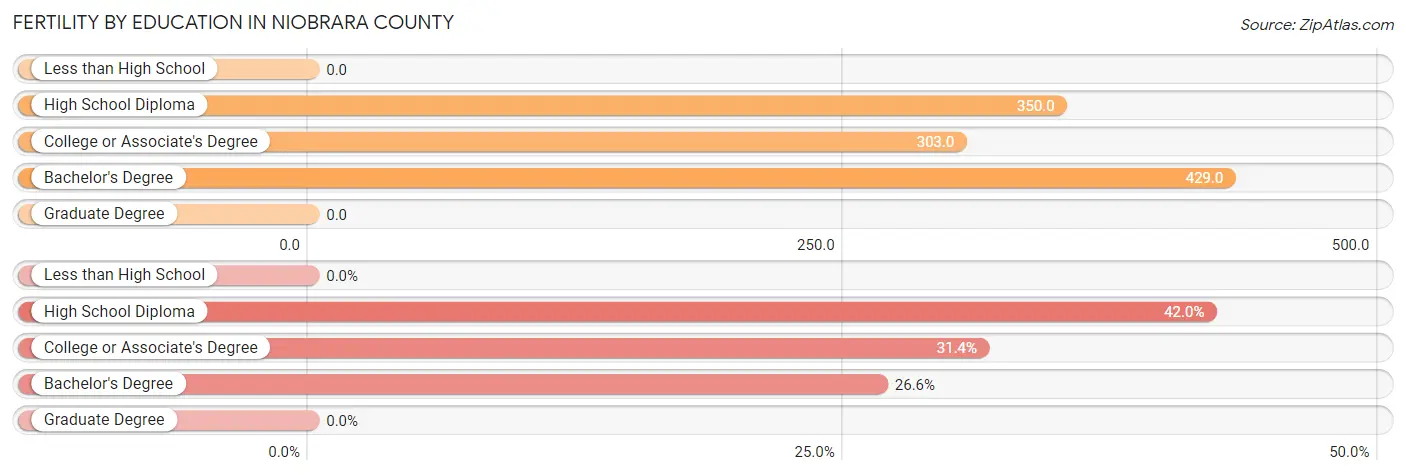
| Educational Attainment | Women with Births | Births / 1,000 Women |
| Less than High School | 0 (0.0%) | 0.0 |
| High School Diploma | 71 (42.0%) | 350.0 |
| College or Associate's Degree | 53 (31.4%) | 303.0 |
| Bachelor's Degree | 45 (26.6%) | 429.0 |
| Graduate Degree | 0 (0.0%) | 0.0 |
| Total | 169 (100.0%) | 283.0 |
Fertility by Education by Marriage Status in Niobrara County
42.0% of women with births in Niobrara County are unmarried. Women with the educational attainment of college or associate's degree are most likely to be married with 100.0% of them married at childbirth, while women with the educational attainment of high school diploma are least likely to be married with 100.0% of them unmarried at childbirth.
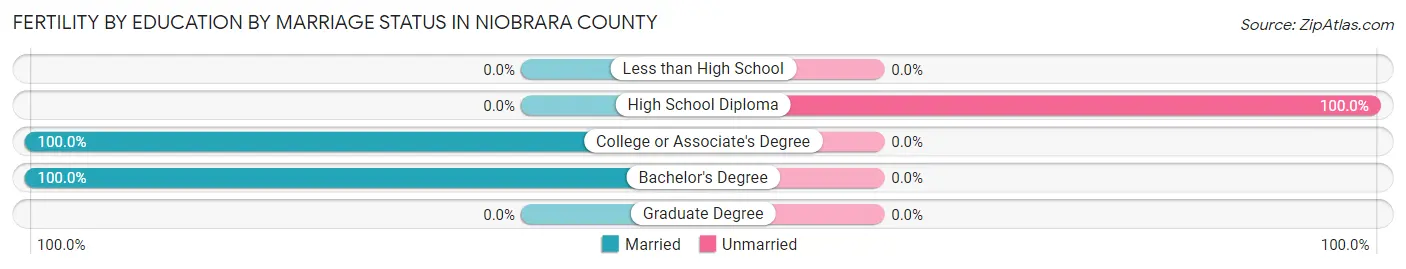
| Educational Attainment | Married | Unmarried |
| Less than High School | 0 (0.0%) | 0 (0.0%) |
| High School Diploma | 0 (0.0%) | 71 (100.0%) |
| College or Associate's Degree | 53 (100.0%) | 0 (0.0%) |
| Bachelor's Degree | 45 (100.0%) | 0 (0.0%) |
| Graduate Degree | 0 (0.0%) | 0 (0.0%) |
| Total | 98 (58.0%) | 71 (42.0%) |
Income in Niobrara County
Income Overview in Niobrara County
Per Capita Income in Niobrara County is $29,442, while median incomes of families and households are $62,434 and $54,375 respectively.
| Characteristic | Number | Measure |
| Per Capita Income | 2,460 | $29,442 |
| Median Family Income | 603 | $62,434 |
| Mean Family Income | 603 | $77,916 |
| Median Household Income | 1,072 | $54,375 |
| Mean Household Income | 1,072 | $67,412 |
| Income Deficit | 603 | $0 |
| Wage / Income Gap (%) | 2,460 | 48.82% |
| Wage / Income Gap ($) | 2,460 | 51.18¢ per $1 |
| Gini / Inequality Index | 2,460 | 0.44 |
Earnings by Sex in Niobrara County
Average Earnings in Niobrara County are $30,718, $46,500 for men and $23,800 for women, a difference of 48.8%.
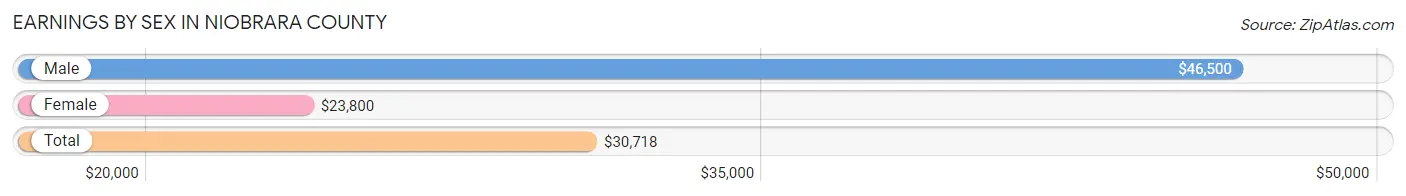
| Sex | Number | Average Earnings |
| Male | 628 (46.5%) | $46,500 |
| Female | 722 (53.5%) | $23,800 |
| Total | 1,350 (100.0%) | $30,718 |
Earnings by Sex by Income Bracket in Niobrara County
The most common earnings brackets in Niobrara County are $55,000 to $64,999 for men (88 | 14.0%) and $22,500 to $24,999 for women (75 | 10.4%).
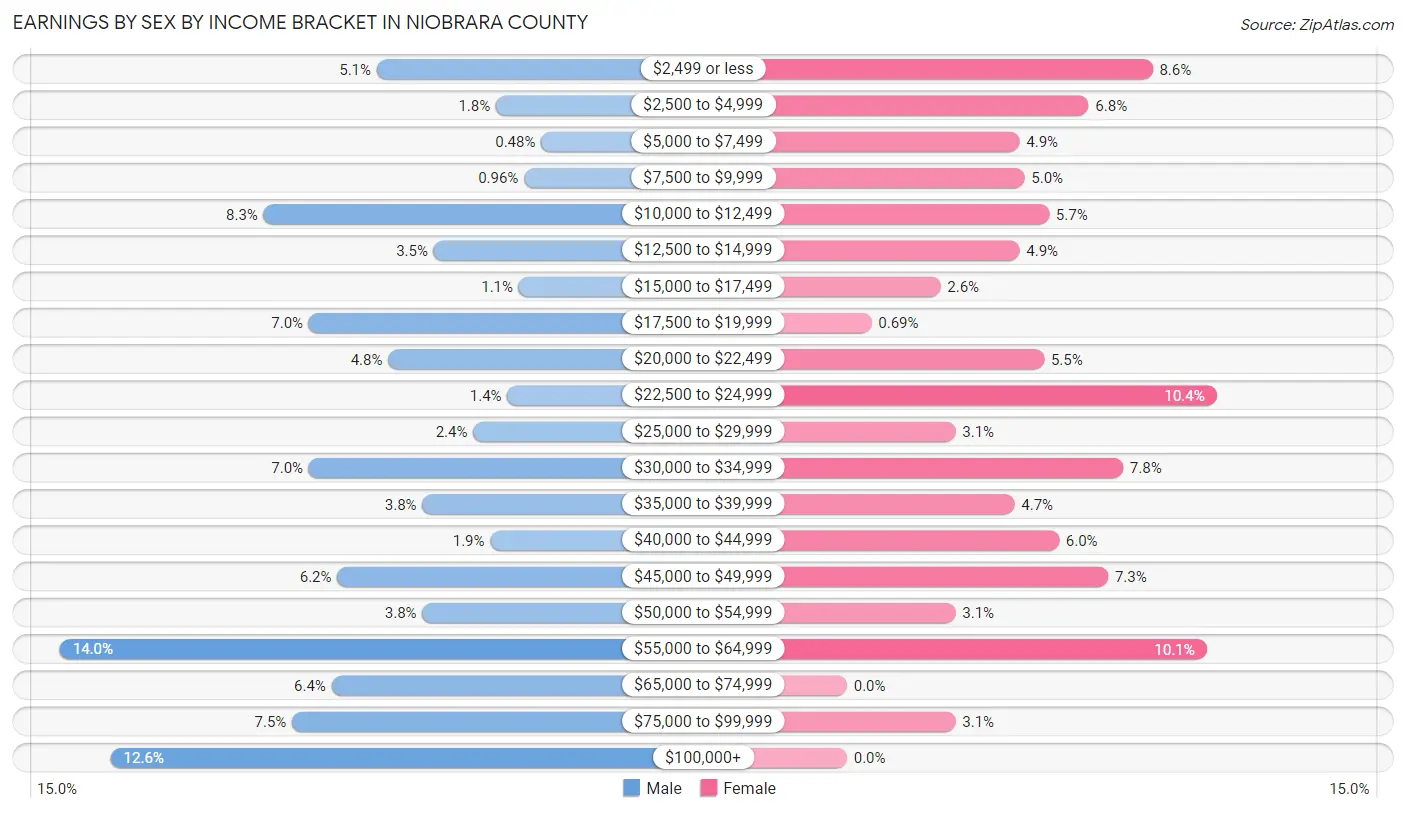
| Income | Male | Female |
| $2,499 or less | 32 (5.1%) | 62 (8.6%) |
| $2,500 to $4,999 | 11 (1.8%) | 49 (6.8%) |
| $5,000 to $7,499 | 3 (0.5%) | 35 (4.9%) |
| $7,500 to $9,999 | 6 (1.0%) | 36 (5.0%) |
| $10,000 to $12,499 | 52 (8.3%) | 41 (5.7%) |
| $12,500 to $14,999 | 22 (3.5%) | 35 (4.9%) |
| $15,000 to $17,499 | 7 (1.1%) | 19 (2.6%) |
| $17,500 to $19,999 | 44 (7.0%) | 5 (0.7%) |
| $20,000 to $22,499 | 30 (4.8%) | 40 (5.5%) |
| $22,500 to $24,999 | 9 (1.4%) | 75 (10.4%) |
| $25,000 to $29,999 | 15 (2.4%) | 22 (3.0%) |
| $30,000 to $34,999 | 44 (7.0%) | 56 (7.8%) |
| $35,000 to $39,999 | 24 (3.8%) | 34 (4.7%) |
| $40,000 to $44,999 | 12 (1.9%) | 43 (6.0%) |
| $45,000 to $49,999 | 39 (6.2%) | 53 (7.3%) |
| $50,000 to $54,999 | 24 (3.8%) | 22 (3.0%) |
| $55,000 to $64,999 | 88 (14.0%) | 73 (10.1%) |
| $65,000 to $74,999 | 40 (6.4%) | 0 (0.0%) |
| $75,000 to $99,999 | 47 (7.5%) | 22 (3.0%) |
| $100,000+ | 79 (12.6%) | 0 (0.0%) |
| Total | 628 (100.0%) | 722 (100.0%) |
Earnings by Sex by Educational Attainment in Niobrara County
Average earnings in Niobrara County are $49,191 for men and $29,583 for women, a difference of 39.9%. Men with an educational attainment of bachelor's degree enjoy the highest average annual earnings of $61,316, while those with less than high school education earn the least with $19,239. Women with an educational attainment of bachelor's degree earn the most with the average annual earnings of $56,154, while those with less than high school education have the smallest earnings of $9,310.
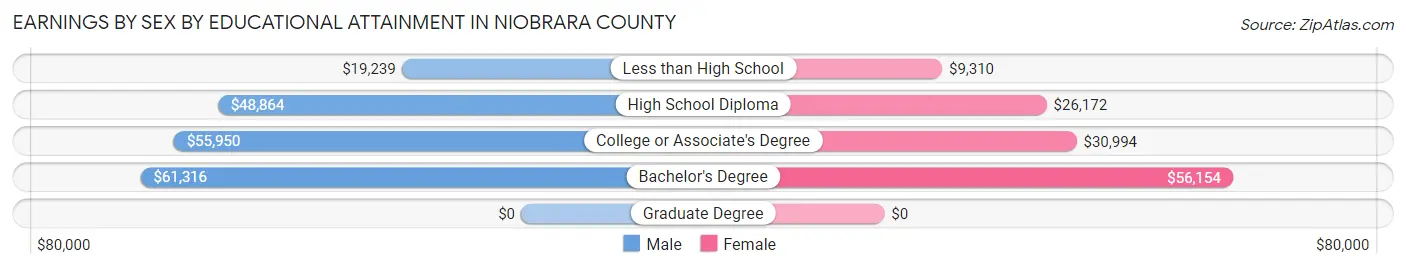
| Educational Attainment | Male Income | Female Income |
| Less than High School | $19,239 | $9,310 |
| High School Diploma | $48,864 | $26,172 |
| College or Associate's Degree | $55,950 | $30,994 |
| Bachelor's Degree | $61,316 | $56,154 |
| Graduate Degree | - | - |
| Total | $49,191 | $29,583 |
Family Income in Niobrara County
Family Income Brackets in Niobrara County
According to the Niobrara County family income data, there are 144 families falling into the $100,000 to $149,999 income range, which is the most common income bracket and makes up 23.9% of all families. Conversely, the $15,000 to $24,999 income bracket is the least frequent group with only 11 families (1.8%) belonging to this category.
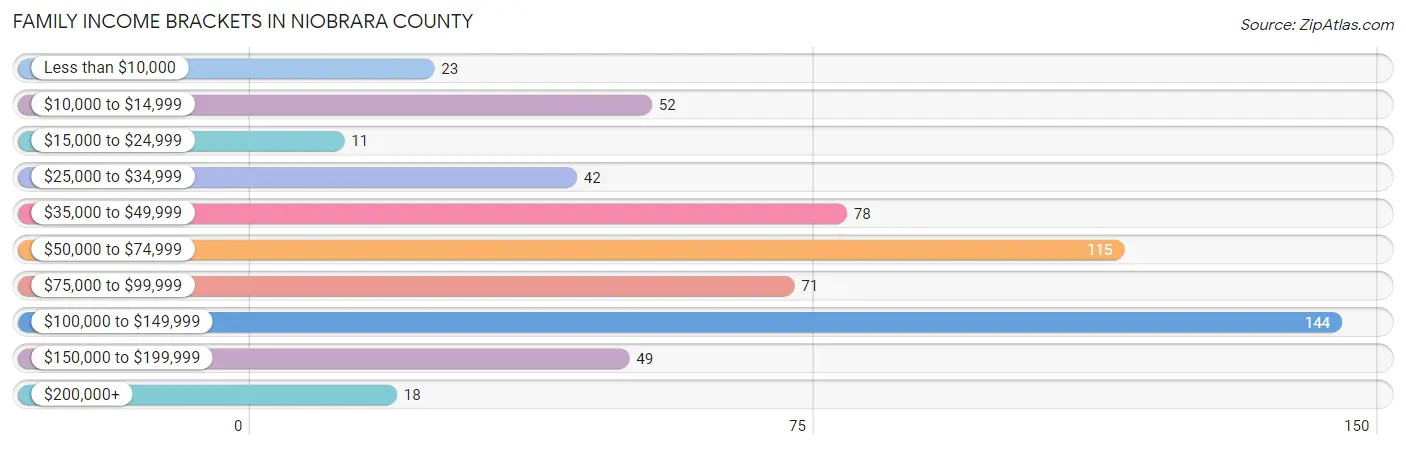
| Income Bracket | # Families | % Families |
| Less than $10,000 | 23 | 3.8% |
| $10,000 to $14,999 | 52 | 8.6% |
| $15,000 to $24,999 | 11 | 1.8% |
| $25,000 to $34,999 | 42 | 7.0% |
| $35,000 to $49,999 | 78 | 12.9% |
| $50,000 to $74,999 | 115 | 19.1% |
| $75,000 to $99,999 | 71 | 11.8% |
| $100,000 to $149,999 | 144 | 23.9% |
| $150,000 to $199,999 | 49 | 8.1% |
| $200,000+ | 18 | 3.0% |
Family Income by Famaliy Size in Niobrara County
3-person families (74 | 12.3%) account for the highest median family income in Niobrara County with $126,000 per family, while 3-person families (74 | 12.3%) have the highest median income of $42,000 per family member.
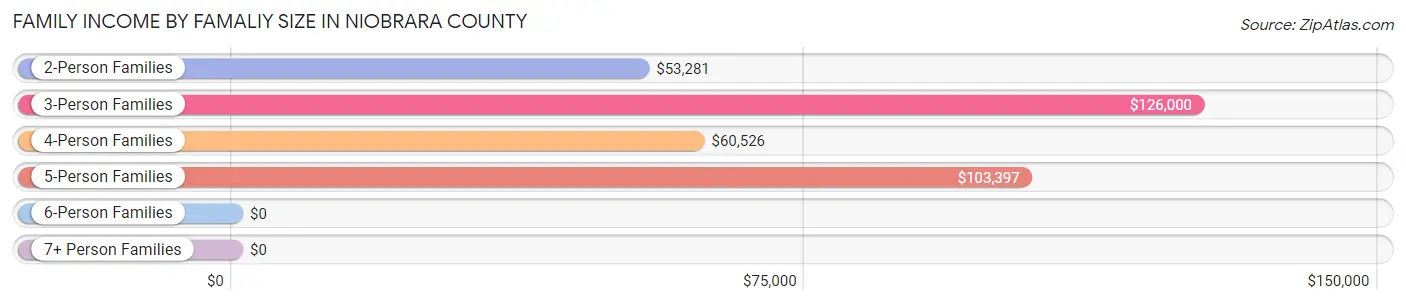
| Income Bracket | # Families | Median Income |
| 2-Person Families | 343 (56.9%) | $53,281 |
| 3-Person Families | 74 (12.3%) | $126,000 |
| 4-Person Families | 104 (17.2%) | $60,526 |
| 5-Person Families | 59 (9.8%) | $103,397 |
| 6-Person Families | 23 (3.8%) | $0 |
| 7+ Person Families | 0 (0.0%) | $0 |
| Total | 603 (100.0%) | $62,434 |
Family Income by Number of Earners in Niobrara County
The median family income in Niobrara County is $62,434, with families comprising 3+ earners (26) having the highest median family income of $113,542, while families with no earners (111) have the lowest median family income of $37,750, accounting for 4.3% and 18.4% of families, respectively.
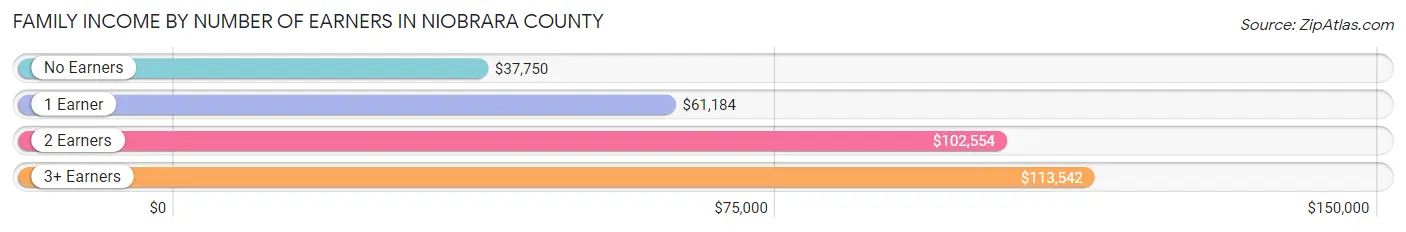
| Number of Earners | # Families | Median Income |
| No Earners | 111 (18.4%) | $37,750 |
| 1 Earner | 224 (37.1%) | $61,184 |
| 2 Earners | 242 (40.1%) | $102,554 |
| 3+ Earners | 26 (4.3%) | $113,542 |
| Total | 603 (100.0%) | $62,434 |
Household Income in Niobrara County
Household Income Brackets in Niobrara County
With 187 households falling in the category, the $50,000 to $74,999 income range is the most frequent in Niobrara County, accounting for 17.4% of all households. In contrast, only 36 households (3.4%) fall into the $200,000+ income bracket, making it the least populous group.
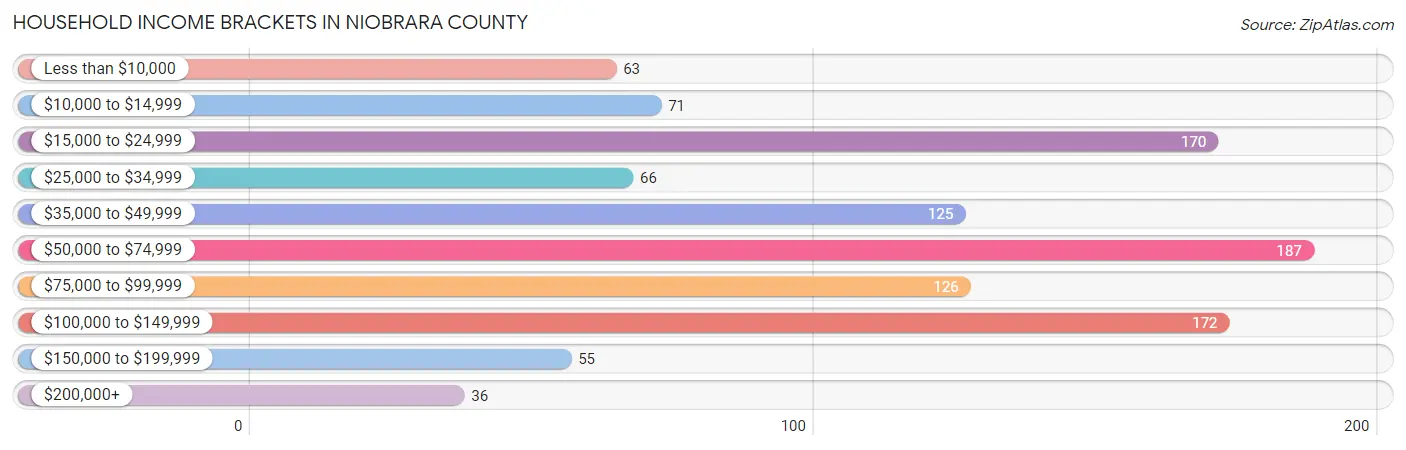
| Income Bracket | # Households | % Households |
| Less than $10,000 | 63 | 5.9% |
| $10,000 to $14,999 | 71 | 6.6% |
| $15,000 to $24,999 | 170 | 15.9% |
| $25,000 to $34,999 | 66 | 6.2% |
| $35,000 to $49,999 | 125 | 11.7% |
| $50,000 to $74,999 | 187 | 17.4% |
| $75,000 to $99,999 | 126 | 11.8% |
| $100,000 to $149,999 | 172 | 16.0% |
| $150,000 to $199,999 | 55 | 5.1% |
| $200,000+ | 36 | 3.4% |
Household Income by Householder Age in Niobrara County
The median household income in Niobrara County is $54,375, with the highest median household income of $97,917 found in the 25 to 44 years age bracket for the primary householder. A total of 265 households (24.7%) fall into this category. Meanwhile, the 15 to 24 years age bracket for the primary householder has the lowest median household income of $0, with 67 households (6.2%) in this group.
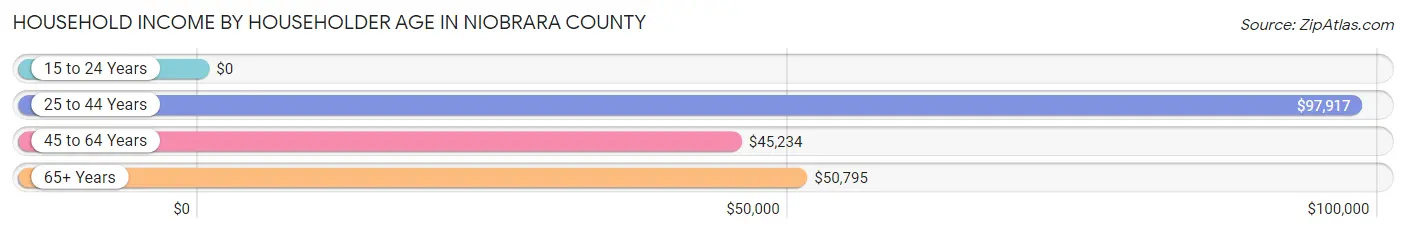
| Income Bracket | # Households | Median Income |
| 15 to 24 Years | 67 (6.2%) | $0 |
| 25 to 44 Years | 265 (24.7%) | $97,917 |
| 45 to 64 Years | 339 (31.6%) | $45,234 |
| 65+ Years | 401 (37.4%) | $50,795 |
| Total | 1,072 (100.0%) | $54,375 |
Poverty in Niobrara County
Income Below Poverty by Sex and Age in Niobrara County
With 15.7% poverty level for males and 20.7% for females among the residents of Niobrara County, 12 to 14 year old males and 16 and 17 year old females are the most vulnerable to poverty, with 27 males (55.1%) and 32 females (100.0%) in their respective age groups living below the poverty level.
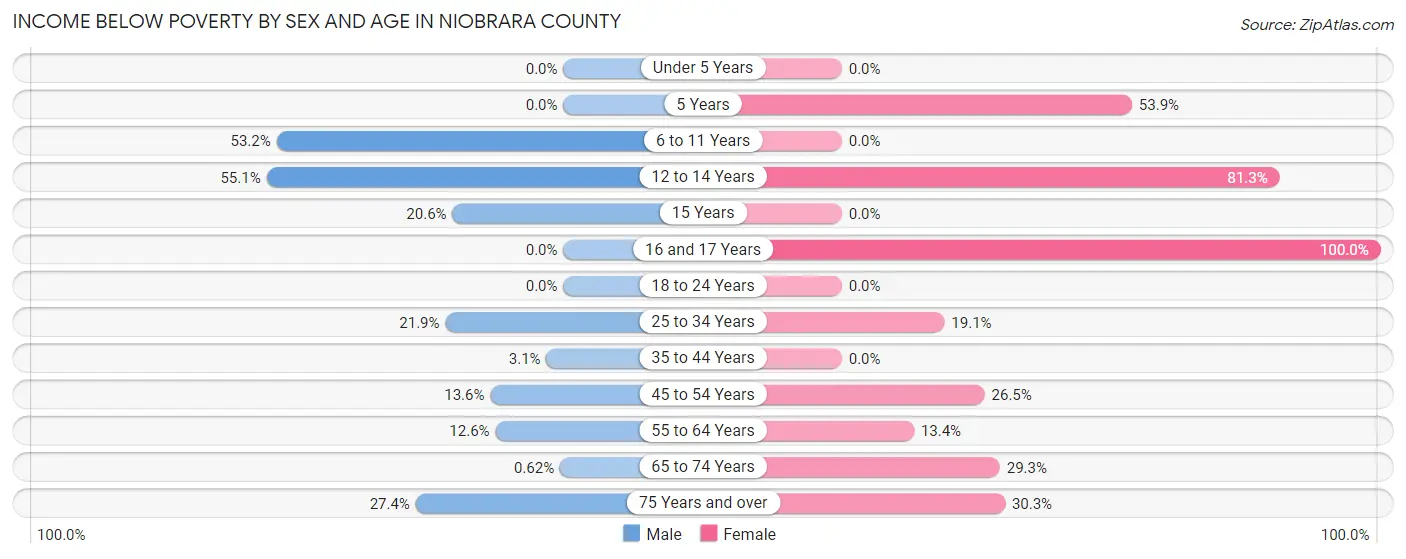
| Age Bracket | Male | Female |
| Under 5 Years | 0 (0.0%) | 0 (0.0%) |
| 5 Years | 0 (0.0%) | 14 (53.8%) |
| 6 to 11 Years | 33 (53.2%) | 0 (0.0%) |
| 12 to 14 Years | 27 (55.1%) | 26 (81.2%) |
| 15 Years | 7 (20.6%) | 0 (0.0%) |
| 16 and 17 Years | 0 (0.0%) | 32 (100.0%) |
| 18 to 24 Years | 0 (0.0%) | 0 (0.0%) |
| 25 to 34 Years | 23 (21.9%) | 32 (19.1%) |
| 35 to 44 Years | 5 (3.1%) | 0 (0.0%) |
| 45 to 54 Years | 16 (13.6%) | 22 (26.5%) |
| 55 to 64 Years | 15 (12.6%) | 32 (13.4%) |
| 65 to 74 Years | 1 (0.6%) | 44 (29.3%) |
| 75 Years and over | 37 (27.4%) | 43 (30.3%) |
| Total | 164 (15.7%) | 245 (20.7%) |
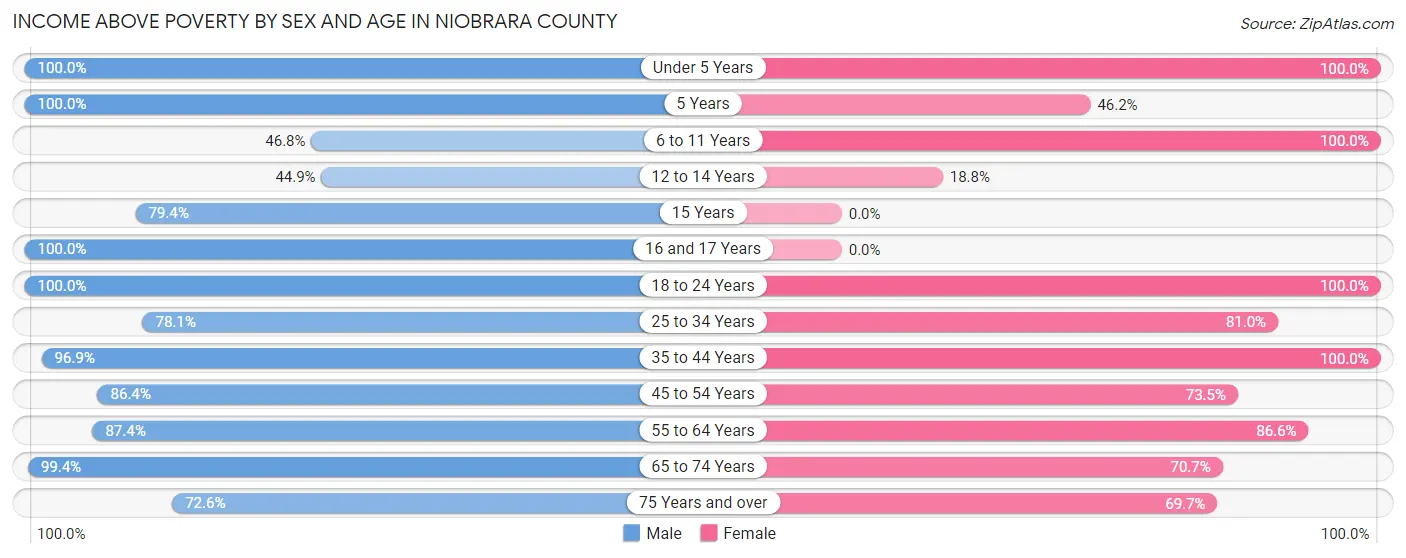
Income Above Poverty by Sex and Age in Niobrara County
According to the poverty statistics in Niobrara County, males aged under 5 years and females aged under 5 years are the age groups that are most secure financially, with 100.0% of males and 100.0% of females in these age groups living above the poverty line.
| Age Bracket | Male | Female |
| Under 5 Years | 30 (100.0%) | 55 (100.0%) |
| 5 Years | 3 (100.0%) | 12 (46.2%) |
| 6 to 11 Years | 29 (46.8%) | 83 (100.0%) |
| 12 to 14 Years | 22 (44.9%) | 6 (18.8%) |
| 15 Years | 27 (79.4%) | 0 (0.0%) |
| 16 and 17 Years | 40 (100.0%) | 0 (0.0%) |
| 18 to 24 Years | 33 (100.0%) | 87 (100.0%) |
| 25 to 34 Years | 82 (78.1%) | 136 (80.9%) |
| 35 to 44 Years | 154 (96.9%) | 85 (100.0%) |
| 45 to 54 Years | 102 (86.4%) | 61 (73.5%) |
| 55 to 64 Years | 104 (87.4%) | 207 (86.6%) |
| 65 to 74 Years | 160 (99.4%) | 106 (70.7%) |
| 75 Years and over | 98 (72.6%) | 99 (69.7%) |
| Total | 884 (84.4%) | 937 (79.3%) |
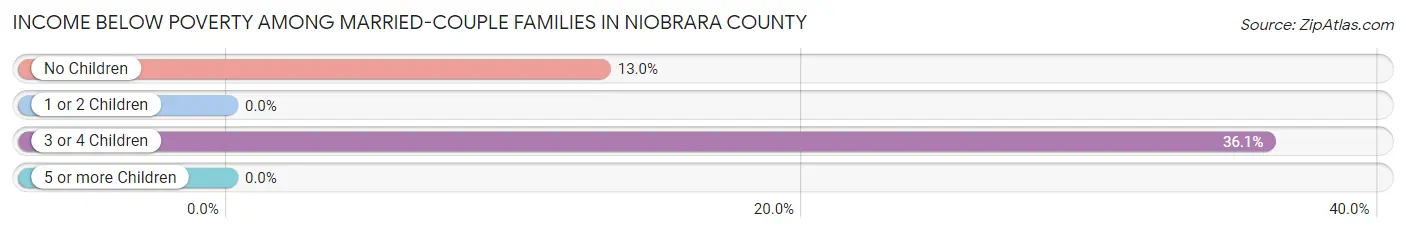
Income Below Poverty Among Married-Couple Families in Niobrara County
The poverty statistics for married-couple families in Niobrara County show that 12.8% or 63 of the total 492 families live below the poverty line. Families with 3 or 4 children have the highest poverty rate of 36.1%, comprising of 26 families. On the other hand, families with 1 or 2 children have the lowest poverty rate of 0.0%, which includes 0 families.
| Children | Above Poverty | Below Poverty |
| No Children | 248 (87.0%) | 37 (13.0%) |
| 1 or 2 Children | 135 (100.0%) | 0 (0.0%) |
| 3 or 4 Children | 46 (63.9%) | 26 (36.1%) |
| 5 or more Children | 0 (0.0%) | 0 (0.0%) |
| Total | 429 (87.2%) | 63 (12.8%) |
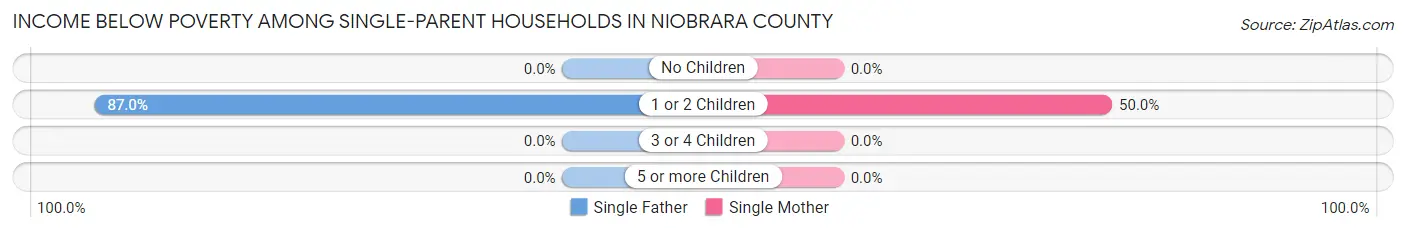
Income Below Poverty Among Single-Parent Households in Niobrara County
According to the poverty data in Niobrara County, 58.8% or 20 single-father households and 28.6% or 22 single-mother households are living below the poverty line. Among single-father households, those with 1 or 2 children have the highest poverty rate, with 20 households (87.0%) experiencing poverty. Likewise, among single-mother households, those with 1 or 2 children have the highest poverty rate, with 22 households (50.0%) falling below the poverty line.
| Children | Single Father | Single Mother |
| No Children | 0 (0.0%) | 0 (0.0%) |
| 1 or 2 Children | 20 (87.0%) | 22 (50.0%) |
| 3 or 4 Children | 0 (0.0%) | 0 (0.0%) |
| 5 or more Children | 0 (0.0%) | 0 (0.0%) |
| Total | 20 (58.8%) | 22 (28.6%) |
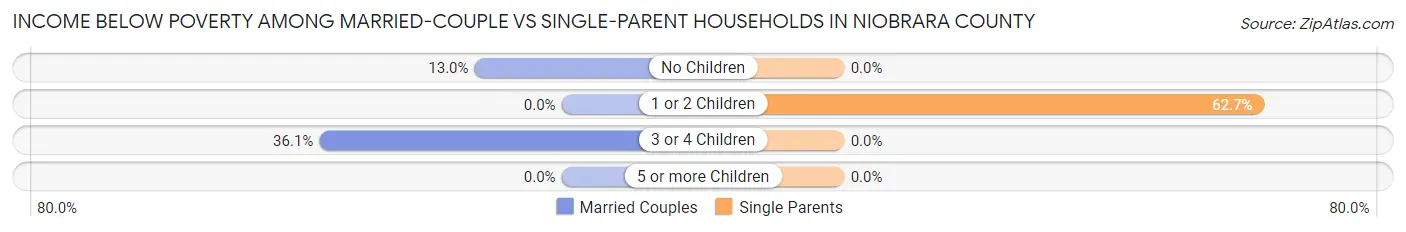
Income Below Poverty Among Married-Couple vs Single-Parent Households in Niobrara County
The poverty data for Niobrara County shows that 63 of the married-couple family households (12.8%) and 42 of the single-parent households (37.8%) are living below the poverty level. Within the married-couple family households, those with 3 or 4 children have the highest poverty rate, with 26 households (36.1%) falling below the poverty line. Among the single-parent households, those with 1 or 2 children have the highest poverty rate, with 42 household (62.7%) living below poverty.
| Children | Married-Couple Families | Single-Parent Households |
| No Children | 37 (13.0%) | 0 (0.0%) |
| 1 or 2 Children | 0 (0.0%) | 42 (62.7%) |
| 3 or 4 Children | 26 (36.1%) | 0 (0.0%) |
| 5 or more Children | 0 (0.0%) | 0 (0.0%) |
| Total | 63 (12.8%) | 42 (37.8%) |
Employment Characteristics in Niobrara County
Employment by Class of Employer in Niobrara County
Among the 1,083 employed individuals in Niobrara County, private company employees (468 | 43.2%), self-employed (not incorporated) (195 | 18.0%), and local government employees (173 | 16.0%) make up the most common classes of employment.
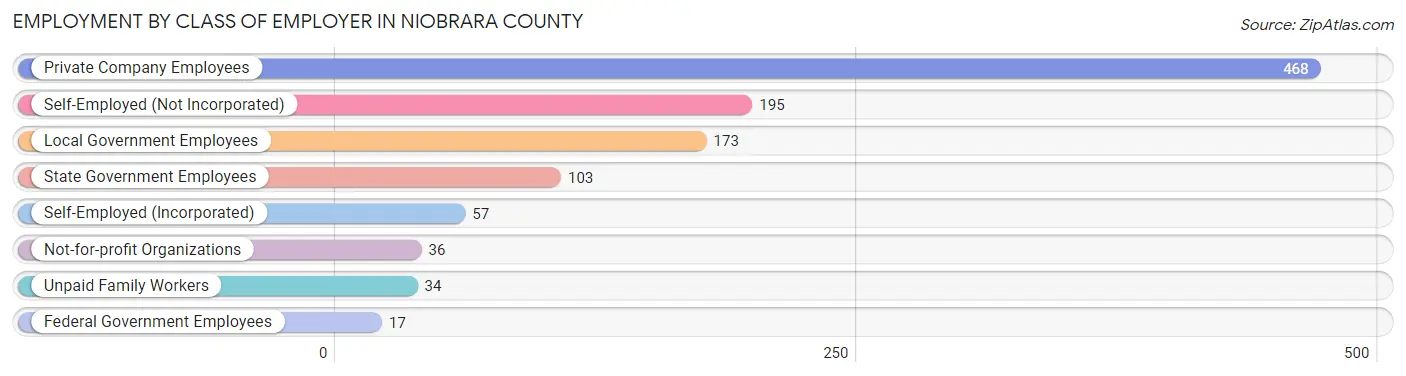
| Employer Class | # Employees | % Employees |
| Private Company Employees | 468 | 43.2% |
| Self-Employed (Incorporated) | 57 | 5.3% |
| Self-Employed (Not Incorporated) | 195 | 18.0% |
| Not-for-profit Organizations | 36 | 3.3% |
| Local Government Employees | 173 | 16.0% |
| State Government Employees | 103 | 9.5% |
| Federal Government Employees | 17 | 1.6% |
| Unpaid Family Workers | 34 | 3.1% |
| Total | 1,083 | 100.0% |
Employment Status by Age in Niobrara County
According to the labor force statistics for Niobrara County, out of the total population over 16 years of age (2,086), 55.9% or 1,166 individuals are in the labor force, with 5.3% or 62 of them unemployed. The age group with the highest labor force participation rate is 45 to 54 years, with 87.0% or 201 individuals in the labor force. Within the labor force, the 55 to 59 years age range has the highest percentage of unemployed individuals, with 18.6% or 11 of them being unemployed.
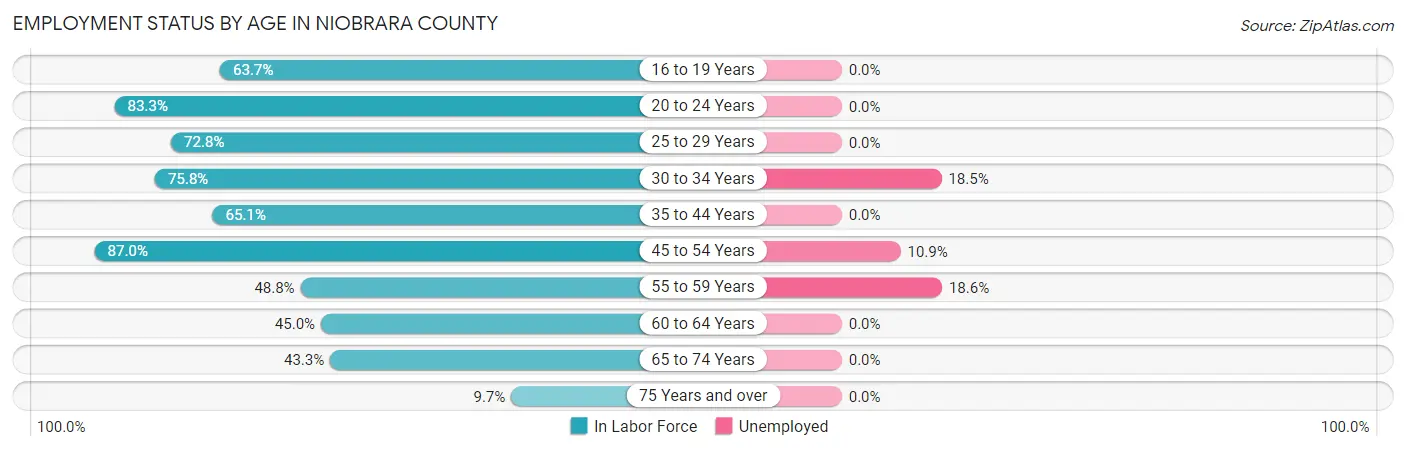
| Age Bracket | In Labor Force | Unemployed |
| 16 to 19 Years | 65 (63.7%) | 0 (0.0%) |
| 20 to 24 Years | 85 (83.3%) | 0 (0.0%) |
| 25 to 29 Years | 107 (72.8%) | 0 (0.0%) |
| 30 to 34 Years | 157 (75.8%) | 29 (18.5%) |
| 35 to 44 Years | 216 (65.1%) | 0 (0.0%) |
| 45 to 54 Years | 201 (87.0%) | 22 (10.9%) |
| 55 to 59 Years | 59 (48.8%) | 11 (18.6%) |
| 60 to 64 Years | 113 (45.0%) | 0 (0.0%) |
| 65 to 74 Years | 136 (43.3%) | 0 (0.0%) |
| 75 Years and over | 27 (9.7%) | 0 (0.0%) |
| Total | 1,166 (55.9%) | 62 (5.3%) |
Employment Status by Educational Attainment in Niobrara County
According to labor force statistics for Niobrara County, 66.2% of individuals (853) out of the total population between 25 and 64 years of age (1,289) are in the labor force, with 7.3% or 62 of them being unemployed. The group with the highest labor force participation rate are those with the educational attainment of bachelor's degree or higher, with 78.6% or 180 individuals in the labor force. Within the labor force, individuals with less than high school education have the highest percentage of unemployment, with 50.0% or 29 of them being unemployed.
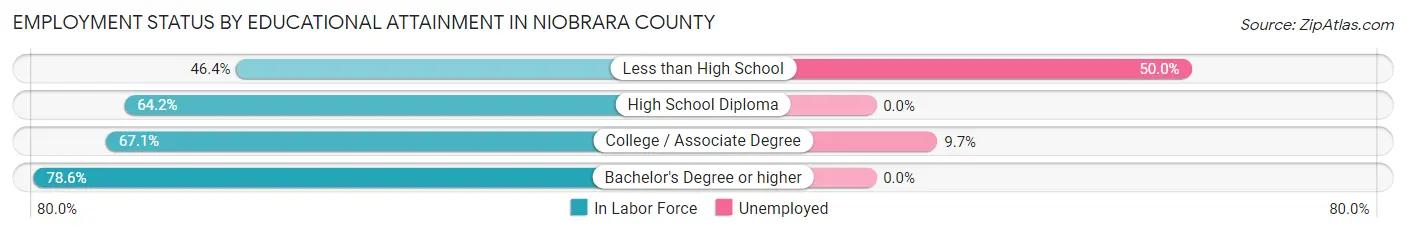
| Educational Attainment | In Labor Force | Unemployed |
| Less than High School | 58 (46.4%) | 62 (50.0%) |
| High School Diploma | 276 (64.2%) | 0 (0.0%) |
| College / Associate Degree | 339 (67.1%) | 49 (9.7%) |
| Bachelor's Degree or higher | 180 (78.6%) | 0 (0.0%) |
| Total | 853 (66.2%) | 94 (7.3%) |
Employment Occupations by Sex in Niobrara County
Management, Business, Science and Arts Occupations
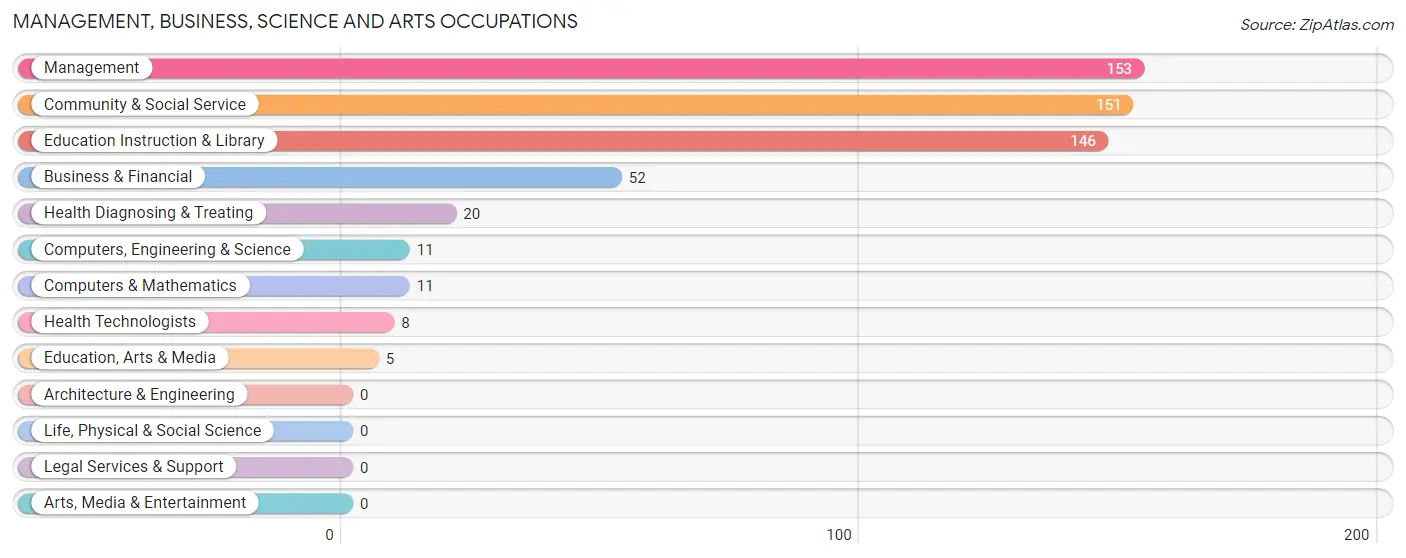
The most common Management, Business, Science and Arts occupations in Niobrara County are Management (153 | 13.9%), Community & Social Service (151 | 13.7%), Education Instruction & Library (146 | 13.2%), Business & Financial (52 | 4.7%), and Health Diagnosing & Treating (20 | 1.8%).
Management, Business, Science and Arts Occupations by Sex
Within the Management, Business, Science and Arts occupations in Niobrara County, the most male-oriented occupations are Computers, Engineering & Science (100.0%), Computers & Mathematics (100.0%), and Education, Arts & Media (100.0%), while the most female-oriented occupations are Health Diagnosing & Treating (80.0%), Business & Financial (73.1%), and Management (51.6%).
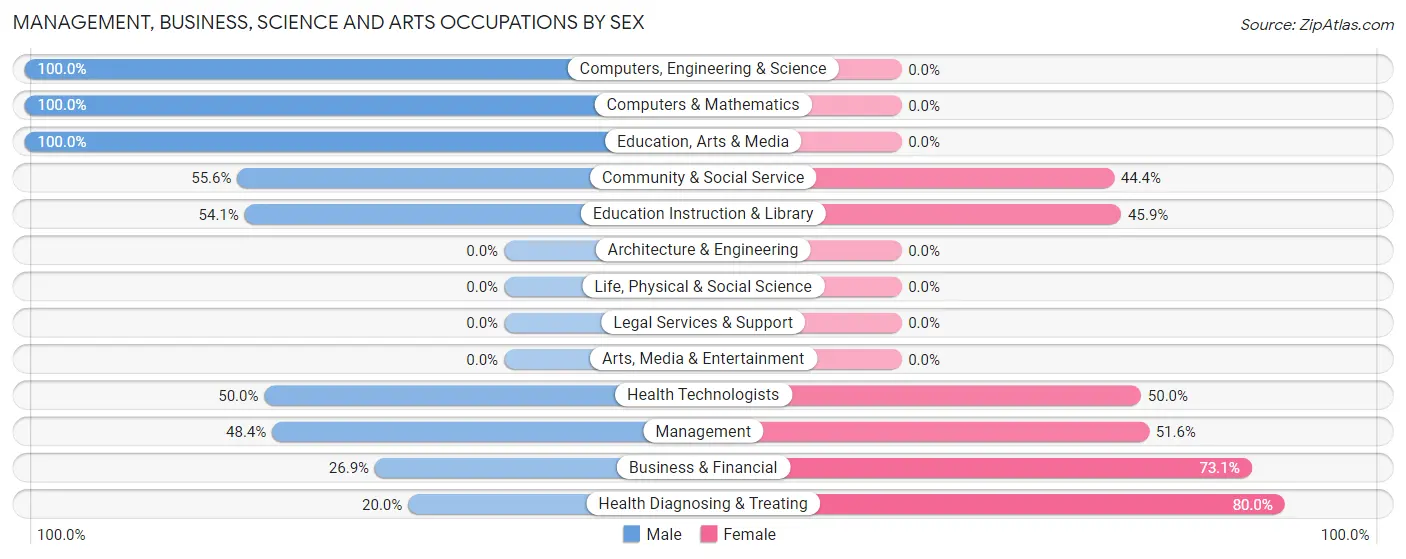
| Occupation | Male | Female |
| Management | 74 (48.4%) | 79 (51.6%) |
| Business & Financial | 14 (26.9%) | 38 (73.1%) |
| Computers, Engineering & Science | 11 (100.0%) | 0 (0.0%) |
| Computers & Mathematics | 11 (100.0%) | 0 (0.0%) |
| Architecture & Engineering | 0 (0.0%) | 0 (0.0%) |
| Life, Physical & Social Science | 0 (0.0%) | 0 (0.0%) |
| Community & Social Service | 84 (55.6%) | 67 (44.4%) |
| Education, Arts & Media | 5 (100.0%) | 0 (0.0%) |
| Legal Services & Support | 0 (0.0%) | 0 (0.0%) |
| Education Instruction & Library | 79 (54.1%) | 67 (45.9%) |
| Arts, Media & Entertainment | 0 (0.0%) | 0 (0.0%) |
| Health Diagnosing & Treating | 4 (20.0%) | 16 (80.0%) |
| Health Technologists | 4 (50.0%) | 4 (50.0%) |
| Total (Category) | 187 (48.3%) | 200 (51.7%) |
| Total (Overall) | 588 (53.3%) | 516 (46.7%) |
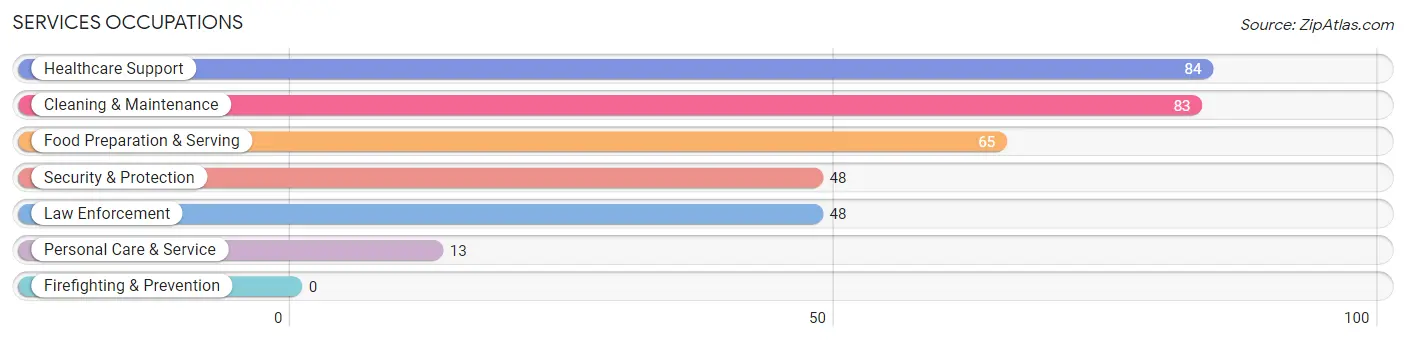
Services Occupations
The most common Services occupations in Niobrara County are Healthcare Support (84 | 7.6%), Cleaning & Maintenance (83 | 7.5%), Food Preparation & Serving (65 | 5.9%), Security & Protection (48 | 4.3%), and Law Enforcement (48 | 4.3%).
Services Occupations by Sex
Within the Services occupations in Niobrara County, the most male-oriented occupations are Cleaning & Maintenance (80.7%), Personal Care & Service (53.8%), and Security & Protection (52.1%), while the most female-oriented occupations are Healthcare Support (100.0%), Food Preparation & Serving (75.4%), and Security & Protection (47.9%).
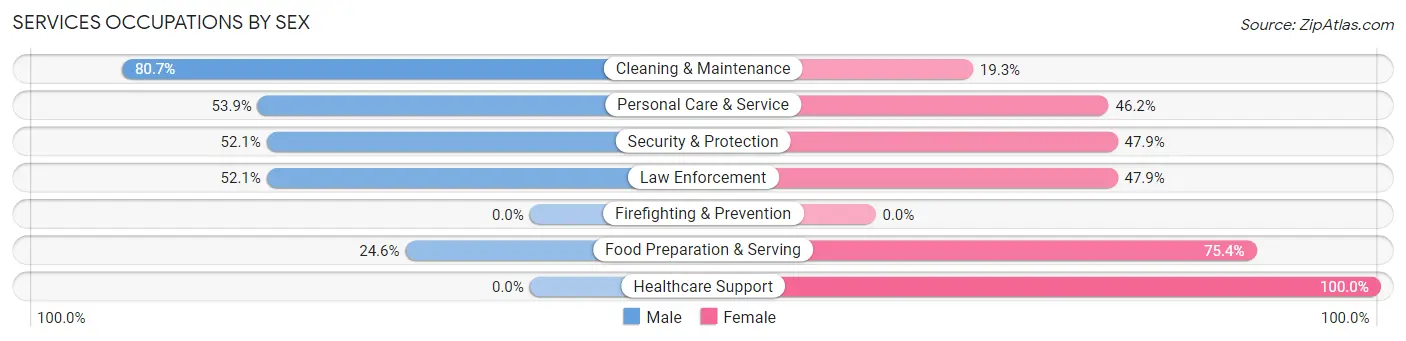
| Occupation | Male | Female |
| Healthcare Support | 0 (0.0%) | 84 (100.0%) |
| Security & Protection | 25 (52.1%) | 23 (47.9%) |
| Firefighting & Prevention | 0 (0.0%) | 0 (0.0%) |
| Law Enforcement | 25 (52.1%) | 23 (47.9%) |
| Food Preparation & Serving | 16 (24.6%) | 49 (75.4%) |
| Cleaning & Maintenance | 67 (80.7%) | 16 (19.3%) |
| Personal Care & Service | 7 (53.8%) | 6 (46.2%) |
| Total (Category) | 115 (39.3%) | 178 (60.8%) |
| Total (Overall) | 588 (53.3%) | 516 (46.7%) |
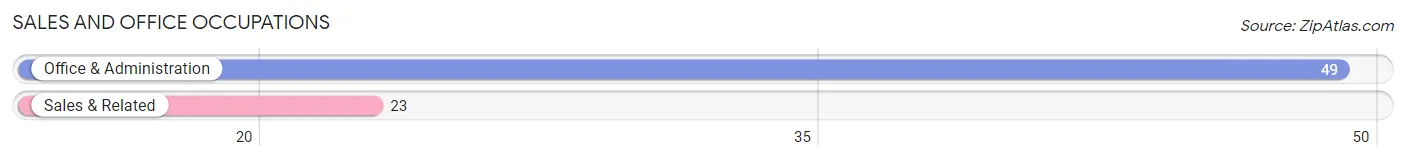
Sales and Office Occupations
The most common Sales and Office occupations in Niobrara County are Office & Administration (49 | 4.4%), and Sales & Related (23 | 2.1%).
Sales and Office Occupations by Sex
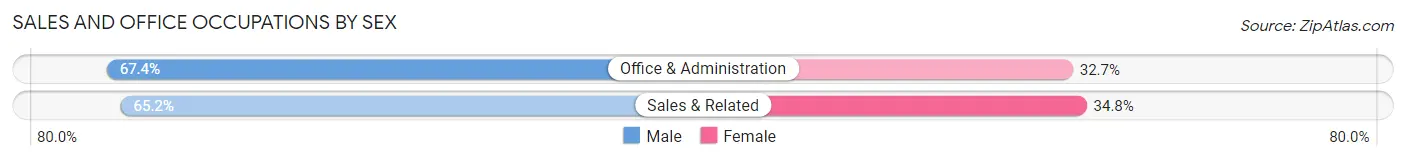
| Occupation | Male | Female |
| Sales & Related | 15 (65.2%) | 8 (34.8%) |
| Office & Administration | 33 (67.3%) | 16 (32.7%) |
| Total (Category) | 48 (66.7%) | 24 (33.3%) |
| Total (Overall) | 588 (53.3%) | 516 (46.7%) |
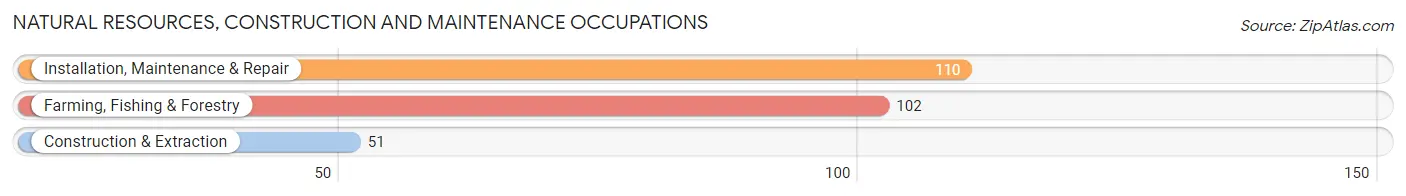
Natural Resources, Construction and Maintenance Occupations
The most common Natural Resources, Construction and Maintenance occupations in Niobrara County are Installation, Maintenance & Repair (110 | 10.0%), Farming, Fishing & Forestry (102 | 9.2%), and Construction & Extraction (51 | 4.6%).
Natural Resources, Construction and Maintenance Occupations by Sex
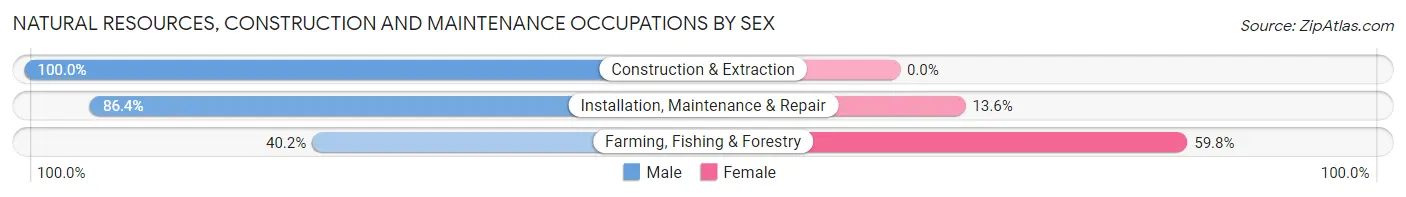
| Occupation | Male | Female |
| Farming, Fishing & Forestry | 41 (40.2%) | 61 (59.8%) |
| Construction & Extraction | 51 (100.0%) | 0 (0.0%) |
| Installation, Maintenance & Repair | 95 (86.4%) | 15 (13.6%) |
| Total (Category) | 187 (71.1%) | 76 (28.9%) |
| Total (Overall) | 588 (53.3%) | 516 (46.7%) |
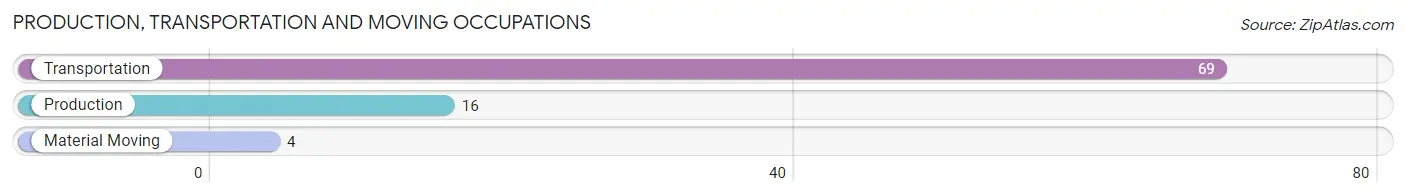
Production, Transportation and Moving Occupations
The most common Production, Transportation and Moving occupations in Niobrara County are Transportation (69 | 6.2%), Production (16 | 1.5%), and Material Moving (4 | 0.4%).
Production, Transportation and Moving Occupations by Sex
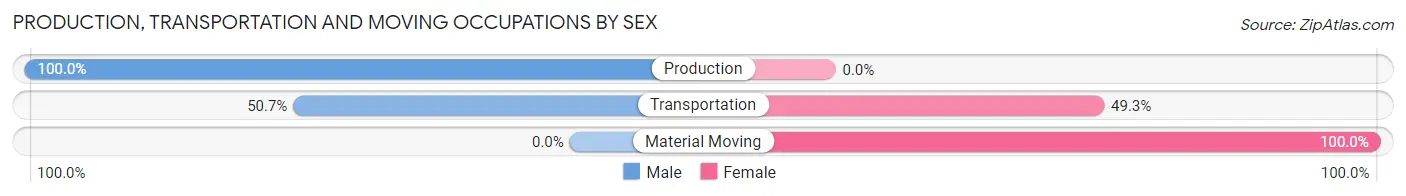
| Occupation | Male | Female |
| Production | 16 (100.0%) | 0 (0.0%) |
| Transportation | 35 (50.7%) | 34 (49.3%) |
| Material Moving | 0 (0.0%) | 4 (100.0%) |
| Total (Category) | 51 (57.3%) | 38 (42.7%) |
| Total (Overall) | 588 (53.3%) | 516 (46.7%) |
Employment Industries by Sex in Niobrara County
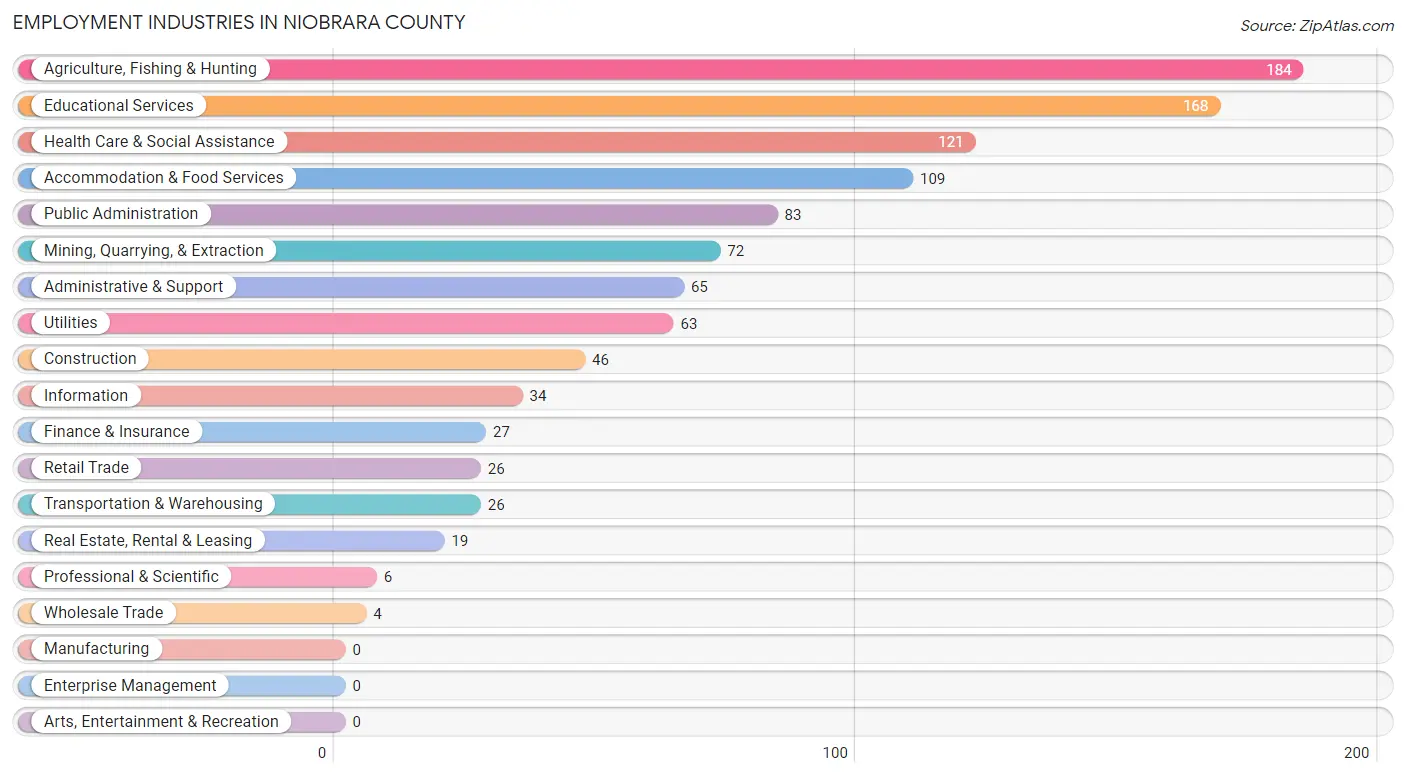
Employment Industries in Niobrara County
The major employment industries in Niobrara County include Agriculture, Fishing & Hunting (184 | 16.7%), Educational Services (168 | 15.2%), Health Care & Social Assistance (121 | 11.0%), Accommodation & Food Services (109 | 9.9%), and Public Administration (83 | 7.5%).
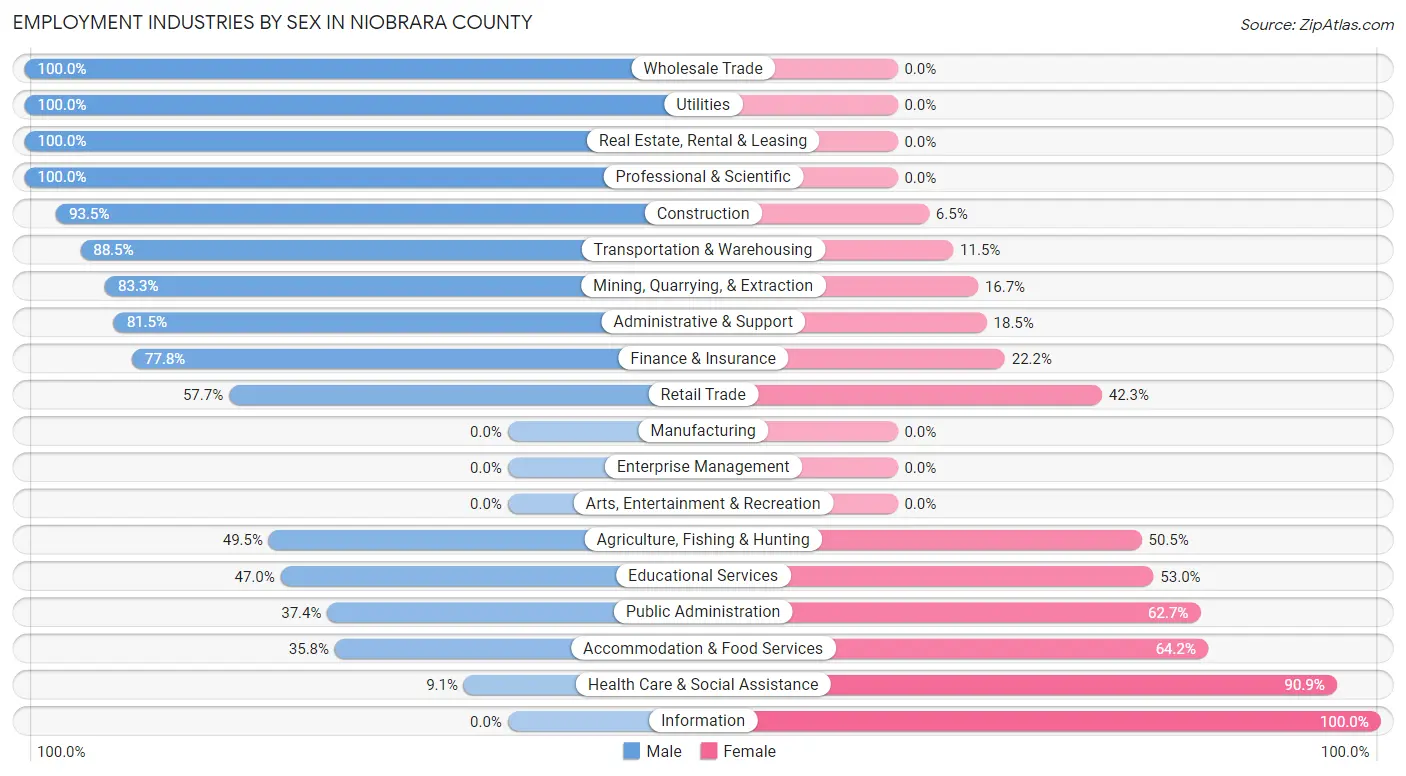
Employment Industries by Sex in Niobrara County
The Niobrara County industries that see more men than women are Wholesale Trade (100.0%), Utilities (100.0%), and Real Estate, Rental & Leasing (100.0%), whereas the industries that tend to have a higher number of women are Information (100.0%), Health Care & Social Assistance (90.9%), and Accommodation & Food Services (64.2%).
| Industry | Male | Female |
| Agriculture, Fishing & Hunting | 91 (49.5%) | 93 (50.5%) |
| Mining, Quarrying, & Extraction | 60 (83.3%) | 12 (16.7%) |
| Construction | 43 (93.5%) | 3 (6.5%) |
| Manufacturing | 0 (0.0%) | 0 (0.0%) |
| Wholesale Trade | 4 (100.0%) | 0 (0.0%) |
| Retail Trade | 15 (57.7%) | 11 (42.3%) |
| Transportation & Warehousing | 23 (88.5%) | 3 (11.5%) |
| Utilities | 63 (100.0%) | 0 (0.0%) |
| Information | 0 (0.0%) | 34 (100.0%) |
| Finance & Insurance | 21 (77.8%) | 6 (22.2%) |
| Real Estate, Rental & Leasing | 19 (100.0%) | 0 (0.0%) |
| Professional & Scientific | 6 (100.0%) | 0 (0.0%) |
| Enterprise Management | 0 (0.0%) | 0 (0.0%) |
| Administrative & Support | 53 (81.5%) | 12 (18.5%) |
| Educational Services | 79 (47.0%) | 89 (53.0%) |
| Health Care & Social Assistance | 11 (9.1%) | 110 (90.9%) |
| Arts, Entertainment & Recreation | 0 (0.0%) | 0 (0.0%) |
| Accommodation & Food Services | 39 (35.8%) | 70 (64.2%) |
| Public Administration | 31 (37.3%) | 52 (62.6%) |
| Total | 588 (53.3%) | 516 (46.7%) |
Education in Niobrara County
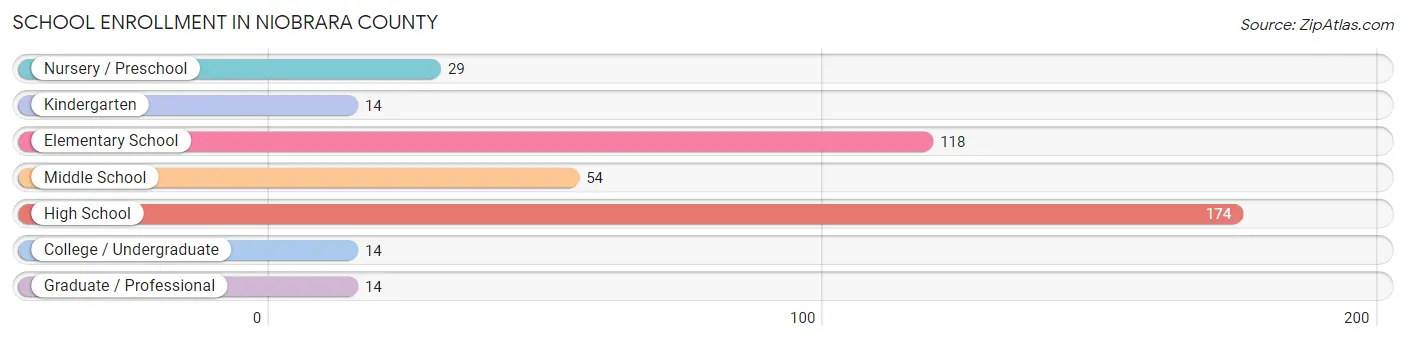
School Enrollment in Niobrara County
The most common levels of schooling among the 417 students in Niobrara County are high school (174 | 41.7%), elementary school (118 | 28.3%), and middle school (54 | 13.0%).
| School Level | # Students | % Students |
| Nursery / Preschool | 29 | 7.0% |
| Kindergarten | 14 | 3.4% |
| Elementary School | 118 | 28.3% |
| Middle School | 54 | 13.0% |
| High School | 174 | 41.7% |
| College / Undergraduate | 14 | 3.4% |
| Graduate / Professional | 14 | 3.4% |
| Total | 417 | 100.0% |
School Enrollment by Age by Funding Source in Niobrara County
Out of a total of 417 students who are enrolled in schools in Niobrara County, 35 (8.4%) attend a private institution, while the remaining 382 (91.6%) are enrolled in public schools. The age group of 35 years and over has the highest likelihood of being enrolled in private schools, with 9 (32.1% in the age bracket) enrolled. Conversely, the age group of 3 to 4 year olds has the lowest likelihood of being enrolled in a private school, with 25 (100.0% in the age bracket) attending a public institution.
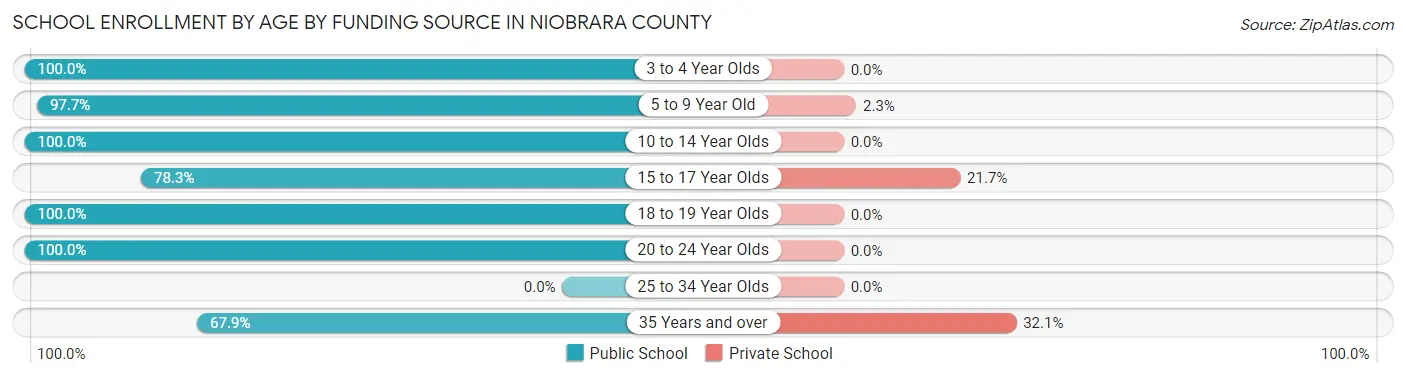
| Age Bracket | Public School | Private School |
| 3 to 4 Year Olds | 25 (100.0%) | 0 (0.0%) |
| 5 to 9 Year Old | 127 (97.7%) | 3 (2.3%) |
| 10 to 14 Year Olds | 114 (100.0%) | 0 (0.0%) |
| 15 to 17 Year Olds | 83 (78.3%) | 23 (21.7%) |
| 18 to 19 Year Olds | 10 (100.0%) | 0 (0.0%) |
| 20 to 24 Year Olds | 4 (100.0%) | 0 (0.0%) |
| 25 to 34 Year Olds | 0 (0.0%) | 0 (0.0%) |
| 35 Years and over | 19 (67.9%) | 9 (32.1%) |
| Total | 382 (91.6%) | 35 (8.4%) |
Educational Attainment by Field of Study in Niobrara County
Business (107 | 28.4%), education (106 | 28.1%), bio, nature & agricultural (55 | 14.6%), engineering (25 | 6.6%), and liberal arts & history (22 | 5.8%) are the most common fields of study among 377 individuals in Niobrara County who have obtained a bachelor's degree or higher.
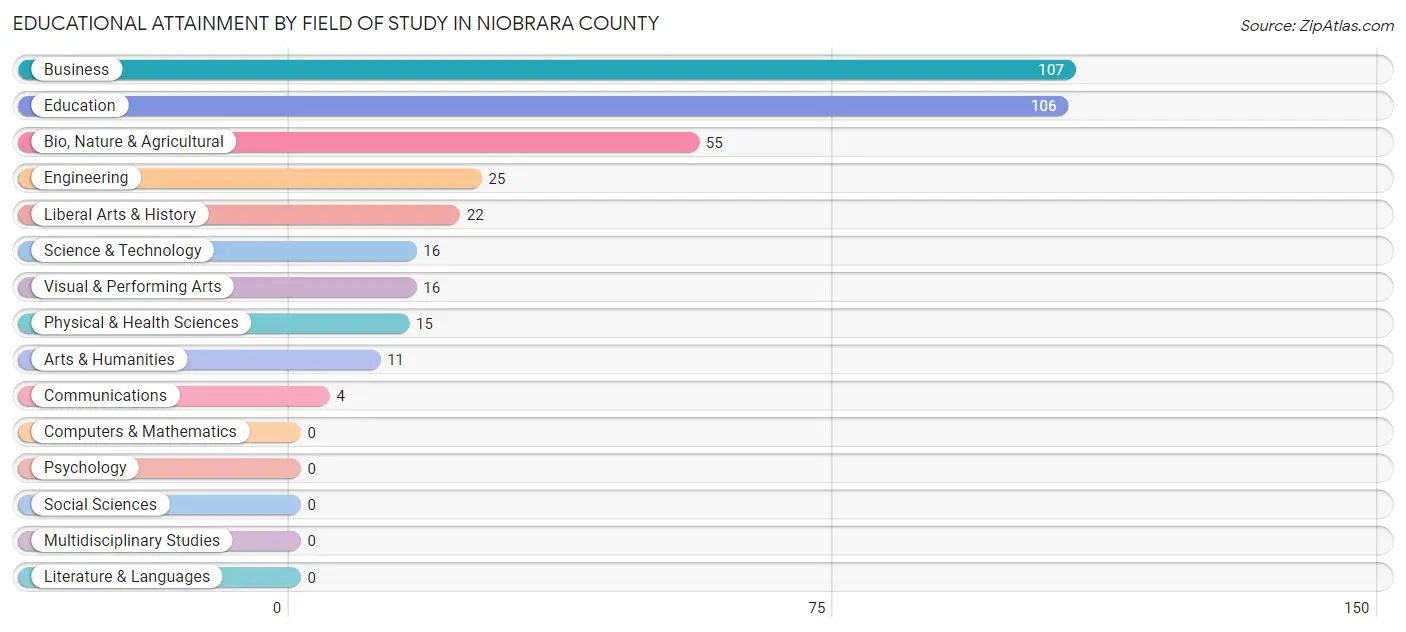
| Field of Study | # Graduates | % Graduates |
| Computers & Mathematics | 0 | 0.0% |
| Bio, Nature & Agricultural | 55 | 14.6% |
| Physical & Health Sciences | 15 | 4.0% |
| Psychology | 0 | 0.0% |
| Social Sciences | 0 | 0.0% |
| Engineering | 25 | 6.6% |
| Multidisciplinary Studies | 0 | 0.0% |
| Science & Technology | 16 | 4.2% |
| Business | 107 | 28.4% |
| Education | 106 | 28.1% |
| Literature & Languages | 0 | 0.0% |
| Liberal Arts & History | 22 | 5.8% |
| Visual & Performing Arts | 16 | 4.2% |
| Communications | 4 | 1.1% |
| Arts & Humanities | 11 | 2.9% |
| Total | 377 | 100.0% |
Transportation & Commute in Niobrara County
Vehicle Availability by Sex in Niobrara County
The most prevalent vehicle ownership categories in Niobrara County are males with 2 vehicles (181, accounting for 31.2%) and females with 2 vehicles (180, making up 36.0%).
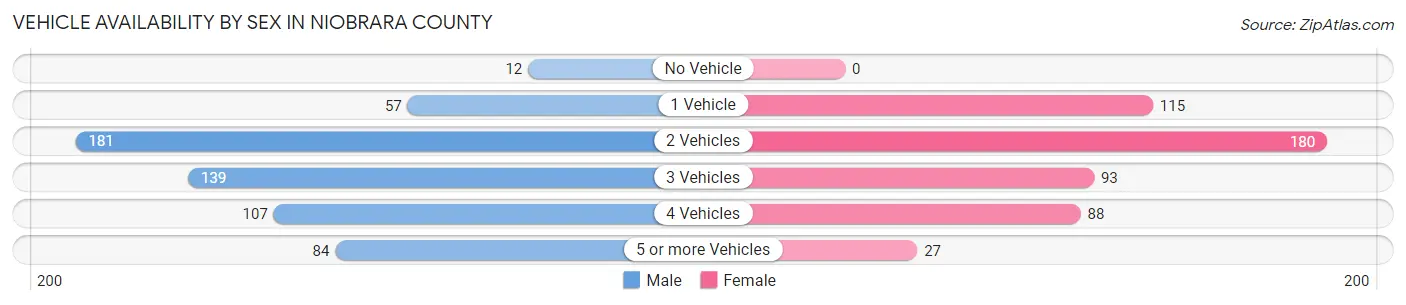
| Vehicles Available | Male | Female |
| No Vehicle | 12 (2.1%) | 0 (0.0%) |
| 1 Vehicle | 57 (9.8%) | 115 (22.9%) |
| 2 Vehicles | 181 (31.2%) | 180 (35.8%) |
| 3 Vehicles | 139 (24.0%) | 93 (18.5%) |
| 4 Vehicles | 107 (18.4%) | 88 (17.5%) |
| 5 or more Vehicles | 84 (14.5%) | 27 (5.4%) |
| Total | 580 (100.0%) | 503 (100.0%) |
Commute Time in Niobrara County
The most frequently occuring commute durations in Niobrara County are 5 to 9 minutes (307 commuters, 31.8%), less than 5 minutes (196 commuters, 20.3%), and 45 to 59 minutes (119 commuters, 12.3%).
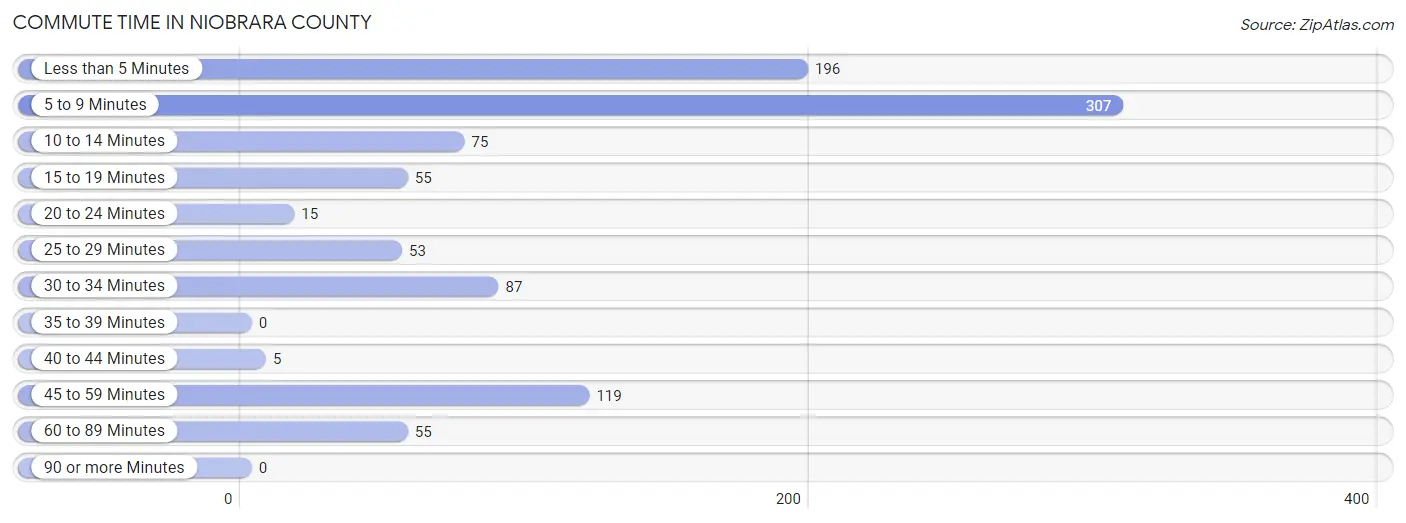
| Commute Time | # Commuters | % Commuters |
| Less than 5 Minutes | 196 | 20.3% |
| 5 to 9 Minutes | 307 | 31.8% |
| 10 to 14 Minutes | 75 | 7.8% |
| 15 to 19 Minutes | 55 | 5.7% |
| 20 to 24 Minutes | 15 | 1.5% |
| 25 to 29 Minutes | 53 | 5.5% |
| 30 to 34 Minutes | 87 | 9.0% |
| 35 to 39 Minutes | 0 | 0.0% |
| 40 to 44 Minutes | 5 | 0.5% |
| 45 to 59 Minutes | 119 | 12.3% |
| 60 to 89 Minutes | 55 | 5.7% |
| 90 or more Minutes | 0 | 0.0% |
Commute Time by Sex in Niobrara County
The most common commute times in Niobrara County are 5 to 9 minutes (165 commuters, 31.2%) for males and 5 to 9 minutes (142 commuters, 32.4%) for females.
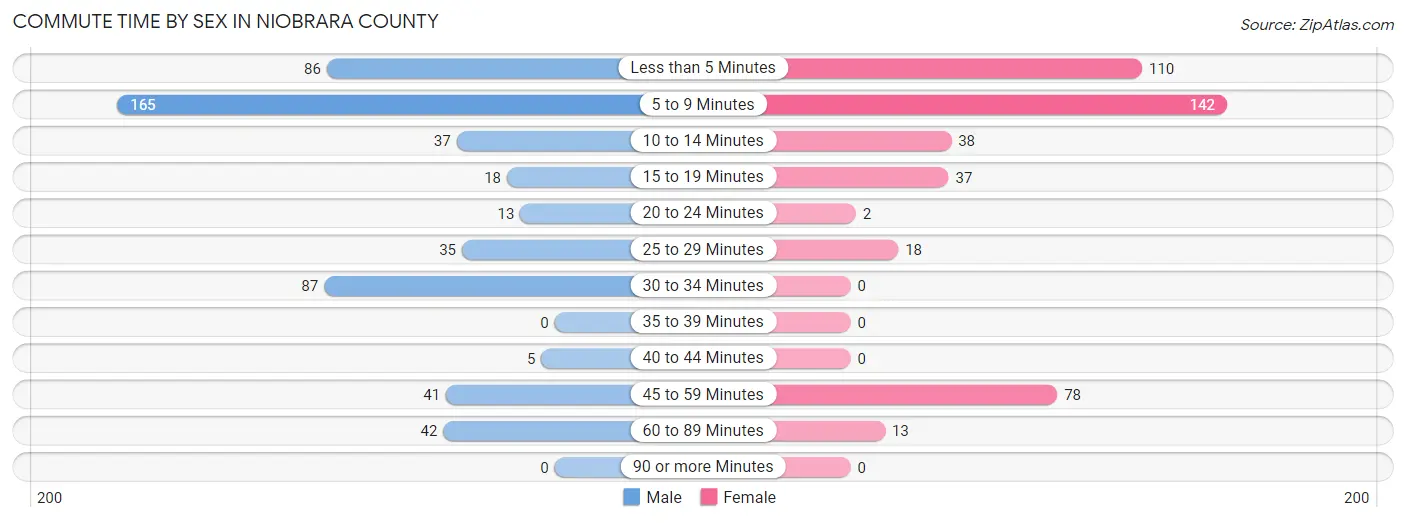
| Commute Time | Male | Female |
| Less than 5 Minutes | 86 (16.3%) | 110 (25.1%) |
| 5 to 9 Minutes | 165 (31.2%) | 142 (32.4%) |
| 10 to 14 Minutes | 37 (7.0%) | 38 (8.7%) |
| 15 to 19 Minutes | 18 (3.4%) | 37 (8.5%) |
| 20 to 24 Minutes | 13 (2.5%) | 2 (0.5%) |
| 25 to 29 Minutes | 35 (6.6%) | 18 (4.1%) |
| 30 to 34 Minutes | 87 (16.5%) | 0 (0.0%) |
| 35 to 39 Minutes | 0 (0.0%) | 0 (0.0%) |
| 40 to 44 Minutes | 5 (0.9%) | 0 (0.0%) |
| 45 to 59 Minutes | 41 (7.7%) | 78 (17.8%) |
| 60 to 89 Minutes | 42 (7.9%) | 13 (3.0%) |
| 90 or more Minutes | 0 (0.0%) | 0 (0.0%) |
Time of Departure to Work by Sex in Niobrara County
The most frequent times of departure to work in Niobrara County are 7:00 AM to 7:29 AM (146, 27.6%) for males and 8:00 AM to 8:29 AM (70, 16.0%) for females.
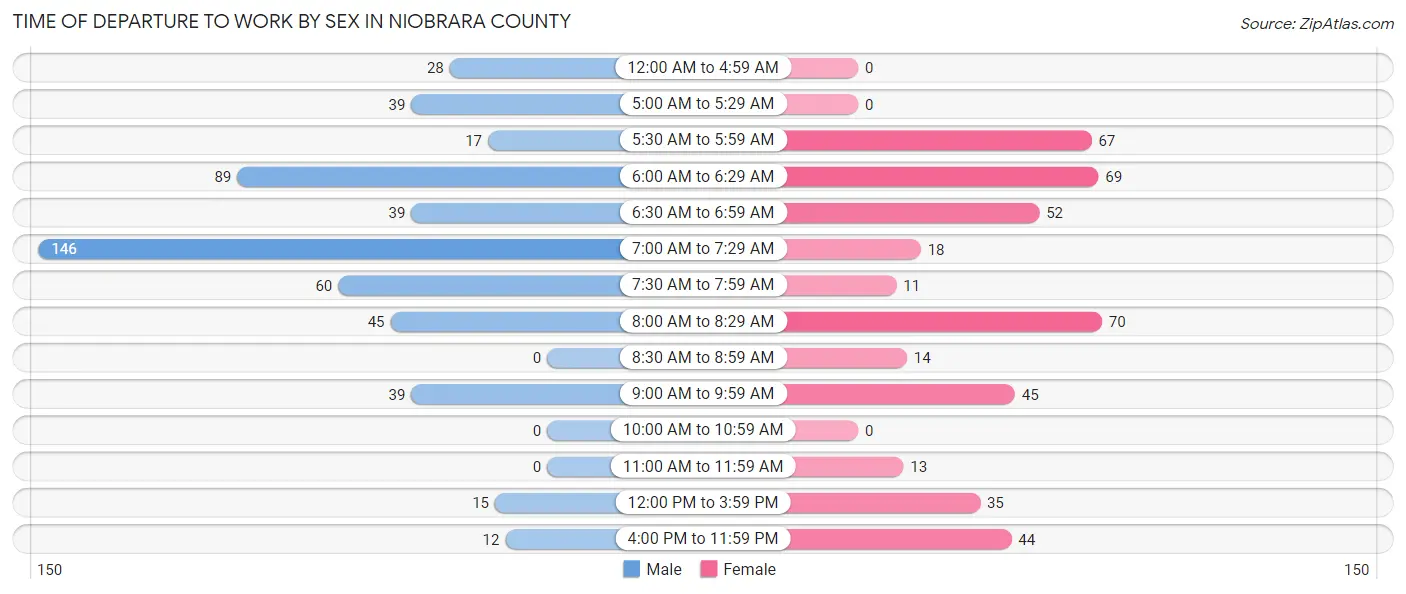
| Time of Departure | Male | Female |
| 12:00 AM to 4:59 AM | 28 (5.3%) | 0 (0.0%) |
| 5:00 AM to 5:29 AM | 39 (7.4%) | 0 (0.0%) |
| 5:30 AM to 5:59 AM | 17 (3.2%) | 67 (15.3%) |
| 6:00 AM to 6:29 AM | 89 (16.8%) | 69 (15.8%) |
| 6:30 AM to 6:59 AM | 39 (7.4%) | 52 (11.9%) |
| 7:00 AM to 7:29 AM | 146 (27.6%) | 18 (4.1%) |
| 7:30 AM to 7:59 AM | 60 (11.3%) | 11 (2.5%) |
| 8:00 AM to 8:29 AM | 45 (8.5%) | 70 (16.0%) |
| 8:30 AM to 8:59 AM | 0 (0.0%) | 14 (3.2%) |
| 9:00 AM to 9:59 AM | 39 (7.4%) | 45 (10.3%) |
| 10:00 AM to 10:59 AM | 0 (0.0%) | 0 (0.0%) |
| 11:00 AM to 11:59 AM | 0 (0.0%) | 13 (3.0%) |
| 12:00 PM to 3:59 PM | 15 (2.8%) | 35 (8.0%) |
| 4:00 PM to 11:59 PM | 12 (2.3%) | 44 (10.1%) |
| Total | 529 (100.0%) | 438 (100.0%) |
Housing Occupancy in Niobrara County
Occupancy by Ownership in Niobrara County
Of the total 1,072 dwellings in Niobrara County, owner-occupied units account for 755 (70.4%), while renter-occupied units make up 317 (29.6%).
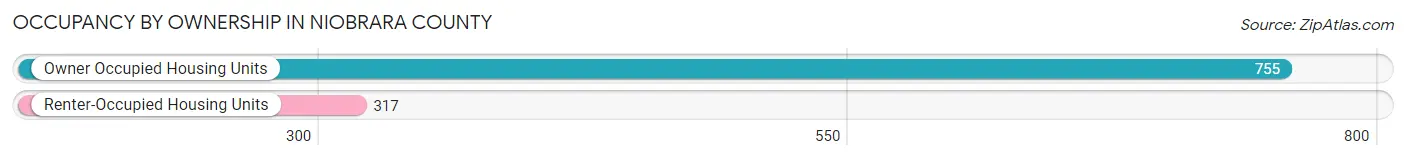
| Occupancy | # Housing Units | % Housing Units |
| Owner Occupied Housing Units | 755 | 70.4% |
| Renter-Occupied Housing Units | 317 | 29.6% |
| Total Occupied Housing Units | 1,072 | 100.0% |
Occupancy by Household Size in Niobrara County
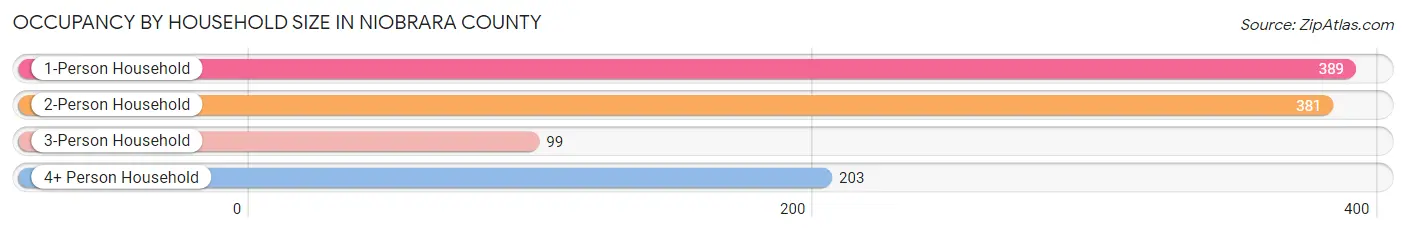
| Household Size | # Housing Units | % Housing Units |
| 1-Person Household | 389 | 36.3% |
| 2-Person Household | 381 | 35.5% |
| 3-Person Household | 99 | 9.2% |
| 4+ Person Household | 203 | 18.9% |
| Total Housing Units | 1,072 | 100.0% |
Occupancy by Ownership by Household Size in Niobrara County
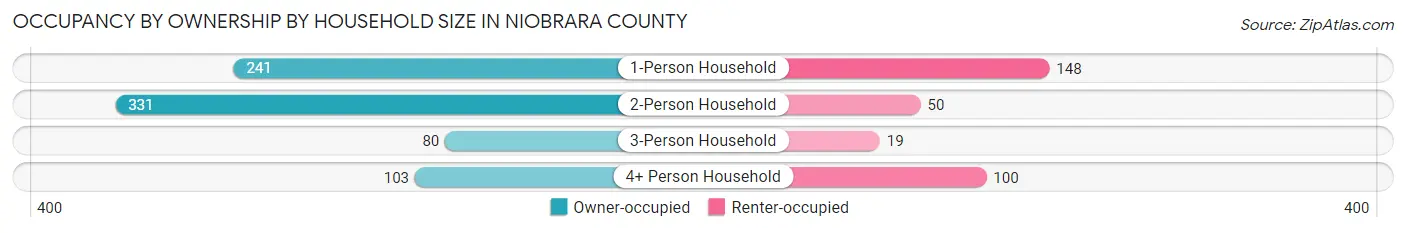
| Household Size | Owner-occupied | Renter-occupied |
| 1-Person Household | 241 (62.0%) | 148 (38.1%) |
| 2-Person Household | 331 (86.9%) | 50 (13.1%) |
| 3-Person Household | 80 (80.8%) | 19 (19.2%) |
| 4+ Person Household | 103 (50.7%) | 100 (49.3%) |
| Total Housing Units | 755 (70.4%) | 317 (29.6%) |
Occupancy by Educational Attainment in Niobrara County
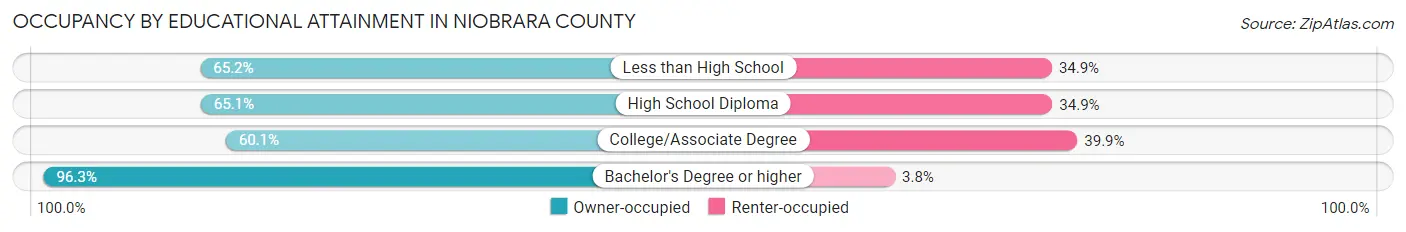
| Household Size | Owner-occupied | Renter-occupied |
| Less than High School | 43 (65.1%) | 23 (34.8%) |
| High School Diploma | 270 (65.1%) | 145 (34.9%) |
| College/Associate Degree | 211 (60.1%) | 140 (39.9%) |
| Bachelor's Degree or higher | 231 (96.3%) | 9 (3.7%) |
Occupancy by Age of Householder in Niobrara County
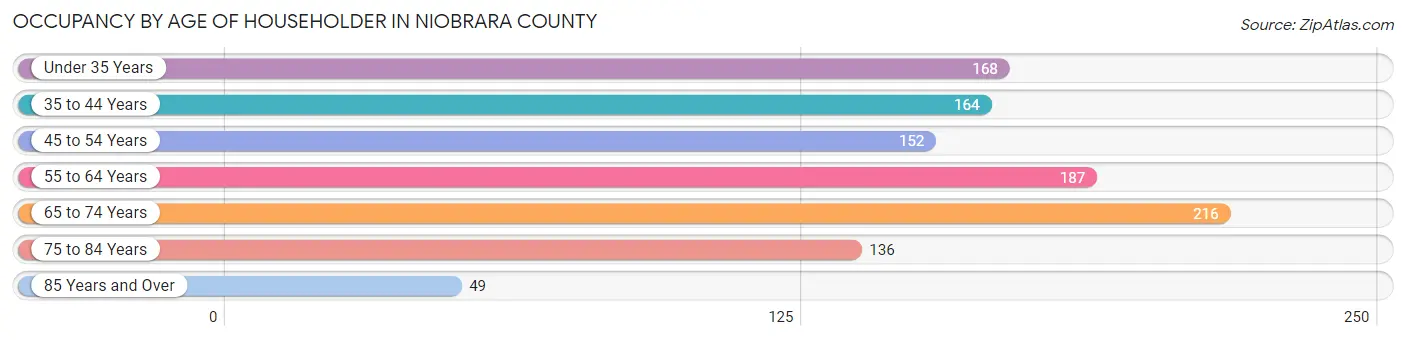
| Age Bracket | # Households | % Households |
| Under 35 Years | 168 | 15.7% |
| 35 to 44 Years | 164 | 15.3% |
| 45 to 54 Years | 152 | 14.2% |
| 55 to 64 Years | 187 | 17.4% |
| 65 to 74 Years | 216 | 20.2% |
| 75 to 84 Years | 136 | 12.7% |
| 85 Years and Over | 49 | 4.6% |
| Total | 1,072 | 100.0% |
Housing Finances in Niobrara County
Median Income by Occupancy in Niobrara County
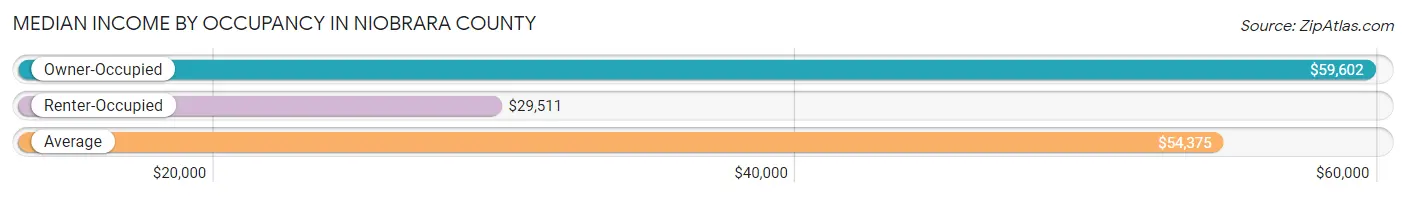
| Occupancy Type | # Households | Median Income |
| Owner-Occupied | 755 (70.4%) | $59,602 |
| Renter-Occupied | 317 (29.6%) | $29,511 |
| Average | 1,072 (100.0%) | $54,375 |
Occupancy by Householder Income Bracket in Niobrara County
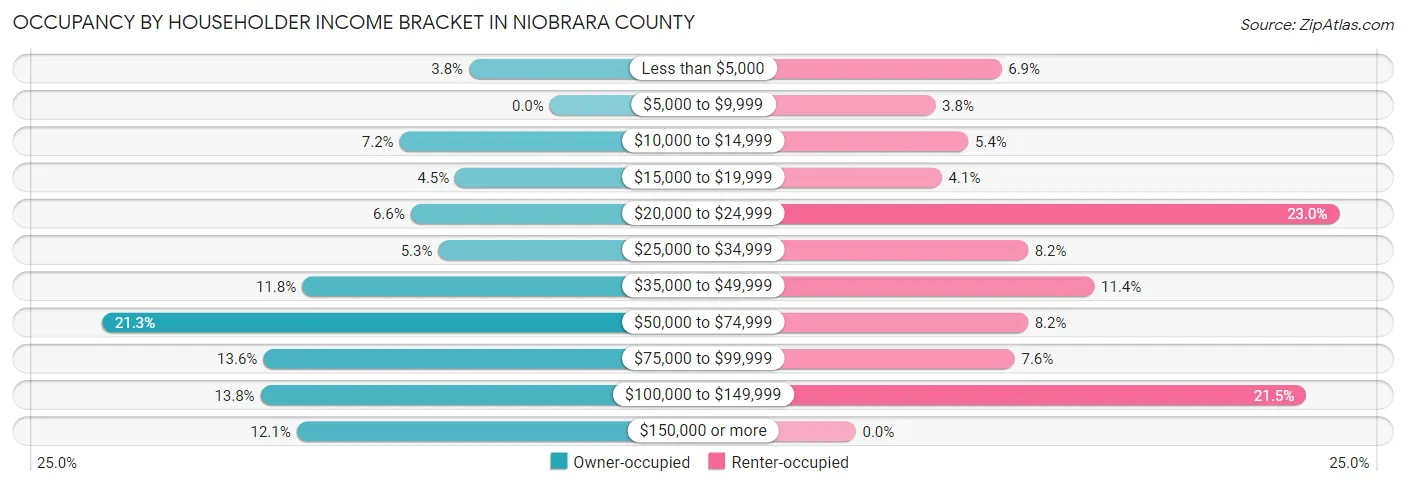
| Income Bracket | Owner-occupied | Renter-occupied |
| Less than $5,000 | 29 (3.8%) | 22 (6.9%) |
| $5,000 to $9,999 | 0 (0.0%) | 12 (3.8%) |
| $10,000 to $14,999 | 54 (7.1%) | 17 (5.4%) |
| $15,000 to $19,999 | 34 (4.5%) | 13 (4.1%) |
| $20,000 to $24,999 | 50 (6.6%) | 73 (23.0%) |
| $25,000 to $34,999 | 40 (5.3%) | 26 (8.2%) |
| $35,000 to $49,999 | 89 (11.8%) | 36 (11.4%) |
| $50,000 to $74,999 | 161 (21.3%) | 26 (8.2%) |
| $75,000 to $99,999 | 103 (13.6%) | 24 (7.6%) |
| $100,000 to $149,999 | 104 (13.8%) | 68 (21.4%) |
| $150,000 or more | 91 (12.0%) | 0 (0.0%) |
| Total | 755 (100.0%) | 317 (100.0%) |
Monthly Housing Cost Tiers in Niobrara County
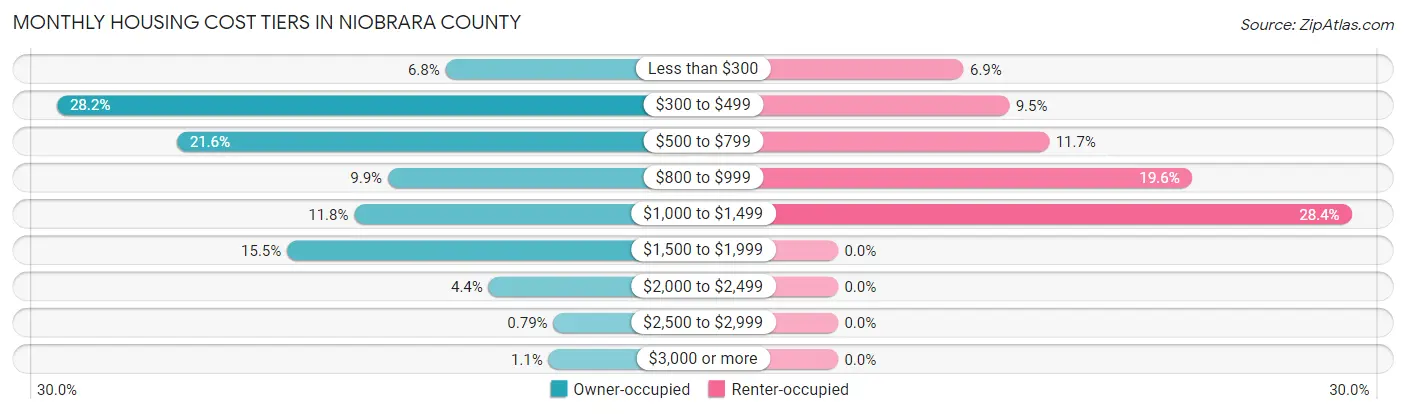
| Monthly Cost | Owner-occupied | Renter-occupied |
| Less than $300 | 51 (6.8%) | 22 (6.9%) |
| $300 to $499 | 213 (28.2%) | 30 (9.5%) |
| $500 to $799 | 163 (21.6%) | 37 (11.7%) |
| $800 to $999 | 75 (9.9%) | 62 (19.6%) |
| $1,000 to $1,499 | 89 (11.8%) | 90 (28.4%) |
| $1,500 to $1,999 | 117 (15.5%) | 0 (0.0%) |
| $2,000 to $2,499 | 33 (4.4%) | 0 (0.0%) |
| $2,500 to $2,999 | 6 (0.8%) | 0 (0.0%) |
| $3,000 or more | 8 (1.1%) | 0 (0.0%) |
| Total | 755 (100.0%) | 317 (100.0%) |
Physical Housing Characteristics in Niobrara County
Housing Structures in Niobrara County
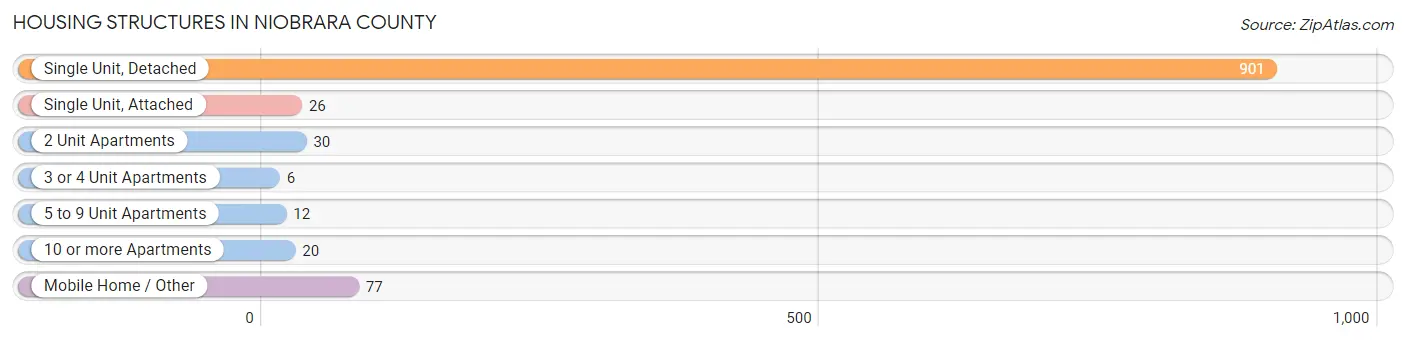
| Structure Type | # Housing Units | % Housing Units |
| Single Unit, Detached | 901 | 84.1% |
| Single Unit, Attached | 26 | 2.4% |
| 2 Unit Apartments | 30 | 2.8% |
| 3 or 4 Unit Apartments | 6 | 0.6% |
| 5 to 9 Unit Apartments | 12 | 1.1% |
| 10 or more Apartments | 20 | 1.9% |
| Mobile Home / Other | 77 | 7.2% |
| Total | 1,072 | 100.0% |
Housing Structures by Occupancy in Niobrara County
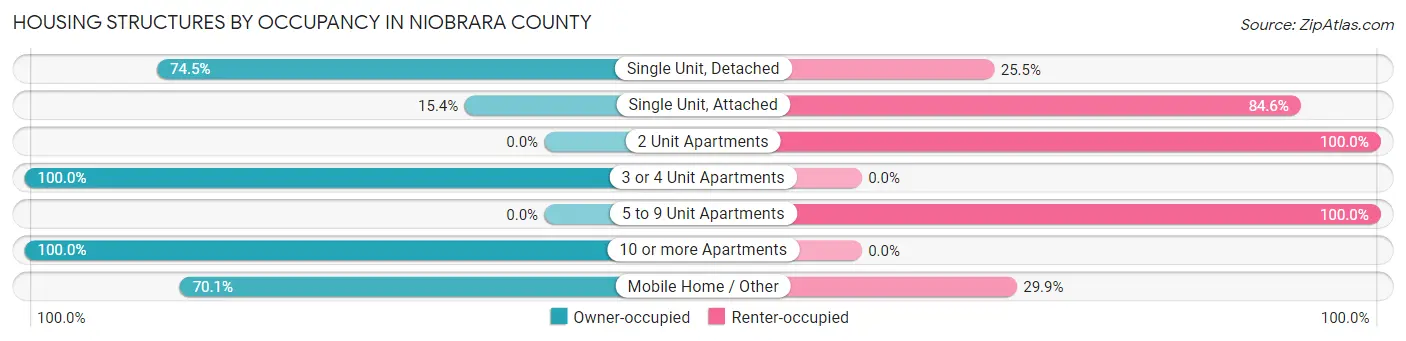
| Structure Type | Owner-occupied | Renter-occupied |
| Single Unit, Detached | 671 (74.5%) | 230 (25.5%) |
| Single Unit, Attached | 4 (15.4%) | 22 (84.6%) |
| 2 Unit Apartments | 0 (0.0%) | 30 (100.0%) |
| 3 or 4 Unit Apartments | 6 (100.0%) | 0 (0.0%) |
| 5 to 9 Unit Apartments | 0 (0.0%) | 12 (100.0%) |
| 10 or more Apartments | 20 (100.0%) | 0 (0.0%) |
| Mobile Home / Other | 54 (70.1%) | 23 (29.9%) |
| Total | 755 (70.4%) | 317 (29.6%) |
Housing Structures by Number of Rooms in Niobrara County
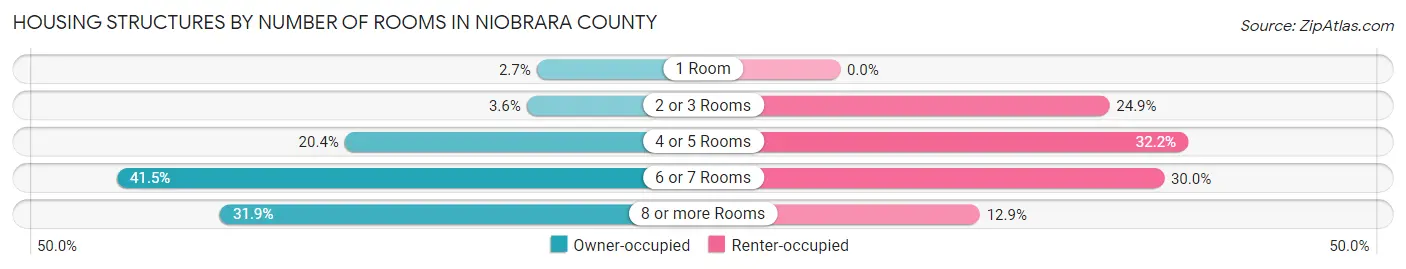
| Number of Rooms | Owner-occupied | Renter-occupied |
| 1 Room | 20 (2.6%) | 0 (0.0%) |
| 2 or 3 Rooms | 27 (3.6%) | 79 (24.9%) |
| 4 or 5 Rooms | 154 (20.4%) | 102 (32.2%) |
| 6 or 7 Rooms | 313 (41.5%) | 95 (30.0%) |
| 8 or more Rooms | 241 (31.9%) | 41 (12.9%) |
| Total | 755 (100.0%) | 317 (100.0%) |
Housing Structure by Heating Type in Niobrara County
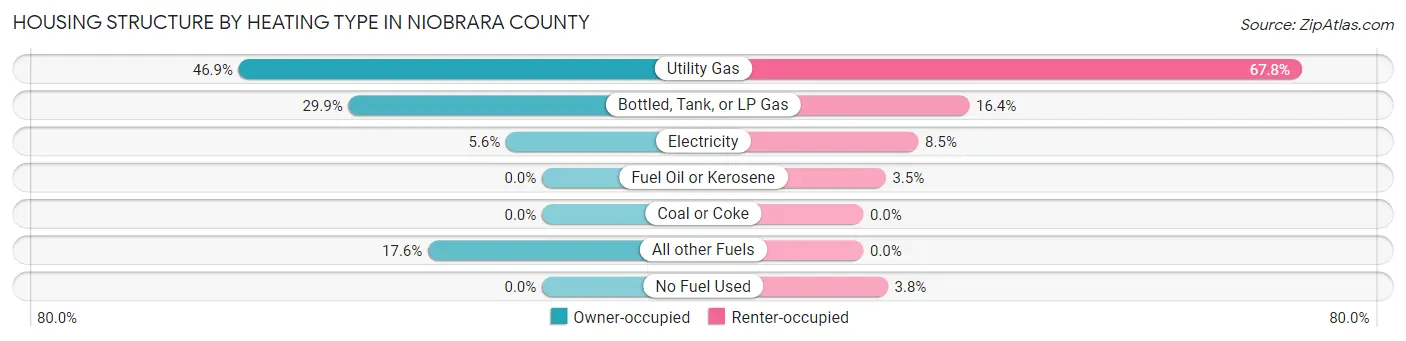
| Heating Type | Owner-occupied | Renter-occupied |
| Utility Gas | 354 (46.9%) | 215 (67.8%) |
| Bottled, Tank, or LP Gas | 226 (29.9%) | 52 (16.4%) |
| Electricity | 42 (5.6%) | 27 (8.5%) |
| Fuel Oil or Kerosene | 0 (0.0%) | 11 (3.5%) |
| Coal or Coke | 0 (0.0%) | 0 (0.0%) |
| All other Fuels | 133 (17.6%) | 0 (0.0%) |
| No Fuel Used | 0 (0.0%) | 12 (3.8%) |
| Total | 755 (100.0%) | 317 (100.0%) |
Household Vehicle Usage in Niobrara County
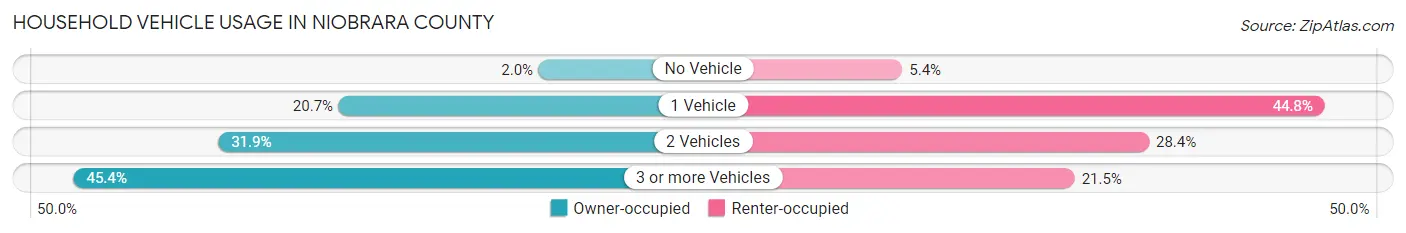
| Vehicles per Household | Owner-occupied | Renter-occupied |
| No Vehicle | 15 (2.0%) | 17 (5.4%) |
| 1 Vehicle | 156 (20.7%) | 142 (44.8%) |
| 2 Vehicles | 241 (31.9%) | 90 (28.4%) |
| 3 or more Vehicles | 343 (45.4%) | 68 (21.4%) |
| Total | 755 (100.0%) | 317 (100.0%) |
Real Estate & Mortgages in Niobrara County
Real Estate and Mortgage Overview in Niobrara County
| Characteristic | Without Mortgage | With Mortgage |
| Housing Units | 445 | 310 |
| Median Property Value | $199,700 | $191,500 |
| Median Household Income | $48,977 | $50 |
| Monthly Housing Costs | $454 | $8 |
| Real Estate Taxes | $777 | $0 |
Property Value by Mortgage Status in Niobrara County
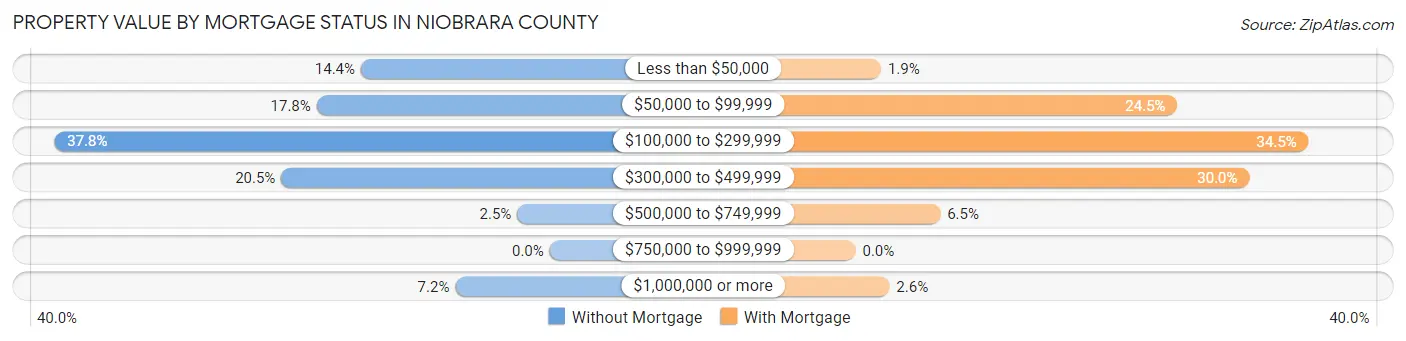
| Property Value | Without Mortgage | With Mortgage |
| Less than $50,000 | 64 (14.4%) | 6 (1.9%) |
| $50,000 to $99,999 | 79 (17.7%) | 76 (24.5%) |
| $100,000 to $299,999 | 168 (37.8%) | 107 (34.5%) |
| $300,000 to $499,999 | 91 (20.4%) | 93 (30.0%) |
| $500,000 to $749,999 | 11 (2.5%) | 20 (6.5%) |
| $750,000 to $999,999 | 0 (0.0%) | 0 (0.0%) |
| $1,000,000 or more | 32 (7.2%) | 8 (2.6%) |
| Total | 445 (100.0%) | 310 (100.0%) |
Household Income by Mortgage Status in Niobrara County
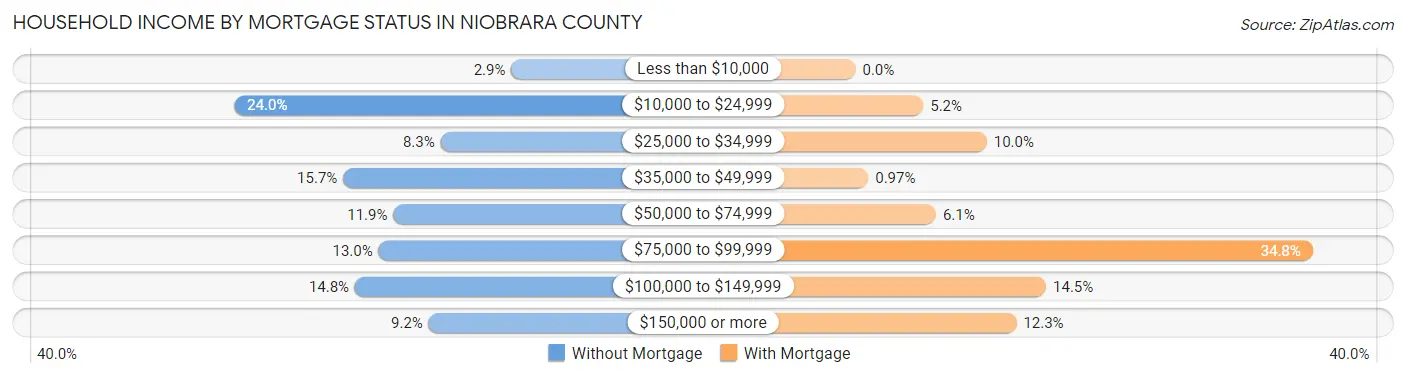
| Household Income | Without Mortgage | With Mortgage |
| Less than $10,000 | 13 (2.9%) | 0 (0.0%) |
| $10,000 to $24,999 | 107 (24.0%) | 16 (5.2%) |
| $25,000 to $34,999 | 37 (8.3%) | 31 (10.0%) |
| $35,000 to $49,999 | 70 (15.7%) | 3 (1.0%) |
| $50,000 to $74,999 | 53 (11.9%) | 19 (6.1%) |
| $75,000 to $99,999 | 58 (13.0%) | 108 (34.8%) |
| $100,000 to $149,999 | 66 (14.8%) | 45 (14.5%) |
| $150,000 or more | 41 (9.2%) | 38 (12.3%) |
| Total | 445 (100.0%) | 310 (100.0%) |
Property Value to Household Income Ratio in Niobrara County
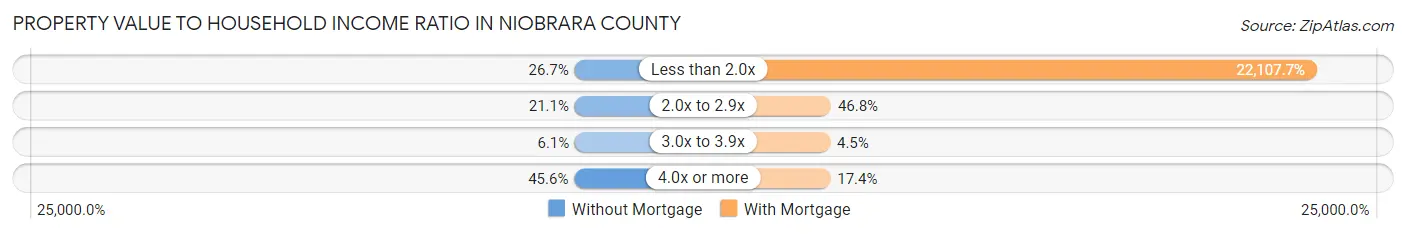
| Value-to-Income Ratio | Without Mortgage | With Mortgage |
| Less than 2.0x | 119 (26.7%) | 68,534 (22,107.7%) |
| 2.0x to 2.9x | 94 (21.1%) | 145 (46.8%) |
| 3.0x to 3.9x | 27 (6.1%) | 14 (4.5%) |
| 4.0x or more | 203 (45.6%) | 54 (17.4%) |
| Total | 445 (100.0%) | 310 (100.0%) |
Real Estate Taxes by Mortgage Status in Niobrara County
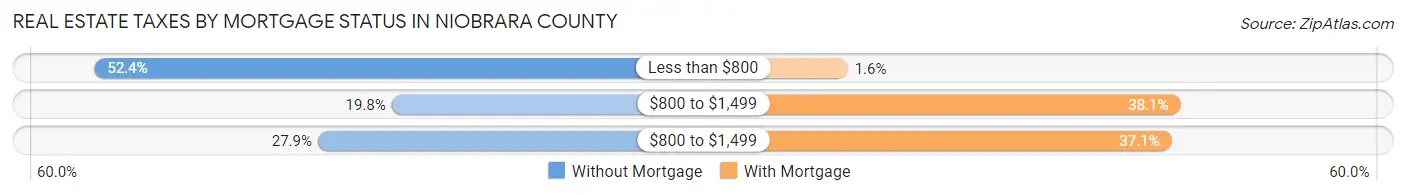
| Property Taxes | Without Mortgage | With Mortgage |
| Less than $800 | 233 (52.4%) | 5 (1.6%) |
| $800 to $1,499 | 88 (19.8%) | 118 (38.1%) |
| $800 to $1,499 | 124 (27.9%) | 115 (37.1%) |
| Total | 445 (100.0%) | 310 (100.0%) |
Health & Disability in Niobrara County
Health Insurance Coverage by Age in Niobrara County
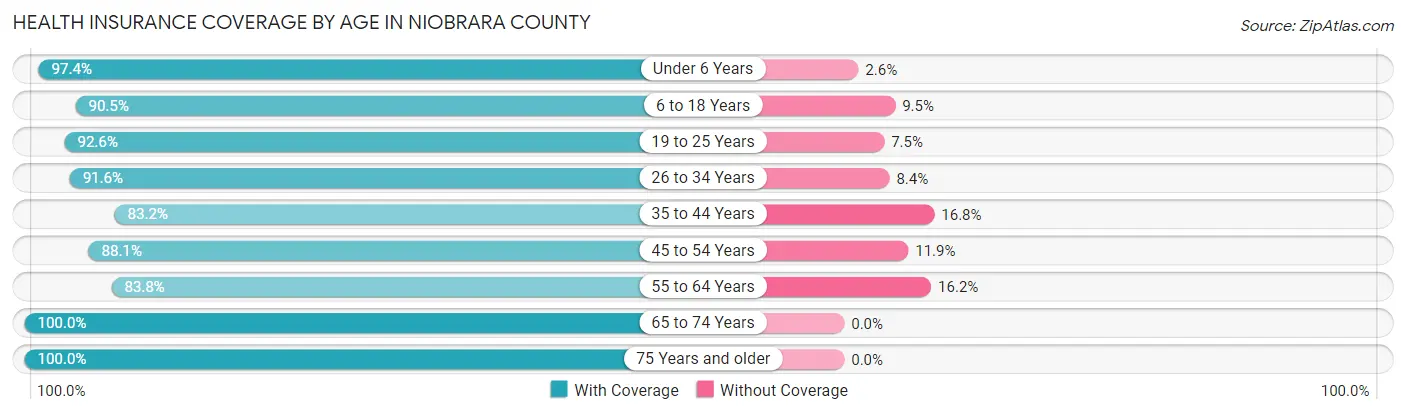
| Age Bracket | With Coverage | Without Coverage |
| Under 6 Years | 111 (97.4%) | 3 (2.6%) |
| 6 to 18 Years | 324 (90.5%) | 34 (9.5%) |
| 19 to 25 Years | 87 (92.5%) | 7 (7.4%) |
| 26 to 34 Years | 250 (91.6%) | 23 (8.4%) |
| 35 to 44 Years | 203 (83.2%) | 41 (16.8%) |
| 45 to 54 Years | 177 (88.1%) | 24 (11.9%) |
| 55 to 64 Years | 300 (83.8%) | 58 (16.2%) |
| 65 to 74 Years | 311 (100.0%) | 0 (0.0%) |
| 75 Years and older | 277 (100.0%) | 0 (0.0%) |
| Total | 2,040 (91.5%) | 190 (8.5%) |
Health Insurance Coverage by Citizenship Status in Niobrara County
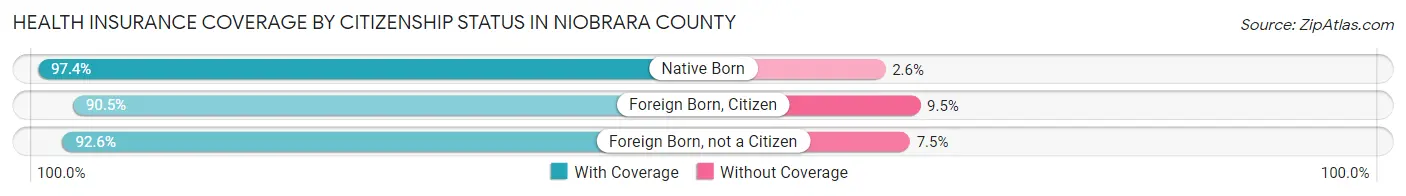
| Citizenship Status | With Coverage | Without Coverage |
| Native Born | 111 (97.4%) | 3 (2.6%) |
| Foreign Born, Citizen | 324 (90.5%) | 34 (9.5%) |
| Foreign Born, not a Citizen | 87 (92.5%) | 7 (7.4%) |
Health Insurance Coverage by Household Income in Niobrara County
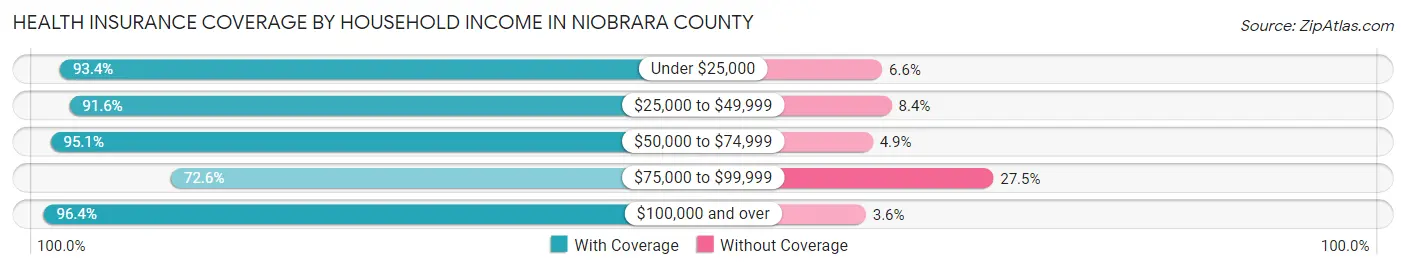
| Household Income | With Coverage | Without Coverage |
| Under $25,000 | 366 (93.4%) | 26 (6.6%) |
| $25,000 to $49,999 | 371 (91.6%) | 34 (8.4%) |
| $50,000 to $74,999 | 431 (95.1%) | 22 (4.9%) |
| $75,000 to $99,999 | 222 (72.6%) | 84 (27.5%) |
| $100,000 and over | 650 (96.4%) | 24 (3.6%) |
Public vs Private Health Insurance Coverage by Age in Niobrara County
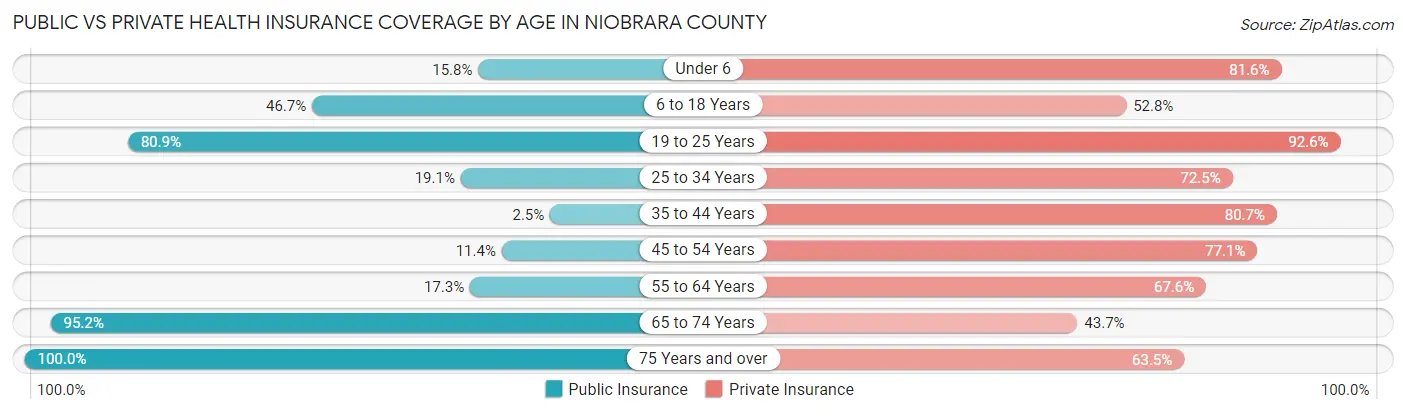
| Age Bracket | Public Insurance | Private Insurance |
| Under 6 | 18 (15.8%) | 93 (81.6%) |
| 6 to 18 Years | 167 (46.7%) | 189 (52.8%) |
| 19 to 25 Years | 76 (80.8%) | 87 (92.5%) |
| 25 to 34 Years | 52 (19.1%) | 198 (72.5%) |
| 35 to 44 Years | 6 (2.5%) | 197 (80.7%) |
| 45 to 54 Years | 23 (11.4%) | 155 (77.1%) |
| 55 to 64 Years | 62 (17.3%) | 242 (67.6%) |
| 65 to 74 Years | 296 (95.2%) | 136 (43.7%) |
| 75 Years and over | 277 (100.0%) | 176 (63.5%) |
| Total | 977 (43.8%) | 1,473 (66.0%) |
Disability Status by Sex by Age in Niobrara County
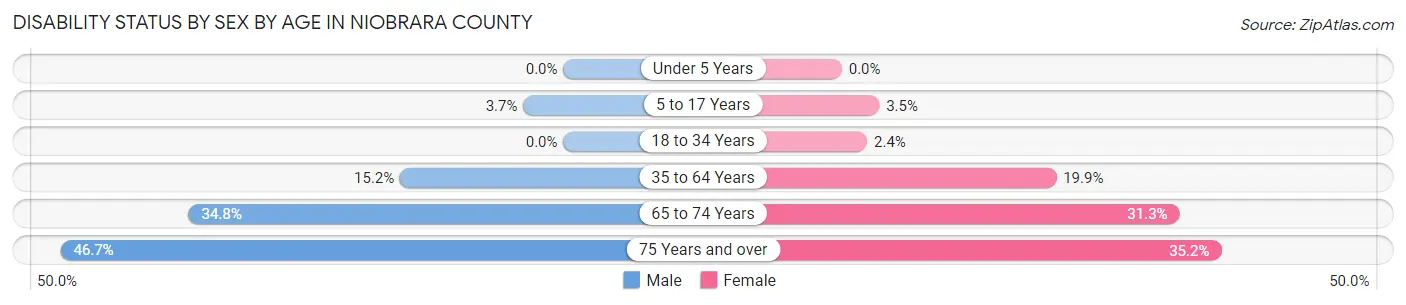
| Age Bracket | Male | Female |
| Under 5 Years | 0 (0.0%) | 0 (0.0%) |
| 5 to 17 Years | 7 (3.7%) | 6 (3.5%) |
| 18 to 34 Years | 0 (0.0%) | 6 (2.4%) |
| 35 to 64 Years | 60 (15.1%) | 81 (19.9%) |
| 65 to 74 Years | 56 (34.8%) | 47 (31.3%) |
| 75 Years and over | 63 (46.7%) | 50 (35.2%) |
Disability Class by Sex by Age in Niobrara County
Disability Class: Hearing Difficulty
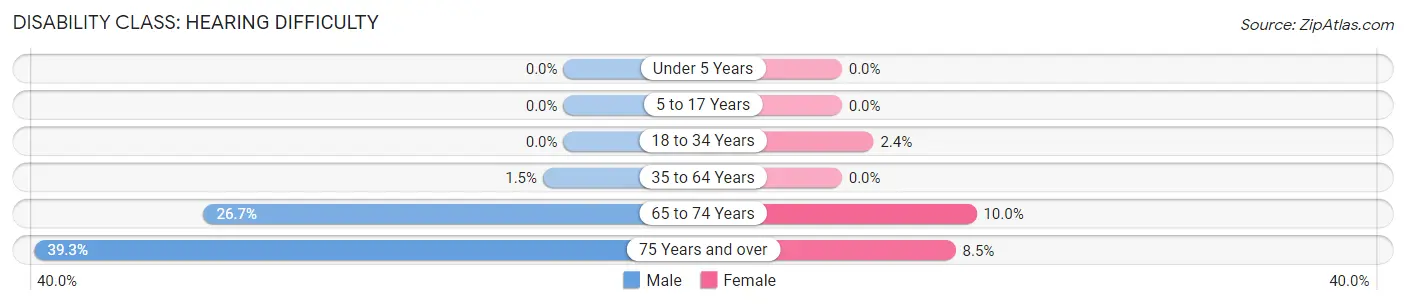
| Age Bracket | Male | Female |
| Under 5 Years | 0 (0.0%) | 0 (0.0%) |
| 5 to 17 Years | 0 (0.0%) | 0 (0.0%) |
| 18 to 34 Years | 0 (0.0%) | 6 (2.4%) |
| 35 to 64 Years | 6 (1.5%) | 0 (0.0%) |
| 65 to 74 Years | 43 (26.7%) | 15 (10.0%) |
| 75 Years and over | 53 (39.3%) | 12 (8.5%) |
Disability Class: Vision Difficulty
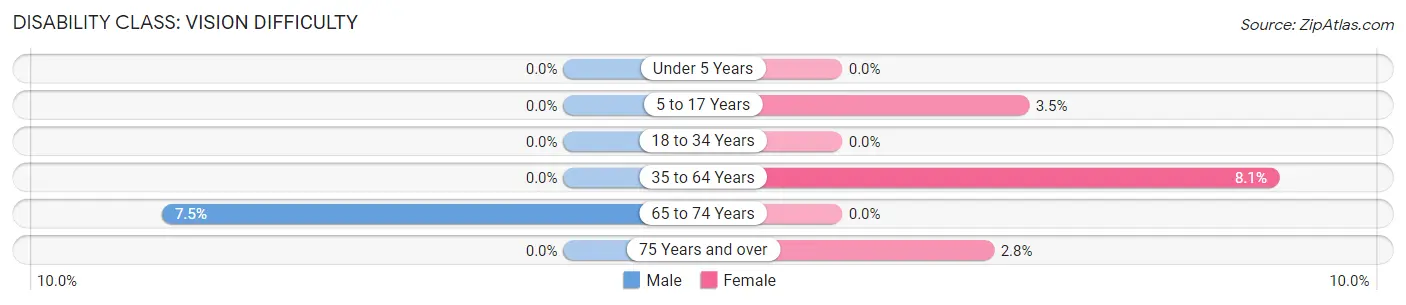
| Age Bracket | Male | Female |
| Under 5 Years | 0 (0.0%) | 0 (0.0%) |
| 5 to 17 Years | 0 (0.0%) | 6 (3.5%) |
| 18 to 34 Years | 0 (0.0%) | 0 (0.0%) |
| 35 to 64 Years | 0 (0.0%) | 33 (8.1%) |
| 65 to 74 Years | 12 (7.4%) | 0 (0.0%) |
| 75 Years and over | 0 (0.0%) | 4 (2.8%) |
Disability Class: Cognitive Difficulty
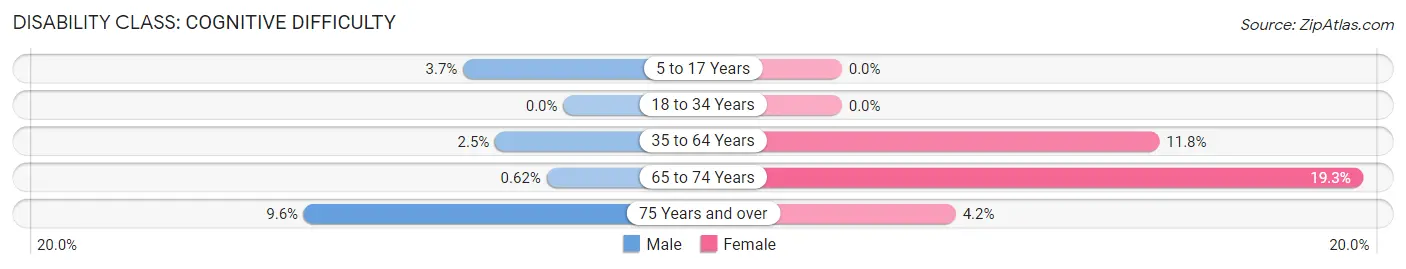
| Age Bracket | Male | Female |
| 5 to 17 Years | 7 (3.7%) | 0 (0.0%) |
| 18 to 34 Years | 0 (0.0%) | 0 (0.0%) |
| 35 to 64 Years | 10 (2.5%) | 48 (11.8%) |
| 65 to 74 Years | 1 (0.6%) | 29 (19.3%) |
| 75 Years and over | 13 (9.6%) | 6 (4.2%) |
Disability Class: Ambulatory Difficulty
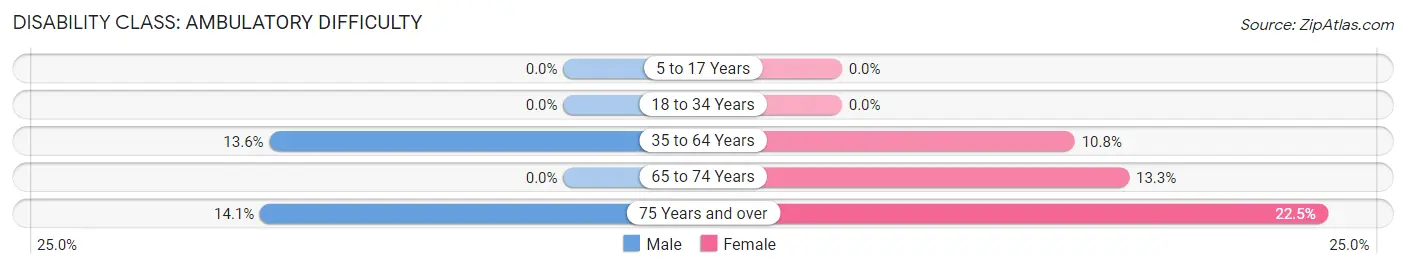
| Age Bracket | Male | Female |
| 5 to 17 Years | 0 (0.0%) | 0 (0.0%) |
| 18 to 34 Years | 0 (0.0%) | 0 (0.0%) |
| 35 to 64 Years | 54 (13.6%) | 44 (10.8%) |
| 65 to 74 Years | 0 (0.0%) | 20 (13.3%) |
| 75 Years and over | 19 (14.1%) | 32 (22.5%) |
Disability Class: Self-Care Difficulty
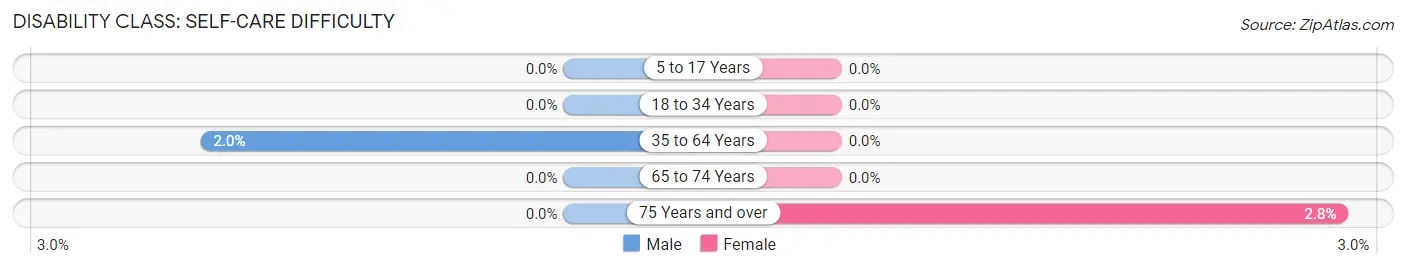
| Age Bracket | Male | Female |
| 5 to 17 Years | 0 (0.0%) | 0 (0.0%) |
| 18 to 34 Years | 0 (0.0%) | 0 (0.0%) |
| 35 to 64 Years | 8 (2.0%) | 0 (0.0%) |
| 65 to 74 Years | 0 (0.0%) | 0 (0.0%) |
| 75 Years and over | 0 (0.0%) | 4 (2.8%) |
Technology Access in Niobrara County
Computing Device Access in Niobrara County
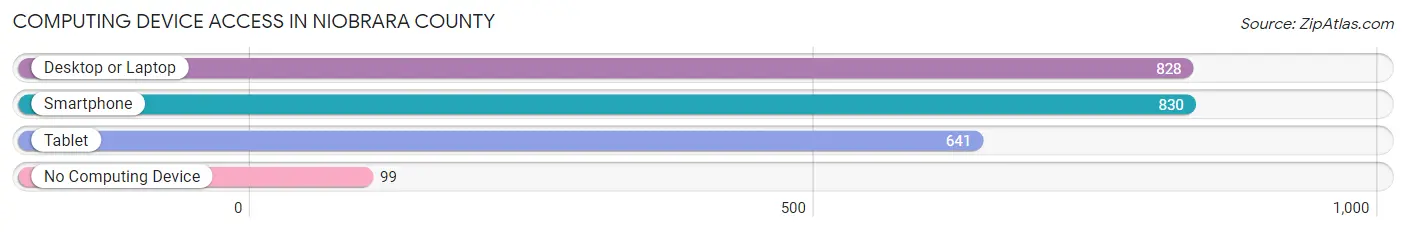
| Device Type | # Households | % Households |
| Desktop or Laptop | 828 | 77.2% |
| Smartphone | 830 | 77.4% |
| Tablet | 641 | 59.8% |
| No Computing Device | 99 | 9.2% |
| Total | 1,072 | 100.0% |
Internet Access in Niobrara County
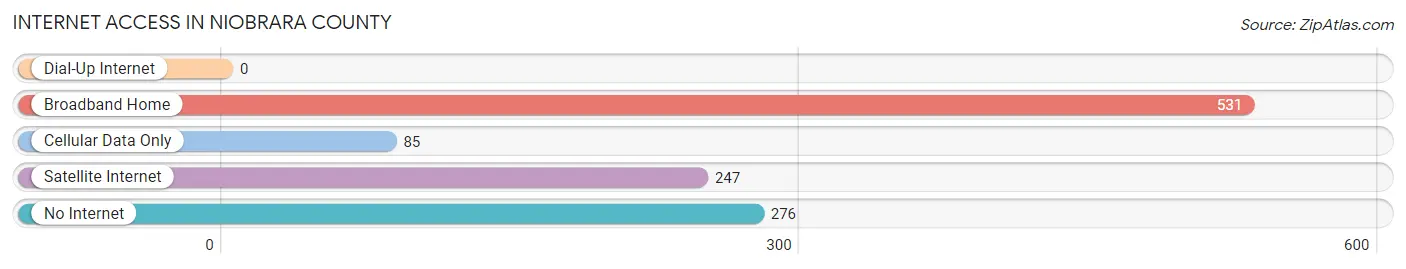
| Internet Type | # Households | % Households |
| Dial-Up Internet | 0 | 0.0% |
| Broadband Home | 531 | 49.5% |
| Cellular Data Only | 85 | 7.9% |
| Satellite Internet | 247 | 23.0% |
| No Internet | 276 | 25.8% |
| Total | 1,072 | 100.0% |
Niobrara County Summary
Niobrara County is located in the northeastern corner of Wyoming, and is bordered by South Dakota to the east, Nebraska to the north, and Johnson County to the south. The county seat is Lusk, and the county is named after the Niobrara River, which flows through the county. The county has a total area of 2,541 square miles, of which 2,539 square miles is land and 2.2 square miles is water.
History
The area that is now Niobrara County was first inhabited by Native American tribes, including the Arapaho, Cheyenne, Sioux, and Shoshone. The first white settlers arrived in the area in the late 1800s, and the county was officially established in 1911. The county was named after the Niobrara River, which was named by French trappers in the early 1800s.
The county was largely rural until the 1950s, when oil and gas exploration began in the area. This led to an influx of people and businesses, and the county's population grew rapidly. The county's economy is still largely based on oil and gas production, as well as agriculture and tourism.
Geography
Niobrara County is located in the northeastern corner of Wyoming, and is bordered by South Dakota to the east, Nebraska to the north, and Johnson County to the south. The county has a total area of 2,541 square miles, of which 2,539 square miles is land and 2.2 square miles is water. The county is mostly flat, with rolling hills in the east and south. The Niobrara River flows through the county, and there are several small lakes and reservoirs in the area.
Economy
Niobrara County's economy is largely based on oil and gas production, as well as agriculture and tourism. The county is home to several oil and gas fields, and the industry is the largest employer in the county. Agriculture is also an important part of the economy, with cattle ranching and wheat farming being the main crops. Tourism is also an important part of the economy, with visitors coming to the area to enjoy the natural beauty and outdoor activities.
Demographics
As of the 2010 census, Niobrara County had a population of 2,484. The population was spread out, with 48.3% male and 51.7% female. The median age was 44.7 years, and the median household income was $45,938. The largest racial group was White (94.2%), followed by American Indian (2.2%), and Hispanic or Latino (1.7%).
Niobrara County is a rural county, with most of the population living in small towns and rural areas. The county is home to several small towns, including Lusk, Manville, and Van Tassell. The county is also home to the Wind River Indian Reservation, which is home to the Eastern Shoshone and Northern Arapaho tribes.
Common Questions
What is the Total Population of Niobrara County?
Total Population of Niobrara County is 2,460.
What is the Total Male Population of Niobrara County?
Total Male Population of Niobrara County is 1,056.
What is the Total Female Population of Niobrara County?
Total Female Population of Niobrara County is 1,404.
What is the Ratio of Males per 100 Females in Niobrara County?
There are 75.21 Males per 100 Females in Niobrara County.
What is the Ratio of Females per 100 Males in Niobrara County?
There are 132.95 Females per 100 Males in Niobrara County.
What is the Median Population Age in Niobrara County?
Median Population Age in Niobrara County is 43.6 Years.
What is the Average Family Size in Niobrara County
Average Family Size in Niobrara County is 2.7 People.
What is the Average Household Size in Niobrara County
Average Household Size in Niobrara County is 2.1 People.
What is Per Capita Income in Niobrara County?
Per Capita income in Niobrara County is $29,442.
What is the Median Family Income in Niobrara County?
Median Family Income in Niobrara County is $62,434.
What is the Median Household income in Niobrara County?
Median Household Income in Niobrara County is $54,375.
What is Income or Wage Gap in Niobrara County?
Income or Wage Gap in Niobrara County is 48.8%.
Women in Niobrara County earn 51.2 cents for every dollar earned by a man.
What is Inequality or Gini Index in Niobrara County?
Inequality or Gini Index in Niobrara County is 0.44.
How Large is the Labor Force in Niobrara County?
There are 1,166 People in the Labor Forcein in Niobrara County.
What is the Percentage of People in the Labor Force in Niobrara County?
55.9% of People are in the Labor Force in Niobrara County.
What is the Unemployment Rate in Niobrara County?
Unemployment Rate in Niobrara County is 5.3%.