Natrona County, WY
Natrona County Map
Natrona County Overview
79,506
TOTAL POPULATION
40,147
MALE POPULATION
39,359
FEMALE POPULATION
102.00
MALES / 100 FEMALES
98.04
FEMALES / 100 MALES
37.7
MEDIAN AGE
3.0
AVG FAMILY SIZE
2.4
AVG HOUSEHOLD SIZE
$40,346
PER CAPITA INCOME
$88,465
AVG FAMILY INCOME
$69,104
AVG HOUSEHOLD INCOME
34.4%
WAGE / INCOME GAP [ % ]
65.6¢/ $1
WAGE / INCOME GAP [ $ ]
$10,306
FAMILY INCOME DEFICIT
0.44
INEQUALITY / GINI INDEX
42,286
LABOR FORCE [ PEOPLE ]
67.5%
PERCENT IN LABOR FORCE
3.5%
UNEMPLOYMENT RATE
Natrona County Area Codes
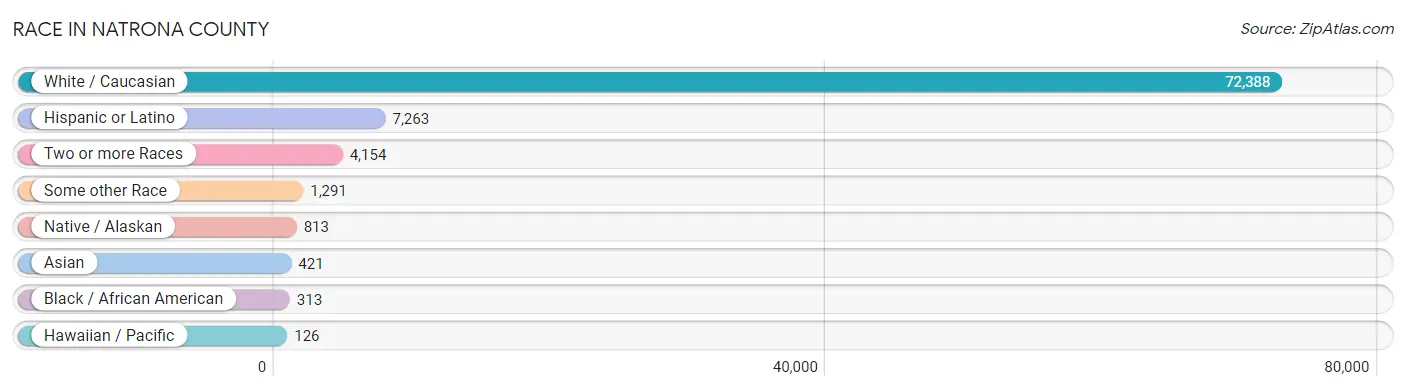
Race in Natrona County
The most populous races in Natrona County are White / Caucasian (72,388 | 91.0%), Hispanic or Latino (7,263 | 9.1%), and Two or more Races (4,154 | 5.2%).
| Race | # Population | % Population |
| Asian | 421 | 0.5% |
| Black / African American | 313 | 0.4% |
| Hawaiian / Pacific | 126 | 0.2% |
| Hispanic or Latino | 7,263 | 9.1% |
| Native / Alaskan | 813 | 1.0% |
| White / Caucasian | 72,388 | 91.0% |
| Two or more Races | 4,154 | 5.2% |
| Some other Race | 1,291 | 1.6% |
| Total | 79,506 | 100.0% |
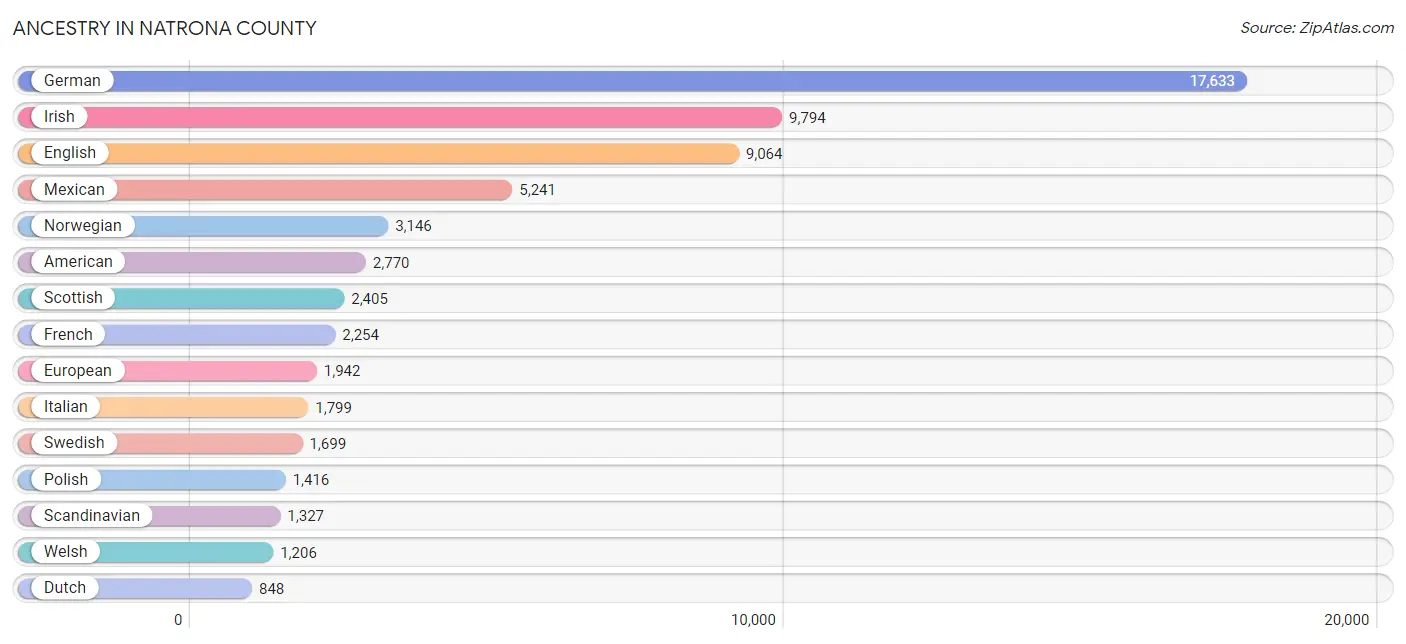
Ancestry in Natrona County
The most populous ancestries reported in Natrona County are German (17,633 | 22.2%), Irish (9,794 | 12.3%), English (9,064 | 11.4%), Mexican (5,241 | 6.6%), and Norwegian (3,146 | 4.0%), together accounting for 56.4% of all Natrona County residents.
| Ancestry | # Population | % Population |
| African | 22 | 0.0% |
| Alaska Native | 5 | 0.0% |
| American | 2,770 | 3.5% |
| Apache | 3 | 0.0% |
| Arab | 49 | 0.1% |
| Arapaho | 110 | 0.1% |
| Austrian | 409 | 0.5% |
| Belgian | 279 | 0.4% |
| Belizean | 73 | 0.1% |
| Bhutanese | 424 | 0.5% |
| Blackfeet | 60 | 0.1% |
| Bolivian | 23 | 0.0% |
| British | 570 | 0.7% |
| Burmese | 97 | 0.1% |
| Canadian | 151 | 0.2% |
| Celtic | 55 | 0.1% |
| Central American | 110 | 0.1% |
| Central American Indian | 14 | 0.0% |
| Cherokee | 189 | 0.2% |
| Cheyenne | 3 | 0.0% |
| Chickasaw | 13 | 0.0% |
| Chinese | 38 | 0.1% |
| Chippewa | 10 | 0.0% |
| Colombian | 11 | 0.0% |
| Cree | 32 | 0.0% |
| Croatian | 108 | 0.1% |
| Cuban | 131 | 0.2% |
| Czech | 546 | 0.7% |
| Czechoslovakian | 31 | 0.0% |
| Danish | 805 | 1.0% |
| Dominican | 34 | 0.0% |
| Dutch | 848 | 1.1% |
| Eastern European | 314 | 0.4% |
| English | 9,064 | 11.4% |
| Estonian | 4 | 0.0% |
| European | 1,942 | 2.4% |
| Finnish | 214 | 0.3% |
| French | 2,254 | 2.8% |
| French American Indian | 6 | 0.0% |
| French Canadian | 344 | 0.4% |
| German | 17,633 | 22.2% |
| Greek | 260 | 0.3% |
| Guatemalan | 63 | 0.1% |
| Hungarian | 280 | 0.4% |
| Icelander | 56 | 0.1% |
| Indian (Asian) | 130 | 0.2% |
| Irish | 9,794 | 12.3% |
| Israeli | 2 | 0.0% |
| Italian | 1,799 | 2.3% |
| Korean | 336 | 0.4% |
| Latvian | 101 | 0.1% |
| Liberian | 74 | 0.1% |
| Lithuanian | 142 | 0.2% |
| Mexican | 5,241 | 6.6% |
| Mexican American Indian | 51 | 0.1% |
| Native Hawaiian | 254 | 0.3% |
| Navajo | 77 | 0.1% |
| Nicaraguan | 6 | 0.0% |
| Nigerian | 17 | 0.0% |
| Northern European | 177 | 0.2% |
| Norwegian | 3,146 | 4.0% |
| Osage | 25 | 0.0% |
| Ottawa | 11 | 0.0% |
| Pakistani | 7 | 0.0% |
| Pennsylvania German | 25 | 0.0% |
| Peruvian | 33 | 0.0% |
| Polish | 1,416 | 1.8% |
| Portuguese | 123 | 0.2% |
| Pueblo | 3 | 0.0% |
| Puerto Rican | 167 | 0.2% |
| Romanian | 7 | 0.0% |
| Russian | 396 | 0.5% |
| Salvadoran | 41 | 0.1% |
| Samoan | 20 | 0.0% |
| Scandinavian | 1,327 | 1.7% |
| Scotch-Irish | 710 | 0.9% |
| Scottish | 2,405 | 3.0% |
| Seminole | 8 | 0.0% |
| Serbian | 76 | 0.1% |
| Shoshone | 50 | 0.1% |
| Sioux | 224 | 0.3% |
| Slavic | 54 | 0.1% |
| Slovak | 23 | 0.0% |
| Slovene | 25 | 0.0% |
| South American | 79 | 0.1% |
| Spaniard | 191 | 0.2% |
| Spanish | 446 | 0.6% |
| Spanish American | 119 | 0.2% |
| Sri Lankan | 10 | 0.0% |
| Subsaharan African | 113 | 0.1% |
| Swedish | 1,699 | 2.1% |
| Swiss | 87 | 0.1% |
| Thai | 45 | 0.1% |
| Ukrainian | 43 | 0.1% |
| Ute | 8 | 0.0% |
| Venezuelan | 12 | 0.0% |
| Welsh | 1,206 | 1.5% |
| Yugoslavian | 244 | 0.3% |
| Yup'ik | 11 | 0.0% | View All 99 Rows |
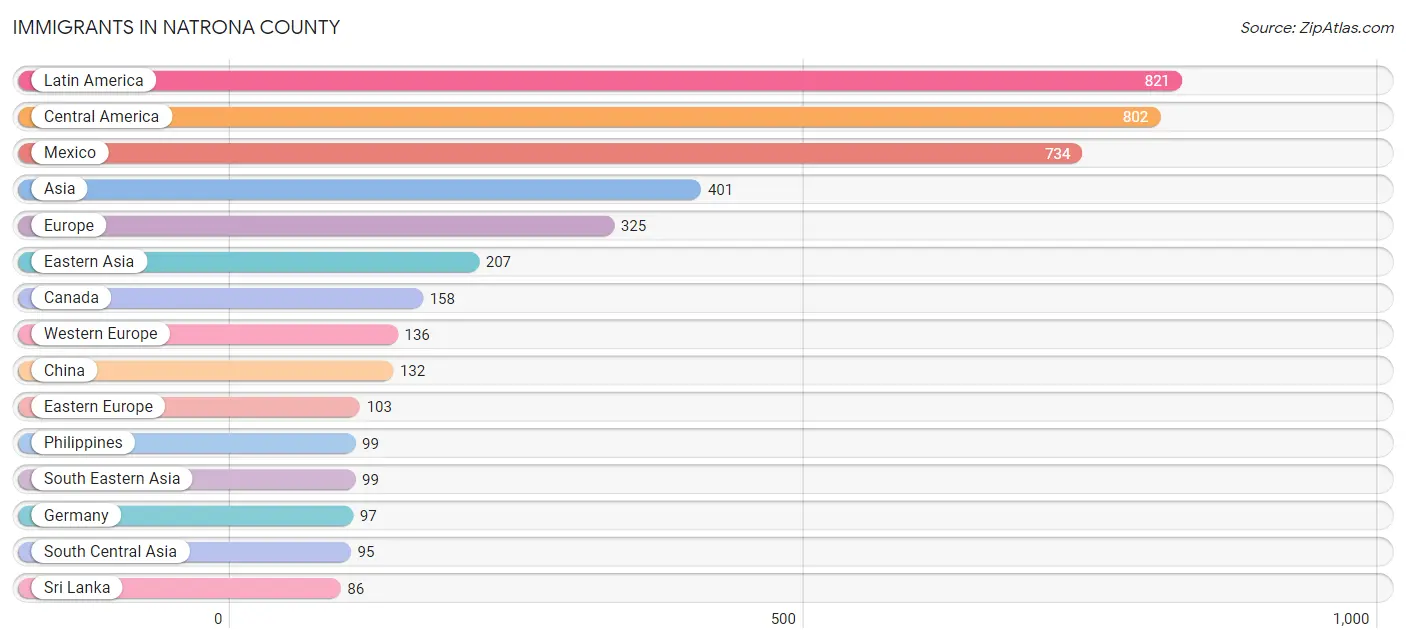
Immigrants in Natrona County
The most numerous immigrant groups reported in Natrona County came from Latin America (821 | 1.0%), Central America (802 | 1.0%), Mexico (734 | 0.9%), Asia (401 | 0.5%), and Europe (325 | 0.4%), together accounting for 3.9% of all Natrona County residents.
| Immigration Origin | # Population | % Population |
| Africa | 6 | 0.0% |
| Asia | 401 | 0.5% |
| Australia | 9 | 0.0% |
| Canada | 158 | 0.2% |
| Caribbean | 7 | 0.0% |
| Central America | 802 | 1.0% |
| China | 132 | 0.2% |
| Costa Rica | 32 | 0.0% |
| Croatia | 26 | 0.0% |
| Cuba | 7 | 0.0% |
| Denmark | 12 | 0.0% |
| Eastern Asia | 207 | 0.3% |
| Eastern Europe | 103 | 0.1% |
| El Salvador | 17 | 0.0% |
| England | 32 | 0.0% |
| Europe | 325 | 0.4% |
| France | 39 | 0.1% |
| Germany | 97 | 0.1% |
| Greece | 42 | 0.1% |
| Guatemala | 15 | 0.0% |
| Hong Kong | 11 | 0.0% |
| India | 9 | 0.0% |
| Japan | 66 | 0.1% |
| Korea | 9 | 0.0% |
| Latin America | 821 | 1.0% |
| Mexico | 734 | 0.9% |
| Morocco | 6 | 0.0% |
| Northern Africa | 6 | 0.0% |
| Northern Europe | 44 | 0.1% |
| Oceania | 9 | 0.0% |
| Panama | 4 | 0.0% |
| Philippines | 99 | 0.1% |
| Russia | 67 | 0.1% |
| South America | 12 | 0.0% |
| South Central Asia | 95 | 0.1% |
| South Eastern Asia | 99 | 0.1% |
| Southern Europe | 42 | 0.1% |
| Sri Lanka | 86 | 0.1% |
| Taiwan | 43 | 0.1% |
| Ukraine | 10 | 0.0% |
| Venezuela | 12 | 0.0% |
| Western Europe | 136 | 0.2% | View All 42 Rows |
Sex and Age in Natrona County
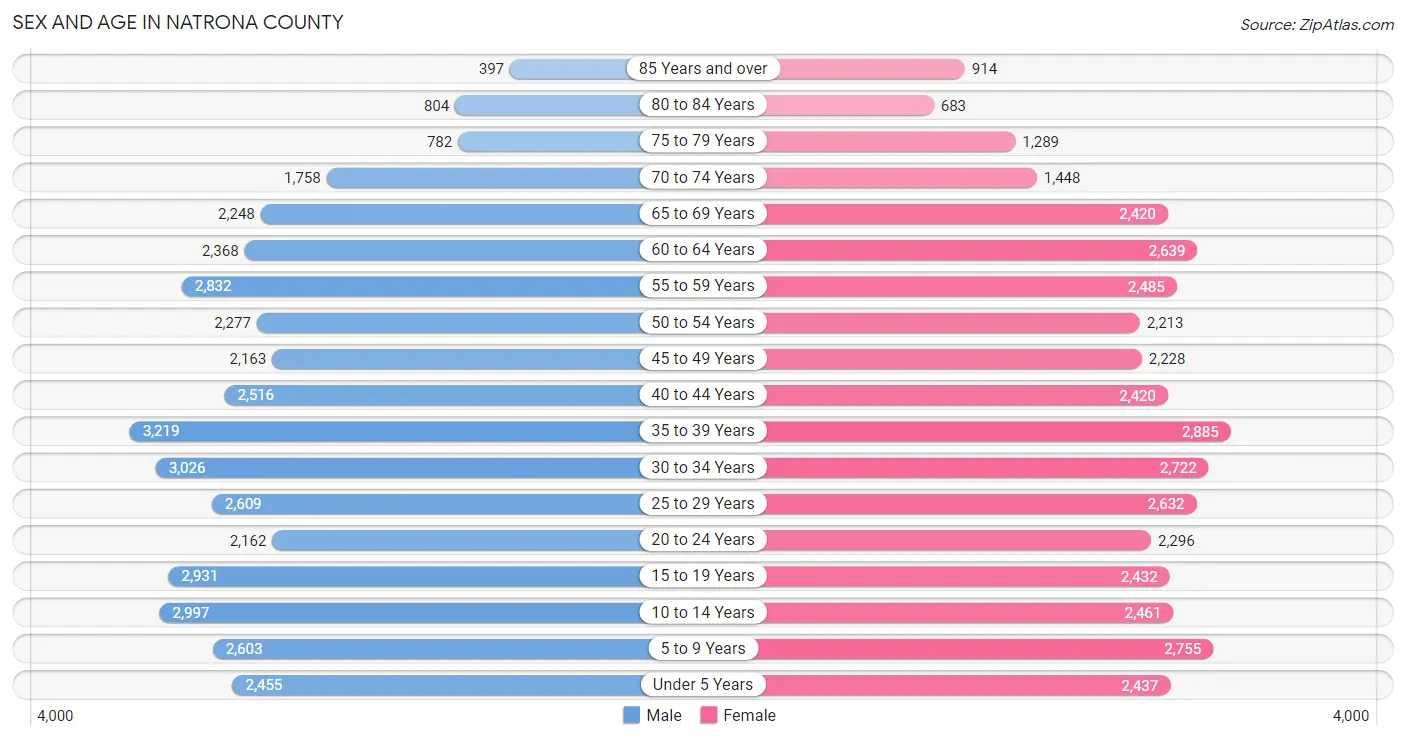
Sex and Age in Natrona County
The most populous age groups in Natrona County are 35 to 39 Years (3,219 | 8.0%) for men and 35 to 39 Years (2,885 | 7.3%) for women.
| Age Bracket | Male | Female |
| Under 5 Years | 2,455 (6.1%) | 2,437 (6.2%) |
| 5 to 9 Years | 2,603 (6.5%) | 2,755 (7.0%) |
| 10 to 14 Years | 2,997 (7.5%) | 2,461 (6.2%) |
| 15 to 19 Years | 2,931 (7.3%) | 2,432 (6.2%) |
| 20 to 24 Years | 2,162 (5.4%) | 2,296 (5.8%) |
| 25 to 29 Years | 2,609 (6.5%) | 2,632 (6.7%) |
| 30 to 34 Years | 3,026 (7.5%) | 2,722 (6.9%) |
| 35 to 39 Years | 3,219 (8.0%) | 2,885 (7.3%) |
| 40 to 44 Years | 2,516 (6.3%) | 2,420 (6.1%) |
| 45 to 49 Years | 2,163 (5.4%) | 2,228 (5.7%) |
| 50 to 54 Years | 2,277 (5.7%) | 2,213 (5.6%) |
| 55 to 59 Years | 2,832 (7.0%) | 2,485 (6.3%) |
| 60 to 64 Years | 2,368 (5.9%) | 2,639 (6.7%) |
| 65 to 69 Years | 2,248 (5.6%) | 2,420 (6.1%) |
| 70 to 74 Years | 1,758 (4.4%) | 1,448 (3.7%) |
| 75 to 79 Years | 782 (1.9%) | 1,289 (3.3%) |
| 80 to 84 Years | 804 (2.0%) | 683 (1.7%) |
| 85 Years and over | 397 (1.0%) | 914 (2.3%) |
| Total | 40,147 (100.0%) | 39,359 (100.0%) |
Families and Households in Natrona County
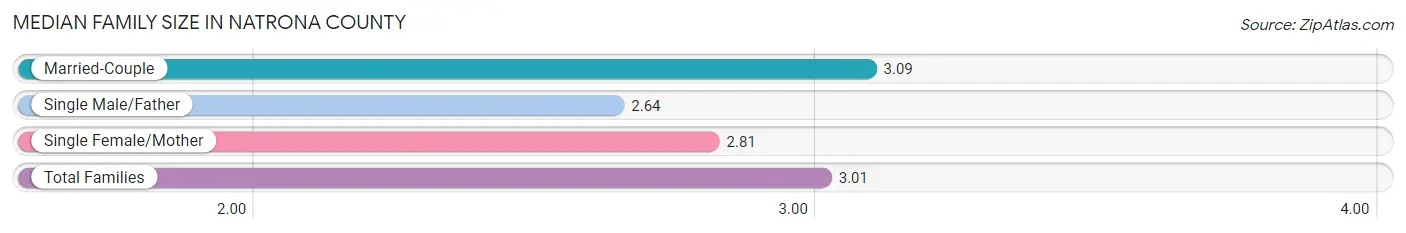
Median Family Size in Natrona County
The median family size in Natrona County is 3.01 persons per family, with married-couple families (15,576 | 75.9%) accounting for the largest median family size of 3.09 persons per family. On the other hand, single male/father families (1,643 | 8.0%) represent the smallest median family size with 2.64 persons per family.
| Family Type | # Families | Family Size |
| Married-Couple | 15,576 (75.9%) | 3.09 |
| Single Male/Father | 1,643 (8.0%) | 2.64 |
| Single Female/Mother | 3,298 (16.1%) | 2.81 |
| Total Families | 20,517 (100.0%) | 3.01 |
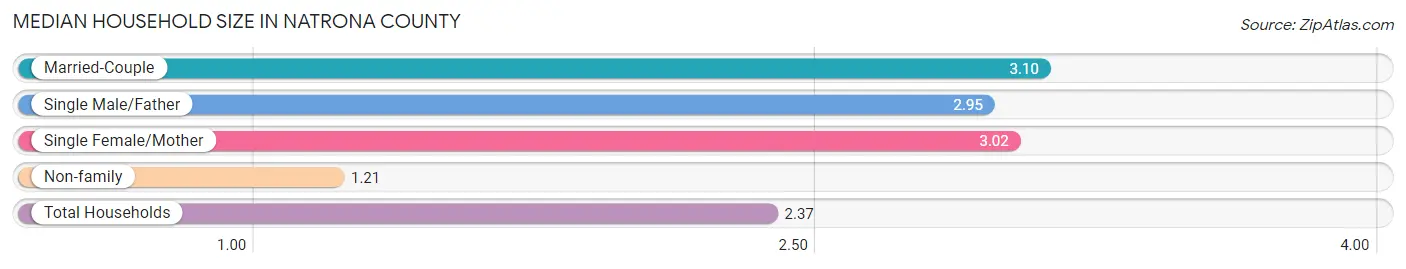
Median Household Size in Natrona County
The median household size in Natrona County is 2.37 persons per household, with married-couple households (15,576 | 47.3%) accounting for the largest median household size of 3.1 persons per household. non-family households (12,378 | 37.6%) represent the smallest median household size with 1.21 persons per household.
| Household Type | # Households | Household Size |
| Married-Couple | 15,576 (47.3%) | 3.10 |
| Single Male/Father | 1,643 (5.0%) | 2.95 |
| Single Female/Mother | 3,298 (10.0%) | 3.02 |
| Non-family | 12,378 (37.6%) | 1.21 |
| Total Households | 32,895 (100.0%) | 2.37 |
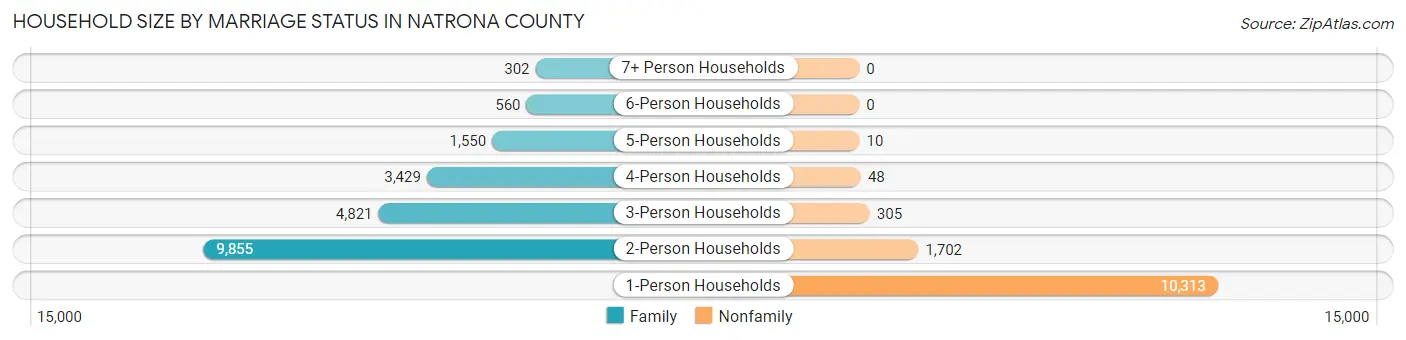
Household Size by Marriage Status in Natrona County
Out of a total of 32,895 households in Natrona County, 20,517 (62.4%) are family households, while 12,378 (37.6%) are nonfamily households. The most numerous type of family households are 2-person households, comprising 9,855, and the most common type of nonfamily households are 1-person households, comprising 10,313.
| Household Size | Family Households | Nonfamily Households |
| 1-Person Households | - | 10,313 (31.4%) |
| 2-Person Households | 9,855 (30.0%) | 1,702 (5.2%) |
| 3-Person Households | 4,821 (14.7%) | 305 (0.9%) |
| 4-Person Households | 3,429 (10.4%) | 48 (0.2%) |
| 5-Person Households | 1,550 (4.7%) | 10 (0.0%) |
| 6-Person Households | 560 (1.7%) | 0 (0.0%) |
| 7+ Person Households | 302 (0.9%) | 0 (0.0%) |
| Total | 20,517 (62.4%) | 12,378 (37.6%) |
Female Fertility in Natrona County
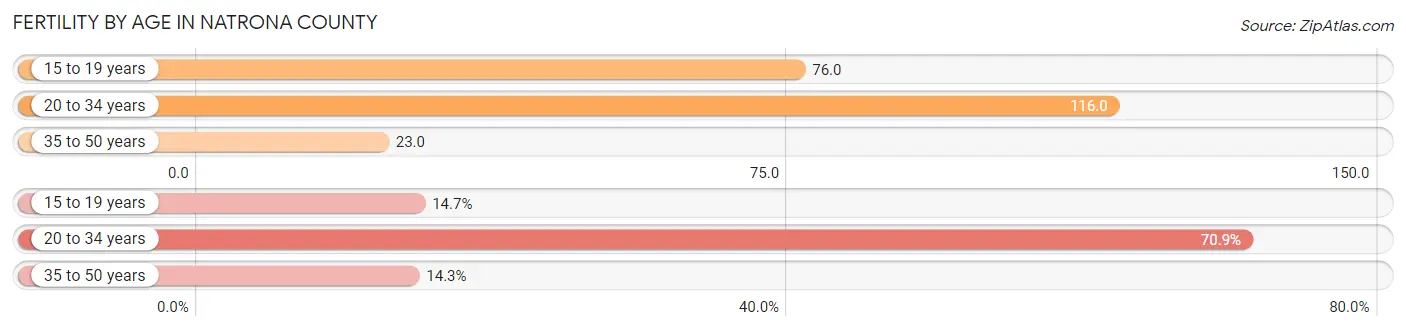
Fertility by Age in Natrona County
Average fertility rate in Natrona County is 69.0 births per 1,000 women. Women in the age bracket of 20 to 34 years have the highest fertility rate with 116.0 births per 1,000 women. Women in the age bracket of 20 to 34 years acount for 70.9% of all women with births.
| Age Bracket | Women with Births | Births / 1,000 Women |
| 15 to 19 years | 184 (14.7%) | 76.0 |
| 20 to 34 years | 885 (70.9%) | 116.0 |
| 35 to 50 years | 179 (14.3%) | 23.0 |
| Total | 1,248 (100.0%) | 69.0 |
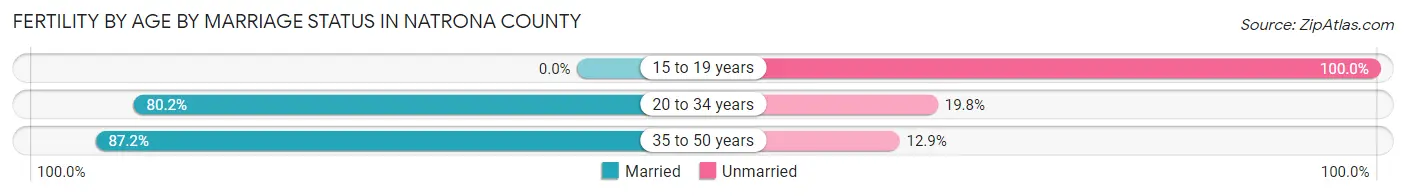
Fertility by Age by Marriage Status in Natrona County
69.4% of women with births (1,248) in Natrona County are married. The highest percentage of unmarried women with births falls into 15 to 19 years age bracket with 100.0% of them unmarried at the time of birth, while the lowest percentage of unmarried women with births belong to 35 to 50 years age bracket with 12.8% of them unmarried.
| Age Bracket | Married | Unmarried |
| 15 to 19 years | 0 (0.0%) | 184 (100.0%) |
| 20 to 34 years | 710 (80.2%) | 175 (19.8%) |
| 35 to 50 years | 156 (87.2%) | 23 (12.9%) |
| Total | 866 (69.4%) | 382 (30.6%) |
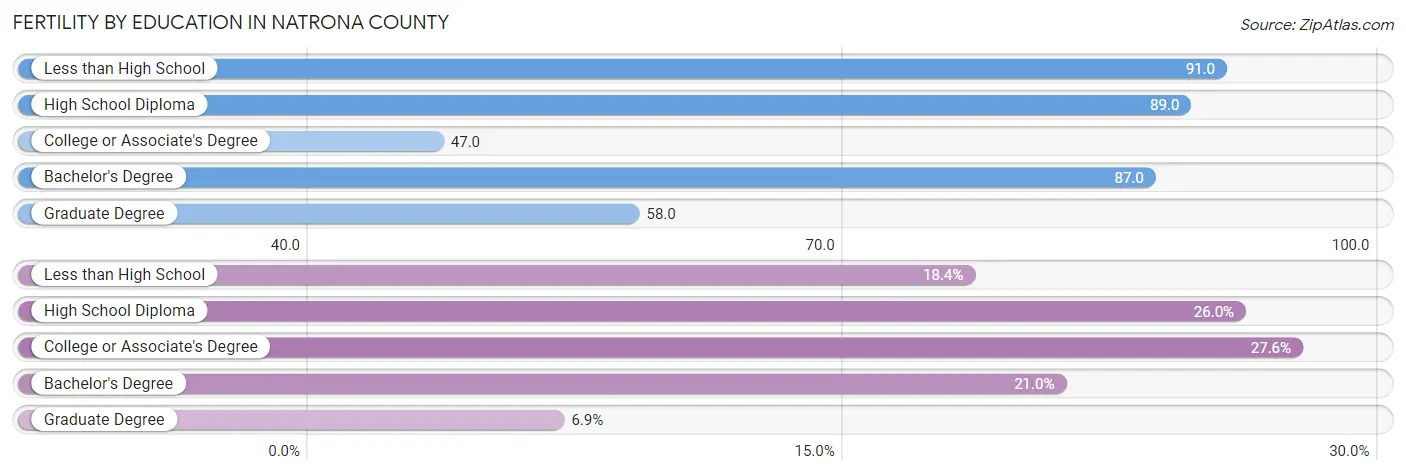
Fertility by Education in Natrona County
Average fertility rate in Natrona County is 69.0 births per 1,000 women. Women with the education attainment of less than high school have the highest fertility rate of 91.0 births per 1,000 women, while women with the education attainment of college or associate's degree have the lowest fertility at 47.0 births per 1,000 women. Women with the education attainment of college or associate's degree represent 27.6% of all women with births.
| Educational Attainment | Women with Births | Births / 1,000 Women |
| Less than High School | 230 (18.4%) | 91.0 |
| High School Diploma | 325 (26.0%) | 89.0 |
| College or Associate's Degree | 345 (27.6%) | 47.0 |
| Bachelor's Degree | 262 (21.0%) | 87.0 |
| Graduate Degree | 86 (6.9%) | 58.0 |
| Total | 1,248 (100.0%) | 69.0 |
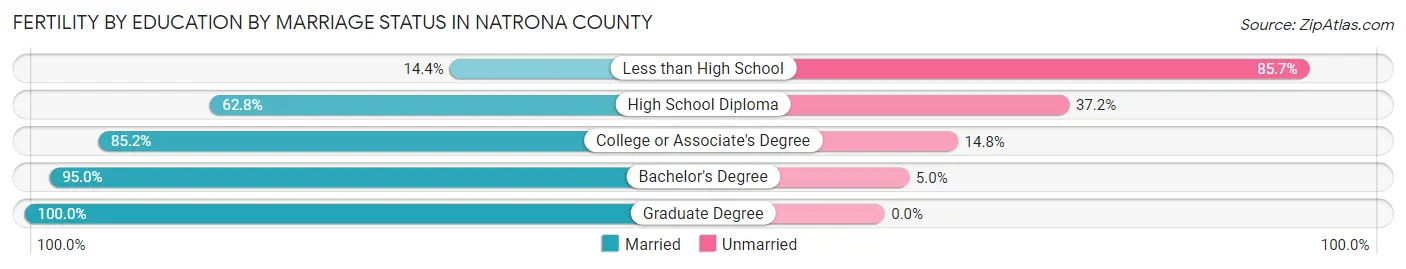
Fertility by Education by Marriage Status in Natrona County
30.6% of women with births in Natrona County are unmarried. Women with the educational attainment of graduate degree are most likely to be married with 100.0% of them married at childbirth, while women with the educational attainment of less than high school are least likely to be married with 85.7% of them unmarried at childbirth.
| Educational Attainment | Married | Unmarried |
| Less than High School | 33 (14.3%) | 197 (85.7%) |
| High School Diploma | 204 (62.8%) | 121 (37.2%) |
| College or Associate's Degree | 294 (85.2%) | 51 (14.8%) |
| Bachelor's Degree | 249 (95.0%) | 13 (5.0%) |
| Graduate Degree | 86 (100.0%) | 0 (0.0%) |
| Total | 866 (69.4%) | 382 (30.6%) |
Income in Natrona County
Income Overview in Natrona County
Per Capita Income in Natrona County is $40,346, while median incomes of families and households are $88,465 and $69,104 respectively.
| Characteristic | Number | Measure |
| Per Capita Income | 79,506 | $40,346 |
| Median Family Income | 20,517 | $88,465 |
| Mean Family Income | 20,517 | $112,980 |
| Median Household Income | 32,895 | $69,104 |
| Mean Household Income | 32,895 | $94,128 |
| Income Deficit | 20,517 | $10,306 |
| Wage / Income Gap (%) | 79,506 | 34.44% |
| Wage / Income Gap ($) | 79,506 | 65.56¢ per $1 |
| Gini / Inequality Index | 79,506 | 0.44 |
Earnings by Sex in Natrona County
Average Earnings in Natrona County are $41,776, $51,232 for men and $33,586 for women, a difference of 34.4%.
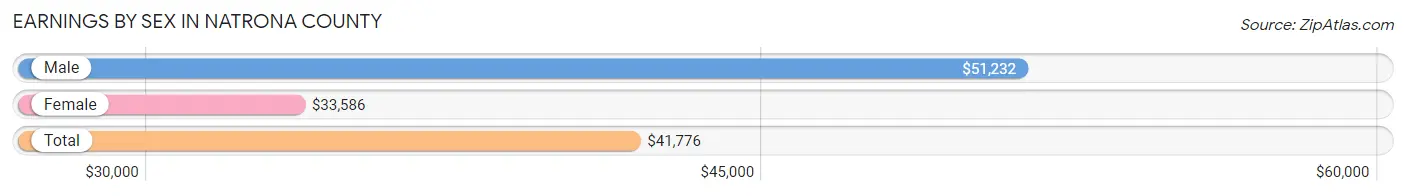
| Sex | Number | Average Earnings |
| Male | 24,254 (54.2%) | $51,232 |
| Female | 20,506 (45.8%) | $33,586 |
| Total | 44,760 (100.0%) | $41,776 |
Earnings by Sex by Income Bracket in Natrona County
The most common earnings brackets in Natrona County are $100,000+ for men (3,968 | 16.4%) and $55,000 to $64,999 for women (1,858 | 9.1%).
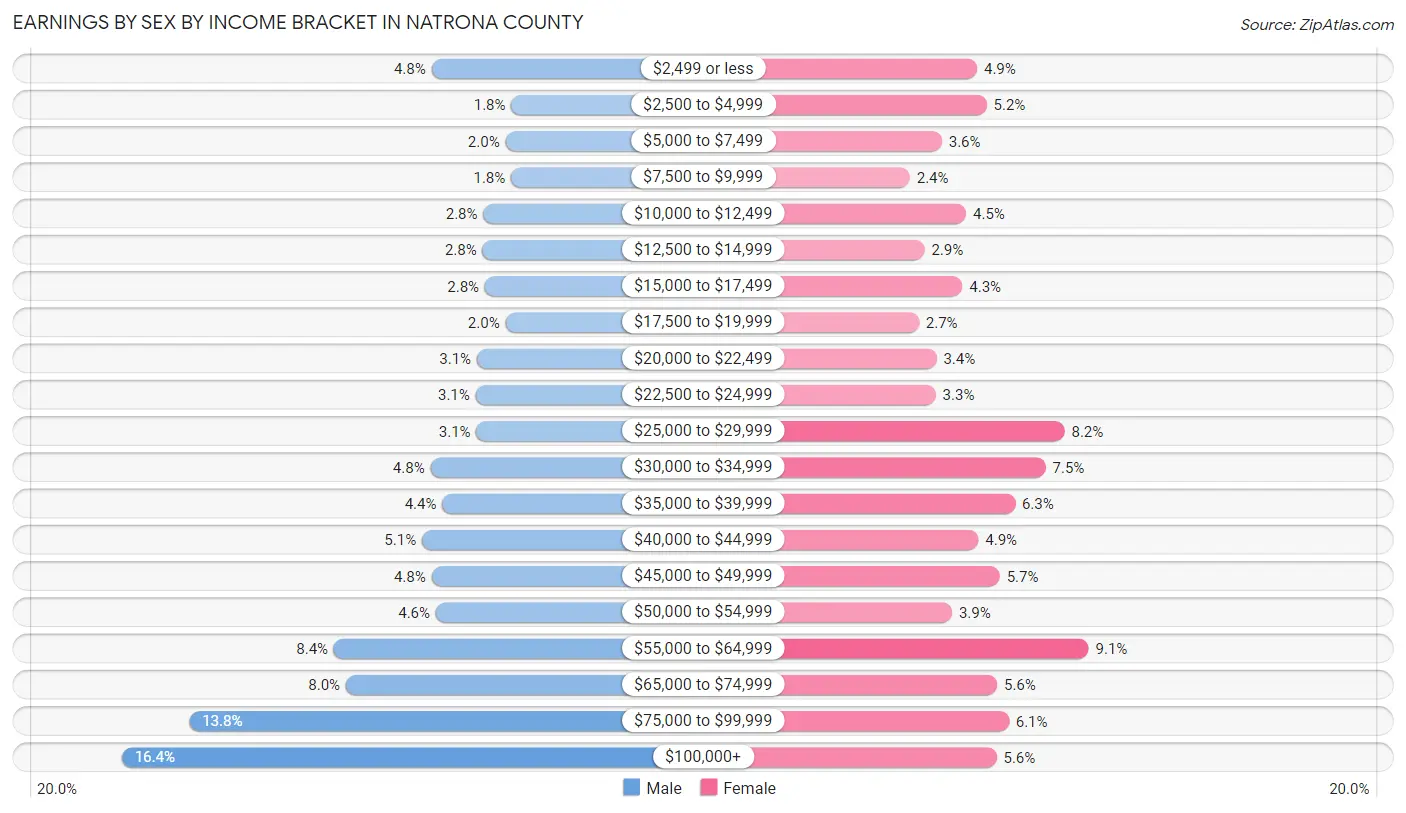
| Income | Male | Female |
| $2,499 or less | 1,151 (4.8%) | 1,000 (4.9%) |
| $2,500 to $4,999 | 428 (1.8%) | 1,074 (5.2%) |
| $5,000 to $7,499 | 481 (2.0%) | 730 (3.6%) |
| $7,500 to $9,999 | 430 (1.8%) | 483 (2.4%) |
| $10,000 to $12,499 | 681 (2.8%) | 917 (4.5%) |
| $12,500 to $14,999 | 690 (2.8%) | 597 (2.9%) |
| $15,000 to $17,499 | 666 (2.8%) | 888 (4.3%) |
| $17,500 to $19,999 | 481 (2.0%) | 554 (2.7%) |
| $20,000 to $22,499 | 739 (3.0%) | 688 (3.4%) |
| $22,500 to $24,999 | 751 (3.1%) | 683 (3.3%) |
| $25,000 to $29,999 | 744 (3.1%) | 1,673 (8.2%) |
| $30,000 to $34,999 | 1,162 (4.8%) | 1,527 (7.4%) |
| $35,000 to $39,999 | 1,054 (4.3%) | 1,291 (6.3%) |
| $40,000 to $44,999 | 1,240 (5.1%) | 1,011 (4.9%) |
| $45,000 to $49,999 | 1,152 (4.8%) | 1,175 (5.7%) |
| $50,000 to $54,999 | 1,113 (4.6%) | 808 (3.9%) |
| $55,000 to $64,999 | 2,039 (8.4%) | 1,858 (9.1%) |
| $65,000 to $74,999 | 1,930 (8.0%) | 1,154 (5.6%) |
| $75,000 to $99,999 | 3,354 (13.8%) | 1,245 (6.1%) |
| $100,000+ | 3,968 (16.4%) | 1,150 (5.6%) |
| Total | 24,254 (100.0%) | 20,506 (100.0%) |
Earnings by Sex by Educational Attainment in Natrona County
Average earnings in Natrona County are $57,660 for men and $38,349 for women, a difference of 33.5%. Men with an educational attainment of graduate degree enjoy the highest average annual earnings of $95,189, while those with less than high school education earn the least with $43,653. Women with an educational attainment of graduate degree earn the most with the average annual earnings of $70,617, while those with less than high school education have the smallest earnings of $23,676.
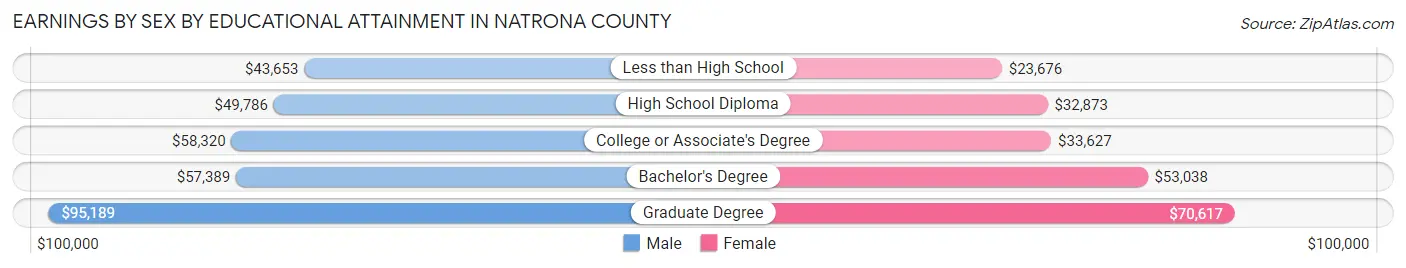
| Educational Attainment | Male Income | Female Income |
| Less than High School | $43,653 | $23,676 |
| High School Diploma | $49,786 | $32,873 |
| College or Associate's Degree | $58,320 | $33,627 |
| Bachelor's Degree | $57,389 | $53,038 |
| Graduate Degree | $95,189 | $70,617 |
| Total | $57,660 | $38,349 |
Family Income in Natrona County
Family Income Brackets in Natrona County
According to the Natrona County family income data, there are 4,432 families falling into the $100,000 to $149,999 income range, which is the most common income bracket and makes up 21.6% of all families. Conversely, the $10,000 to $14,999 income bracket is the least frequent group with only 246 families (1.2%) belonging to this category.
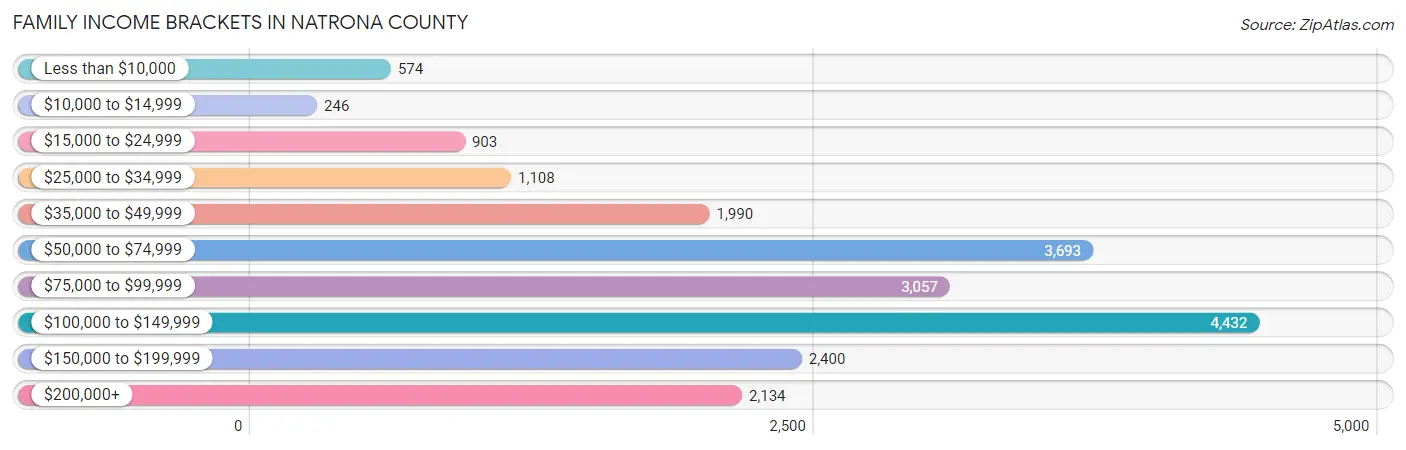
| Income Bracket | # Families | % Families |
| Less than $10,000 | 574 | 2.8% |
| $10,000 to $14,999 | 246 | 1.2% |
| $15,000 to $24,999 | 903 | 4.4% |
| $25,000 to $34,999 | 1,108 | 5.4% |
| $35,000 to $49,999 | 1,990 | 9.7% |
| $50,000 to $74,999 | 3,693 | 18.0% |
| $75,000 to $99,999 | 3,057 | 14.9% |
| $100,000 to $149,999 | 4,432 | 21.6% |
| $150,000 to $199,999 | 2,400 | 11.7% |
| $200,000+ | 2,134 | 10.4% |
Family Income by Famaliy Size in Natrona County
5-person families (1,444 | 7.0%) account for the highest median family income in Natrona County with $115,398 per family, while 2-person families (10,508 | 51.2%) have the highest median income of $39,406 per family member.
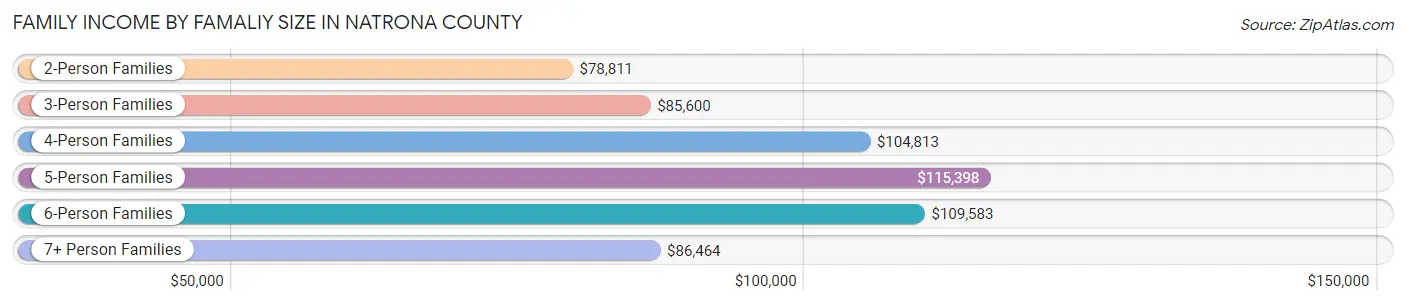
| Income Bracket | # Families | Median Income |
| 2-Person Families | 10,508 (51.2%) | $78,811 |
| 3-Person Families | 4,558 (22.2%) | $85,600 |
| 4-Person Families | 3,201 (15.6%) | $104,813 |
| 5-Person Families | 1,444 (7.0%) | $115,398 |
| 6-Person Families | 537 (2.6%) | $109,583 |
| 7+ Person Families | 269 (1.3%) | $86,464 |
| Total | 20,517 (100.0%) | $88,465 |
Family Income by Number of Earners in Natrona County
The median family income in Natrona County is $88,465, with families comprising 3+ earners (1,774) having the highest median family income of $142,500, while families with no earners (2,378) have the lowest median family income of $49,632, accounting for 8.6% and 11.6% of families, respectively.
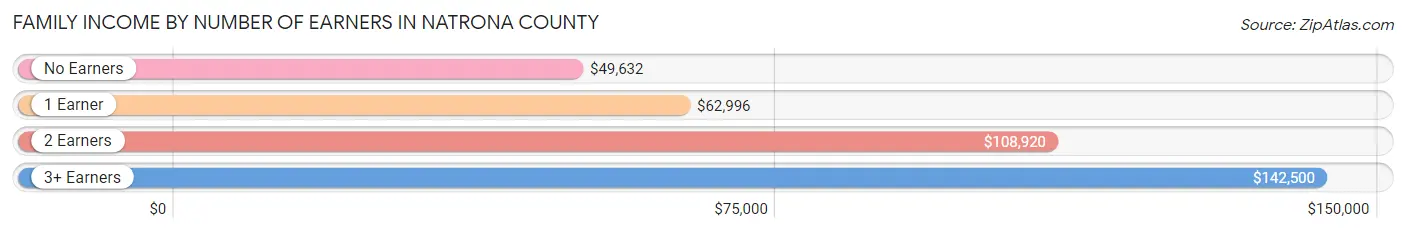
| Number of Earners | # Families | Median Income |
| No Earners | 2,378 (11.6%) | $49,632 |
| 1 Earner | 7,110 (34.6%) | $62,996 |
| 2 Earners | 9,255 (45.1%) | $108,920 |
| 3+ Earners | 1,774 (8.6%) | $142,500 |
| Total | 20,517 (100.0%) | $88,465 |
Household Income in Natrona County
Household Income Brackets in Natrona County
With 6,579 households falling in the category, the $50,000 to $74,999 income range is the most frequent in Natrona County, accounting for 20.0% of all households. In contrast, only 888 households (2.7%) fall into the $10,000 to $14,999 income bracket, making it the least populous group.
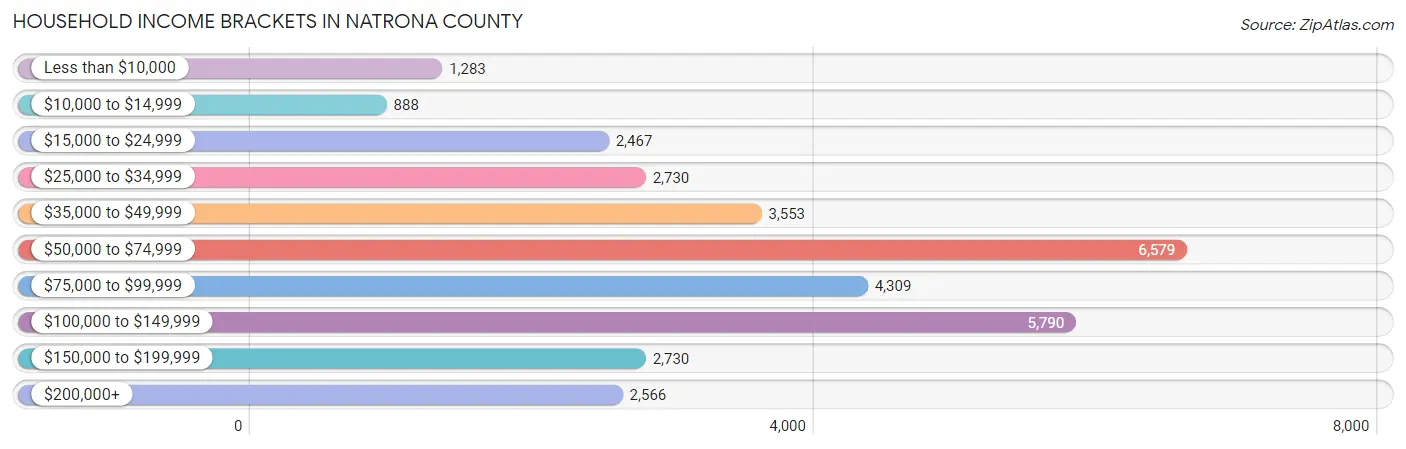
| Income Bracket | # Households | % Households |
| Less than $10,000 | 1,283 | 3.9% |
| $10,000 to $14,999 | 888 | 2.7% |
| $15,000 to $24,999 | 2,467 | 7.5% |
| $25,000 to $34,999 | 2,730 | 8.3% |
| $35,000 to $49,999 | 3,553 | 10.8% |
| $50,000 to $74,999 | 6,579 | 20.0% |
| $75,000 to $99,999 | 4,309 | 13.1% |
| $100,000 to $149,999 | 5,790 | 17.6% |
| $150,000 to $199,999 | 2,730 | 8.3% |
| $200,000+ | 2,566 | 7.8% |
Household Income by Householder Age in Natrona County
The median household income in Natrona County is $69,104, with the highest median household income of $91,647 found in the 45 to 64 years age bracket for the primary householder. A total of 10,833 households (32.9%) fall into this category. Meanwhile, the 15 to 24 years age bracket for the primary householder has the lowest median household income of $38,178, with 1,798 households (5.5%) in this group.
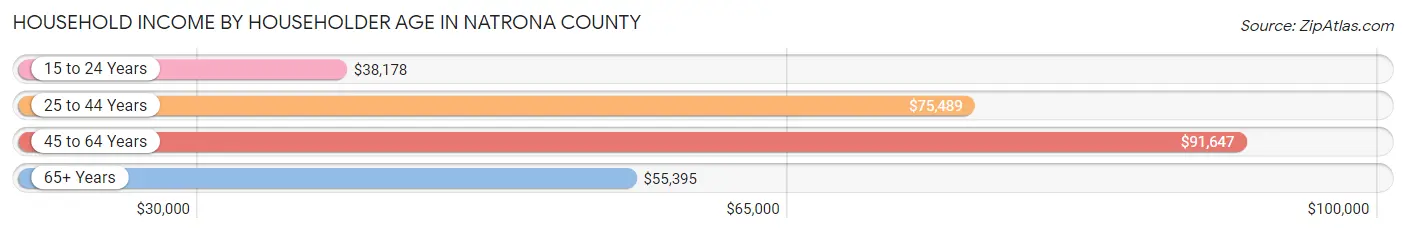
| Income Bracket | # Households | Median Income |
| 15 to 24 Years | 1,798 (5.5%) | $38,178 |
| 25 to 44 Years | 11,846 (36.0%) | $75,489 |
| 45 to 64 Years | 10,833 (32.9%) | $91,647 |
| 65+ Years | 8,418 (25.6%) | $55,395 |
| Total | 32,895 (100.0%) | $69,104 |
Poverty in Natrona County
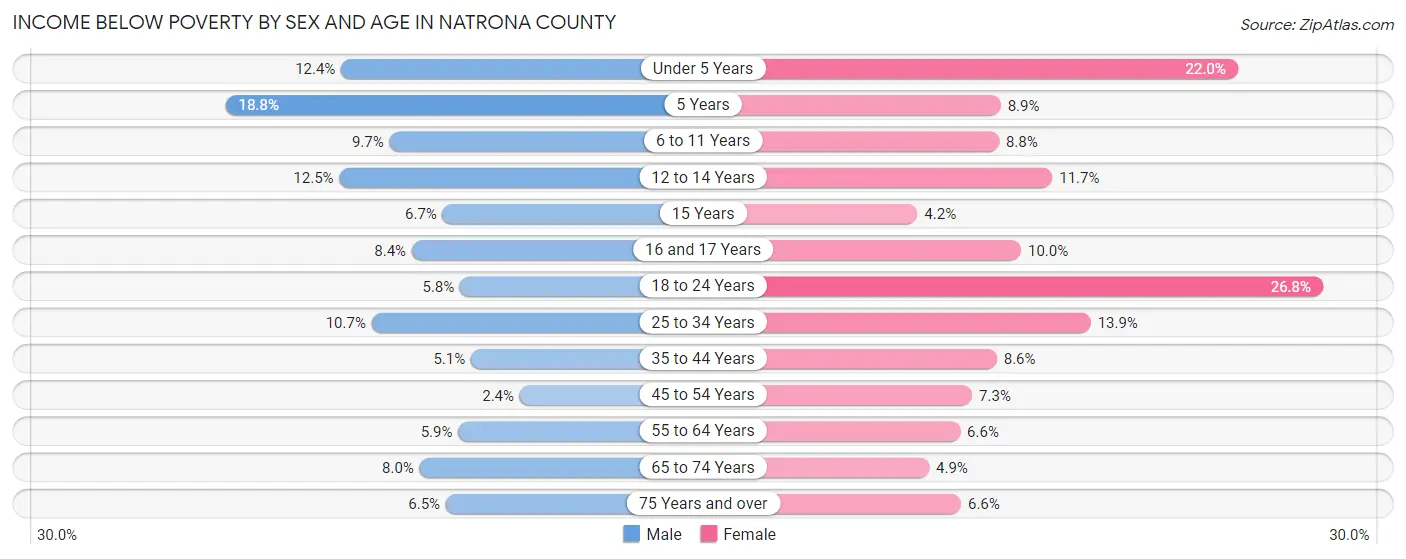
Income Below Poverty by Sex and Age in Natrona County
With 7.5% poverty level for males and 10.7% for females among the residents of Natrona County, 5 year old males and 18 to 24 year old females are the most vulnerable to poverty, with 85 males (18.8%) and 793 females (26.8%) in their respective age groups living below the poverty level.
| Age Bracket | Male | Female |
| Under 5 Years | 299 (12.4%) | 533 (22.0%) |
| 5 Years | 85 (18.8%) | 33 (8.8%) |
| 6 to 11 Years | 309 (9.7%) | 290 (8.7%) |
| 12 to 14 Years | 234 (12.5%) | 164 (11.7%) |
| 15 Years | 37 (6.7%) | 25 (4.2%) |
| 16 and 17 Years | 97 (8.4%) | 96 (10.0%) |
| 18 to 24 Years | 180 (5.8%) | 793 (26.8%) |
| 25 to 34 Years | 591 (10.7%) | 739 (13.9%) |
| 35 to 44 Years | 289 (5.1%) | 457 (8.6%) |
| 45 to 54 Years | 106 (2.4%) | 322 (7.3%) |
| 55 to 64 Years | 301 (5.9%) | 335 (6.6%) |
| 65 to 74 Years | 315 (8.0%) | 185 (4.9%) |
| 75 Years and over | 126 (6.5%) | 179 (6.6%) |
| Total | 2,969 (7.5%) | 4,151 (10.7%) |
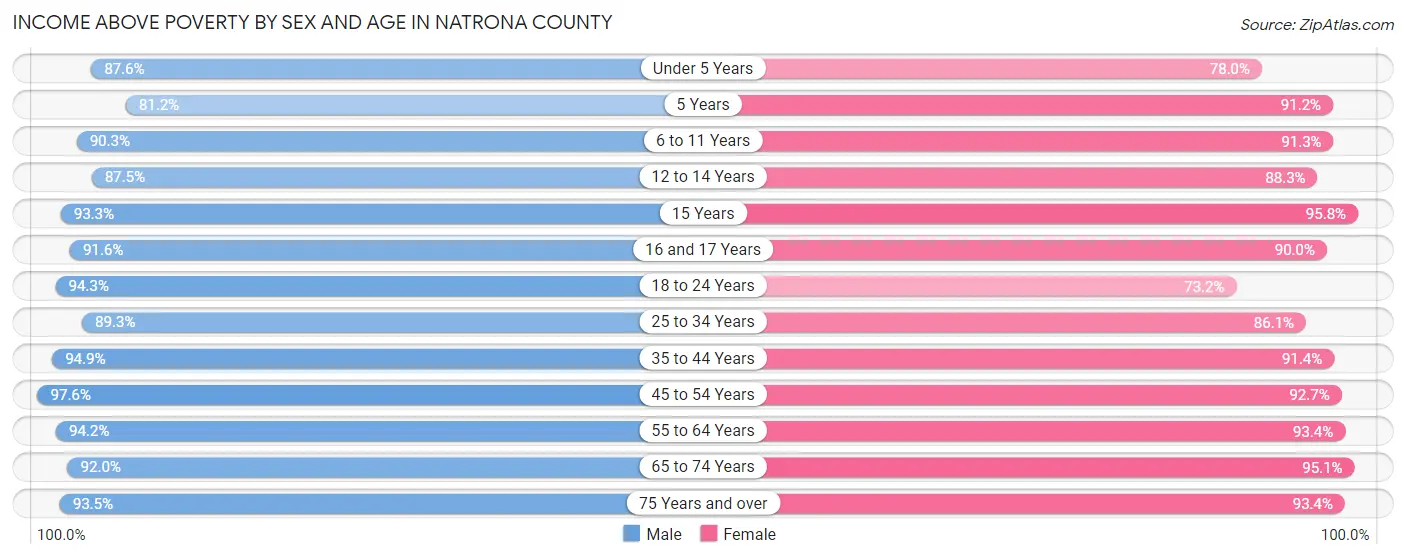
Income Above Poverty by Sex and Age in Natrona County
According to the poverty statistics in Natrona County, males aged 45 to 54 years and females aged 15 years are the age groups that are most secure financially, with 97.6% of males and 95.8% of females in these age groups living above the poverty line.
| Age Bracket | Male | Female |
| Under 5 Years | 2,118 (87.6%) | 1,885 (78.0%) |
| 5 Years | 367 (81.2%) | 340 (91.1%) |
| 6 to 11 Years | 2,884 (90.3%) | 3,026 (91.2%) |
| 12 to 14 Years | 1,642 (87.5%) | 1,235 (88.3%) |
| 15 Years | 514 (93.3%) | 569 (95.8%) |
| 16 and 17 Years | 1,053 (91.6%) | 866 (90.0%) |
| 18 to 24 Years | 2,948 (94.3%) | 2,168 (73.2%) |
| 25 to 34 Years | 4,950 (89.3%) | 4,594 (86.1%) |
| 35 to 44 Years | 5,338 (94.9%) | 4,839 (91.4%) |
| 45 to 54 Years | 4,282 (97.6%) | 4,112 (92.7%) |
| 55 to 64 Years | 4,848 (94.2%) | 4,746 (93.4%) |
| 65 to 74 Years | 3,624 (92.0%) | 3,619 (95.1%) |
| 75 Years and over | 1,802 (93.5%) | 2,517 (93.4%) |
| Total | 36,370 (92.4%) | 34,516 (89.3%) |
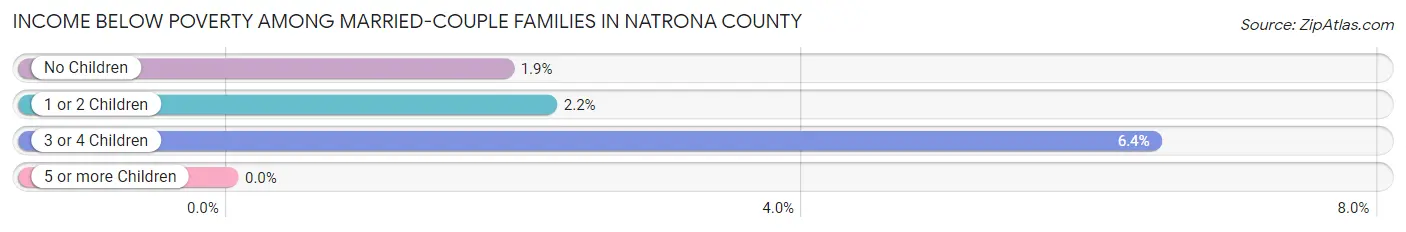
Income Below Poverty Among Married-Couple Families in Natrona County
The poverty statistics for married-couple families in Natrona County show that 2.5% or 387 of the total 15,576 families live below the poverty line. Families with 3 or 4 children have the highest poverty rate of 6.4%, comprising of 111 families. On the other hand, families with 5 or more children have the lowest poverty rate of 0.0%, which includes 0 families.
| Children | Above Poverty | Below Poverty |
| No Children | 9,244 (98.1%) | 181 (1.9%) |
| 1 or 2 Children | 4,186 (97.8%) | 95 (2.2%) |
| 3 or 4 Children | 1,614 (93.6%) | 111 (6.4%) |
| 5 or more Children | 145 (100.0%) | 0 (0.0%) |
| Total | 15,189 (97.5%) | 387 (2.5%) |
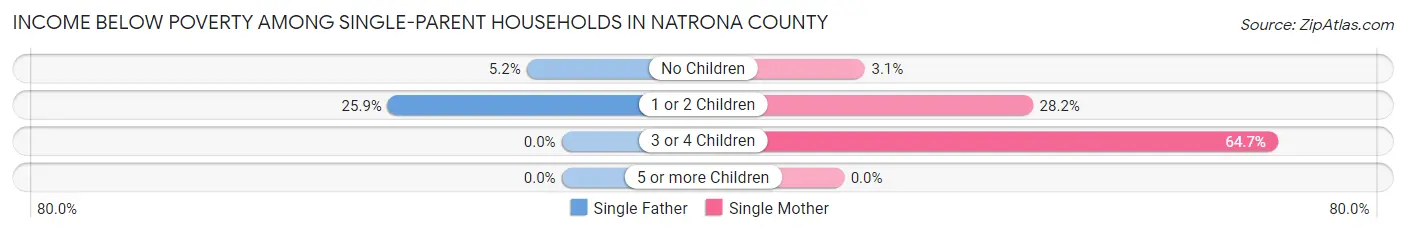
Income Below Poverty Among Single-Parent Households in Natrona County
According to the poverty data in Natrona County, 16.9% or 277 single-father households and 22.3% or 735 single-mother households are living below the poverty line. Among single-father households, those with 1 or 2 children have the highest poverty rate, with 244 households (25.9%) experiencing poverty. Likewise, among single-mother households, those with 3 or 4 children have the highest poverty rate, with 86 households (64.7%) falling below the poverty line.
| Children | Single Father | Single Mother |
| No Children | 33 (5.2%) | 28 (3.1%) |
| 1 or 2 Children | 244 (25.9%) | 621 (28.2%) |
| 3 or 4 Children | 0 (0.0%) | 86 (64.7%) |
| 5 or more Children | 0 (0.0%) | 0 (0.0%) |
| Total | 277 (16.9%) | 735 (22.3%) |
Income Below Poverty Among Married-Couple vs Single-Parent Households in Natrona County
The poverty data for Natrona County shows that 387 of the married-couple family households (2.5%) and 1,012 of the single-parent households (20.5%) are living below the poverty level. Within the married-couple family households, those with 3 or 4 children have the highest poverty rate, with 111 households (6.4%) falling below the poverty line. Among the single-parent households, those with 3 or 4 children have the highest poverty rate, with 86 household (43.0%) living below poverty.
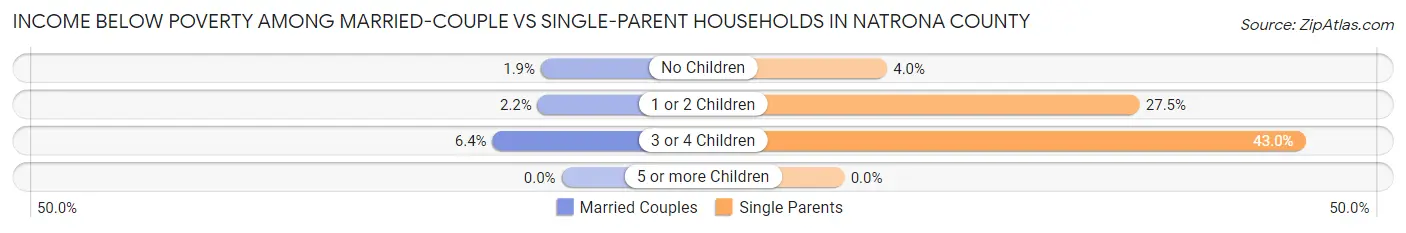
| Children | Married-Couple Families | Single-Parent Households |
| No Children | 181 (1.9%) | 61 (4.0%) |
| 1 or 2 Children | 95 (2.2%) | 865 (27.5%) |
| 3 or 4 Children | 111 (6.4%) | 86 (43.0%) |
| 5 or more Children | 0 (0.0%) | 0 (0.0%) |
| Total | 387 (2.5%) | 1,012 (20.5%) |
Employment Characteristics in Natrona County
Employment by Class of Employer in Natrona County
Among the 40,190 employed individuals in Natrona County, private company employees (26,150 | 65.1%), local government employees (3,881 | 9.7%), and not-for-profit organizations (2,873 | 7.1%) make up the most common classes of employment.
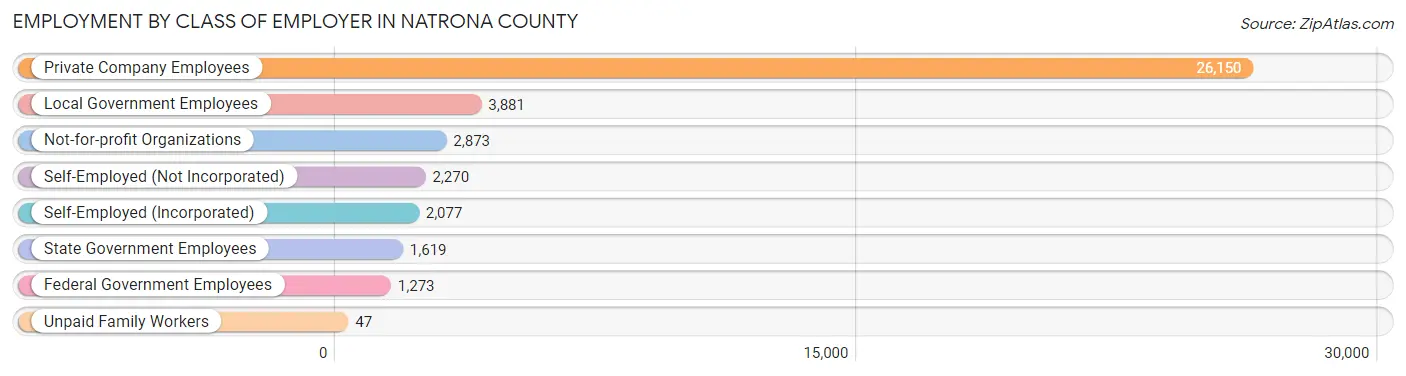
| Employer Class | # Employees | % Employees |
| Private Company Employees | 26,150 | 65.1% |
| Self-Employed (Incorporated) | 2,077 | 5.2% |
| Self-Employed (Not Incorporated) | 2,270 | 5.7% |
| Not-for-profit Organizations | 2,873 | 7.1% |
| Local Government Employees | 3,881 | 9.7% |
| State Government Employees | 1,619 | 4.0% |
| Federal Government Employees | 1,273 | 3.2% |
| Unpaid Family Workers | 47 | 0.1% |
| Total | 40,190 | 100.0% |
Employment Status by Age in Natrona County
According to the labor force statistics for Natrona County, out of the total population over 16 years of age (62,646), 67.5% or 42,286 individuals are in the labor force, with 3.5% or 1,480 of them unemployed. The age group with the highest labor force participation rate is 35 to 44 years, with 90.4% or 9,980 individuals in the labor force. Within the labor force, the 16 to 19 years age range has the highest percentage of unemployed individuals, with 6.9% or 161 of them being unemployed.

| Age Bracket | In Labor Force | Unemployed |
| 16 to 19 Years | 2,333 (55.4%) | 161 (6.9%) |
| 20 to 24 Years | 3,428 (76.9%) | 230 (6.7%) |
| 25 to 29 Years | 4,308 (82.2%) | 52 (1.2%) |
| 30 to 34 Years | 4,961 (86.3%) | 94 (1.9%) |
| 35 to 44 Years | 9,980 (90.4%) | 289 (2.9%) |
| 45 to 54 Years | 7,549 (85.0%) | 287 (3.8%) |
| 55 to 59 Years | 4,094 (77.0%) | 135 (3.3%) |
| 60 to 64 Years | 3,024 (60.4%) | 97 (3.2%) |
| 65 to 74 Years | 2,252 (28.6%) | 128 (5.7%) |
| 75 Years and over | 341 (7.0%) | 0 (0.0%) |
| Total | 42,286 (67.5%) | 1,480 (3.5%) |
Employment Status by Educational Attainment in Natrona County
According to labor force statistics for Natrona County, 82.3% of individuals (33,936) out of the total population between 25 and 64 years of age (41,234) are in the labor force, with 2.8% or 950 of them being unemployed. The group with the highest labor force participation rate are those with the educational attainment of bachelor's degree or higher, with 87.1% or 9,208 individuals in the labor force. Within the labor force, individuals with less than high school education have the highest percentage of unemployment, with 8.8% or 159 of them being unemployed.
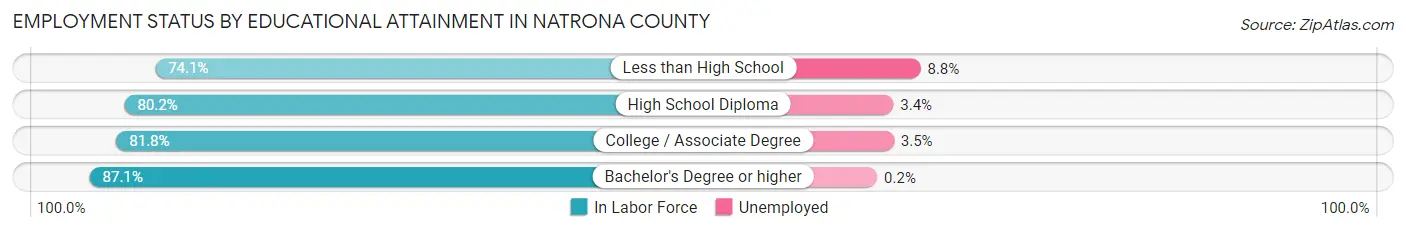
| Educational Attainment | In Labor Force | Unemployed |
| Less than High School | 1,803 (74.1%) | 214 (8.8%) |
| High School Diploma | 8,998 (80.2%) | 381 (3.4%) |
| College / Associate Degree | 13,913 (81.8%) | 595 (3.5%) |
| Bachelor's Degree or higher | 9,208 (87.1%) | 21 (0.2%) |
| Total | 33,936 (82.3%) | 1,155 (2.8%) |
Employment Occupations by Sex in Natrona County
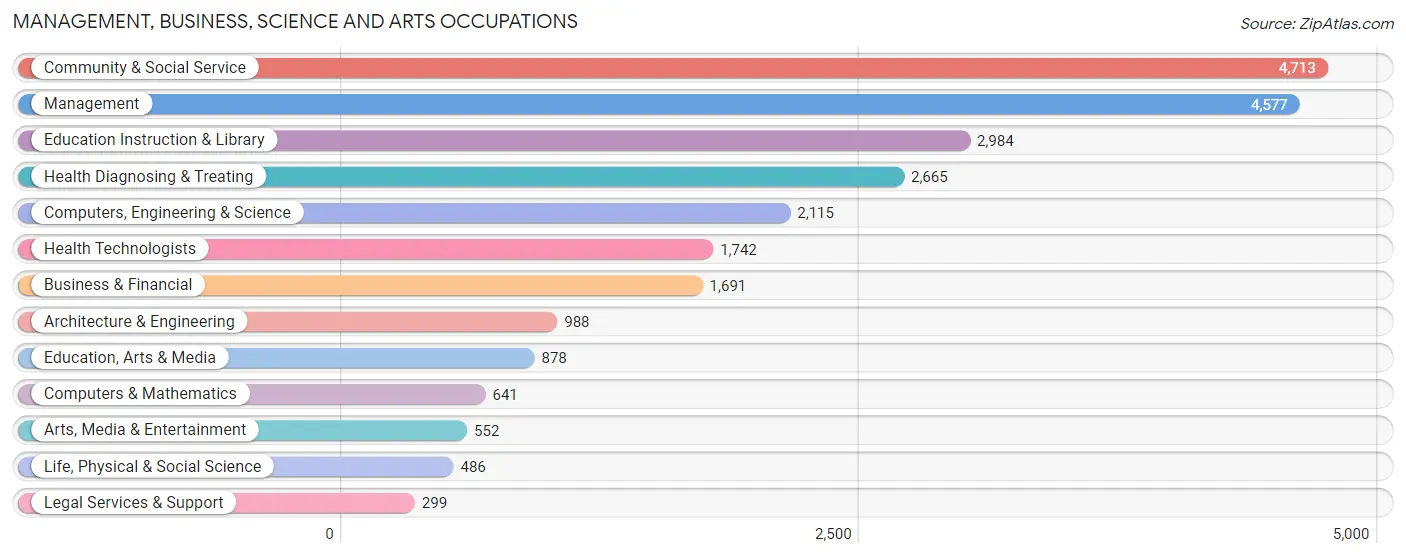
Management, Business, Science and Arts Occupations
The most common Management, Business, Science and Arts occupations in Natrona County are Community & Social Service (4,713 | 11.6%), Management (4,577 | 11.3%), Education Instruction & Library (2,984 | 7.3%), Health Diagnosing & Treating (2,665 | 6.6%), and Computers, Engineering & Science (2,115 | 5.2%).
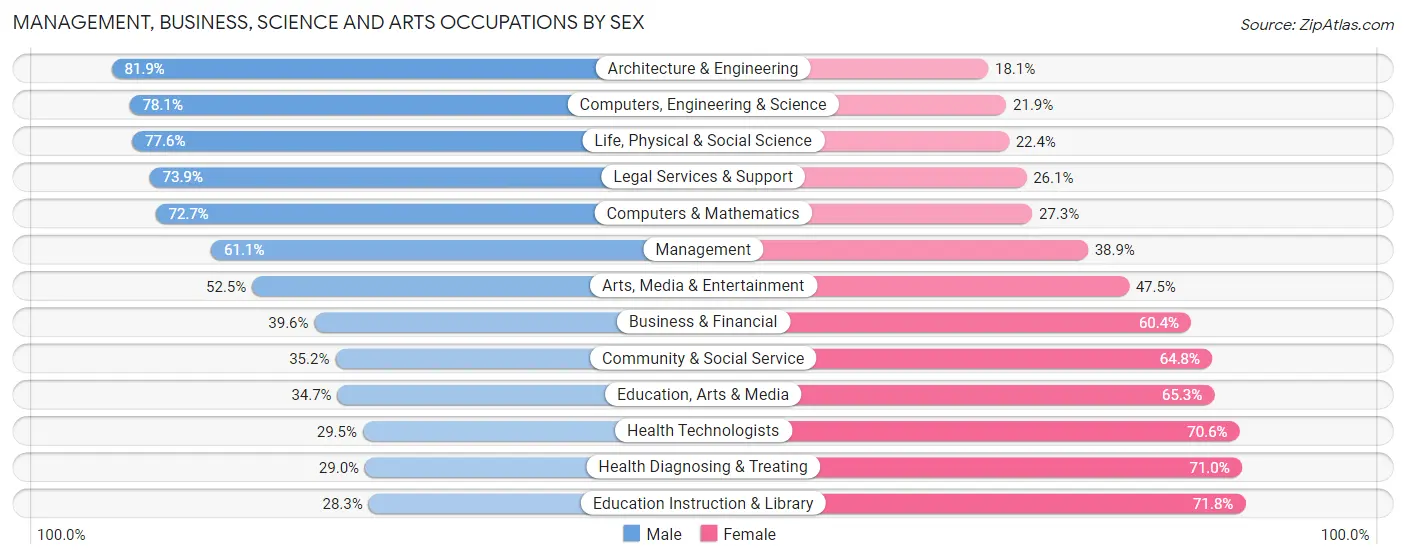
Management, Business, Science and Arts Occupations by Sex
Within the Management, Business, Science and Arts occupations in Natrona County, the most male-oriented occupations are Architecture & Engineering (81.9%), Computers, Engineering & Science (78.1%), and Life, Physical & Social Science (77.6%), while the most female-oriented occupations are Education Instruction & Library (71.8%), Health Diagnosing & Treating (71.0%), and Health Technologists (70.6%).
| Occupation | Male | Female |
| Management | 2,796 (61.1%) | 1,781 (38.9%) |
| Business & Financial | 669 (39.6%) | 1,022 (60.4%) |
| Computers, Engineering & Science | 1,652 (78.1%) | 463 (21.9%) |
| Computers & Mathematics | 466 (72.7%) | 175 (27.3%) |
| Architecture & Engineering | 809 (81.9%) | 179 (18.1%) |
| Life, Physical & Social Science | 377 (77.6%) | 109 (22.4%) |
| Community & Social Service | 1,659 (35.2%) | 3,054 (64.8%) |
| Education, Arts & Media | 305 (34.7%) | 573 (65.3%) |
| Legal Services & Support | 221 (73.9%) | 78 (26.1%) |
| Education Instruction & Library | 843 (28.2%) | 2,141 (71.8%) |
| Arts, Media & Entertainment | 290 (52.5%) | 262 (47.5%) |
| Health Diagnosing & Treating | 773 (29.0%) | 1,892 (71.0%) |
| Health Technologists | 513 (29.4%) | 1,229 (70.6%) |
| Total (Category) | 7,549 (47.9%) | 8,212 (52.1%) |
| Total (Overall) | 22,127 (54.4%) | 18,534 (45.6%) |
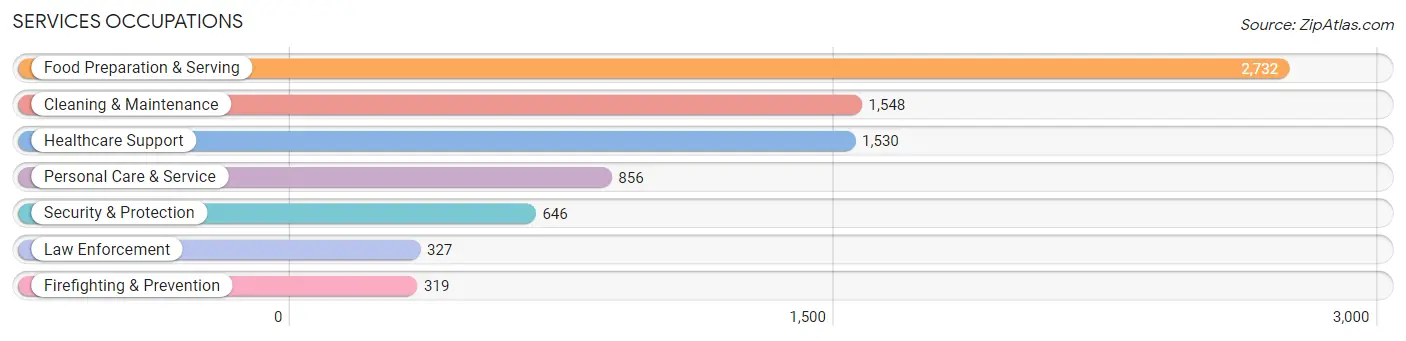
Services Occupations
The most common Services occupations in Natrona County are Food Preparation & Serving (2,732 | 6.7%), Cleaning & Maintenance (1,548 | 3.8%), Healthcare Support (1,530 | 3.8%), Personal Care & Service (856 | 2.1%), and Security & Protection (646 | 1.6%).
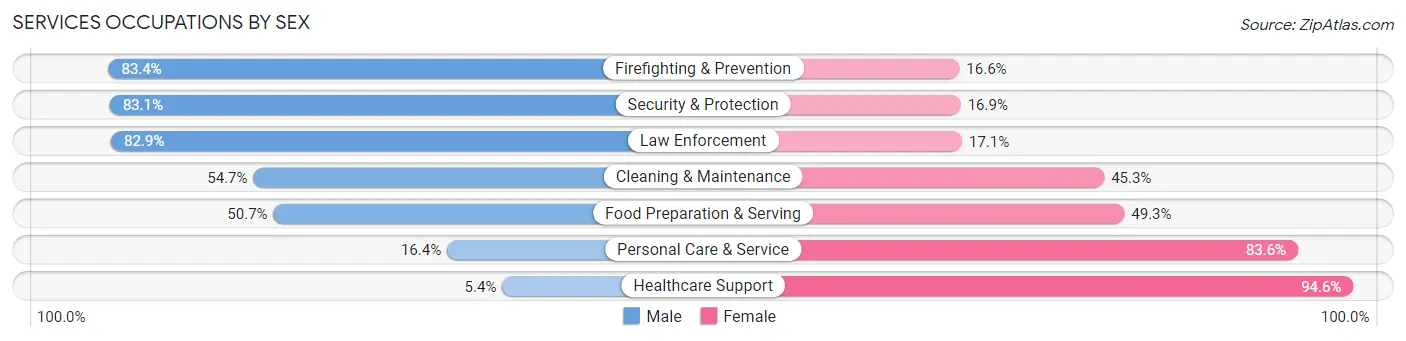
Services Occupations by Sex
Within the Services occupations in Natrona County, the most male-oriented occupations are Firefighting & Prevention (83.4%), Security & Protection (83.1%), and Law Enforcement (82.9%), while the most female-oriented occupations are Healthcare Support (94.6%), Personal Care & Service (83.6%), and Food Preparation & Serving (49.3%).
| Occupation | Male | Female |
| Healthcare Support | 83 (5.4%) | 1,447 (94.6%) |
| Security & Protection | 537 (83.1%) | 109 (16.9%) |
| Firefighting & Prevention | 266 (83.4%) | 53 (16.6%) |
| Law Enforcement | 271 (82.9%) | 56 (17.1%) |
| Food Preparation & Serving | 1,386 (50.7%) | 1,346 (49.3%) |
| Cleaning & Maintenance | 847 (54.7%) | 701 (45.3%) |
| Personal Care & Service | 140 (16.4%) | 716 (83.6%) |
| Total (Category) | 2,993 (40.9%) | 4,319 (59.1%) |
| Total (Overall) | 22,127 (54.4%) | 18,534 (45.6%) |
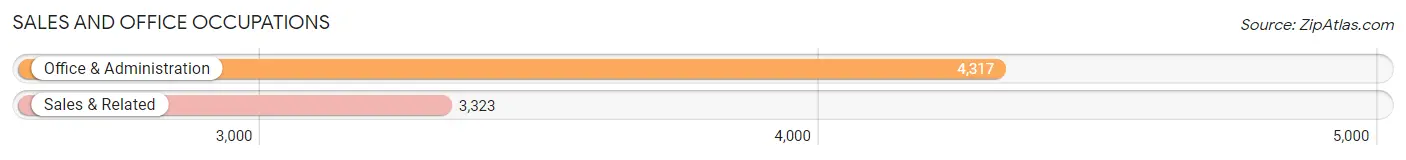
Sales and Office Occupations
The most common Sales and Office occupations in Natrona County are Office & Administration (4,317 | 10.6%), and Sales & Related (3,323 | 8.2%).
Sales and Office Occupations by Sex
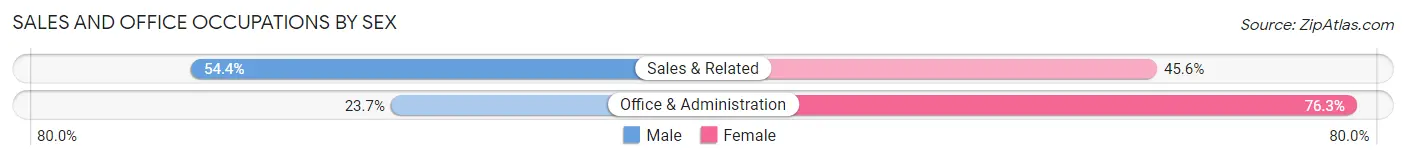
| Occupation | Male | Female |
| Sales & Related | 1,807 (54.4%) | 1,516 (45.6%) |
| Office & Administration | 1,022 (23.7%) | 3,295 (76.3%) |
| Total (Category) | 2,829 (37.0%) | 4,811 (63.0%) |
| Total (Overall) | 22,127 (54.4%) | 18,534 (45.6%) |
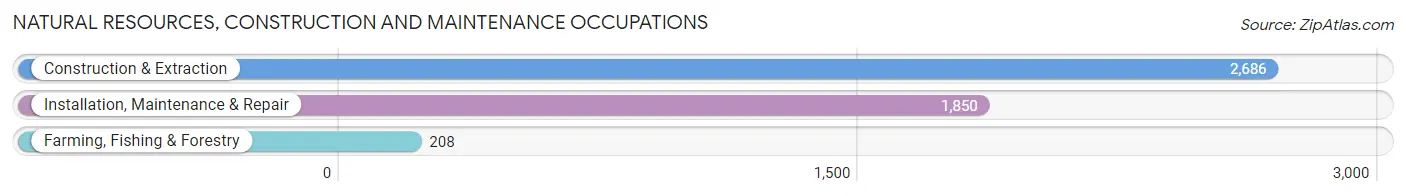
Natural Resources, Construction and Maintenance Occupations
The most common Natural Resources, Construction and Maintenance occupations in Natrona County are Construction & Extraction (2,686 | 6.6%), Installation, Maintenance & Repair (1,850 | 4.5%), and Farming, Fishing & Forestry (208 | 0.5%).
Natural Resources, Construction and Maintenance Occupations by Sex
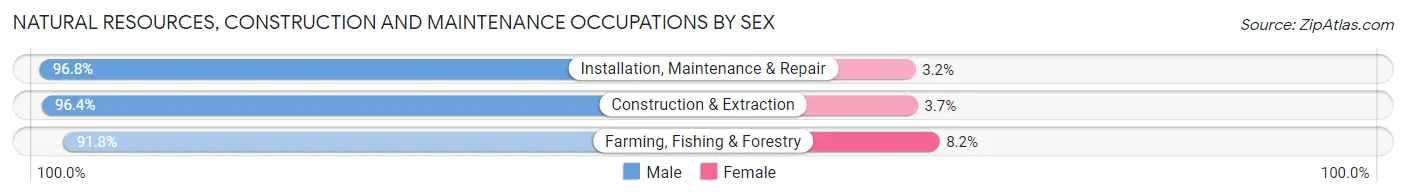
| Occupation | Male | Female |
| Farming, Fishing & Forestry | 191 (91.8%) | 17 (8.2%) |
| Construction & Extraction | 2,588 (96.4%) | 98 (3.6%) |
| Installation, Maintenance & Repair | 1,791 (96.8%) | 59 (3.2%) |
| Total (Category) | 4,570 (96.3%) | 174 (3.7%) |
| Total (Overall) | 22,127 (54.4%) | 18,534 (45.6%) |
Production, Transportation and Moving Occupations
The most common Production, Transportation and Moving occupations in Natrona County are Production (2,345 | 5.8%), Transportation (1,736 | 4.3%), and Material Moving (1,123 | 2.8%).

Production, Transportation and Moving Occupations by Sex
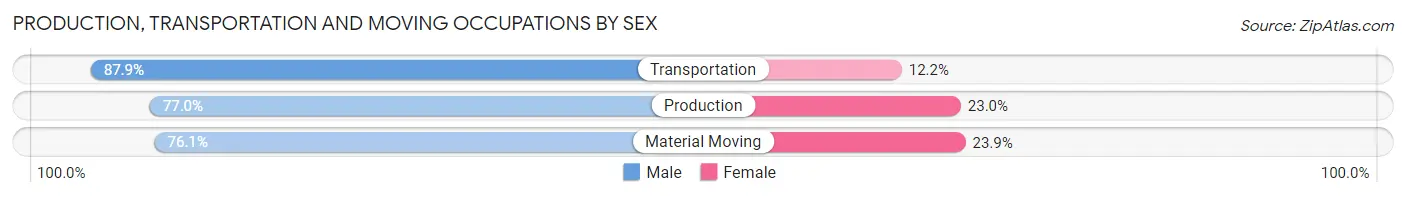
| Occupation | Male | Female |
| Production | 1,806 (77.0%) | 539 (23.0%) |
| Transportation | 1,525 (87.8%) | 211 (12.1%) |
| Material Moving | 855 (76.1%) | 268 (23.9%) |
| Total (Category) | 4,186 (80.4%) | 1,018 (19.6%) |
| Total (Overall) | 22,127 (54.4%) | 18,534 (45.6%) |
Employment Industries by Sex in Natrona County
Employment Industries in Natrona County
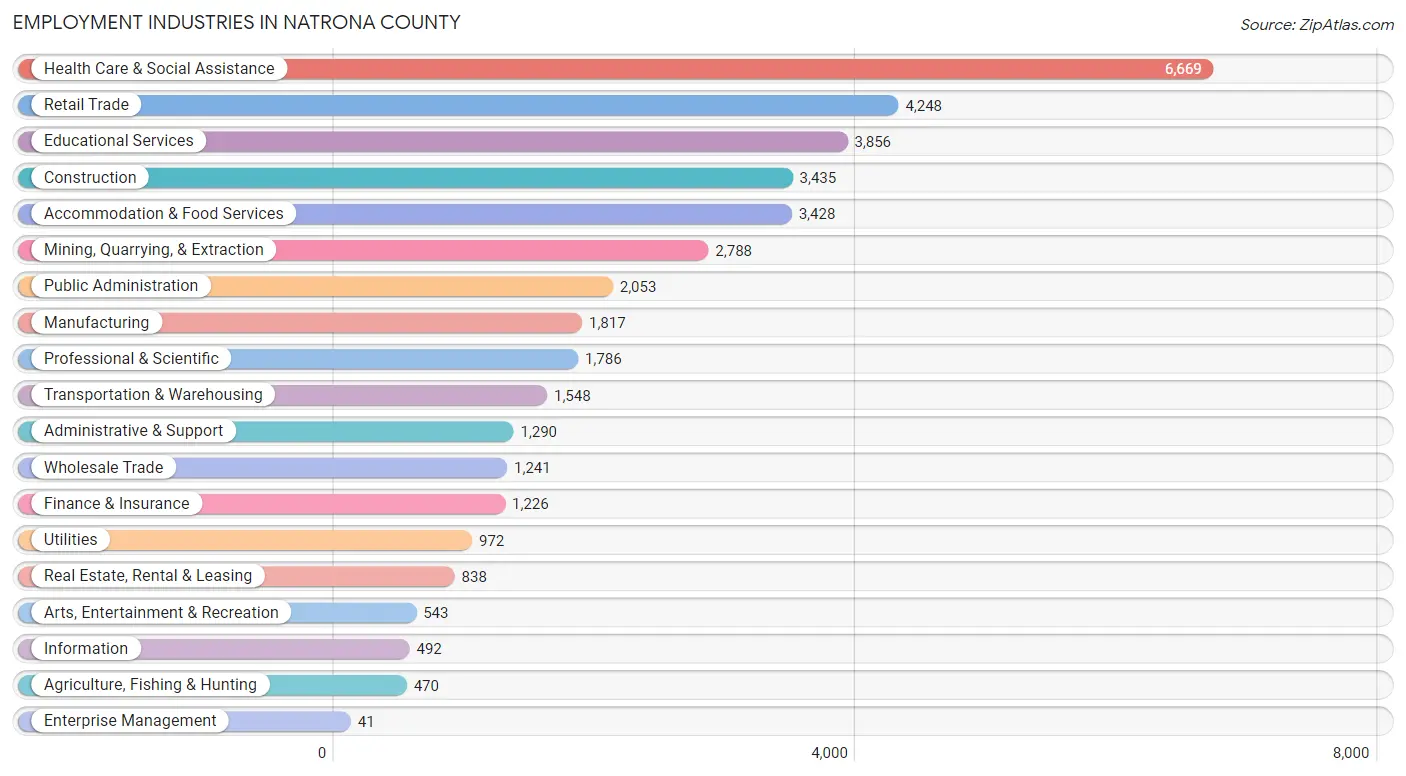
The major employment industries in Natrona County include Health Care & Social Assistance (6,669 | 16.4%), Retail Trade (4,248 | 10.4%), Educational Services (3,856 | 9.5%), Construction (3,435 | 8.5%), and Accommodation & Food Services (3,428 | 8.4%).
Employment Industries by Sex in Natrona County
The Natrona County industries that see more men than women are Construction (88.3%), Mining, Quarrying, & Extraction (86.9%), and Utilities (85.4%), whereas the industries that tend to have a higher number of women are Enterprise Management (100.0%), Health Care & Social Assistance (78.2%), and Educational Services (68.2%).
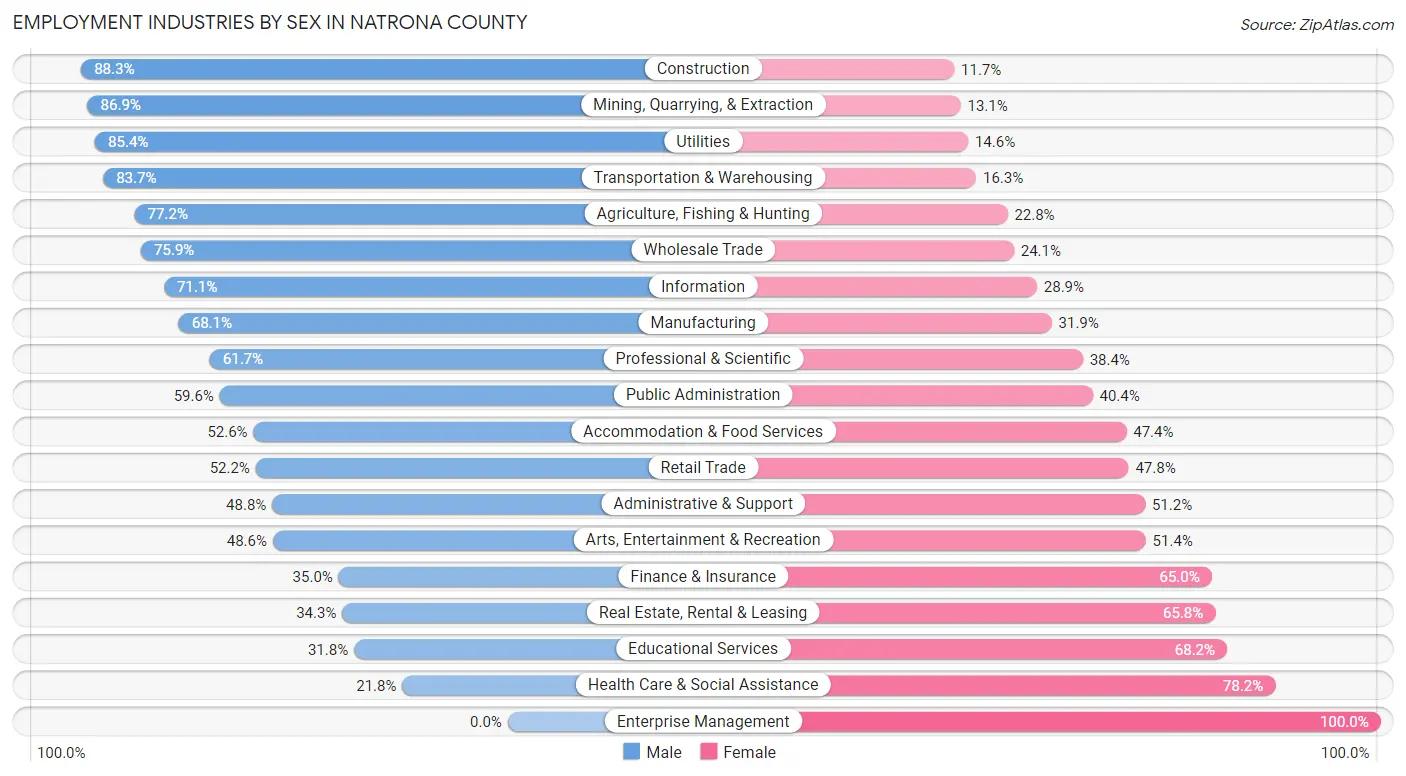
| Industry | Male | Female |
| Agriculture, Fishing & Hunting | 363 (77.2%) | 107 (22.8%) |
| Mining, Quarrying, & Extraction | 2,424 (86.9%) | 364 (13.1%) |
| Construction | 3,032 (88.3%) | 403 (11.7%) |
| Manufacturing | 1,237 (68.1%) | 580 (31.9%) |
| Wholesale Trade | 942 (75.9%) | 299 (24.1%) |
| Retail Trade | 2,216 (52.2%) | 2,032 (47.8%) |
| Transportation & Warehousing | 1,296 (83.7%) | 252 (16.3%) |
| Utilities | 830 (85.4%) | 142 (14.6%) |
| Information | 350 (71.1%) | 142 (28.9%) |
| Finance & Insurance | 429 (35.0%) | 797 (65.0%) |
| Real Estate, Rental & Leasing | 287 (34.3%) | 551 (65.7%) |
| Professional & Scientific | 1,101 (61.7%) | 685 (38.4%) |
| Enterprise Management | 0 (0.0%) | 41 (100.0%) |
| Administrative & Support | 629 (48.8%) | 661 (51.2%) |
| Educational Services | 1,227 (31.8%) | 2,629 (68.2%) |
| Health Care & Social Assistance | 1,456 (21.8%) | 5,213 (78.2%) |
| Arts, Entertainment & Recreation | 264 (48.6%) | 279 (51.4%) |
| Accommodation & Food Services | 1,804 (52.6%) | 1,624 (47.4%) |
| Public Administration | 1,224 (59.6%) | 829 (40.4%) |
| Total | 22,127 (54.4%) | 18,534 (45.6%) |
Education in Natrona County
School Enrollment in Natrona County
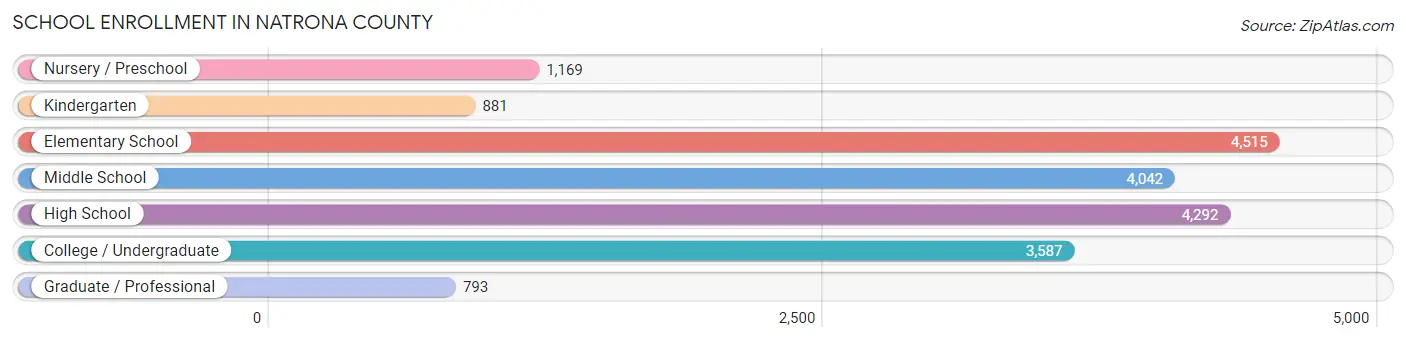
The most common levels of schooling among the 19,279 students in Natrona County are elementary school (4,515 | 23.4%), high school (4,292 | 22.3%), and middle school (4,042 | 21.0%).
| School Level | # Students | % Students |
| Nursery / Preschool | 1,169 | 6.1% |
| Kindergarten | 881 | 4.6% |
| Elementary School | 4,515 | 23.4% |
| Middle School | 4,042 | 21.0% |
| High School | 4,292 | 22.3% |
| College / Undergraduate | 3,587 | 18.6% |
| Graduate / Professional | 793 | 4.1% |
| Total | 19,279 | 100.0% |
School Enrollment by Age by Funding Source in Natrona County
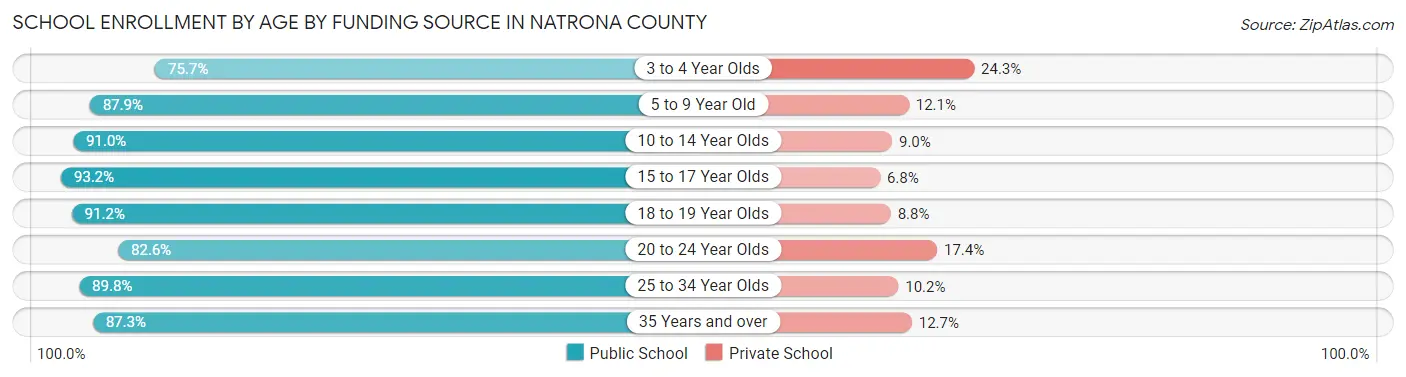
Out of a total of 19,279 students who are enrolled in schools in Natrona County, 2,121 (11.0%) attend a private institution, while the remaining 17,158 (89.0%) are enrolled in public schools. The age group of 3 to 4 year olds has the highest likelihood of being enrolled in private schools, with 200 (24.3% in the age bracket) enrolled. Conversely, the age group of 15 to 17 year olds has the lowest likelihood of being enrolled in a private school, with 2,926 (93.2% in the age bracket) attending a public institution.
| Age Bracket | Public School | Private School |
| 3 to 4 Year Olds | 623 (75.7%) | 200 (24.3%) |
| 5 to 9 Year Old | 4,555 (87.9%) | 629 (12.1%) |
| 10 to 14 Year Olds | 4,835 (91.0%) | 479 (9.0%) |
| 15 to 17 Year Olds | 2,926 (93.2%) | 212 (6.8%) |
| 18 to 19 Year Olds | 1,177 (91.2%) | 113 (8.8%) |
| 20 to 24 Year Olds | 1,088 (82.6%) | 229 (17.4%) |
| 25 to 34 Year Olds | 1,025 (89.8%) | 116 (10.2%) |
| 35 Years and over | 936 (87.3%) | 136 (12.7%) |
| Total | 17,158 (89.0%) | 2,121 (11.0%) |
Educational Attainment by Field of Study in Natrona County
Education (3,420 | 22.4%), business (2,007 | 13.1%), science & technology (1,651 | 10.8%), bio, nature & agricultural (1,237 | 8.1%), and engineering (1,145 | 7.5%) are the most common fields of study among 15,299 individuals in Natrona County who have obtained a bachelor's degree or higher.
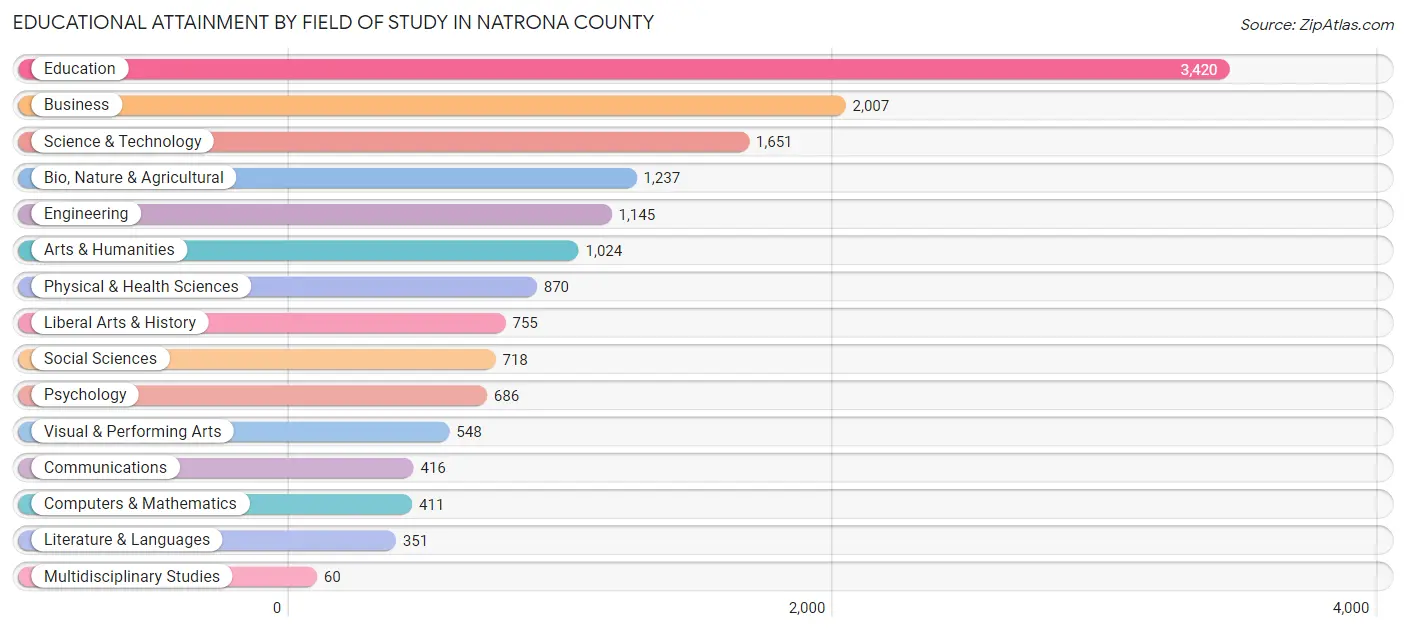
| Field of Study | # Graduates | % Graduates |
| Computers & Mathematics | 411 | 2.7% |
| Bio, Nature & Agricultural | 1,237 | 8.1% |
| Physical & Health Sciences | 870 | 5.7% |
| Psychology | 686 | 4.5% |
| Social Sciences | 718 | 4.7% |
| Engineering | 1,145 | 7.5% |
| Multidisciplinary Studies | 60 | 0.4% |
| Science & Technology | 1,651 | 10.8% |
| Business | 2,007 | 13.1% |
| Education | 3,420 | 22.4% |
| Literature & Languages | 351 | 2.3% |
| Liberal Arts & History | 755 | 4.9% |
| Visual & Performing Arts | 548 | 3.6% |
| Communications | 416 | 2.7% |
| Arts & Humanities | 1,024 | 6.7% |
| Total | 15,299 | 100.0% |
Transportation & Commute in Natrona County
Vehicle Availability by Sex in Natrona County
The most prevalent vehicle ownership categories in Natrona County are males with 2 vehicles (8,542, accounting for 39.1%) and females with 2 vehicles (6,057, making up 47.1%).
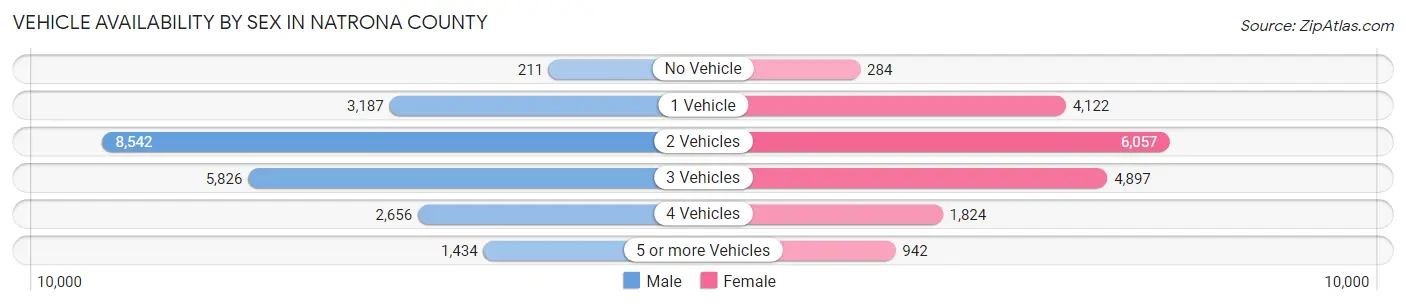
| Vehicles Available | Male | Female |
| No Vehicle | 211 (1.0%) | 284 (1.6%) |
| 1 Vehicle | 3,187 (14.6%) | 4,122 (22.7%) |
| 2 Vehicles | 8,542 (39.1%) | 6,057 (33.4%) |
| 3 Vehicles | 5,826 (26.7%) | 4,897 (27.0%) |
| 4 Vehicles | 2,656 (12.1%) | 1,824 (10.1%) |
| 5 or more Vehicles | 1,434 (6.6%) | 942 (5.2%) |
| Total | 21,856 (100.0%) | 18,126 (100.0%) |
Commute Time in Natrona County
The most frequently occuring commute durations in Natrona County are 10 to 14 minutes (9,429 commuters, 25.5%), 15 to 19 minutes (9,392 commuters, 25.4%), and 5 to 9 minutes (6,392 commuters, 17.3%).
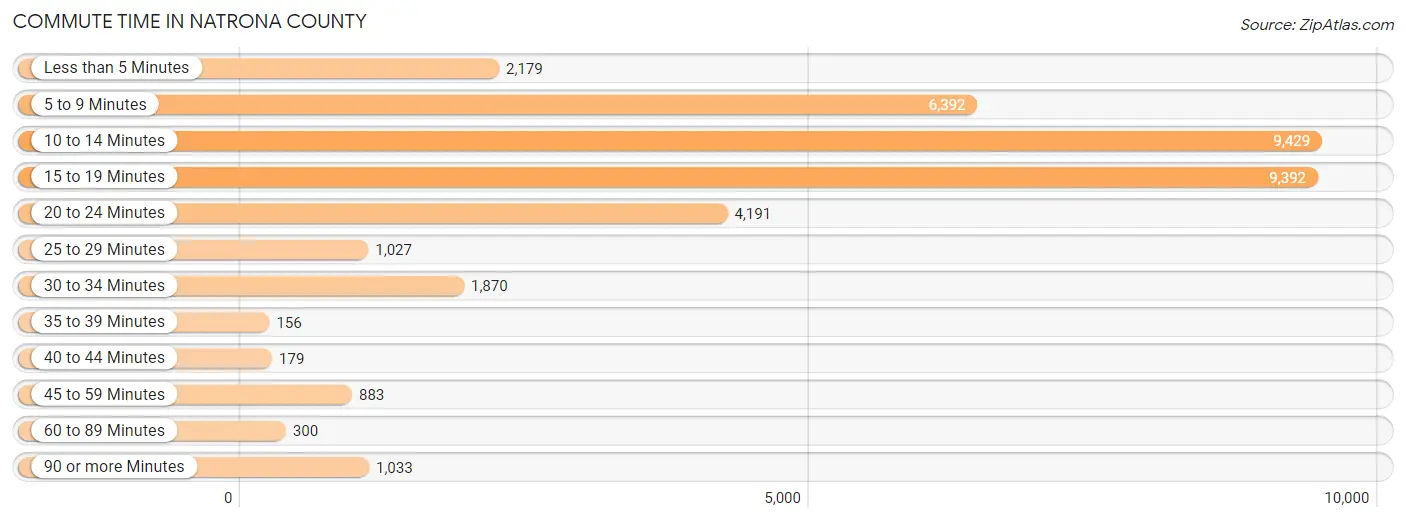
| Commute Time | # Commuters | % Commuters |
| Less than 5 Minutes | 2,179 | 5.9% |
| 5 to 9 Minutes | 6,392 | 17.3% |
| 10 to 14 Minutes | 9,429 | 25.5% |
| 15 to 19 Minutes | 9,392 | 25.4% |
| 20 to 24 Minutes | 4,191 | 11.3% |
| 25 to 29 Minutes | 1,027 | 2.8% |
| 30 to 34 Minutes | 1,870 | 5.1% |
| 35 to 39 Minutes | 156 | 0.4% |
| 40 to 44 Minutes | 179 | 0.5% |
| 45 to 59 Minutes | 883 | 2.4% |
| 60 to 89 Minutes | 300 | 0.8% |
| 90 or more Minutes | 1,033 | 2.8% |
Commute Time by Sex in Natrona County
The most common commute times in Natrona County are 15 to 19 minutes (5,042 commuters, 24.7%) for males and 10 to 14 minutes (4,712 commuters, 28.4%) for females.
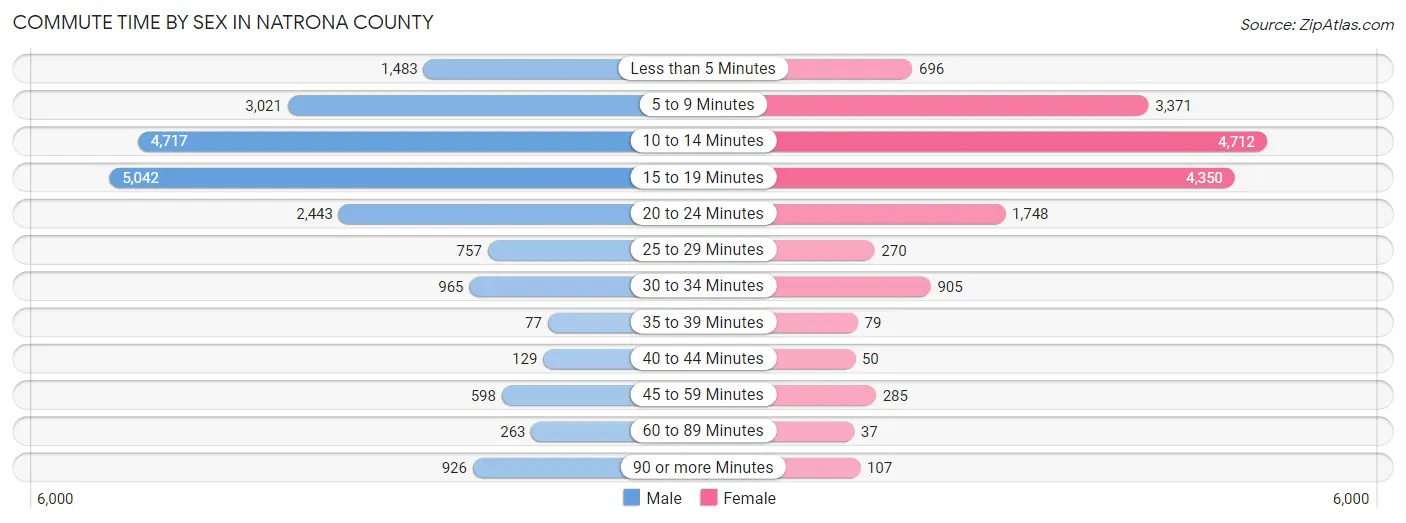
| Commute Time | Male | Female |
| Less than 5 Minutes | 1,483 (7.3%) | 696 (4.2%) |
| 5 to 9 Minutes | 3,021 (14.8%) | 3,371 (20.3%) |
| 10 to 14 Minutes | 4,717 (23.1%) | 4,712 (28.4%) |
| 15 to 19 Minutes | 5,042 (24.7%) | 4,350 (26.2%) |
| 20 to 24 Minutes | 2,443 (12.0%) | 1,748 (10.5%) |
| 25 to 29 Minutes | 757 (3.7%) | 270 (1.6%) |
| 30 to 34 Minutes | 965 (4.7%) | 905 (5.4%) |
| 35 to 39 Minutes | 77 (0.4%) | 79 (0.5%) |
| 40 to 44 Minutes | 129 (0.6%) | 50 (0.3%) |
| 45 to 59 Minutes | 598 (2.9%) | 285 (1.7%) |
| 60 to 89 Minutes | 263 (1.3%) | 37 (0.2%) |
| 90 or more Minutes | 926 (4.5%) | 107 (0.6%) |
Time of Departure to Work by Sex in Natrona County
The most frequent times of departure to work in Natrona County are 7:30 AM to 7:59 AM (4,510, 22.1%) for males and 7:30 AM to 7:59 AM (4,158, 25.0%) for females.
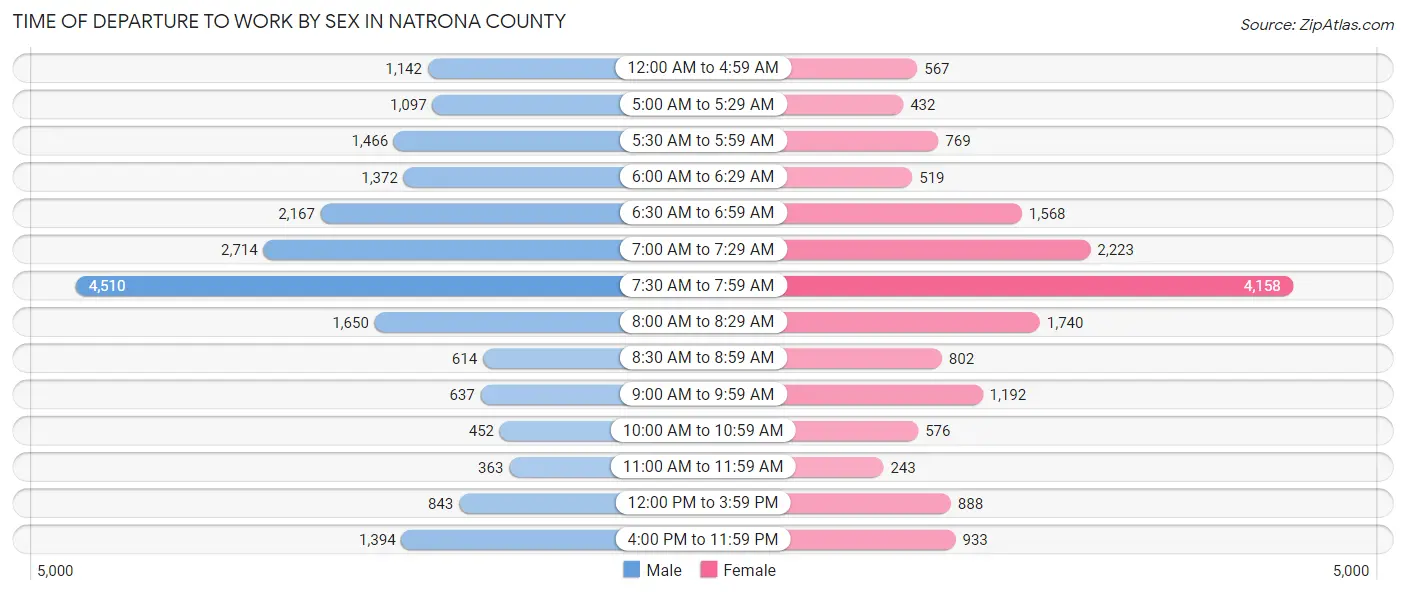
| Time of Departure | Male | Female |
| 12:00 AM to 4:59 AM | 1,142 (5.6%) | 567 (3.4%) |
| 5:00 AM to 5:29 AM | 1,097 (5.4%) | 432 (2.6%) |
| 5:30 AM to 5:59 AM | 1,466 (7.2%) | 769 (4.6%) |
| 6:00 AM to 6:29 AM | 1,372 (6.7%) | 519 (3.1%) |
| 6:30 AM to 6:59 AM | 2,167 (10.6%) | 1,568 (9.4%) |
| 7:00 AM to 7:29 AM | 2,714 (13.3%) | 2,223 (13.4%) |
| 7:30 AM to 7:59 AM | 4,510 (22.1%) | 4,158 (25.0%) |
| 8:00 AM to 8:29 AM | 1,650 (8.1%) | 1,740 (10.5%) |
| 8:30 AM to 8:59 AM | 614 (3.0%) | 802 (4.8%) |
| 9:00 AM to 9:59 AM | 637 (3.1%) | 1,192 (7.2%) |
| 10:00 AM to 10:59 AM | 452 (2.2%) | 576 (3.5%) |
| 11:00 AM to 11:59 AM | 363 (1.8%) | 243 (1.5%) |
| 12:00 PM to 3:59 PM | 843 (4.1%) | 888 (5.3%) |
| 4:00 PM to 11:59 PM | 1,394 (6.8%) | 933 (5.6%) |
| Total | 20,421 (100.0%) | 16,610 (100.0%) |
Housing Occupancy in Natrona County
Occupancy by Ownership in Natrona County
Of the total 32,895 dwellings in Natrona County, owner-occupied units account for 23,937 (72.8%), while renter-occupied units make up 8,958 (27.2%).
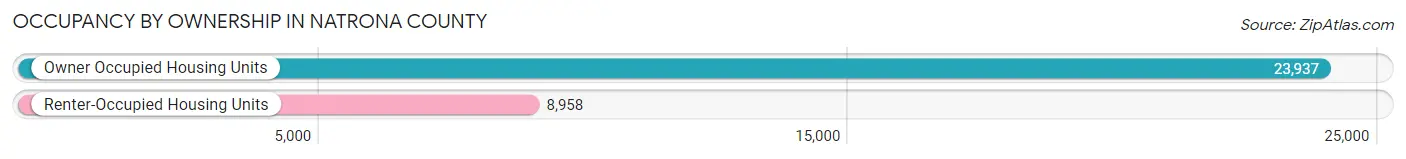
| Occupancy | # Housing Units | % Housing Units |
| Owner Occupied Housing Units | 23,937 | 72.8% |
| Renter-Occupied Housing Units | 8,958 | 27.2% |
| Total Occupied Housing Units | 32,895 | 100.0% |
Occupancy by Household Size in Natrona County
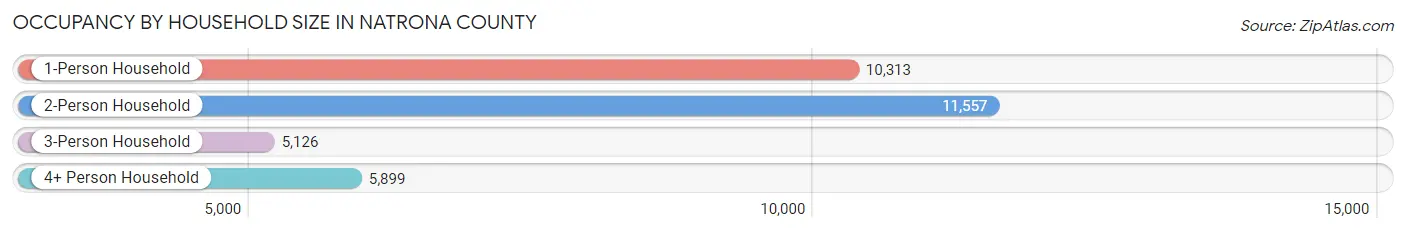
| Household Size | # Housing Units | % Housing Units |
| 1-Person Household | 10,313 | 31.4% |
| 2-Person Household | 11,557 | 35.1% |
| 3-Person Household | 5,126 | 15.6% |
| 4+ Person Household | 5,899 | 17.9% |
| Total Housing Units | 32,895 | 100.0% |
Occupancy by Ownership by Household Size in Natrona County
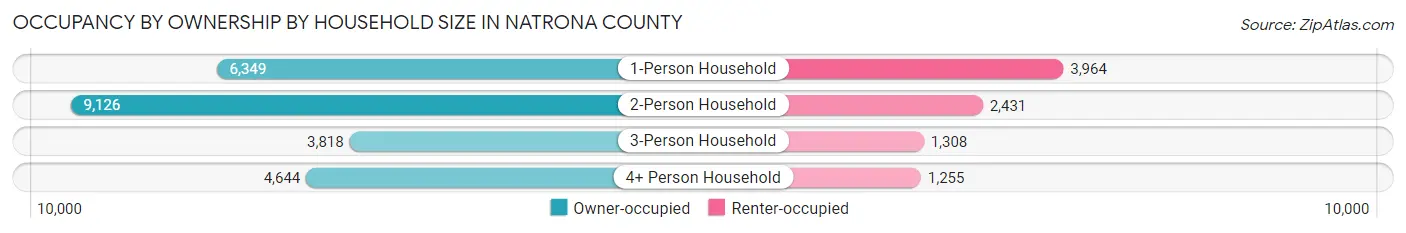
| Household Size | Owner-occupied | Renter-occupied |
| 1-Person Household | 6,349 (61.6%) | 3,964 (38.4%) |
| 2-Person Household | 9,126 (79.0%) | 2,431 (21.0%) |
| 3-Person Household | 3,818 (74.5%) | 1,308 (25.5%) |
| 4+ Person Household | 4,644 (78.7%) | 1,255 (21.3%) |
| Total Housing Units | 23,937 (72.8%) | 8,958 (27.2%) |
Occupancy by Educational Attainment in Natrona County
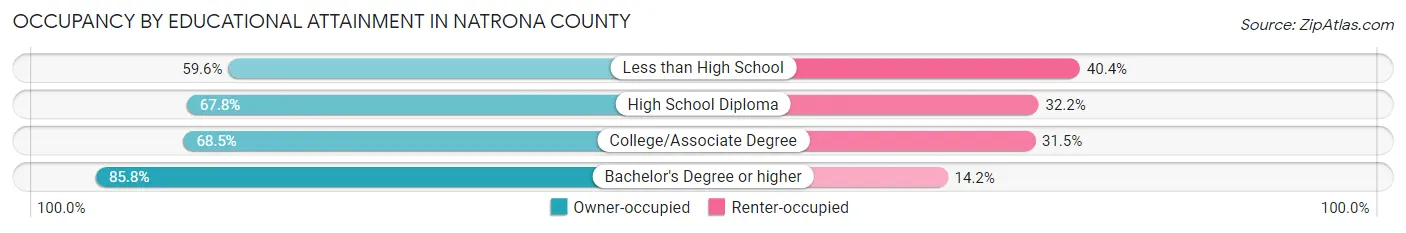
| Household Size | Owner-occupied | Renter-occupied |
| Less than High School | 986 (59.6%) | 668 (40.4%) |
| High School Diploma | 5,708 (67.8%) | 2,710 (32.2%) |
| College/Associate Degree | 9,273 (68.5%) | 4,265 (31.5%) |
| Bachelor's Degree or higher | 7,970 (85.8%) | 1,315 (14.2%) |
Occupancy by Age of Householder in Natrona County
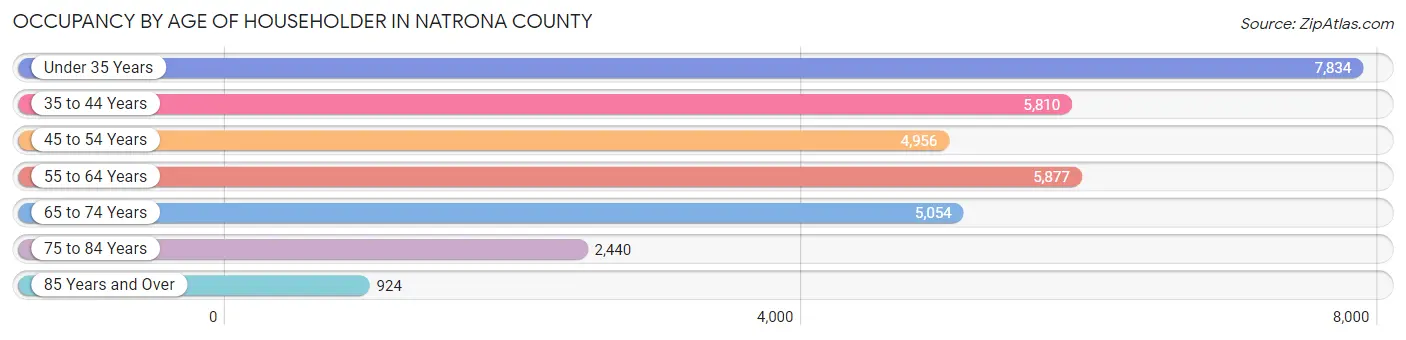
| Age Bracket | # Households | % Households |
| Under 35 Years | 7,834 | 23.8% |
| 35 to 44 Years | 5,810 | 17.7% |
| 45 to 54 Years | 4,956 | 15.1% |
| 55 to 64 Years | 5,877 | 17.9% |
| 65 to 74 Years | 5,054 | 15.4% |
| 75 to 84 Years | 2,440 | 7.4% |
| 85 Years and Over | 924 | 2.8% |
| Total | 32,895 | 100.0% |
Housing Finances in Natrona County
Median Income by Occupancy in Natrona County
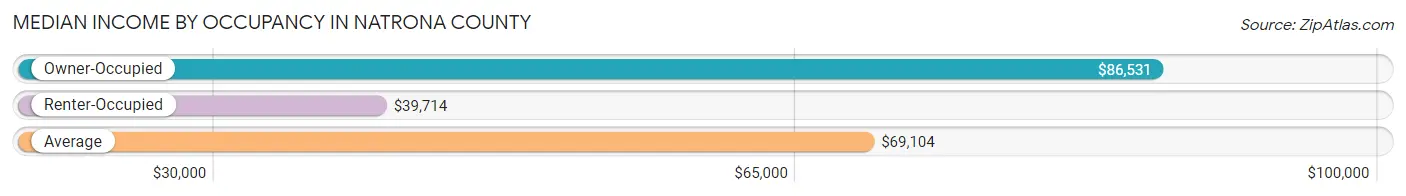
| Occupancy Type | # Households | Median Income |
| Owner-Occupied | 23,937 (72.8%) | $86,531 |
| Renter-Occupied | 8,958 (27.2%) | $39,714 |
| Average | 32,895 (100.0%) | $69,104 |
Occupancy by Householder Income Bracket in Natrona County
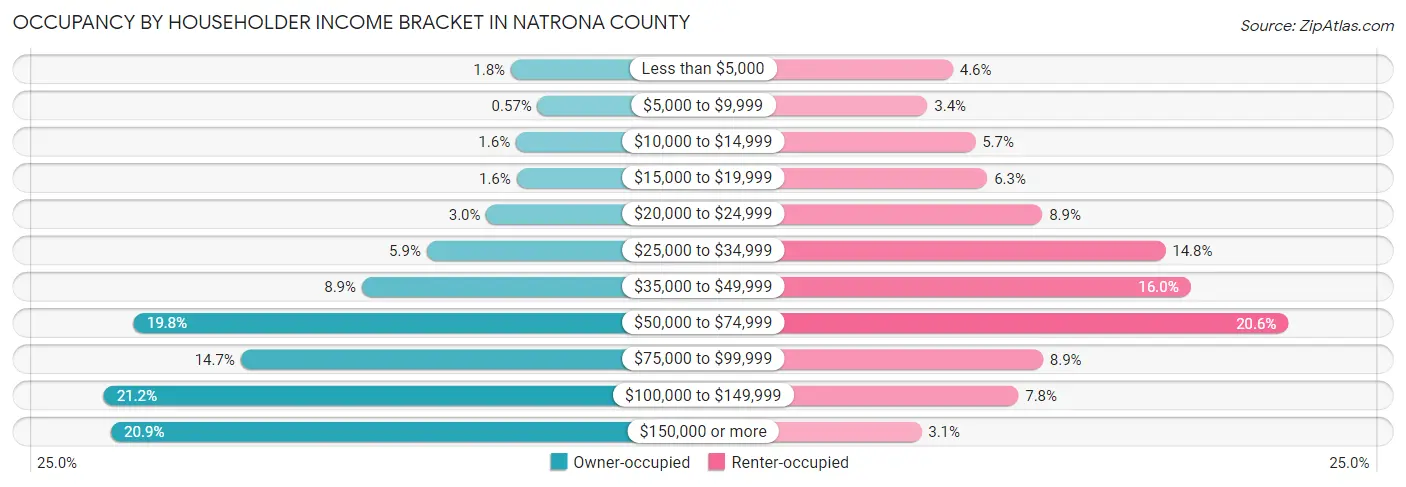
| Income Bracket | Owner-occupied | Renter-occupied |
| Less than $5,000 | 440 (1.8%) | 415 (4.6%) |
| $5,000 to $9,999 | 137 (0.6%) | 306 (3.4%) |
| $10,000 to $14,999 | 382 (1.6%) | 511 (5.7%) |
| $15,000 to $19,999 | 377 (1.6%) | 562 (6.3%) |
| $20,000 to $24,999 | 720 (3.0%) | 796 (8.9%) |
| $25,000 to $34,999 | 1,400 (5.9%) | 1,321 (14.7%) |
| $35,000 to $49,999 | 2,140 (8.9%) | 1,429 (16.0%) |
| $50,000 to $74,999 | 4,740 (19.8%) | 1,845 (20.6%) |
| $75,000 to $99,999 | 3,521 (14.7%) | 799 (8.9%) |
| $100,000 to $149,999 | 5,081 (21.2%) | 694 (7.7%) |
| $150,000 or more | 4,999 (20.9%) | 280 (3.1%) |
| Total | 23,937 (100.0%) | 8,958 (100.0%) |
Monthly Housing Cost Tiers in Natrona County
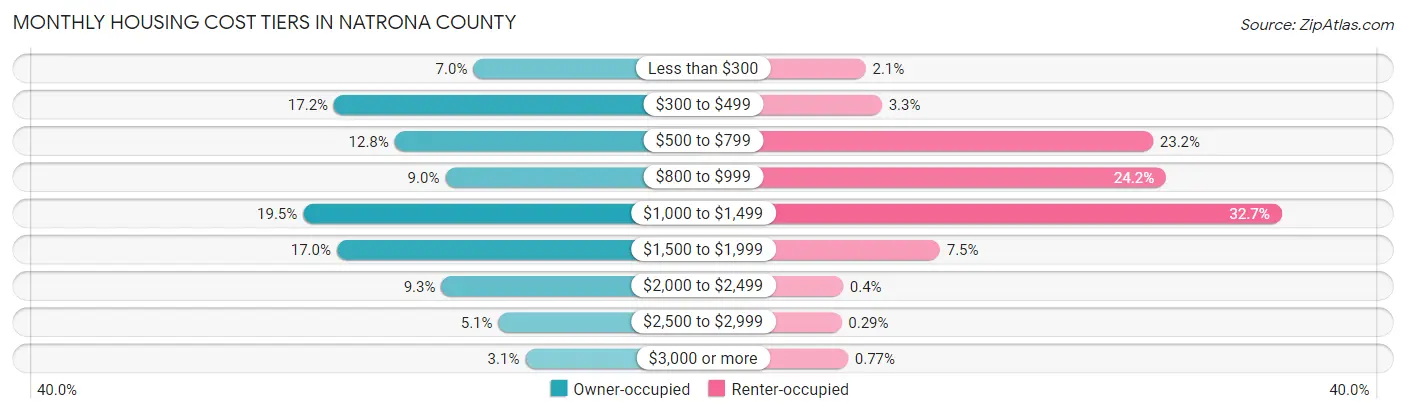
| Monthly Cost | Owner-occupied | Renter-occupied |
| Less than $300 | 1,666 (7.0%) | 185 (2.1%) |
| $300 to $499 | 4,121 (17.2%) | 292 (3.3%) |
| $500 to $799 | 3,051 (12.8%) | 2,081 (23.2%) |
| $800 to $999 | 2,160 (9.0%) | 2,168 (24.2%) |
| $1,000 to $1,499 | 4,665 (19.5%) | 2,930 (32.7%) |
| $1,500 to $1,999 | 4,071 (17.0%) | 675 (7.5%) |
| $2,000 to $2,499 | 2,229 (9.3%) | 36 (0.4%) |
| $2,500 to $2,999 | 1,224 (5.1%) | 26 (0.3%) |
| $3,000 or more | 750 (3.1%) | 69 (0.8%) |
| Total | 23,937 (100.0%) | 8,958 (100.0%) |
Physical Housing Characteristics in Natrona County
Housing Structures in Natrona County
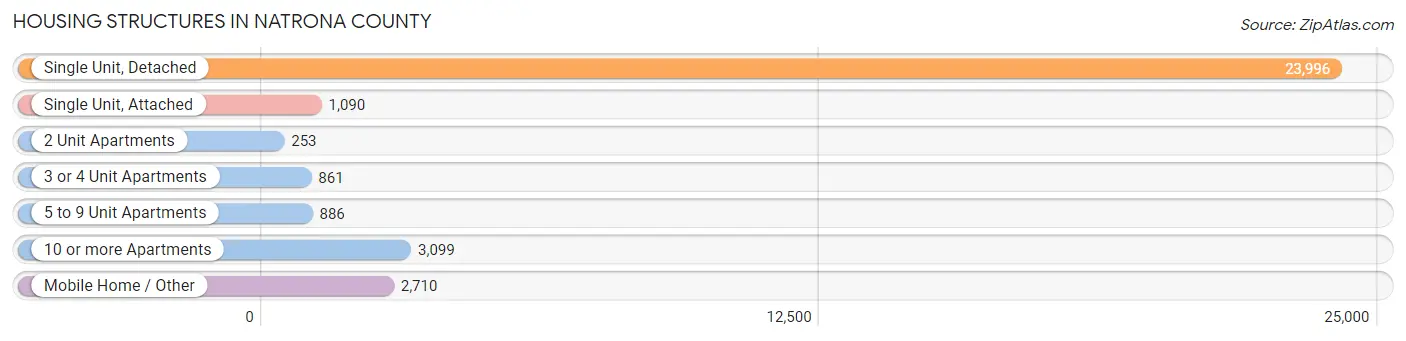
| Structure Type | # Housing Units | % Housing Units |
| Single Unit, Detached | 23,996 | 73.0% |
| Single Unit, Attached | 1,090 | 3.3% |
| 2 Unit Apartments | 253 | 0.8% |
| 3 or 4 Unit Apartments | 861 | 2.6% |
| 5 to 9 Unit Apartments | 886 | 2.7% |
| 10 or more Apartments | 3,099 | 9.4% |
| Mobile Home / Other | 2,710 | 8.2% |
| Total | 32,895 | 100.0% |
Housing Structures by Occupancy in Natrona County
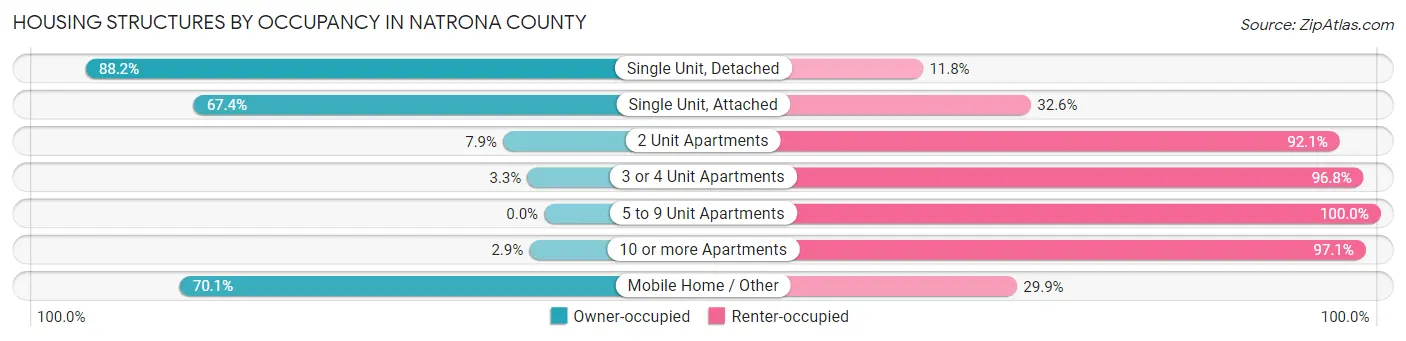
| Structure Type | Owner-occupied | Renter-occupied |
| Single Unit, Detached | 21,165 (88.2%) | 2,831 (11.8%) |
| Single Unit, Attached | 735 (67.4%) | 355 (32.6%) |
| 2 Unit Apartments | 20 (7.9%) | 233 (92.1%) |
| 3 or 4 Unit Apartments | 28 (3.3%) | 833 (96.8%) |
| 5 to 9 Unit Apartments | 0 (0.0%) | 886 (100.0%) |
| 10 or more Apartments | 89 (2.9%) | 3,010 (97.1%) |
| Mobile Home / Other | 1,900 (70.1%) | 810 (29.9%) |
| Total | 23,937 (72.8%) | 8,958 (27.2%) |
Housing Structures by Number of Rooms in Natrona County
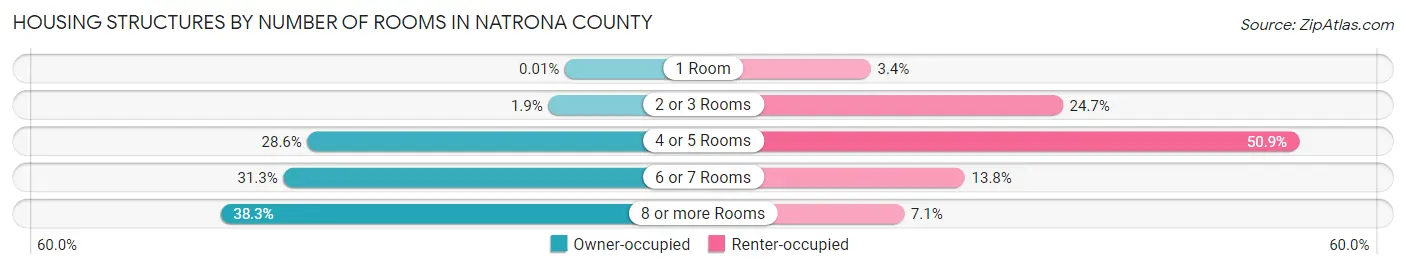
| Number of Rooms | Owner-occupied | Renter-occupied |
| 1 Room | 2 (0.0%) | 305 (3.4%) |
| 2 or 3 Rooms | 444 (1.8%) | 2,214 (24.7%) |
| 4 or 5 Rooms | 6,844 (28.6%) | 4,563 (50.9%) |
| 6 or 7 Rooms | 7,483 (31.3%) | 1,240 (13.8%) |
| 8 or more Rooms | 9,164 (38.3%) | 636 (7.1%) |
| Total | 23,937 (100.0%) | 8,958 (100.0%) |
Housing Structure by Heating Type in Natrona County
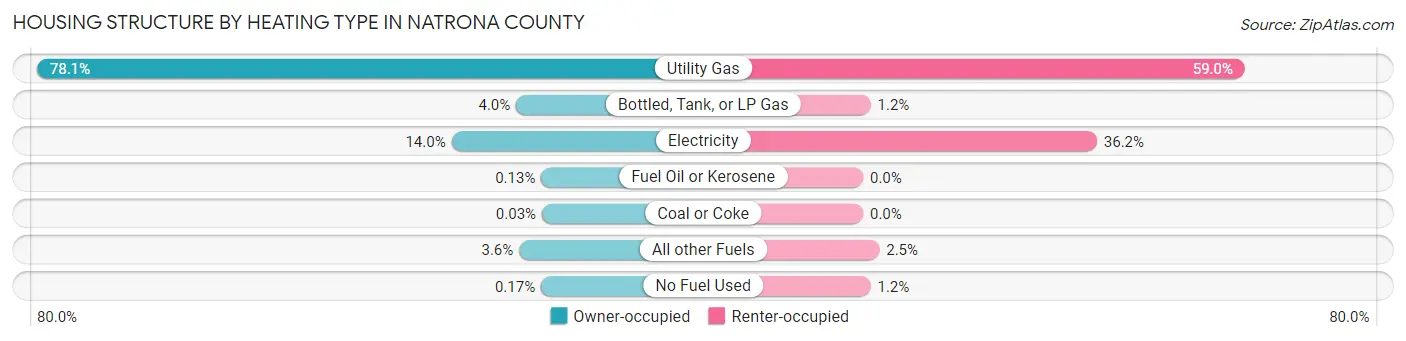
| Heating Type | Owner-occupied | Renter-occupied |
| Utility Gas | 18,694 (78.1%) | 5,286 (59.0%) |
| Bottled, Tank, or LP Gas | 963 (4.0%) | 105 (1.2%) |
| Electricity | 3,353 (14.0%) | 3,238 (36.1%) |
| Fuel Oil or Kerosene | 30 (0.1%) | 0 (0.0%) |
| Coal or Coke | 8 (0.0%) | 0 (0.0%) |
| All other Fuels | 849 (3.5%) | 225 (2.5%) |
| No Fuel Used | 40 (0.2%) | 104 (1.2%) |
| Total | 23,937 (100.0%) | 8,958 (100.0%) |
Household Vehicle Usage in Natrona County
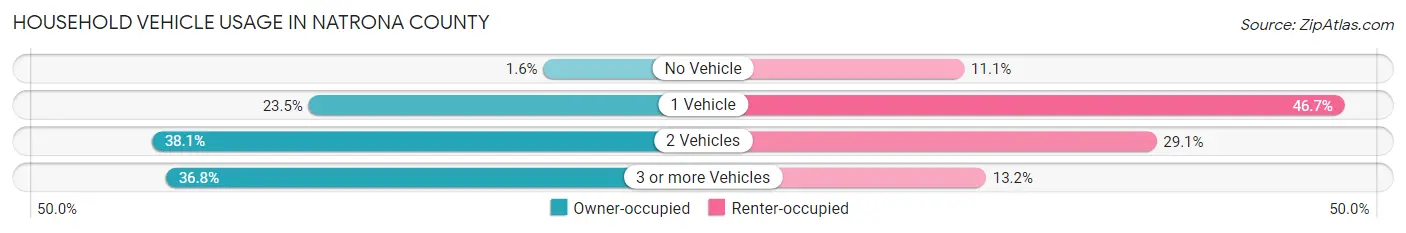
| Vehicles per Household | Owner-occupied | Renter-occupied |
| No Vehicle | 375 (1.6%) | 997 (11.1%) |
| 1 Vehicle | 5,620 (23.5%) | 4,179 (46.7%) |
| 2 Vehicles | 9,128 (38.1%) | 2,604 (29.1%) |
| 3 or more Vehicles | 8,814 (36.8%) | 1,178 (13.2%) |
| Total | 23,937 (100.0%) | 8,958 (100.0%) |
Real Estate & Mortgages in Natrona County
Real Estate and Mortgage Overview in Natrona County
| Characteristic | Without Mortgage | With Mortgage |
| Housing Units | 9,027 | 14,910 |
| Median Property Value | $235,300 | $255,700 |
| Median Household Income | $66,892 | $3,415 |
| Monthly Housing Costs | $452 | $717 |
| Real Estate Taxes | $1,519 | $337 |
Property Value by Mortgage Status in Natrona County
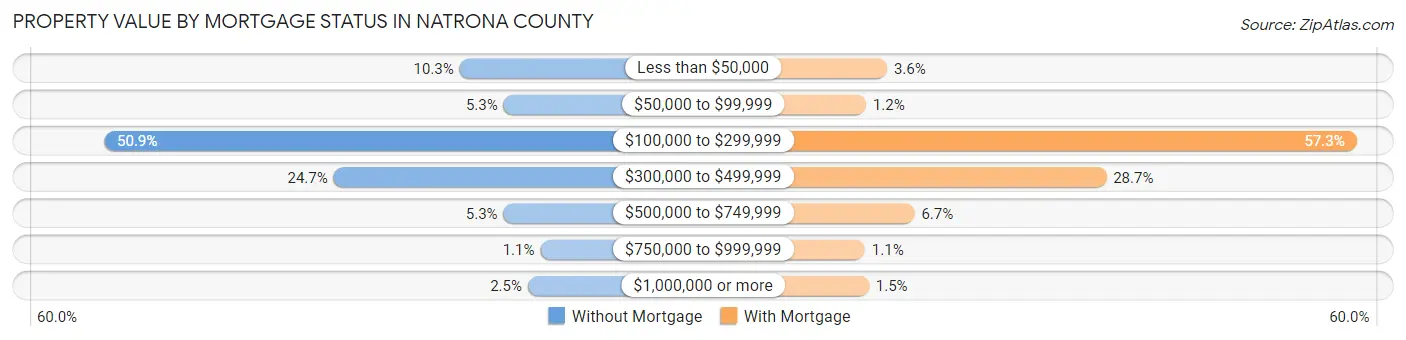
| Property Value | Without Mortgage | With Mortgage |
| Less than $50,000 | 929 (10.3%) | 536 (3.6%) |
| $50,000 to $99,999 | 475 (5.3%) | 177 (1.2%) |
| $100,000 to $299,999 | 4,596 (50.9%) | 8,536 (57.3%) |
| $300,000 to $499,999 | 2,229 (24.7%) | 4,272 (28.6%) |
| $500,000 to $749,999 | 477 (5.3%) | 1,004 (6.7%) |
| $750,000 to $999,999 | 96 (1.1%) | 159 (1.1%) |
| $1,000,000 or more | 225 (2.5%) | 226 (1.5%) |
| Total | 9,027 (100.0%) | 14,910 (100.0%) |
Household Income by Mortgage Status in Natrona County
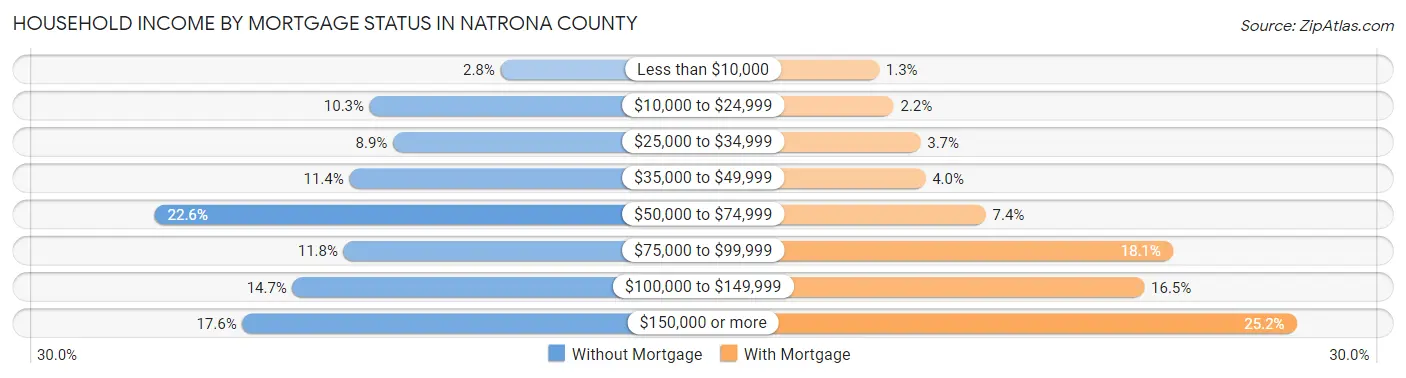
| Household Income | Without Mortgage | With Mortgage |
| Less than $10,000 | 253 (2.8%) | 198 (1.3%) |
| $10,000 to $24,999 | 927 (10.3%) | 324 (2.2%) |
| $25,000 to $34,999 | 807 (8.9%) | 552 (3.7%) |
| $35,000 to $49,999 | 1,032 (11.4%) | 593 (4.0%) |
| $50,000 to $74,999 | 2,037 (22.6%) | 1,108 (7.4%) |
| $75,000 to $99,999 | 1,062 (11.8%) | 2,703 (18.1%) |
| $100,000 to $149,999 | 1,325 (14.7%) | 2,459 (16.5%) |
| $150,000 or more | 1,584 (17.5%) | 3,756 (25.2%) |
| Total | 9,027 (100.0%) | 14,910 (100.0%) |
Property Value to Household Income Ratio in Natrona County
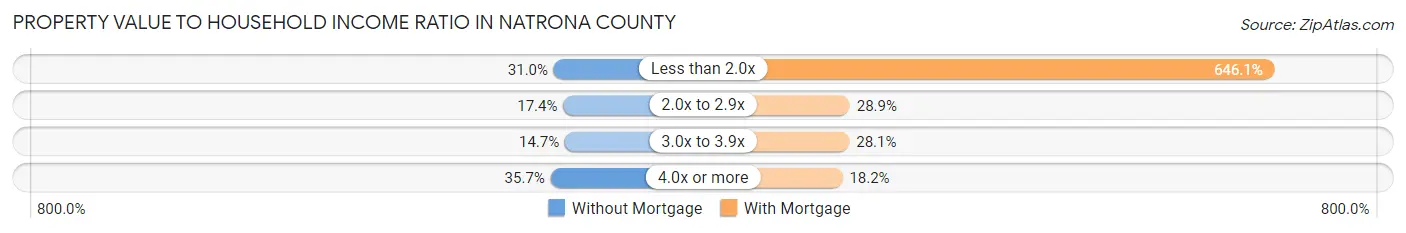
| Value-to-Income Ratio | Without Mortgage | With Mortgage |
| Less than 2.0x | 2,801 (31.0%) | 96,339 (646.1%) |
| 2.0x to 2.9x | 1,570 (17.4%) | 4,310 (28.9%) |
| 3.0x to 3.9x | 1,331 (14.7%) | 4,192 (28.1%) |
| 4.0x or more | 3,222 (35.7%) | 2,711 (18.2%) |
| Total | 9,027 (100.0%) | 14,910 (100.0%) |
Real Estate Taxes by Mortgage Status in Natrona County

| Property Taxes | Without Mortgage | With Mortgage |
| Less than $800 | 1,956 (21.7%) | 132 (0.9%) |
| $800 to $1,499 | 2,299 (25.5%) | 1,742 (11.7%) |
| $800 to $1,499 | 4,397 (48.7%) | 5,230 (35.1%) |
| Total | 9,027 (100.0%) | 14,910 (100.0%) |
Health & Disability in Natrona County
Health Insurance Coverage by Age in Natrona County
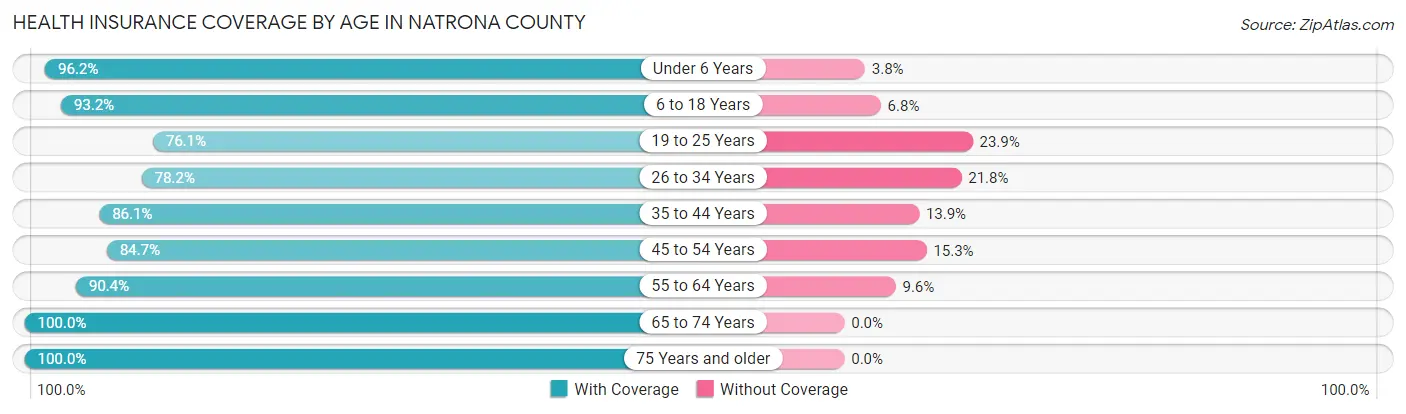
| Age Bracket | With Coverage | Without Coverage |
| Under 6 Years | 5,498 (96.2%) | 219 (3.8%) |
| 6 to 18 Years | 13,306 (93.2%) | 968 (6.8%) |
| 19 to 25 Years | 4,716 (76.1%) | 1,482 (23.9%) |
| 26 to 34 Years | 7,828 (78.2%) | 2,184 (21.8%) |
| 35 to 44 Years | 9,392 (86.1%) | 1,519 (13.9%) |
| 45 to 54 Years | 7,433 (84.7%) | 1,345 (15.3%) |
| 55 to 64 Years | 9,252 (90.4%) | 978 (9.6%) |
| 65 to 74 Years | 7,743 (100.0%) | 0 (0.0%) |
| 75 Years and older | 4,624 (100.0%) | 0 (0.0%) |
| Total | 69,792 (88.9%) | 8,695 (11.1%) |
Health Insurance Coverage by Citizenship Status in Natrona County

| Citizenship Status | With Coverage | Without Coverage |
| Native Born | 5,498 (96.2%) | 219 (3.8%) |
| Foreign Born, Citizen | 13,306 (93.2%) | 968 (6.8%) |
| Foreign Born, not a Citizen | 4,716 (76.1%) | 1,482 (23.9%) |
Health Insurance Coverage by Household Income in Natrona County
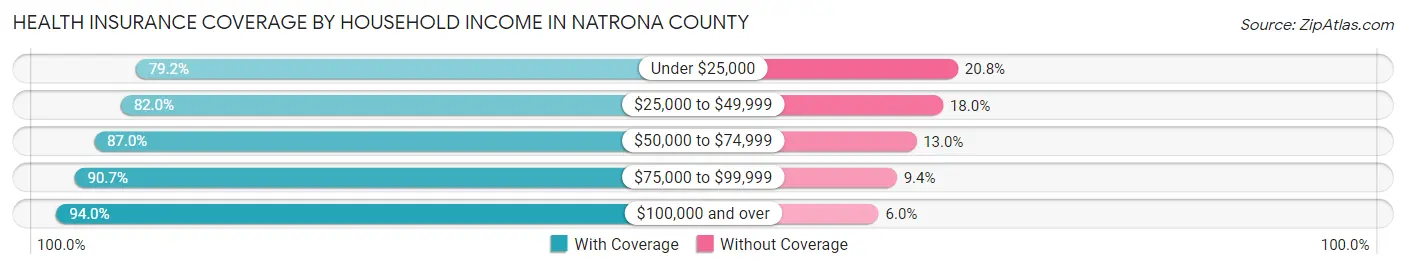
| Household Income | With Coverage | Without Coverage |
| Under $25,000 | 5,567 (79.2%) | 1,464 (20.8%) |
| $25,000 to $49,999 | 9,891 (82.0%) | 2,174 (18.0%) |
| $50,000 to $74,999 | 12,351 (87.0%) | 1,845 (13.0%) |
| $75,000 to $99,999 | 10,486 (90.6%) | 1,082 (9.3%) |
| $100,000 and over | 31,095 (94.0%) | 1,971 (6.0%) |
Public vs Private Health Insurance Coverage by Age in Natrona County
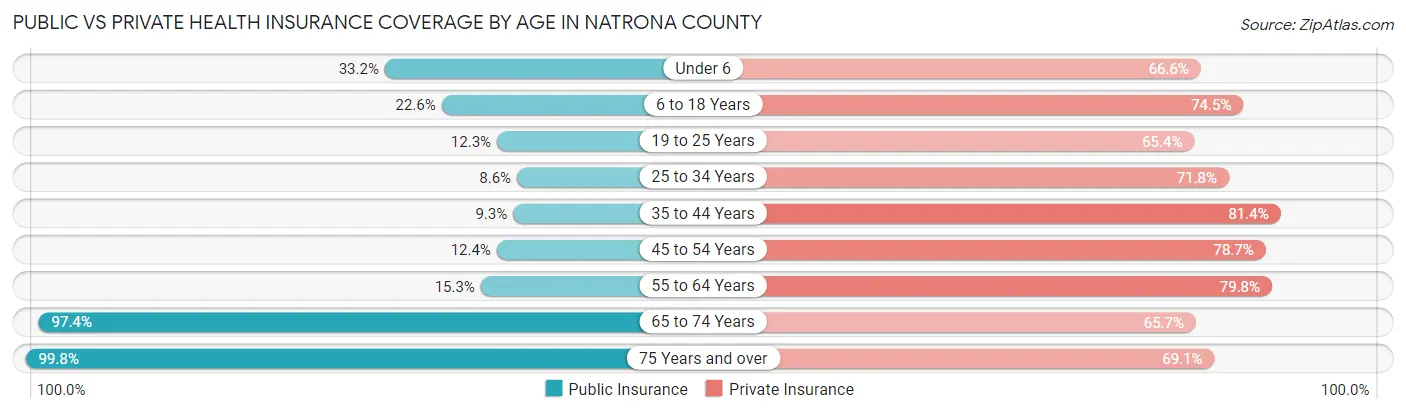
| Age Bracket | Public Insurance | Private Insurance |
| Under 6 | 1,895 (33.2%) | 3,808 (66.6%) |
| 6 to 18 Years | 3,227 (22.6%) | 10,635 (74.5%) |
| 19 to 25 Years | 764 (12.3%) | 4,054 (65.4%) |
| 25 to 34 Years | 863 (8.6%) | 7,193 (71.8%) |
| 35 to 44 Years | 1,019 (9.3%) | 8,884 (81.4%) |
| 45 to 54 Years | 1,086 (12.4%) | 6,904 (78.6%) |
| 55 to 64 Years | 1,569 (15.3%) | 8,166 (79.8%) |
| 65 to 74 Years | 7,541 (97.4%) | 5,087 (65.7%) |
| 75 Years and over | 4,616 (99.8%) | 3,197 (69.1%) |
| Total | 22,580 (28.8%) | 57,928 (73.8%) |
Disability Status by Sex by Age in Natrona County
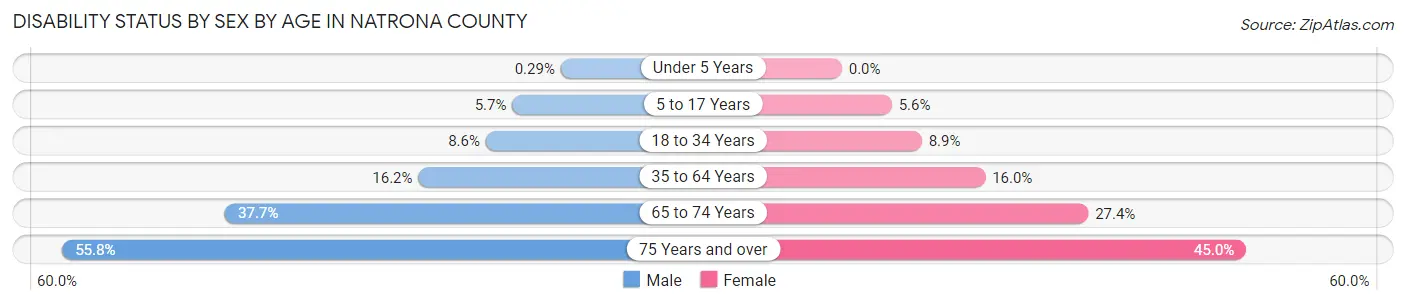
| Age Bracket | Male | Female |
| Under 5 Years | 7 (0.3%) | 0 (0.0%) |
| 5 to 17 Years | 414 (5.7%) | 376 (5.6%) |
| 18 to 34 Years | 763 (8.6%) | 752 (8.9%) |
| 35 to 64 Years | 2,440 (16.2%) | 2,365 (16.0%) |
| 65 to 74 Years | 1,484 (37.7%) | 1,044 (27.4%) |
| 75 Years and over | 1,076 (55.8%) | 1,214 (45.0%) |
Disability Class by Sex by Age in Natrona County
Disability Class: Hearing Difficulty
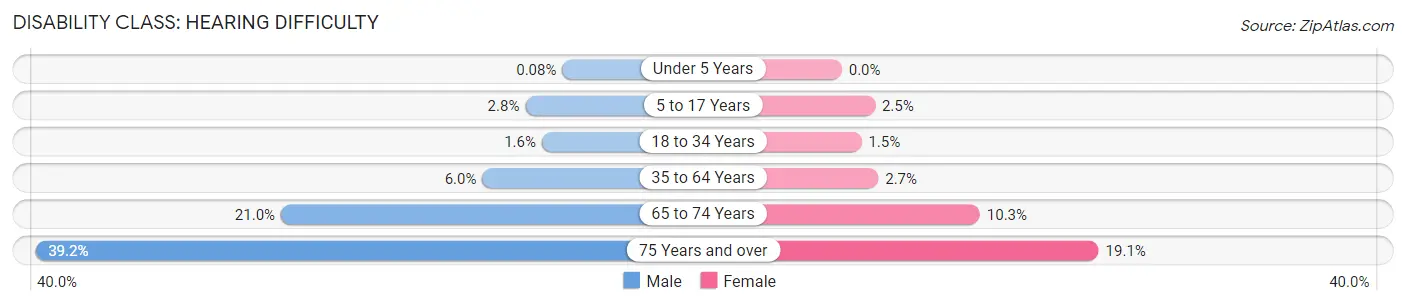
| Age Bracket | Male | Female |
| Under 5 Years | 2 (0.1%) | 0 (0.0%) |
| 5 to 17 Years | 206 (2.8%) | 166 (2.5%) |
| 18 to 34 Years | 141 (1.6%) | 123 (1.5%) |
| 35 to 64 Years | 910 (6.0%) | 401 (2.7%) |
| 65 to 74 Years | 826 (21.0%) | 390 (10.2%) |
| 75 Years and over | 756 (39.2%) | 514 (19.1%) |
Disability Class: Vision Difficulty
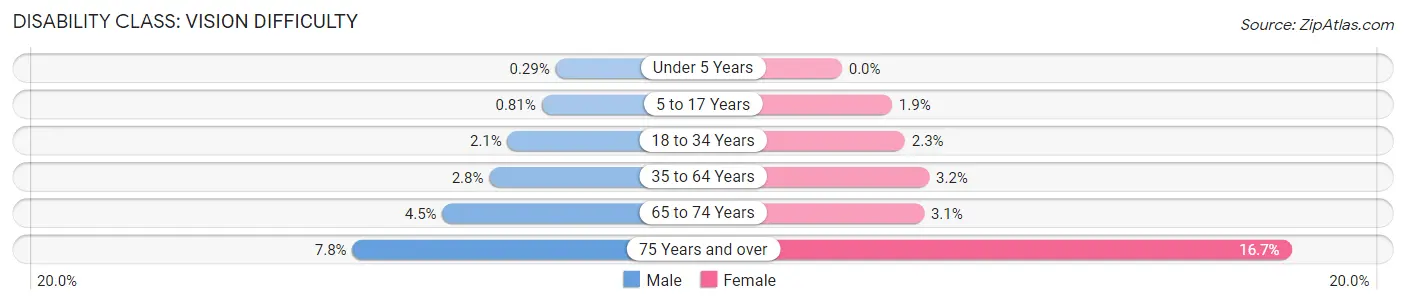
| Age Bracket | Male | Female |
| Under 5 Years | 7 (0.3%) | 0 (0.0%) |
| 5 to 17 Years | 59 (0.8%) | 126 (1.9%) |
| 18 to 34 Years | 183 (2.1%) | 198 (2.3%) |
| 35 to 64 Years | 416 (2.8%) | 480 (3.2%) |
| 65 to 74 Years | 177 (4.5%) | 116 (3.0%) |
| 75 Years and over | 151 (7.8%) | 450 (16.7%) |
Disability Class: Cognitive Difficulty
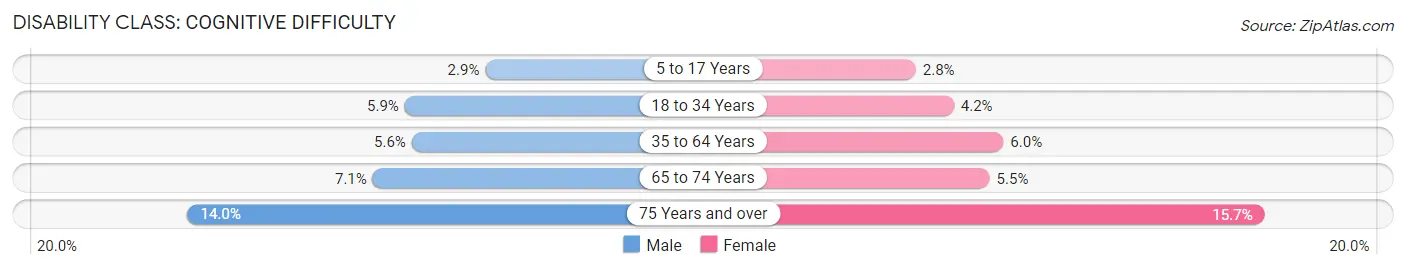
| Age Bracket | Male | Female |
| 5 to 17 Years | 211 (2.9%) | 186 (2.8%) |
| 18 to 34 Years | 520 (5.9%) | 351 (4.2%) |
| 35 to 64 Years | 851 (5.6%) | 888 (6.0%) |
| 65 to 74 Years | 279 (7.1%) | 209 (5.5%) |
| 75 Years and over | 269 (14.0%) | 423 (15.7%) |
Disability Class: Ambulatory Difficulty
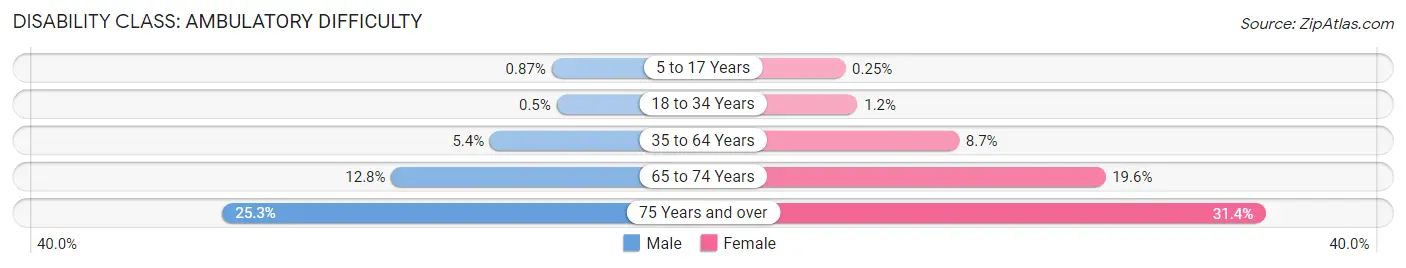
| Age Bracket | Male | Female |
| 5 to 17 Years | 63 (0.9%) | 17 (0.3%) |
| 18 to 34 Years | 44 (0.5%) | 97 (1.1%) |
| 35 to 64 Years | 822 (5.4%) | 1,287 (8.7%) |
| 65 to 74 Years | 503 (12.8%) | 744 (19.6%) |
| 75 Years and over | 488 (25.3%) | 847 (31.4%) |
Disability Class: Self-Care Difficulty
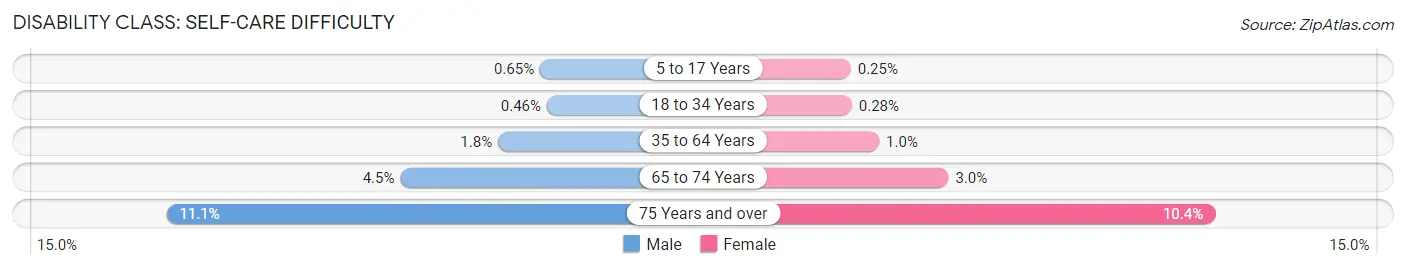
| Age Bracket | Male | Female |
| 5 to 17 Years | 47 (0.6%) | 17 (0.3%) |
| 18 to 34 Years | 41 (0.5%) | 24 (0.3%) |
| 35 to 64 Years | 275 (1.8%) | 154 (1.0%) |
| 65 to 74 Years | 179 (4.5%) | 113 (3.0%) |
| 75 Years and over | 213 (11.1%) | 280 (10.4%) |
Technology Access in Natrona County
Computing Device Access in Natrona County
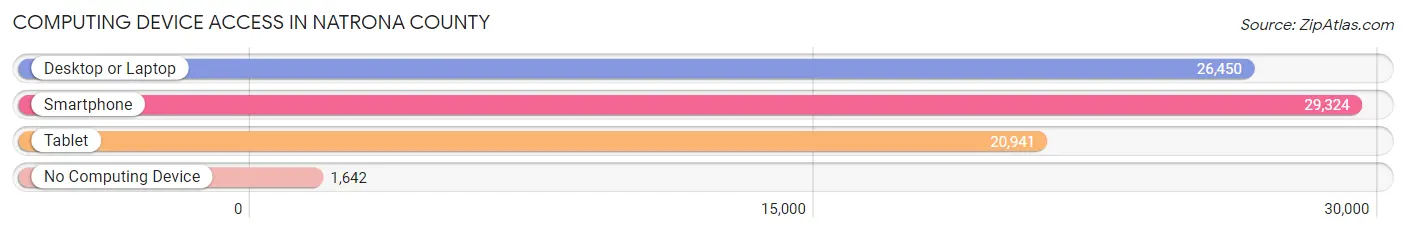
| Device Type | # Households | % Households |
| Desktop or Laptop | 26,450 | 80.4% |
| Smartphone | 29,324 | 89.1% |
| Tablet | 20,941 | 63.7% |
| No Computing Device | 1,642 | 5.0% |
| Total | 32,895 | 100.0% |
Internet Access in Natrona County
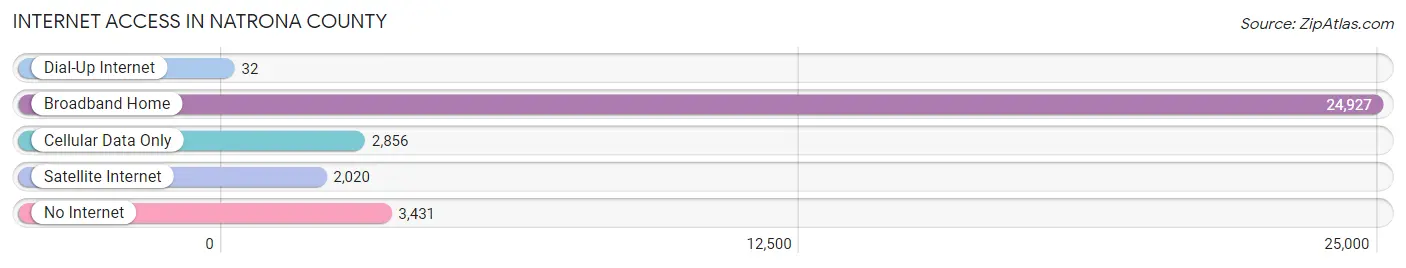
| Internet Type | # Households | % Households |
| Dial-Up Internet | 32 | 0.1% |
| Broadband Home | 24,927 | 75.8% |
| Cellular Data Only | 2,856 | 8.7% |
| Satellite Internet | 2,020 | 6.1% |
| No Internet | 3,431 | 10.4% |
| Total | 32,895 | 100.0% |
Natrona County Summary
Natrona County, Wyoming is located in the central part of the state and is the second most populous county in Wyoming. It is bordered by Johnson County to the north, Fremont County to the east, Sweetwater County to the south, and Converse County to the west. The county seat is Casper, which is also the largest city in the county. Natrona County is home to a variety of landscapes, including the Wind River Range, the Red Desert, and the Laramie Mountains.
History
Natrona County was established in 1888 and was named after the Natrona Salt Springs, which were located in the area. The county was originally part of Carbon County, but was split off in 1890. The county was originally populated by Native American tribes, including the Arapaho, Shoshone, and Crow. The first settlers in the area were ranchers and miners, who were attracted to the area by the abundance of natural resources.
Geography
Natrona County covers an area of 4,919 square miles and is located in the central part of Wyoming. The county is bordered by Johnson County to the north, Fremont County to the east, Sweetwater County to the south, and Converse County to the west. The county is home to a variety of landscapes, including the Wind River Range, the Red Desert, and the Laramie Mountains. The county is also home to several rivers, including the North Platte River, the Sweetwater River, and the Little Snake River.
Economy
Natrona County is home to a variety of industries, including oil and gas, mining, agriculture, and tourism. The county is home to several oil and gas fields, including the Salt Creek Oil Field, which is the largest oil field in Wyoming. The county is also home to several coal mines, including the Black Thunder Mine, which is the largest coal mine in the United States. Agriculture is also an important part of the county's economy, with cattle ranching and wheat farming being the two main agricultural activities. Tourism is also an important part of the county's economy, with the county being home to several national parks and monuments, including Yellowstone National Park and the Grand Teton National Park.
Demographics
As of the 2010 census, Natrona County had a population of 75,450. The population was spread out, with 24.3% under the age of 18, 10.2% from 18 to 24, 28.2% from 25 to 44, 24.2% from 45 to 64, and 13.1% who were 65 years of age or older. The median age was 36.3 years. The gender makeup of the county was 49.3% male and 50.7% female.
The median income for a household in the county was $50,945, and the median income for a family was $60,945. The per capita income for the county was $25,945. About 11.2% of families and 14.3% of the population were below the poverty line, including 19.2% of those under age 18 and 8.2% of those age 65 or over.
Natrona County is a diverse and vibrant county with a rich history and a variety of landscapes. The county is home to a variety of industries, including oil and gas, mining, agriculture, and tourism. The county is also home to a diverse population, with a median age of 36.3 years and a median income of $50,945. Natrona County is an important part of Wyoming and is sure to continue to be an important part of the state for many years to come.
Common Questions
What is the Total Population of Natrona County?
Total Population of Natrona County is 79,506.
What is the Total Male Population of Natrona County?
Total Male Population of Natrona County is 40,147.
What is the Total Female Population of Natrona County?
Total Female Population of Natrona County is 39,359.
What is the Ratio of Males per 100 Females in Natrona County?
There are 102.00 Males per 100 Females in Natrona County.
What is the Ratio of Females per 100 Males in Natrona County?
There are 98.04 Females per 100 Males in Natrona County.
What is the Median Population Age in Natrona County?
Median Population Age in Natrona County is 37.7 Years.
What is the Average Family Size in Natrona County
Average Family Size in Natrona County is 3.0 People.
What is the Average Household Size in Natrona County
Average Household Size in Natrona County is 2.4 People.
What is Per Capita Income in Natrona County?
Per Capita income in Natrona County is $40,346.
What is the Median Family Income in Natrona County?
Median Family Income in Natrona County is $88,465.
What is the Median Household income in Natrona County?
Median Household Income in Natrona County is $69,104.
What is Income or Wage Gap in Natrona County?
Income or Wage Gap in Natrona County is 34.4%.
Women in Natrona County earn 65.6 cents for every dollar earned by a man.
What is Family Income Deficit in Natrona County?
Family Income Deficit in Natrona County is $10,306.
Families that are below poverty line in Natrona County earn $10,306 less on average than the poverty threshold level.
What is Inequality or Gini Index in Natrona County?
Inequality or Gini Index in Natrona County is 0.44.
How Large is the Labor Force in Natrona County?
There are 42,286 People in the Labor Forcein in Natrona County.
What is the Percentage of People in the Labor Force in Natrona County?
67.5% of People are in the Labor Force in Natrona County.
What is the Unemployment Rate in Natrona County?
Unemployment Rate in Natrona County is 3.5%.