Lincoln County, WY
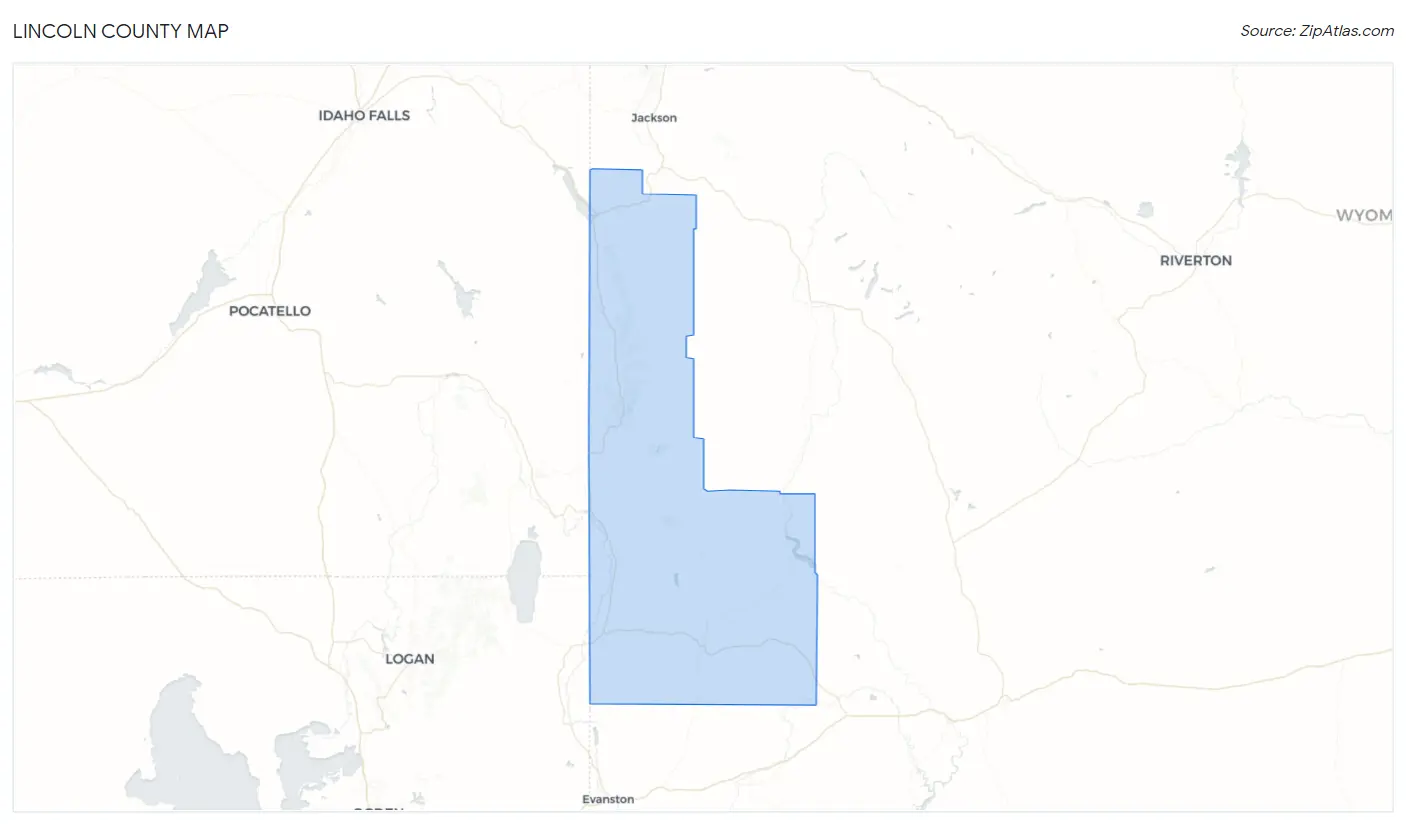
Lincoln County Map
Lincoln County Overview
19,794
TOTAL POPULATION
10,134
MALE POPULATION
9,660
FEMALE POPULATION
104.91
MALES / 100 FEMALES
95.32
FEMALES / 100 MALES
40.7
MEDIAN AGE
3.2
AVG FAMILY SIZE
2.6
AVG HOUSEHOLD SIZE
$38,245
PER CAPITA INCOME
$105,307
AVG FAMILY INCOME
$83,033
AVG HOUSEHOLD INCOME
48.9%
WAGE / INCOME GAP [ % ]
51.1¢/ $1
WAGE / INCOME GAP [ $ ]
$10,461
FAMILY INCOME DEFICIT
0.38
INEQUALITY / GINI INDEX
10,142
LABOR FORCE [ PEOPLE ]
66.5%
PERCENT IN LABOR FORCE
2.6%
UNEMPLOYMENT RATE
Lincoln County Area Codes
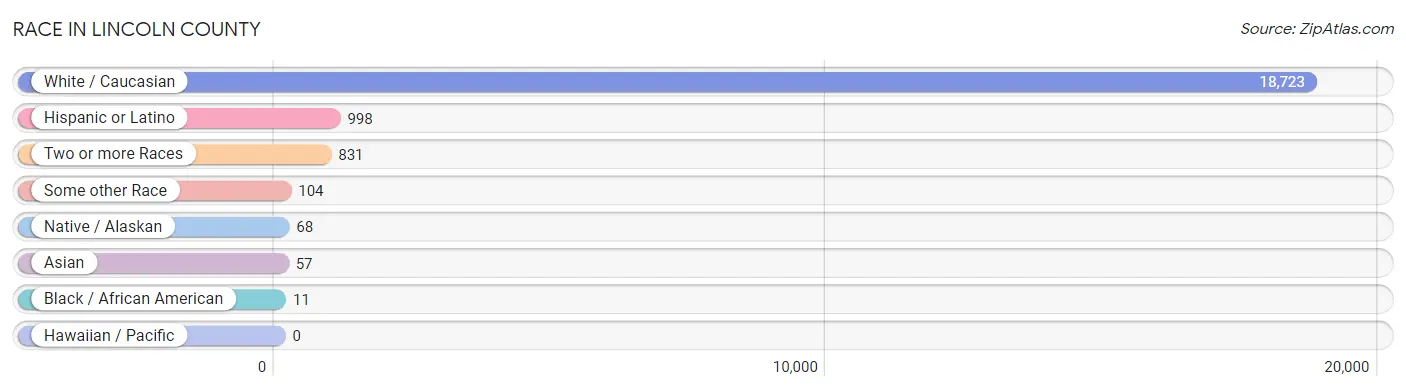
Race in Lincoln County
The most populous races in Lincoln County are White / Caucasian (18,723 | 94.6%), Hispanic or Latino (998 | 5.0%), and Two or more Races (831 | 4.2%).
| Race | # Population | % Population |
| Asian | 57 | 0.3% |
| Black / African American | 11 | 0.1% |
| Hawaiian / Pacific | 0 | 0.0% |
| Hispanic or Latino | 998 | 5.0% |
| Native / Alaskan | 68 | 0.3% |
| White / Caucasian | 18,723 | 94.6% |
| Two or more Races | 831 | 4.2% |
| Some other Race | 104 | 0.5% |
| Total | 19,794 | 100.0% |
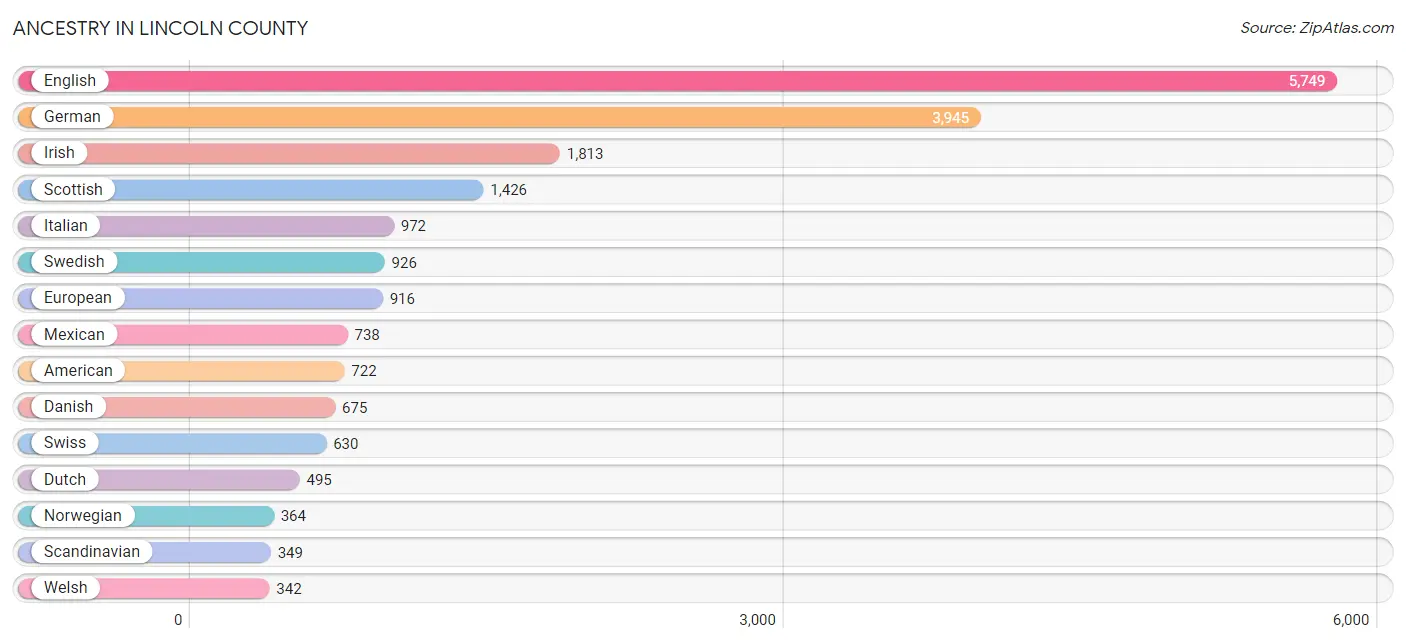
Ancestry in Lincoln County
The most populous ancestries reported in Lincoln County are English (5,749 | 29.0%), German (3,945 | 19.9%), Irish (1,813 | 9.2%), Scottish (1,426 | 7.2%), and Italian (972 | 4.9%), together accounting for 70.2% of all Lincoln County residents.
| Ancestry | # Population | % Population |
| African | 17 | 0.1% |
| Alaskan Athabascan | 5 | 0.0% |
| American | 722 | 3.6% |
| Apache | 7 | 0.0% |
| Arab | 21 | 0.1% |
| Arapaho | 1 | 0.0% |
| Armenian | 8 | 0.0% |
| Australian | 16 | 0.1% |
| Austrian | 58 | 0.3% |
| Belgian | 25 | 0.1% |
| Bhutanese | 53 | 0.3% |
| Brazilian | 4 | 0.0% |
| British | 179 | 0.9% |
| Burmese | 41 | 0.2% |
| Canadian | 27 | 0.1% |
| Central American | 53 | 0.3% |
| Central American Indian | 44 | 0.2% |
| Cherokee | 70 | 0.4% |
| Chippewa | 3 | 0.0% |
| Choctaw | 11 | 0.1% |
| Colombian | 45 | 0.2% |
| Colville | 9 | 0.1% |
| Comanche | 12 | 0.1% |
| Czech | 62 | 0.3% |
| Czechoslovakian | 11 | 0.1% |
| Danish | 675 | 3.4% |
| Dutch | 495 | 2.5% |
| Eastern European | 33 | 0.2% |
| Ecuadorian | 4 | 0.0% |
| English | 5,749 | 29.0% |
| European | 916 | 4.6% |
| Finnish | 30 | 0.2% |
| French | 248 | 1.3% |
| French Canadian | 132 | 0.7% |
| German | 3,945 | 19.9% |
| Greek | 1 | 0.0% |
| Guatemalan | 43 | 0.2% |
| Hungarian | 18 | 0.1% |
| Indian (Asian) | 16 | 0.1% |
| Irish | 1,813 | 9.2% |
| Italian | 972 | 4.9% |
| Korean | 68 | 0.3% |
| Latvian | 24 | 0.1% |
| Lebanese | 7 | 0.0% |
| Lithuanian | 34 | 0.2% |
| Mexican | 738 | 3.7% |
| Mexican American Indian | 54 | 0.3% |
| Native Hawaiian | 1 | 0.0% |
| Navajo | 34 | 0.2% |
| Northern European | 26 | 0.1% |
| Norwegian | 364 | 1.8% |
| Ottawa | 17 | 0.1% |
| Panamanian | 10 | 0.1% |
| Polish | 188 | 0.9% |
| Portuguese | 36 | 0.2% |
| Puerto Rican | 12 | 0.1% |
| Romanian | 2 | 0.0% |
| Russian | 93 | 0.5% |
| Samoan | 6 | 0.0% |
| Scandinavian | 349 | 1.8% |
| Scotch-Irish | 245 | 1.2% |
| Scottish | 1,426 | 7.2% |
| Shoshone | 79 | 0.4% |
| Sioux | 15 | 0.1% |
| Slavic | 5 | 0.0% |
| Slovak | 7 | 0.0% |
| Slovene | 28 | 0.1% |
| South American | 49 | 0.3% |
| Spaniard | 90 | 0.4% |
| Spanish | 53 | 0.3% |
| Subsaharan African | 17 | 0.1% |
| Swedish | 926 | 4.7% |
| Swiss | 630 | 3.2% |
| Syrian | 14 | 0.1% |
| Thai | 4 | 0.0% |
| Ukrainian | 38 | 0.2% |
| Ute | 12 | 0.1% |
| Welsh | 342 | 1.7% |
| West Indian | 7 | 0.0% |
| Yugoslavian | 24 | 0.1% | View All 80 Rows |
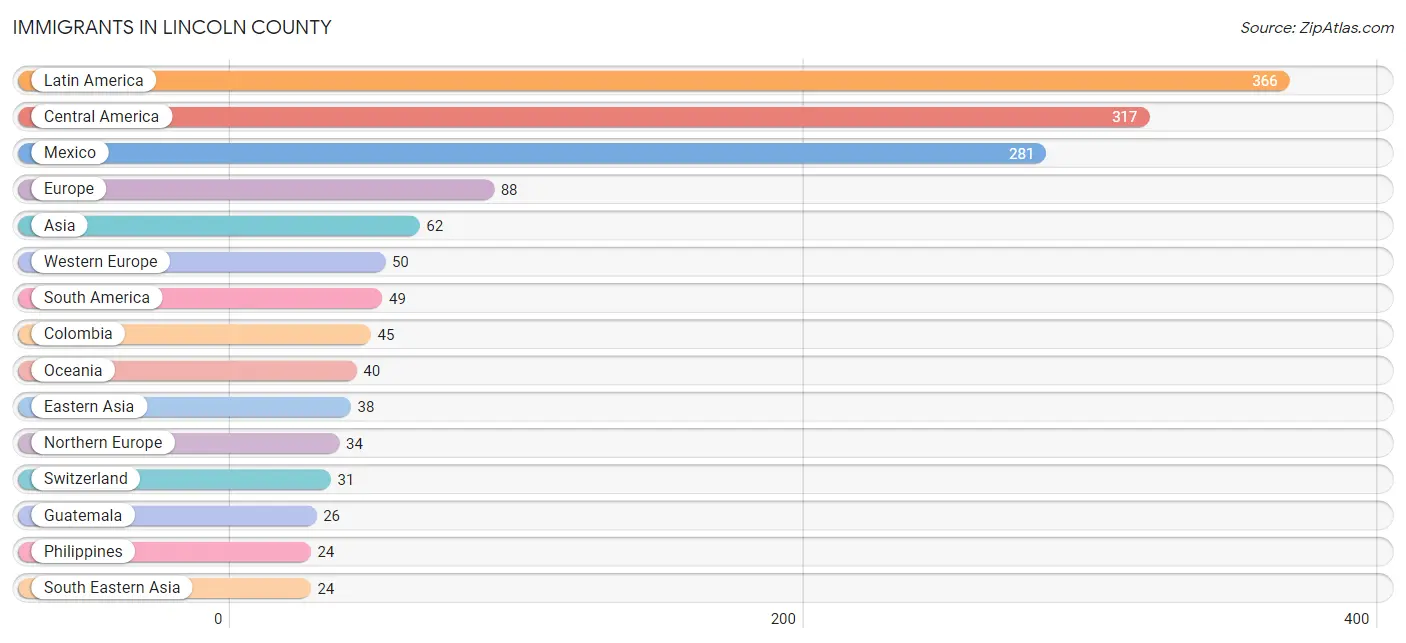
Immigrants in Lincoln County
The most numerous immigrant groups reported in Lincoln County came from Latin America (366 | 1.8%), Central America (317 | 1.6%), Mexico (281 | 1.4%), Europe (88 | 0.4%), and Asia (62 | 0.3%), together accounting for 5.6% of all Lincoln County residents.
| Immigration Origin | # Population | % Population |
| Africa | 13 | 0.1% |
| Asia | 62 | 0.3% |
| Australia | 16 | 0.1% |
| Brazil | 4 | 0.0% |
| Canada | 12 | 0.1% |
| Central America | 317 | 1.6% |
| China | 14 | 0.1% |
| Colombia | 45 | 0.2% |
| Eastern Asia | 38 | 0.2% |
| Eastern Europe | 4 | 0.0% |
| England | 19 | 0.1% |
| Europe | 88 | 0.4% |
| Guatemala | 26 | 0.1% |
| Japan | 6 | 0.0% |
| Korea | 18 | 0.1% |
| Latin America | 366 | 1.8% |
| Mexico | 281 | 1.4% |
| Netherlands | 19 | 0.1% |
| Northern Europe | 34 | 0.2% |
| Oceania | 40 | 0.2% |
| Panama | 10 | 0.1% |
| Philippines | 24 | 0.1% |
| Poland | 2 | 0.0% |
| Russia | 2 | 0.0% |
| South Africa | 13 | 0.1% |
| South America | 49 | 0.3% |
| South Eastern Asia | 24 | 0.1% |
| Switzerland | 31 | 0.2% |
| Western Europe | 50 | 0.3% | View All 29 Rows |
Sex and Age in Lincoln County
Sex and Age in Lincoln County
The most populous age groups in Lincoln County are 10 to 14 Years (979 | 9.7%) for men and 5 to 9 Years (845 | 8.7%) for women.
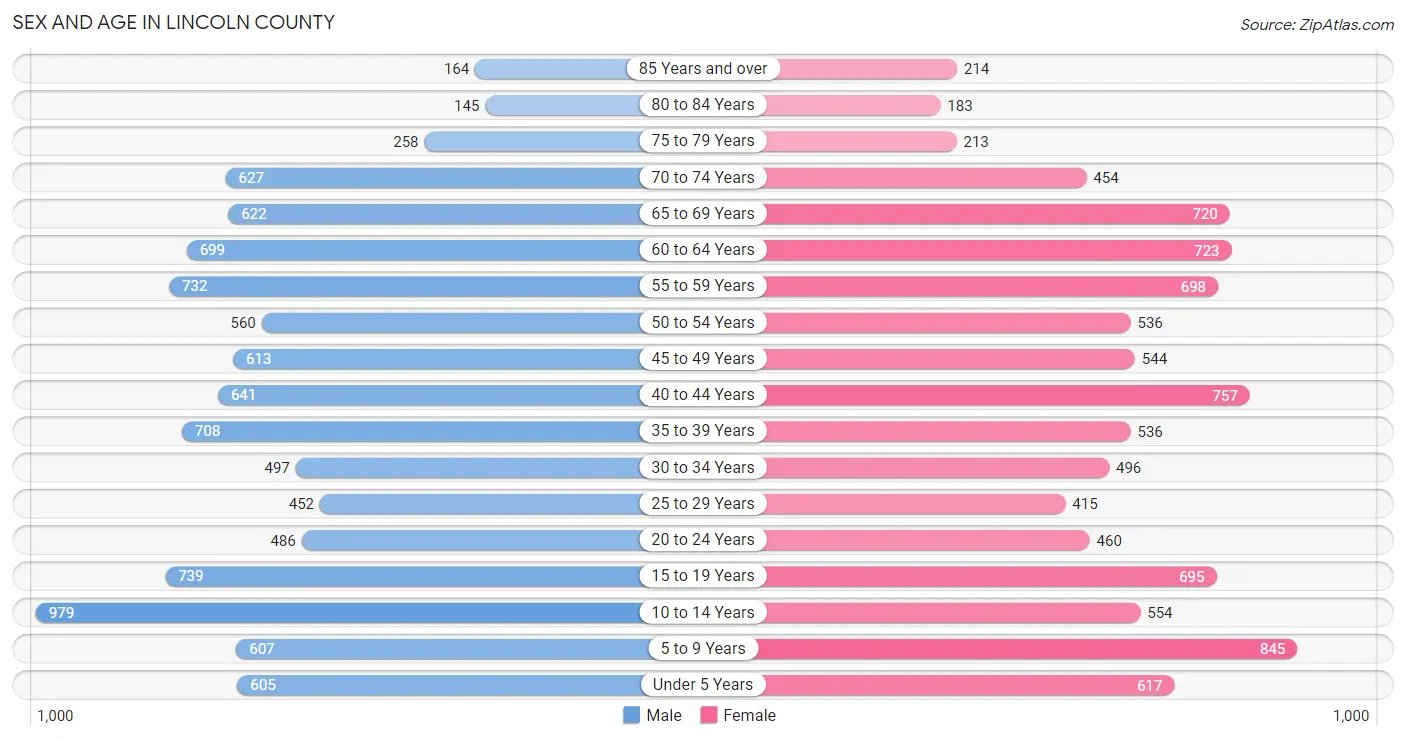
| Age Bracket | Male | Female |
| Under 5 Years | 605 (6.0%) | 617 (6.4%) |
| 5 to 9 Years | 607 (6.0%) | 845 (8.7%) |
| 10 to 14 Years | 979 (9.7%) | 554 (5.7%) |
| 15 to 19 Years | 739 (7.3%) | 695 (7.2%) |
| 20 to 24 Years | 486 (4.8%) | 460 (4.8%) |
| 25 to 29 Years | 452 (4.5%) | 415 (4.3%) |
| 30 to 34 Years | 497 (4.9%) | 496 (5.1%) |
| 35 to 39 Years | 708 (7.0%) | 536 (5.6%) |
| 40 to 44 Years | 641 (6.3%) | 757 (7.8%) |
| 45 to 49 Years | 613 (6.0%) | 544 (5.6%) |
| 50 to 54 Years | 560 (5.5%) | 536 (5.6%) |
| 55 to 59 Years | 732 (7.2%) | 698 (7.2%) |
| 60 to 64 Years | 699 (6.9%) | 723 (7.5%) |
| 65 to 69 Years | 622 (6.1%) | 720 (7.4%) |
| 70 to 74 Years | 627 (6.2%) | 454 (4.7%) |
| 75 to 79 Years | 258 (2.5%) | 213 (2.2%) |
| 80 to 84 Years | 145 (1.4%) | 183 (1.9%) |
| 85 Years and over | 164 (1.6%) | 214 (2.2%) |
| Total | 10,134 (100.0%) | 9,660 (100.0%) |
Families and Households in Lincoln County
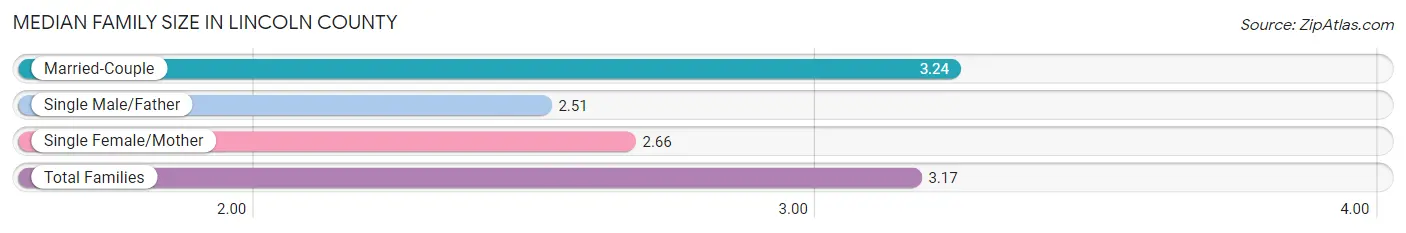
Median Family Size in Lincoln County
The median family size in Lincoln County is 3.17 persons per family, with married-couple families (4,631 | 89.0%) accounting for the largest median family size of 3.24 persons per family. On the other hand, single male/father families (202 | 3.9%) represent the smallest median family size with 2.51 persons per family.
| Family Type | # Families | Family Size |
| Married-Couple | 4,631 (89.0%) | 3.24 |
| Single Male/Father | 202 (3.9%) | 2.51 |
| Single Female/Mother | 371 (7.1%) | 2.66 |
| Total Families | 5,204 (100.0%) | 3.17 |
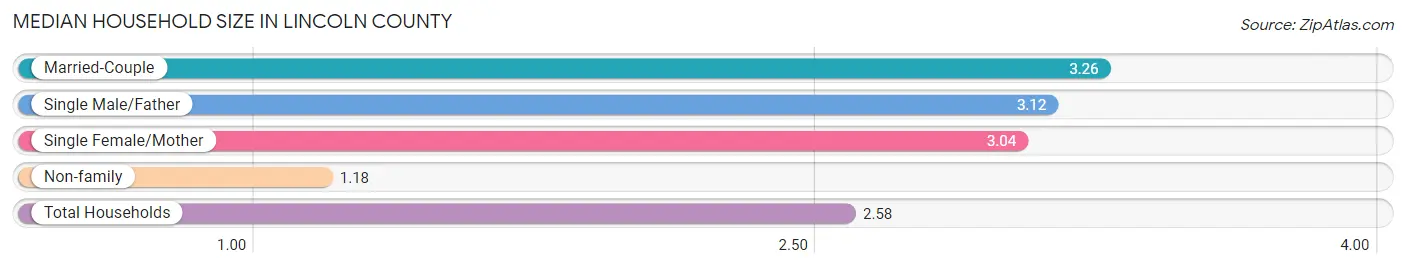
Median Household Size in Lincoln County
The median household size in Lincoln County is 2.58 persons per household, with married-couple households (4,631 | 60.7%) accounting for the largest median household size of 3.26 persons per household. non-family households (2,425 | 31.8%) represent the smallest median household size with 1.18 persons per household.
| Household Type | # Households | Household Size |
| Married-Couple | 4,631 (60.7%) | 3.26 |
| Single Male/Father | 202 (2.6%) | 3.12 |
| Single Female/Mother | 371 (4.9%) | 3.04 |
| Non-family | 2,425 (31.8%) | 1.18 |
| Total Households | 7,629 (100.0%) | 2.58 |
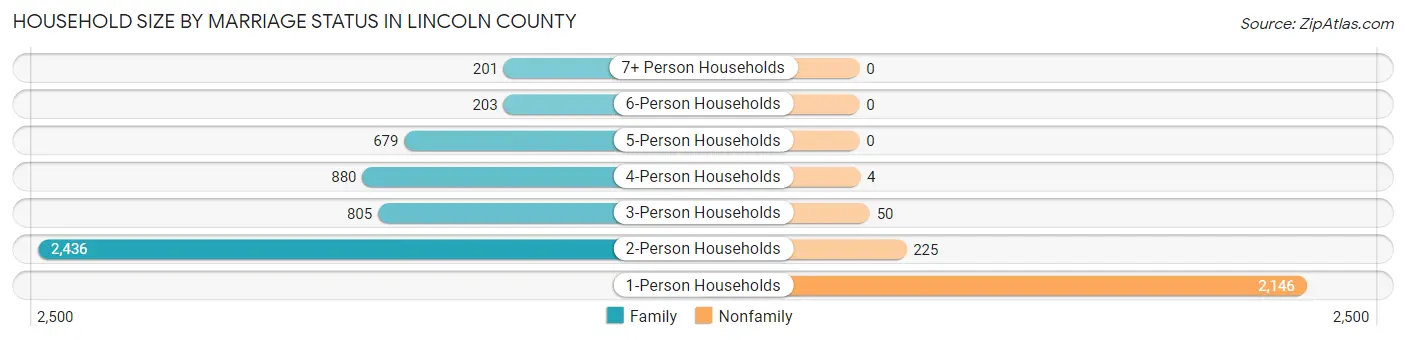
Household Size by Marriage Status in Lincoln County
Out of a total of 7,629 households in Lincoln County, 5,204 (68.2%) are family households, while 2,425 (31.8%) are nonfamily households. The most numerous type of family households are 2-person households, comprising 2,436, and the most common type of nonfamily households are 1-person households, comprising 2,146.
| Household Size | Family Households | Nonfamily Households |
| 1-Person Households | - | 2,146 (28.1%) |
| 2-Person Households | 2,436 (31.9%) | 225 (2.9%) |
| 3-Person Households | 805 (10.5%) | 50 (0.7%) |
| 4-Person Households | 880 (11.5%) | 4 (0.1%) |
| 5-Person Households | 679 (8.9%) | 0 (0.0%) |
| 6-Person Households | 203 (2.7%) | 0 (0.0%) |
| 7+ Person Households | 201 (2.6%) | 0 (0.0%) |
| Total | 5,204 (68.2%) | 2,425 (31.8%) |
Female Fertility in Lincoln County
Fertility by Age in Lincoln County
Average fertility rate in Lincoln County is 56.0 births per 1,000 women. Women in the age bracket of 20 to 34 years have the highest fertility rate with 97.0 births per 1,000 women. Women in the age bracket of 20 to 34 years acount for 59.1% of all women with births.
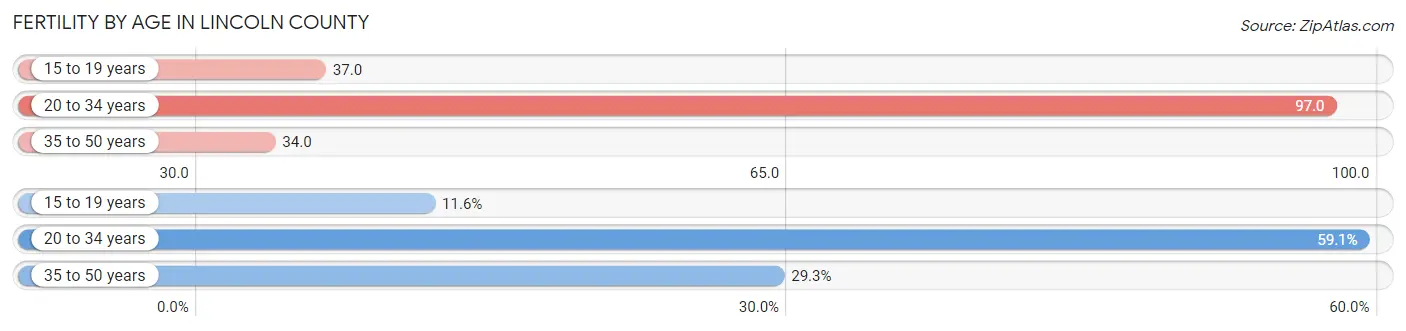
| Age Bracket | Women with Births | Births / 1,000 Women |
| 15 to 19 years | 26 (11.6%) | 37.0 |
| 20 to 34 years | 133 (59.1%) | 97.0 |
| 35 to 50 years | 66 (29.3%) | 34.0 |
| Total | 225 (100.0%) | 56.0 |
Fertility by Age by Marriage Status in Lincoln County
63.1% of women with births (225) in Lincoln County are married. The highest percentage of unmarried women with births falls into 15 to 19 years age bracket with 100.0% of them unmarried at the time of birth, while the lowest percentage of unmarried women with births belong to 35 to 50 years age bracket with 16.7% of them unmarried.
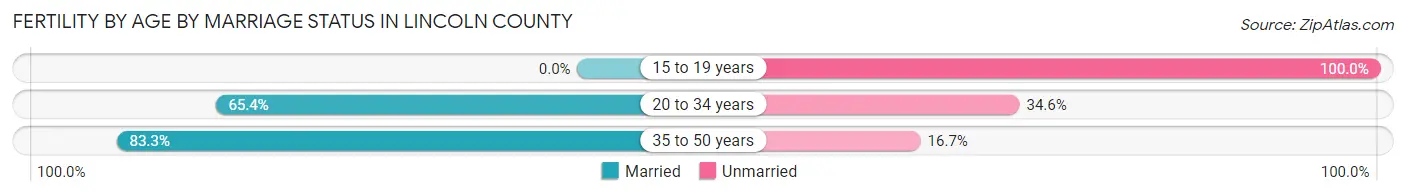
| Age Bracket | Married | Unmarried |
| 15 to 19 years | 0 (0.0%) | 26 (100.0%) |
| 20 to 34 years | 87 (65.4%) | 46 (34.6%) |
| 35 to 50 years | 55 (83.3%) | 11 (16.7%) |
| Total | 142 (63.1%) | 83 (36.9%) |
Fertility by Education in Lincoln County
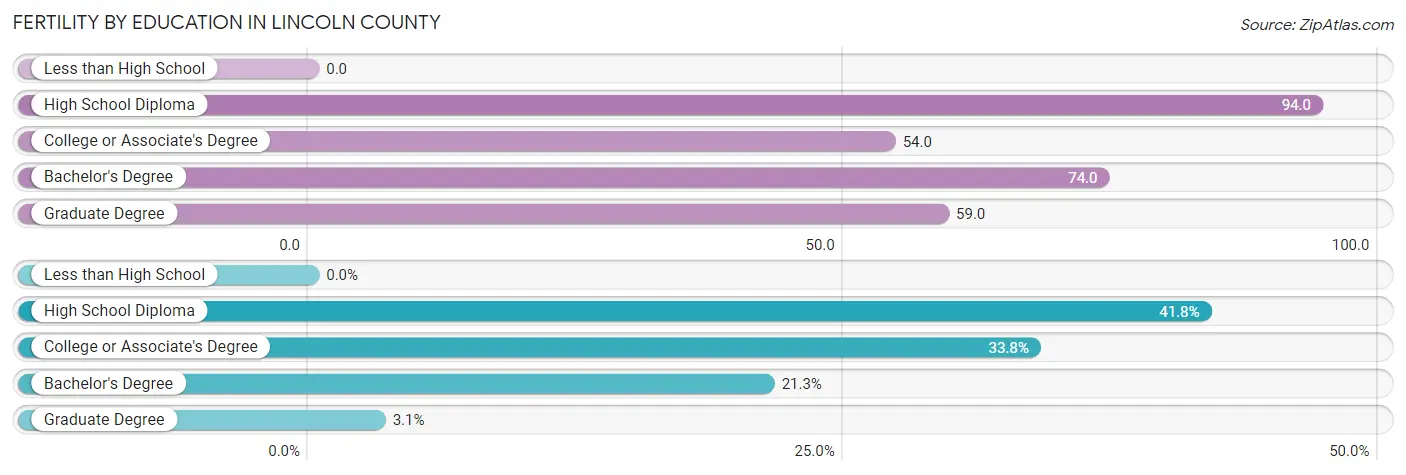
| Educational Attainment | Women with Births | Births / 1,000 Women |
| Less than High School | 0 (0.0%) | 0.0 |
| High School Diploma | 94 (41.8%) | 94.0 |
| College or Associate's Degree | 76 (33.8%) | 54.0 |
| Bachelor's Degree | 48 (21.3%) | 74.0 |
| Graduate Degree | 7 (3.1%) | 59.0 |
| Total | 225 (100.0%) | 56.0 |
Fertility by Education by Marriage Status in Lincoln County
36.9% of women with births in Lincoln County are unmarried. Women with the educational attainment of bachelor's degree are most likely to be married with 100.0% of them married at childbirth, while women with the educational attainment of high school diploma are least likely to be married with 48.9% of them unmarried at childbirth.
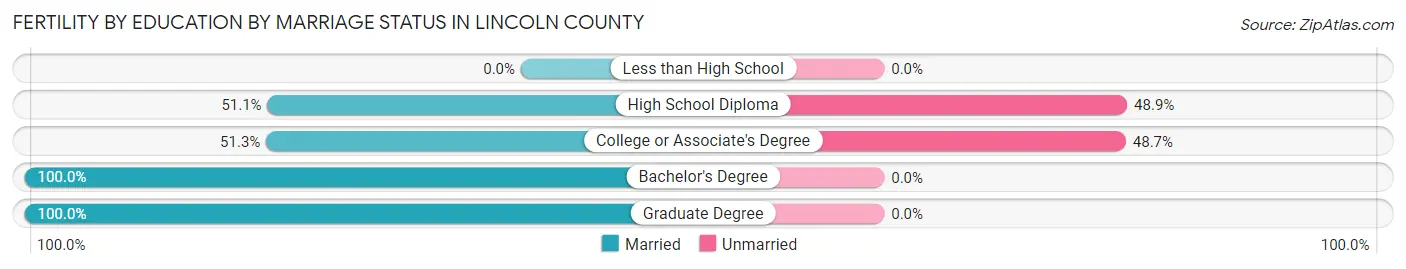
| Educational Attainment | Married | Unmarried |
| Less than High School | 0 (0.0%) | 0 (0.0%) |
| High School Diploma | 48 (51.1%) | 46 (48.9%) |
| College or Associate's Degree | 39 (51.3%) | 37 (48.7%) |
| Bachelor's Degree | 48 (100.0%) | 0 (0.0%) |
| Graduate Degree | 7 (100.0%) | 0 (0.0%) |
| Total | 142 (63.1%) | 83 (36.9%) |
Income in Lincoln County
Income Overview in Lincoln County
Per Capita Income in Lincoln County is $38,245, while median incomes of families and households are $105,307 and $83,033 respectively.
| Characteristic | Number | Measure |
| Per Capita Income | 19,794 | $38,245 |
| Median Family Income | 5,204 | $105,307 |
| Mean Family Income | 5,204 | $113,635 |
| Median Household Income | 7,629 | $83,033 |
| Mean Household Income | 7,629 | $98,906 |
| Income Deficit | 5,204 | $10,461 |
| Wage / Income Gap (%) | 19,794 | 48.90% |
| Wage / Income Gap ($) | 19,794 | 51.10¢ per $1 |
| Gini / Inequality Index | 19,794 | 0.38 |
Earnings by Sex in Lincoln County
Average Earnings in Lincoln County are $42,374, $58,320 for men and $29,802 for women, a difference of 48.9%.
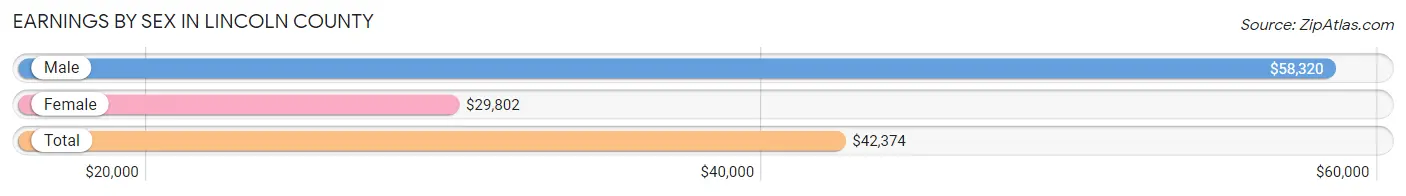
| Sex | Number | Average Earnings |
| Male | 5,954 (54.0%) | $58,320 |
| Female | 5,065 (46.0%) | $29,802 |
| Total | 11,019 (100.0%) | $42,374 |
Earnings by Sex by Income Bracket in Lincoln County
The most common earnings brackets in Lincoln County are $100,000+ for men (1,215 | 20.4%) and $2,499 or less for women (508 | 10.0%).
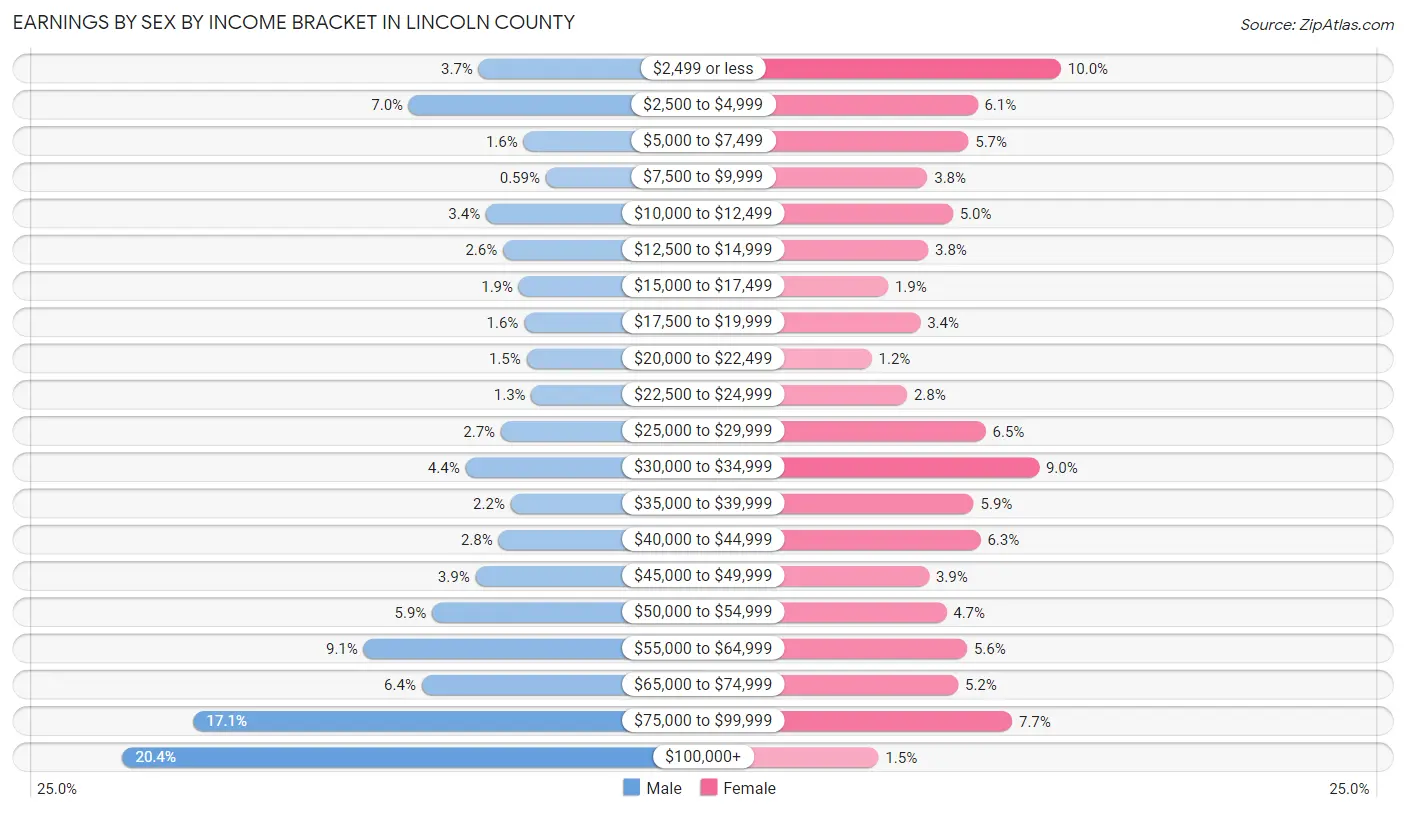
| Income | Male | Female |
| $2,499 or less | 222 (3.7%) | 508 (10.0%) |
| $2,500 to $4,999 | 417 (7.0%) | 310 (6.1%) |
| $5,000 to $7,499 | 97 (1.6%) | 288 (5.7%) |
| $7,500 to $9,999 | 35 (0.6%) | 191 (3.8%) |
| $10,000 to $12,499 | 202 (3.4%) | 251 (5.0%) |
| $12,500 to $14,999 | 154 (2.6%) | 193 (3.8%) |
| $15,000 to $17,499 | 110 (1.8%) | 98 (1.9%) |
| $17,500 to $19,999 | 95 (1.6%) | 174 (3.4%) |
| $20,000 to $22,499 | 89 (1.5%) | 59 (1.2%) |
| $22,500 to $24,999 | 75 (1.3%) | 143 (2.8%) |
| $25,000 to $29,999 | 160 (2.7%) | 329 (6.5%) |
| $30,000 to $34,999 | 259 (4.3%) | 456 (9.0%) |
| $35,000 to $39,999 | 133 (2.2%) | 301 (5.9%) |
| $40,000 to $44,999 | 167 (2.8%) | 317 (6.3%) |
| $45,000 to $49,999 | 231 (3.9%) | 195 (3.8%) |
| $50,000 to $54,999 | 352 (5.9%) | 236 (4.7%) |
| $55,000 to $64,999 | 543 (9.1%) | 285 (5.6%) |
| $65,000 to $74,999 | 381 (6.4%) | 264 (5.2%) |
| $75,000 to $99,999 | 1,017 (17.1%) | 392 (7.7%) |
| $100,000+ | 1,215 (20.4%) | 75 (1.5%) |
| Total | 5,954 (100.0%) | 5,065 (100.0%) |
Earnings by Sex by Educational Attainment in Lincoln County
Average earnings in Lincoln County are $66,313 for men and $34,061 for women, a difference of 48.6%. Men with an educational attainment of graduate degree enjoy the highest average annual earnings of $96,836, while those with less than high school education earn the least with $42,813. Women with an educational attainment of graduate degree earn the most with the average annual earnings of $68,750, while those with high school diploma education have the smallest earnings of $27,700.
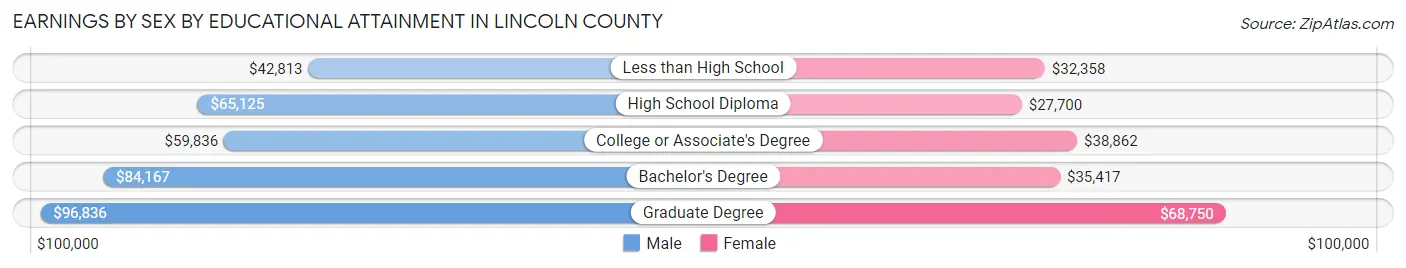
| Educational Attainment | Male Income | Female Income |
| Less than High School | $42,813 | $32,358 |
| High School Diploma | $65,125 | $27,700 |
| College or Associate's Degree | $59,836 | $38,862 |
| Bachelor's Degree | $84,167 | $35,417 |
| Graduate Degree | $96,836 | $68,750 |
| Total | $66,313 | $34,061 |
Family Income in Lincoln County
Family Income Brackets in Lincoln County
According to the Lincoln County family income data, there are 1,546 families falling into the $100,000 to $149,999 income range, which is the most common income bracket and makes up 29.7% of all families. Conversely, the $10,000 to $14,999 income bracket is the least frequent group with only 88 families (1.7%) belonging to this category.
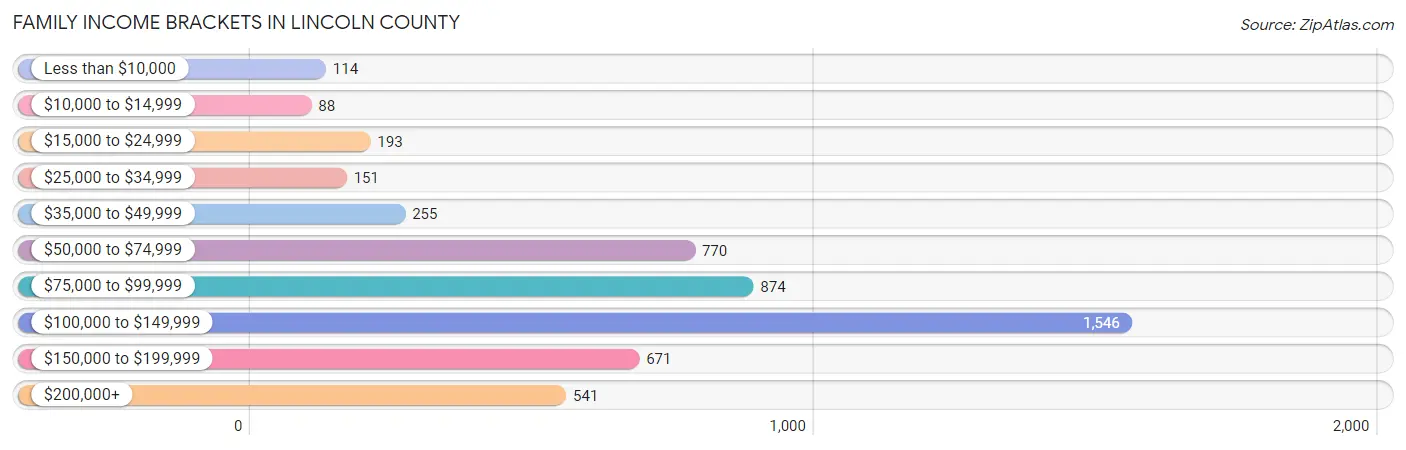
| Income Bracket | # Families | % Families |
| Less than $10,000 | 114 | 2.2% |
| $10,000 to $14,999 | 88 | 1.7% |
| $15,000 to $24,999 | 193 | 3.7% |
| $25,000 to $34,999 | 151 | 2.9% |
| $35,000 to $49,999 | 255 | 4.9% |
| $50,000 to $74,999 | 770 | 14.8% |
| $75,000 to $99,999 | 874 | 16.8% |
| $100,000 to $149,999 | 1,546 | 29.7% |
| $150,000 to $199,999 | 671 | 12.9% |
| $200,000+ | 541 | 10.4% |
Family Income by Famaliy Size in Lincoln County
4-person families (786 | 15.1%) account for the highest median family income in Lincoln County with $117,917 per family, while 2-person families (2,553 | 49.1%) have the highest median income of $41,891 per family member.
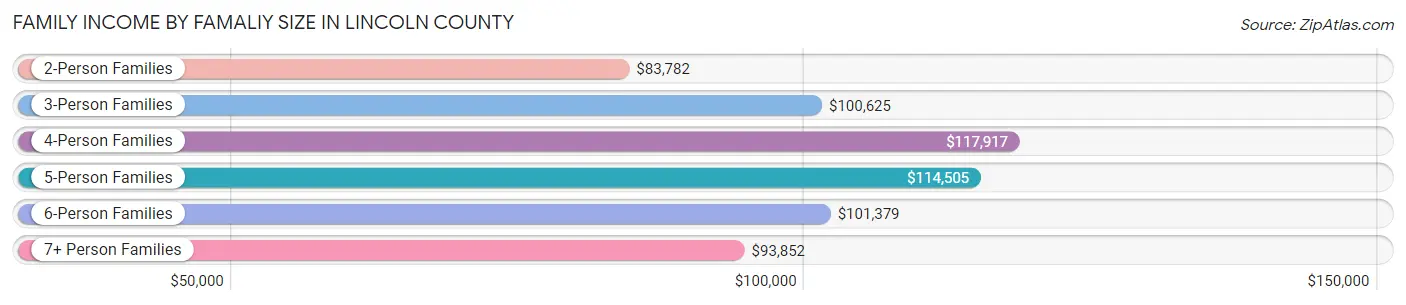
| Income Bracket | # Families | Median Income |
| 2-Person Families | 2,553 (49.1%) | $83,782 |
| 3-Person Families | 815 (15.7%) | $100,625 |
| 4-Person Families | 786 (15.1%) | $117,917 |
| 5-Person Families | 685 (13.2%) | $114,505 |
| 6-Person Families | 166 (3.2%) | $101,379 |
| 7+ Person Families | 199 (3.8%) | $93,852 |
| Total | 5,204 (100.0%) | $105,307 |
Family Income by Number of Earners in Lincoln County
The median family income in Lincoln County is $105,307, with families comprising 3+ earners (942) having the highest median family income of $124,531, while families with no earners (844) have the lowest median family income of $68,750, accounting for 18.1% and 16.2% of families, respectively.
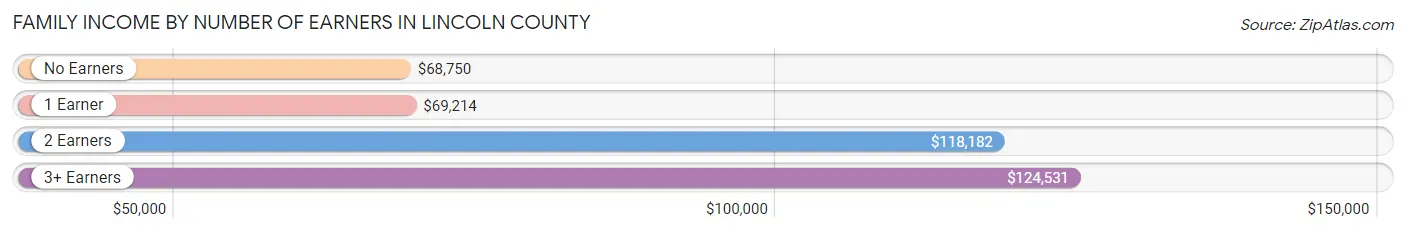
| Number of Earners | # Families | Median Income |
| No Earners | 844 (16.2%) | $68,750 |
| 1 Earner | 1,282 (24.6%) | $69,214 |
| 2 Earners | 2,136 (41.0%) | $118,182 |
| 3+ Earners | 942 (18.1%) | $124,531 |
| Total | 5,204 (100.0%) | $105,307 |
Household Income in Lincoln County
Household Income Brackets in Lincoln County
With 1,778 households falling in the category, the $100,000 to $149,999 income range is the most frequent in Lincoln County, accounting for 23.3% of all households. In contrast, only 122 households (1.6%) fall into the $10,000 to $14,999 income bracket, making it the least populous group.
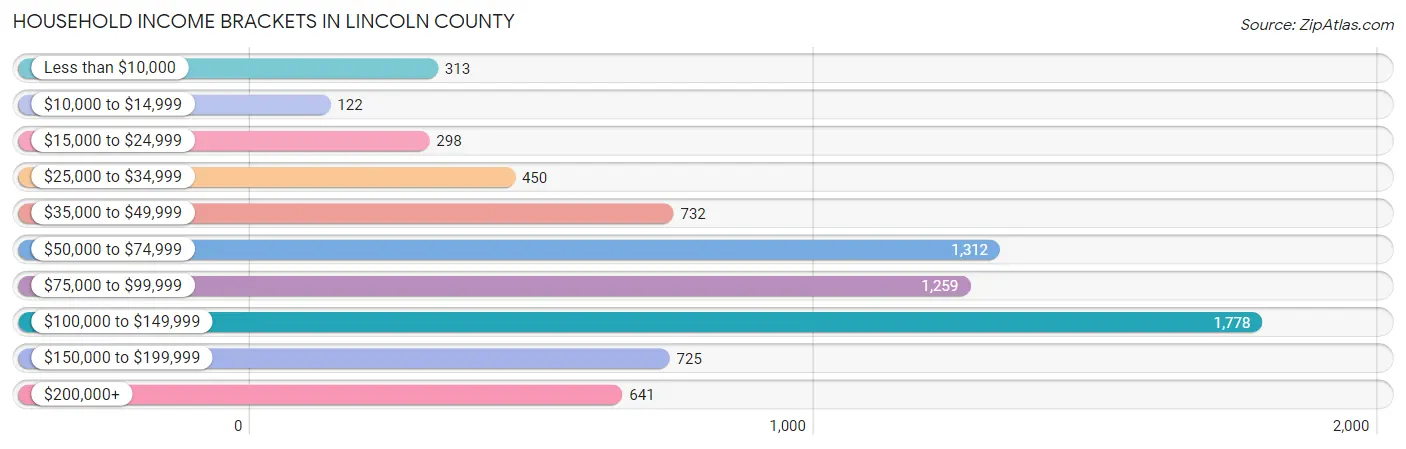
| Income Bracket | # Households | % Households |
| Less than $10,000 | 313 | 4.1% |
| $10,000 to $14,999 | 122 | 1.6% |
| $15,000 to $24,999 | 298 | 3.9% |
| $25,000 to $34,999 | 450 | 5.9% |
| $35,000 to $49,999 | 732 | 9.6% |
| $50,000 to $74,999 | 1,312 | 17.2% |
| $75,000 to $99,999 | 1,259 | 16.5% |
| $100,000 to $149,999 | 1,778 | 23.3% |
| $150,000 to $199,999 | 725 | 9.5% |
| $200,000+ | 641 | 8.4% |
Household Income by Householder Age in Lincoln County
The median household income in Lincoln County is $83,033, with the highest median household income of $101,635 found in the 45 to 64 years age bracket for the primary householder. A total of 2,768 households (36.3%) fall into this category. Meanwhile, the 15 to 24 years age bracket for the primary householder has the lowest median household income of $46,587, with 167 households (2.2%) in this group.
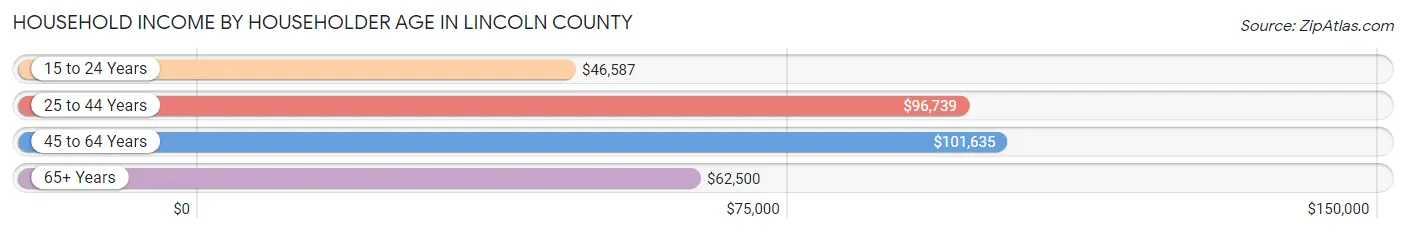
| Income Bracket | # Households | Median Income |
| 15 to 24 Years | 167 (2.2%) | $46,587 |
| 25 to 44 Years | 2,488 (32.6%) | $96,739 |
| 45 to 64 Years | 2,768 (36.3%) | $101,635 |
| 65+ Years | 2,206 (28.9%) | $62,500 |
| Total | 7,629 (100.0%) | $83,033 |
Poverty in Lincoln County
Income Below Poverty by Sex and Age in Lincoln County
With 5.4% poverty level for males and 8.8% for females among the residents of Lincoln County, 15 year old males and 18 to 24 year old females are the most vulnerable to poverty, with 41 males (19.6%) and 121 females (18.5%) in their respective age groups living below the poverty level.
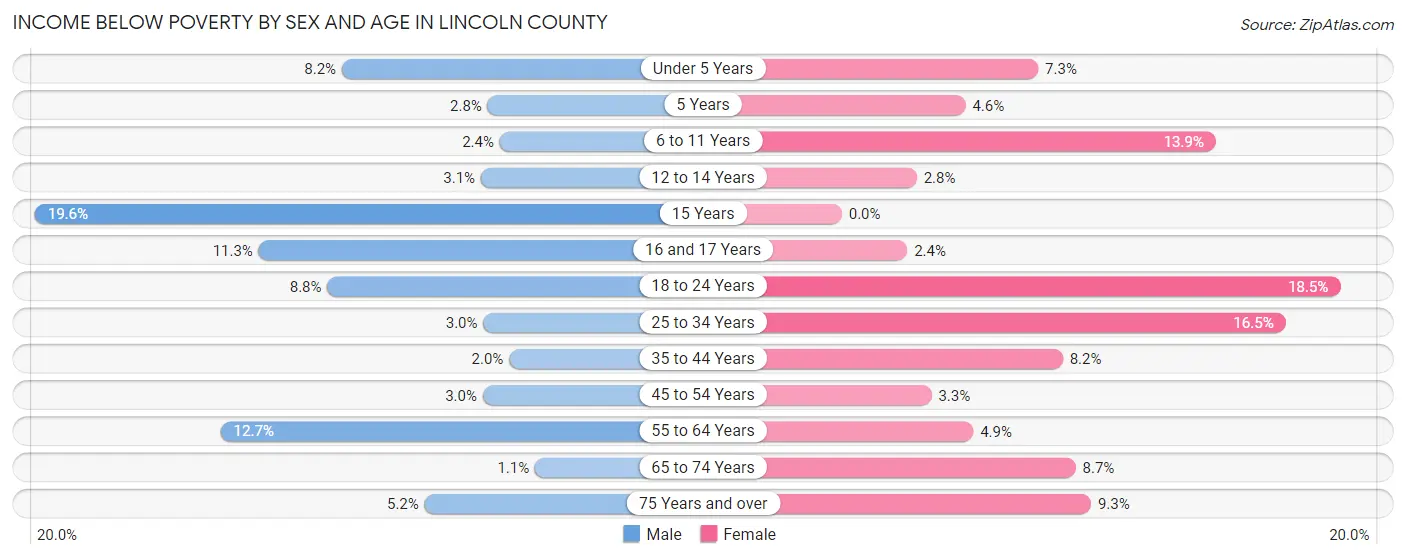
| Age Bracket | Male | Female |
| Under 5 Years | 49 (8.2%) | 45 (7.3%) |
| 5 Years | 5 (2.8%) | 5 (4.6%) |
| 6 to 11 Years | 17 (2.4%) | 143 (13.9%) |
| 12 to 14 Years | 20 (3.1%) | 7 (2.8%) |
| 15 Years | 41 (19.6%) | 0 (0.0%) |
| 16 and 17 Years | 31 (11.3%) | 9 (2.4%) |
| 18 to 24 Years | 65 (8.8%) | 121 (18.5%) |
| 25 to 34 Years | 28 (3.0%) | 150 (16.5%) |
| 35 to 44 Years | 27 (2.0%) | 106 (8.2%) |
| 45 to 54 Years | 35 (3.0%) | 36 (3.3%) |
| 55 to 64 Years | 182 (12.7%) | 69 (4.9%) |
| 65 to 74 Years | 13 (1.1%) | 101 (8.7%) |
| 75 Years and over | 28 (5.1%) | 54 (9.2%) |
| Total | 541 (5.4%) | 846 (8.8%) |
Income Above Poverty by Sex and Age in Lincoln County
According to the poverty statistics in Lincoln County, males aged 65 to 74 years and females aged 15 years are the age groups that are most secure financially, with 99.0% of males and 100.0% of females in these age groups living above the poverty line.
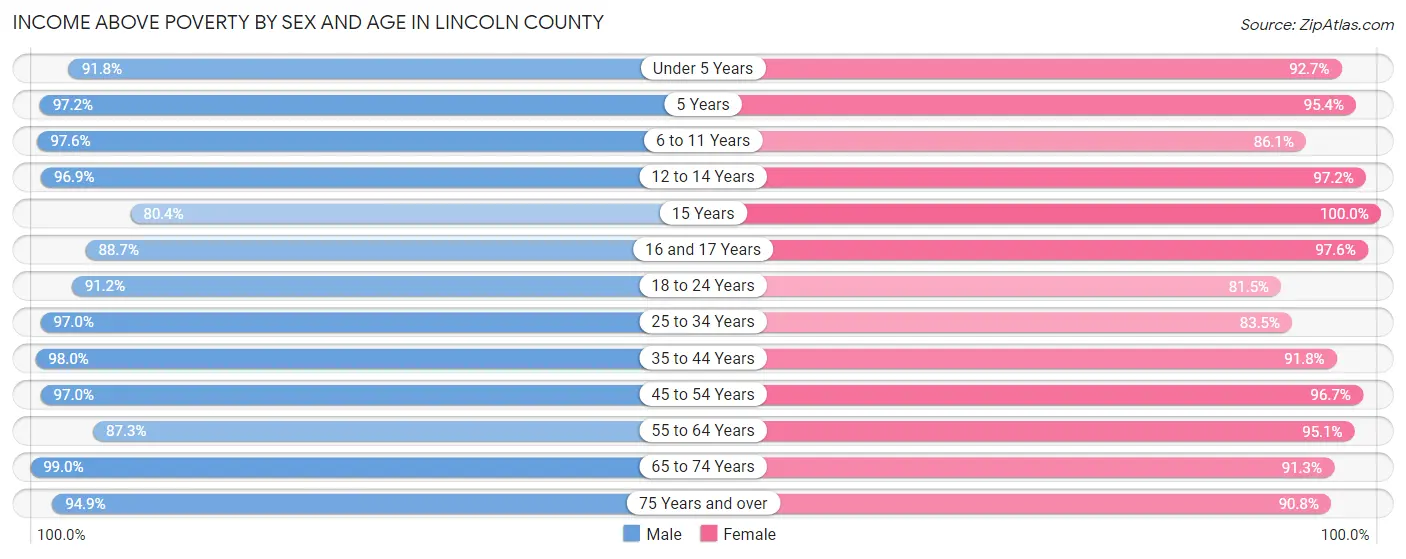
| Age Bracket | Male | Female |
| Under 5 Years | 547 (91.8%) | 572 (92.7%) |
| 5 Years | 173 (97.2%) | 104 (95.4%) |
| 6 to 11 Years | 703 (97.6%) | 887 (86.1%) |
| 12 to 14 Years | 633 (96.9%) | 245 (97.2%) |
| 15 Years | 168 (80.4%) | 127 (100.0%) |
| 16 and 17 Years | 243 (88.7%) | 362 (97.6%) |
| 18 to 24 Years | 677 (91.2%) | 533 (81.5%) |
| 25 to 34 Years | 914 (97.0%) | 761 (83.5%) |
| 35 to 44 Years | 1,316 (98.0%) | 1,187 (91.8%) |
| 45 to 54 Years | 1,134 (97.0%) | 1,044 (96.7%) |
| 55 to 64 Years | 1,249 (87.3%) | 1,346 (95.1%) |
| 65 to 74 Years | 1,228 (99.0%) | 1,063 (91.3%) |
| 75 Years and over | 516 (94.9%) | 530 (90.7%) |
| Total | 9,501 (94.6%) | 8,761 (91.2%) |
Income Below Poverty Among Married-Couple Families in Lincoln County
The poverty statistics for married-couple families in Lincoln County show that 2.4% or 109 of the total 4,631 families live below the poverty line. Families with no children have the highest poverty rate of 3.0%, comprising of 77 families. On the other hand, families with 5 or more children have the lowest poverty rate of 0.0%, which includes 0 families.
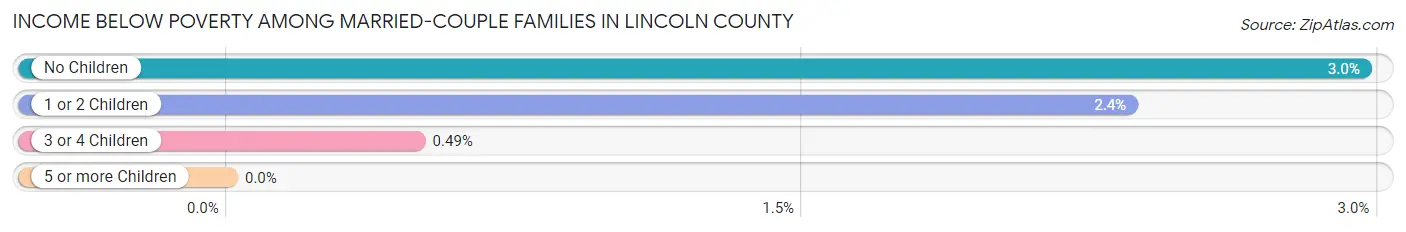
| Children | Above Poverty | Below Poverty |
| No Children | 2,528 (97.0%) | 77 (3.0%) |
| 1 or 2 Children | 1,204 (97.7%) | 29 (2.4%) |
| 3 or 4 Children | 611 (99.5%) | 3 (0.5%) |
| 5 or more Children | 179 (100.0%) | 0 (0.0%) |
| Total | 4,522 (97.7%) | 109 (2.4%) |
Income Below Poverty Among Single-Parent Households in Lincoln County
According to the poverty data in Lincoln County, 17.8% or 36 single-father households and 37.7% or 140 single-mother households are living below the poverty line. Among single-father households, those with 1 or 2 children have the highest poverty rate, with 30 households (23.3%) experiencing poverty. Likewise, among single-mother households, those with 1 or 2 children have the highest poverty rate, with 137 households (52.7%) falling below the poverty line.
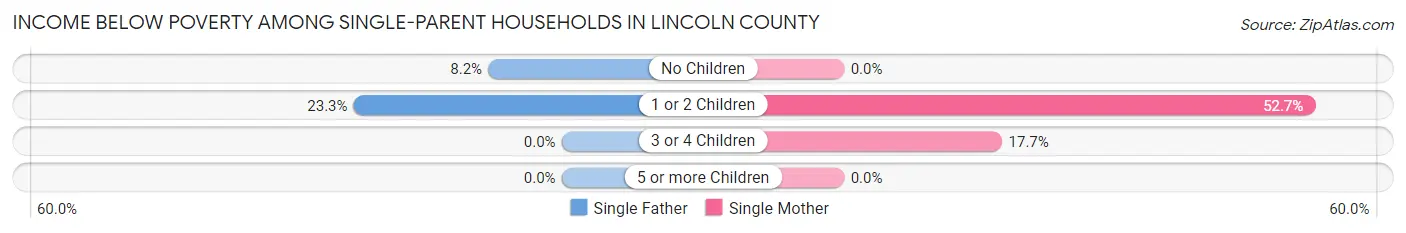
| Children | Single Father | Single Mother |
| No Children | 6 (8.2%) | 0 (0.0%) |
| 1 or 2 Children | 30 (23.3%) | 137 (52.7%) |
| 3 or 4 Children | 0 (0.0%) | 3 (17.6%) |
| 5 or more Children | 0 (0.0%) | 0 (0.0%) |
| Total | 36 (17.8%) | 140 (37.7%) |
Income Below Poverty Among Married-Couple vs Single-Parent Households in Lincoln County
The poverty data for Lincoln County shows that 109 of the married-couple family households (2.4%) and 176 of the single-parent households (30.7%) are living below the poverty level. Within the married-couple family households, those with no children have the highest poverty rate, with 77 households (3.0%) falling below the poverty line. Among the single-parent households, those with 1 or 2 children have the highest poverty rate, with 167 household (42.9%) living below poverty.
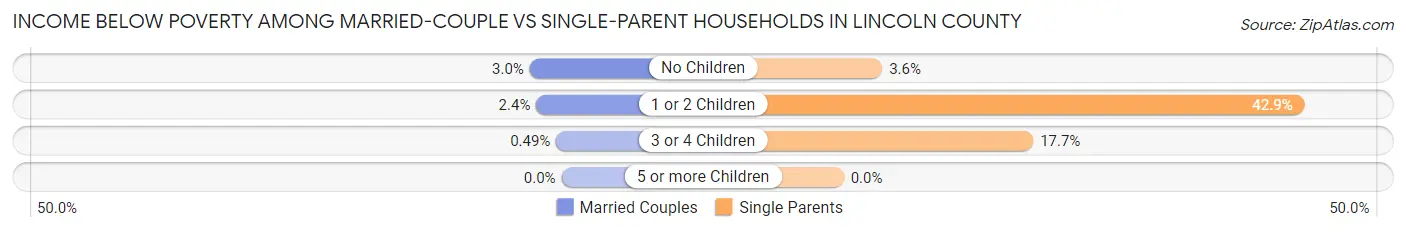
| Children | Married-Couple Families | Single-Parent Households |
| No Children | 77 (3.0%) | 6 (3.6%) |
| 1 or 2 Children | 29 (2.4%) | 167 (42.9%) |
| 3 or 4 Children | 3 (0.5%) | 3 (17.6%) |
| 5 or more Children | 0 (0.0%) | 0 (0.0%) |
| Total | 109 (2.4%) | 176 (30.7%) |
Employment Characteristics in Lincoln County
Employment by Class of Employer in Lincoln County
Among the 9,577 employed individuals in Lincoln County, private company employees (6,035 | 63.0%), local government employees (1,073 | 11.2%), and self-employed (not incorporated) (840 | 8.8%) make up the most common classes of employment.
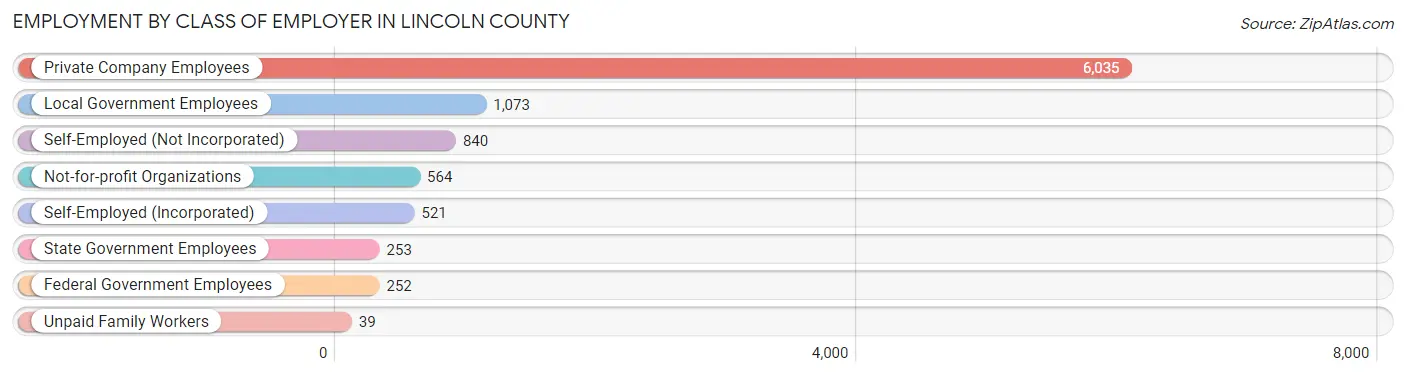
| Employer Class | # Employees | % Employees |
| Private Company Employees | 6,035 | 63.0% |
| Self-Employed (Incorporated) | 521 | 5.4% |
| Self-Employed (Not Incorporated) | 840 | 8.8% |
| Not-for-profit Organizations | 564 | 5.9% |
| Local Government Employees | 1,073 | 11.2% |
| State Government Employees | 253 | 2.6% |
| Federal Government Employees | 252 | 2.6% |
| Unpaid Family Workers | 39 | 0.4% |
| Total | 9,577 | 100.0% |
Employment Status by Age in Lincoln County
According to the labor force statistics for Lincoln County, out of the total population over 16 years of age (15,251), 66.5% or 10,142 individuals are in the labor force, with 2.6% or 264 of them unemployed. The age group with the highest labor force participation rate is 35 to 44 years, with 89.5% or 2,365 individuals in the labor force. Within the labor force, the 20 to 24 years age range has the highest percentage of unemployed individuals, with 18.8% or 139 of them being unemployed.
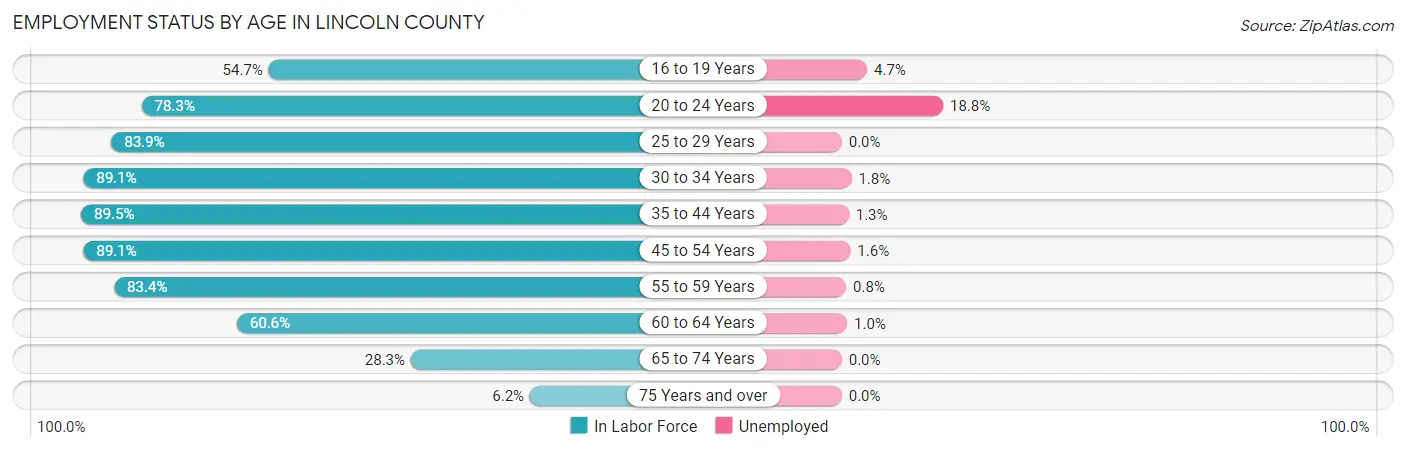
| Age Bracket | In Labor Force | Unemployed |
| 16 to 19 Years | 601 (54.7%) | 28 (4.7%) |
| 20 to 24 Years | 741 (78.3%) | 139 (18.8%) |
| 25 to 29 Years | 727 (83.9%) | 0 (0.0%) |
| 30 to 34 Years | 885 (89.1%) | 16 (1.8%) |
| 35 to 44 Years | 2,365 (89.5%) | 31 (1.3%) |
| 45 to 54 Years | 2,007 (89.1%) | 32 (1.6%) |
| 55 to 59 Years | 1,193 (83.4%) | 10 (0.8%) |
| 60 to 64 Years | 862 (60.6%) | 9 (1.0%) |
| 65 to 74 Years | 686 (28.3%) | 0 (0.0%) |
| 75 Years and over | 73 (6.2%) | 0 (0.0%) |
| Total | 10,142 (66.5%) | 264 (2.6%) |
Employment Status by Educational Attainment in Lincoln County
According to labor force statistics for Lincoln County, 83.7% of individuals (8,041) out of the total population between 25 and 64 years of age (9,607) are in the labor force, with 1.2% or 96 of them being unemployed. The group with the highest labor force participation rate are those with the educational attainment of bachelor's degree or higher, with 85.8% or 1,828 individuals in the labor force. Within the labor force, individuals with less than high school education have the highest percentage of unemployment, with 3.2% or 14 of them being unemployed.
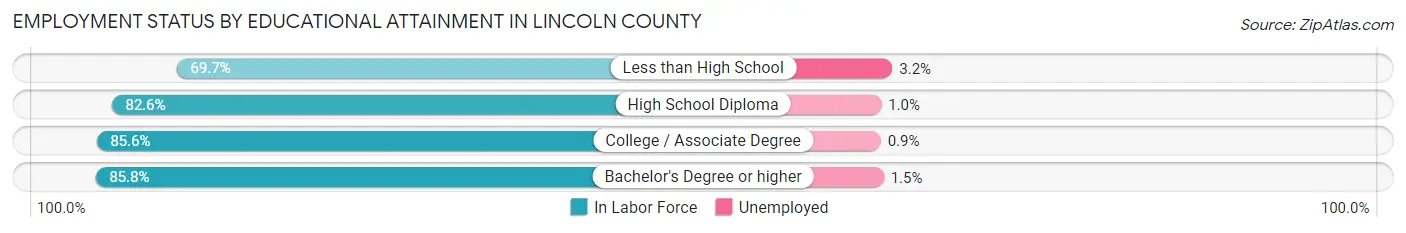
| Educational Attainment | In Labor Force | Unemployed |
| Less than High School | 444 (69.7%) | 20 (3.2%) |
| High School Diploma | 2,409 (82.6%) | 29 (1.0%) |
| College / Associate Degree | 3,358 (85.6%) | 35 (0.9%) |
| Bachelor's Degree or higher | 1,828 (85.8%) | 32 (1.5%) |
| Total | 8,041 (83.7%) | 115 (1.2%) |
Employment Occupations by Sex in Lincoln County
Management, Business, Science and Arts Occupations
The most common Management, Business, Science and Arts occupations in Lincoln County are Management (987 | 10.0%), Community & Social Service (871 | 8.8%), Health Diagnosing & Treating (622 | 6.3%), Education Instruction & Library (608 | 6.2%), and Health Technologists (496 | 5.0%).

Management, Business, Science and Arts Occupations by Sex
Within the Management, Business, Science and Arts occupations in Lincoln County, the most male-oriented occupations are Life, Physical & Social Science (91.9%), Architecture & Engineering (84.8%), and Computers, Engineering & Science (79.1%), while the most female-oriented occupations are Education Instruction & Library (81.7%), Health Diagnosing & Treating (74.9%), and Health Technologists (69.8%).
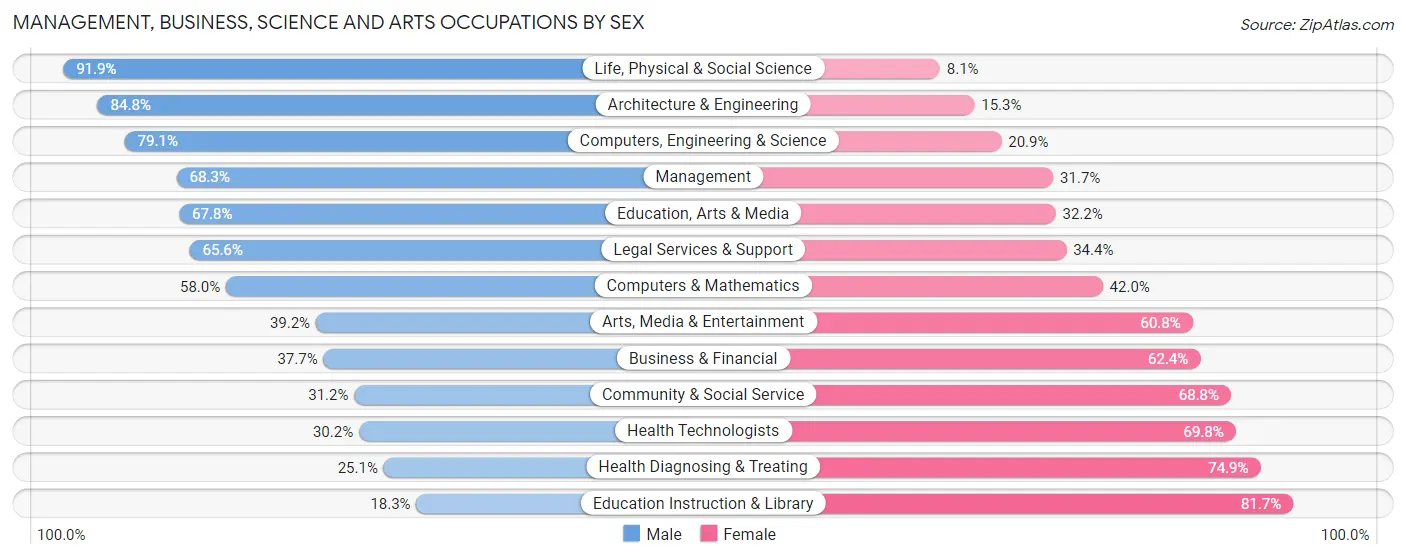
| Occupation | Male | Female |
| Management | 674 (68.3%) | 313 (31.7%) |
| Business & Financial | 157 (37.7%) | 260 (62.4%) |
| Computers, Engineering & Science | 197 (79.1%) | 52 (20.9%) |
| Computers & Mathematics | 40 (58.0%) | 29 (42.0%) |
| Architecture & Engineering | 100 (84.8%) | 18 (15.2%) |
| Life, Physical & Social Science | 57 (91.9%) | 5 (8.1%) |
| Community & Social Service | 272 (31.2%) | 599 (68.8%) |
| Education, Arts & Media | 61 (67.8%) | 29 (32.2%) |
| Legal Services & Support | 80 (65.6%) | 42 (34.4%) |
| Education Instruction & Library | 111 (18.3%) | 497 (81.7%) |
| Arts, Media & Entertainment | 20 (39.2%) | 31 (60.8%) |
| Health Diagnosing & Treating | 156 (25.1%) | 466 (74.9%) |
| Health Technologists | 150 (30.2%) | 346 (69.8%) |
| Total (Category) | 1,456 (46.3%) | 1,690 (53.7%) |
| Total (Overall) | 5,281 (53.5%) | 4,588 (46.5%) |
Services Occupations
The most common Services occupations in Lincoln County are Food Preparation & Serving (386 | 3.9%), Healthcare Support (360 | 3.6%), Cleaning & Maintenance (310 | 3.1%), Personal Care & Service (262 | 2.6%), and Security & Protection (205 | 2.1%).
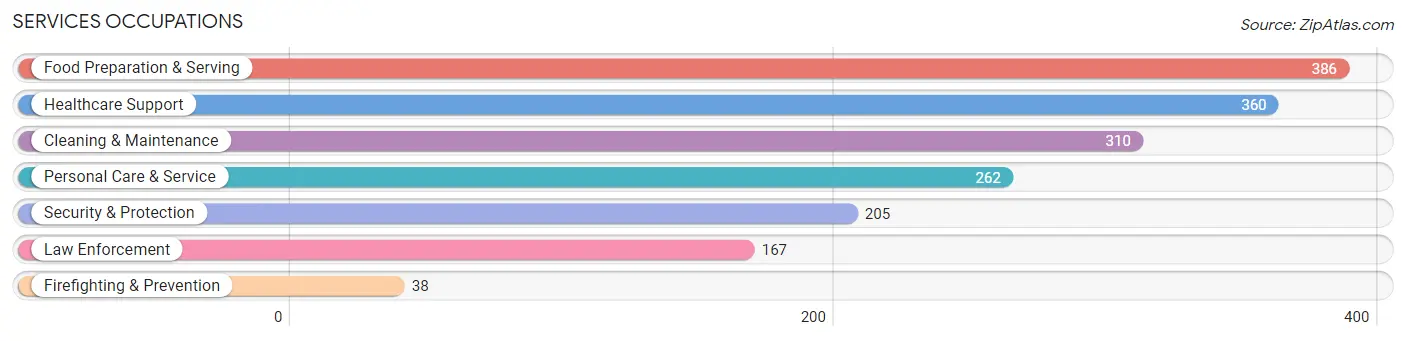
Services Occupations by Sex
Within the Services occupations in Lincoln County, the most male-oriented occupations are Law Enforcement (98.2%), Security & Protection (86.8%), and Cleaning & Maintenance (45.5%), while the most female-oriented occupations are Personal Care & Service (95.4%), Healthcare Support (76.9%), and Firefighting & Prevention (63.2%).

| Occupation | Male | Female |
| Healthcare Support | 83 (23.1%) | 277 (76.9%) |
| Security & Protection | 178 (86.8%) | 27 (13.2%) |
| Firefighting & Prevention | 14 (36.8%) | 24 (63.2%) |
| Law Enforcement | 164 (98.2%) | 3 (1.8%) |
| Food Preparation & Serving | 143 (37.0%) | 243 (62.9%) |
| Cleaning & Maintenance | 141 (45.5%) | 169 (54.5%) |
| Personal Care & Service | 12 (4.6%) | 250 (95.4%) |
| Total (Category) | 557 (36.6%) | 966 (63.4%) |
| Total (Overall) | 5,281 (53.5%) | 4,588 (46.5%) |
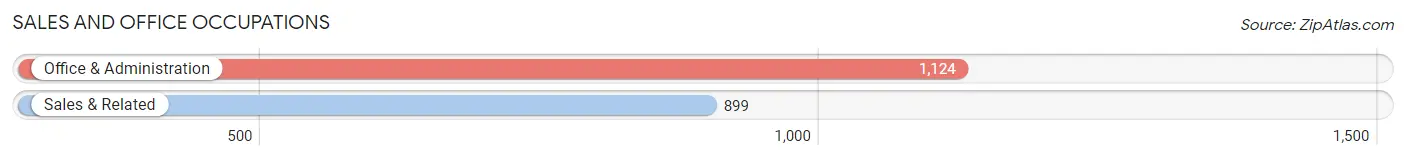
Sales and Office Occupations
The most common Sales and Office occupations in Lincoln County are Office & Administration (1,124 | 11.4%), and Sales & Related (899 | 9.1%).
Sales and Office Occupations by Sex
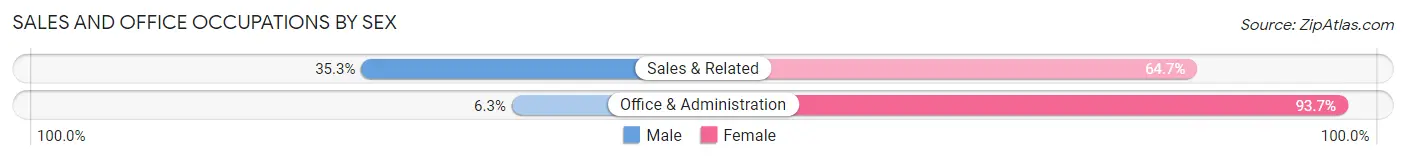
| Occupation | Male | Female |
| Sales & Related | 317 (35.3%) | 582 (64.7%) |
| Office & Administration | 71 (6.3%) | 1,053 (93.7%) |
| Total (Category) | 388 (19.2%) | 1,635 (80.8%) |
| Total (Overall) | 5,281 (53.5%) | 4,588 (46.5%) |
Natural Resources, Construction and Maintenance Occupations
The most common Natural Resources, Construction and Maintenance occupations in Lincoln County are Construction & Extraction (1,391 | 14.1%), Installation, Maintenance & Repair (637 | 6.5%), and Farming, Fishing & Forestry (100 | 1.0%).
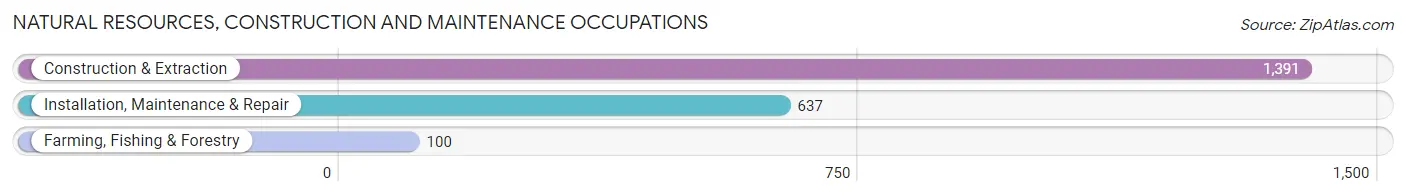
Natural Resources, Construction and Maintenance Occupations by Sex
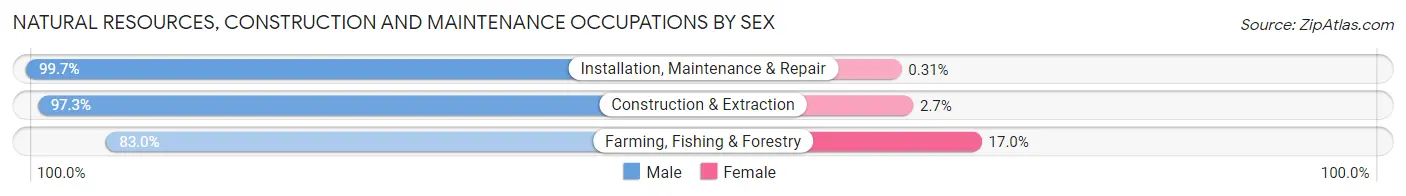
| Occupation | Male | Female |
| Farming, Fishing & Forestry | 83 (83.0%) | 17 (17.0%) |
| Construction & Extraction | 1,353 (97.3%) | 38 (2.7%) |
| Installation, Maintenance & Repair | 635 (99.7%) | 2 (0.3%) |
| Total (Category) | 2,071 (97.3%) | 57 (2.7%) |
| Total (Overall) | 5,281 (53.5%) | 4,588 (46.5%) |
Production, Transportation and Moving Occupations
The most common Production, Transportation and Moving occupations in Lincoln County are Production (579 | 5.9%), Transportation (256 | 2.6%), and Material Moving (214 | 2.2%).
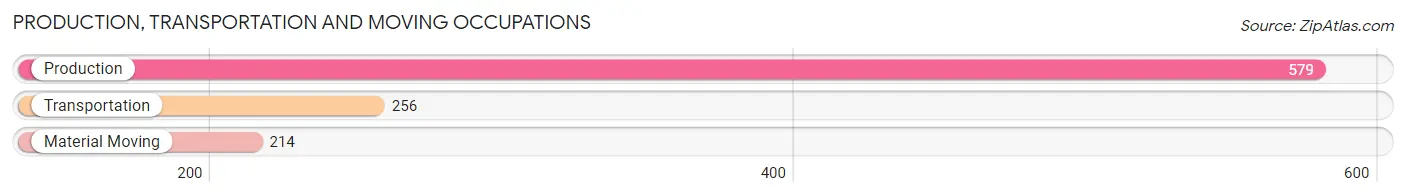
Production, Transportation and Moving Occupations by Sex
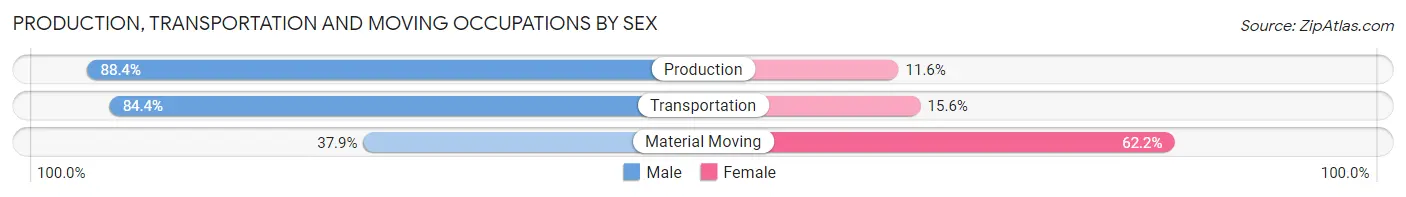
| Occupation | Male | Female |
| Production | 512 (88.4%) | 67 (11.6%) |
| Transportation | 216 (84.4%) | 40 (15.6%) |
| Material Moving | 81 (37.9%) | 133 (62.2%) |
| Total (Category) | 809 (77.1%) | 240 (22.9%) |
| Total (Overall) | 5,281 (53.5%) | 4,588 (46.5%) |
Employment Industries by Sex in Lincoln County
Employment Industries in Lincoln County
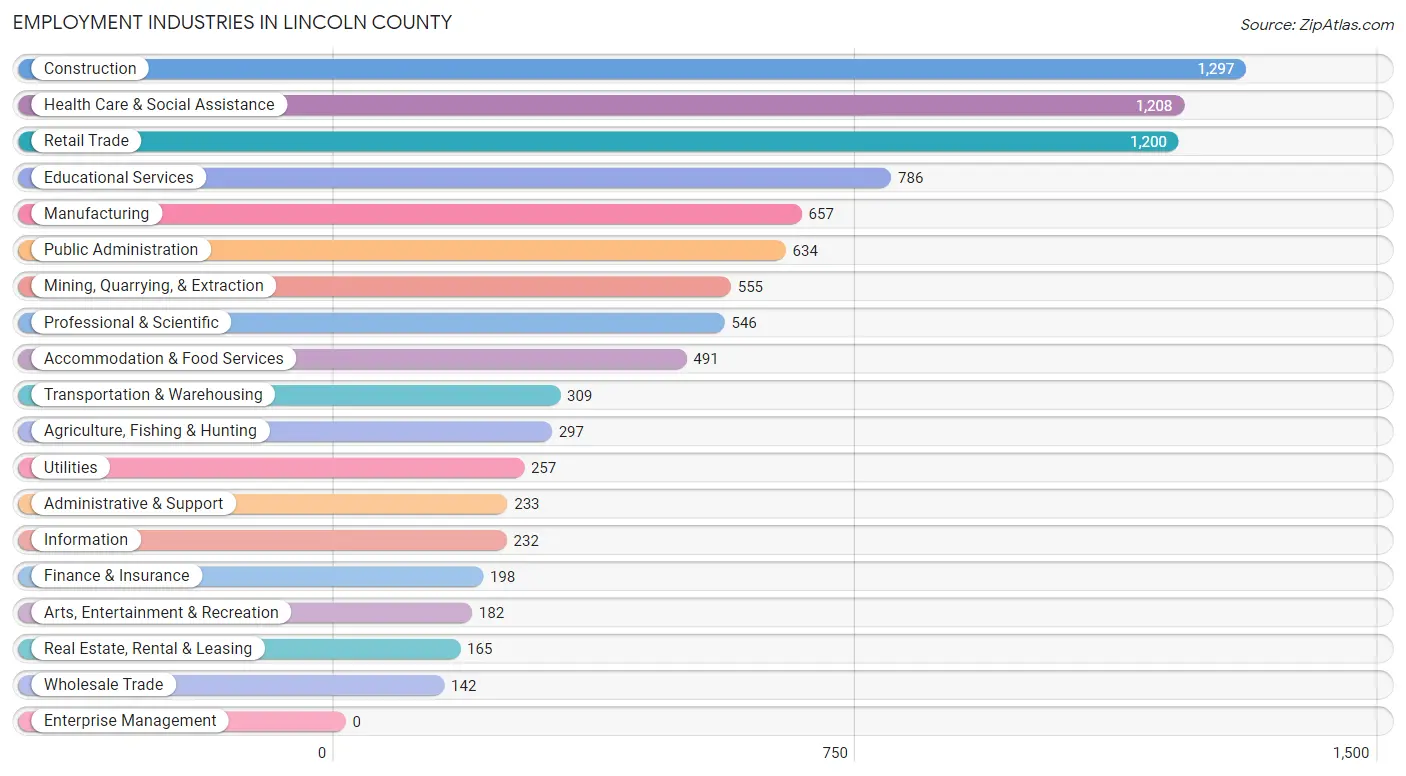
The major employment industries in Lincoln County include Construction (1,297 | 13.1%), Health Care & Social Assistance (1,208 | 12.2%), Retail Trade (1,200 | 12.2%), Educational Services (786 | 8.0%), and Manufacturing (657 | 6.7%).
Employment Industries by Sex in Lincoln County
The Lincoln County industries that see more men than women are Construction (92.2%), Mining, Quarrying, & Extraction (91.5%), and Utilities (88.7%), whereas the industries that tend to have a higher number of women are Finance & Insurance (92.9%), Accommodation & Food Services (74.5%), and Educational Services (74.3%).

| Industry | Male | Female |
| Agriculture, Fishing & Hunting | 221 (74.4%) | 76 (25.6%) |
| Mining, Quarrying, & Extraction | 508 (91.5%) | 47 (8.5%) |
| Construction | 1,196 (92.2%) | 101 (7.8%) |
| Manufacturing | 465 (70.8%) | 192 (29.2%) |
| Wholesale Trade | 100 (70.4%) | 42 (29.6%) |
| Retail Trade | 421 (35.1%) | 779 (64.9%) |
| Transportation & Warehousing | 213 (68.9%) | 96 (31.1%) |
| Utilities | 228 (88.7%) | 29 (11.3%) |
| Information | 120 (51.7%) | 112 (48.3%) |
| Finance & Insurance | 14 (7.1%) | 184 (92.9%) |
| Real Estate, Rental & Leasing | 53 (32.1%) | 112 (67.9%) |
| Professional & Scientific | 303 (55.5%) | 243 (44.5%) |
| Enterprise Management | 0 (0.0%) | 0 (0.0%) |
| Administrative & Support | 132 (56.7%) | 101 (43.3%) |
| Educational Services | 202 (25.7%) | 584 (74.3%) |
| Health Care & Social Assistance | 390 (32.3%) | 818 (67.7%) |
| Arts, Entertainment & Recreation | 125 (68.7%) | 57 (31.3%) |
| Accommodation & Food Services | 125 (25.5%) | 366 (74.5%) |
| Public Administration | 299 (47.2%) | 335 (52.8%) |
| Total | 5,281 (53.5%) | 4,588 (46.5%) |
Education in Lincoln County
School Enrollment in Lincoln County
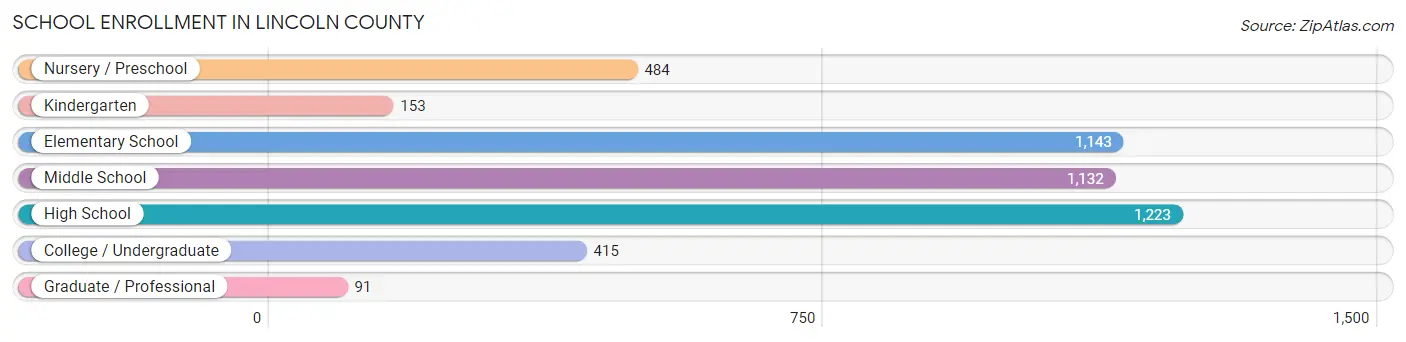
The most common levels of schooling among the 4,641 students in Lincoln County are high school (1,223 | 26.4%), elementary school (1,143 | 24.6%), and middle school (1,132 | 24.4%).
| School Level | # Students | % Students |
| Nursery / Preschool | 484 | 10.4% |
| Kindergarten | 153 | 3.3% |
| Elementary School | 1,143 | 24.6% |
| Middle School | 1,132 | 24.4% |
| High School | 1,223 | 26.4% |
| College / Undergraduate | 415 | 8.9% |
| Graduate / Professional | 91 | 2.0% |
| Total | 4,641 | 100.0% |
School Enrollment by Age by Funding Source in Lincoln County
Out of a total of 4,641 students who are enrolled in schools in Lincoln County, 371 (8.0%) attend a private institution, while the remaining 4,270 (92.0%) are enrolled in public schools. The age group of 3 to 4 year olds has the highest likelihood of being enrolled in private schools, with 196 (75.4% in the age bracket) enrolled. Conversely, the age group of 15 to 17 year olds has the lowest likelihood of being enrolled in a private school, with 895 (100.0% in the age bracket) attending a public institution.
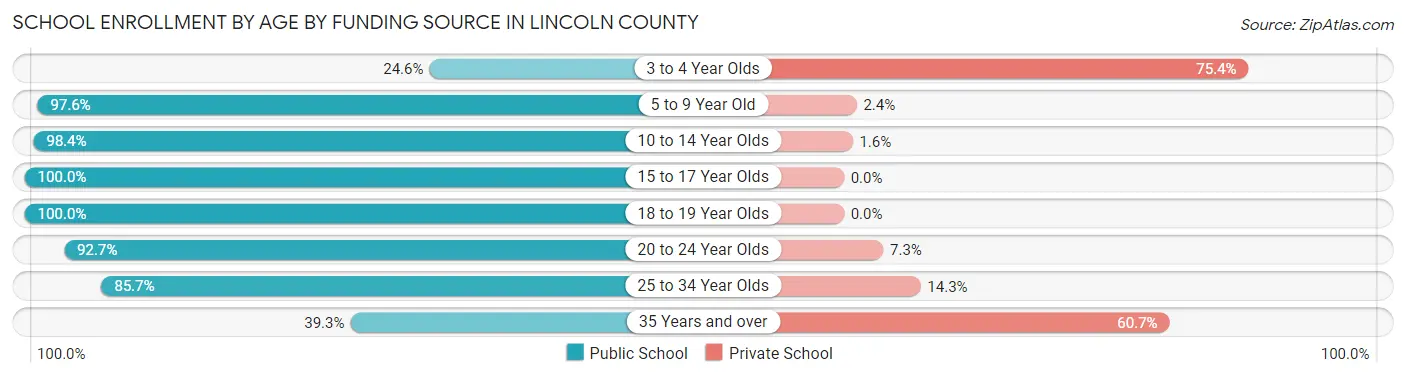
| Age Bracket | Public School | Private School |
| 3 to 4 Year Olds | 64 (24.6%) | 196 (75.4%) |
| 5 to 9 Year Old | 1,306 (97.6%) | 32 (2.4%) |
| 10 to 14 Year Olds | 1,389 (98.4%) | 23 (1.6%) |
| 15 to 17 Year Olds | 895 (100.0%) | 0 (0.0%) |
| 18 to 19 Year Olds | 277 (100.0%) | 0 (0.0%) |
| 20 to 24 Year Olds | 202 (92.7%) | 16 (7.3%) |
| 25 to 34 Year Olds | 78 (85.7%) | 13 (14.3%) |
| 35 Years and over | 59 (39.3%) | 91 (60.7%) |
| Total | 4,270 (92.0%) | 371 (8.0%) |
Educational Attainment by Field of Study in Lincoln County
Education (733 | 22.5%), business (485 | 14.9%), bio, nature & agricultural (413 | 12.7%), science & technology (309 | 9.5%), and engineering (289 | 8.9%) are the most common fields of study among 3,254 individuals in Lincoln County who have obtained a bachelor's degree or higher.
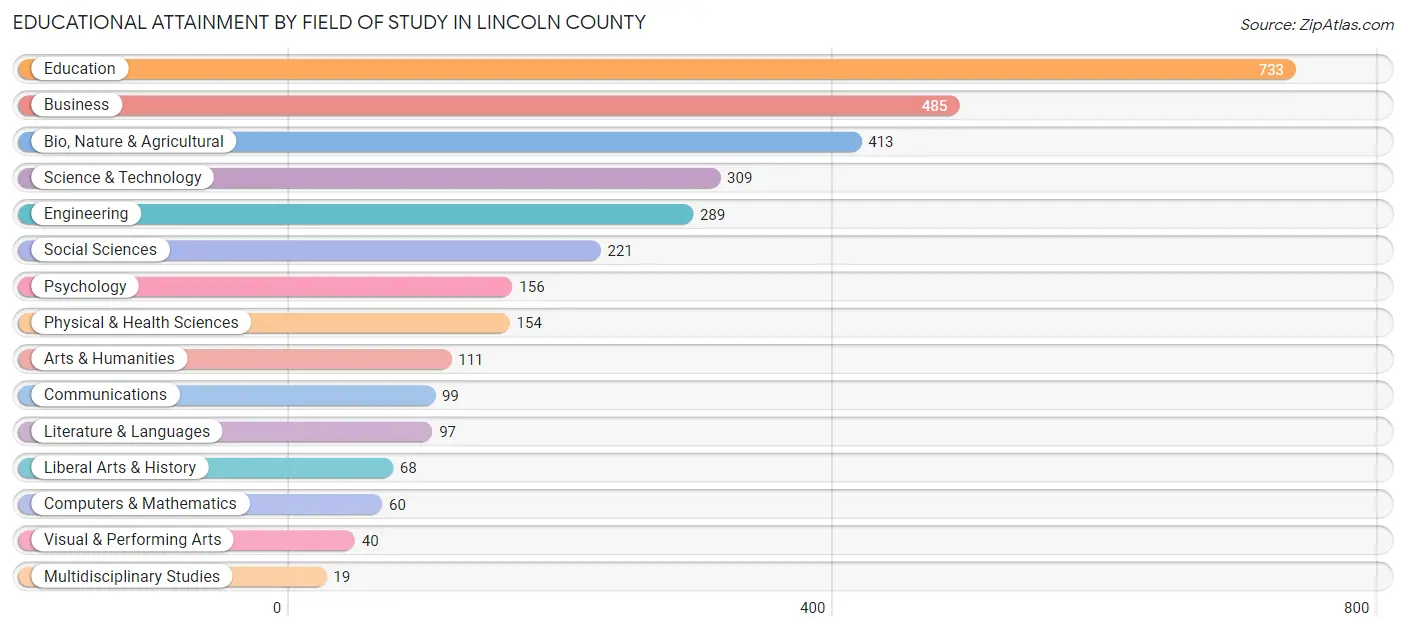
| Field of Study | # Graduates | % Graduates |
| Computers & Mathematics | 60 | 1.8% |
| Bio, Nature & Agricultural | 413 | 12.7% |
| Physical & Health Sciences | 154 | 4.7% |
| Psychology | 156 | 4.8% |
| Social Sciences | 221 | 6.8% |
| Engineering | 289 | 8.9% |
| Multidisciplinary Studies | 19 | 0.6% |
| Science & Technology | 309 | 9.5% |
| Business | 485 | 14.9% |
| Education | 733 | 22.5% |
| Literature & Languages | 97 | 3.0% |
| Liberal Arts & History | 68 | 2.1% |
| Visual & Performing Arts | 40 | 1.2% |
| Communications | 99 | 3.0% |
| Arts & Humanities | 111 | 3.4% |
| Total | 3,254 | 100.0% |
Transportation & Commute in Lincoln County
Vehicle Availability by Sex in Lincoln County
The most prevalent vehicle ownership categories in Lincoln County are males with 2 vehicles (1,560, accounting for 30.3%) and females with 2 vehicles (1,457, making up 35.2%).

| Vehicles Available | Male | Female |
| No Vehicle | 80 (1.6%) | 32 (0.7%) |
| 1 Vehicle | 574 (11.2%) | 569 (12.8%) |
| 2 Vehicles | 1,560 (30.3%) | 1,457 (32.9%) |
| 3 Vehicles | 1,429 (27.8%) | 1,374 (31.0%) |
| 4 Vehicles | 1,080 (21.0%) | 788 (17.8%) |
| 5 or more Vehicles | 417 (8.1%) | 215 (4.9%) |
| Total | 5,140 (100.0%) | 4,435 (100.0%) |
Commute Time in Lincoln County
The most frequently occuring commute durations in Lincoln County are 5 to 9 minutes (1,696 commuters, 19.4%), 10 to 14 minutes (1,307 commuters, 14.9%), and less than 5 minutes (1,193 commuters, 13.6%).
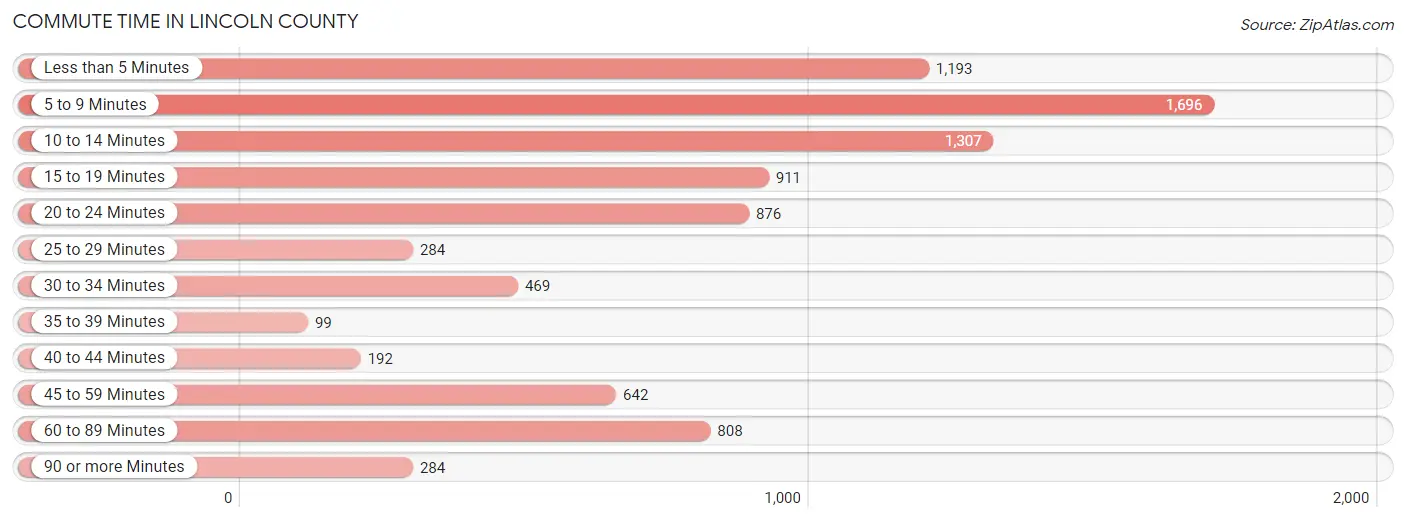
| Commute Time | # Commuters | % Commuters |
| Less than 5 Minutes | 1,193 | 13.6% |
| 5 to 9 Minutes | 1,696 | 19.4% |
| 10 to 14 Minutes | 1,307 | 14.9% |
| 15 to 19 Minutes | 911 | 10.4% |
| 20 to 24 Minutes | 876 | 10.0% |
| 25 to 29 Minutes | 284 | 3.2% |
| 30 to 34 Minutes | 469 | 5.3% |
| 35 to 39 Minutes | 99 | 1.1% |
| 40 to 44 Minutes | 192 | 2.2% |
| 45 to 59 Minutes | 642 | 7.3% |
| 60 to 89 Minutes | 808 | 9.2% |
| 90 or more Minutes | 284 | 3.2% |
Commute Time by Sex in Lincoln County
The most common commute times in Lincoln County are 10 to 14 minutes (692 commuters, 14.4%) for males and 5 to 9 minutes (1,034 commuters, 26.0%) for females.
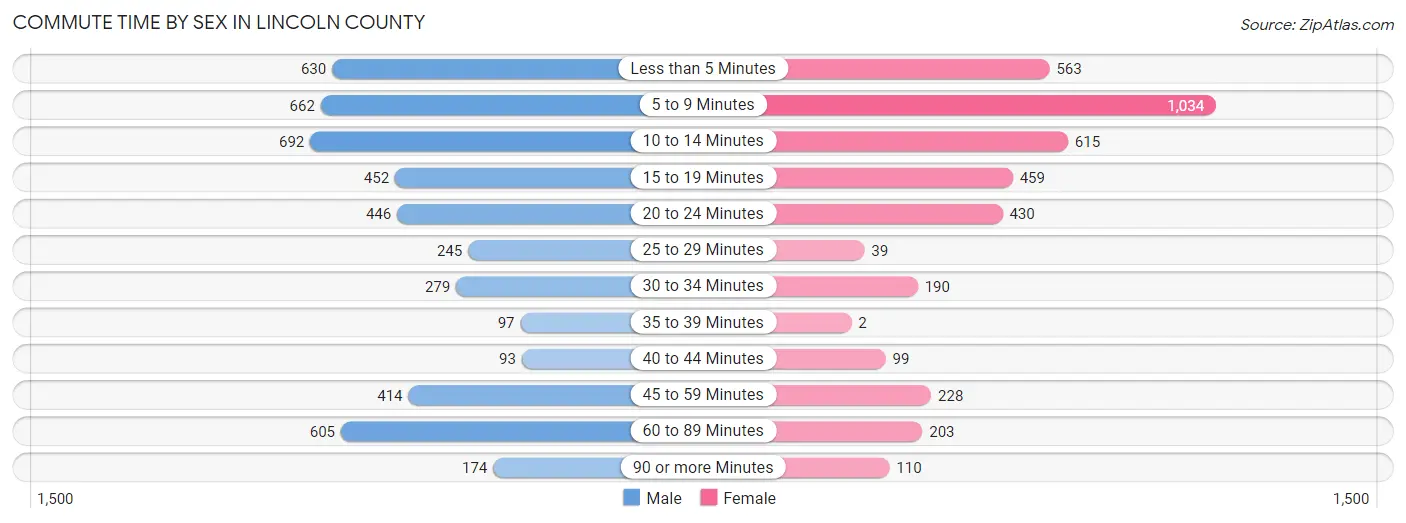
| Commute Time | Male | Female |
| Less than 5 Minutes | 630 (13.2%) | 563 (14.2%) |
| 5 to 9 Minutes | 662 (13.8%) | 1,034 (26.0%) |
| 10 to 14 Minutes | 692 (14.4%) | 615 (15.5%) |
| 15 to 19 Minutes | 452 (9.4%) | 459 (11.6%) |
| 20 to 24 Minutes | 446 (9.3%) | 430 (10.8%) |
| 25 to 29 Minutes | 245 (5.1%) | 39 (1.0%) |
| 30 to 34 Minutes | 279 (5.8%) | 190 (4.8%) |
| 35 to 39 Minutes | 97 (2.0%) | 2 (0.1%) |
| 40 to 44 Minutes | 93 (1.9%) | 99 (2.5%) |
| 45 to 59 Minutes | 414 (8.6%) | 228 (5.7%) |
| 60 to 89 Minutes | 605 (12.6%) | 203 (5.1%) |
| 90 or more Minutes | 174 (3.6%) | 110 (2.8%) |
Time of Departure to Work by Sex in Lincoln County
The most frequent times of departure to work in Lincoln County are 7:30 AM to 7:59 AM (722, 15.1%) for males and 7:30 AM to 7:59 AM (937, 23.6%) for females.
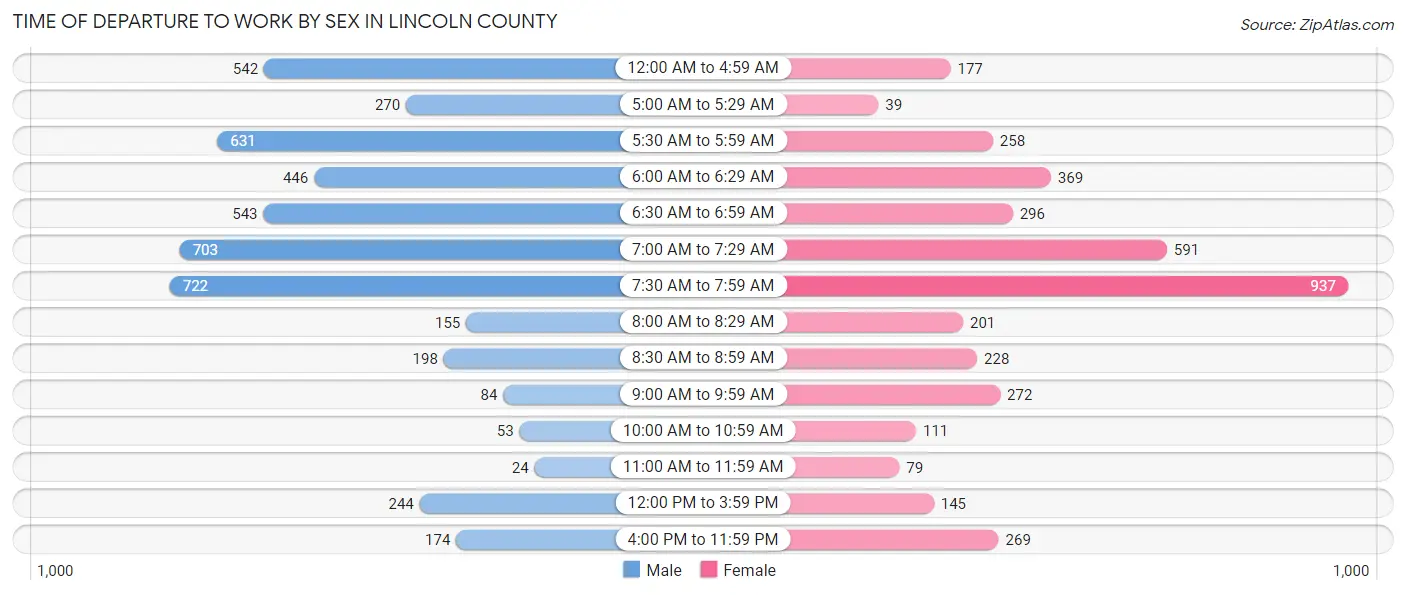
| Time of Departure | Male | Female |
| 12:00 AM to 4:59 AM | 542 (11.3%) | 177 (4.5%) |
| 5:00 AM to 5:29 AM | 270 (5.6%) | 39 (1.0%) |
| 5:30 AM to 5:59 AM | 631 (13.2%) | 258 (6.5%) |
| 6:00 AM to 6:29 AM | 446 (9.3%) | 369 (9.3%) |
| 6:30 AM to 6:59 AM | 543 (11.3%) | 296 (7.4%) |
| 7:00 AM to 7:29 AM | 703 (14.7%) | 591 (14.9%) |
| 7:30 AM to 7:59 AM | 722 (15.1%) | 937 (23.6%) |
| 8:00 AM to 8:29 AM | 155 (3.2%) | 201 (5.1%) |
| 8:30 AM to 8:59 AM | 198 (4.1%) | 228 (5.7%) |
| 9:00 AM to 9:59 AM | 84 (1.8%) | 272 (6.9%) |
| 10:00 AM to 10:59 AM | 53 (1.1%) | 111 (2.8%) |
| 11:00 AM to 11:59 AM | 24 (0.5%) | 79 (2.0%) |
| 12:00 PM to 3:59 PM | 244 (5.1%) | 145 (3.6%) |
| 4:00 PM to 11:59 PM | 174 (3.6%) | 269 (6.8%) |
| Total | 4,789 (100.0%) | 3,972 (100.0%) |
Housing Occupancy in Lincoln County
Occupancy by Ownership in Lincoln County
Of the total 7,629 dwellings in Lincoln County, owner-occupied units account for 6,056 (79.4%), while renter-occupied units make up 1,573 (20.6%).
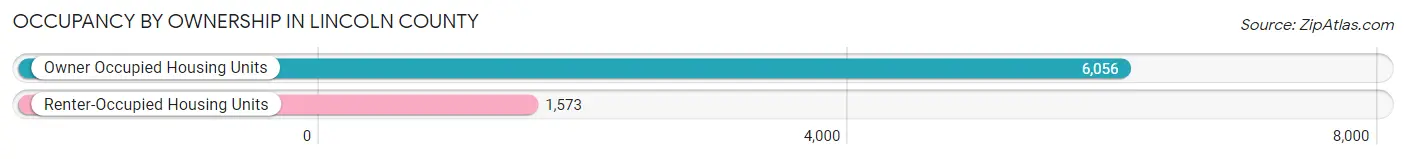
| Occupancy | # Housing Units | % Housing Units |
| Owner Occupied Housing Units | 6,056 | 79.4% |
| Renter-Occupied Housing Units | 1,573 | 20.6% |
| Total Occupied Housing Units | 7,629 | 100.0% |
Occupancy by Household Size in Lincoln County
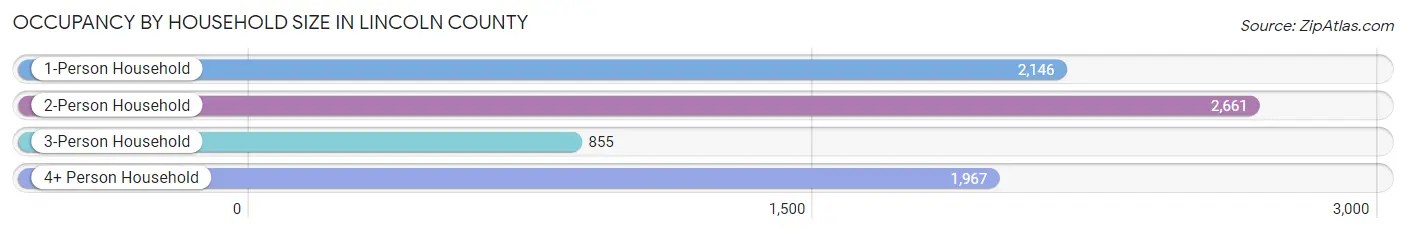
| Household Size | # Housing Units | % Housing Units |
| 1-Person Household | 2,146 | 28.1% |
| 2-Person Household | 2,661 | 34.9% |
| 3-Person Household | 855 | 11.2% |
| 4+ Person Household | 1,967 | 25.8% |
| Total Housing Units | 7,629 | 100.0% |
Occupancy by Ownership by Household Size in Lincoln County

| Household Size | Owner-occupied | Renter-occupied |
| 1-Person Household | 1,431 (66.7%) | 715 (33.3%) |
| 2-Person Household | 2,423 (91.1%) | 238 (8.9%) |
| 3-Person Household | 583 (68.2%) | 272 (31.8%) |
| 4+ Person Household | 1,619 (82.3%) | 348 (17.7%) |
| Total Housing Units | 6,056 (79.4%) | 1,573 (20.6%) |
Occupancy by Educational Attainment in Lincoln County
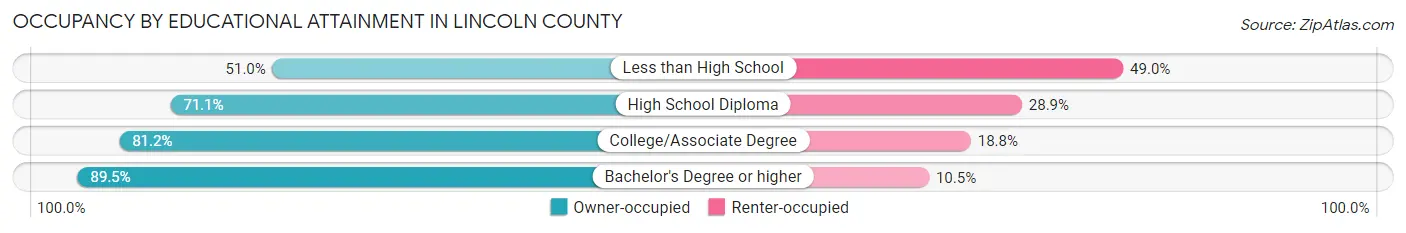
| Household Size | Owner-occupied | Renter-occupied |
| Less than High School | 173 (51.0%) | 166 (49.0%) |
| High School Diploma | 1,415 (71.1%) | 575 (28.9%) |
| College/Associate Degree | 2,715 (81.2%) | 627 (18.8%) |
| Bachelor's Degree or higher | 1,753 (89.5%) | 205 (10.5%) |
Occupancy by Age of Householder in Lincoln County
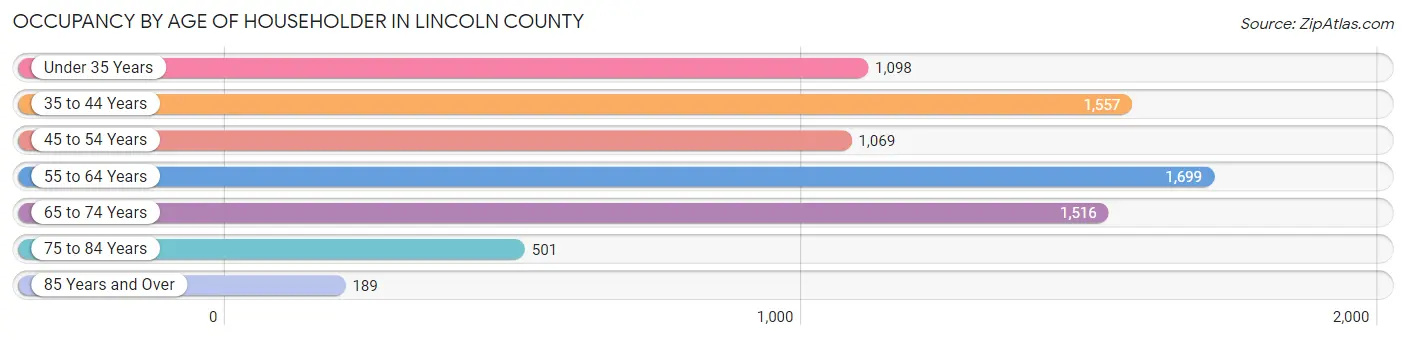
| Age Bracket | # Households | % Households |
| Under 35 Years | 1,098 | 14.4% |
| 35 to 44 Years | 1,557 | 20.4% |
| 45 to 54 Years | 1,069 | 14.0% |
| 55 to 64 Years | 1,699 | 22.3% |
| 65 to 74 Years | 1,516 | 19.9% |
| 75 to 84 Years | 501 | 6.6% |
| 85 Years and Over | 189 | 2.5% |
| Total | 7,629 | 100.0% |
Housing Finances in Lincoln County
Median Income by Occupancy in Lincoln County
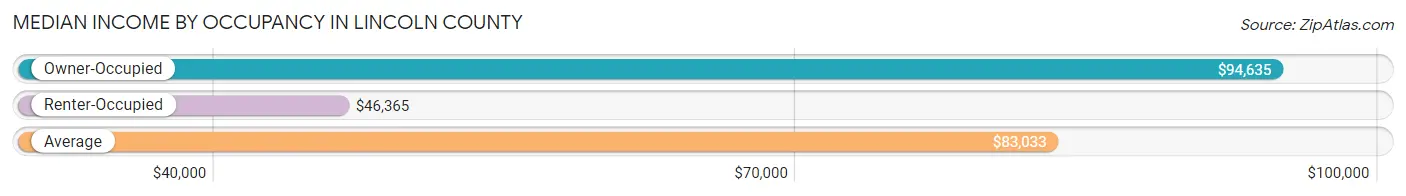
| Occupancy Type | # Households | Median Income |
| Owner-Occupied | 6,056 (79.4%) | $94,635 |
| Renter-Occupied | 1,573 (20.6%) | $46,365 |
| Average | 7,629 (100.0%) | $83,033 |
Occupancy by Householder Income Bracket in Lincoln County
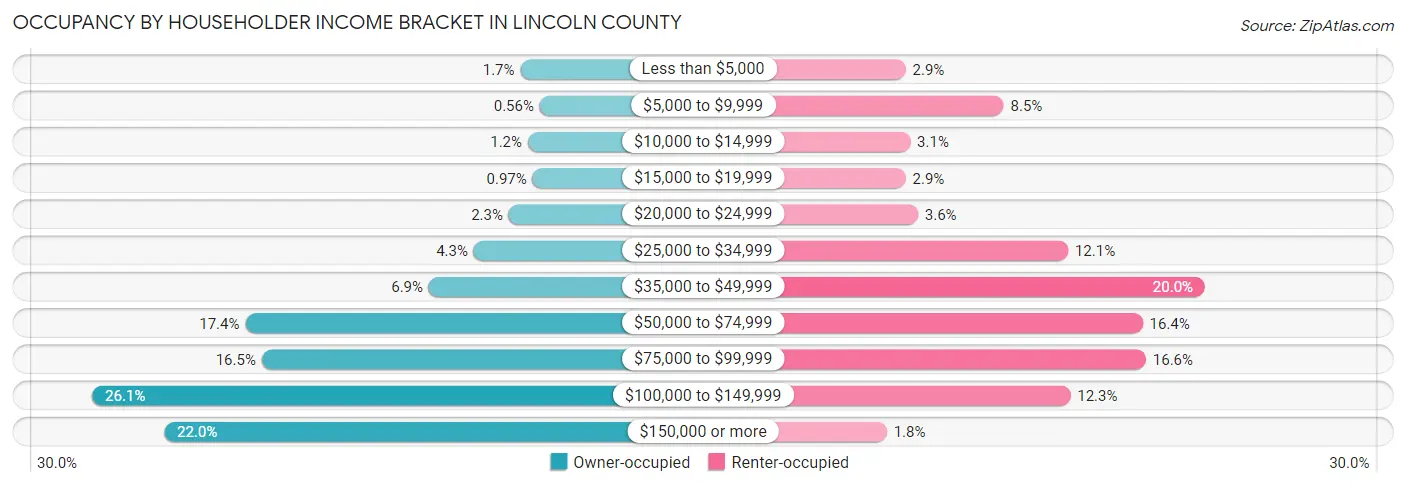
| Income Bracket | Owner-occupied | Renter-occupied |
| Less than $5,000 | 101 (1.7%) | 45 (2.9%) |
| $5,000 to $9,999 | 34 (0.6%) | 133 (8.5%) |
| $10,000 to $14,999 | 75 (1.2%) | 49 (3.1%) |
| $15,000 to $19,999 | 59 (1.0%) | 45 (2.9%) |
| $20,000 to $24,999 | 141 (2.3%) | 56 (3.6%) |
| $25,000 to $34,999 | 262 (4.3%) | 191 (12.1%) |
| $35,000 to $49,999 | 418 (6.9%) | 314 (20.0%) |
| $50,000 to $74,999 | 1,053 (17.4%) | 258 (16.4%) |
| $75,000 to $99,999 | 996 (16.5%) | 261 (16.6%) |
| $100,000 to $149,999 | 1,583 (26.1%) | 193 (12.3%) |
| $150,000 or more | 1,334 (22.0%) | 28 (1.8%) |
| Total | 6,056 (100.0%) | 1,573 (100.0%) |
Monthly Housing Cost Tiers in Lincoln County
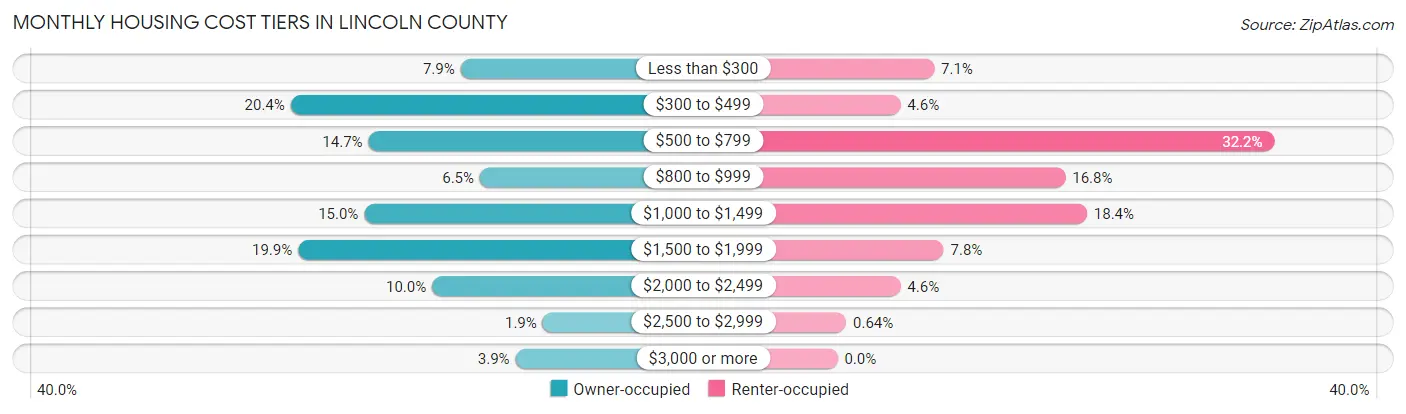
| Monthly Cost | Owner-occupied | Renter-occupied |
| Less than $300 | 478 (7.9%) | 112 (7.1%) |
| $300 to $499 | 1,236 (20.4%) | 73 (4.6%) |
| $500 to $799 | 889 (14.7%) | 506 (32.2%) |
| $800 to $999 | 392 (6.5%) | 264 (16.8%) |
| $1,000 to $1,499 | 908 (15.0%) | 289 (18.4%) |
| $1,500 to $1,999 | 1,203 (19.9%) | 123 (7.8%) |
| $2,000 to $2,499 | 605 (10.0%) | 73 (4.6%) |
| $2,500 to $2,999 | 112 (1.8%) | 10 (0.6%) |
| $3,000 or more | 233 (3.8%) | 0 (0.0%) |
| Total | 6,056 (100.0%) | 1,573 (100.0%) |
Physical Housing Characteristics in Lincoln County
Housing Structures in Lincoln County
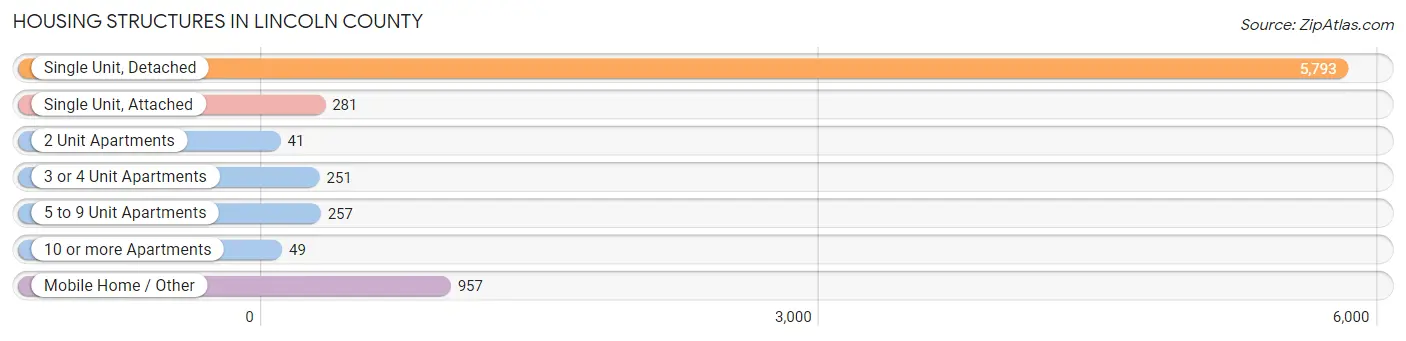
| Structure Type | # Housing Units | % Housing Units |
| Single Unit, Detached | 5,793 | 75.9% |
| Single Unit, Attached | 281 | 3.7% |
| 2 Unit Apartments | 41 | 0.5% |
| 3 or 4 Unit Apartments | 251 | 3.3% |
| 5 to 9 Unit Apartments | 257 | 3.4% |
| 10 or more Apartments | 49 | 0.6% |
| Mobile Home / Other | 957 | 12.5% |
| Total | 7,629 | 100.0% |
Housing Structures by Occupancy in Lincoln County
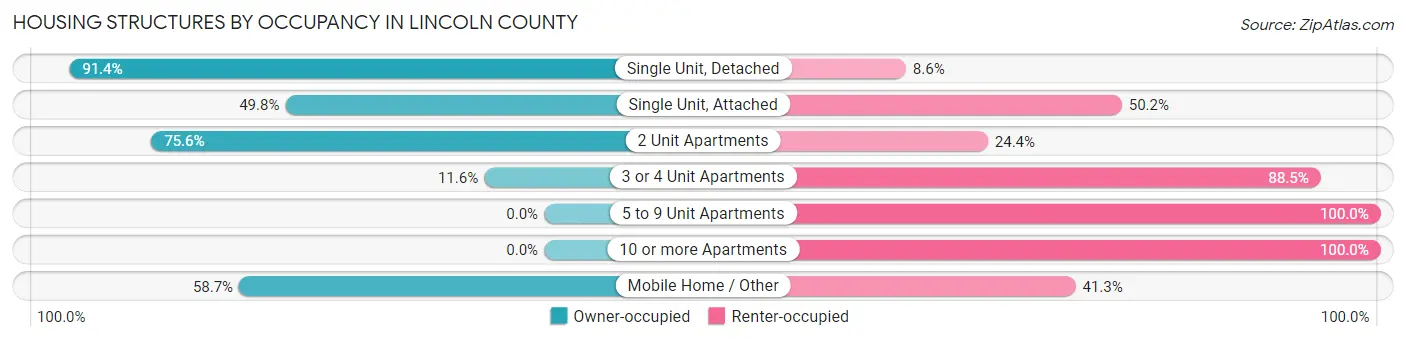
| Structure Type | Owner-occupied | Renter-occupied |
| Single Unit, Detached | 5,294 (91.4%) | 499 (8.6%) |
| Single Unit, Attached | 140 (49.8%) | 141 (50.2%) |
| 2 Unit Apartments | 31 (75.6%) | 10 (24.4%) |
| 3 or 4 Unit Apartments | 29 (11.6%) | 222 (88.4%) |
| 5 to 9 Unit Apartments | 0 (0.0%) | 257 (100.0%) |
| 10 or more Apartments | 0 (0.0%) | 49 (100.0%) |
| Mobile Home / Other | 562 (58.7%) | 395 (41.3%) |
| Total | 6,056 (79.4%) | 1,573 (20.6%) |
Housing Structures by Number of Rooms in Lincoln County
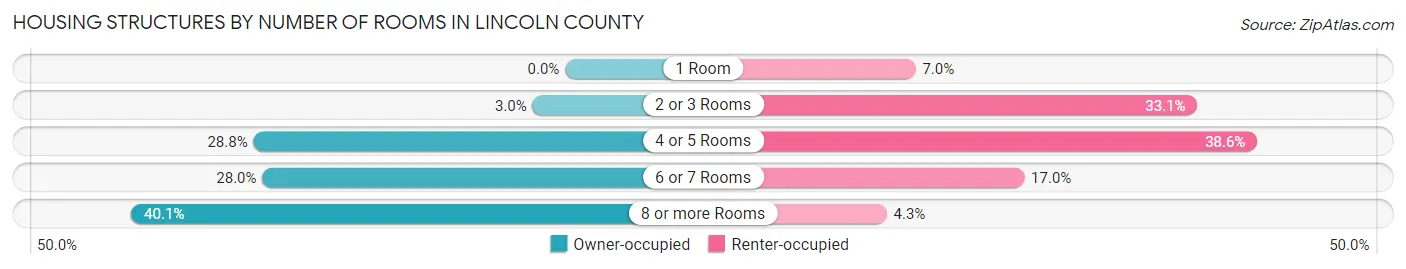
| Number of Rooms | Owner-occupied | Renter-occupied |
| 1 Room | 0 (0.0%) | 110 (7.0%) |
| 2 or 3 Rooms | 183 (3.0%) | 520 (33.1%) |
| 4 or 5 Rooms | 1,746 (28.8%) | 607 (38.6%) |
| 6 or 7 Rooms | 1,696 (28.0%) | 268 (17.0%) |
| 8 or more Rooms | 2,431 (40.1%) | 68 (4.3%) |
| Total | 6,056 (100.0%) | 1,573 (100.0%) |
Housing Structure by Heating Type in Lincoln County
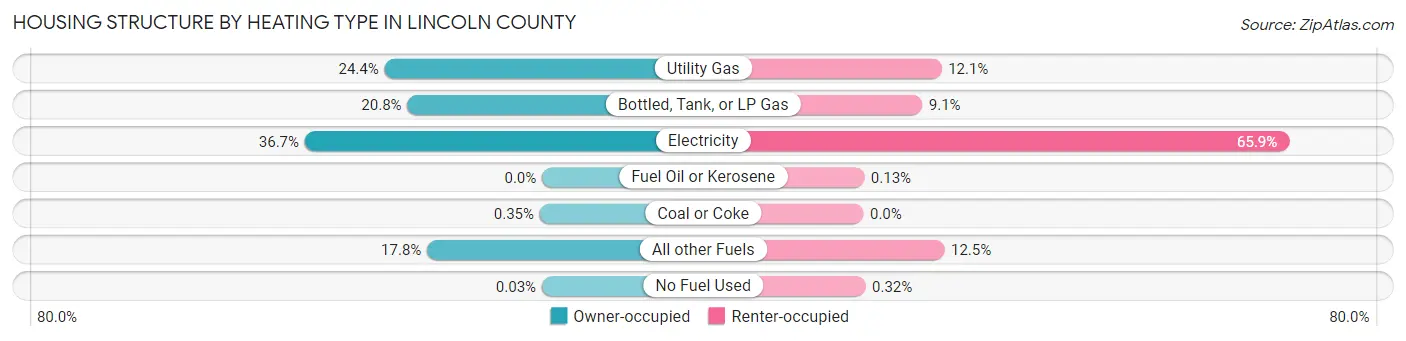
| Heating Type | Owner-occupied | Renter-occupied |
| Utility Gas | 1,475 (24.4%) | 190 (12.1%) |
| Bottled, Tank, or LP Gas | 1,261 (20.8%) | 143 (9.1%) |
| Electricity | 2,221 (36.7%) | 1,036 (65.9%) |
| Fuel Oil or Kerosene | 0 (0.0%) | 2 (0.1%) |
| Coal or Coke | 21 (0.4%) | 0 (0.0%) |
| All other Fuels | 1,076 (17.8%) | 197 (12.5%) |
| No Fuel Used | 2 (0.0%) | 5 (0.3%) |
| Total | 6,056 (100.0%) | 1,573 (100.0%) |
Household Vehicle Usage in Lincoln County
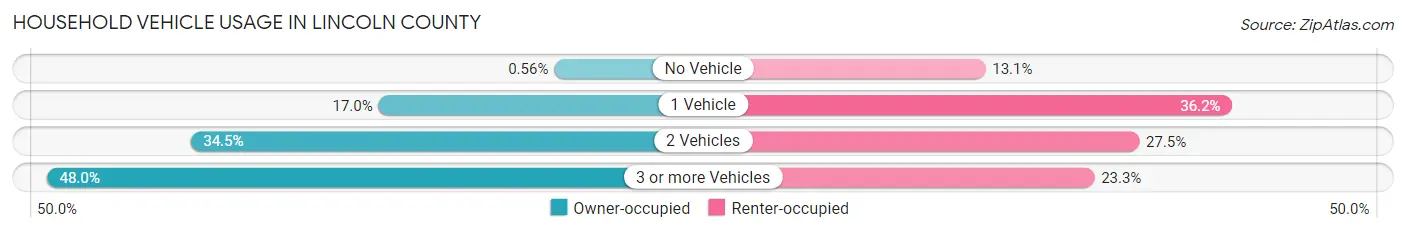
| Vehicles per Household | Owner-occupied | Renter-occupied |
| No Vehicle | 34 (0.6%) | 206 (13.1%) |
| 1 Vehicle | 1,027 (17.0%) | 569 (36.2%) |
| 2 Vehicles | 2,091 (34.5%) | 432 (27.5%) |
| 3 or more Vehicles | 2,904 (47.9%) | 366 (23.3%) |
| Total | 6,056 (100.0%) | 1,573 (100.0%) |
Real Estate & Mortgages in Lincoln County
Real Estate and Mortgage Overview in Lincoln County
| Characteristic | Without Mortgage | With Mortgage |
| Housing Units | 2,655 | 3,401 |
| Median Property Value | $301,400 | $343,300 |
| Median Household Income | $72,242 | $948 |
| Monthly Housing Costs | $436 | $217 |
| Real Estate Taxes | $1,271 | $58 |
Property Value by Mortgage Status in Lincoln County

| Property Value | Without Mortgage | With Mortgage |
| Less than $50,000 | 173 (6.5%) | 50 (1.5%) |
| $50,000 to $99,999 | 308 (11.6%) | 47 (1.4%) |
| $100,000 to $299,999 | 839 (31.6%) | 1,281 (37.7%) |
| $300,000 to $499,999 | 876 (33.0%) | 1,345 (39.6%) |
| $500,000 to $749,999 | 292 (11.0%) | 478 (14.1%) |
| $750,000 to $999,999 | 68 (2.6%) | 120 (3.5%) |
| $1,000,000 or more | 99 (3.7%) | 80 (2.4%) |
| Total | 2,655 (100.0%) | 3,401 (100.0%) |
Household Income by Mortgage Status in Lincoln County
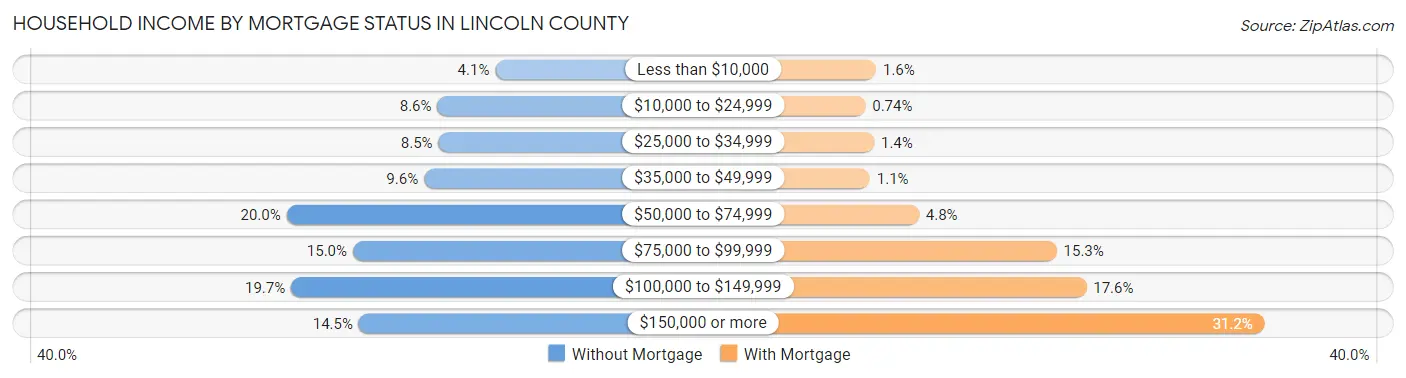
| Household Income | Without Mortgage | With Mortgage |
| Less than $10,000 | 110 (4.1%) | 53 (1.6%) |
| $10,000 to $24,999 | 227 (8.6%) | 25 (0.7%) |
| $25,000 to $34,999 | 225 (8.5%) | 48 (1.4%) |
| $35,000 to $49,999 | 254 (9.6%) | 37 (1.1%) |
| $50,000 to $74,999 | 532 (20.0%) | 164 (4.8%) |
| $75,000 to $99,999 | 398 (15.0%) | 521 (15.3%) |
| $100,000 to $149,999 | 523 (19.7%) | 598 (17.6%) |
| $150,000 or more | 386 (14.5%) | 1,060 (31.2%) |
| Total | 2,655 (100.0%) | 3,401 (100.0%) |
Property Value to Household Income Ratio in Lincoln County
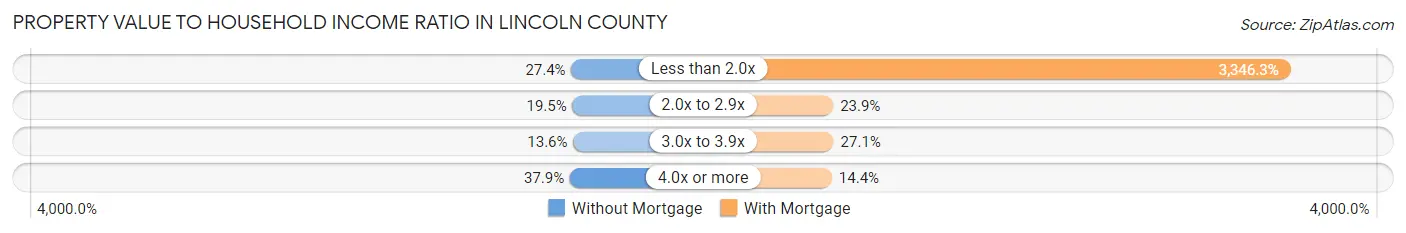
| Value-to-Income Ratio | Without Mortgage | With Mortgage |
| Less than 2.0x | 728 (27.4%) | 113,806 (3,346.2%) |
| 2.0x to 2.9x | 517 (19.5%) | 814 (23.9%) |
| 3.0x to 3.9x | 360 (13.6%) | 920 (27.1%) |
| 4.0x or more | 1,005 (37.9%) | 491 (14.4%) |
| Total | 2,655 (100.0%) | 3,401 (100.0%) |
Real Estate Taxes by Mortgage Status in Lincoln County
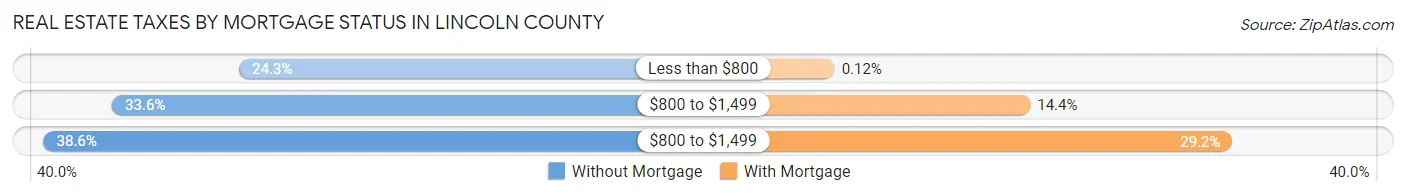
| Property Taxes | Without Mortgage | With Mortgage |
| Less than $800 | 646 (24.3%) | 4 (0.1%) |
| $800 to $1,499 | 892 (33.6%) | 490 (14.4%) |
| $800 to $1,499 | 1,025 (38.6%) | 992 (29.2%) |
| Total | 2,655 (100.0%) | 3,401 (100.0%) |
Health & Disability in Lincoln County
Health Insurance Coverage by Age in Lincoln County
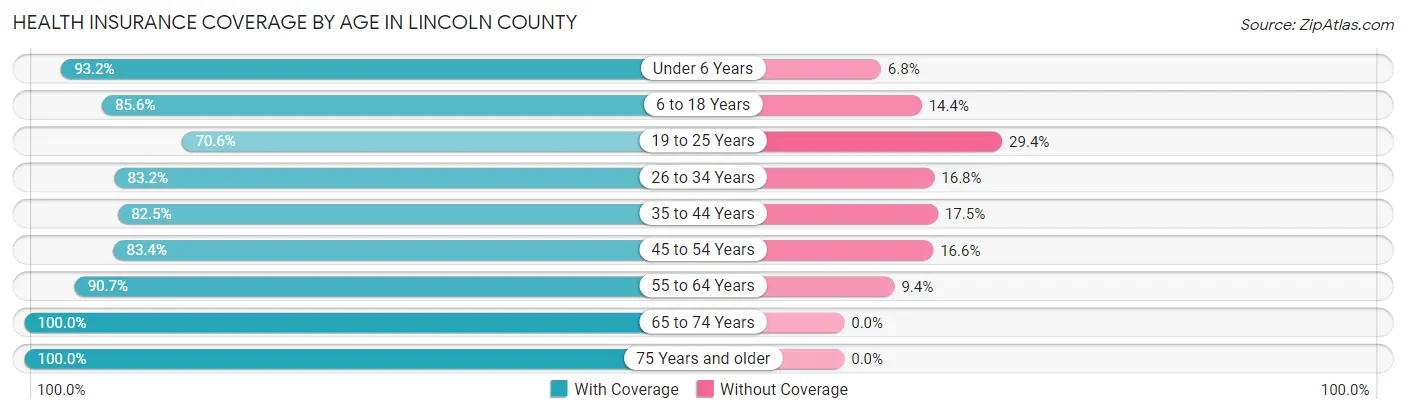
| Age Bracket | With Coverage | Without Coverage |
| Under 6 Years | 1,406 (93.2%) | 103 (6.8%) |
| 6 to 18 Years | 3,388 (85.6%) | 572 (14.4%) |
| 19 to 25 Years | 834 (70.6%) | 348 (29.4%) |
| 26 to 34 Years | 1,486 (83.2%) | 300 (16.8%) |
| 35 to 44 Years | 2,169 (82.5%) | 459 (17.5%) |
| 45 to 54 Years | 1,876 (83.4%) | 373 (16.6%) |
| 55 to 64 Years | 2,580 (90.6%) | 266 (9.3%) |
| 65 to 74 Years | 2,405 (100.0%) | 0 (0.0%) |
| 75 Years and older | 1,128 (100.0%) | 0 (0.0%) |
| Total | 17,272 (87.7%) | 2,421 (12.3%) |
Health Insurance Coverage by Citizenship Status in Lincoln County
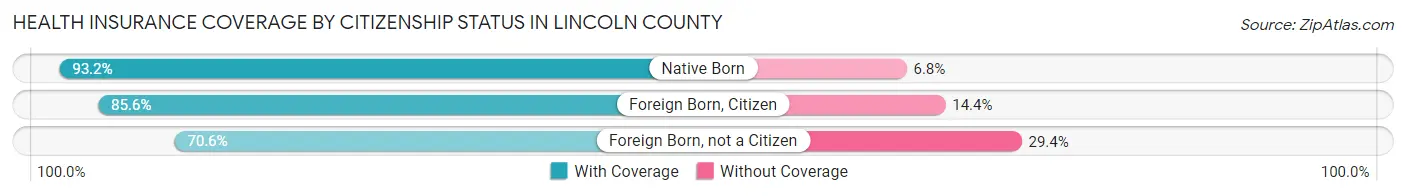
| Citizenship Status | With Coverage | Without Coverage |
| Native Born | 1,406 (93.2%) | 103 (6.8%) |
| Foreign Born, Citizen | 3,388 (85.6%) | 572 (14.4%) |
| Foreign Born, not a Citizen | 834 (70.6%) | 348 (29.4%) |
Health Insurance Coverage by Household Income in Lincoln County
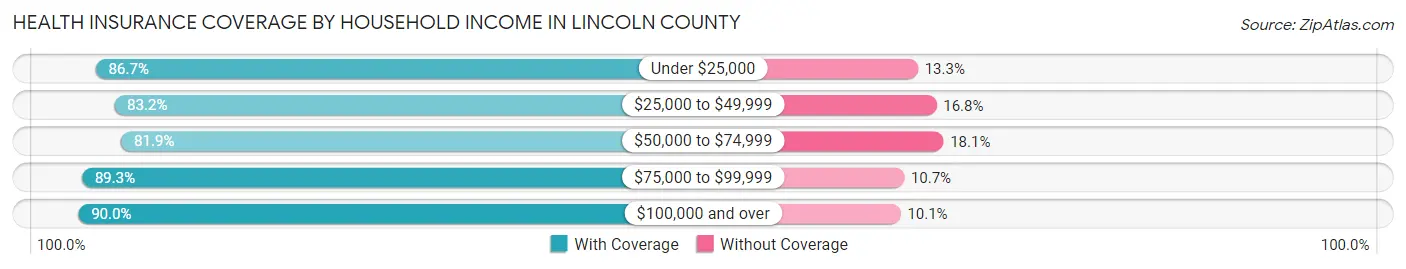
| Household Income | With Coverage | Without Coverage |
| Under $25,000 | 1,031 (86.7%) | 158 (13.3%) |
| $25,000 to $49,999 | 1,673 (83.2%) | 337 (16.8%) |
| $50,000 to $74,999 | 2,502 (81.9%) | 552 (18.1%) |
| $75,000 to $99,999 | 3,243 (89.3%) | 389 (10.7%) |
| $100,000 and over | 8,817 (89.9%) | 985 (10.1%) |
Public vs Private Health Insurance Coverage by Age in Lincoln County
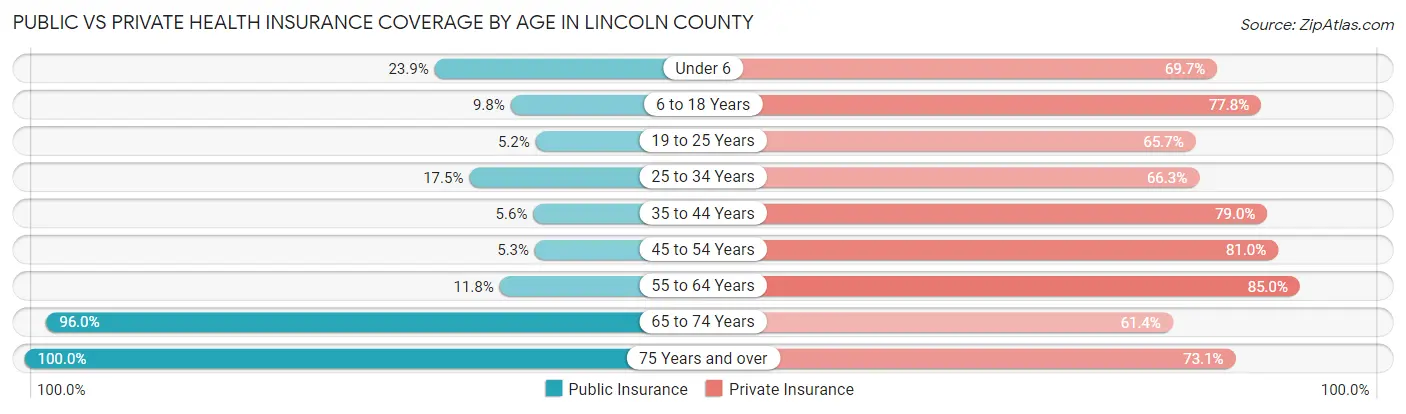
| Age Bracket | Public Insurance | Private Insurance |
| Under 6 | 361 (23.9%) | 1,051 (69.7%) |
| 6 to 18 Years | 388 (9.8%) | 3,081 (77.8%) |
| 19 to 25 Years | 61 (5.2%) | 776 (65.6%) |
| 25 to 34 Years | 312 (17.5%) | 1,184 (66.3%) |
| 35 to 44 Years | 147 (5.6%) | 2,075 (79.0%) |
| 45 to 54 Years | 119 (5.3%) | 1,821 (81.0%) |
| 55 to 64 Years | 337 (11.8%) | 2,419 (85.0%) |
| 65 to 74 Years | 2,308 (96.0%) | 1,477 (61.4%) |
| 75 Years and over | 1,128 (100.0%) | 824 (73.1%) |
| Total | 5,161 (26.2%) | 14,708 (74.7%) |
Disability Status by Sex by Age in Lincoln County
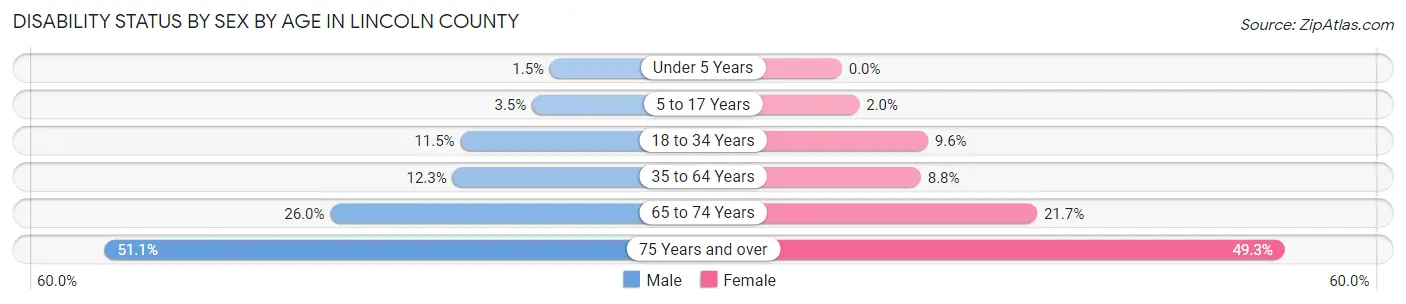
| Age Bracket | Male | Female |
| Under 5 Years | 9 (1.5%) | 0 (0.0%) |
| 5 to 17 Years | 72 (3.5%) | 37 (1.9%) |
| 18 to 34 Years | 193 (11.5%) | 150 (9.6%) |
| 35 to 64 Years | 486 (12.3%) | 333 (8.8%) |
| 65 to 74 Years | 322 (26.0%) | 253 (21.7%) |
| 75 Years and over | 278 (51.1%) | 288 (49.3%) |
Disability Class by Sex by Age in Lincoln County
Disability Class: Hearing Difficulty
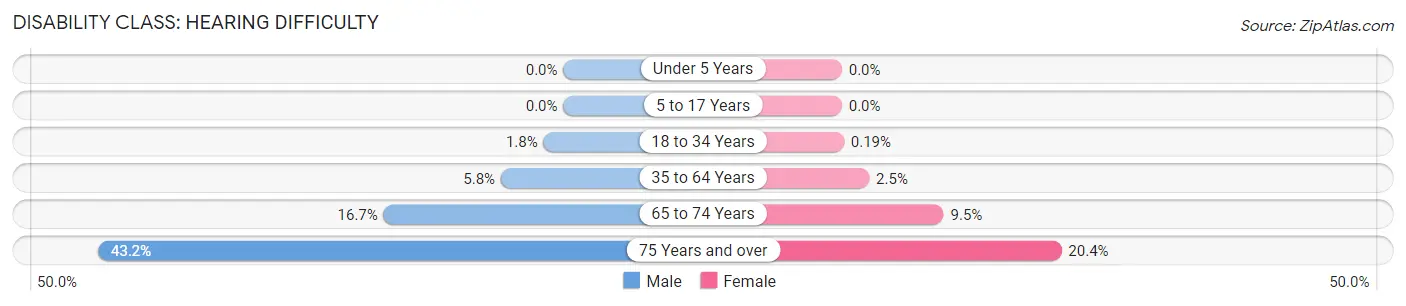
| Age Bracket | Male | Female |
| Under 5 Years | 0 (0.0%) | 0 (0.0%) |
| 5 to 17 Years | 0 (0.0%) | 0 (0.0%) |
| 18 to 34 Years | 31 (1.8%) | 3 (0.2%) |
| 35 to 64 Years | 228 (5.8%) | 96 (2.5%) |
| 65 to 74 Years | 207 (16.7%) | 110 (9.5%) |
| 75 Years and over | 235 (43.2%) | 119 (20.4%) |
Disability Class: Vision Difficulty

| Age Bracket | Male | Female |
| Under 5 Years | 9 (1.5%) | 0 (0.0%) |
| 5 to 17 Years | 0 (0.0%) | 3 (0.2%) |
| 18 to 34 Years | 0 (0.0%) | 31 (2.0%) |
| 35 to 64 Years | 30 (0.8%) | 75 (2.0%) |
| 65 to 74 Years | 71 (5.7%) | 12 (1.0%) |
| 75 Years and over | 41 (7.5%) | 86 (14.7%) |
Disability Class: Cognitive Difficulty
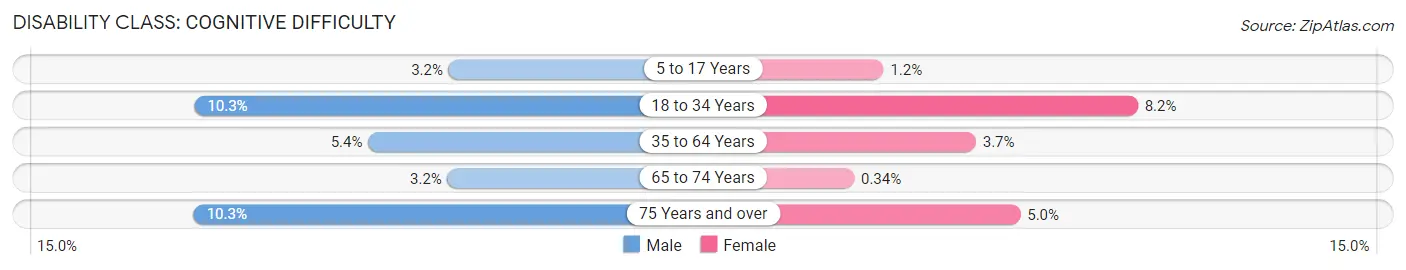
| Age Bracket | Male | Female |
| 5 to 17 Years | 66 (3.2%) | 22 (1.2%) |
| 18 to 34 Years | 173 (10.3%) | 129 (8.2%) |
| 35 to 64 Years | 214 (5.4%) | 141 (3.7%) |
| 65 to 74 Years | 40 (3.2%) | 4 (0.3%) |
| 75 Years and over | 56 (10.3%) | 29 (5.0%) |
Disability Class: Ambulatory Difficulty
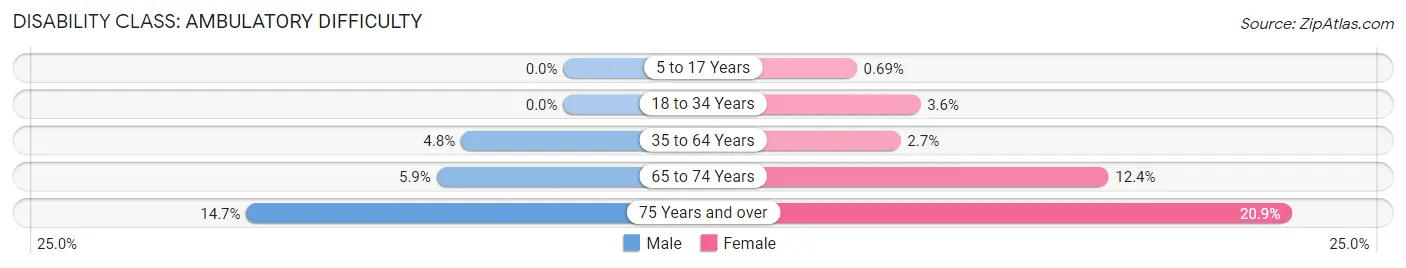
| Age Bracket | Male | Female |
| 5 to 17 Years | 0 (0.0%) | 13 (0.7%) |
| 18 to 34 Years | 0 (0.0%) | 57 (3.6%) |
| 35 to 64 Years | 187 (4.8%) | 103 (2.7%) |
| 65 to 74 Years | 73 (5.9%) | 144 (12.4%) |
| 75 Years and over | 80 (14.7%) | 122 (20.9%) |
Disability Class: Self-Care Difficulty
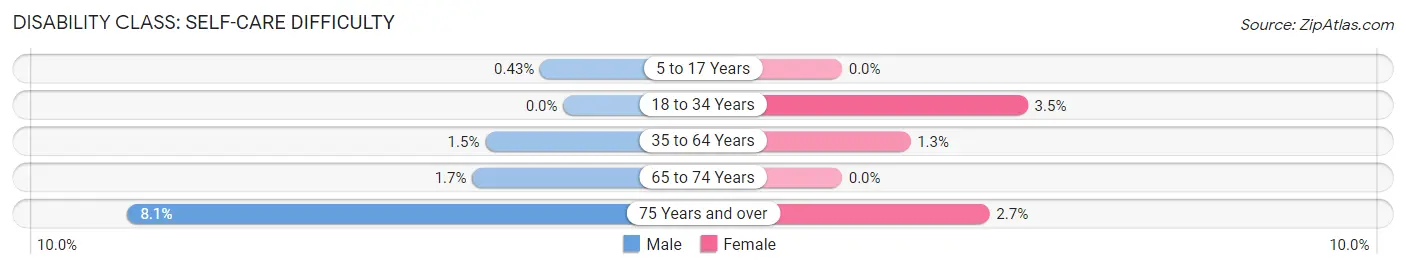
| Age Bracket | Male | Female |
| 5 to 17 Years | 9 (0.4%) | 0 (0.0%) |
| 18 to 34 Years | 0 (0.0%) | 54 (3.5%) |
| 35 to 64 Years | 57 (1.5%) | 48 (1.3%) |
| 65 to 74 Years | 21 (1.7%) | 0 (0.0%) |
| 75 Years and over | 44 (8.1%) | 16 (2.7%) |
Technology Access in Lincoln County
Computing Device Access in Lincoln County
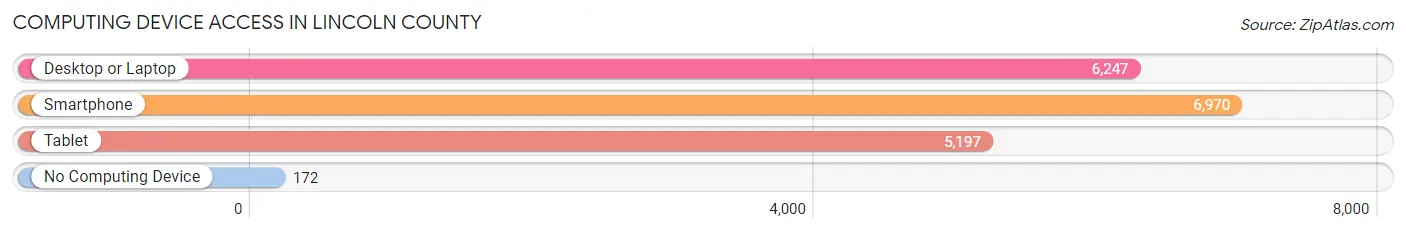
| Device Type | # Households | % Households |
| Desktop or Laptop | 6,247 | 81.9% |
| Smartphone | 6,970 | 91.4% |
| Tablet | 5,197 | 68.1% |
| No Computing Device | 172 | 2.2% |
| Total | 7,629 | 100.0% |
Internet Access in Lincoln County
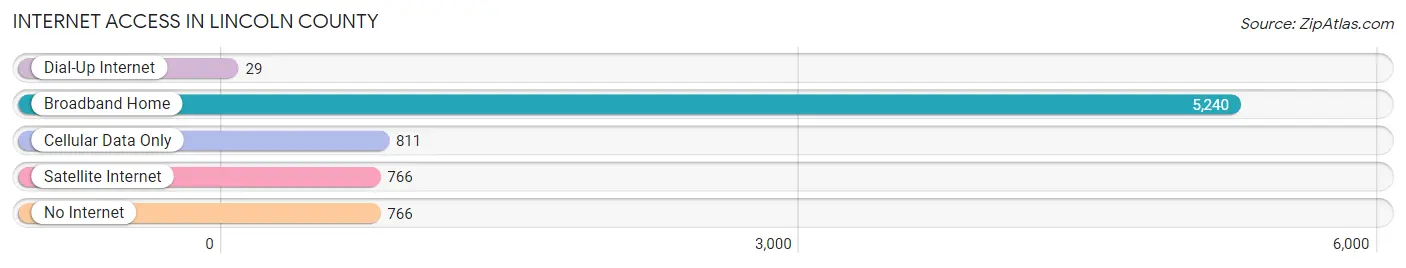
| Internet Type | # Households | % Households |
| Dial-Up Internet | 29 | 0.4% |
| Broadband Home | 5,240 | 68.7% |
| Cellular Data Only | 811 | 10.6% |
| Satellite Internet | 766 | 10.0% |
| No Internet | 766 | 10.0% |
| Total | 7,629 | 100.0% |
Lincoln County Summary
Lincoln County, Wyoming is located in the south-central part of the state and is bordered by Sweetwater County to the north, Uinta County to the east, Sublette County to the south, and Fremont County to the west. The county seat is Kemmerer, and the largest city is Afton. The county was created in 1911 and named after President Abraham Lincoln.
Geography
Lincoln County covers an area of 4,822 square miles and is the fourth largest county in Wyoming. The county is located in the Rocky Mountains and is home to the Salt River Range, the Wyoming Range, and the Gros Ventre Range. The highest point in the county is Mount Coffin at 11,890 feet. The county is also home to the Salt River, the Greys River, and the Snake River.
The county is mostly rural and is home to several small towns and communities, including Afton, Cokeville, Diamondville, Kemmerer, and La Barge. The county is also home to several state parks, including Bear River State Park, Fontenelle Reservoir State Park, and Seedskadee National Wildlife Refuge.
Economy
Lincoln County has a diverse economy that is largely based on agriculture, mining, and tourism. The county is home to several large coal mines, including the Kemmerer Mine, the Bridger Mine, and the Black Butte Mine. The county is also home to several large ranches, including the Diamond Cross Ranch and the Bar T Bar Ranch.
Tourism is also an important part of the county's economy. The county is home to several popular tourist attractions, including the Fossil Butte National Monument, the Seedskadee National Wildlife Refuge, and the Fontenelle Reservoir State Park.
Demographics
As of the 2010 census, Lincoln County had a population of 18,906. The population was spread out with a median age of 38.7 years. The racial makeup of the county was 95.2% White, 0.3% African American, 0.7% Native American, 0.4% Asian, 0.1% Pacific Islander, 1.7% from other races, and 1.6% from two or more races. Hispanic or Latino of any race were 4.2% of the population.
The median income for a household in the county was $45,945 and the median income for a family was $54,945. The per capita income for the county was $22,945. About 11.2% of families and 14.2% of the population were below the poverty line, including 17.2% of those under age 18 and 8.2% of those age 65 or over.
Conclusion
Lincoln County, Wyoming is a rural county located in the south-central part of the state. The county is home to several small towns and communities and is largely based on agriculture, mining, and tourism. The county has a diverse population and a median income of $45,945. Lincoln County is home to several popular tourist attractions and is a great place to visit and explore.
Common Questions
What is the Total Population of Lincoln County?
Total Population of Lincoln County is 19,794.
What is the Total Male Population of Lincoln County?
Total Male Population of Lincoln County is 10,134.
What is the Total Female Population of Lincoln County?
Total Female Population of Lincoln County is 9,660.
What is the Ratio of Males per 100 Females in Lincoln County?
There are 104.91 Males per 100 Females in Lincoln County.
What is the Ratio of Females per 100 Males in Lincoln County?
There are 95.32 Females per 100 Males in Lincoln County.
What is the Median Population Age in Lincoln County?
Median Population Age in Lincoln County is 40.7 Years.
What is the Average Family Size in Lincoln County
Average Family Size in Lincoln County is 3.2 People.
What is the Average Household Size in Lincoln County
Average Household Size in Lincoln County is 2.6 People.
What is Per Capita Income in Lincoln County?
Per Capita income in Lincoln County is $38,245.
What is the Median Family Income in Lincoln County?
Median Family Income in Lincoln County is $105,307.
What is the Median Household income in Lincoln County?
Median Household Income in Lincoln County is $83,033.
What is Income or Wage Gap in Lincoln County?
Income or Wage Gap in Lincoln County is 48.9%.
Women in Lincoln County earn 51.1 cents for every dollar earned by a man.
What is Family Income Deficit in Lincoln County?
Family Income Deficit in Lincoln County is $10,461.
Families that are below poverty line in Lincoln County earn $10,461 less on average than the poverty threshold level.
What is Inequality or Gini Index in Lincoln County?
Inequality or Gini Index in Lincoln County is 0.38.
How Large is the Labor Force in Lincoln County?
There are 10,142 People in the Labor Forcein in Lincoln County.
What is the Percentage of People in the Labor Force in Lincoln County?
66.5% of People are in the Labor Force in Lincoln County.
What is the Unemployment Rate in Lincoln County?
Unemployment Rate in Lincoln County is 2.6%.