Laramie County, WY
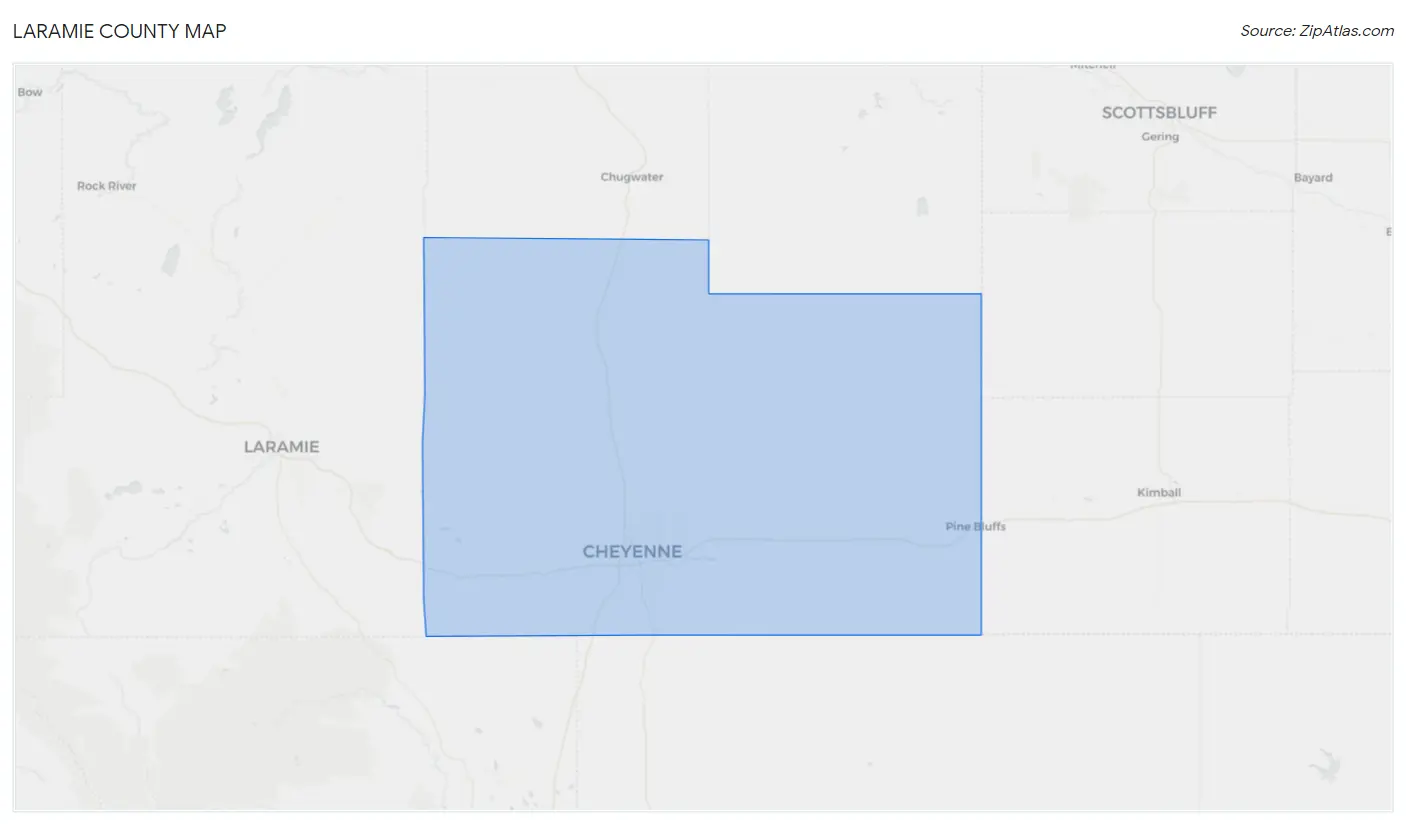
Laramie County Map
Laramie County Overview
100,316
TOTAL POPULATION
51,152
MALE POPULATION
49,164
FEMALE POPULATION
104.04
MALES / 100 FEMALES
96.11
FEMALES / 100 MALES
38.0
MEDIAN AGE
3.0
AVG FAMILY SIZE
2.4
AVG HOUSEHOLD SIZE
$41,104
PER CAPITA INCOME
$96,410
AVG FAMILY INCOME
$76,282
AVG HOUSEHOLD INCOME
36.3%
WAGE / INCOME GAP [ % ]
63.7¢/ $1
WAGE / INCOME GAP [ $ ]
$11,470
FAMILY INCOME DEFICIT
0.44
INEQUALITY / GINI INDEX
53,454
LABOR FORCE [ PEOPLE ]
66.9%
PERCENT IN LABOR FORCE
3.5%
UNEMPLOYMENT RATE
Laramie County Area Codes
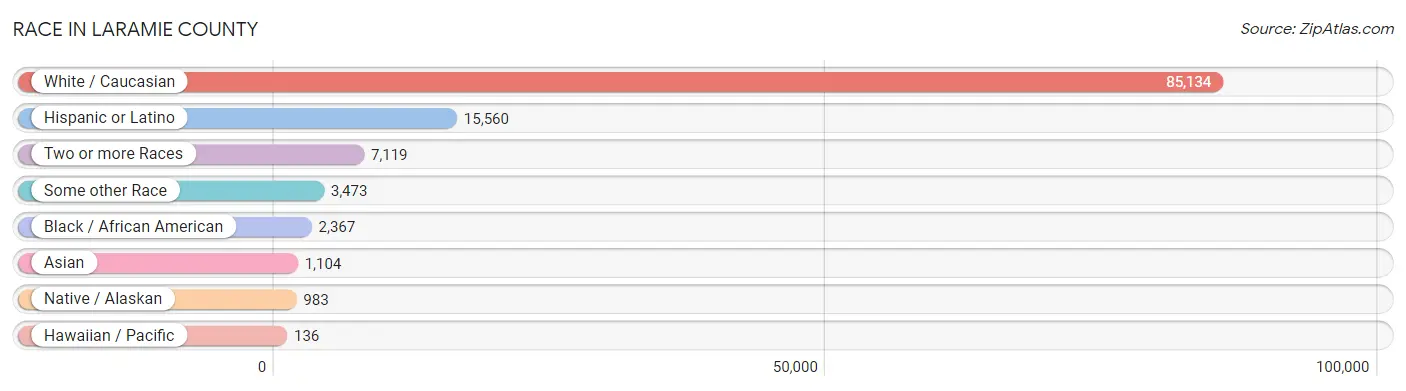
Race in Laramie County
The most populous races in Laramie County are White / Caucasian (85,134 | 84.9%), Hispanic or Latino (15,560 | 15.5%), and Two or more Races (7,119 | 7.1%).
| Race | # Population | % Population |
| Asian | 1,104 | 1.1% |
| Black / African American | 2,367 | 2.4% |
| Hawaiian / Pacific | 136 | 0.1% |
| Hispanic or Latino | 15,560 | 15.5% |
| Native / Alaskan | 983 | 1.0% |
| White / Caucasian | 85,134 | 84.9% |
| Two or more Races | 7,119 | 7.1% |
| Some other Race | 3,473 | 3.5% |
| Total | 100,316 | 100.0% |
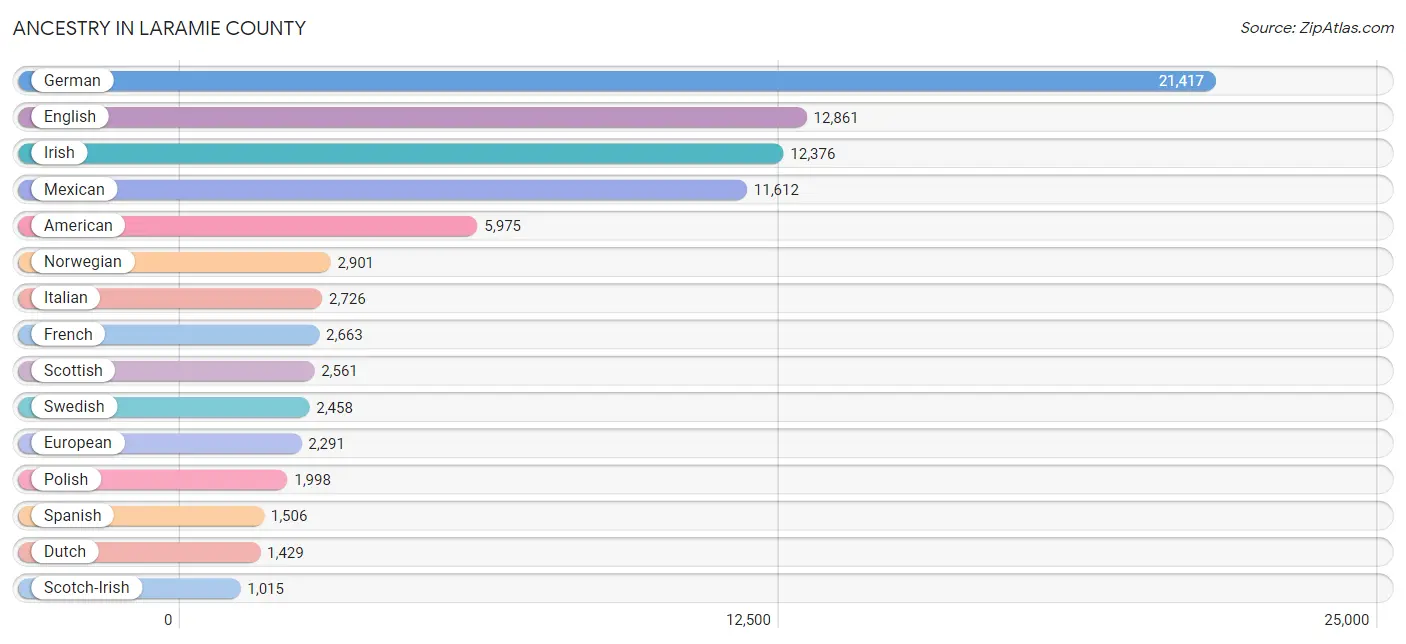
Ancestry in Laramie County
The most populous ancestries reported in Laramie County are German (21,417 | 21.3%), English (12,861 | 12.8%), Irish (12,376 | 12.3%), Mexican (11,612 | 11.6%), and American (5,975 | 6.0%), together accounting for 64.0% of all Laramie County residents.
| Ancestry | # Population | % Population |
| African | 204 | 0.2% |
| Albanian | 1 | 0.0% |
| American | 5,975 | 6.0% |
| Apache | 72 | 0.1% |
| Arab | 123 | 0.1% |
| Arapaho | 89 | 0.1% |
| Argentinean | 12 | 0.0% |
| Armenian | 8 | 0.0% |
| Austrian | 222 | 0.2% |
| Bahamian | 21 | 0.0% |
| Bangladeshi | 7 | 0.0% |
| Barbadian | 42 | 0.0% |
| Belgian | 273 | 0.3% |
| Bhutanese | 384 | 0.4% |
| Blackfeet | 35 | 0.0% |
| Brazilian | 1 | 0.0% |
| British | 879 | 0.9% |
| Burmese | 442 | 0.4% |
| Cajun | 17 | 0.0% |
| Canadian | 244 | 0.2% |
| Celtic | 24 | 0.0% |
| Central American | 106 | 0.1% |
| Central American Indian | 59 | 0.1% |
| Cherokee | 237 | 0.2% |
| Cheyenne | 22 | 0.0% |
| Chickasaw | 11 | 0.0% |
| Chilean | 138 | 0.1% |
| Chinese | 11 | 0.0% |
| Chippewa | 107 | 0.1% |
| Choctaw | 50 | 0.1% |
| Creek | 46 | 0.1% |
| Croatian | 98 | 0.1% |
| Crow | 23 | 0.0% |
| Cuban | 42 | 0.0% |
| Czech | 558 | 0.6% |
| Czechoslovakian | 212 | 0.2% |
| Danish | 1,009 | 1.0% |
| Dominican | 1 | 0.0% |
| Dutch | 1,429 | 1.4% |
| Eastern European | 180 | 0.2% |
| Egyptian | 10 | 0.0% |
| English | 12,861 | 12.8% |
| Estonian | 5 | 0.0% |
| European | 2,291 | 2.3% |
| Filipino | 52 | 0.1% |
| Finnish | 385 | 0.4% |
| French | 2,663 | 2.6% |
| French American Indian | 3 | 0.0% |
| French Canadian | 702 | 0.7% |
| German | 21,417 | 21.3% |
| German Russian | 9 | 0.0% |
| Ghanaian | 32 | 0.0% |
| Greek | 425 | 0.4% |
| Guamanian / Chamorro | 86 | 0.1% |
| Guatemalan | 6 | 0.0% |
| Haitian | 10 | 0.0% |
| Hopi | 52 | 0.1% |
| Hungarian | 57 | 0.1% |
| Icelander | 9 | 0.0% |
| Indian (Asian) | 338 | 0.3% |
| Indonesian | 10 | 0.0% |
| Iranian | 14 | 0.0% |
| Irish | 12,376 | 12.3% |
| Iroquois | 2 | 0.0% |
| Italian | 2,726 | 2.7% |
| Jamaican | 13 | 0.0% |
| Jordanian | 15 | 0.0% |
| Korean | 678 | 0.7% |
| Laotian | 20 | 0.0% |
| Latvian | 17 | 0.0% |
| Lebanese | 92 | 0.1% |
| Lithuanian | 294 | 0.3% |
| Mexican | 11,612 | 11.6% |
| Mexican American Indian | 189 | 0.2% |
| Native Hawaiian | 87 | 0.1% |
| Navajo | 56 | 0.1% |
| New Zealander | 15 | 0.0% |
| Nicaraguan | 59 | 0.1% |
| Nigerian | 64 | 0.1% |
| Northern European | 206 | 0.2% |
| Norwegian | 2,901 | 2.9% |
| Osage | 3 | 0.0% |
| Ottawa | 5 | 0.0% |
| Pakistani | 58 | 0.1% |
| Palestinian | 1 | 0.0% |
| Panamanian | 31 | 0.0% |
| Pennsylvania German | 27 | 0.0% |
| Peruvian | 88 | 0.1% |
| Pima | 20 | 0.0% |
| Polish | 1,998 | 2.0% |
| Portuguese | 414 | 0.4% |
| Pueblo | 94 | 0.1% |
| Puerto Rican | 287 | 0.3% |
| Romanian | 16 | 0.0% |
| Russian | 849 | 0.9% |
| Salvadoran | 10 | 0.0% |
| Samoan | 72 | 0.1% |
| Scandinavian | 925 | 0.9% |
| Scotch-Irish | 1,015 | 1.0% |
| Scottish | 2,561 | 2.5% |
| Shoshone | 133 | 0.1% |
| Sioux | 428 | 0.4% |
| Slavic | 36 | 0.0% |
| Slovak | 36 | 0.0% |
| Slovene | 17 | 0.0% |
| Somali | 26 | 0.0% |
| South American | 442 | 0.4% |
| Spaniard | 561 | 0.6% |
| Spanish | 1,506 | 1.5% |
| Spanish American | 17 | 0.0% |
| Sri Lankan | 45 | 0.0% |
| Subsaharan African | 337 | 0.3% |
| Swedish | 2,458 | 2.5% |
| Swiss | 244 | 0.2% |
| Syrian | 5 | 0.0% |
| Thai | 255 | 0.3% |
| Trinidadian and Tobagonian | 9 | 0.0% |
| Turkish | 46 | 0.1% |
| Ukrainian | 202 | 0.2% |
| Venezuelan | 204 | 0.2% |
| Welsh | 706 | 0.7% |
| Yakama | 4 | 0.0% |
| Yugoslavian | 28 | 0.0% | View All 123 Rows |
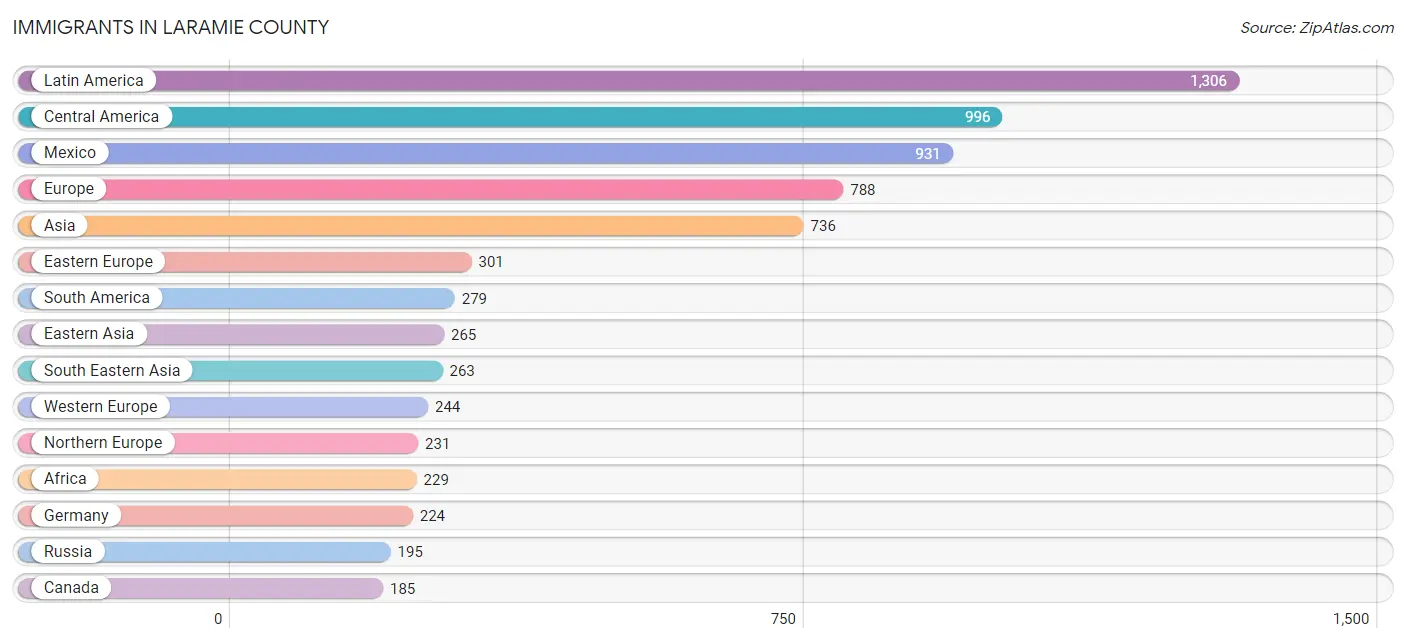
Immigrants in Laramie County
The most numerous immigrant groups reported in Laramie County came from Latin America (1,306 | 1.3%), Central America (996 | 1.0%), Mexico (931 | 0.9%), Europe (788 | 0.8%), and Asia (736 | 0.7%), together accounting for 4.7% of all Laramie County residents.
| Immigration Origin | # Population | % Population |
| Africa | 229 | 0.2% |
| Argentina | 19 | 0.0% |
| Asia | 736 | 0.7% |
| Australia | 12 | 0.0% |
| Azores | 7 | 0.0% |
| Bahamas | 21 | 0.0% |
| Bangladesh | 21 | 0.0% |
| Bulgaria | 13 | 0.0% |
| Canada | 185 | 0.2% |
| Caribbean | 31 | 0.0% |
| Central America | 996 | 1.0% |
| Chile | 64 | 0.1% |
| China | 97 | 0.1% |
| Croatia | 9 | 0.0% |
| Czechoslovakia | 24 | 0.0% |
| Denmark | 12 | 0.0% |
| Eastern Africa | 109 | 0.1% |
| Eastern Asia | 265 | 0.3% |
| Eastern Europe | 301 | 0.3% |
| El Salvador | 10 | 0.0% |
| England | 162 | 0.2% |
| Europe | 788 | 0.8% |
| France | 20 | 0.0% |
| Germany | 224 | 0.2% |
| Haiti | 10 | 0.0% |
| India | 63 | 0.1% |
| Indonesia | 20 | 0.0% |
| Italy | 1 | 0.0% |
| Japan | 54 | 0.1% |
| Jordan | 15 | 0.0% |
| Korea | 114 | 0.1% |
| Latin America | 1,306 | 1.3% |
| Mexico | 931 | 0.9% |
| Nepal | 31 | 0.0% |
| Nicaragua | 26 | 0.0% |
| Nigeria | 65 | 0.1% |
| Northern Europe | 231 | 0.2% |
| Oceania | 20 | 0.0% |
| Pakistan | 20 | 0.0% |
| Panama | 29 | 0.0% |
| Peru | 51 | 0.1% |
| Philippines | 182 | 0.2% |
| Poland | 35 | 0.0% |
| Portugal | 7 | 0.0% |
| Russia | 195 | 0.2% |
| Scotland | 19 | 0.0% |
| Senegal | 5 | 0.0% |
| Somalia | 26 | 0.0% |
| South Africa | 18 | 0.0% |
| South America | 279 | 0.3% |
| South Central Asia | 135 | 0.1% |
| South Eastern Asia | 263 | 0.3% |
| Southern Europe | 12 | 0.0% |
| Spain | 4 | 0.0% |
| Sweden | 1 | 0.0% |
| Taiwan | 33 | 0.0% |
| Turkey | 58 | 0.1% |
| Uganda | 47 | 0.1% |
| Ukraine | 23 | 0.0% |
| Venezuela | 145 | 0.1% |
| Vietnam | 14 | 0.0% |
| Western Africa | 70 | 0.1% |
| Western Asia | 73 | 0.1% |
| Western Europe | 244 | 0.2% | View All 64 Rows |
Sex and Age in Laramie County
Sex and Age in Laramie County
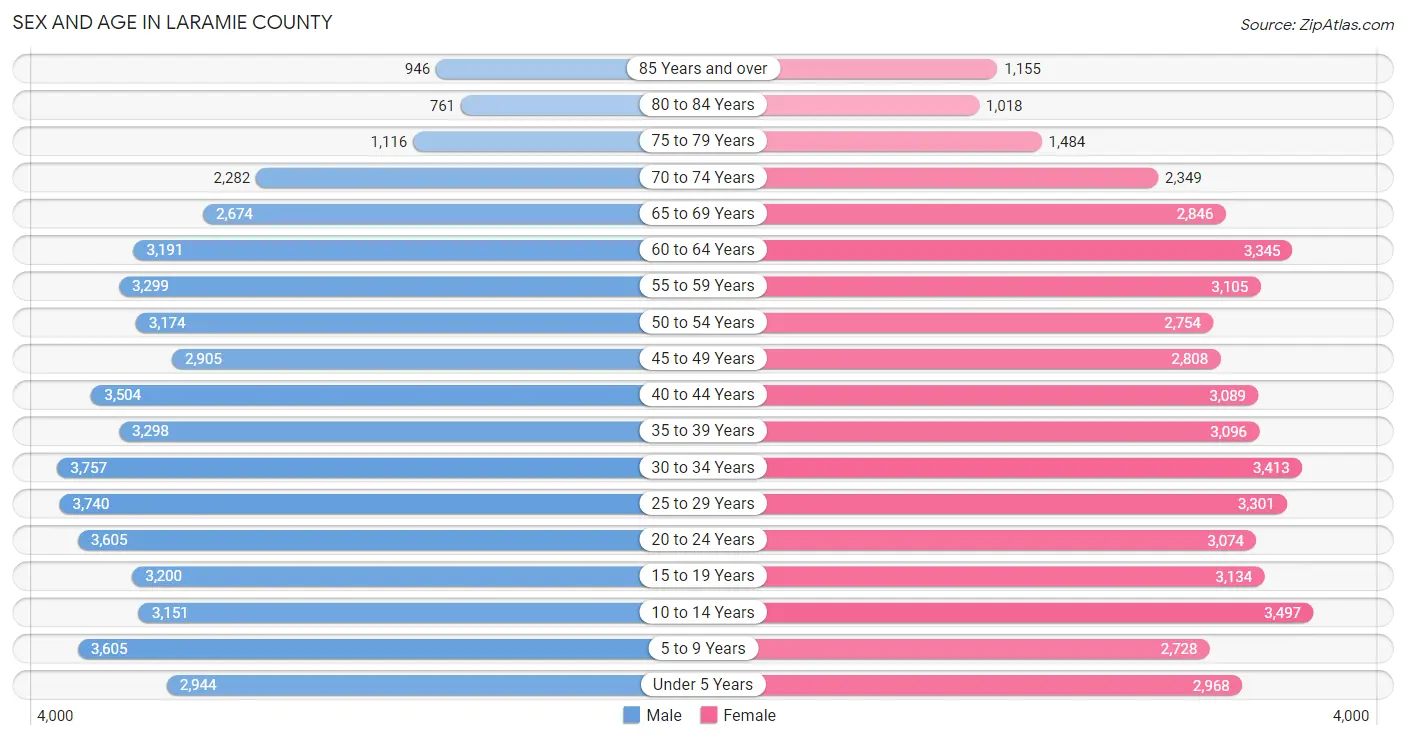
The most populous age groups in Laramie County are 30 to 34 Years (3,757 | 7.3%) for men and 10 to 14 Years (3,497 | 7.1%) for women.
| Age Bracket | Male | Female |
| Under 5 Years | 2,944 (5.8%) | 2,968 (6.0%) |
| 5 to 9 Years | 3,605 (7.0%) | 2,728 (5.6%) |
| 10 to 14 Years | 3,151 (6.2%) | 3,497 (7.1%) |
| 15 to 19 Years | 3,200 (6.3%) | 3,134 (6.4%) |
| 20 to 24 Years | 3,605 (7.0%) | 3,074 (6.2%) |
| 25 to 29 Years | 3,740 (7.3%) | 3,301 (6.7%) |
| 30 to 34 Years | 3,757 (7.3%) | 3,413 (6.9%) |
| 35 to 39 Years | 3,298 (6.5%) | 3,096 (6.3%) |
| 40 to 44 Years | 3,504 (6.9%) | 3,089 (6.3%) |
| 45 to 49 Years | 2,905 (5.7%) | 2,808 (5.7%) |
| 50 to 54 Years | 3,174 (6.2%) | 2,754 (5.6%) |
| 55 to 59 Years | 3,299 (6.5%) | 3,105 (6.3%) |
| 60 to 64 Years | 3,191 (6.2%) | 3,345 (6.8%) |
| 65 to 69 Years | 2,674 (5.2%) | 2,846 (5.8%) |
| 70 to 74 Years | 2,282 (4.5%) | 2,349 (4.8%) |
| 75 to 79 Years | 1,116 (2.2%) | 1,484 (3.0%) |
| 80 to 84 Years | 761 (1.5%) | 1,018 (2.1%) |
| 85 Years and over | 946 (1.8%) | 1,155 (2.4%) |
| Total | 51,152 (100.0%) | 49,164 (100.0%) |
Families and Households in Laramie County
Median Family Size in Laramie County
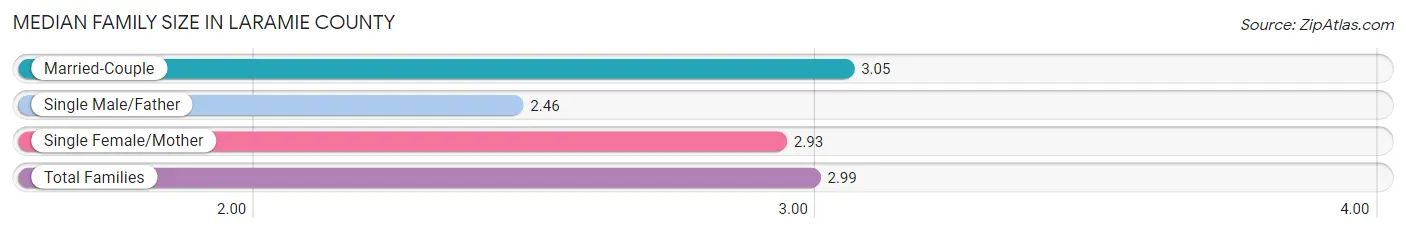
The median family size in Laramie County is 2.99 persons per family, with married-couple families (20,667 | 79.1%) accounting for the largest median family size of 3.05 persons per family. On the other hand, single male/father families (1,769 | 6.8%) represent the smallest median family size with 2.46 persons per family.
| Family Type | # Families | Family Size |
| Married-Couple | 20,667 (79.1%) | 3.05 |
| Single Male/Father | 1,769 (6.8%) | 2.46 |
| Single Female/Mother | 3,694 (14.1%) | 2.93 |
| Total Families | 26,130 (100.0%) | 2.99 |
Median Household Size in Laramie County
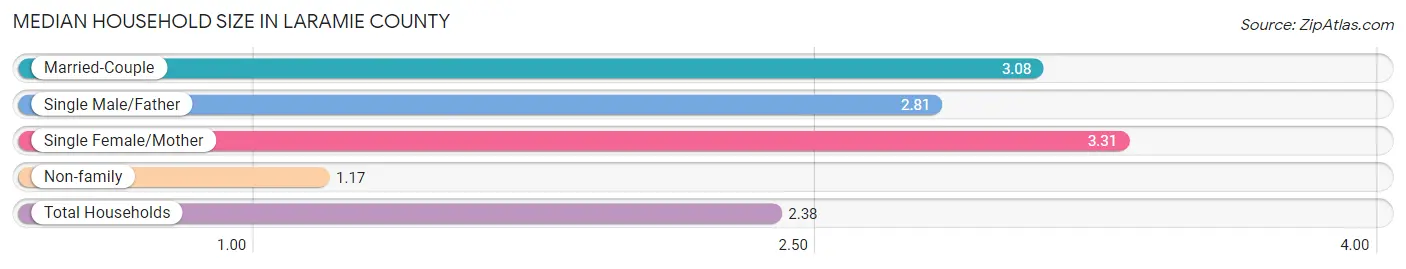
The median household size in Laramie County is 2.38 persons per household, with single female/mother households (3,694 | 8.9%) accounting for the largest median household size of 3.31 persons per household. non-family households (15,277 | 36.9%) represent the smallest median household size with 1.17 persons per household.
| Household Type | # Households | Household Size |
| Married-Couple | 20,667 (49.9%) | 3.08 |
| Single Male/Father | 1,769 (4.3%) | 2.81 |
| Single Female/Mother | 3,694 (8.9%) | 3.31 |
| Non-family | 15,277 (36.9%) | 1.17 |
| Total Households | 41,407 (100.0%) | 2.38 |
Household Size by Marriage Status in Laramie County
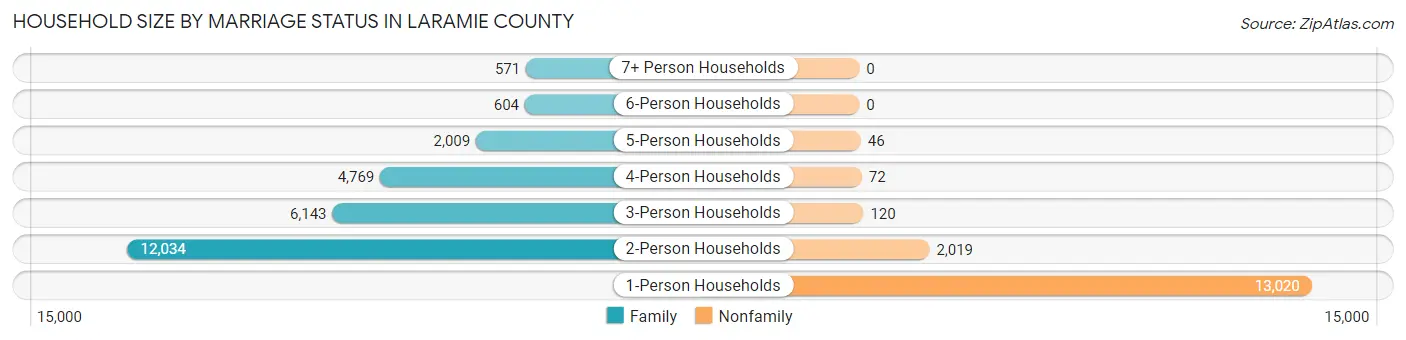
Out of a total of 41,407 households in Laramie County, 26,130 (63.1%) are family households, while 15,277 (36.9%) are nonfamily households. The most numerous type of family households are 2-person households, comprising 12,034, and the most common type of nonfamily households are 1-person households, comprising 13,020.
| Household Size | Family Households | Nonfamily Households |
| 1-Person Households | - | 13,020 (31.4%) |
| 2-Person Households | 12,034 (29.1%) | 2,019 (4.9%) |
| 3-Person Households | 6,143 (14.8%) | 120 (0.3%) |
| 4-Person Households | 4,769 (11.5%) | 72 (0.2%) |
| 5-Person Households | 2,009 (4.9%) | 46 (0.1%) |
| 6-Person Households | 604 (1.5%) | 0 (0.0%) |
| 7+ Person Households | 571 (1.4%) | 0 (0.0%) |
| Total | 26,130 (63.1%) | 15,277 (36.9%) |
Female Fertility in Laramie County
Fertility by Age in Laramie County
Average fertility rate in Laramie County is 61.0 births per 1,000 women. Women in the age bracket of 20 to 34 years have the highest fertility rate with 113.0 births per 1,000 women. Women in the age bracket of 20 to 34 years acount for 80.9% of all women with births.
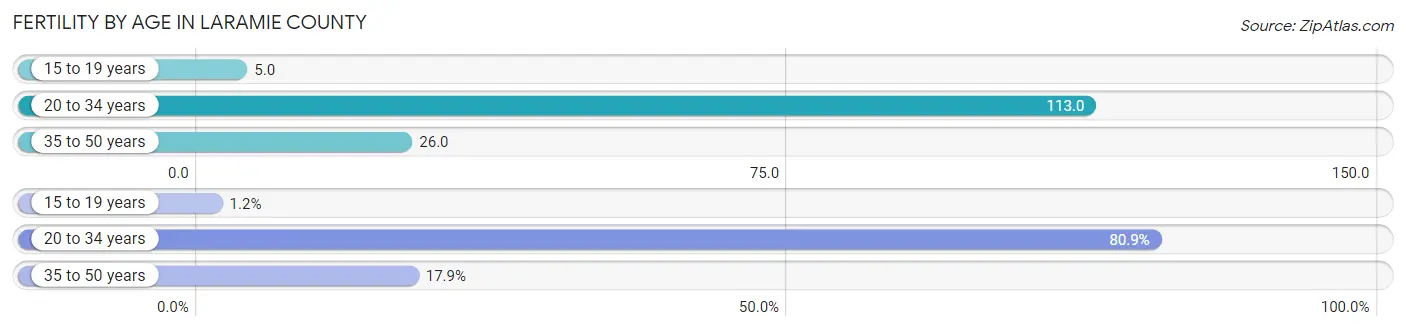
| Age Bracket | Women with Births | Births / 1,000 Women |
| 15 to 19 years | 17 (1.2%) | 5.0 |
| 20 to 34 years | 1,108 (80.9%) | 113.0 |
| 35 to 50 years | 245 (17.9%) | 26.0 |
| Total | 1,370 (100.0%) | 61.0 |
Fertility by Age by Marriage Status in Laramie County
79.6% of women with births (1,370) in Laramie County are married. The highest percentage of unmarried women with births falls into 15 to 19 years age bracket with 100.0% of them unmarried at the time of birth, while the lowest percentage of unmarried women with births belong to 20 to 34 years age bracket with 19.0% of them unmarried.
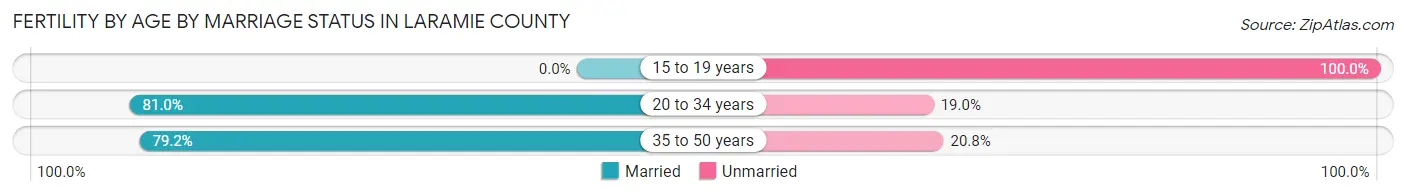
| Age Bracket | Married | Unmarried |
| 15 to 19 years | 0 (0.0%) | 17 (100.0%) |
| 20 to 34 years | 897 (81.0%) | 211 (19.0%) |
| 35 to 50 years | 194 (79.2%) | 51 (20.8%) |
| Total | 1,091 (79.6%) | 279 (20.4%) |
Fertility by Education in Laramie County
Average fertility rate in Laramie County is 61.0 births per 1,000 women. Women with the education attainment of graduate degree have the highest fertility rate of 105.0 births per 1,000 women, while women with the education attainment of college or associate's degree have the lowest fertility at 36.0 births per 1,000 women. Women with the education attainment of high school diploma represent 26.1% of all women with births.
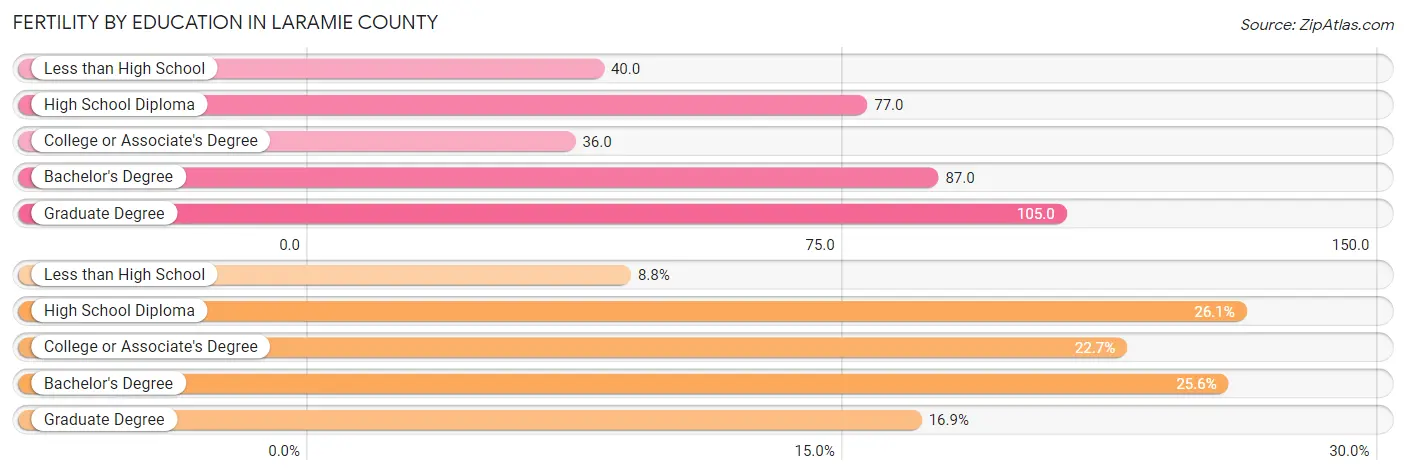
| Educational Attainment | Women with Births | Births / 1,000 Women |
| Less than High School | 120 (8.8%) | 40.0 |
| High School Diploma | 357 (26.1%) | 77.0 |
| College or Associate's Degree | 311 (22.7%) | 36.0 |
| Bachelor's Degree | 350 (25.6%) | 87.0 |
| Graduate Degree | 232 (16.9%) | 105.0 |
| Total | 1,370 (100.0%) | 61.0 |
Fertility by Education by Marriage Status in Laramie County
20.4% of women with births in Laramie County are unmarried. Women with the educational attainment of bachelor's degree are most likely to be married with 94.6% of them married at childbirth, while women with the educational attainment of less than high school are least likely to be married with 35.0% of them unmarried at childbirth.
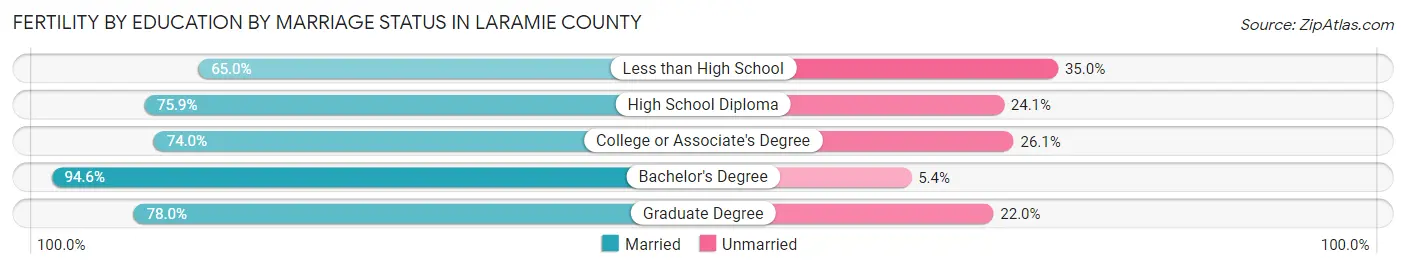
| Educational Attainment | Married | Unmarried |
| Less than High School | 78 (65.0%) | 42 (35.0%) |
| High School Diploma | 271 (75.9%) | 86 (24.1%) |
| College or Associate's Degree | 230 (74.0%) | 81 (26.1%) |
| Bachelor's Degree | 331 (94.6%) | 19 (5.4%) |
| Graduate Degree | 181 (78.0%) | 51 (22.0%) |
| Total | 1,091 (79.6%) | 279 (20.4%) |
Income in Laramie County
Income Overview in Laramie County
Per Capita Income in Laramie County is $41,104, while median incomes of families and households are $96,410 and $76,282 respectively.
| Characteristic | Number | Measure |
| Per Capita Income | 100,316 | $41,104 |
| Median Family Income | 26,130 | $96,410 |
| Mean Family Income | 26,130 | $118,851 |
| Median Household Income | 41,407 | $76,282 |
| Mean Household Income | 41,407 | $97,662 |
| Income Deficit | 26,130 | $11,470 |
| Wage / Income Gap (%) | 100,316 | 36.28% |
| Wage / Income Gap ($) | 100,316 | 63.72¢ per $1 |
| Gini / Inequality Index | 100,316 | 0.44 |
Earnings by Sex in Laramie County
Average Earnings in Laramie County are $43,148, $53,311 for men and $33,971 for women, a difference of 36.3%.
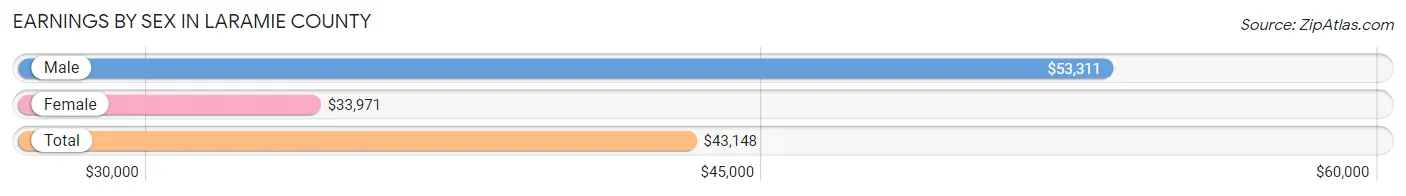
| Sex | Number | Average Earnings |
| Male | 30,591 (54.6%) | $53,311 |
| Female | 25,468 (45.4%) | $33,971 |
| Total | 56,059 (100.0%) | $43,148 |
Earnings by Sex by Income Bracket in Laramie County
The most common earnings brackets in Laramie County are $100,000+ for men (4,625 | 15.1%) and $30,000 to $34,999 for women (2,317 | 9.1%).
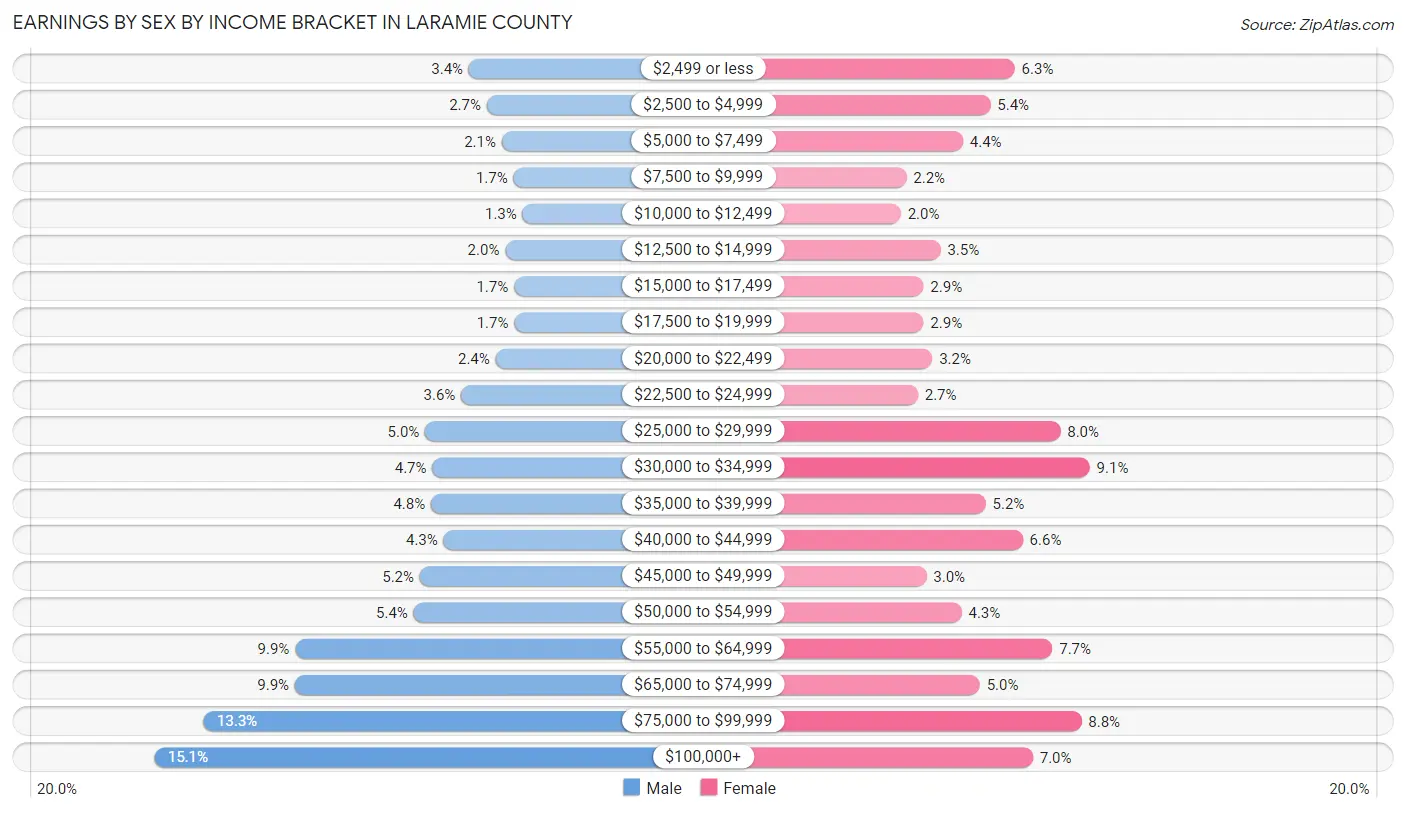
| Income | Male | Female |
| $2,499 or less | 1,026 (3.4%) | 1,603 (6.3%) |
| $2,500 to $4,999 | 820 (2.7%) | 1,370 (5.4%) |
| $5,000 to $7,499 | 649 (2.1%) | 1,109 (4.3%) |
| $7,500 to $9,999 | 515 (1.7%) | 568 (2.2%) |
| $10,000 to $12,499 | 409 (1.3%) | 514 (2.0%) |
| $12,500 to $14,999 | 610 (2.0%) | 895 (3.5%) |
| $15,000 to $17,499 | 509 (1.7%) | 730 (2.9%) |
| $17,500 to $19,999 | 506 (1.7%) | 731 (2.9%) |
| $20,000 to $22,499 | 720 (2.4%) | 815 (3.2%) |
| $22,500 to $24,999 | 1,113 (3.6%) | 677 (2.7%) |
| $25,000 to $29,999 | 1,526 (5.0%) | 2,037 (8.0%) |
| $30,000 to $34,999 | 1,444 (4.7%) | 2,317 (9.1%) |
| $35,000 to $39,999 | 1,459 (4.8%) | 1,325 (5.2%) |
| $40,000 to $44,999 | 1,315 (4.3%) | 1,679 (6.6%) |
| $45,000 to $49,999 | 1,589 (5.2%) | 758 (3.0%) |
| $50,000 to $54,999 | 1,659 (5.4%) | 1,095 (4.3%) |
| $55,000 to $64,999 | 3,017 (9.9%) | 1,962 (7.7%) |
| $65,000 to $74,999 | 3,018 (9.9%) | 1,268 (5.0%) |
| $75,000 to $99,999 | 4,062 (13.3%) | 2,239 (8.8%) |
| $100,000+ | 4,625 (15.1%) | 1,776 (7.0%) |
| Total | 30,591 (100.0%) | 25,468 (100.0%) |
Earnings by Sex by Educational Attainment in Laramie County
Average earnings in Laramie County are $60,121 for men and $39,092 for women, a difference of 35.0%. Men with an educational attainment of graduate degree enjoy the highest average annual earnings of $88,466, while those with less than high school education earn the least with $47,384. Women with an educational attainment of graduate degree earn the most with the average annual earnings of $72,543, while those with less than high school education have the smallest earnings of $23,949.
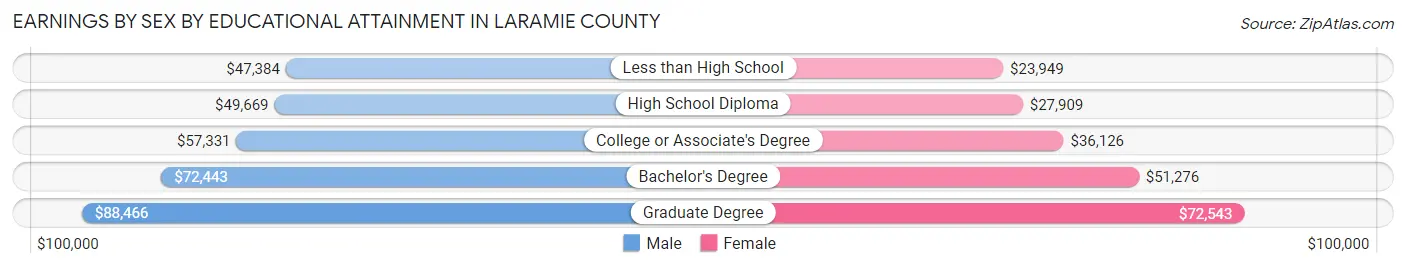
| Educational Attainment | Male Income | Female Income |
| Less than High School | $47,384 | $23,949 |
| High School Diploma | $49,669 | $27,909 |
| College or Associate's Degree | $57,331 | $36,126 |
| Bachelor's Degree | $72,443 | $51,276 |
| Graduate Degree | $88,466 | $72,543 |
| Total | $60,121 | $39,092 |
Family Income in Laramie County
Family Income Brackets in Laramie County
According to the Laramie County family income data, there are 6,167 families falling into the $100,000 to $149,999 income range, which is the most common income bracket and makes up 23.6% of all families. Conversely, the $10,000 to $14,999 income bracket is the least frequent group with only 287 families (1.1%) belonging to this category.
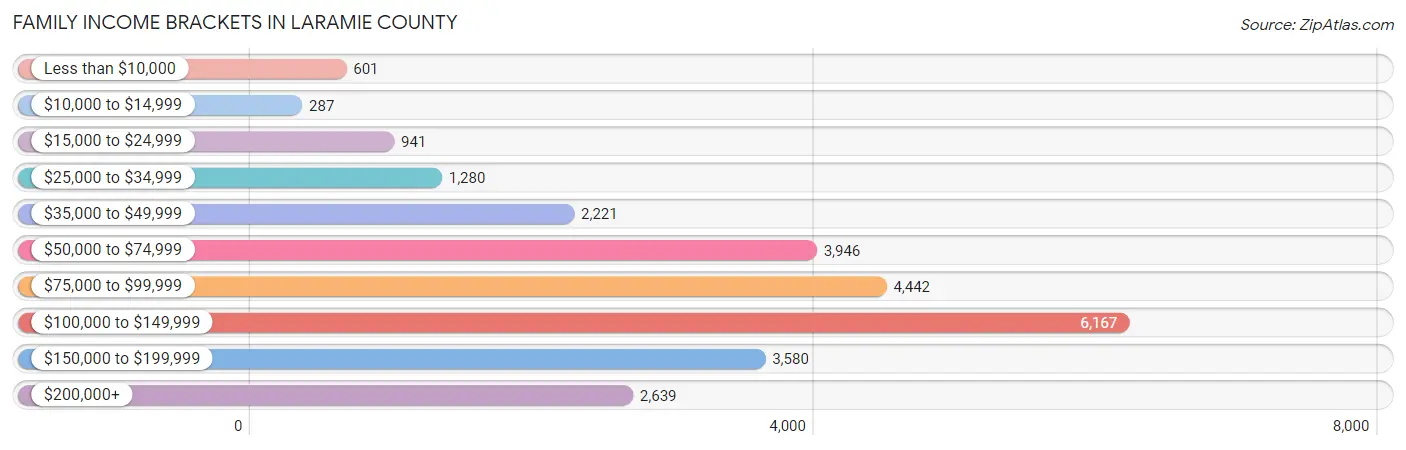
| Income Bracket | # Families | % Families |
| Less than $10,000 | 601 | 2.3% |
| $10,000 to $14,999 | 287 | 1.1% |
| $15,000 to $24,999 | 941 | 3.6% |
| $25,000 to $34,999 | 1,280 | 4.9% |
| $35,000 to $49,999 | 2,221 | 8.5% |
| $50,000 to $74,999 | 3,946 | 15.1% |
| $75,000 to $99,999 | 4,442 | 17.0% |
| $100,000 to $149,999 | 6,167 | 23.6% |
| $150,000 to $199,999 | 3,580 | 13.7% |
| $200,000+ | 2,639 | 10.1% |
Family Income by Famaliy Size in Laramie County
4-person families (4,393 | 16.8%) account for the highest median family income in Laramie County with $130,673 per family, while 2-person families (12,872 | 49.3%) have the highest median income of $43,698 per family member.
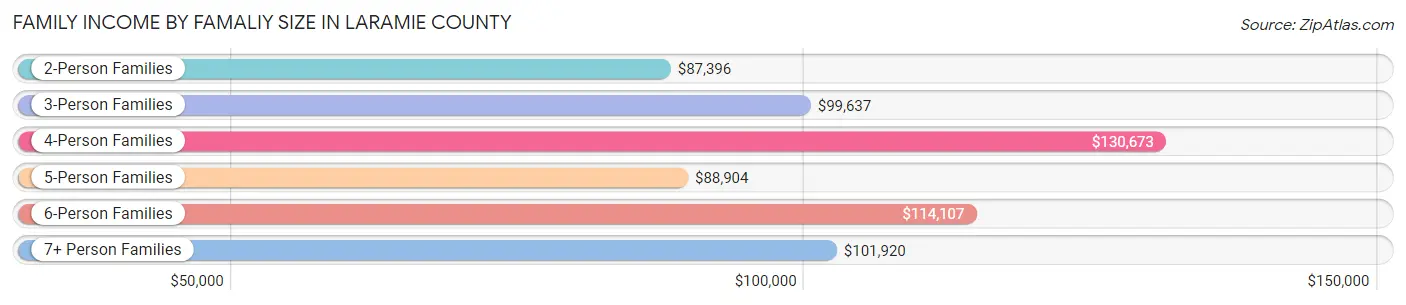
| Income Bracket | # Families | Median Income |
| 2-Person Families | 12,872 (49.3%) | $87,396 |
| 3-Person Families | 6,079 (23.3%) | $99,637 |
| 4-Person Families | 4,393 (16.8%) | $130,673 |
| 5-Person Families | 1,702 (6.5%) | $88,904 |
| 6-Person Families | 573 (2.2%) | $114,107 |
| 7+ Person Families | 511 (2.0%) | $101,920 |
| Total | 26,130 (100.0%) | $96,410 |
Family Income by Number of Earners in Laramie County
The median family income in Laramie County is $96,410, with families comprising 3+ earners (3,002) having the highest median family income of $159,167, while families with no earners (3,773) have the lowest median family income of $64,568, accounting for 11.5% and 14.4% of families, respectively.
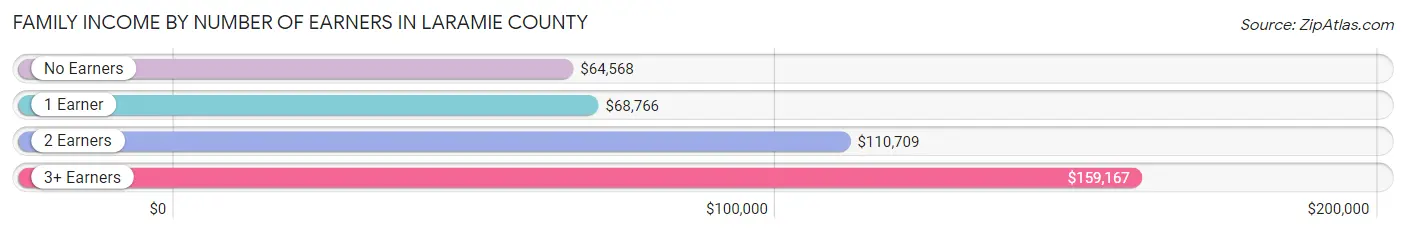
| Number of Earners | # Families | Median Income |
| No Earners | 3,773 (14.4%) | $64,568 |
| 1 Earner | 7,378 (28.2%) | $68,766 |
| 2 Earners | 11,977 (45.8%) | $110,709 |
| 3+ Earners | 3,002 (11.5%) | $159,167 |
| Total | 26,130 (100.0%) | $96,410 |
Household Income in Laramie County
Household Income Brackets in Laramie County
With 7,867 households falling in the category, the $100,000 to $149,999 income range is the most frequent in Laramie County, accounting for 19.0% of all households. In contrast, only 1,366 households (3.3%) fall into the $10,000 to $14,999 income bracket, making it the least populous group.
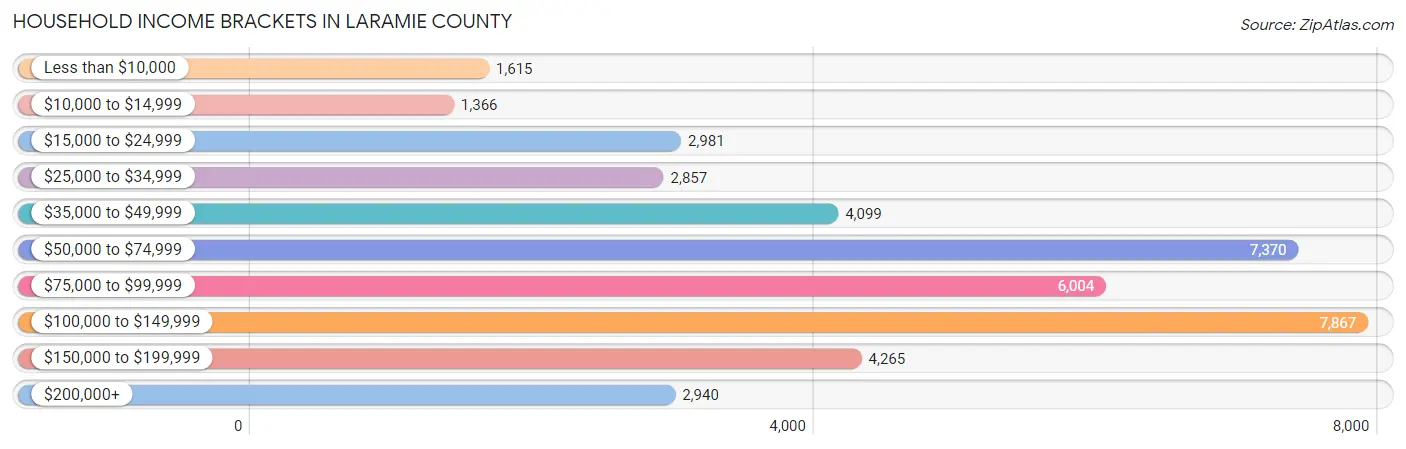
| Income Bracket | # Households | % Households |
| Less than $10,000 | 1,615 | 3.9% |
| $10,000 to $14,999 | 1,366 | 3.3% |
| $15,000 to $24,999 | 2,981 | 7.2% |
| $25,000 to $34,999 | 2,857 | 6.9% |
| $35,000 to $49,999 | 4,099 | 9.9% |
| $50,000 to $74,999 | 7,370 | 17.8% |
| $75,000 to $99,999 | 6,004 | 14.5% |
| $100,000 to $149,999 | 7,867 | 19.0% |
| $150,000 to $199,999 | 4,265 | 10.3% |
| $200,000+ | 2,940 | 7.1% |
Household Income by Householder Age in Laramie County
The median household income in Laramie County is $76,282, with the highest median household income of $88,549 found in the 45 to 64 years age bracket for the primary householder. A total of 14,530 households (35.1%) fall into this category. Meanwhile, the 15 to 24 years age bracket for the primary householder has the lowest median household income of $52,764, with 2,025 households (4.9%) in this group.
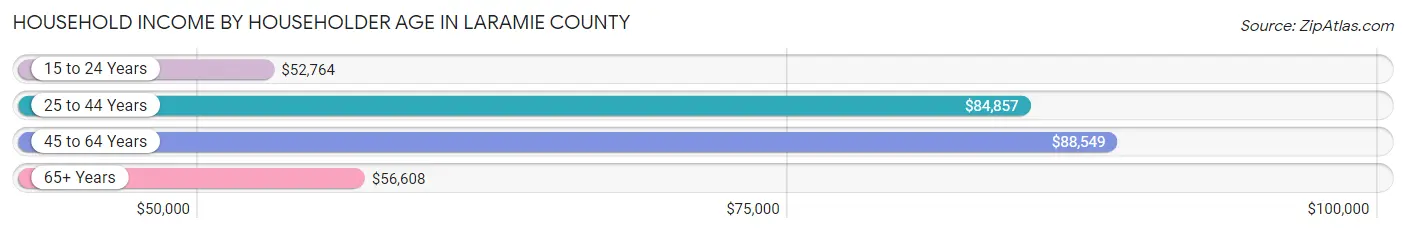
| Income Bracket | # Households | Median Income |
| 15 to 24 Years | 2,025 (4.9%) | $52,764 |
| 25 to 44 Years | 13,909 (33.6%) | $84,857 |
| 45 to 64 Years | 14,530 (35.1%) | $88,549 |
| 65+ Years | 10,943 (26.4%) | $56,608 |
| Total | 41,407 (100.0%) | $76,282 |
Poverty in Laramie County
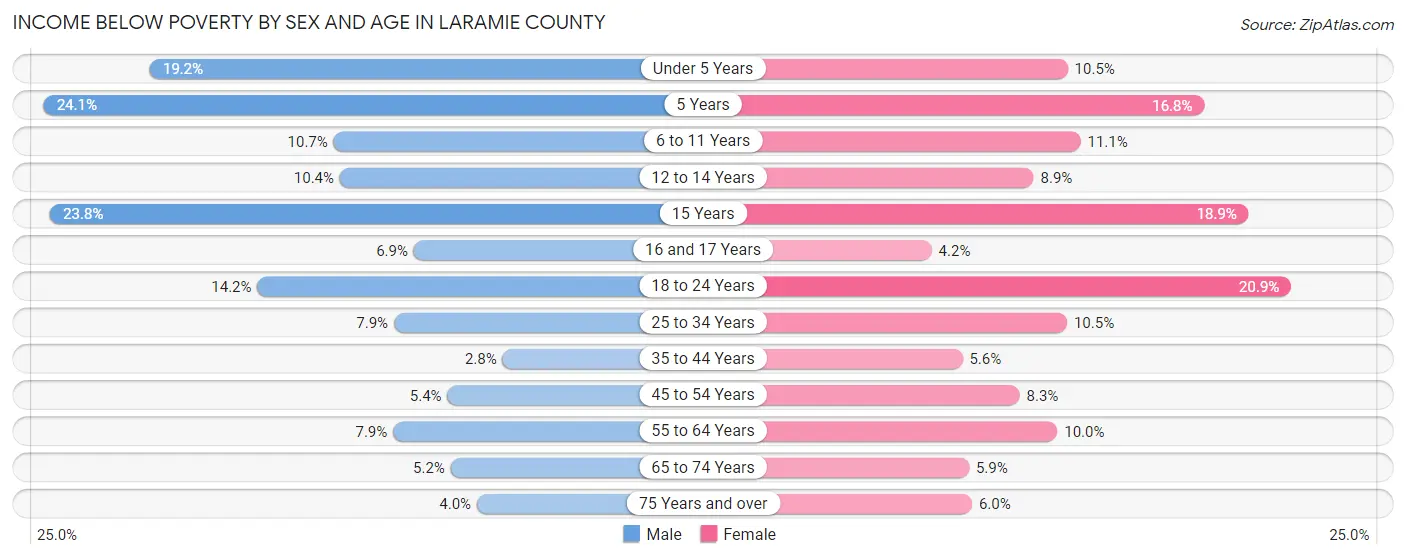
Income Below Poverty by Sex and Age in Laramie County
With 8.3% poverty level for males and 9.6% for females among the residents of Laramie County, 5 year old males and 18 to 24 year old females are the most vulnerable to poverty, with 177 males (24.1%) and 825 females (20.8%) in their respective age groups living below the poverty level.
| Age Bracket | Male | Female |
| Under 5 Years | 556 (19.2%) | 304 (10.5%) |
| 5 Years | 177 (24.1%) | 91 (16.8%) |
| 6 to 11 Years | 422 (10.7%) | 392 (11.1%) |
| 12 to 14 Years | 195 (10.4%) | 174 (8.9%) |
| 15 Years | 141 (23.8%) | 175 (18.9%) |
| 16 and 17 Years | 94 (6.9%) | 46 (4.2%) |
| 18 to 24 Years | 612 (14.2%) | 825 (20.8%) |
| 25 to 34 Years | 580 (7.9%) | 698 (10.4%) |
| 35 to 44 Years | 190 (2.8%) | 346 (5.6%) |
| 45 to 54 Years | 325 (5.4%) | 457 (8.3%) |
| 55 to 64 Years | 509 (7.9%) | 644 (10.0%) |
| 65 to 74 Years | 256 (5.2%) | 303 (5.9%) |
| 75 Years and over | 109 (4.0%) | 210 (6.0%) |
| Total | 4,166 (8.3%) | 4,665 (9.6%) |
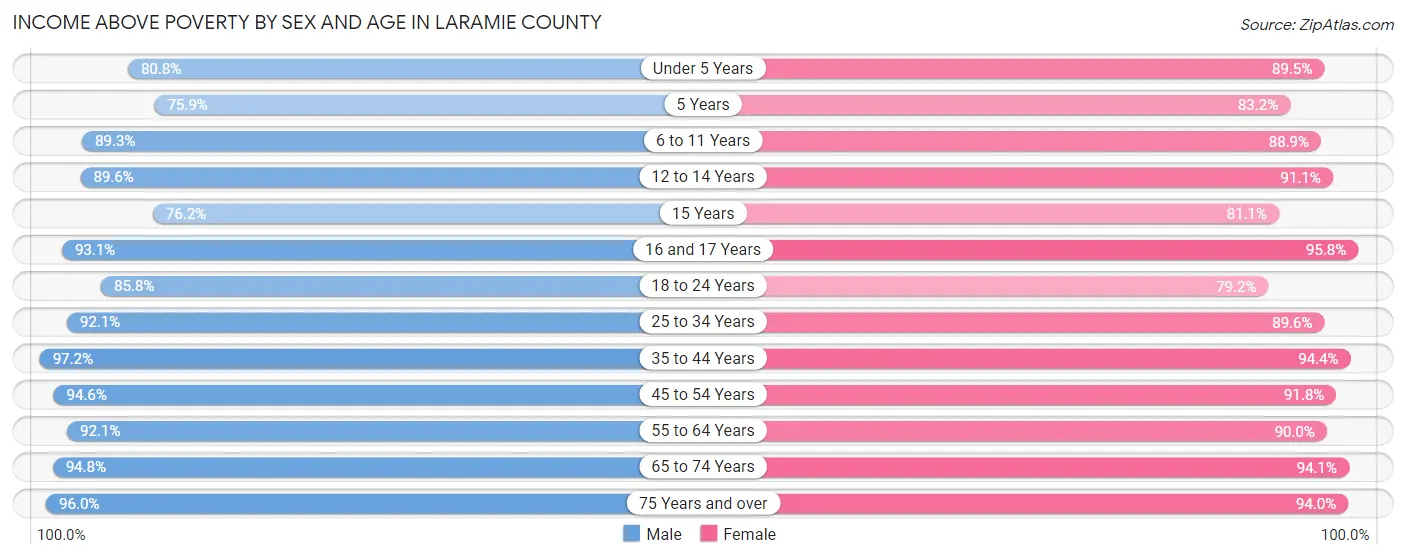
Income Above Poverty by Sex and Age in Laramie County
According to the poverty statistics in Laramie County, males aged 35 to 44 years and females aged 16 and 17 years are the age groups that are most secure financially, with 97.2% of males and 95.8% of females in these age groups living above the poverty line.
| Age Bracket | Male | Female |
| Under 5 Years | 2,342 (80.8%) | 2,597 (89.5%) |
| 5 Years | 557 (75.9%) | 450 (83.2%) |
| 6 to 11 Years | 3,538 (89.3%) | 3,145 (88.9%) |
| 12 to 14 Years | 1,685 (89.6%) | 1,782 (91.1%) |
| 15 Years | 451 (76.2%) | 752 (81.1%) |
| 16 and 17 Years | 1,261 (93.1%) | 1,057 (95.8%) |
| 18 to 24 Years | 3,699 (85.8%) | 3,131 (79.1%) |
| 25 to 34 Years | 6,798 (92.1%) | 5,984 (89.5%) |
| 35 to 44 Years | 6,555 (97.2%) | 5,829 (94.4%) |
| 45 to 54 Years | 5,721 (94.6%) | 5,085 (91.7%) |
| 55 to 64 Years | 5,936 (92.1%) | 5,799 (90.0%) |
| 65 to 74 Years | 4,637 (94.8%) | 4,836 (94.1%) |
| 75 Years and over | 2,612 (96.0%) | 3,266 (94.0%) |
| Total | 45,792 (91.7%) | 43,713 (90.4%) |
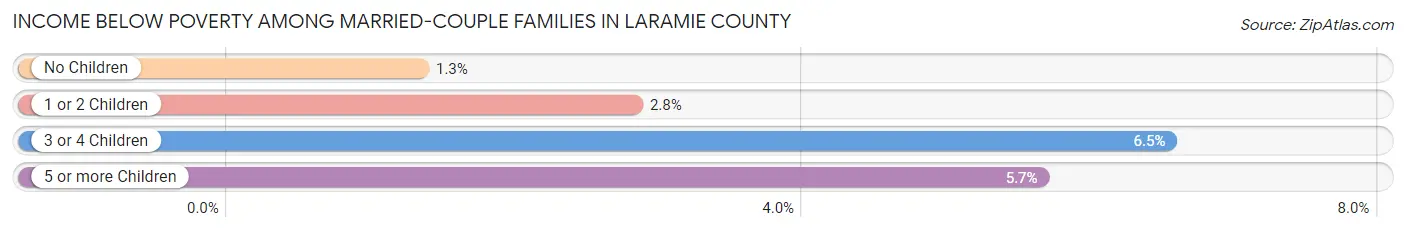
Income Below Poverty Among Married-Couple Families in Laramie County
The poverty statistics for married-couple families in Laramie County show that 2.3% or 472 of the total 20,667 families live below the poverty line. Families with 3 or 4 children have the highest poverty rate of 6.5%, comprising of 104 families. On the other hand, families with no children have the lowest poverty rate of 1.3%, which includes 159 families.
| Children | Above Poverty | Below Poverty |
| No Children | 11,840 (98.7%) | 159 (1.3%) |
| 1 or 2 Children | 6,553 (97.2%) | 190 (2.8%) |
| 3 or 4 Children | 1,485 (93.5%) | 104 (6.5%) |
| 5 or more Children | 317 (94.4%) | 19 (5.7%) |
| Total | 20,195 (97.7%) | 472 (2.3%) |
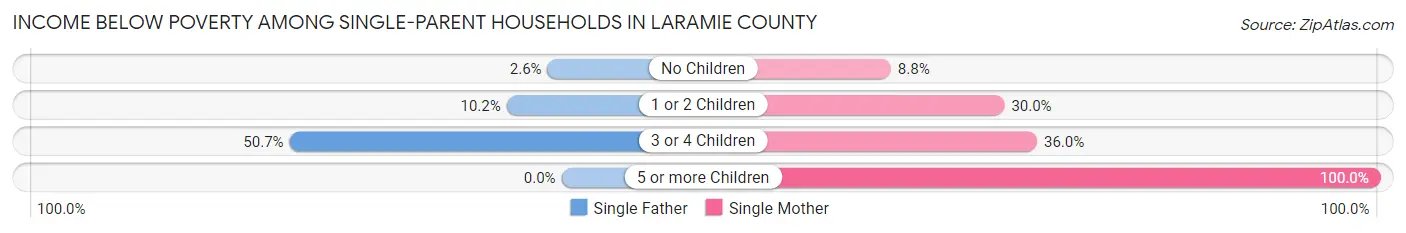
Income Below Poverty Among Single-Parent Households in Laramie County
According to the poverty data in Laramie County, 9.1% or 161 single-father households and 23.7% or 877 single-mother households are living below the poverty line. Among single-father households, those with 3 or 4 children have the highest poverty rate, with 37 households (50.7%) experiencing poverty. Likewise, among single-mother households, those with 5 or more children have the highest poverty rate, with 2 households (100.0%) falling below the poverty line.
| Children | Single Father | Single Mother |
| No Children | 17 (2.6%) | 102 (8.8%) |
| 1 or 2 Children | 107 (10.2%) | 688 (29.9%) |
| 3 or 4 Children | 37 (50.7%) | 85 (36.0%) |
| 5 or more Children | 0 (0.0%) | 2 (100.0%) |
| Total | 161 (9.1%) | 877 (23.7%) |
Income Below Poverty Among Married-Couple vs Single-Parent Households in Laramie County
The poverty data for Laramie County shows that 472 of the married-couple family households (2.3%) and 1,038 of the single-parent households (19.0%) are living below the poverty level. Within the married-couple family households, those with 3 or 4 children have the highest poverty rate, with 104 households (6.5%) falling below the poverty line. Among the single-parent households, those with 5 or more children have the highest poverty rate, with 2 household (100.0%) living below poverty.
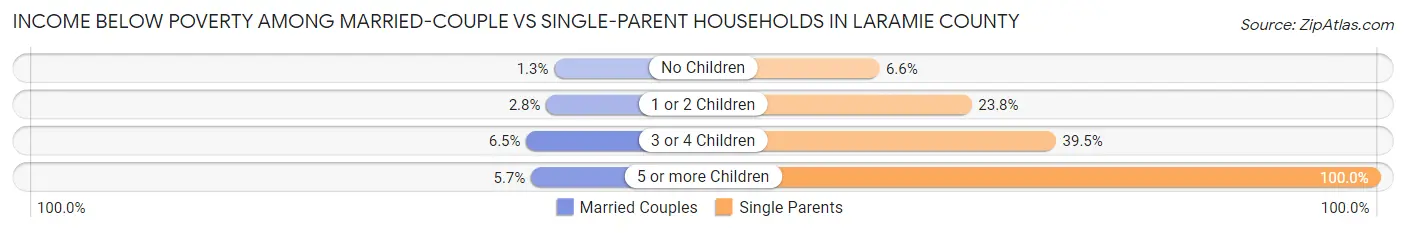
| Children | Married-Couple Families | Single-Parent Households |
| No Children | 159 (1.3%) | 119 (6.6%) |
| 1 or 2 Children | 190 (2.8%) | 795 (23.8%) |
| 3 or 4 Children | 104 (6.5%) | 122 (39.5%) |
| 5 or more Children | 19 (5.7%) | 2 (100.0%) |
| Total | 472 (2.3%) | 1,038 (19.0%) |
Employment Characteristics in Laramie County
Employment by Class of Employer in Laramie County
Among the 50,613 employed individuals in Laramie County, private company employees (27,183 | 53.7%), federal government employees (5,992 | 11.8%), and local government employees (4,851 | 9.6%) make up the most common classes of employment.
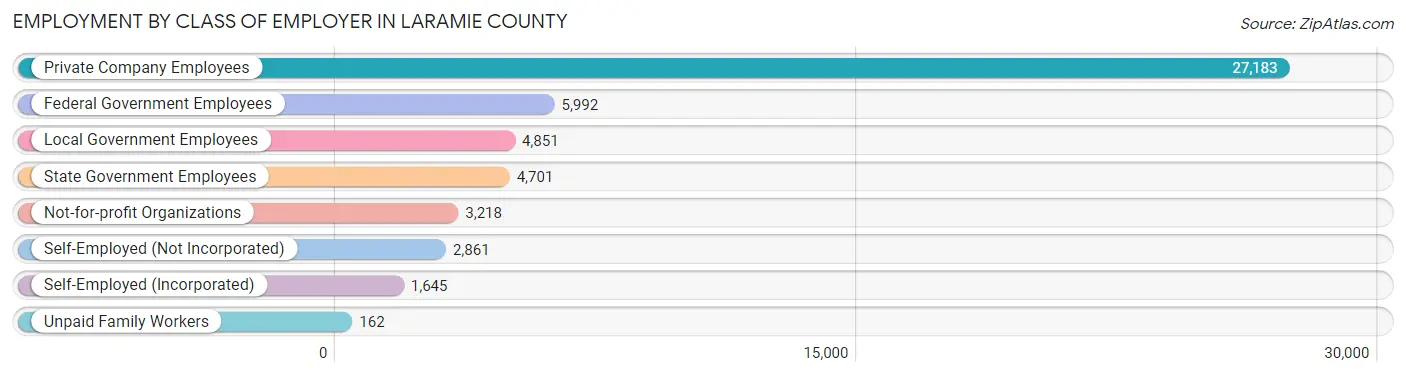
| Employer Class | # Employees | % Employees |
| Private Company Employees | 27,183 | 53.7% |
| Self-Employed (Incorporated) | 1,645 | 3.3% |
| Self-Employed (Not Incorporated) | 2,861 | 5.7% |
| Not-for-profit Organizations | 3,218 | 6.4% |
| Local Government Employees | 4,851 | 9.6% |
| State Government Employees | 4,701 | 9.3% |
| Federal Government Employees | 5,992 | 11.8% |
| Unpaid Family Workers | 162 | 0.3% |
| Total | 50,613 | 100.0% |
Employment Status by Age in Laramie County
According to the labor force statistics for Laramie County, out of the total population over 16 years of age (79,901), 66.9% or 53,454 individuals are in the labor force, with 3.5% or 1,871 of them unemployed. The age group with the highest labor force participation rate is 35 to 44 years, with 88.7% or 11,519 individuals in the labor force. Within the labor force, the 16 to 19 years age range has the highest percentage of unemployed individuals, with 13.4% or 337 of them being unemployed.
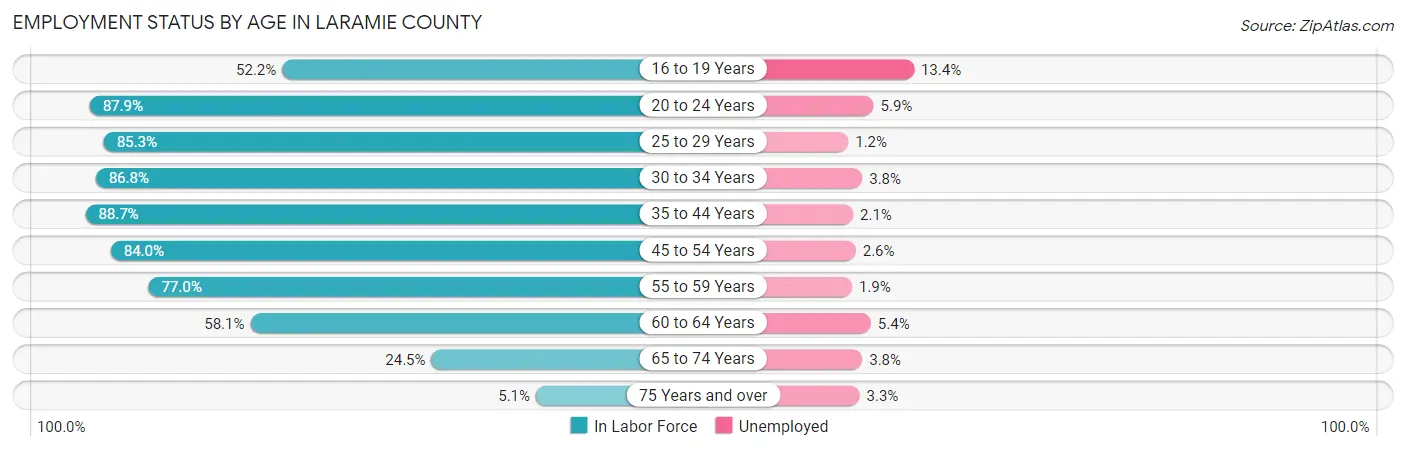
| Age Bracket | In Labor Force | Unemployed |
| 16 to 19 Years | 2,512 (52.2%) | 337 (13.4%) |
| 20 to 24 Years | 5,871 (87.9%) | 346 (5.9%) |
| 25 to 29 Years | 6,006 (85.3%) | 72 (1.2%) |
| 30 to 34 Years | 6,224 (86.8%) | 237 (3.8%) |
| 35 to 44 Years | 11,519 (88.7%) | 242 (2.1%) |
| 45 to 54 Years | 9,778 (84.0%) | 254 (2.6%) |
| 55 to 59 Years | 4,931 (77.0%) | 94 (1.9%) |
| 60 to 64 Years | 3,797 (58.1%) | 205 (5.4%) |
| 65 to 74 Years | 2,487 (24.5%) | 95 (3.8%) |
| 75 Years and over | 330 (5.1%) | 11 (3.3%) |
| Total | 53,454 (66.9%) | 1,871 (3.5%) |
Employment Status by Educational Attainment in Laramie County
According to labor force statistics for Laramie County, 81.6% of individuals (42,252) out of the total population between 25 and 64 years of age (51,779) are in the labor force, with 2.6% or 1,099 of them being unemployed. The group with the highest labor force participation rate are those with the educational attainment of bachelor's degree or higher, with 86.2% or 13,869 individuals in the labor force. Within the labor force, individuals with less than high school education have the highest percentage of unemployment, with 4.5% or 76 of them being unemployed.
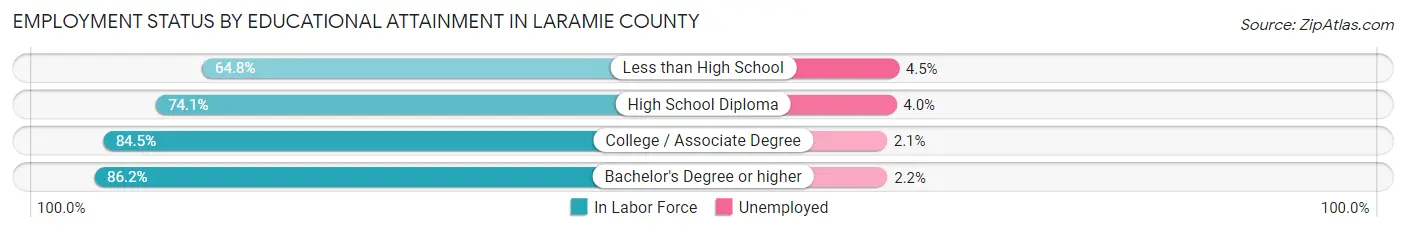
| Educational Attainment | In Labor Force | Unemployed |
| Less than High School | 1,696 (64.8%) | 118 (4.5%) |
| High School Diploma | 8,910 (74.1%) | 481 (4.0%) |
| College / Associate Degree | 17,786 (84.5%) | 442 (2.1%) |
| Bachelor's Degree or higher | 13,869 (86.2%) | 354 (2.2%) |
| Total | 42,252 (81.6%) | 1,346 (2.6%) |
Employment Occupations by Sex in Laramie County
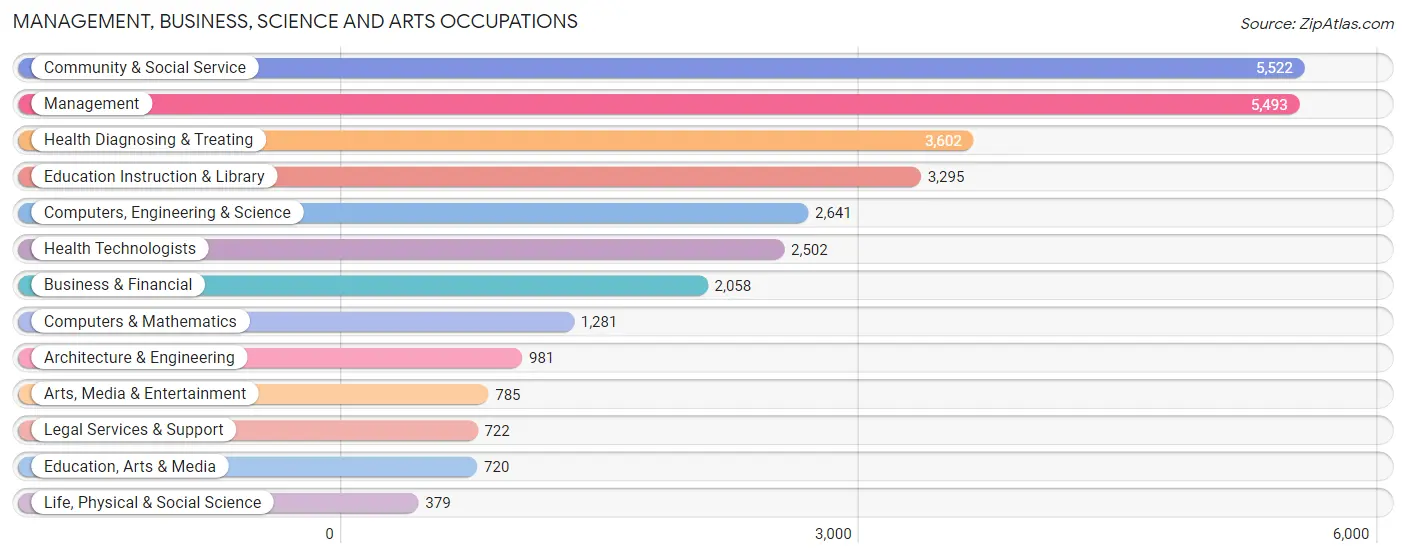
Management, Business, Science and Arts Occupations
The most common Management, Business, Science and Arts occupations in Laramie County are Community & Social Service (5,522 | 11.3%), Management (5,493 | 11.2%), Health Diagnosing & Treating (3,602 | 7.4%), Education Instruction & Library (3,295 | 6.7%), and Computers, Engineering & Science (2,641 | 5.4%).
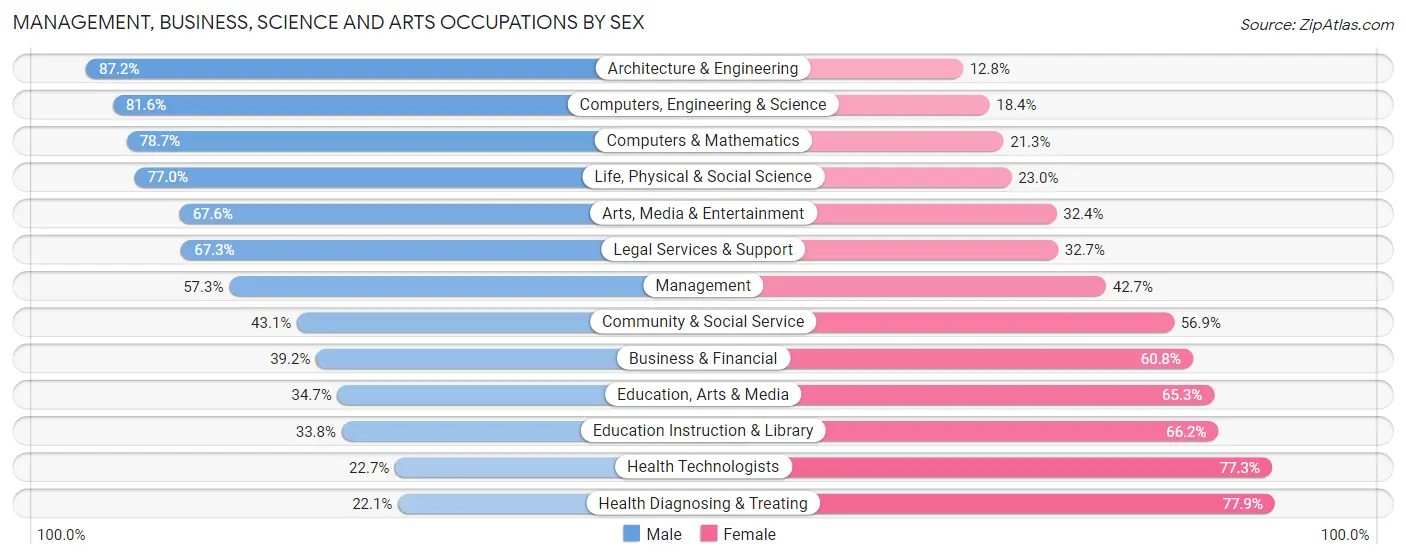
Management, Business, Science and Arts Occupations by Sex
Within the Management, Business, Science and Arts occupations in Laramie County, the most male-oriented occupations are Architecture & Engineering (87.2%), Computers, Engineering & Science (81.6%), and Computers & Mathematics (78.7%), while the most female-oriented occupations are Health Diagnosing & Treating (77.9%), Health Technologists (77.3%), and Education Instruction & Library (66.2%).
| Occupation | Male | Female |
| Management | 3,148 (57.3%) | 2,345 (42.7%) |
| Business & Financial | 806 (39.2%) | 1,252 (60.8%) |
| Computers, Engineering & Science | 2,155 (81.6%) | 486 (18.4%) |
| Computers & Mathematics | 1,008 (78.7%) | 273 (21.3%) |
| Architecture & Engineering | 855 (87.2%) | 126 (12.8%) |
| Life, Physical & Social Science | 292 (77.0%) | 87 (23.0%) |
| Community & Social Service | 2,382 (43.1%) | 3,140 (56.9%) |
| Education, Arts & Media | 250 (34.7%) | 470 (65.3%) |
| Legal Services & Support | 486 (67.3%) | 236 (32.7%) |
| Education Instruction & Library | 1,115 (33.8%) | 2,180 (66.2%) |
| Arts, Media & Entertainment | 531 (67.6%) | 254 (32.4%) |
| Health Diagnosing & Treating | 795 (22.1%) | 2,807 (77.9%) |
| Health Technologists | 568 (22.7%) | 1,934 (77.3%) |
| Total (Category) | 9,286 (48.1%) | 10,030 (51.9%) |
| Total (Overall) | 25,977 (53.2%) | 22,877 (46.8%) |
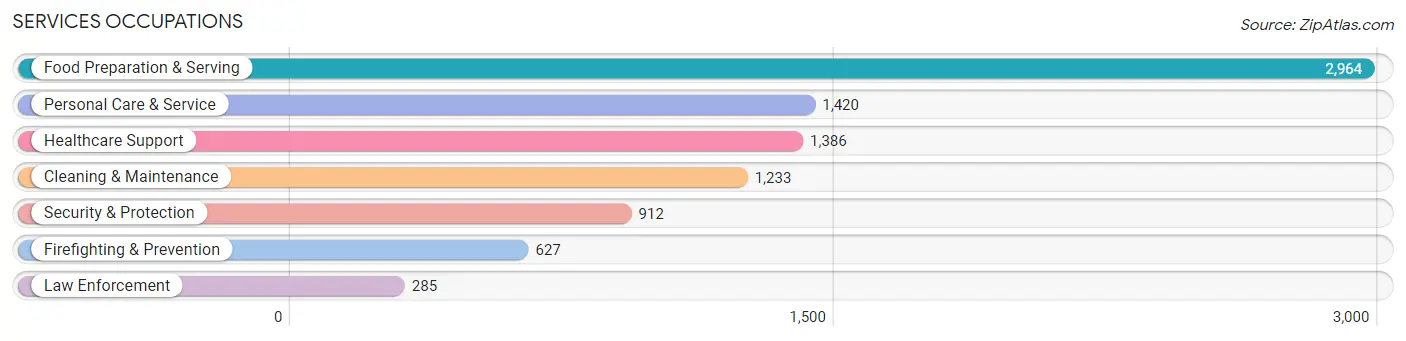
Services Occupations
The most common Services occupations in Laramie County are Food Preparation & Serving (2,964 | 6.1%), Personal Care & Service (1,420 | 2.9%), Healthcare Support (1,386 | 2.8%), Cleaning & Maintenance (1,233 | 2.5%), and Security & Protection (912 | 1.9%).
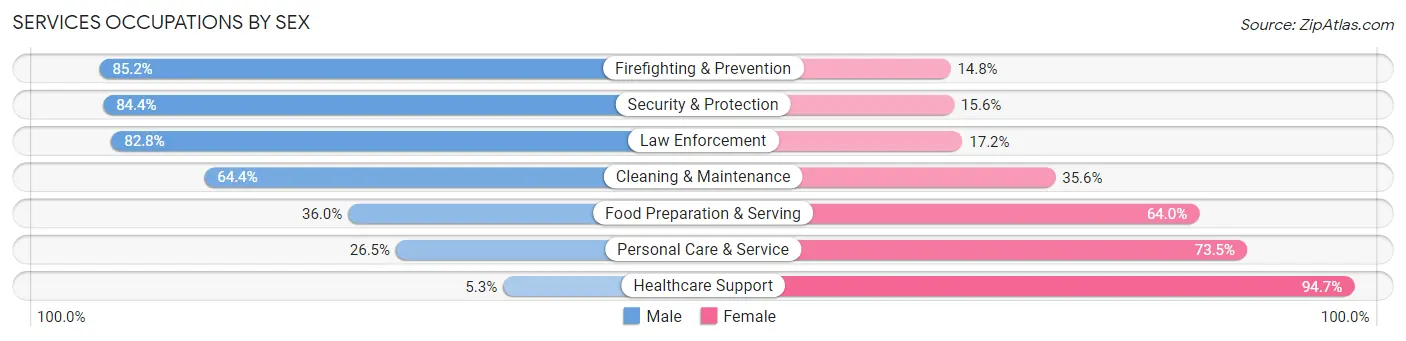
Services Occupations by Sex
Within the Services occupations in Laramie County, the most male-oriented occupations are Firefighting & Prevention (85.2%), Security & Protection (84.4%), and Law Enforcement (82.8%), while the most female-oriented occupations are Healthcare Support (94.7%), Personal Care & Service (73.5%), and Food Preparation & Serving (64.0%).
| Occupation | Male | Female |
| Healthcare Support | 73 (5.3%) | 1,313 (94.7%) |
| Security & Protection | 770 (84.4%) | 142 (15.6%) |
| Firefighting & Prevention | 534 (85.2%) | 93 (14.8%) |
| Law Enforcement | 236 (82.8%) | 49 (17.2%) |
| Food Preparation & Serving | 1,066 (36.0%) | 1,898 (64.0%) |
| Cleaning & Maintenance | 794 (64.4%) | 439 (35.6%) |
| Personal Care & Service | 376 (26.5%) | 1,044 (73.5%) |
| Total (Category) | 3,079 (38.9%) | 4,836 (61.1%) |
| Total (Overall) | 25,977 (53.2%) | 22,877 (46.8%) |
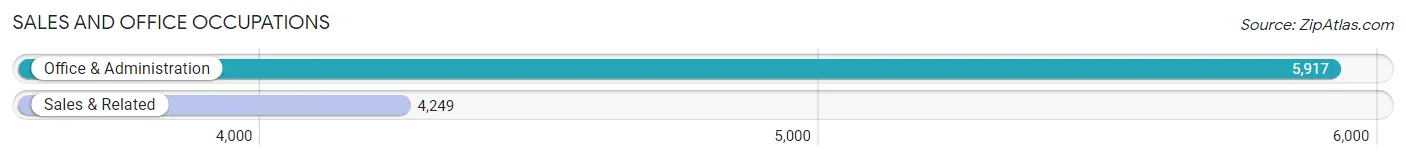
Sales and Office Occupations
The most common Sales and Office occupations in Laramie County are Office & Administration (5,917 | 12.1%), and Sales & Related (4,249 | 8.7%).
Sales and Office Occupations by Sex
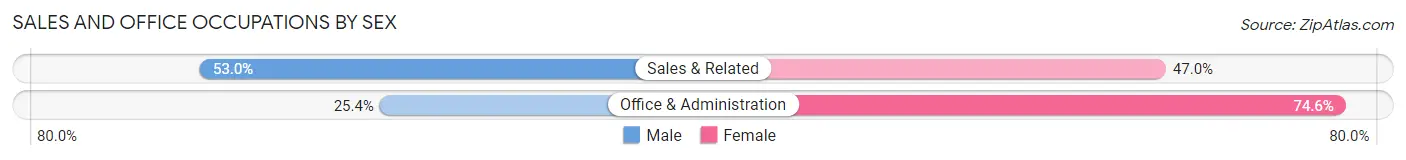
| Occupation | Male | Female |
| Sales & Related | 2,253 (53.0%) | 1,996 (47.0%) |
| Office & Administration | 1,501 (25.4%) | 4,416 (74.6%) |
| Total (Category) | 3,754 (36.9%) | 6,412 (63.1%) |
| Total (Overall) | 25,977 (53.2%) | 22,877 (46.8%) |
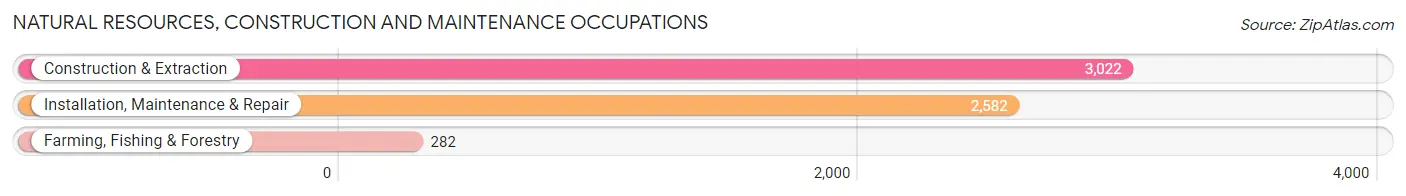
Natural Resources, Construction and Maintenance Occupations
The most common Natural Resources, Construction and Maintenance occupations in Laramie County are Construction & Extraction (3,022 | 6.2%), Installation, Maintenance & Repair (2,582 | 5.3%), and Farming, Fishing & Forestry (282 | 0.6%).
Natural Resources, Construction and Maintenance Occupations by Sex
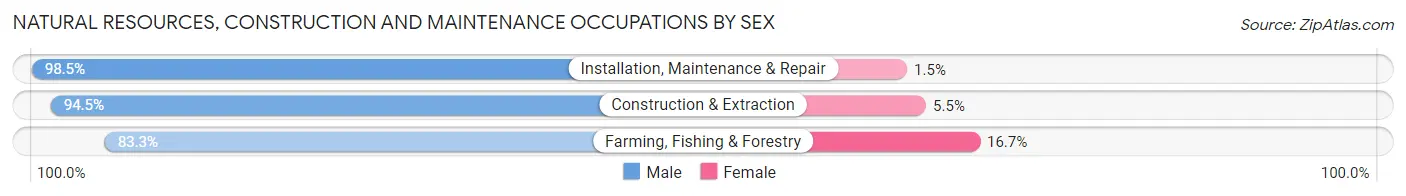
| Occupation | Male | Female |
| Farming, Fishing & Forestry | 235 (83.3%) | 47 (16.7%) |
| Construction & Extraction | 2,857 (94.5%) | 165 (5.5%) |
| Installation, Maintenance & Repair | 2,543 (98.5%) | 39 (1.5%) |
| Total (Category) | 5,635 (95.7%) | 251 (4.3%) |
| Total (Overall) | 25,977 (53.2%) | 22,877 (46.8%) |
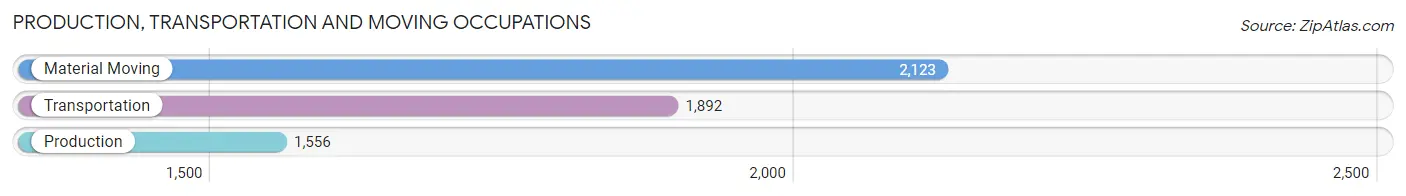
Production, Transportation and Moving Occupations
The most common Production, Transportation and Moving occupations in Laramie County are Material Moving (2,123 | 4.3%), Transportation (1,892 | 3.9%), and Production (1,556 | 3.2%).
Production, Transportation and Moving Occupations by Sex
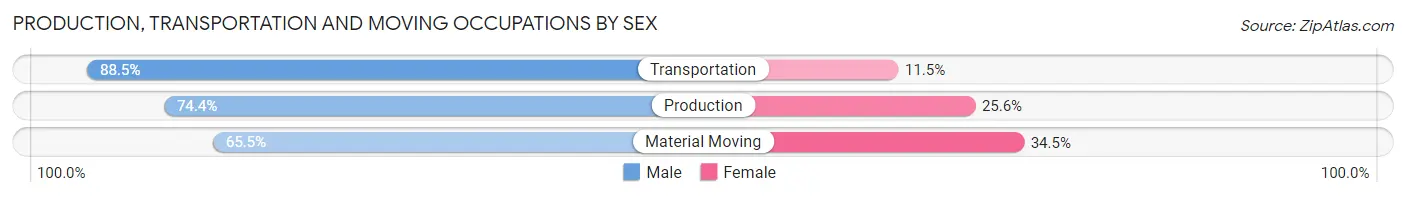
| Occupation | Male | Female |
| Production | 1,158 (74.4%) | 398 (25.6%) |
| Transportation | 1,675 (88.5%) | 217 (11.5%) |
| Material Moving | 1,390 (65.5%) | 733 (34.5%) |
| Total (Category) | 4,223 (75.8%) | 1,348 (24.2%) |
| Total (Overall) | 25,977 (53.2%) | 22,877 (46.8%) |
Employment Industries by Sex in Laramie County
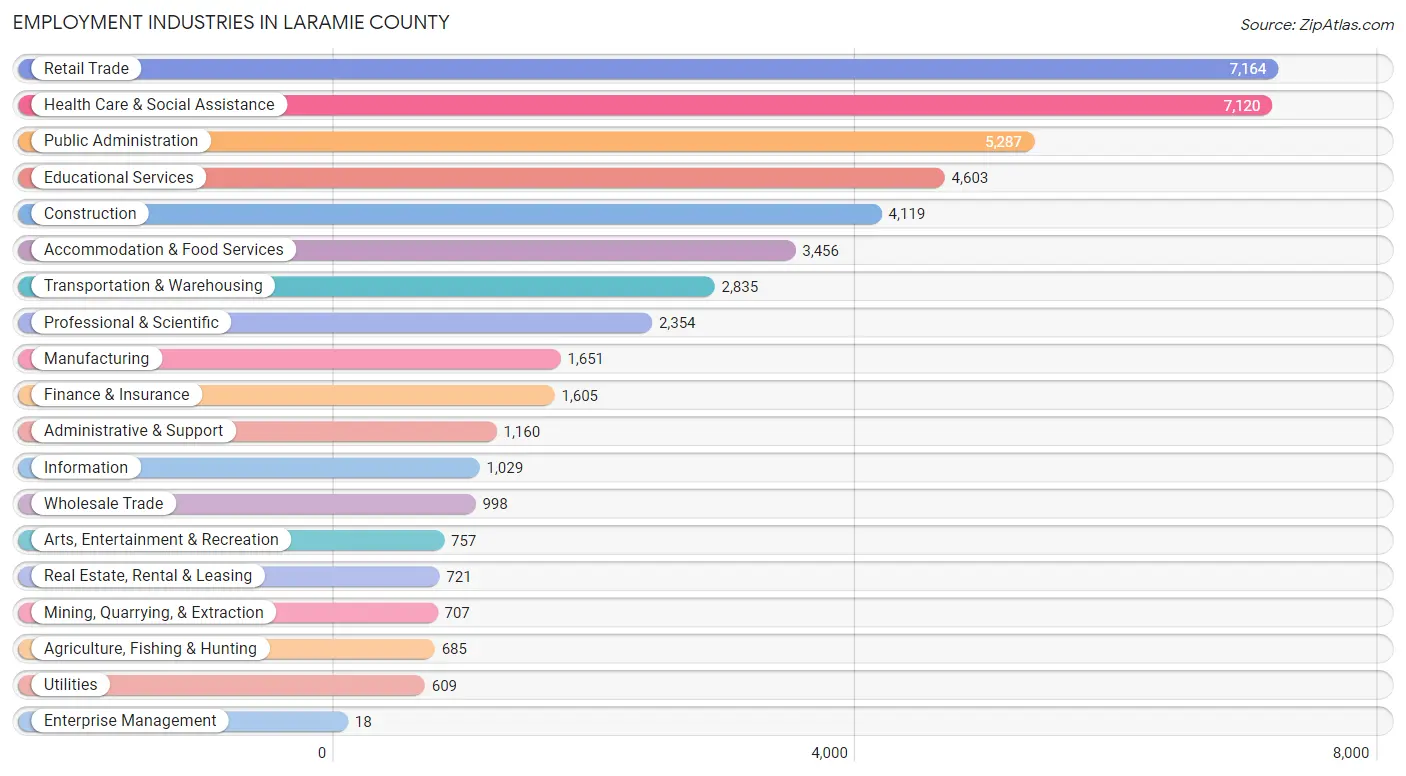
Employment Industries in Laramie County
The major employment industries in Laramie County include Retail Trade (7,164 | 14.7%), Health Care & Social Assistance (7,120 | 14.6%), Public Administration (5,287 | 10.8%), Educational Services (4,603 | 9.4%), and Construction (4,119 | 8.4%).
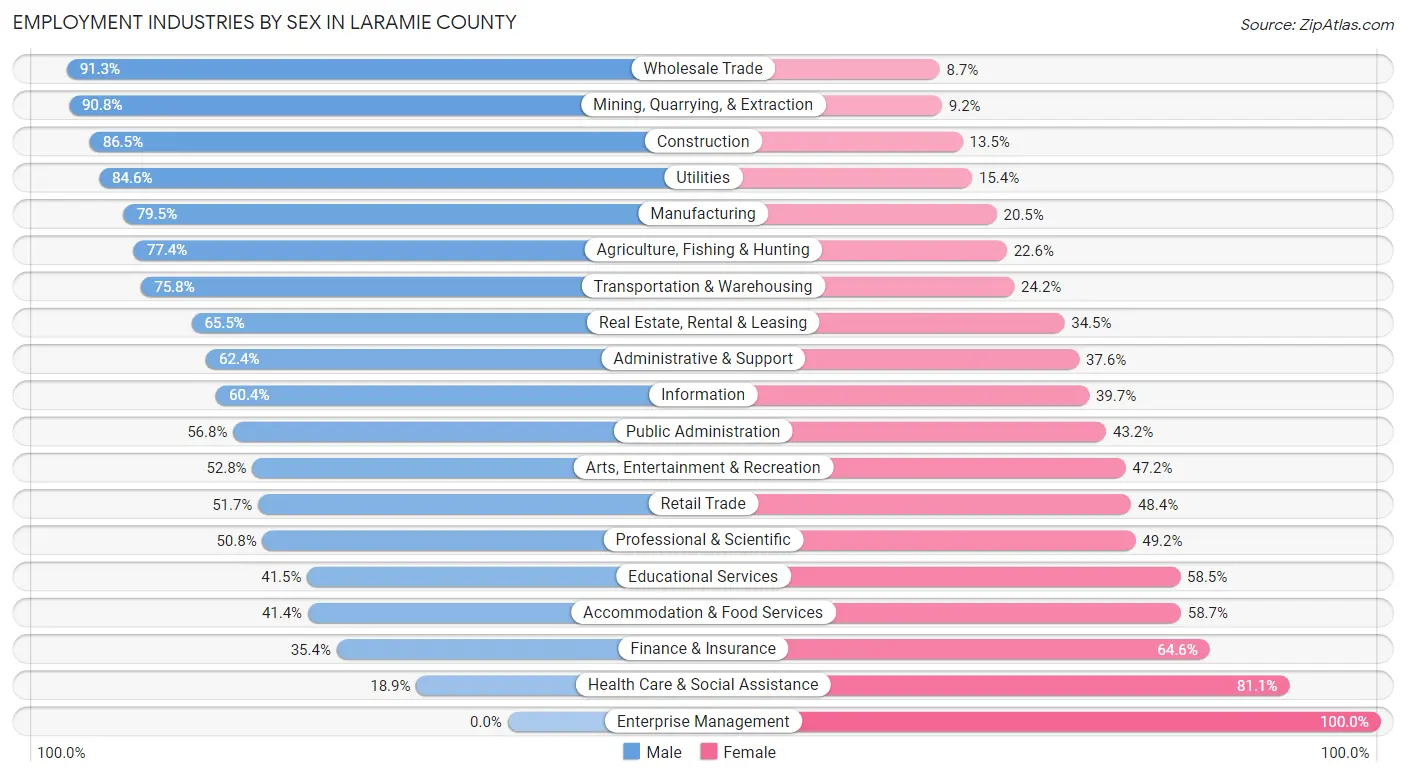
Employment Industries by Sex in Laramie County
The Laramie County industries that see more men than women are Wholesale Trade (91.3%), Mining, Quarrying, & Extraction (90.8%), and Construction (86.5%), whereas the industries that tend to have a higher number of women are Enterprise Management (100.0%), Health Care & Social Assistance (81.1%), and Finance & Insurance (64.6%).
| Industry | Male | Female |
| Agriculture, Fishing & Hunting | 530 (77.4%) | 155 (22.6%) |
| Mining, Quarrying, & Extraction | 642 (90.8%) | 65 (9.2%) |
| Construction | 3,563 (86.5%) | 556 (13.5%) |
| Manufacturing | 1,312 (79.5%) | 339 (20.5%) |
| Wholesale Trade | 911 (91.3%) | 87 (8.7%) |
| Retail Trade | 3,700 (51.6%) | 3,464 (48.3%) |
| Transportation & Warehousing | 2,150 (75.8%) | 685 (24.2%) |
| Utilities | 515 (84.6%) | 94 (15.4%) |
| Information | 621 (60.4%) | 408 (39.7%) |
| Finance & Insurance | 568 (35.4%) | 1,037 (64.6%) |
| Real Estate, Rental & Leasing | 472 (65.5%) | 249 (34.5%) |
| Professional & Scientific | 1,195 (50.8%) | 1,159 (49.2%) |
| Enterprise Management | 0 (0.0%) | 18 (100.0%) |
| Administrative & Support | 724 (62.4%) | 436 (37.6%) |
| Educational Services | 1,910 (41.5%) | 2,693 (58.5%) |
| Health Care & Social Assistance | 1,348 (18.9%) | 5,772 (81.1%) |
| Arts, Entertainment & Recreation | 400 (52.8%) | 357 (47.2%) |
| Accommodation & Food Services | 1,429 (41.3%) | 2,027 (58.7%) |
| Public Administration | 3,004 (56.8%) | 2,283 (43.2%) |
| Total | 25,977 (53.2%) | 22,877 (46.8%) |
Education in Laramie County
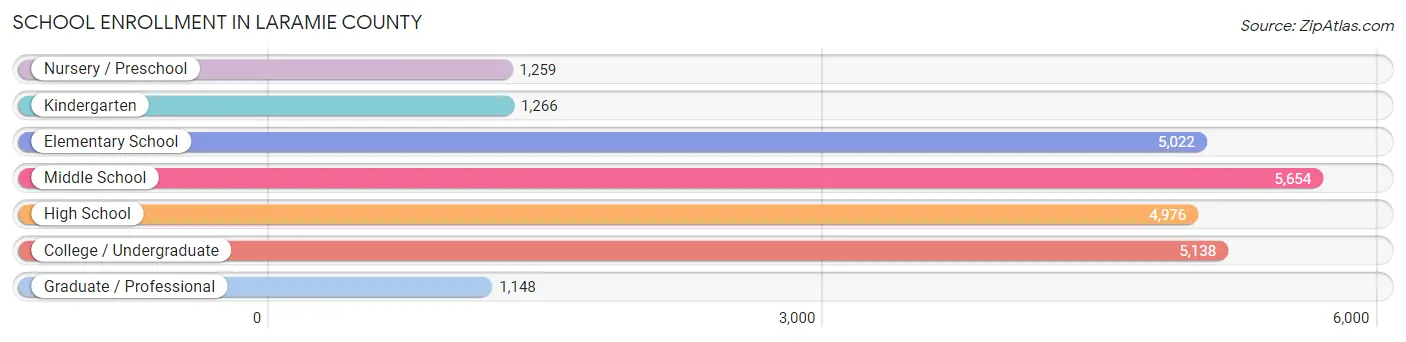
School Enrollment in Laramie County
The most common levels of schooling among the 24,463 students in Laramie County are middle school (5,654 | 23.1%), college / undergraduate (5,138 | 21.0%), and elementary school (5,022 | 20.5%).
| School Level | # Students | % Students |
| Nursery / Preschool | 1,259 | 5.1% |
| Kindergarten | 1,266 | 5.2% |
| Elementary School | 5,022 | 20.5% |
| Middle School | 5,654 | 23.1% |
| High School | 4,976 | 20.3% |
| College / Undergraduate | 5,138 | 21.0% |
| Graduate / Professional | 1,148 | 4.7% |
| Total | 24,463 | 100.0% |
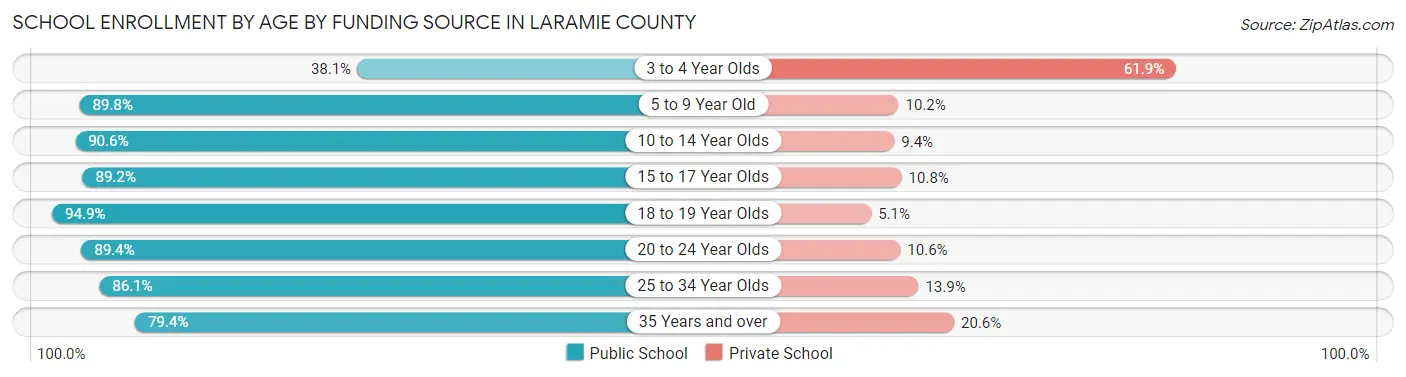
School Enrollment by Age by Funding Source in Laramie County
Out of a total of 24,463 students who are enrolled in schools in Laramie County, 3,107 (12.7%) attend a private institution, while the remaining 21,356 (87.3%) are enrolled in public schools. The age group of 3 to 4 year olds has the highest likelihood of being enrolled in private schools, with 507 (61.9% in the age bracket) enrolled. Conversely, the age group of 18 to 19 year olds has the lowest likelihood of being enrolled in a private school, with 1,422 (94.9% in the age bracket) attending a public institution.
| Age Bracket | Public School | Private School |
| 3 to 4 Year Olds | 312 (38.1%) | 507 (61.9%) |
| 5 to 9 Year Old | 5,467 (89.8%) | 623 (10.2%) |
| 10 to 14 Year Olds | 5,998 (90.6%) | 625 (9.4%) |
| 15 to 17 Year Olds | 3,460 (89.2%) | 419 (10.8%) |
| 18 to 19 Year Olds | 1,422 (94.9%) | 77 (5.1%) |
| 20 to 24 Year Olds | 1,506 (89.4%) | 178 (10.6%) |
| 25 to 34 Year Olds | 1,606 (86.1%) | 260 (13.9%) |
| 35 Years and over | 1,591 (79.4%) | 412 (20.6%) |
| Total | 21,356 (87.3%) | 3,107 (12.7%) |
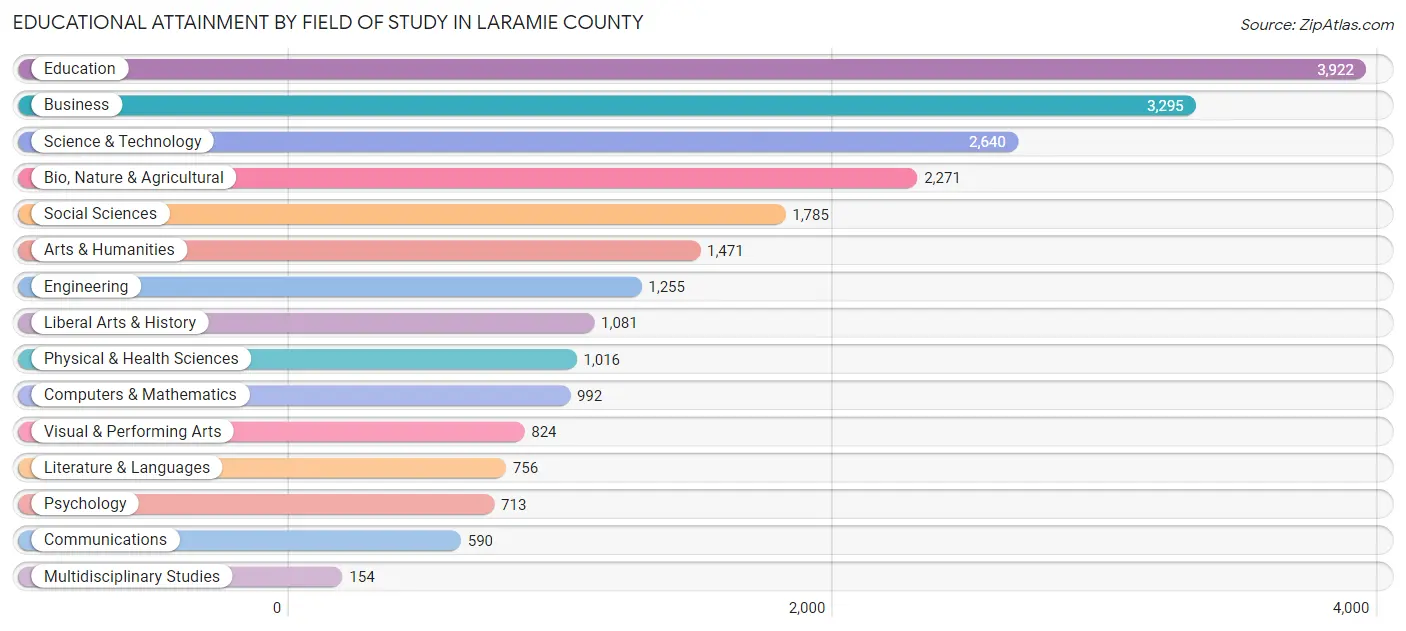
Educational Attainment by Field of Study in Laramie County
Education (3,922 | 17.2%), business (3,295 | 14.5%), science & technology (2,640 | 11.6%), bio, nature & agricultural (2,271 | 10.0%), and social sciences (1,785 | 7.8%) are the most common fields of study among 22,765 individuals in Laramie County who have obtained a bachelor's degree or higher.
| Field of Study | # Graduates | % Graduates |
| Computers & Mathematics | 992 | 4.4% |
| Bio, Nature & Agricultural | 2,271 | 10.0% |
| Physical & Health Sciences | 1,016 | 4.5% |
| Psychology | 713 | 3.1% |
| Social Sciences | 1,785 | 7.8% |
| Engineering | 1,255 | 5.5% |
| Multidisciplinary Studies | 154 | 0.7% |
| Science & Technology | 2,640 | 11.6% |
| Business | 3,295 | 14.5% |
| Education | 3,922 | 17.2% |
| Literature & Languages | 756 | 3.3% |
| Liberal Arts & History | 1,081 | 4.8% |
| Visual & Performing Arts | 824 | 3.6% |
| Communications | 590 | 2.6% |
| Arts & Humanities | 1,471 | 6.5% |
| Total | 22,765 | 100.0% |
Transportation & Commute in Laramie County
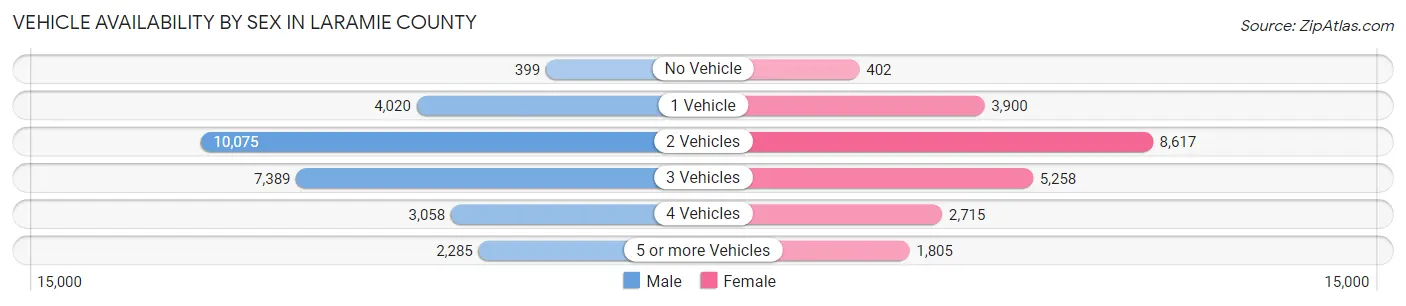
Vehicle Availability by Sex in Laramie County
The most prevalent vehicle ownership categories in Laramie County are males with 2 vehicles (10,075, accounting for 37.0%) and females with 2 vehicles (8,617, making up 44.4%).
| Vehicles Available | Male | Female |
| No Vehicle | 399 (1.5%) | 402 (1.8%) |
| 1 Vehicle | 4,020 (14.8%) | 3,900 (17.2%) |
| 2 Vehicles | 10,075 (37.0%) | 8,617 (38.0%) |
| 3 Vehicles | 7,389 (27.1%) | 5,258 (23.2%) |
| 4 Vehicles | 3,058 (11.2%) | 2,715 (12.0%) |
| 5 or more Vehicles | 2,285 (8.4%) | 1,805 (8.0%) |
| Total | 27,226 (100.0%) | 22,697 (100.0%) |
Commute Time in Laramie County
The most frequently occuring commute durations in Laramie County are 10 to 14 minutes (13,277 commuters, 28.4%), 15 to 19 minutes (12,406 commuters, 26.5%), and 5 to 9 minutes (8,362 commuters, 17.9%).
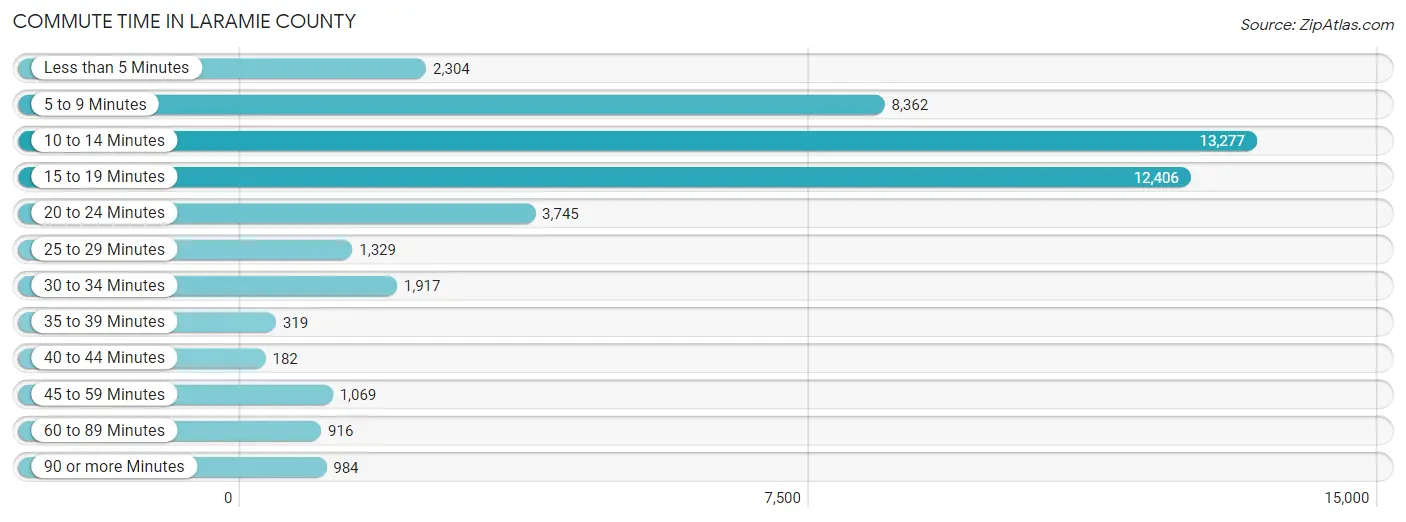
| Commute Time | # Commuters | % Commuters |
| Less than 5 Minutes | 2,304 | 4.9% |
| 5 to 9 Minutes | 8,362 | 17.9% |
| 10 to 14 Minutes | 13,277 | 28.4% |
| 15 to 19 Minutes | 12,406 | 26.5% |
| 20 to 24 Minutes | 3,745 | 8.0% |
| 25 to 29 Minutes | 1,329 | 2.8% |
| 30 to 34 Minutes | 1,917 | 4.1% |
| 35 to 39 Minutes | 319 | 0.7% |
| 40 to 44 Minutes | 182 | 0.4% |
| 45 to 59 Minutes | 1,069 | 2.3% |
| 60 to 89 Minutes | 916 | 2.0% |
| 90 or more Minutes | 984 | 2.1% |
Commute Time by Sex in Laramie County
The most common commute times in Laramie County are 10 to 14 minutes (7,396 commuters, 28.2%) for males and 15 to 19 minutes (5,916 commuters, 28.7%) for females.
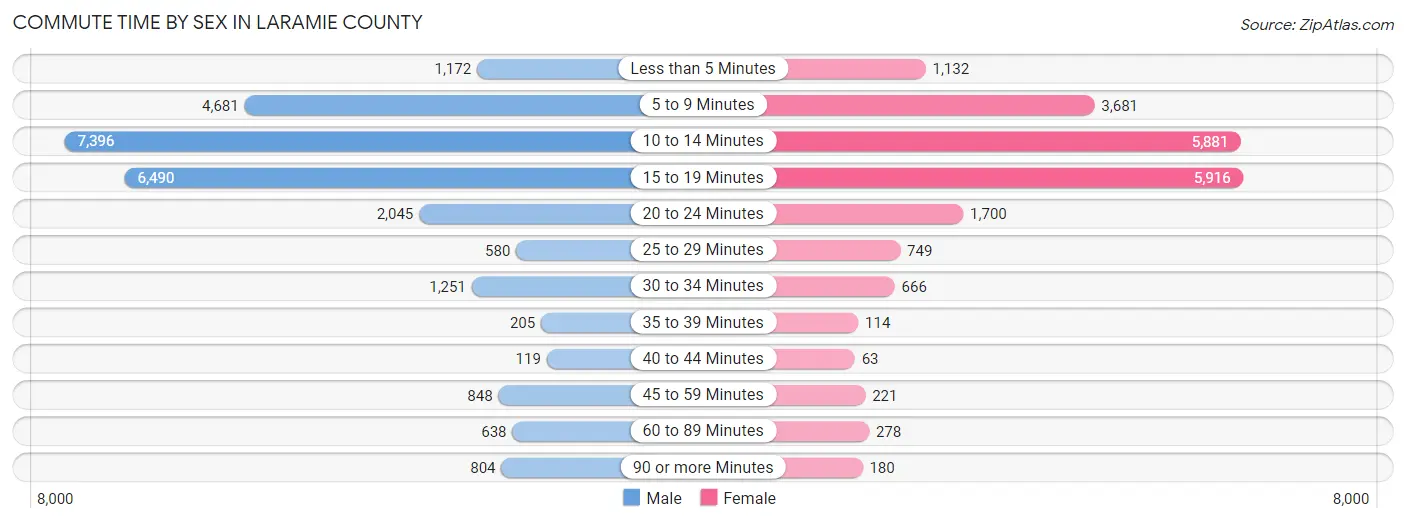
| Commute Time | Male | Female |
| Less than 5 Minutes | 1,172 (4.5%) | 1,132 (5.5%) |
| 5 to 9 Minutes | 4,681 (17.8%) | 3,681 (17.9%) |
| 10 to 14 Minutes | 7,396 (28.2%) | 5,881 (28.6%) |
| 15 to 19 Minutes | 6,490 (24.7%) | 5,916 (28.7%) |
| 20 to 24 Minutes | 2,045 (7.8%) | 1,700 (8.3%) |
| 25 to 29 Minutes | 580 (2.2%) | 749 (3.6%) |
| 30 to 34 Minutes | 1,251 (4.8%) | 666 (3.2%) |
| 35 to 39 Minutes | 205 (0.8%) | 114 (0.5%) |
| 40 to 44 Minutes | 119 (0.4%) | 63 (0.3%) |
| 45 to 59 Minutes | 848 (3.2%) | 221 (1.1%) |
| 60 to 89 Minutes | 638 (2.4%) | 278 (1.3%) |
| 90 or more Minutes | 804 (3.1%) | 180 (0.9%) |
Time of Departure to Work by Sex in Laramie County
The most frequent times of departure to work in Laramie County are 7:00 AM to 7:29 AM (4,000, 15.2%) for males and 7:30 AM to 7:59 AM (4,975, 24.2%) for females.
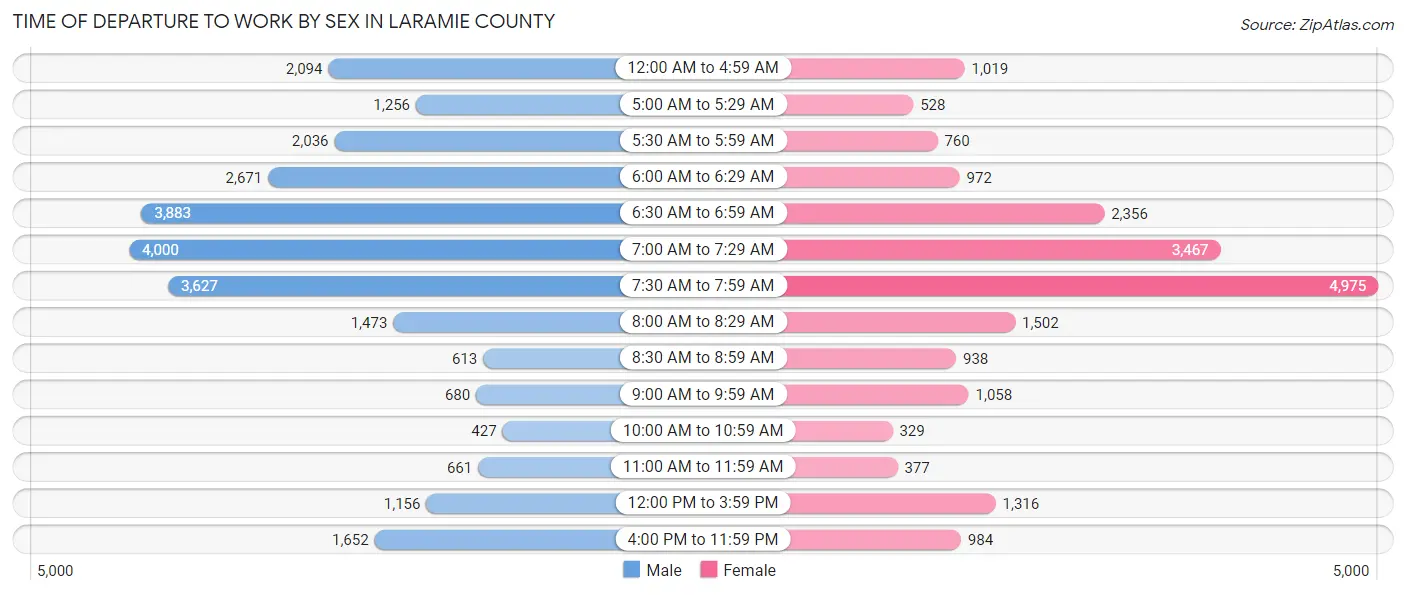
| Time of Departure | Male | Female |
| 12:00 AM to 4:59 AM | 2,094 (8.0%) | 1,019 (5.0%) |
| 5:00 AM to 5:29 AM | 1,256 (4.8%) | 528 (2.6%) |
| 5:30 AM to 5:59 AM | 2,036 (7.8%) | 760 (3.7%) |
| 6:00 AM to 6:29 AM | 2,671 (10.2%) | 972 (4.7%) |
| 6:30 AM to 6:59 AM | 3,883 (14.8%) | 2,356 (11.5%) |
| 7:00 AM to 7:29 AM | 4,000 (15.2%) | 3,467 (16.9%) |
| 7:30 AM to 7:59 AM | 3,627 (13.8%) | 4,975 (24.2%) |
| 8:00 AM to 8:29 AM | 1,473 (5.6%) | 1,502 (7.3%) |
| 8:30 AM to 8:59 AM | 613 (2.3%) | 938 (4.6%) |
| 9:00 AM to 9:59 AM | 680 (2.6%) | 1,058 (5.1%) |
| 10:00 AM to 10:59 AM | 427 (1.6%) | 329 (1.6%) |
| 11:00 AM to 11:59 AM | 661 (2.5%) | 377 (1.8%) |
| 12:00 PM to 3:59 PM | 1,156 (4.4%) | 1,316 (6.4%) |
| 4:00 PM to 11:59 PM | 1,652 (6.3%) | 984 (4.8%) |
| Total | 26,229 (100.0%) | 20,581 (100.0%) |
Housing Occupancy in Laramie County
Occupancy by Ownership in Laramie County
Of the total 41,407 dwellings in Laramie County, owner-occupied units account for 29,892 (72.2%), while renter-occupied units make up 11,515 (27.8%).
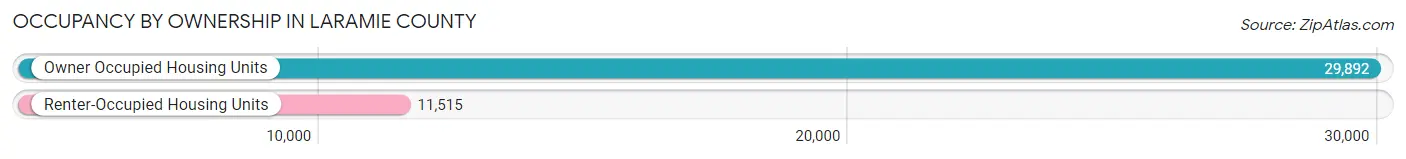
| Occupancy | # Housing Units | % Housing Units |
| Owner Occupied Housing Units | 29,892 | 72.2% |
| Renter-Occupied Housing Units | 11,515 | 27.8% |
| Total Occupied Housing Units | 41,407 | 100.0% |
Occupancy by Household Size in Laramie County
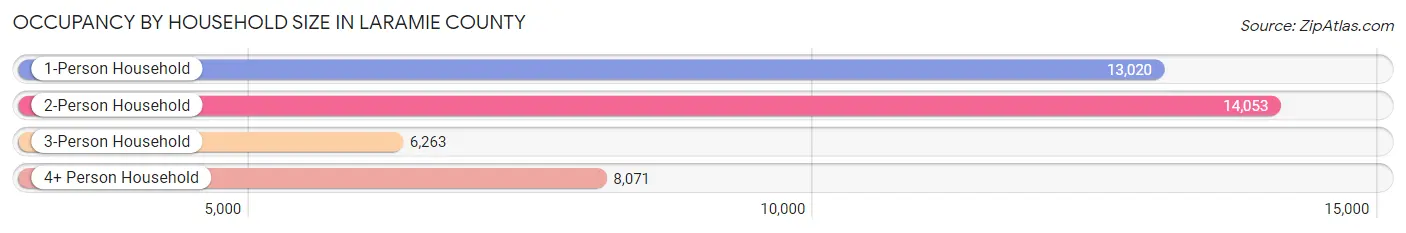
| Household Size | # Housing Units | % Housing Units |
| 1-Person Household | 13,020 | 31.4% |
| 2-Person Household | 14,053 | 33.9% |
| 3-Person Household | 6,263 | 15.1% |
| 4+ Person Household | 8,071 | 19.5% |
| Total Housing Units | 41,407 | 100.0% |
Occupancy by Ownership by Household Size in Laramie County
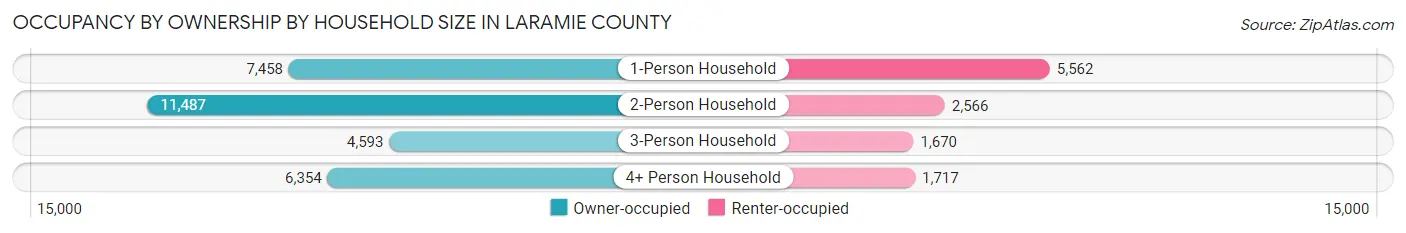
| Household Size | Owner-occupied | Renter-occupied |
| 1-Person Household | 7,458 (57.3%) | 5,562 (42.7%) |
| 2-Person Household | 11,487 (81.7%) | 2,566 (18.3%) |
| 3-Person Household | 4,593 (73.3%) | 1,670 (26.7%) |
| 4+ Person Household | 6,354 (78.7%) | 1,717 (21.3%) |
| Total Housing Units | 29,892 (72.2%) | 11,515 (27.8%) |
Occupancy by Educational Attainment in Laramie County
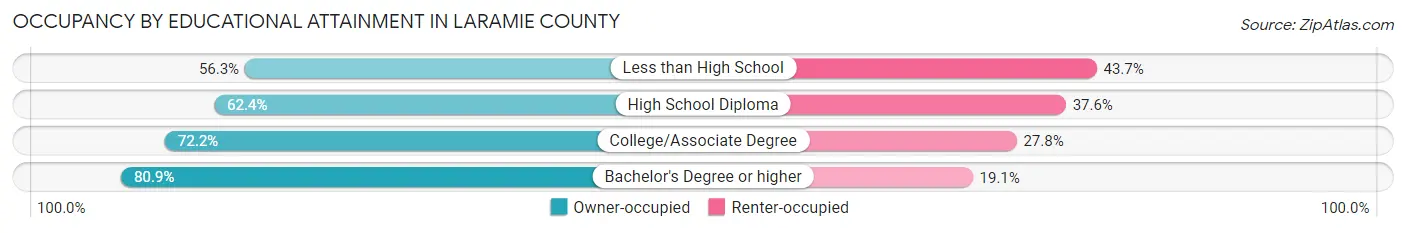
| Household Size | Owner-occupied | Renter-occupied |
| Less than High School | 951 (56.3%) | 738 (43.7%) |
| High School Diploma | 5,562 (62.4%) | 3,349 (37.6%) |
| College/Associate Degree | 12,763 (72.2%) | 4,919 (27.8%) |
| Bachelor's Degree or higher | 10,616 (80.9%) | 2,509 (19.1%) |
Occupancy by Age of Householder in Laramie County
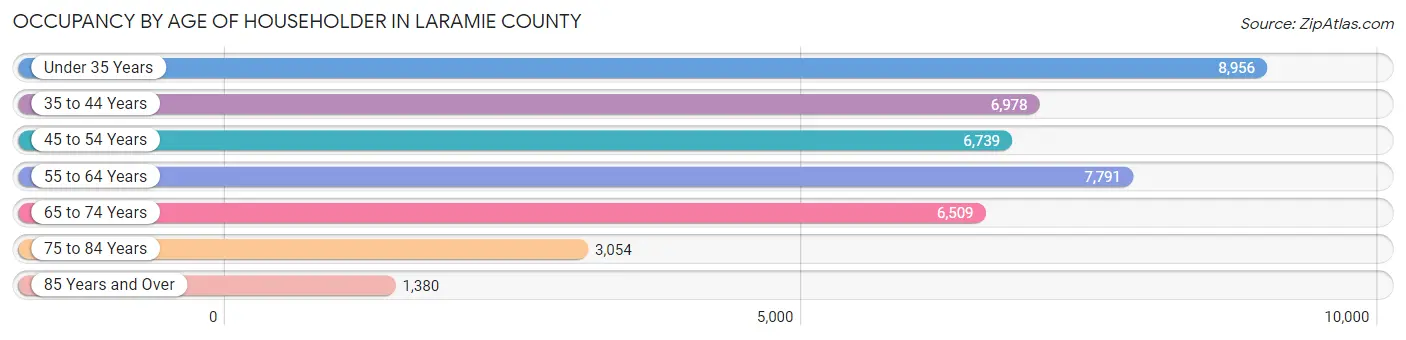
| Age Bracket | # Households | % Households |
| Under 35 Years | 8,956 | 21.6% |
| 35 to 44 Years | 6,978 | 16.9% |
| 45 to 54 Years | 6,739 | 16.3% |
| 55 to 64 Years | 7,791 | 18.8% |
| 65 to 74 Years | 6,509 | 15.7% |
| 75 to 84 Years | 3,054 | 7.4% |
| 85 Years and Over | 1,380 | 3.3% |
| Total | 41,407 | 100.0% |
Housing Finances in Laramie County
Median Income by Occupancy in Laramie County
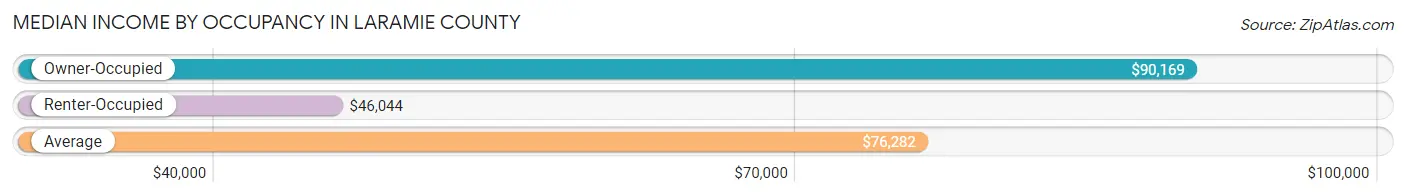
| Occupancy Type | # Households | Median Income |
| Owner-Occupied | 29,892 (72.2%) | $90,169 |
| Renter-Occupied | 11,515 (27.8%) | $46,044 |
| Average | 41,407 (100.0%) | $76,282 |
Occupancy by Householder Income Bracket in Laramie County
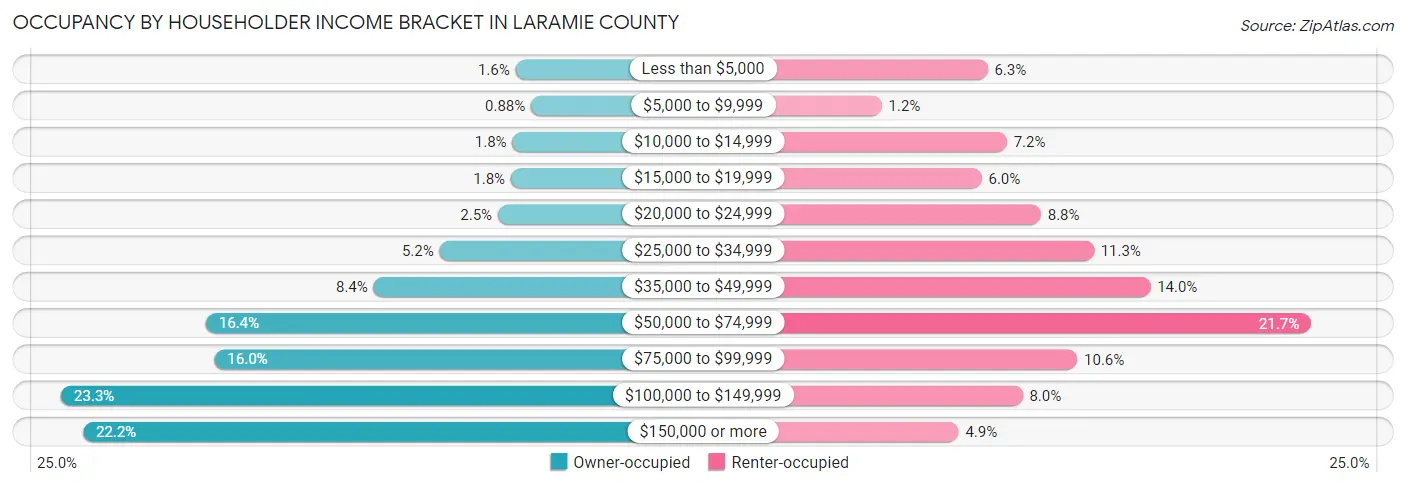
| Income Bracket | Owner-occupied | Renter-occupied |
| Less than $5,000 | 485 (1.6%) | 723 (6.3%) |
| $5,000 to $9,999 | 263 (0.9%) | 143 (1.2%) |
| $10,000 to $14,999 | 529 (1.8%) | 829 (7.2%) |
| $15,000 to $19,999 | 549 (1.8%) | 691 (6.0%) |
| $20,000 to $24,999 | 735 (2.5%) | 1,016 (8.8%) |
| $25,000 to $34,999 | 1,566 (5.2%) | 1,306 (11.3%) |
| $35,000 to $49,999 | 2,504 (8.4%) | 1,615 (14.0%) |
| $50,000 to $74,999 | 4,893 (16.4%) | 2,498 (21.7%) |
| $75,000 to $99,999 | 4,771 (16.0%) | 1,215 (10.5%) |
| $100,000 to $149,999 | 6,955 (23.3%) | 915 (8.0%) |
| $150,000 or more | 6,642 (22.2%) | 564 (4.9%) |
| Total | 29,892 (100.0%) | 11,515 (100.0%) |
Monthly Housing Cost Tiers in Laramie County
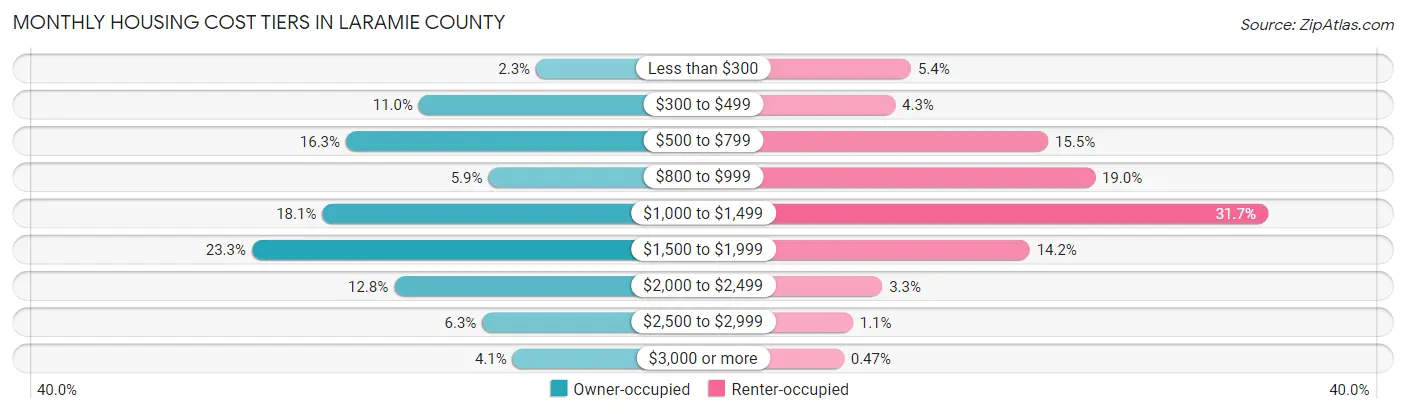
| Monthly Cost | Owner-occupied | Renter-occupied |
| Less than $300 | 700 (2.3%) | 624 (5.4%) |
| $300 to $499 | 3,280 (11.0%) | 489 (4.3%) |
| $500 to $799 | 4,883 (16.3%) | 1,786 (15.5%) |
| $800 to $999 | 1,749 (5.9%) | 2,184 (19.0%) |
| $1,000 to $1,499 | 5,404 (18.1%) | 3,649 (31.7%) |
| $1,500 to $1,999 | 6,957 (23.3%) | 1,631 (14.2%) |
| $2,000 to $2,499 | 3,824 (12.8%) | 380 (3.3%) |
| $2,500 to $2,999 | 1,882 (6.3%) | 130 (1.1%) |
| $3,000 or more | 1,213 (4.1%) | 54 (0.5%) |
| Total | 29,892 (100.0%) | 11,515 (100.0%) |
Physical Housing Characteristics in Laramie County
Housing Structures in Laramie County
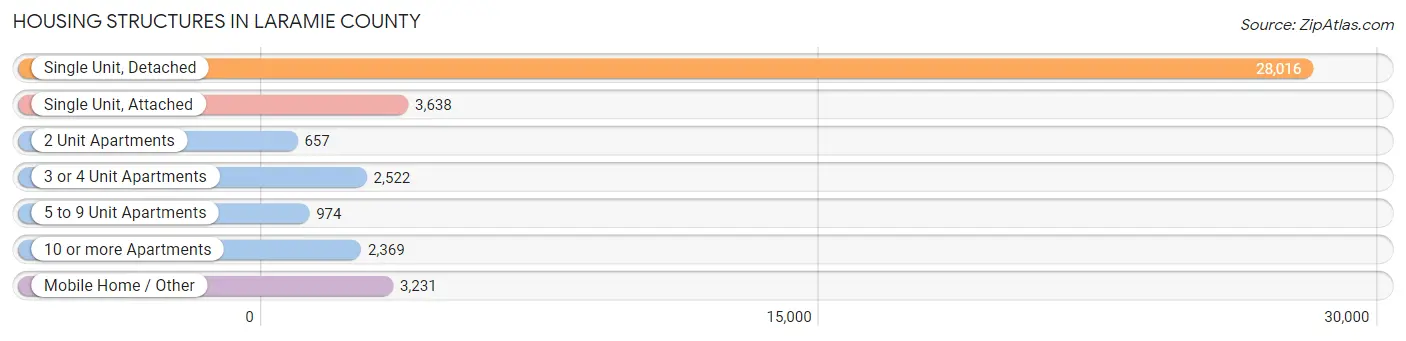
| Structure Type | # Housing Units | % Housing Units |
| Single Unit, Detached | 28,016 | 67.7% |
| Single Unit, Attached | 3,638 | 8.8% |
| 2 Unit Apartments | 657 | 1.6% |
| 3 or 4 Unit Apartments | 2,522 | 6.1% |
| 5 to 9 Unit Apartments | 974 | 2.4% |
| 10 or more Apartments | 2,369 | 5.7% |
| Mobile Home / Other | 3,231 | 7.8% |
| Total | 41,407 | 100.0% |
Housing Structures by Occupancy in Laramie County
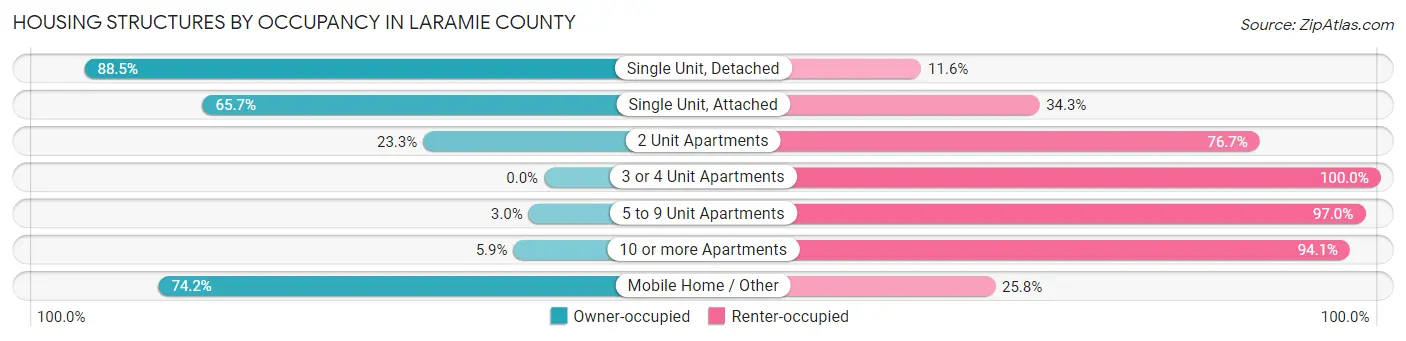
| Structure Type | Owner-occupied | Renter-occupied |
| Single Unit, Detached | 24,781 (88.4%) | 3,235 (11.6%) |
| Single Unit, Attached | 2,391 (65.7%) | 1,247 (34.3%) |
| 2 Unit Apartments | 153 (23.3%) | 504 (76.7%) |
| 3 or 4 Unit Apartments | 0 (0.0%) | 2,522 (100.0%) |
| 5 to 9 Unit Apartments | 29 (3.0%) | 945 (97.0%) |
| 10 or more Apartments | 140 (5.9%) | 2,229 (94.1%) |
| Mobile Home / Other | 2,398 (74.2%) | 833 (25.8%) |
| Total | 29,892 (72.2%) | 11,515 (27.8%) |
Housing Structures by Number of Rooms in Laramie County
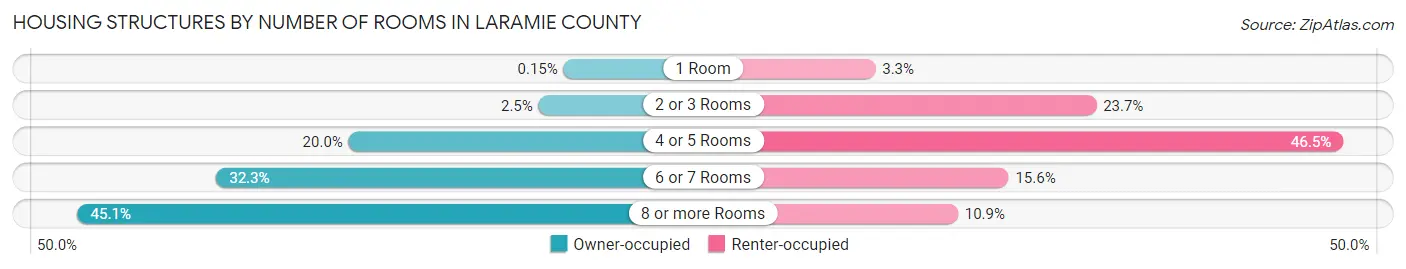
| Number of Rooms | Owner-occupied | Renter-occupied |
| 1 Room | 46 (0.2%) | 377 (3.3%) |
| 2 or 3 Rooms | 736 (2.5%) | 2,729 (23.7%) |
| 4 or 5 Rooms | 5,988 (20.0%) | 5,359 (46.5%) |
| 6 or 7 Rooms | 9,645 (32.3%) | 1,795 (15.6%) |
| 8 or more Rooms | 13,477 (45.1%) | 1,255 (10.9%) |
| Total | 29,892 (100.0%) | 11,515 (100.0%) |
Housing Structure by Heating Type in Laramie County
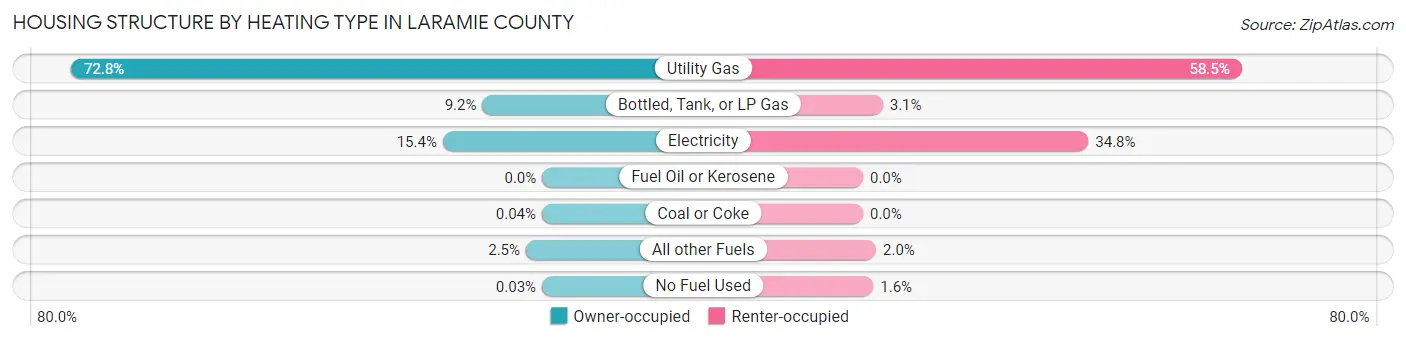
| Heating Type | Owner-occupied | Renter-occupied |
| Utility Gas | 21,771 (72.8%) | 6,737 (58.5%) |
| Bottled, Tank, or LP Gas | 2,762 (9.2%) | 351 (3.0%) |
| Electricity | 4,590 (15.4%) | 4,011 (34.8%) |
| Fuel Oil or Kerosene | 0 (0.0%) | 0 (0.0%) |
| Coal or Coke | 11 (0.0%) | 0 (0.0%) |
| All other Fuels | 749 (2.5%) | 233 (2.0%) |
| No Fuel Used | 9 (0.0%) | 183 (1.6%) |
| Total | 29,892 (100.0%) | 11,515 (100.0%) |
Household Vehicle Usage in Laramie County
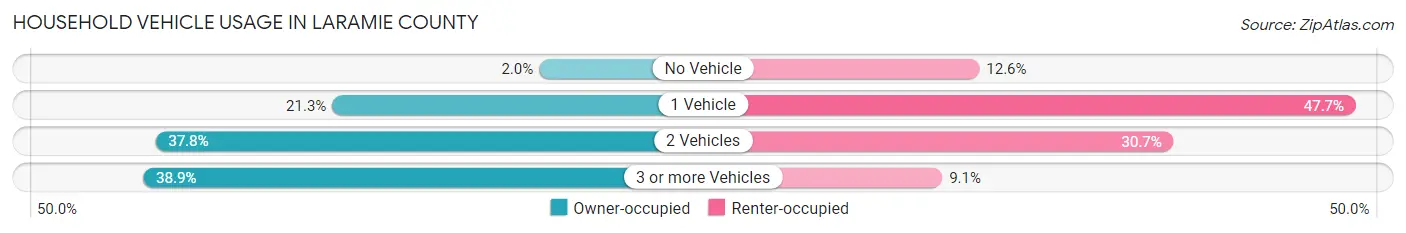
| Vehicles per Household | Owner-occupied | Renter-occupied |
| No Vehicle | 593 (2.0%) | 1,445 (12.6%) |
| 1 Vehicle | 6,364 (21.3%) | 5,491 (47.7%) |
| 2 Vehicles | 11,299 (37.8%) | 3,533 (30.7%) |
| 3 or more Vehicles | 11,636 (38.9%) | 1,046 (9.1%) |
| Total | 29,892 (100.0%) | 11,515 (100.0%) |
Real Estate & Mortgages in Laramie County
Real Estate and Mortgage Overview in Laramie County
| Characteristic | Without Mortgage | With Mortgage |
| Housing Units | 9,466 | 20,426 |
| Median Property Value | $265,300 | $309,200 |
| Median Household Income | $66,071 | $5,181 |
| Monthly Housing Costs | $541 | $1,198 |
| Real Estate Taxes | $1,602 | $494 |
Property Value by Mortgage Status in Laramie County
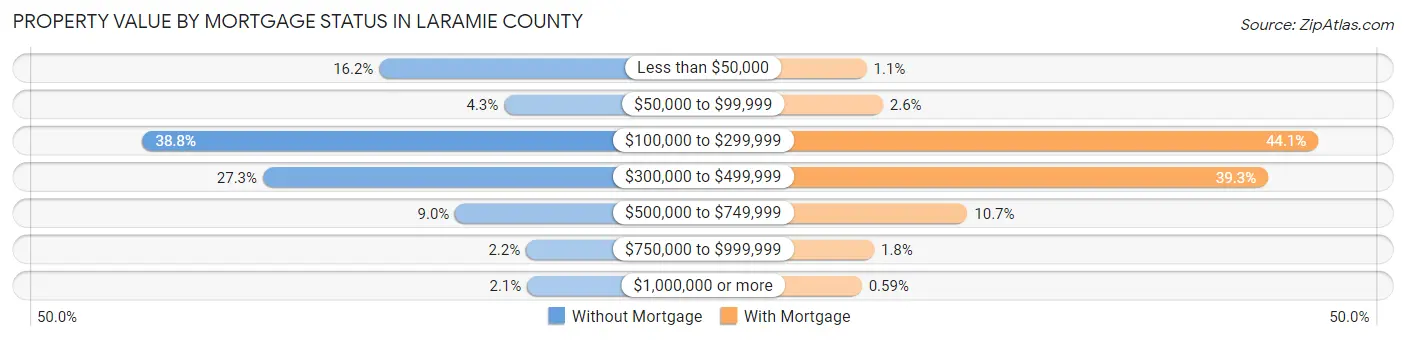
| Property Value | Without Mortgage | With Mortgage |
| Less than $50,000 | 1,536 (16.2%) | 214 (1.1%) |
| $50,000 to $99,999 | 410 (4.3%) | 532 (2.6%) |
| $100,000 to $299,999 | 3,669 (38.8%) | 9,000 (44.1%) |
| $300,000 to $499,999 | 2,585 (27.3%) | 8,024 (39.3%) |
| $500,000 to $749,999 | 851 (9.0%) | 2,175 (10.6%) |
| $750,000 to $999,999 | 212 (2.2%) | 360 (1.8%) |
| $1,000,000 or more | 203 (2.1%) | 121 (0.6%) |
| Total | 9,466 (100.0%) | 20,426 (100.0%) |
Household Income by Mortgage Status in Laramie County
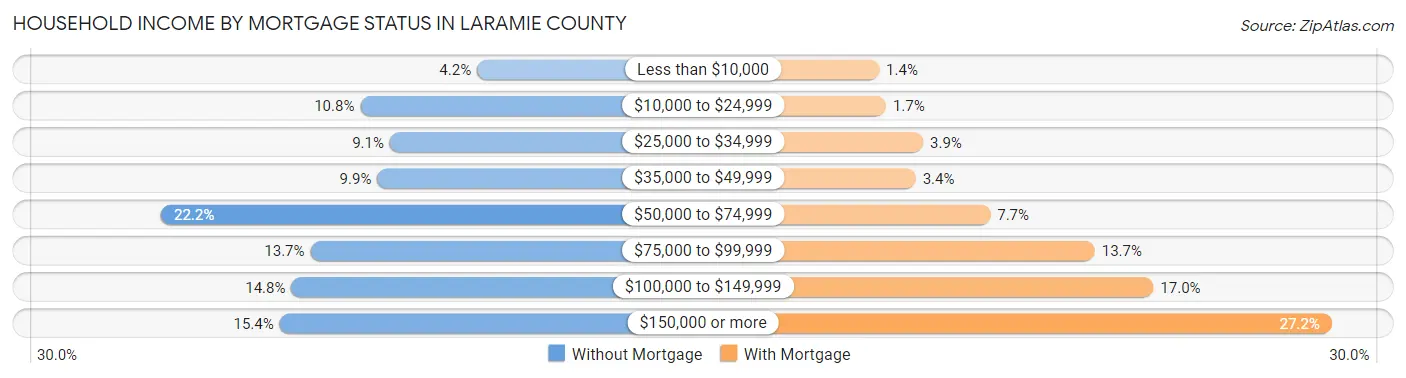
| Household Income | Without Mortgage | With Mortgage |
| Less than $10,000 | 393 (4.2%) | 276 (1.3%) |
| $10,000 to $24,999 | 1,024 (10.8%) | 355 (1.7%) |
| $25,000 to $34,999 | 864 (9.1%) | 789 (3.9%) |
| $35,000 to $49,999 | 932 (9.9%) | 702 (3.4%) |
| $50,000 to $74,999 | 2,101 (22.2%) | 1,572 (7.7%) |
| $75,000 to $99,999 | 1,294 (13.7%) | 2,792 (13.7%) |
| $100,000 to $149,999 | 1,397 (14.8%) | 3,477 (17.0%) |
| $150,000 or more | 1,461 (15.4%) | 5,558 (27.2%) |
| Total | 9,466 (100.0%) | 20,426 (100.0%) |
Property Value to Household Income Ratio in Laramie County
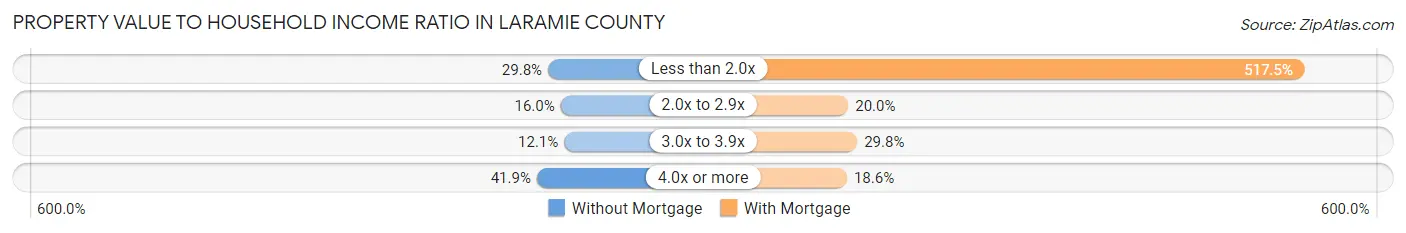
| Value-to-Income Ratio | Without Mortgage | With Mortgage |
| Less than 2.0x | 2,819 (29.8%) | 105,696 (517.5%) |
| 2.0x to 2.9x | 1,518 (16.0%) | 4,094 (20.0%) |
| 3.0x to 3.9x | 1,145 (12.1%) | 6,085 (29.8%) |
| 4.0x or more | 3,969 (41.9%) | 3,803 (18.6%) |
| Total | 9,466 (100.0%) | 20,426 (100.0%) |
Real Estate Taxes by Mortgage Status in Laramie County
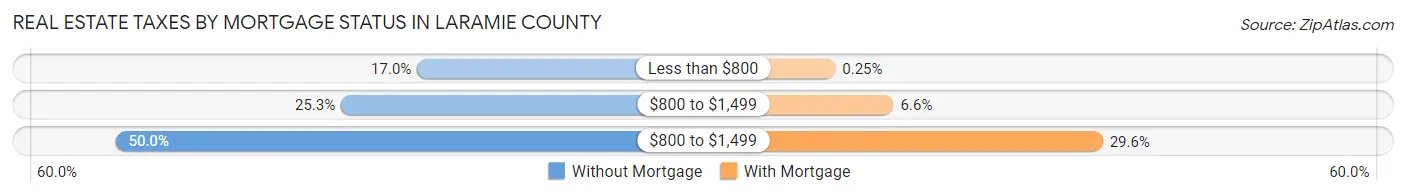
| Property Taxes | Without Mortgage | With Mortgage |
| Less than $800 | 1,607 (17.0%) | 51 (0.3%) |
| $800 to $1,499 | 2,397 (25.3%) | 1,356 (6.6%) |
| $800 to $1,499 | 4,735 (50.0%) | 6,036 (29.5%) |
| Total | 9,466 (100.0%) | 20,426 (100.0%) |
Health & Disability in Laramie County
Health Insurance Coverage by Age in Laramie County
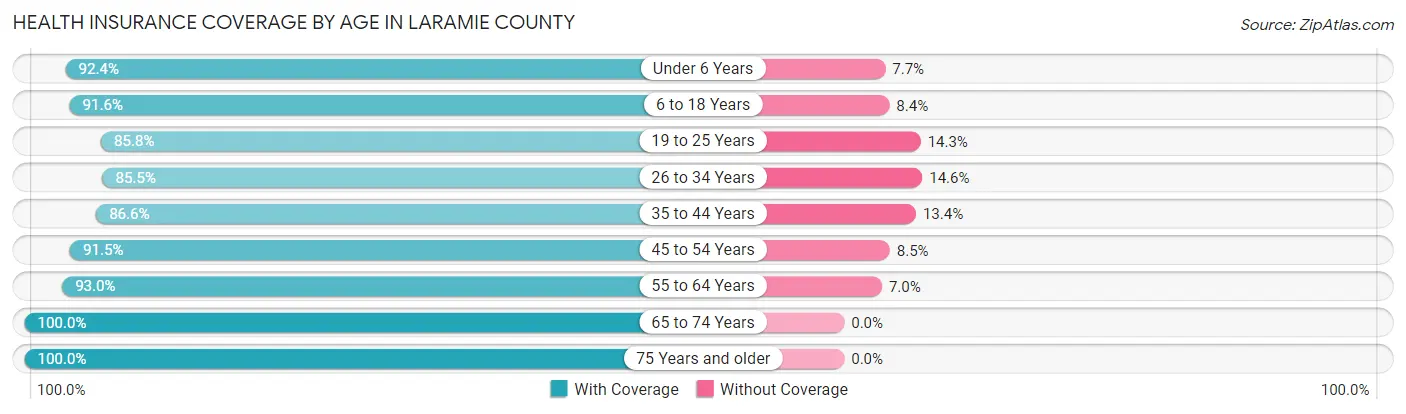
| Age Bracket | With Coverage | Without Coverage |
| Under 6 Years | 6,687 (92.3%) | 554 (7.6%) |
| 6 to 18 Years | 15,390 (91.6%) | 1,414 (8.4%) |
| 19 to 25 Years | 6,742 (85.8%) | 1,120 (14.2%) |
| 26 to 34 Years | 10,017 (85.5%) | 1,705 (14.5%) |
| 35 to 44 Years | 10,869 (86.6%) | 1,677 (13.4%) |
| 45 to 54 Years | 10,500 (91.5%) | 976 (8.5%) |
| 55 to 64 Years | 11,980 (93.0%) | 905 (7.0%) |
| 65 to 74 Years | 10,032 (100.0%) | 0 (0.0%) |
| 75 Years and older | 6,197 (100.0%) | 0 (0.0%) |
| Total | 88,414 (91.4%) | 8,351 (8.6%) |
Health Insurance Coverage by Citizenship Status in Laramie County
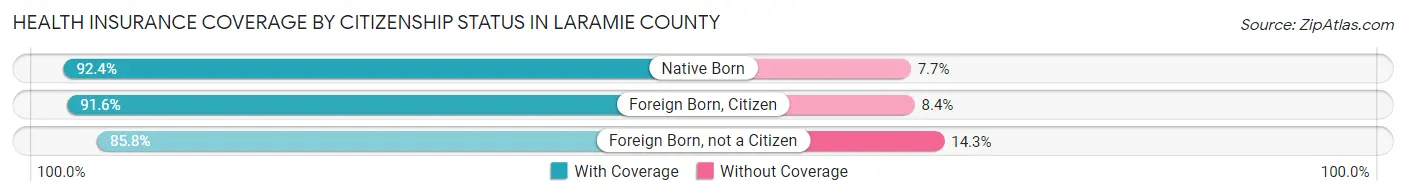
| Citizenship Status | With Coverage | Without Coverage |
| Native Born | 6,687 (92.3%) | 554 (7.6%) |
| Foreign Born, Citizen | 15,390 (91.6%) | 1,414 (8.4%) |
| Foreign Born, not a Citizen | 6,742 (85.8%) | 1,120 (14.2%) |
Health Insurance Coverage by Household Income in Laramie County
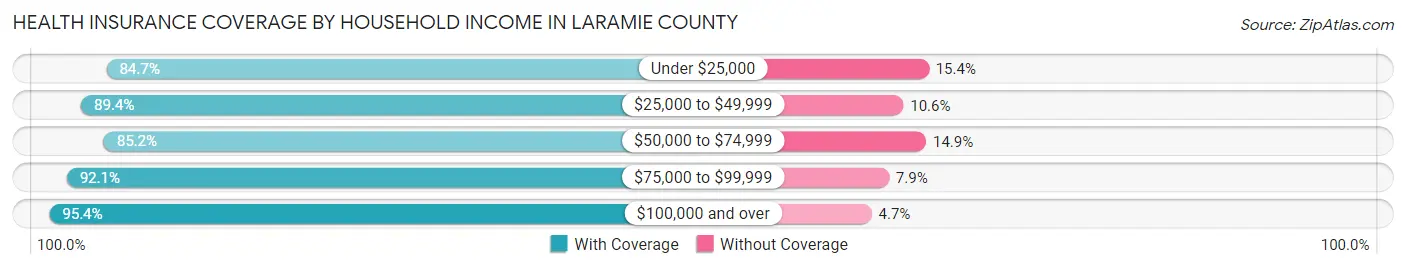
| Household Income | With Coverage | Without Coverage |
| Under $25,000 | 7,728 (84.7%) | 1,401 (15.3%) |
| $25,000 to $49,999 | 10,996 (89.4%) | 1,303 (10.6%) |
| $50,000 to $74,999 | 13,420 (85.2%) | 2,340 (14.8%) |
| $75,000 to $99,999 | 14,253 (92.1%) | 1,221 (7.9%) |
| $100,000 and over | 41,740 (95.4%) | 2,034 (4.6%) |
Public vs Private Health Insurance Coverage by Age in Laramie County
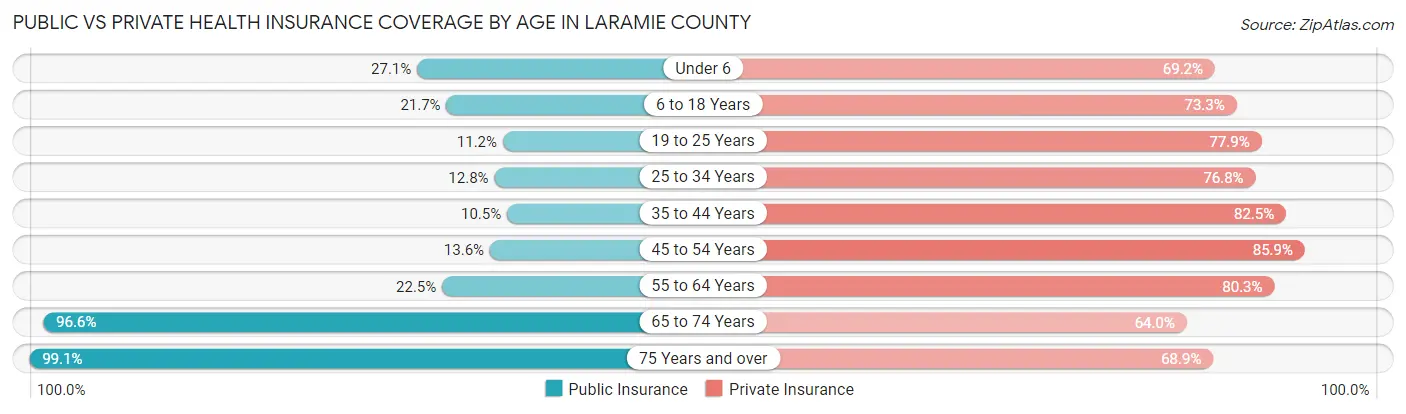
| Age Bracket | Public Insurance | Private Insurance |
| Under 6 | 1,965 (27.1%) | 5,014 (69.2%) |
| 6 to 18 Years | 3,646 (21.7%) | 12,310 (73.3%) |
| 19 to 25 Years | 883 (11.2%) | 6,125 (77.9%) |
| 25 to 34 Years | 1,500 (12.8%) | 8,999 (76.8%) |
| 35 to 44 Years | 1,311 (10.4%) | 10,344 (82.5%) |
| 45 to 54 Years | 1,564 (13.6%) | 9,863 (85.9%) |
| 55 to 64 Years | 2,899 (22.5%) | 10,344 (80.3%) |
| 65 to 74 Years | 9,687 (96.6%) | 6,422 (64.0%) |
| 75 Years and over | 6,144 (99.1%) | 4,272 (68.9%) |
| Total | 29,599 (30.6%) | 73,693 (76.2%) |
Disability Status by Sex by Age in Laramie County
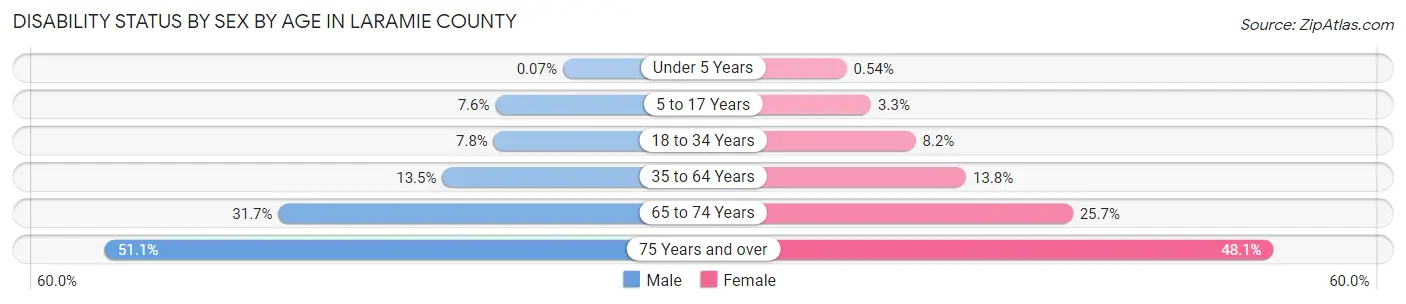
| Age Bracket | Male | Female |
| Under 5 Years | 2 (0.1%) | 16 (0.5%) |
| 5 to 17 Years | 659 (7.6%) | 270 (3.3%) |
| 18 to 34 Years | 809 (7.8%) | 851 (8.2%) |
| 35 to 64 Years | 2,538 (13.5%) | 2,502 (13.8%) |
| 65 to 74 Years | 1,553 (31.7%) | 1,322 (25.7%) |
| 75 Years and over | 1,389 (51.0%) | 1,671 (48.1%) |
Disability Class by Sex by Age in Laramie County
Disability Class: Hearing Difficulty
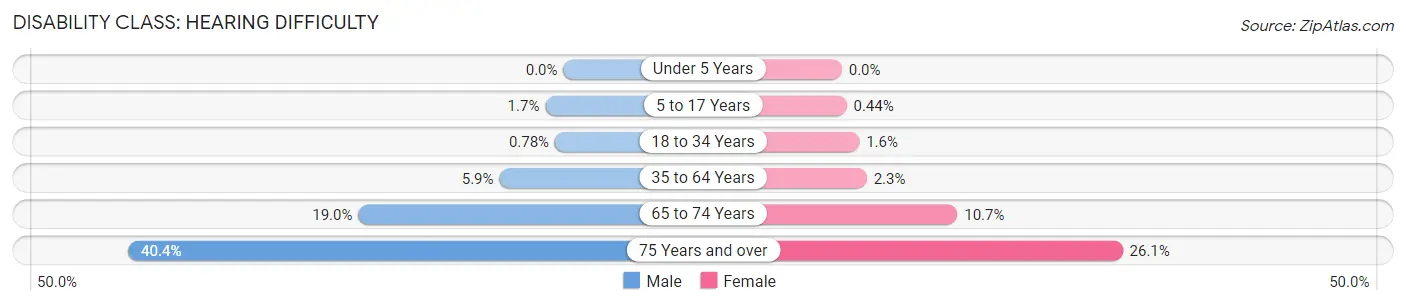
| Age Bracket | Male | Female |
| Under 5 Years | 0 (0.0%) | 0 (0.0%) |
| 5 to 17 Years | 146 (1.7%) | 36 (0.4%) |
| 18 to 34 Years | 81 (0.8%) | 168 (1.6%) |
| 35 to 64 Years | 1,119 (5.9%) | 418 (2.3%) |
| 65 to 74 Years | 931 (19.0%) | 551 (10.7%) |
| 75 Years and over | 1,099 (40.4%) | 906 (26.1%) |
Disability Class: Vision Difficulty
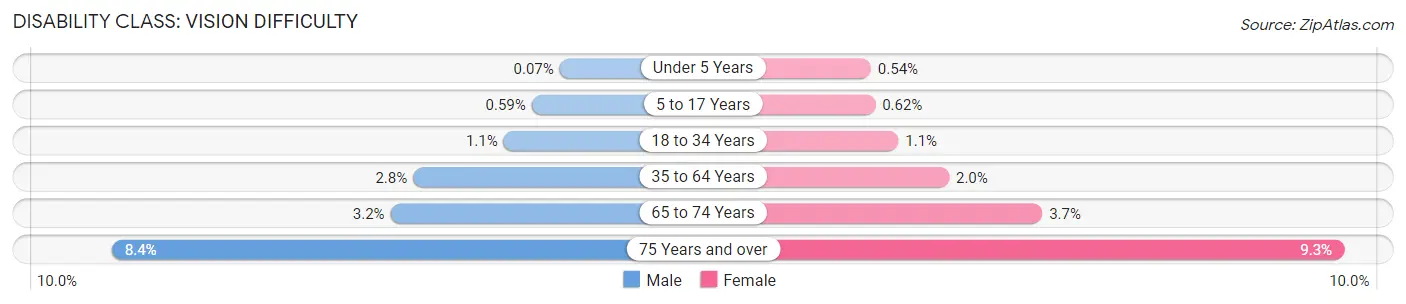
| Age Bracket | Male | Female |
| Under 5 Years | 2 (0.1%) | 16 (0.5%) |
| 5 to 17 Years | 51 (0.6%) | 51 (0.6%) |
| 18 to 34 Years | 116 (1.1%) | 109 (1.1%) |
| 35 to 64 Years | 525 (2.8%) | 360 (2.0%) |
| 65 to 74 Years | 157 (3.2%) | 191 (3.7%) |
| 75 Years and over | 228 (8.4%) | 324 (9.3%) |
Disability Class: Cognitive Difficulty
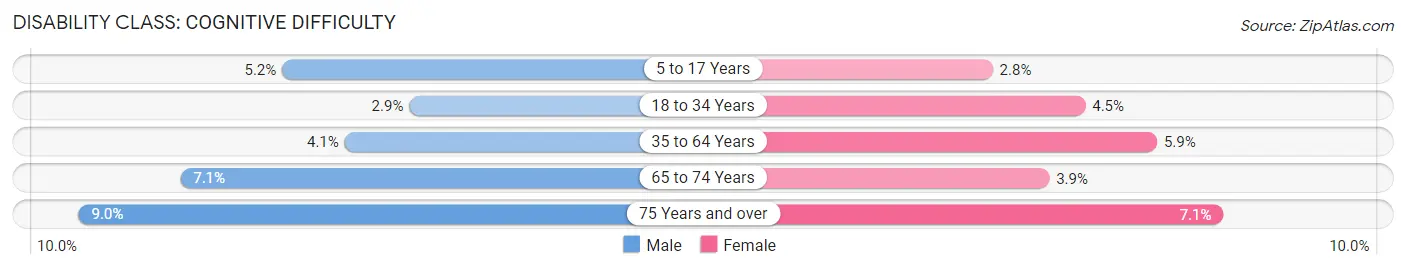
| Age Bracket | Male | Female |
| 5 to 17 Years | 454 (5.2%) | 231 (2.8%) |
| 18 to 34 Years | 298 (2.9%) | 468 (4.5%) |
| 35 to 64 Years | 765 (4.1%) | 1,058 (5.9%) |
| 65 to 74 Years | 348 (7.1%) | 198 (3.8%) |
| 75 Years and over | 245 (9.0%) | 246 (7.1%) |
Disability Class: Ambulatory Difficulty
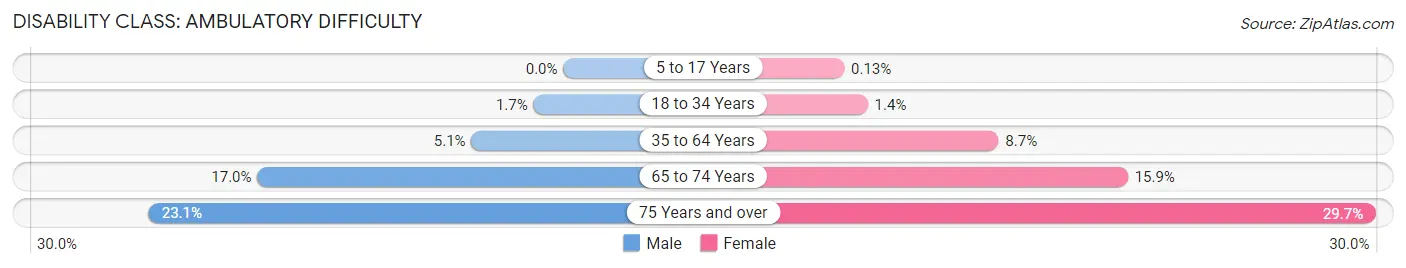
| Age Bracket | Male | Female |
| 5 to 17 Years | 0 (0.0%) | 11 (0.1%) |
| 18 to 34 Years | 173 (1.7%) | 149 (1.4%) |
| 35 to 64 Years | 964 (5.1%) | 1,577 (8.7%) |
| 65 to 74 Years | 834 (17.0%) | 818 (15.9%) |
| 75 Years and over | 628 (23.1%) | 1,032 (29.7%) |
Disability Class: Self-Care Difficulty
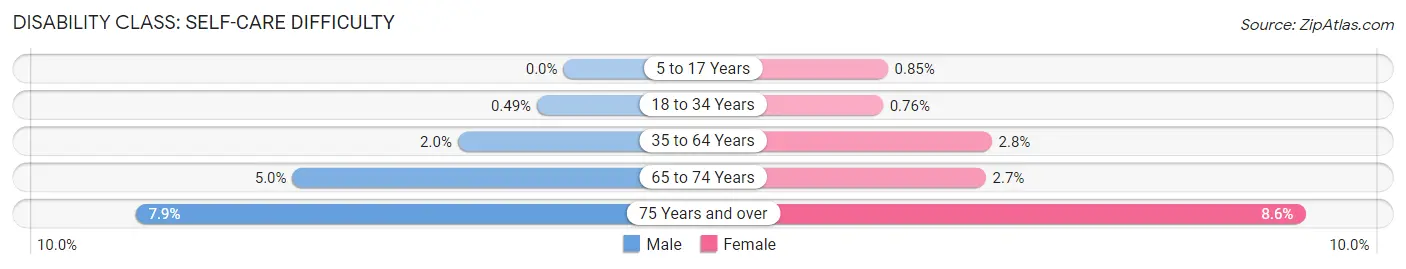
| Age Bracket | Male | Female |
| 5 to 17 Years | 0 (0.0%) | 70 (0.9%) |
| 18 to 34 Years | 51 (0.5%) | 79 (0.8%) |
| 35 to 64 Years | 369 (2.0%) | 502 (2.8%) |
| 65 to 74 Years | 246 (5.0%) | 137 (2.7%) |
| 75 Years and over | 216 (7.9%) | 299 (8.6%) |
Technology Access in Laramie County
Computing Device Access in Laramie County
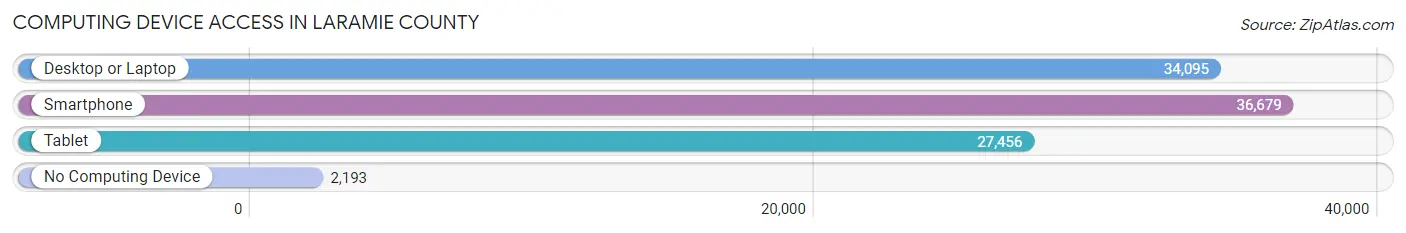
| Device Type | # Households | % Households |
| Desktop or Laptop | 34,095 | 82.3% |
| Smartphone | 36,679 | 88.6% |
| Tablet | 27,456 | 66.3% |
| No Computing Device | 2,193 | 5.3% |
| Total | 41,407 | 100.0% |
Internet Access in Laramie County
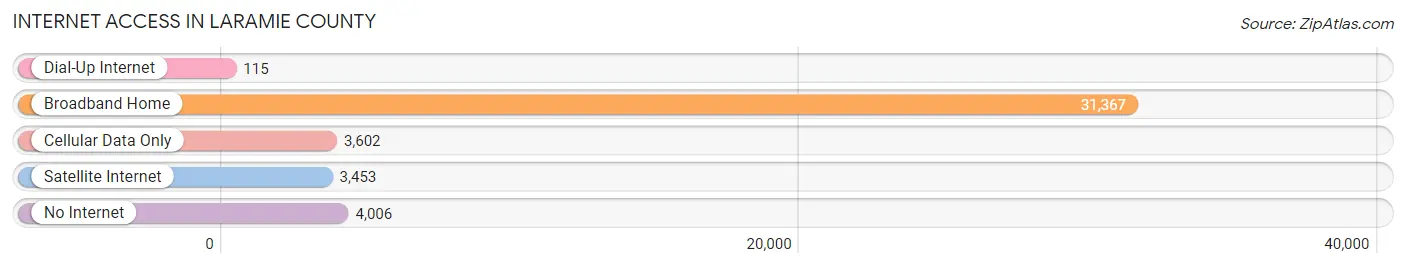
| Internet Type | # Households | % Households |
| Dial-Up Internet | 115 | 0.3% |
| Broadband Home | 31,367 | 75.7% |
| Cellular Data Only | 3,602 | 8.7% |
| Satellite Internet | 3,453 | 8.3% |
| No Internet | 4,006 | 9.7% |
| Total | 41,407 | 100.0% |
Laramie County Summary
Laramie County, Wyoming is located in the southeastern corner of the state and is the third most populous county in Wyoming. The county seat is Cheyenne, the state capital. The county was created in 1867 and named after Jacques La Ramie, a French-Canadian trapper who explored the area in the early 1800s.
Geography
Laramie County covers an area of 2,633 square miles and is bordered by Platte County to the north, Albany County to the east, Carbon County to the south, and Laramie County to the west. The county is located in the Great Plains region of the United States and is characterized by rolling hills, grasslands, and sagebrush. The Laramie Range, a subrange of the Rocky Mountains, runs through the county from north to south. The highest point in the county is Pilot Butte, which has an elevation of 8,717 feet.
The county is home to several rivers and streams, including the Laramie River, which flows through the county from north to south. The North Platte River also flows through the county, as does the Medicine Bow River. The county is also home to several reservoirs, including Lake Hattie, Lake Absarraca, and Lake Hattie.
Economy
Laramie County has a diverse economy that is largely driven by the energy, agriculture, and tourism industries. The county is home to several oil and gas fields, including the Laramie-Platte Field, which is the largest oil and gas field in Wyoming. The county is also home to several coal mines, including the Black Thunder Mine, which is the largest coal mine in the United States.
Agriculture is also an important part of the county’s economy. The county is home to several large farms and ranches, which produce a variety of crops, including wheat, corn, and hay. The county is also home to several large cattle ranches, which produce beef and other livestock products.
Tourism is also an important part of the county’s economy. The county is home to several popular tourist attractions, including the Cheyenne Frontier Days, the Wyoming State Fair, and the Cheyenne Botanic Gardens. The county is also home to several national parks and monuments, including the Medicine Bow National Forest and the Fossil Butte National Monument.
Demographics
As of the 2010 census, Laramie County had a population of 91,738. The population is largely white (87.3%), with smaller percentages of Native American (3.2%), African American (2.2%), Asian (1.2%), and Hispanic or Latino (7.2%) residents. The median household income in the county is $60,945, and the median home value is $212,400.
Conclusion
Laramie County, Wyoming is a diverse and vibrant county located in the southeastern corner of the state. The county is home to a variety of industries, including energy, agriculture, and tourism, and is home to several popular tourist attractions. The county has a population of 91,738, and the median household income is $60,945. Laramie County is an important part of the state of Wyoming and is an excellent place to live, work, and visit.
Common Questions
What is the Total Population of Laramie County?
Total Population of Laramie County is 100,316.
What is the Total Male Population of Laramie County?
Total Male Population of Laramie County is 51,152.
What is the Total Female Population of Laramie County?
Total Female Population of Laramie County is 49,164.
What is the Ratio of Males per 100 Females in Laramie County?
There are 104.04 Males per 100 Females in Laramie County.
What is the Ratio of Females per 100 Males in Laramie County?
There are 96.11 Females per 100 Males in Laramie County.
What is the Median Population Age in Laramie County?
Median Population Age in Laramie County is 38.0 Years.
What is the Average Family Size in Laramie County
Average Family Size in Laramie County is 3.0 People.
What is the Average Household Size in Laramie County
Average Household Size in Laramie County is 2.4 People.
What is Per Capita Income in Laramie County?
Per Capita income in Laramie County is $41,104.
What is the Median Family Income in Laramie County?
Median Family Income in Laramie County is $96,410.
What is the Median Household income in Laramie County?
Median Household Income in Laramie County is $76,282.
What is Income or Wage Gap in Laramie County?
Income or Wage Gap in Laramie County is 36.3%.
Women in Laramie County earn 63.7 cents for every dollar earned by a man.
What is Family Income Deficit in Laramie County?
Family Income Deficit in Laramie County is $11,470.
Families that are below poverty line in Laramie County earn $11,470 less on average than the poverty threshold level.
What is Inequality or Gini Index in Laramie County?
Inequality or Gini Index in Laramie County is 0.44.
How Large is the Labor Force in Laramie County?
There are 53,454 People in the Labor Forcein in Laramie County.
What is the Percentage of People in the Labor Force in Laramie County?
66.9% of People are in the Labor Force in Laramie County.
What is the Unemployment Rate in Laramie County?
Unemployment Rate in Laramie County is 3.5%.