Johnson County, WY
Johnson County Map
Johnson County Overview
8,536
TOTAL POPULATION
4,406
MALE POPULATION
4,130
FEMALE POPULATION
106.68
MALES / 100 FEMALES
93.74
FEMALES / 100 MALES
46.1
MEDIAN AGE
2.9
AVG FAMILY SIZE
2.1
AVG HOUSEHOLD SIZE
$37,691
PER CAPITA INCOME
$89,837
AVG FAMILY INCOME
$60,667
AVG HOUSEHOLD INCOME
32.7%
WAGE / INCOME GAP [ % ]
67.3¢/ $1
WAGE / INCOME GAP [ $ ]
$15,999
FAMILY INCOME DEFICIT
0.49
INEQUALITY / GINI INDEX
4,094
LABOR FORCE [ PEOPLE ]
57.6%
PERCENT IN LABOR FORCE
2.3%
UNEMPLOYMENT RATE
Johnson County Area Codes
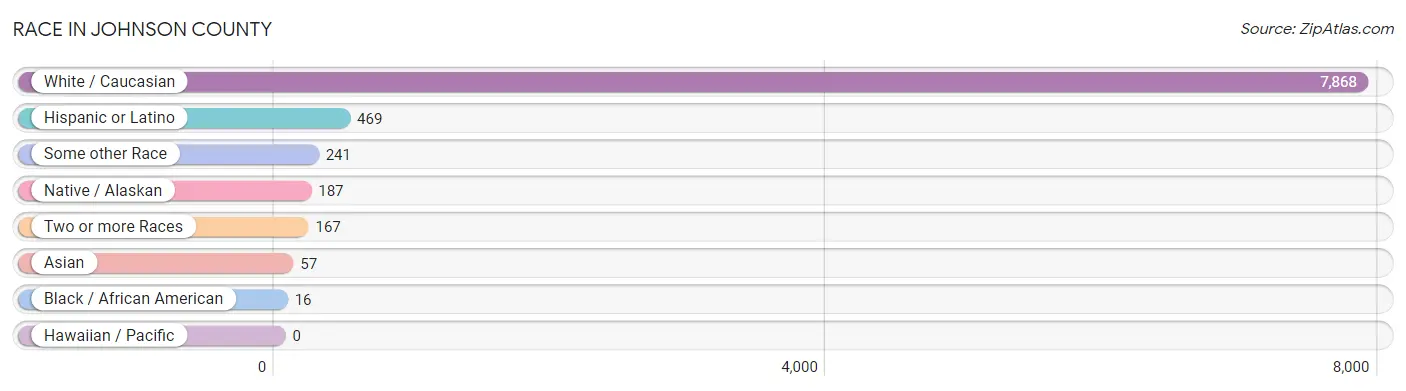
Race in Johnson County
The most populous races in Johnson County are White / Caucasian (7,868 | 92.2%), Hispanic or Latino (469 | 5.5%), and Some other Race (241 | 2.8%).
| Race | # Population | % Population |
| Asian | 57 | 0.7% |
| Black / African American | 16 | 0.2% |
| Hawaiian / Pacific | 0 | 0.0% |
| Hispanic or Latino | 469 | 5.5% |
| Native / Alaskan | 187 | 2.2% |
| White / Caucasian | 7,868 | 92.2% |
| Two or more Races | 167 | 2.0% |
| Some other Race | 241 | 2.8% |
| Total | 8,536 | 100.0% |
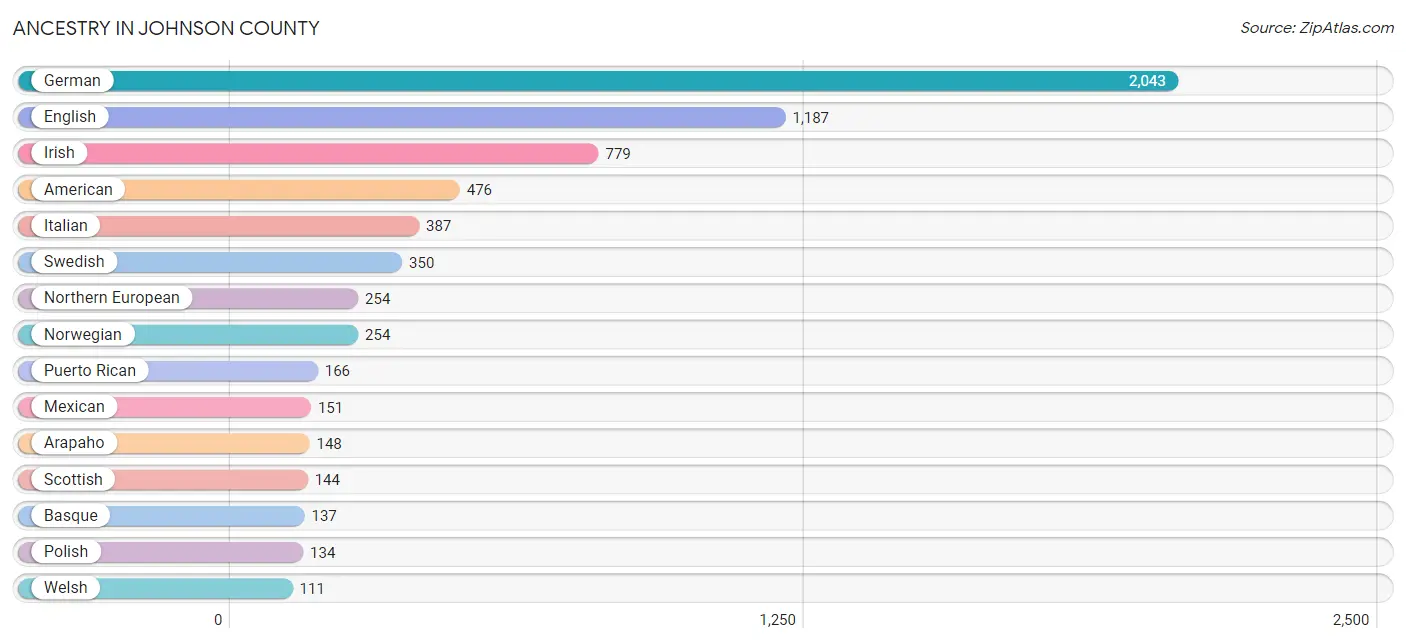
Ancestry in Johnson County
The most populous ancestries reported in Johnson County are German (2,043 | 23.9%), English (1,187 | 13.9%), Irish (779 | 9.1%), American (476 | 5.6%), and Italian (387 | 4.5%), together accounting for 57.1% of all Johnson County residents.
| Ancestry | # Population | % Population |
| African | 1 | 0.0% |
| American | 476 | 5.6% |
| Arapaho | 148 | 1.7% |
| Austrian | 6 | 0.1% |
| Basque | 137 | 1.6% |
| Belgian | 43 | 0.5% |
| Bhutanese | 7 | 0.1% |
| British | 103 | 1.2% |
| Burmese | 34 | 0.4% |
| Canadian | 40 | 0.5% |
| Cherokee | 49 | 0.6% |
| Cheyenne | 1 | 0.0% |
| Choctaw | 5 | 0.1% |
| Czech | 9 | 0.1% |
| Danish | 20 | 0.2% |
| Dutch | 87 | 1.0% |
| English | 1,187 | 13.9% |
| European | 53 | 0.6% |
| French | 58 | 0.7% |
| French Canadian | 79 | 0.9% |
| German | 2,043 | 23.9% |
| Hungarian | 12 | 0.1% |
| Irish | 779 | 9.1% |
| Italian | 387 | 4.5% |
| Mexican | 151 | 1.8% |
| Mongolian | 37 | 0.4% |
| Northern European | 254 | 3.0% |
| Norwegian | 254 | 3.0% |
| Polish | 134 | 1.6% |
| Portuguese | 4 | 0.1% |
| Puerto Rican | 166 | 1.9% |
| Scandinavian | 103 | 1.2% |
| Scotch-Irish | 77 | 0.9% |
| Scottish | 144 | 1.7% |
| Sioux | 12 | 0.1% |
| Spaniard | 22 | 0.3% |
| Spanish | 81 | 0.9% |
| Subsaharan African | 1 | 0.0% |
| Swedish | 350 | 4.1% |
| Swiss | 61 | 0.7% |
| Thai | 57 | 0.7% |
| Welsh | 111 | 1.3% | View All 42 Rows |
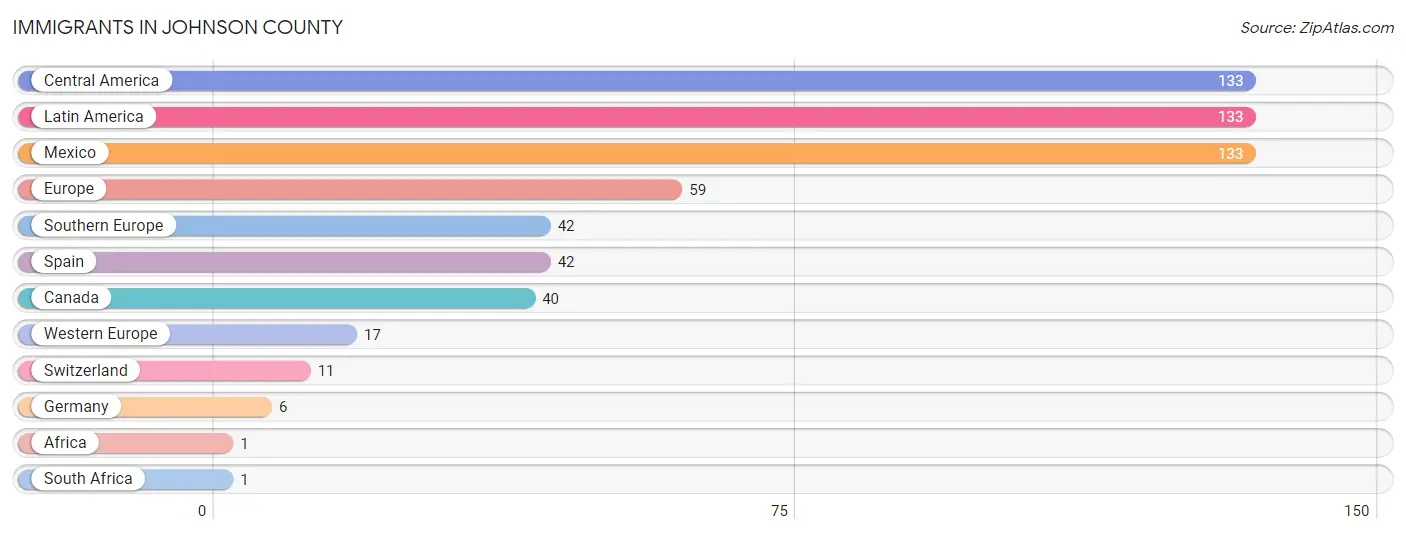
Immigrants in Johnson County
The most numerous immigrant groups reported in Johnson County came from Central America (133 | 1.6%), Latin America (133 | 1.6%), Mexico (133 | 1.6%), Europe (59 | 0.7%), and Southern Europe (42 | 0.5%), together accounting for 5.9% of all Johnson County residents.
| Immigration Origin | # Population | % Population |
| Africa | 1 | 0.0% |
| Canada | 40 | 0.5% |
| Central America | 133 | 1.6% |
| Europe | 59 | 0.7% |
| Germany | 6 | 0.1% |
| Latin America | 133 | 1.6% |
| Mexico | 133 | 1.6% |
| South Africa | 1 | 0.0% |
| Southern Europe | 42 | 0.5% |
| Spain | 42 | 0.5% |
| Switzerland | 11 | 0.1% |
| Western Europe | 17 | 0.2% | View All 12 Rows |
Sex and Age in Johnson County
Sex and Age in Johnson County
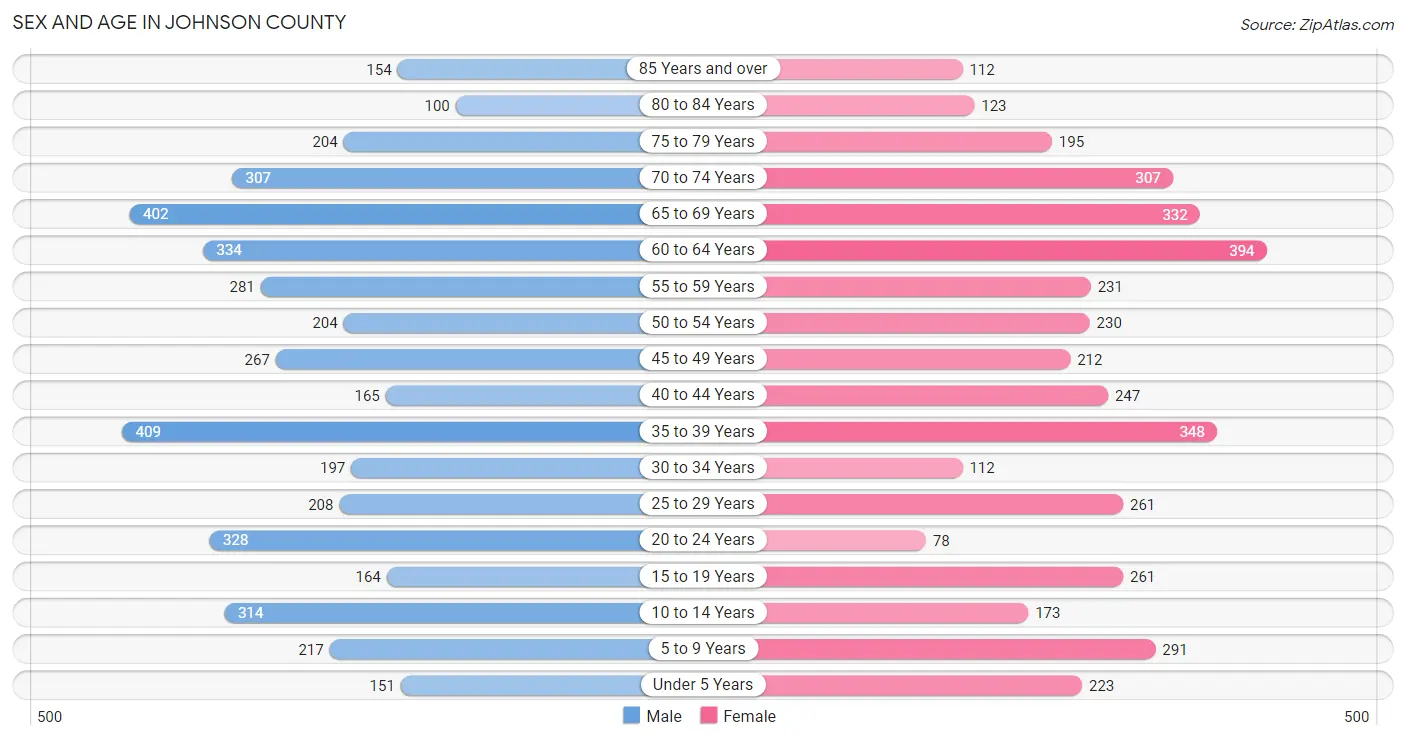
The most populous age groups in Johnson County are 35 to 39 Years (409 | 9.3%) for men and 60 to 64 Years (394 | 9.5%) for women.
| Age Bracket | Male | Female |
| Under 5 Years | 151 (3.4%) | 223 (5.4%) |
| 5 to 9 Years | 217 (4.9%) | 291 (7.0%) |
| 10 to 14 Years | 314 (7.1%) | 173 (4.2%) |
| 15 to 19 Years | 164 (3.7%) | 261 (6.3%) |
| 20 to 24 Years | 328 (7.4%) | 78 (1.9%) |
| 25 to 29 Years | 208 (4.7%) | 261 (6.3%) |
| 30 to 34 Years | 197 (4.5%) | 112 (2.7%) |
| 35 to 39 Years | 409 (9.3%) | 348 (8.4%) |
| 40 to 44 Years | 165 (3.7%) | 247 (6.0%) |
| 45 to 49 Years | 267 (6.1%) | 212 (5.1%) |
| 50 to 54 Years | 204 (4.6%) | 230 (5.6%) |
| 55 to 59 Years | 281 (6.4%) | 231 (5.6%) |
| 60 to 64 Years | 334 (7.6%) | 394 (9.5%) |
| 65 to 69 Years | 402 (9.1%) | 332 (8.0%) |
| 70 to 74 Years | 307 (7.0%) | 307 (7.4%) |
| 75 to 79 Years | 204 (4.6%) | 195 (4.7%) |
| 80 to 84 Years | 100 (2.3%) | 123 (3.0%) |
| 85 Years and over | 154 (3.5%) | 112 (2.7%) |
| Total | 4,406 (100.0%) | 4,130 (100.0%) |
Families and Households in Johnson County
Median Family Size in Johnson County
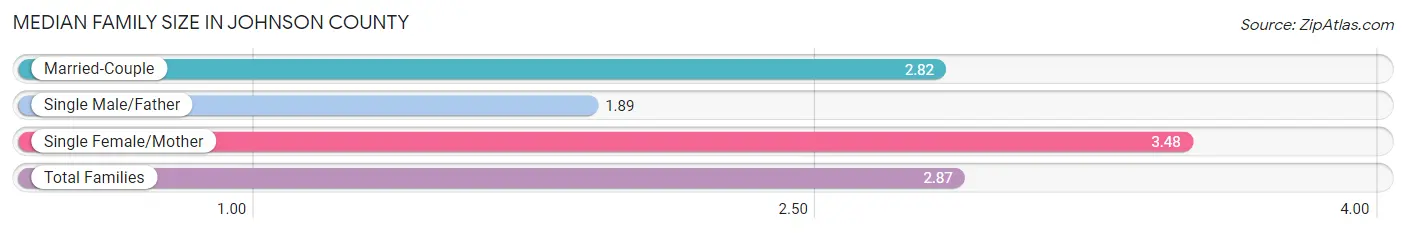
The median family size in Johnson County is 2.87 persons per family, with single female/mother families (211 | 9.2%) accounting for the largest median family size of 3.48 persons per family. On the other hand, single male/father families (27 | 1.2%) represent the smallest median family size with 1.89 persons per family.
| Family Type | # Families | Family Size |
| Married-Couple | 2,065 (89.7%) | 2.82 |
| Single Male/Father | 27 (1.2%) | 1.89 |
| Single Female/Mother | 211 (9.2%) | 3.48 |
| Total Families | 2,303 (100.0%) | 2.87 |
Median Household Size in Johnson County
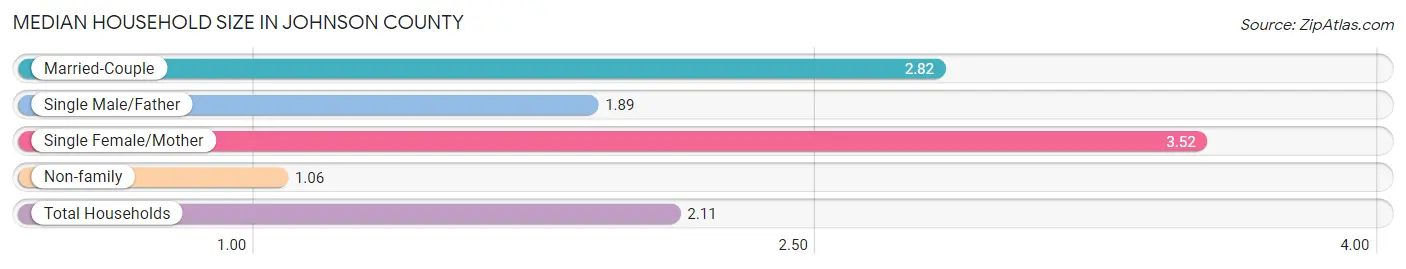
The median household size in Johnson County is 2.11 persons per household, with single female/mother households (211 | 5.3%) accounting for the largest median household size of 3.52 persons per household. non-family households (1,668 | 42.0%) represent the smallest median household size with 1.06 persons per household.
| Household Type | # Households | Household Size |
| Married-Couple | 2,065 (52.0%) | 2.82 |
| Single Male/Father | 27 (0.7%) | 1.89 |
| Single Female/Mother | 211 (5.3%) | 3.52 |
| Non-family | 1,668 (42.0%) | 1.06 |
| Total Households | 3,971 (100.0%) | 2.11 |
Household Size by Marriage Status in Johnson County
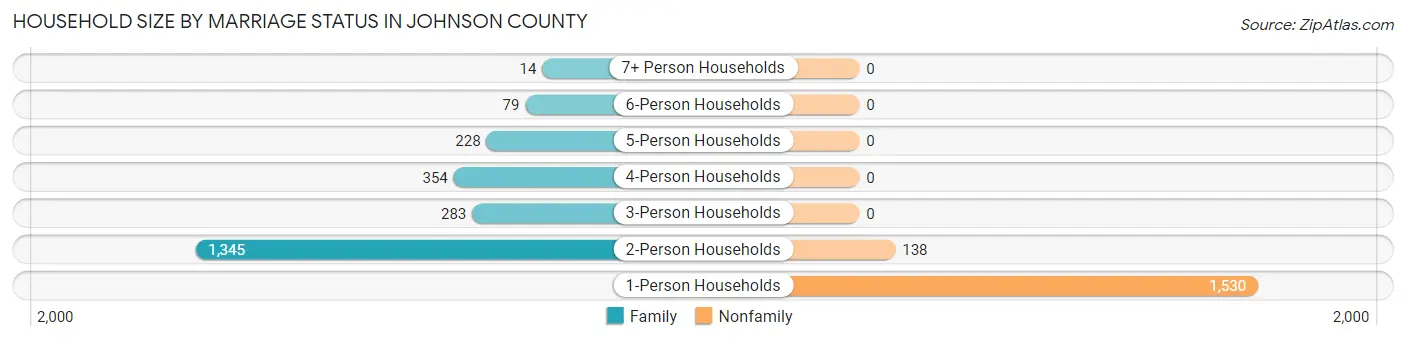
Out of a total of 3,971 households in Johnson County, 2,303 (58.0%) are family households, while 1,668 (42.0%) are nonfamily households. The most numerous type of family households are 2-person households, comprising 1,345, and the most common type of nonfamily households are 1-person households, comprising 1,530.
| Household Size | Family Households | Nonfamily Households |
| 1-Person Households | - | 1,530 (38.5%) |
| 2-Person Households | 1,345 (33.9%) | 138 (3.5%) |
| 3-Person Households | 283 (7.1%) | 0 (0.0%) |
| 4-Person Households | 354 (8.9%) | 0 (0.0%) |
| 5-Person Households | 228 (5.7%) | 0 (0.0%) |
| 6-Person Households | 79 (2.0%) | 0 (0.0%) |
| 7+ Person Households | 14 (0.4%) | 0 (0.0%) |
| Total | 2,303 (58.0%) | 1,668 (42.0%) |
Female Fertility in Johnson County
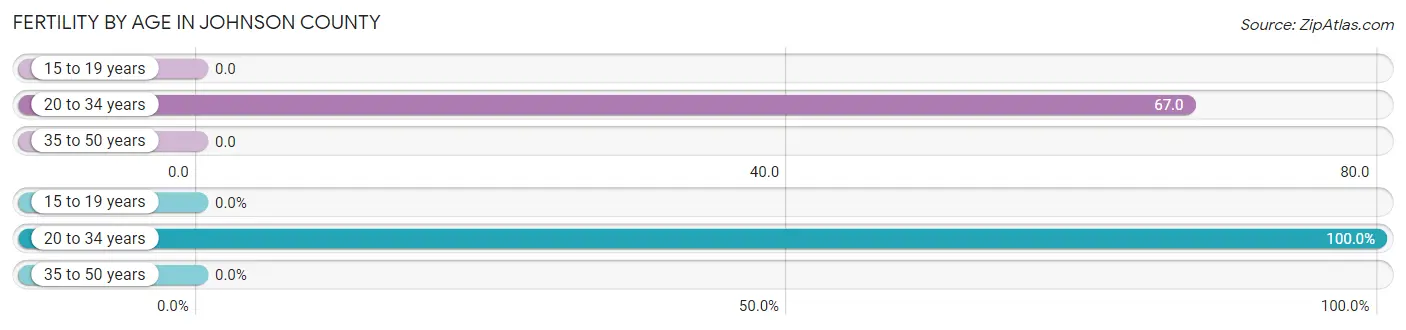
Fertility by Age in Johnson County
Average fertility rate in Johnson County is 19.0 births per 1,000 women. Women in the age bracket of 20 to 34 years have the highest fertility rate with 67.0 births per 1,000 women. Women in the age bracket of 20 to 34 years acount for 100.0% of all women with births.
| Age Bracket | Women with Births | Births / 1,000 Women |
| 15 to 19 years | 0 (0.0%) | 0.0 |
| 20 to 34 years | 30 (100.0%) | 67.0 |
| 35 to 50 years | 0 (0.0%) | 0.0 |
| Total | 30 (100.0%) | 19.0 |
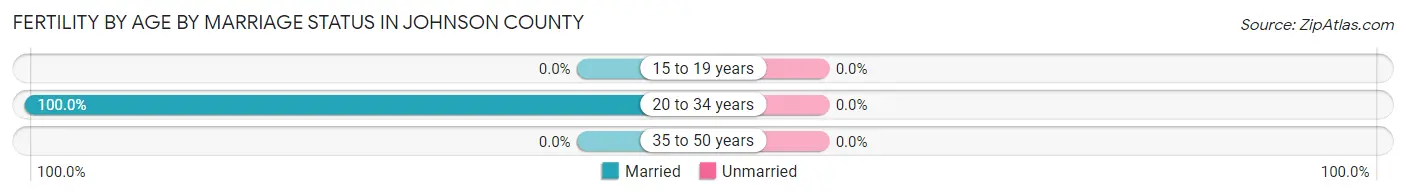
Fertility by Age by Marriage Status in Johnson County
| Age Bracket | Married | Unmarried |
| 15 to 19 years | 0 (0.0%) | 0 (0.0%) |
| 20 to 34 years | 30 (100.0%) | 0 (0.0%) |
| 35 to 50 years | 0 (0.0%) | 0 (0.0%) |
| Total | 30 (100.0%) | 0 (0.0%) |
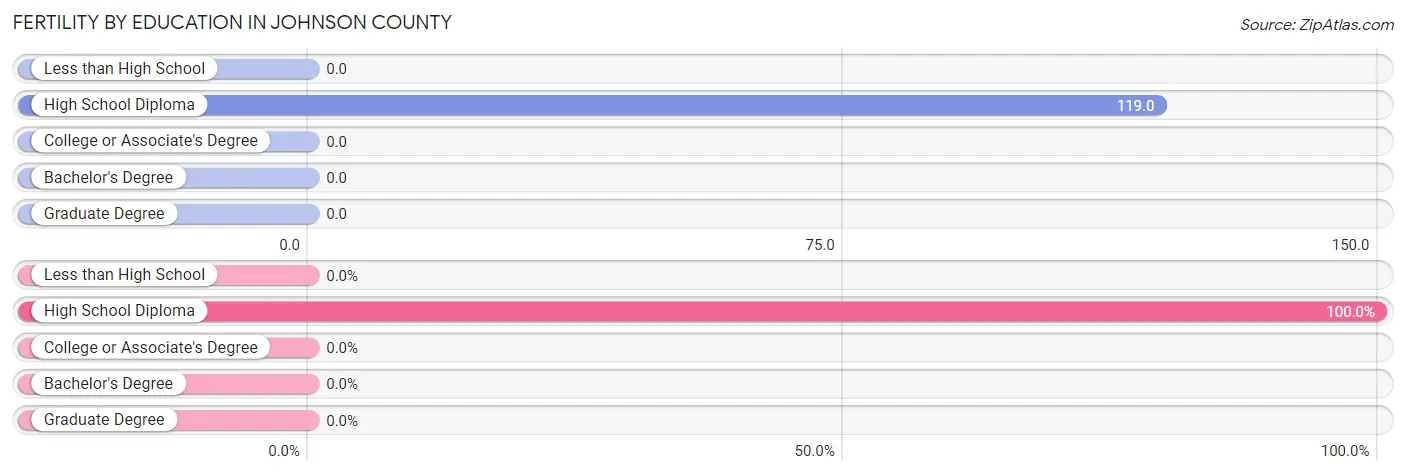
Fertility by Education in Johnson County
| Educational Attainment | Women with Births | Births / 1,000 Women |
| Less than High School | 0 (0.0%) | 0.0 |
| High School Diploma | 30 (100.0%) | 119.0 |
| College or Associate's Degree | 0 (0.0%) | 0.0 |
| Bachelor's Degree | 0 (0.0%) | 0.0 |
| Graduate Degree | 0 (0.0%) | 0.0 |
| Total | 30 (100.0%) | 19.0 |
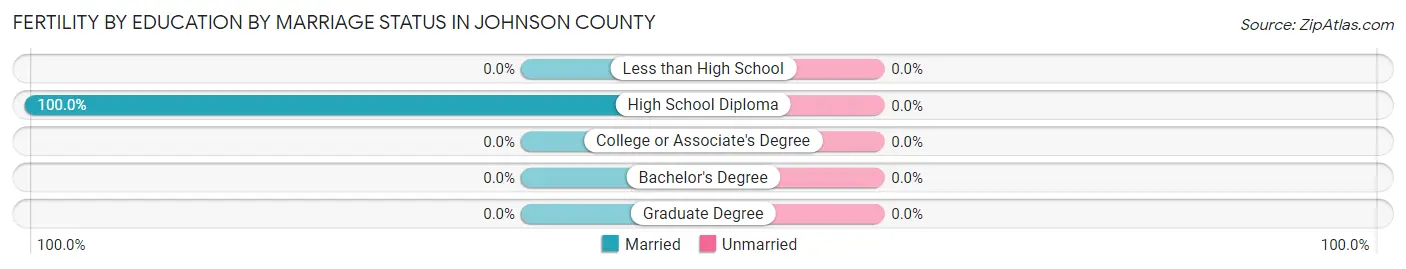
Fertility by Education by Marriage Status in Johnson County
| Educational Attainment | Married | Unmarried |
| Less than High School | 0 (0.0%) | 0 (0.0%) |
| High School Diploma | 30 (100.0%) | 0 (0.0%) |
| College or Associate's Degree | 0 (0.0%) | 0 (0.0%) |
| Bachelor's Degree | 0 (0.0%) | 0 (0.0%) |
| Graduate Degree | 0 (0.0%) | 0 (0.0%) |
| Total | 30 (100.0%) | 0 (0.0%) |
Income in Johnson County
Income Overview in Johnson County
Per Capita Income in Johnson County is $37,691, while median incomes of families and households are $89,837 and $60,667 respectively.
| Characteristic | Number | Measure |
| Per Capita Income | 8,536 | $37,691 |
| Median Family Income | 2,303 | $89,837 |
| Mean Family Income | 2,303 | $101,616 |
| Median Household Income | 3,971 | $60,667 |
| Mean Household Income | 3,971 | $81,448 |
| Income Deficit | 2,303 | $15,999 |
| Wage / Income Gap (%) | 8,536 | 32.68% |
| Wage / Income Gap ($) | 8,536 | 67.32¢ per $1 |
| Gini / Inequality Index | 8,536 | 0.49 |
Earnings by Sex in Johnson County
Average Earnings in Johnson County are $37,047, $49,408 for men and $33,259 for women, a difference of 32.7%.
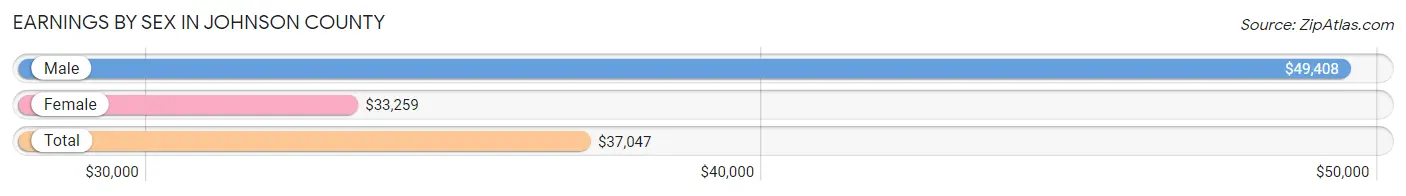
| Sex | Number | Average Earnings |
| Male | 2,295 (52.2%) | $49,408 |
| Female | 2,102 (47.8%) | $33,259 |
| Total | 4,397 (100.0%) | $37,047 |
Earnings by Sex by Income Bracket in Johnson County
The most common earnings brackets in Johnson County are $100,000+ for men (388 | 16.9%) and $35,000 to $39,999 for women (232 | 11.0%).
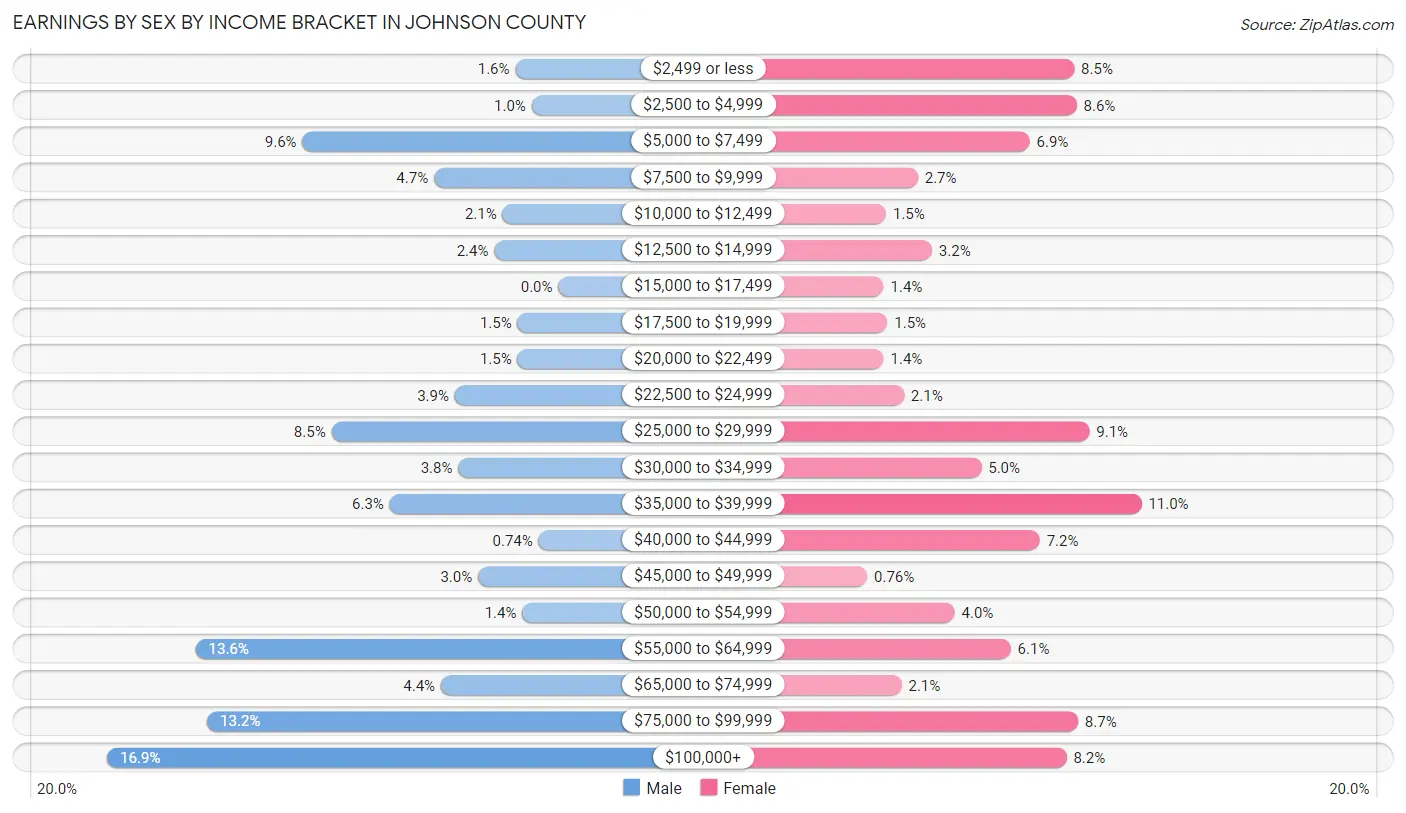
| Income | Male | Female |
| $2,499 or less | 37 (1.6%) | 179 (8.5%) |
| $2,500 to $4,999 | 23 (1.0%) | 181 (8.6%) |
| $5,000 to $7,499 | 220 (9.6%) | 144 (6.9%) |
| $7,500 to $9,999 | 107 (4.7%) | 56 (2.7%) |
| $10,000 to $12,499 | 48 (2.1%) | 31 (1.5%) |
| $12,500 to $14,999 | 55 (2.4%) | 67 (3.2%) |
| $15,000 to $17,499 | 0 (0.0%) | 29 (1.4%) |
| $17,500 to $19,999 | 35 (1.5%) | 32 (1.5%) |
| $20,000 to $22,499 | 35 (1.5%) | 29 (1.4%) |
| $22,500 to $24,999 | 89 (3.9%) | 45 (2.1%) |
| $25,000 to $29,999 | 195 (8.5%) | 191 (9.1%) |
| $30,000 to $34,999 | 86 (3.7%) | 106 (5.0%) |
| $35,000 to $39,999 | 145 (6.3%) | 232 (11.0%) |
| $40,000 to $44,999 | 17 (0.7%) | 152 (7.2%) |
| $45,000 to $49,999 | 69 (3.0%) | 16 (0.8%) |
| $50,000 to $54,999 | 31 (1.3%) | 85 (4.0%) |
| $55,000 to $64,999 | 312 (13.6%) | 129 (6.1%) |
| $65,000 to $74,999 | 101 (4.4%) | 43 (2.1%) |
| $75,000 to $99,999 | 302 (13.2%) | 182 (8.7%) |
| $100,000+ | 388 (16.9%) | 173 (8.2%) |
| Total | 2,295 (100.0%) | 2,102 (100.0%) |
Earnings by Sex by Educational Attainment in Johnson County
Average earnings in Johnson County are $57,795 for men and $36,103 for women, a difference of 37.5%. Men with an educational attainment of graduate degree enjoy the highest average annual earnings of $91,548, while those with college or associate's degree education earn the least with $47,705. Women with an educational attainment of graduate degree earn the most with the average annual earnings of $77,670, while those with bachelor's degree education have the smallest earnings of $28,958.
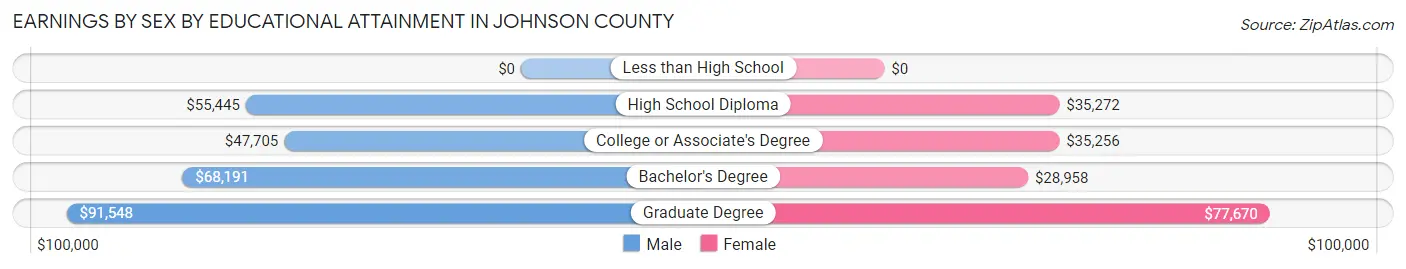
| Educational Attainment | Male Income | Female Income |
| Less than High School | - | - |
| High School Diploma | $55,445 | $35,272 |
| College or Associate's Degree | $47,705 | $35,256 |
| Bachelor's Degree | $68,191 | $28,958 |
| Graduate Degree | $91,548 | $77,670 |
| Total | $57,795 | $36,103 |
Family Income in Johnson County
Family Income Brackets in Johnson County
According to the Johnson County family income data, there are 599 families falling into the $100,000 to $149,999 income range, which is the most common income bracket and makes up 26.0% of all families. Conversely, the $10,000 to $14,999 income bracket is the least frequent group with only 35 families (1.5%) belonging to this category.
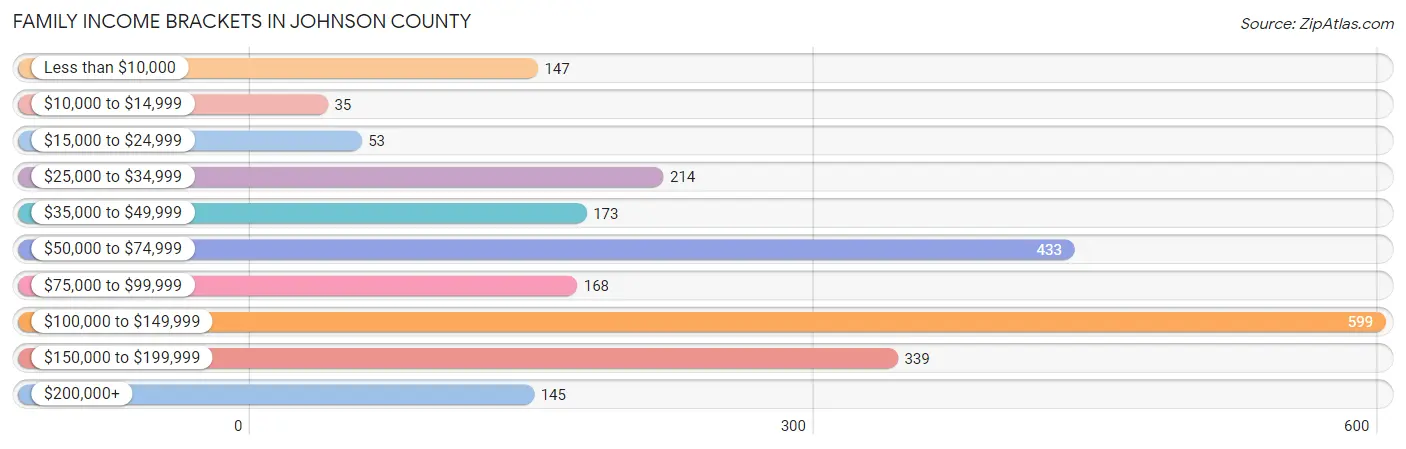
| Income Bracket | # Families | % Families |
| Less than $10,000 | 147 | 6.4% |
| $10,000 to $14,999 | 35 | 1.5% |
| $15,000 to $24,999 | 53 | 2.3% |
| $25,000 to $34,999 | 214 | 9.3% |
| $35,000 to $49,999 | 173 | 7.5% |
| $50,000 to $74,999 | 433 | 18.8% |
| $75,000 to $99,999 | 168 | 7.3% |
| $100,000 to $149,999 | 599 | 26.0% |
| $150,000 to $199,999 | 339 | 14.7% |
| $200,000+ | 145 | 6.3% |
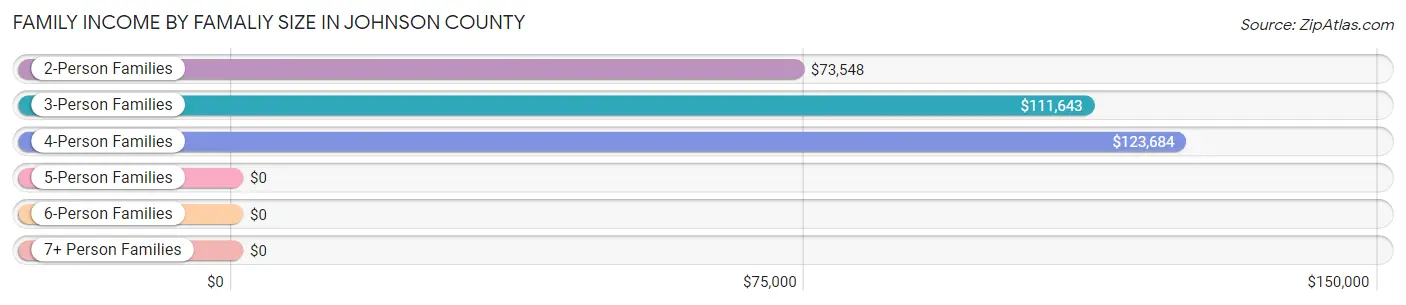
Family Income by Famaliy Size in Johnson County
4-person families (344 | 14.9%) account for the highest median family income in Johnson County with $123,684 per family, while 3-person families (294 | 12.8%) have the highest median income of $37,214 per family member.
| Income Bracket | # Families | Median Income |
| 2-Person Families | 1,345 (58.4%) | $73,548 |
| 3-Person Families | 294 (12.8%) | $111,643 |
| 4-Person Families | 344 (14.9%) | $123,684 |
| 5-Person Families | 227 (9.9%) | $0 |
| 6-Person Families | 79 (3.4%) | $0 |
| 7+ Person Families | 14 (0.6%) | $0 |
| Total | 2,303 (100.0%) | $89,837 |
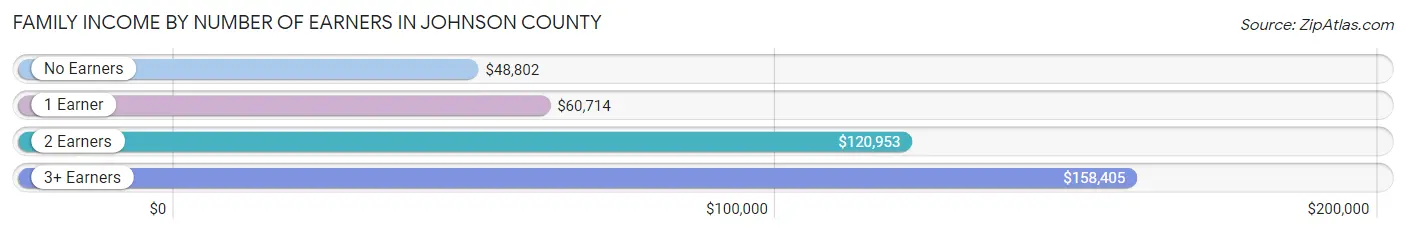
Family Income by Number of Earners in Johnson County
The median family income in Johnson County is $89,837, with families comprising 3+ earners (161) having the highest median family income of $158,405, while families with no earners (497) have the lowest median family income of $48,802, accounting for 7.0% and 21.6% of families, respectively.
| Number of Earners | # Families | Median Income |
| No Earners | 497 (21.6%) | $48,802 |
| 1 Earner | 510 (22.2%) | $60,714 |
| 2 Earners | 1,135 (49.3%) | $120,953 |
| 3+ Earners | 161 (7.0%) | $158,405 |
| Total | 2,303 (100.0%) | $89,837 |
Household Income in Johnson County
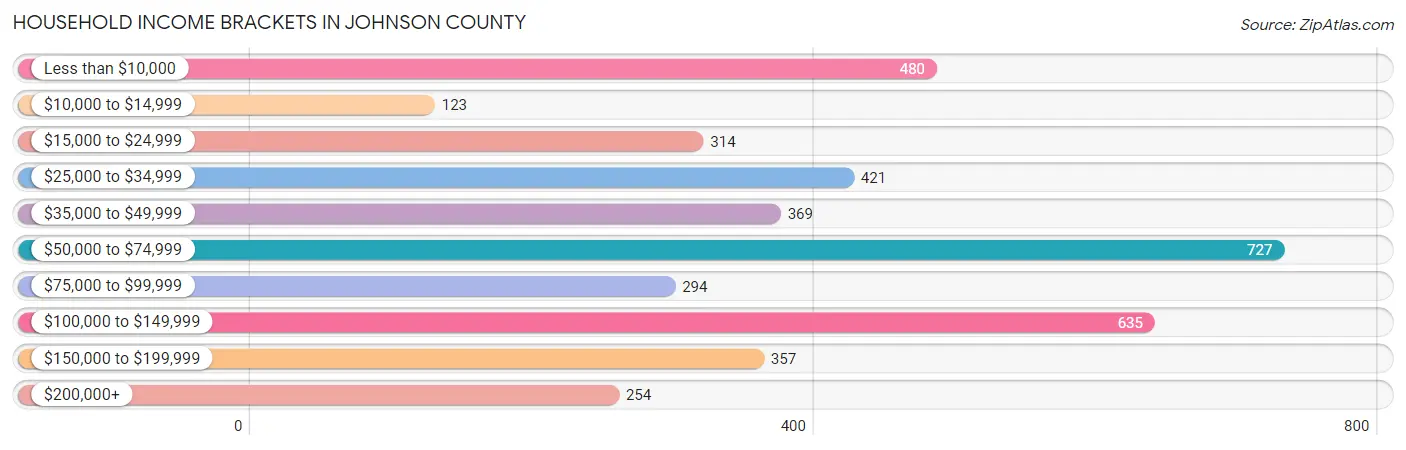
Household Income Brackets in Johnson County
With 727 households falling in the category, the $50,000 to $74,999 income range is the most frequent in Johnson County, accounting for 18.3% of all households. In contrast, only 123 households (3.1%) fall into the $10,000 to $14,999 income bracket, making it the least populous group.
| Income Bracket | # Households | % Households |
| Less than $10,000 | 480 | 12.1% |
| $10,000 to $14,999 | 123 | 3.1% |
| $15,000 to $24,999 | 314 | 7.9% |
| $25,000 to $34,999 | 421 | 10.6% |
| $35,000 to $49,999 | 369 | 9.3% |
| $50,000 to $74,999 | 727 | 18.3% |
| $75,000 to $99,999 | 294 | 7.4% |
| $100,000 to $149,999 | 635 | 16.0% |
| $150,000 to $199,999 | 357 | 9.0% |
| $200,000+ | 254 | 6.4% |
Household Income by Householder Age in Johnson County
The median household income in Johnson County is $60,667, with the highest median household income of $79,167 found in the 45 to 64 years age bracket for the primary householder. A total of 1,200 households (30.2%) fall into this category. Meanwhile, the 15 to 24 years age bracket for the primary householder has the lowest median household income of $0, with 337 households (8.5%) in this group.

| Income Bracket | # Households | Median Income |
| 15 to 24 Years | 337 (8.5%) | $0 |
| 25 to 44 Years | 986 (24.8%) | $59,110 |
| 45 to 64 Years | 1,200 (30.2%) | $79,167 |
| 65+ Years | 1,448 (36.5%) | $60,440 |
| Total | 3,971 (100.0%) | $60,667 |
Poverty in Johnson County
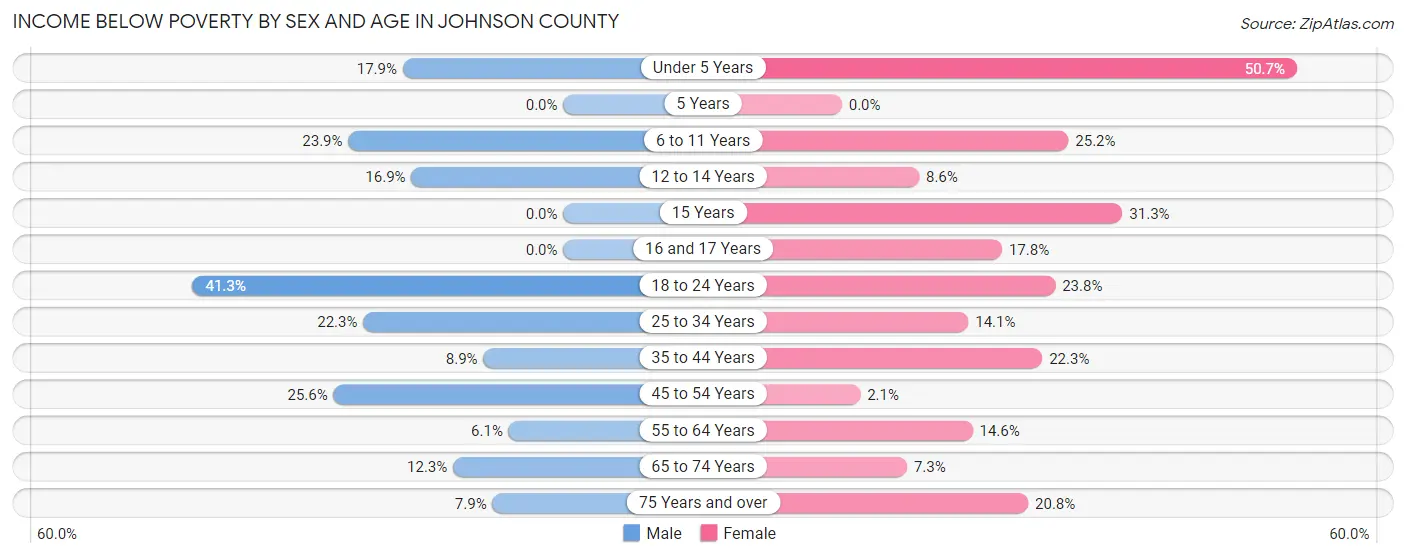
Income Below Poverty by Sex and Age in Johnson County
With 16.5% poverty level for males and 16.9% for females among the residents of Johnson County, 18 to 24 year old males and under 5 year old females are the most vulnerable to poverty, with 166 males (41.3%) and 113 females (50.7%) in their respective age groups living below the poverty level.
| Age Bracket | Male | Female |
| Under 5 Years | 27 (17.9%) | 113 (50.7%) |
| 5 Years | 0 (0.0%) | 0 (0.0%) |
| 6 to 11 Years | 85 (23.9%) | 81 (25.2%) |
| 12 to 14 Years | 22 (16.9%) | 8 (8.6%) |
| 15 Years | 0 (0.0%) | 10 (31.2%) |
| 16 and 17 Years | 0 (0.0%) | 33 (17.8%) |
| 18 to 24 Years | 166 (41.3%) | 29 (23.8%) |
| 25 to 34 Years | 88 (22.3%) | 52 (14.1%) |
| 35 to 44 Years | 51 (8.9%) | 131 (22.3%) |
| 45 to 54 Years | 120 (25.6%) | 9 (2.1%) |
| 55 to 64 Years | 37 (6.1%) | 91 (14.6%) |
| 65 to 74 Years | 84 (12.3%) | 45 (7.3%) |
| 75 Years and over | 36 (7.9%) | 83 (20.7%) |
| Total | 716 (16.5%) | 685 (16.9%) |
Income Above Poverty by Sex and Age in Johnson County
According to the poverty statistics in Johnson County, males aged 5 years and females aged 5 years are the age groups that are most secure financially, with 100.0% of males and 100.0% of females in these age groups living above the poverty line.
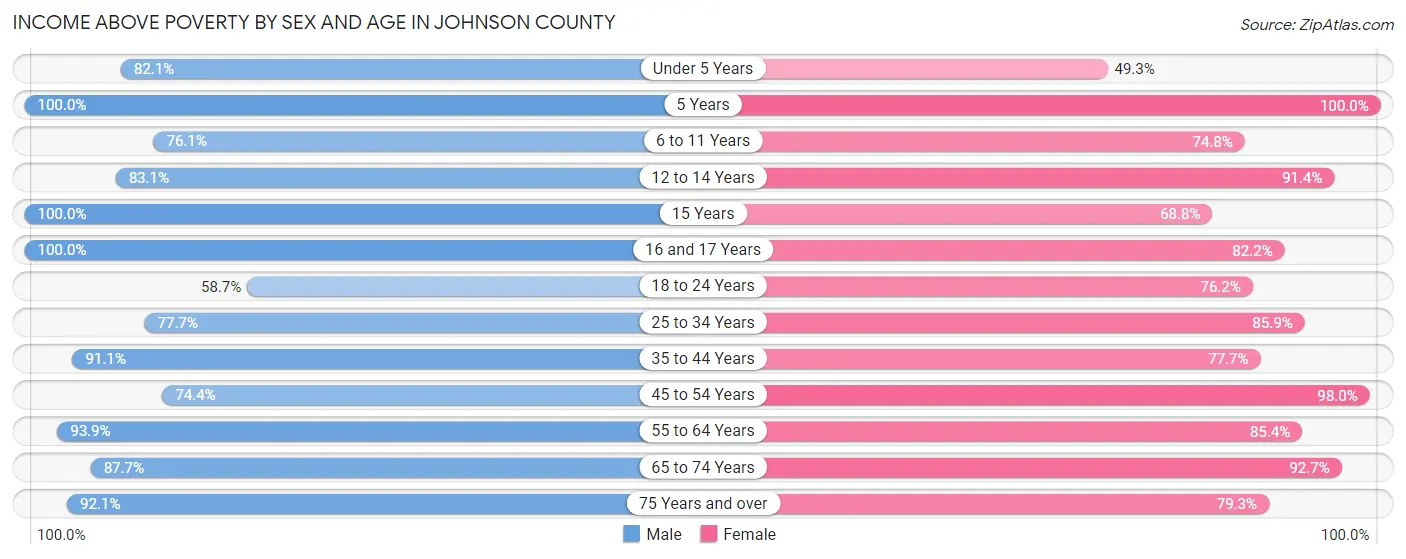
| Age Bracket | Male | Female |
| Under 5 Years | 124 (82.1%) | 110 (49.3%) |
| 5 Years | 46 (100.0%) | 50 (100.0%) |
| 6 to 11 Years | 270 (76.1%) | 240 (74.8%) |
| 12 to 14 Years | 108 (83.1%) | 85 (91.4%) |
| 15 Years | 27 (100.0%) | 22 (68.8%) |
| 16 and 17 Years | 44 (100.0%) | 152 (82.2%) |
| 18 to 24 Years | 236 (58.7%) | 93 (76.2%) |
| 25 to 34 Years | 307 (77.7%) | 317 (85.9%) |
| 35 to 44 Years | 522 (91.1%) | 456 (77.7%) |
| 45 to 54 Years | 349 (74.4%) | 430 (98.0%) |
| 55 to 64 Years | 572 (93.9%) | 534 (85.4%) |
| 65 to 74 Years | 600 (87.7%) | 575 (92.7%) |
| 75 Years and over | 420 (92.1%) | 317 (79.2%) |
| Total | 3,625 (83.5%) | 3,381 (83.2%) |
Income Below Poverty Among Married-Couple Families in Johnson County
The poverty statistics for married-couple families in Johnson County show that 8.9% or 184 of the total 2,065 families live below the poverty line. Families with 5 or more children have the highest poverty rate of 100.0%, comprising of 14 families. On the other hand, families with no children have the lowest poverty rate of 5.0%, which includes 67 families.
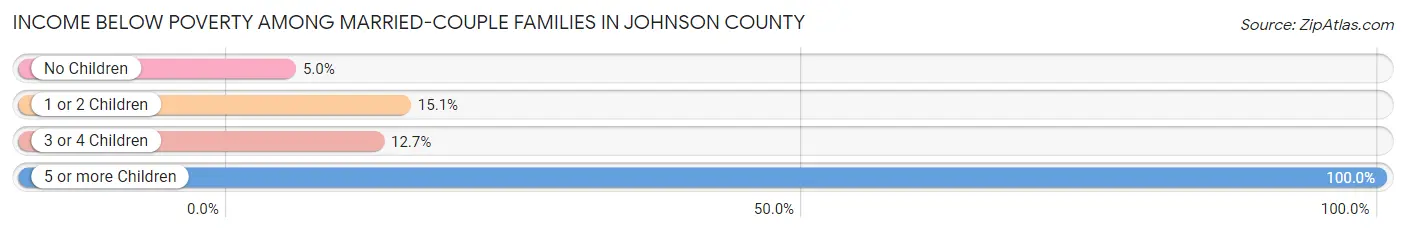
| Children | Above Poverty | Below Poverty |
| No Children | 1,263 (95.0%) | 67 (5.0%) |
| 1 or 2 Children | 412 (85.0%) | 73 (15.0%) |
| 3 or 4 Children | 206 (87.3%) | 30 (12.7%) |
| 5 or more Children | 0 (0.0%) | 14 (100.0%) |
| Total | 1,881 (91.1%) | 184 (8.9%) |
Income Below Poverty Among Single-Parent Households in Johnson County
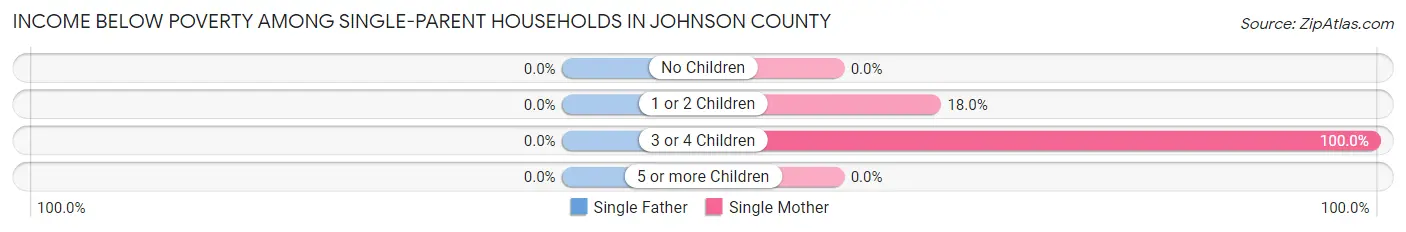
| Children | Single Father | Single Mother |
| No Children | 0 (0.0%) | 0 (0.0%) |
| 1 or 2 Children | 0 (0.0%) | 11 (18.0%) |
| 3 or 4 Children | 0 (0.0%) | 62 (100.0%) |
| 5 or more Children | 0 (0.0%) | 0 (0.0%) |
| Total | 0 (0.0%) | 73 (34.6%) |
Income Below Poverty Among Married-Couple vs Single-Parent Households in Johnson County
The poverty data for Johnson County shows that 184 of the married-couple family households (8.9%) and 73 of the single-parent households (30.7%) are living below the poverty level. Within the married-couple family households, those with 5 or more children have the highest poverty rate, with 14 households (100.0%) falling below the poverty line. Among the single-parent households, those with 3 or 4 children have the highest poverty rate, with 62 household (100.0%) living below poverty.
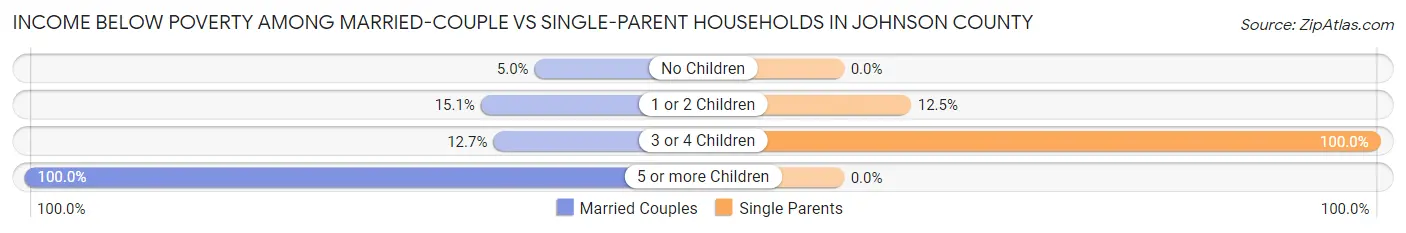
| Children | Married-Couple Families | Single-Parent Households |
| No Children | 67 (5.0%) | 0 (0.0%) |
| 1 or 2 Children | 73 (15.0%) | 11 (12.5%) |
| 3 or 4 Children | 30 (12.7%) | 62 (100.0%) |
| 5 or more Children | 14 (100.0%) | 0 (0.0%) |
| Total | 184 (8.9%) | 73 (30.7%) |
Employment Characteristics in Johnson County
Employment by Class of Employer in Johnson County
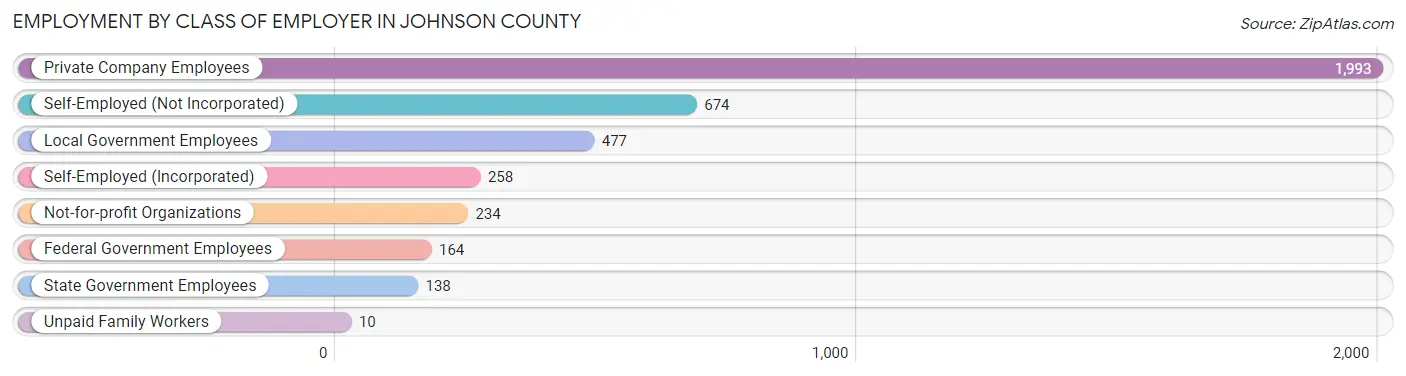
Among the 3,948 employed individuals in Johnson County, private company employees (1,993 | 50.5%), self-employed (not incorporated) (674 | 17.1%), and local government employees (477 | 12.1%) make up the most common classes of employment.
| Employer Class | # Employees | % Employees |
| Private Company Employees | 1,993 | 50.5% |
| Self-Employed (Incorporated) | 258 | 6.5% |
| Self-Employed (Not Incorporated) | 674 | 17.1% |
| Not-for-profit Organizations | 234 | 5.9% |
| Local Government Employees | 477 | 12.1% |
| State Government Employees | 138 | 3.5% |
| Federal Government Employees | 164 | 4.2% |
| Unpaid Family Workers | 10 | 0.3% |
| Total | 3,948 | 100.0% |
Employment Status by Age in Johnson County
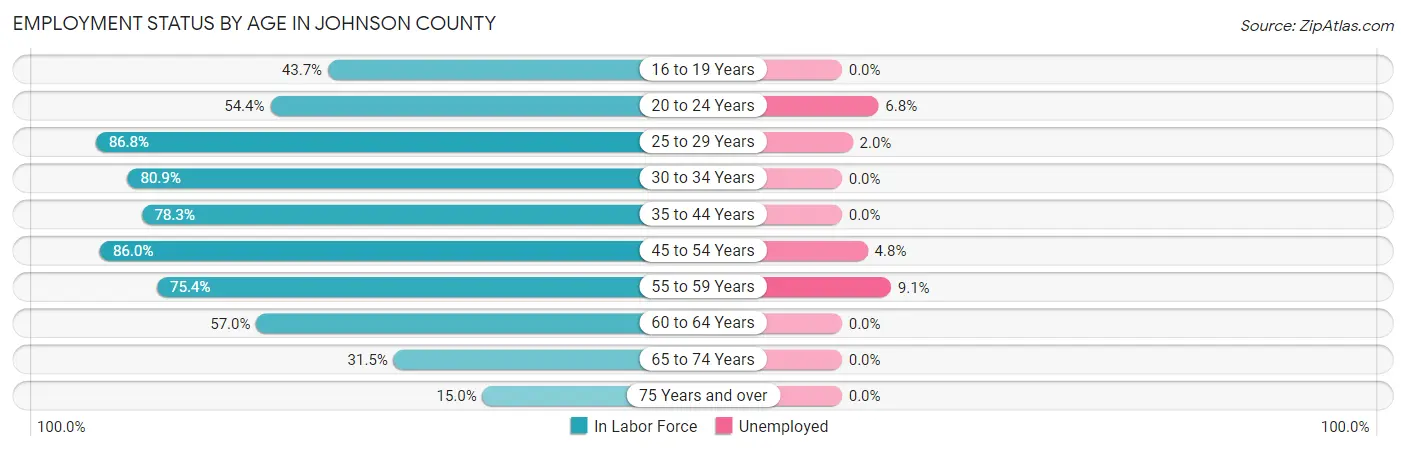
According to the labor force statistics for Johnson County, out of the total population over 16 years of age (7,108), 57.6% or 4,094 individuals are in the labor force, with 2.3% or 94 of them unemployed. The age group with the highest labor force participation rate is 25 to 29 years, with 86.8% or 407 individuals in the labor force. Within the labor force, the 55 to 59 years age range has the highest percentage of unemployed individuals, with 9.1% or 35 of them being unemployed.
| Age Bracket | In Labor Force | Unemployed |
| 16 to 19 Years | 160 (43.7%) | 0 (0.0%) |
| 20 to 24 Years | 221 (54.4%) | 15 (6.8%) |
| 25 to 29 Years | 407 (86.8%) | 8 (2.0%) |
| 30 to 34 Years | 250 (80.9%) | 0 (0.0%) |
| 35 to 44 Years | 915 (78.3%) | 0 (0.0%) |
| 45 to 54 Years | 785 (86.0%) | 38 (4.8%) |
| 55 to 59 Years | 386 (75.4%) | 35 (9.1%) |
| 60 to 64 Years | 415 (57.0%) | 0 (0.0%) |
| 65 to 74 Years | 425 (31.5%) | 0 (0.0%) |
| 75 Years and over | 133 (15.0%) | 0 (0.0%) |
| Total | 4,094 (57.6%) | 94 (2.3%) |
Employment Status by Educational Attainment in Johnson County
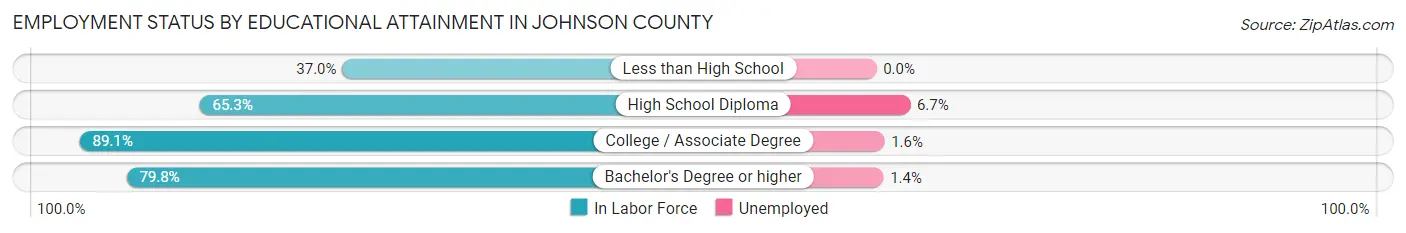
According to labor force statistics for Johnson County, 77.0% of individuals (3,157) out of the total population between 25 and 64 years of age (4,100) are in the labor force, with 2.6% or 82 of them being unemployed. The group with the highest labor force participation rate are those with the educational attainment of college / associate degree, with 89.1% or 1,277 individuals in the labor force. Within the labor force, individuals with high school diploma education have the highest percentage of unemployment, with 6.7% or 46 of them being unemployed.
| Educational Attainment | In Labor Force | Unemployed |
| Less than High School | 81 (37.0%) | 0 (0.0%) |
| High School Diploma | 690 (65.3%) | 71 (6.7%) |
| College / Associate Degree | 1,277 (89.1%) | 23 (1.6%) |
| Bachelor's Degree or higher | 1,110 (79.8%) | 19 (1.4%) |
| Total | 3,157 (77.0%) | 107 (2.6%) |
Employment Occupations by Sex in Johnson County
Management, Business, Science and Arts Occupations
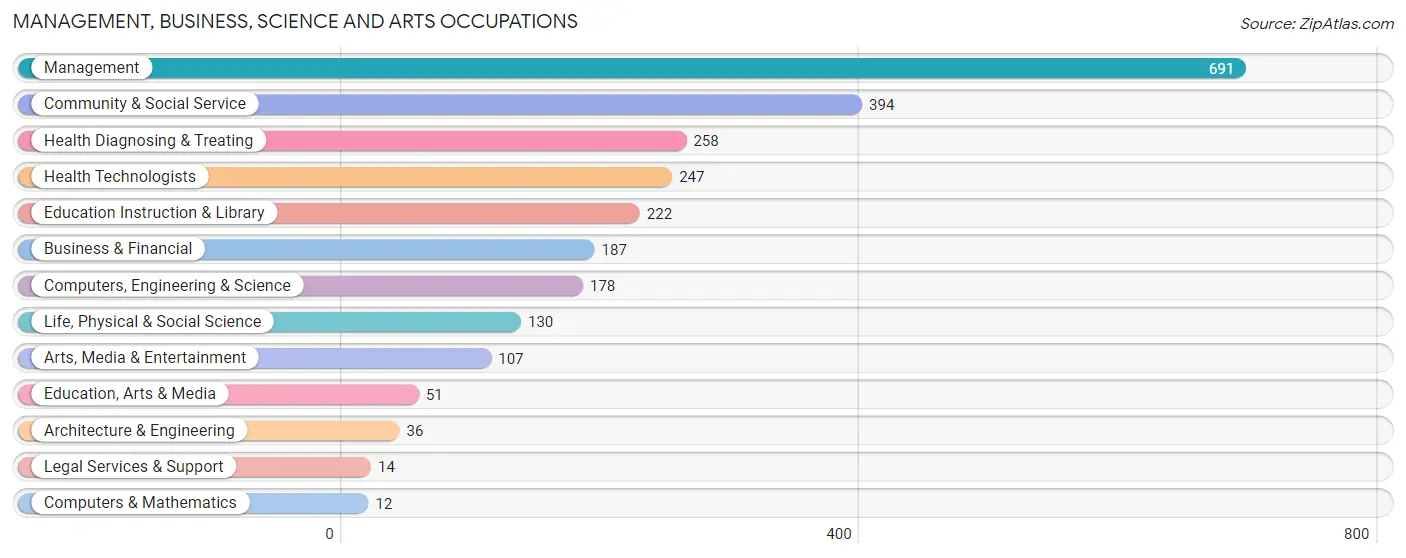
The most common Management, Business, Science and Arts occupations in Johnson County are Management (691 | 17.3%), Community & Social Service (394 | 9.9%), Health Diagnosing & Treating (258 | 6.5%), Health Technologists (247 | 6.2%), and Education Instruction & Library (222 | 5.6%).
Management, Business, Science and Arts Occupations by Sex
Within the Management, Business, Science and Arts occupations in Johnson County, the most male-oriented occupations are Architecture & Engineering (100.0%), Arts, Media & Entertainment (75.7%), and Business & Financial (58.8%), while the most female-oriented occupations are Computers & Mathematics (100.0%), Legal Services & Support (100.0%), and Health Diagnosing & Treating (78.7%).
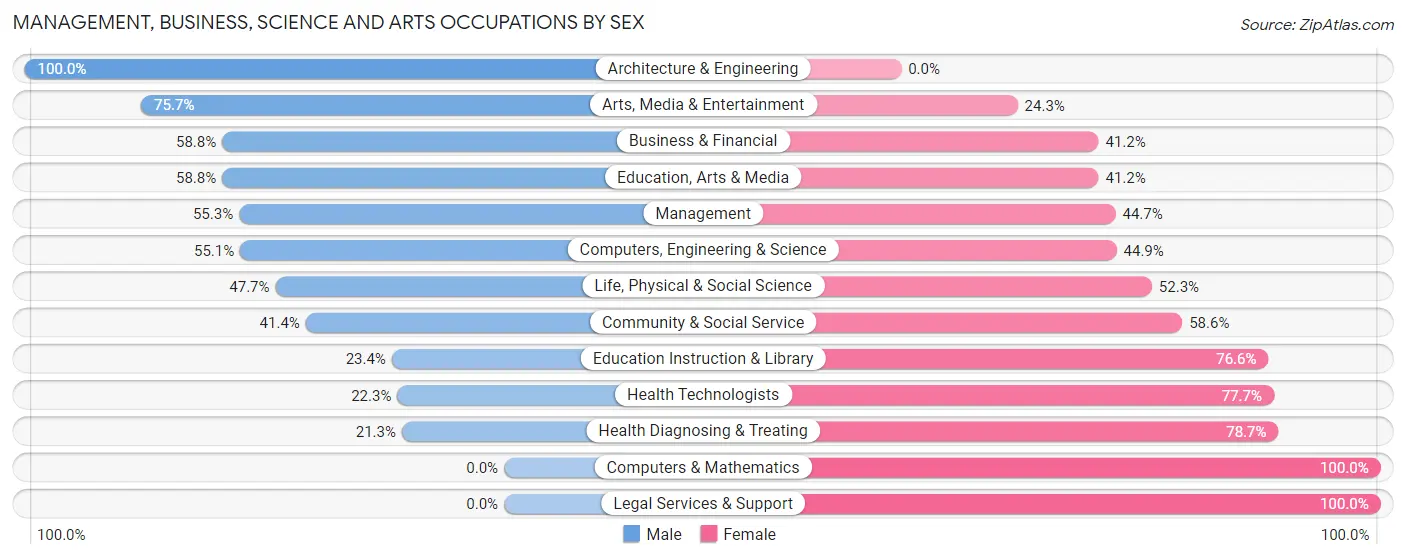
| Occupation | Male | Female |
| Management | 382 (55.3%) | 309 (44.7%) |
| Business & Financial | 110 (58.8%) | 77 (41.2%) |
| Computers, Engineering & Science | 98 (55.1%) | 80 (44.9%) |
| Computers & Mathematics | 0 (0.0%) | 12 (100.0%) |
| Architecture & Engineering | 36 (100.0%) | 0 (0.0%) |
| Life, Physical & Social Science | 62 (47.7%) | 68 (52.3%) |
| Community & Social Service | 163 (41.4%) | 231 (58.6%) |
| Education, Arts & Media | 30 (58.8%) | 21 (41.2%) |
| Legal Services & Support | 0 (0.0%) | 14 (100.0%) |
| Education Instruction & Library | 52 (23.4%) | 170 (76.6%) |
| Arts, Media & Entertainment | 81 (75.7%) | 26 (24.3%) |
| Health Diagnosing & Treating | 55 (21.3%) | 203 (78.7%) |
| Health Technologists | 55 (22.3%) | 192 (77.7%) |
| Total (Category) | 808 (47.3%) | 900 (52.7%) |
| Total (Overall) | 2,094 (52.3%) | 1,907 (47.7%) |
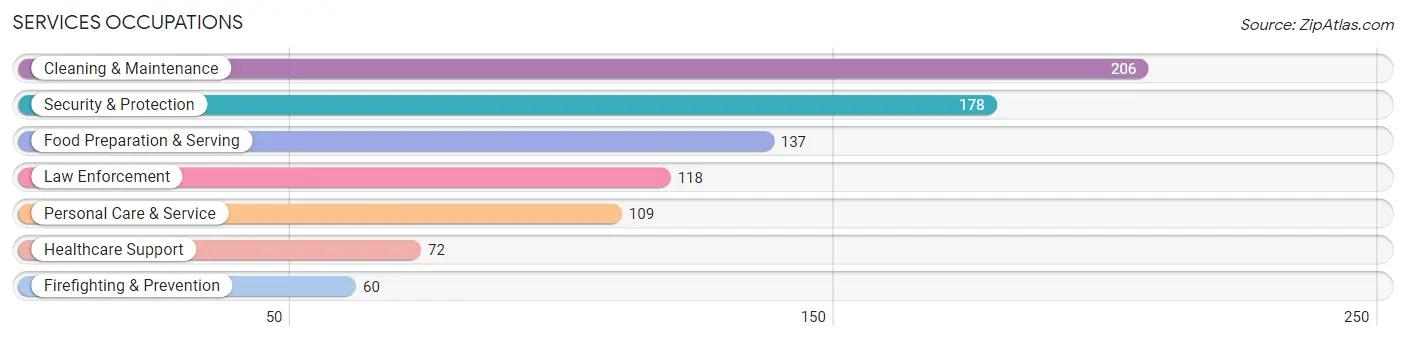
Services Occupations
The most common Services occupations in Johnson County are Cleaning & Maintenance (206 | 5.1%), Security & Protection (178 | 4.4%), Food Preparation & Serving (137 | 3.4%), Law Enforcement (118 | 2.9%), and Personal Care & Service (109 | 2.7%).
Services Occupations by Sex
Within the Services occupations in Johnson County, the most male-oriented occupations are Law Enforcement (100.0%), Security & Protection (87.6%), and Cleaning & Maintenance (76.7%), while the most female-oriented occupations are Healthcare Support (100.0%), Personal Care & Service (85.3%), and Food Preparation & Serving (55.5%).
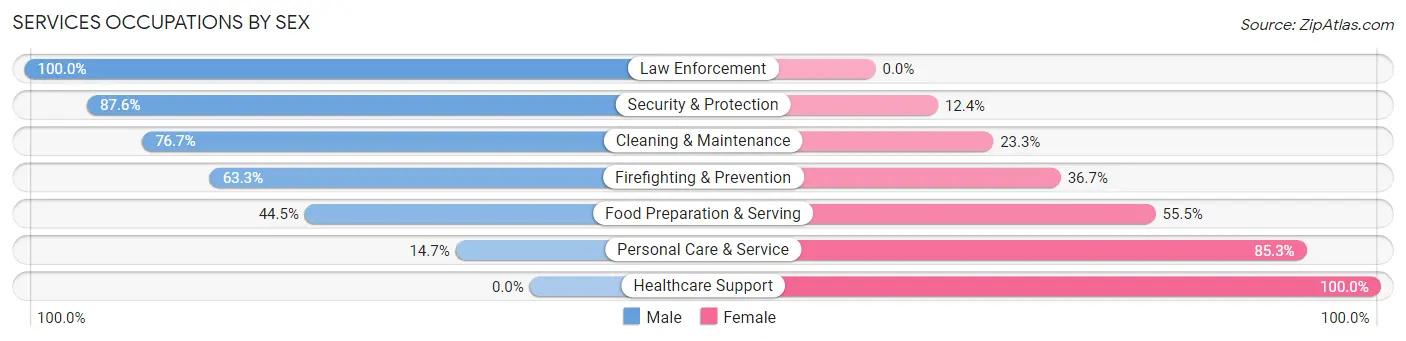
| Occupation | Male | Female |
| Healthcare Support | 0 (0.0%) | 72 (100.0%) |
| Security & Protection | 156 (87.6%) | 22 (12.4%) |
| Firefighting & Prevention | 38 (63.3%) | 22 (36.7%) |
| Law Enforcement | 118 (100.0%) | 0 (0.0%) |
| Food Preparation & Serving | 61 (44.5%) | 76 (55.5%) |
| Cleaning & Maintenance | 158 (76.7%) | 48 (23.3%) |
| Personal Care & Service | 16 (14.7%) | 93 (85.3%) |
| Total (Category) | 391 (55.7%) | 311 (44.3%) |
| Total (Overall) | 2,094 (52.3%) | 1,907 (47.7%) |
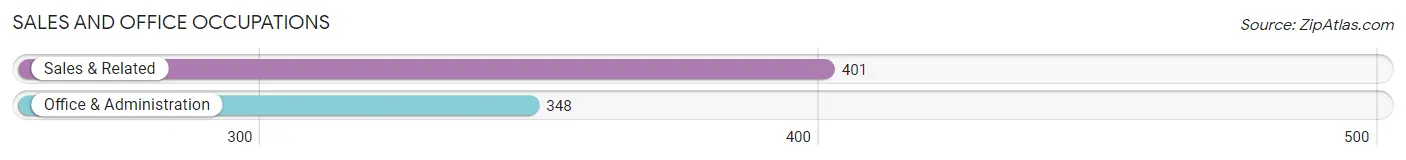
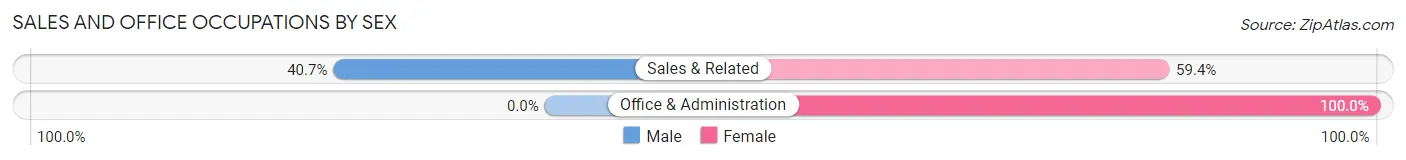
Sales and Office Occupations
The most common Sales and Office occupations in Johnson County are Sales & Related (401 | 10.0%), and Office & Administration (348 | 8.7%).
Sales and Office Occupations by Sex
| Occupation | Male | Female |
| Sales & Related | 163 (40.6%) | 238 (59.4%) |
| Office & Administration | 0 (0.0%) | 348 (100.0%) |
| Total (Category) | 163 (21.8%) | 586 (78.2%) |
| Total (Overall) | 2,094 (52.3%) | 1,907 (47.7%) |
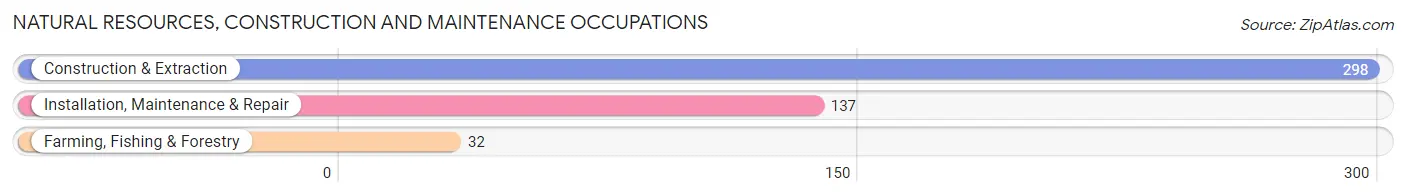
Natural Resources, Construction and Maintenance Occupations
The most common Natural Resources, Construction and Maintenance occupations in Johnson County are Construction & Extraction (298 | 7.4%), Installation, Maintenance & Repair (137 | 3.4%), and Farming, Fishing & Forestry (32 | 0.8%).
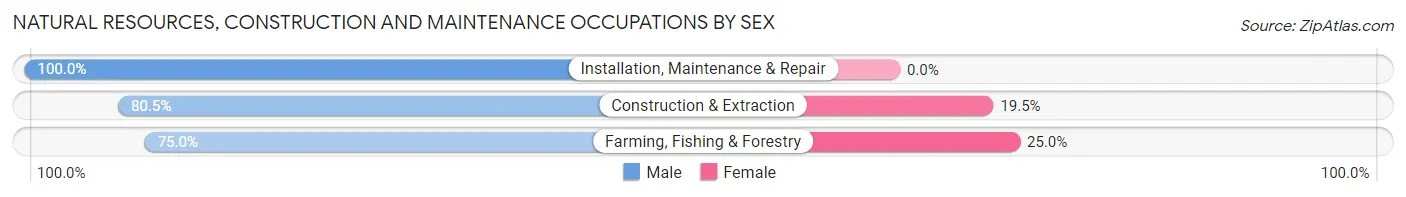
Natural Resources, Construction and Maintenance Occupations by Sex
| Occupation | Male | Female |
| Farming, Fishing & Forestry | 24 (75.0%) | 8 (25.0%) |
| Construction & Extraction | 240 (80.5%) | 58 (19.5%) |
| Installation, Maintenance & Repair | 137 (100.0%) | 0 (0.0%) |
| Total (Category) | 401 (85.9%) | 66 (14.1%) |
| Total (Overall) | 2,094 (52.3%) | 1,907 (47.7%) |
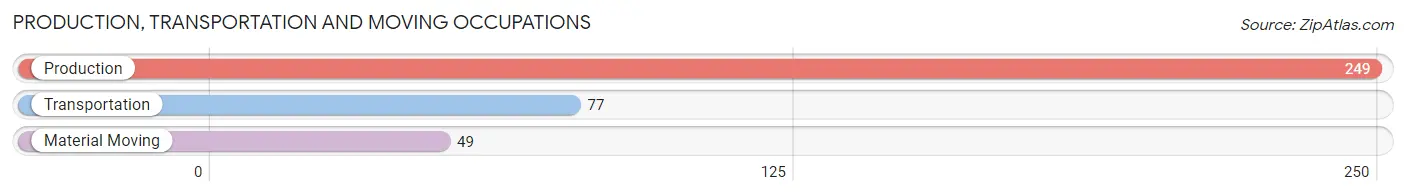
Production, Transportation and Moving Occupations
The most common Production, Transportation and Moving occupations in Johnson County are Production (249 | 6.2%), Transportation (77 | 1.9%), and Material Moving (49 | 1.2%).
Production, Transportation and Moving Occupations by Sex

| Occupation | Male | Female |
| Production | 206 (82.7%) | 43 (17.3%) |
| Transportation | 77 (100.0%) | 0 (0.0%) |
| Material Moving | 48 (98.0%) | 1 (2.0%) |
| Total (Category) | 331 (88.3%) | 44 (11.7%) |
| Total (Overall) | 2,094 (52.3%) | 1,907 (47.7%) |
Employment Industries by Sex in Johnson County
Employment Industries in Johnson County
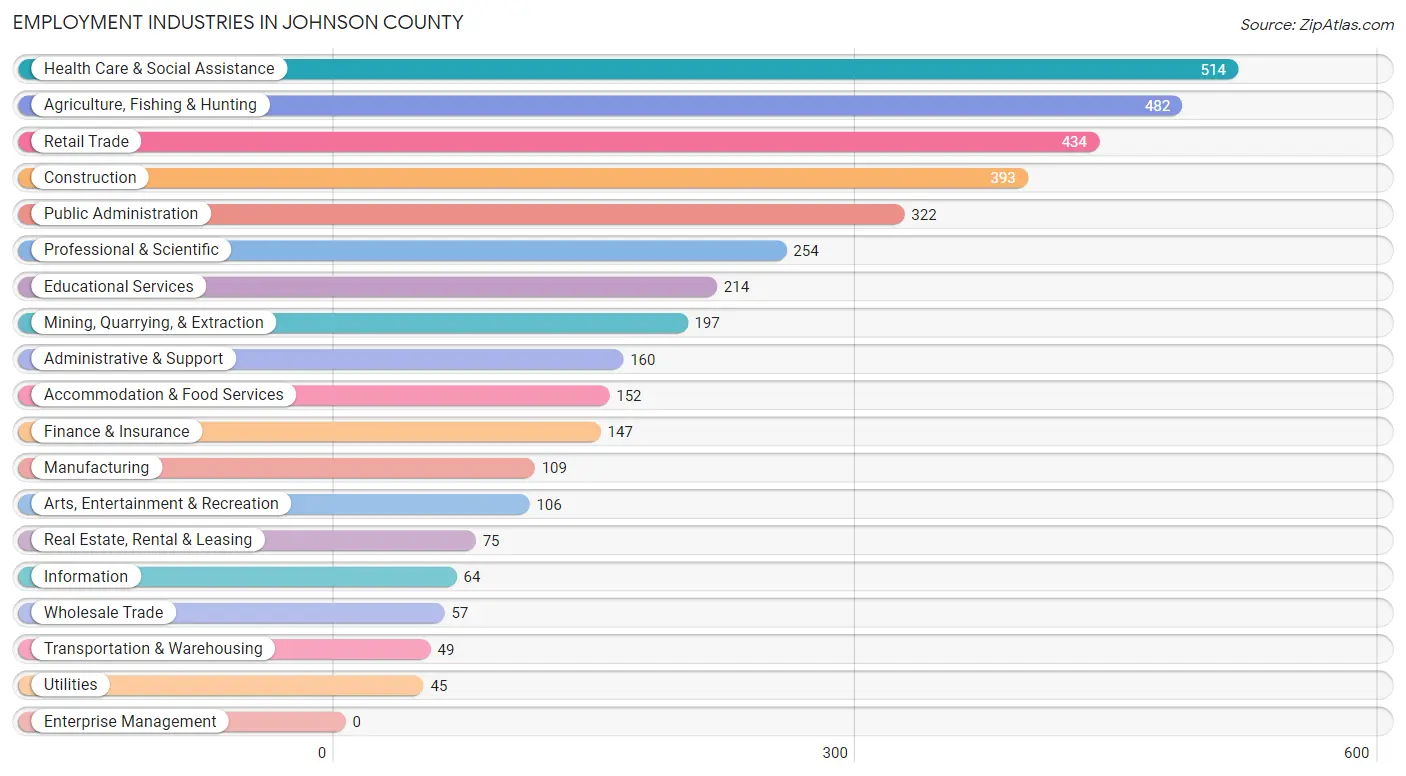
The major employment industries in Johnson County include Health Care & Social Assistance (514 | 12.9%), Agriculture, Fishing & Hunting (482 | 12.0%), Retail Trade (434 | 10.8%), Construction (393 | 9.8%), and Public Administration (322 | 8.1%).
Employment Industries by Sex in Johnson County
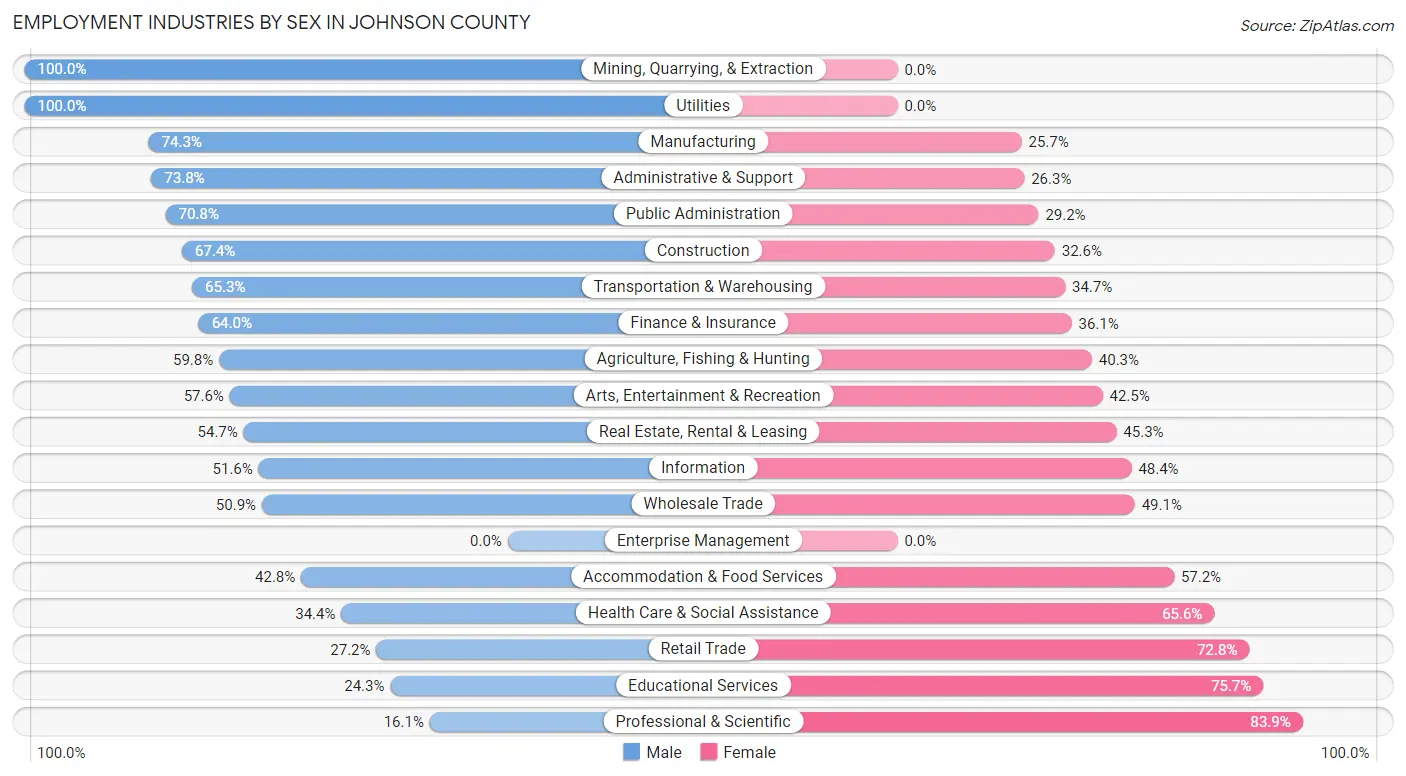
The Johnson County industries that see more men than women are Mining, Quarrying, & Extraction (100.0%), Utilities (100.0%), and Manufacturing (74.3%), whereas the industries that tend to have a higher number of women are Professional & Scientific (83.9%), Educational Services (75.7%), and Retail Trade (72.8%).
| Industry | Male | Female |
| Agriculture, Fishing & Hunting | 288 (59.8%) | 194 (40.3%) |
| Mining, Quarrying, & Extraction | 197 (100.0%) | 0 (0.0%) |
| Construction | 265 (67.4%) | 128 (32.6%) |
| Manufacturing | 81 (74.3%) | 28 (25.7%) |
| Wholesale Trade | 29 (50.9%) | 28 (49.1%) |
| Retail Trade | 118 (27.2%) | 316 (72.8%) |
| Transportation & Warehousing | 32 (65.3%) | 17 (34.7%) |
| Utilities | 45 (100.0%) | 0 (0.0%) |
| Information | 33 (51.6%) | 31 (48.4%) |
| Finance & Insurance | 94 (63.9%) | 53 (36.0%) |
| Real Estate, Rental & Leasing | 41 (54.7%) | 34 (45.3%) |
| Professional & Scientific | 41 (16.1%) | 213 (83.9%) |
| Enterprise Management | 0 (0.0%) | 0 (0.0%) |
| Administrative & Support | 118 (73.8%) | 42 (26.3%) |
| Educational Services | 52 (24.3%) | 162 (75.7%) |
| Health Care & Social Assistance | 177 (34.4%) | 337 (65.6%) |
| Arts, Entertainment & Recreation | 61 (57.6%) | 45 (42.4%) |
| Accommodation & Food Services | 65 (42.8%) | 87 (57.2%) |
| Public Administration | 228 (70.8%) | 94 (29.2%) |
| Total | 2,094 (52.3%) | 1,907 (47.7%) |
Education in Johnson County
School Enrollment in Johnson County
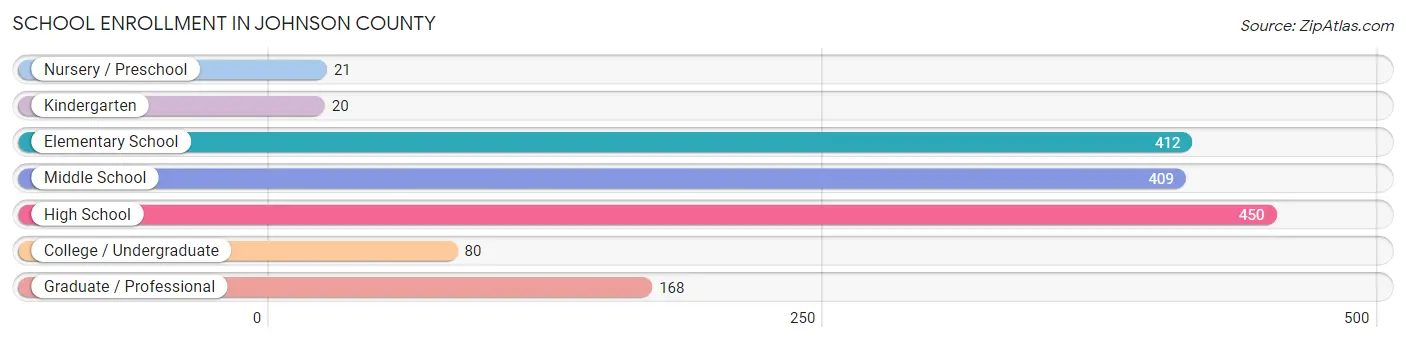
The most common levels of schooling among the 1,560 students in Johnson County are high school (450 | 28.8%), elementary school (412 | 26.4%), and middle school (409 | 26.2%).
| School Level | # Students | % Students |
| Nursery / Preschool | 21 | 1.3% |
| Kindergarten | 20 | 1.3% |
| Elementary School | 412 | 26.4% |
| Middle School | 409 | 26.2% |
| High School | 450 | 28.8% |
| College / Undergraduate | 80 | 5.1% |
| Graduate / Professional | 168 | 10.8% |
| Total | 1,560 | 100.0% |
School Enrollment by Age by Funding Source in Johnson County
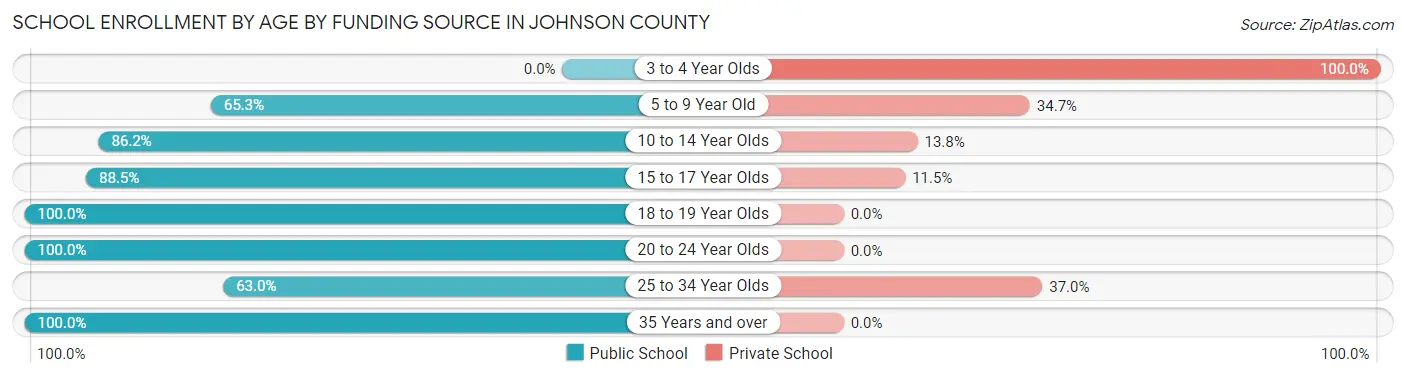
Out of a total of 1,560 students who are enrolled in schools in Johnson County, 279 (17.9%) attend a private institution, while the remaining 1,281 (82.1%) are enrolled in public schools. The age group of 3 to 4 year olds has the highest likelihood of being enrolled in private schools, with 6 (100.0% in the age bracket) enrolled. Conversely, the age group of 18 to 19 year olds has the lowest likelihood of being enrolled in a private school, with 137 (100.0% in the age bracket) attending a public institution.
| Age Bracket | Public School | Private School |
| 3 to 4 Year Olds | 0 (0.0%) | 6 (100.0%) |
| 5 to 9 Year Old | 256 (65.3%) | 136 (34.7%) |
| 10 to 14 Year Olds | 420 (86.2%) | 67 (13.8%) |
| 15 to 17 Year Olds | 255 (88.5%) | 33 (11.5%) |
| 18 to 19 Year Olds | 137 (100.0%) | 0 (0.0%) |
| 20 to 24 Year Olds | 55 (100.0%) | 0 (0.0%) |
| 25 to 34 Year Olds | 63 (63.0%) | 37 (37.0%) |
| 35 Years and over | 95 (100.0%) | 0 (0.0%) |
| Total | 1,281 (82.1%) | 279 (17.9%) |
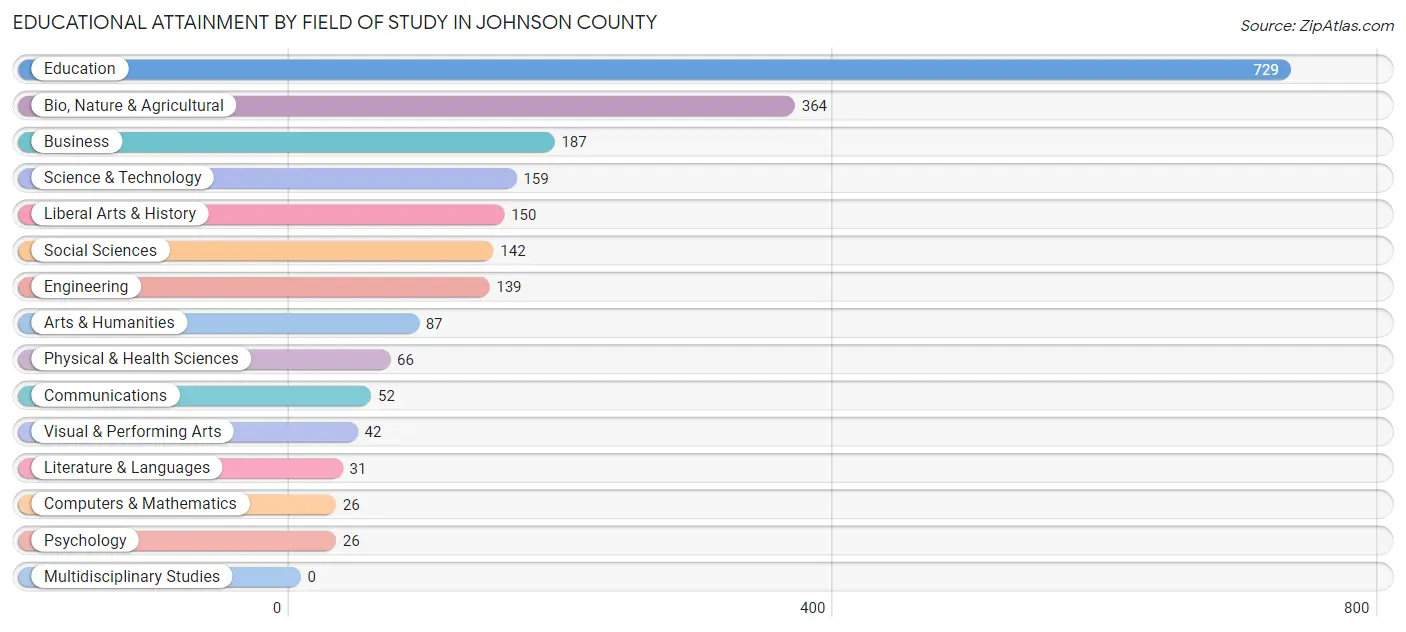
Educational Attainment by Field of Study in Johnson County
Education (729 | 33.1%), bio, nature & agricultural (364 | 16.6%), business (187 | 8.5%), science & technology (159 | 7.2%), and liberal arts & history (150 | 6.8%) are the most common fields of study among 2,200 individuals in Johnson County who have obtained a bachelor's degree or higher.
| Field of Study | # Graduates | % Graduates |
| Computers & Mathematics | 26 | 1.2% |
| Bio, Nature & Agricultural | 364 | 16.6% |
| Physical & Health Sciences | 66 | 3.0% |
| Psychology | 26 | 1.2% |
| Social Sciences | 142 | 6.5% |
| Engineering | 139 | 6.3% |
| Multidisciplinary Studies | 0 | 0.0% |
| Science & Technology | 159 | 7.2% |
| Business | 187 | 8.5% |
| Education | 729 | 33.1% |
| Literature & Languages | 31 | 1.4% |
| Liberal Arts & History | 150 | 6.8% |
| Visual & Performing Arts | 42 | 1.9% |
| Communications | 52 | 2.4% |
| Arts & Humanities | 87 | 4.0% |
| Total | 2,200 | 100.0% |
Transportation & Commute in Johnson County
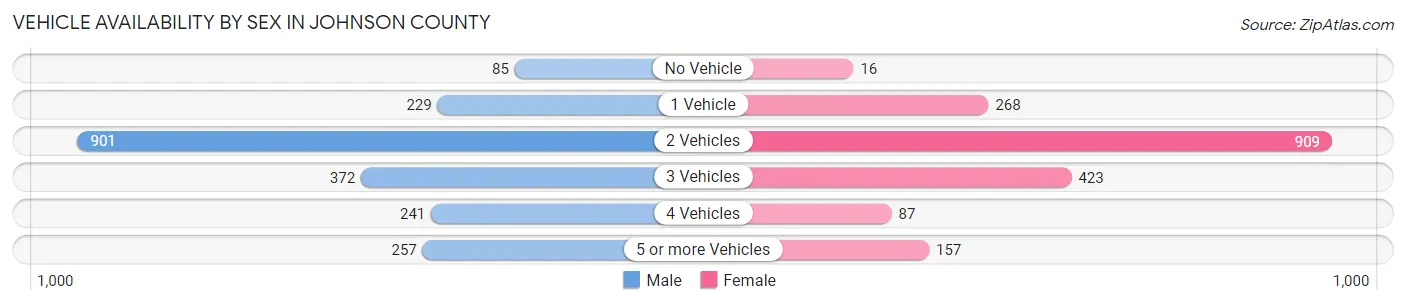
Vehicle Availability by Sex in Johnson County
The most prevalent vehicle ownership categories in Johnson County are males with 2 vehicles (901, accounting for 43.2%) and females with 2 vehicles (909, making up 48.4%).
| Vehicles Available | Male | Female |
| No Vehicle | 85 (4.1%) | 16 (0.9%) |
| 1 Vehicle | 229 (11.0%) | 268 (14.4%) |
| 2 Vehicles | 901 (43.2%) | 909 (48.9%) |
| 3 Vehicles | 372 (17.8%) | 423 (22.7%) |
| 4 Vehicles | 241 (11.6%) | 87 (4.7%) |
| 5 or more Vehicles | 257 (12.3%) | 157 (8.4%) |
| Total | 2,085 (100.0%) | 1,860 (100.0%) |
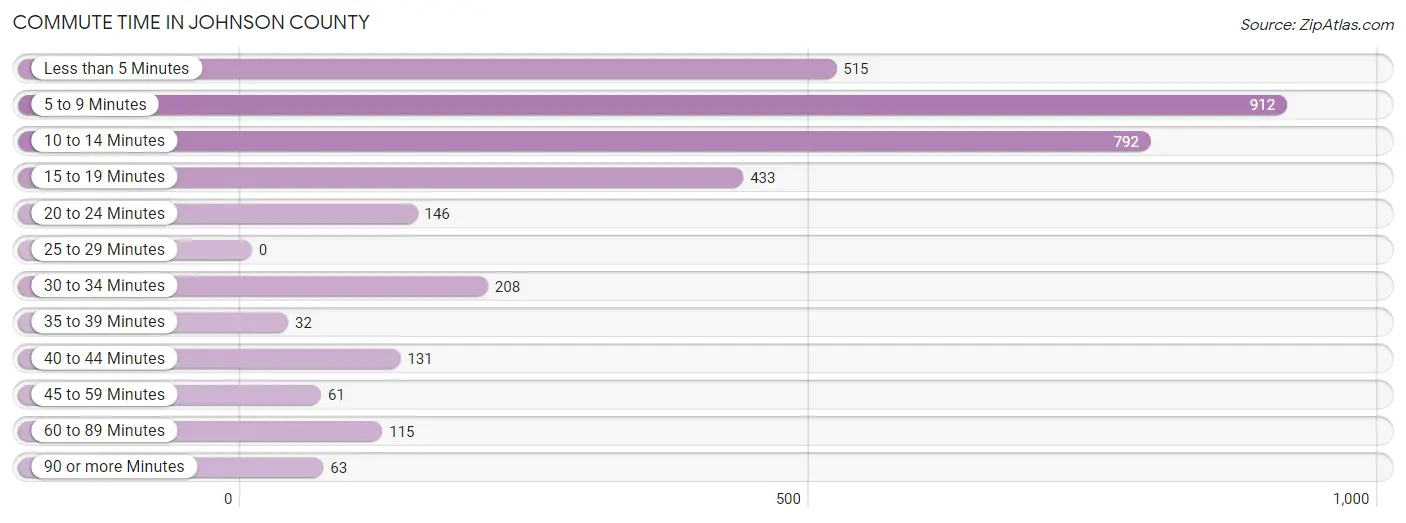
Commute Time in Johnson County
The most frequently occuring commute durations in Johnson County are 5 to 9 minutes (912 commuters, 26.8%), 10 to 14 minutes (792 commuters, 23.2%), and less than 5 minutes (515 commuters, 15.1%).
| Commute Time | # Commuters | % Commuters |
| Less than 5 Minutes | 515 | 15.1% |
| 5 to 9 Minutes | 912 | 26.8% |
| 10 to 14 Minutes | 792 | 23.2% |
| 15 to 19 Minutes | 433 | 12.7% |
| 20 to 24 Minutes | 146 | 4.3% |
| 25 to 29 Minutes | 0 | 0.0% |
| 30 to 34 Minutes | 208 | 6.1% |
| 35 to 39 Minutes | 32 | 0.9% |
| 40 to 44 Minutes | 131 | 3.8% |
| 45 to 59 Minutes | 61 | 1.8% |
| 60 to 89 Minutes | 115 | 3.4% |
| 90 or more Minutes | 63 | 1.8% |
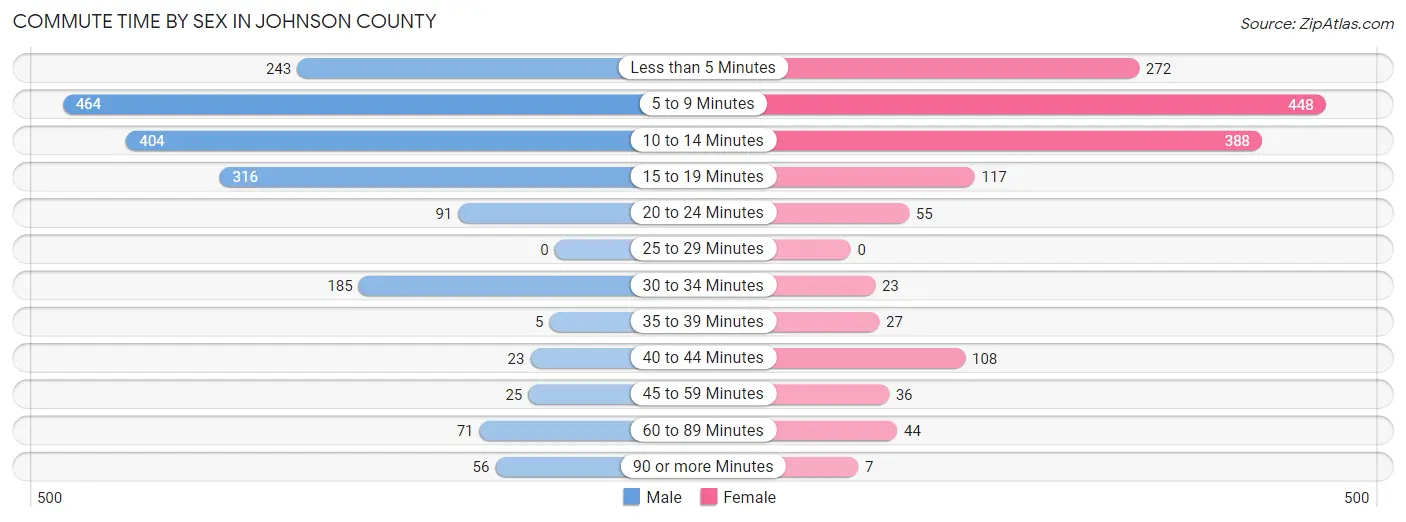
Commute Time by Sex in Johnson County
The most common commute times in Johnson County are 5 to 9 minutes (464 commuters, 24.6%) for males and 5 to 9 minutes (448 commuters, 29.4%) for females.
| Commute Time | Male | Female |
| Less than 5 Minutes | 243 (12.9%) | 272 (17.8%) |
| 5 to 9 Minutes | 464 (24.6%) | 448 (29.4%) |
| 10 to 14 Minutes | 404 (21.5%) | 388 (25.4%) |
| 15 to 19 Minutes | 316 (16.8%) | 117 (7.7%) |
| 20 to 24 Minutes | 91 (4.8%) | 55 (3.6%) |
| 25 to 29 Minutes | 0 (0.0%) | 0 (0.0%) |
| 30 to 34 Minutes | 185 (9.8%) | 23 (1.5%) |
| 35 to 39 Minutes | 5 (0.3%) | 27 (1.8%) |
| 40 to 44 Minutes | 23 (1.2%) | 108 (7.1%) |
| 45 to 59 Minutes | 25 (1.3%) | 36 (2.4%) |
| 60 to 89 Minutes | 71 (3.8%) | 44 (2.9%) |
| 90 or more Minutes | 56 (3.0%) | 7 (0.5%) |
Time of Departure to Work by Sex in Johnson County
The most frequent times of departure to work in Johnson County are 7:30 AM to 7:59 AM (387, 20.5%) for males and 7:30 AM to 7:59 AM (373, 24.5%) for females.

| Time of Departure | Male | Female |
| 12:00 AM to 4:59 AM | 67 (3.6%) | 8 (0.5%) |
| 5:00 AM to 5:29 AM | 165 (8.8%) | 16 (1.1%) |
| 5:30 AM to 5:59 AM | 34 (1.8%) | 51 (3.3%) |
| 6:00 AM to 6:29 AM | 177 (9.4%) | 43 (2.8%) |
| 6:30 AM to 6:59 AM | 360 (19.1%) | 114 (7.5%) |
| 7:00 AM to 7:29 AM | 218 (11.6%) | 300 (19.7%) |
| 7:30 AM to 7:59 AM | 387 (20.5%) | 373 (24.5%) |
| 8:00 AM to 8:29 AM | 257 (13.7%) | 301 (19.7%) |
| 8:30 AM to 8:59 AM | 123 (6.5%) | 63 (4.1%) |
| 9:00 AM to 9:59 AM | 19 (1.0%) | 43 (2.8%) |
| 10:00 AM to 10:59 AM | 11 (0.6%) | 95 (6.2%) |
| 11:00 AM to 11:59 AM | 0 (0.0%) | 13 (0.9%) |
| 12:00 PM to 3:59 PM | 14 (0.7%) | 88 (5.8%) |
| 4:00 PM to 11:59 PM | 51 (2.7%) | 17 (1.1%) |
| Total | 1,883 (100.0%) | 1,525 (100.0%) |
Housing Occupancy in Johnson County
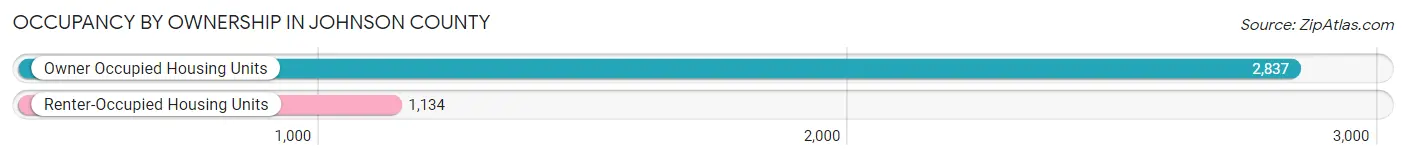
Occupancy by Ownership in Johnson County
Of the total 3,971 dwellings in Johnson County, owner-occupied units account for 2,837 (71.4%), while renter-occupied units make up 1,134 (28.6%).
| Occupancy | # Housing Units | % Housing Units |
| Owner Occupied Housing Units | 2,837 | 71.4% |
| Renter-Occupied Housing Units | 1,134 | 28.6% |
| Total Occupied Housing Units | 3,971 | 100.0% |
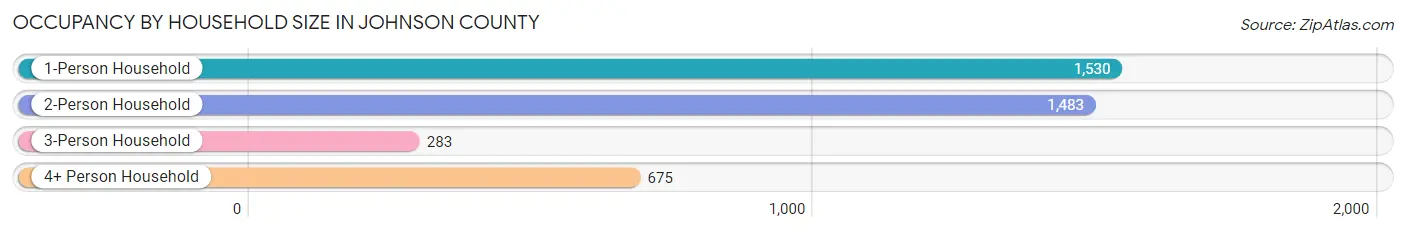
Occupancy by Household Size in Johnson County
| Household Size | # Housing Units | % Housing Units |
| 1-Person Household | 1,530 | 38.5% |
| 2-Person Household | 1,483 | 37.3% |
| 3-Person Household | 283 | 7.1% |
| 4+ Person Household | 675 | 17.0% |
| Total Housing Units | 3,971 | 100.0% |
Occupancy by Ownership by Household Size in Johnson County

| Household Size | Owner-occupied | Renter-occupied |
| 1-Person Household | 871 (56.9%) | 659 (43.1%) |
| 2-Person Household | 1,265 (85.3%) | 218 (14.7%) |
| 3-Person Household | 197 (69.6%) | 86 (30.4%) |
| 4+ Person Household | 504 (74.7%) | 171 (25.3%) |
| Total Housing Units | 2,837 (71.4%) | 1,134 (28.6%) |
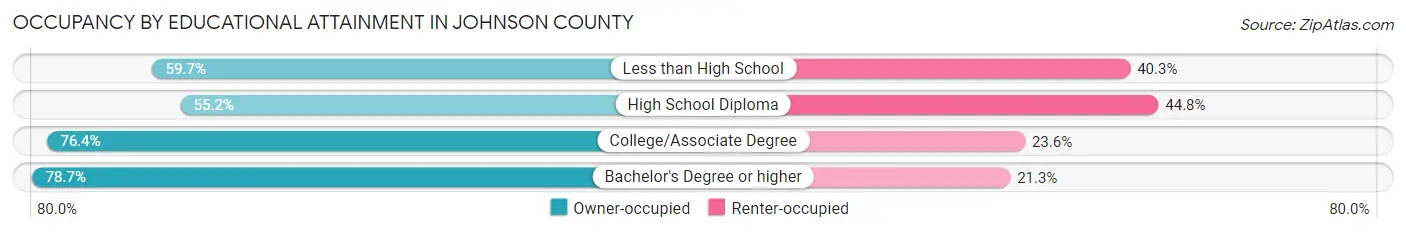
Occupancy by Educational Attainment in Johnson County
| Household Size | Owner-occupied | Renter-occupied |
| Less than High School | 157 (59.7%) | 106 (40.3%) |
| High School Diploma | 480 (55.2%) | 389 (44.8%) |
| College/Associate Degree | 1,159 (76.4%) | 358 (23.6%) |
| Bachelor's Degree or higher | 1,041 (78.7%) | 281 (21.3%) |
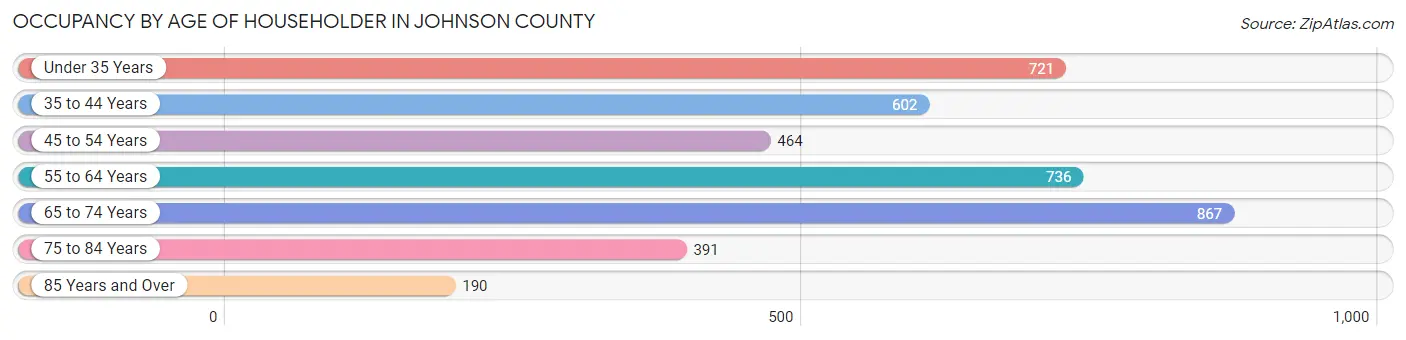
Occupancy by Age of Householder in Johnson County
| Age Bracket | # Households | % Households |
| Under 35 Years | 721 | 18.2% |
| 35 to 44 Years | 602 | 15.2% |
| 45 to 54 Years | 464 | 11.7% |
| 55 to 64 Years | 736 | 18.5% |
| 65 to 74 Years | 867 | 21.8% |
| 75 to 84 Years | 391 | 9.9% |
| 85 Years and Over | 190 | 4.8% |
| Total | 3,971 | 100.0% |
Housing Finances in Johnson County
Median Income by Occupancy in Johnson County
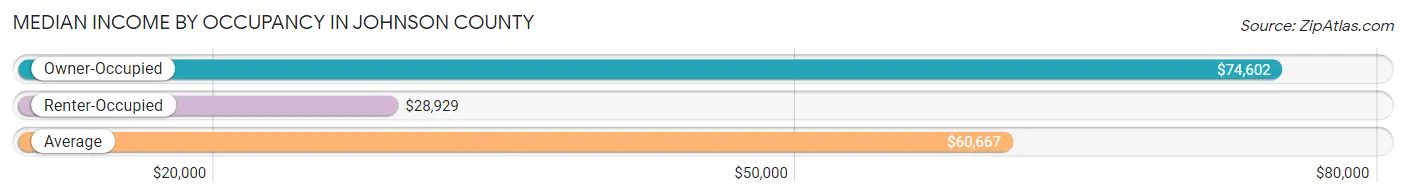
| Occupancy Type | # Households | Median Income |
| Owner-Occupied | 2,837 (71.4%) | $74,602 |
| Renter-Occupied | 1,134 (28.6%) | $28,929 |
| Average | 3,971 (100.0%) | $60,667 |
Occupancy by Householder Income Bracket in Johnson County
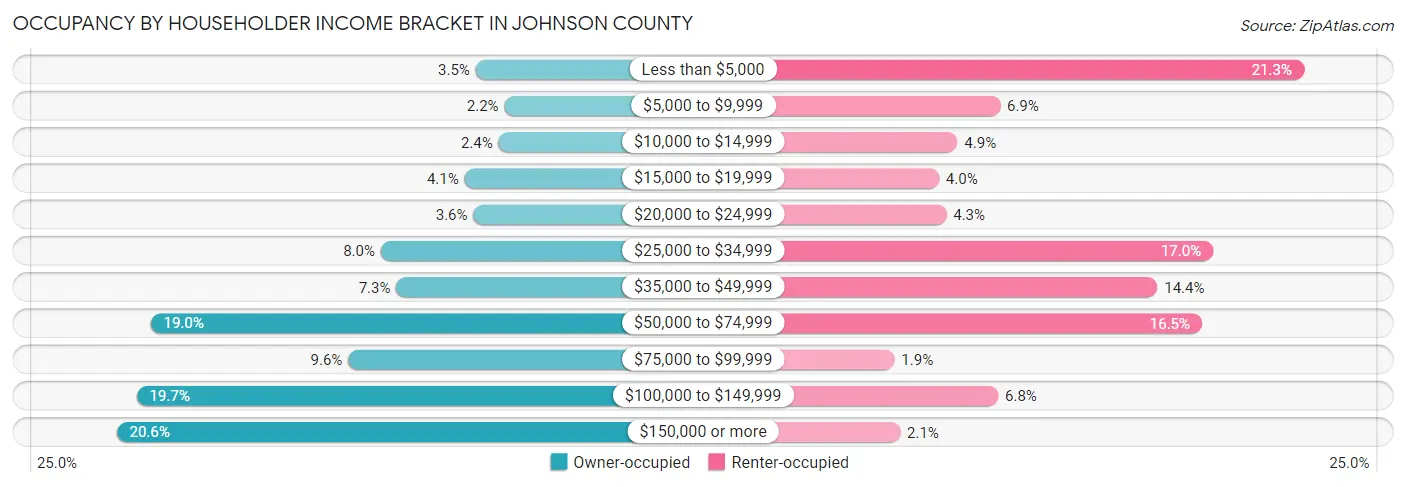
| Income Bracket | Owner-occupied | Renter-occupied |
| Less than $5,000 | 100 (3.5%) | 242 (21.3%) |
| $5,000 to $9,999 | 61 (2.1%) | 78 (6.9%) |
| $10,000 to $14,999 | 69 (2.4%) | 55 (4.9%) |
| $15,000 to $19,999 | 115 (4.1%) | 45 (4.0%) |
| $20,000 to $24,999 | 103 (3.6%) | 49 (4.3%) |
| $25,000 to $34,999 | 228 (8.0%) | 193 (17.0%) |
| $35,000 to $49,999 | 207 (7.3%) | 163 (14.4%) |
| $50,000 to $74,999 | 539 (19.0%) | 187 (16.5%) |
| $75,000 to $99,999 | 272 (9.6%) | 21 (1.8%) |
| $100,000 to $149,999 | 558 (19.7%) | 77 (6.8%) |
| $150,000 or more | 585 (20.6%) | 24 (2.1%) |
| Total | 2,837 (100.0%) | 1,134 (100.0%) |
Monthly Housing Cost Tiers in Johnson County
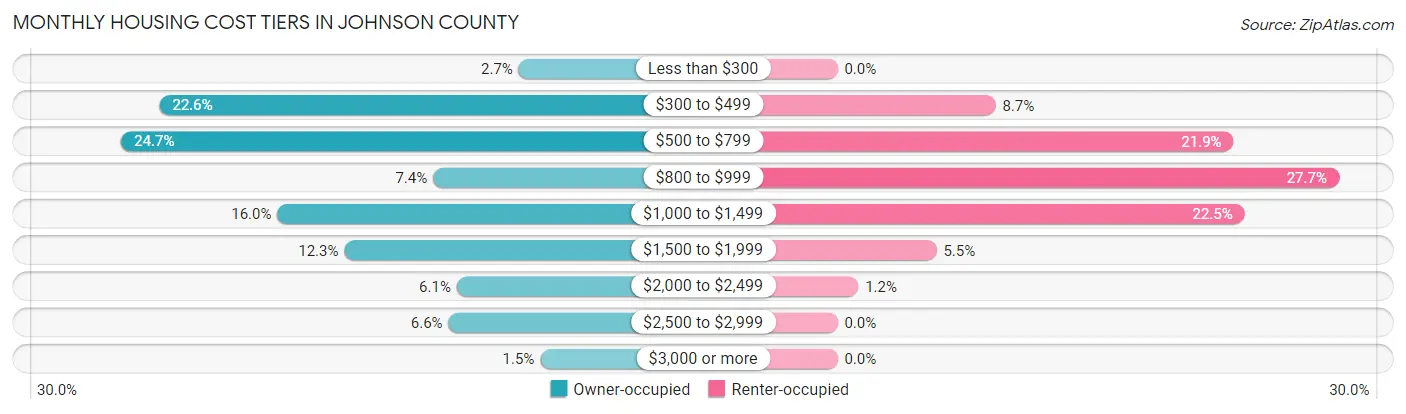
| Monthly Cost | Owner-occupied | Renter-occupied |
| Less than $300 | 77 (2.7%) | 0 (0.0%) |
| $300 to $499 | 640 (22.6%) | 99 (8.7%) |
| $500 to $799 | 700 (24.7%) | 248 (21.9%) |
| $800 to $999 | 211 (7.4%) | 314 (27.7%) |
| $1,000 to $1,499 | 455 (16.0%) | 255 (22.5%) |
| $1,500 to $1,999 | 350 (12.3%) | 62 (5.5%) |
| $2,000 to $2,499 | 174 (6.1%) | 13 (1.1%) |
| $2,500 to $2,999 | 187 (6.6%) | 0 (0.0%) |
| $3,000 or more | 43 (1.5%) | 0 (0.0%) |
| Total | 2,837 (100.0%) | 1,134 (100.0%) |
Physical Housing Characteristics in Johnson County
Housing Structures in Johnson County
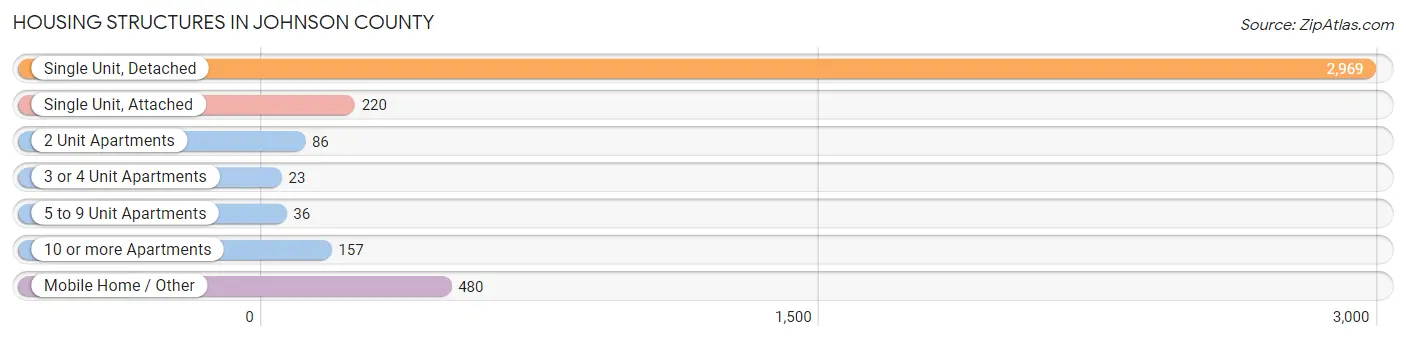
| Structure Type | # Housing Units | % Housing Units |
| Single Unit, Detached | 2,969 | 74.8% |
| Single Unit, Attached | 220 | 5.5% |
| 2 Unit Apartments | 86 | 2.2% |
| 3 or 4 Unit Apartments | 23 | 0.6% |
| 5 to 9 Unit Apartments | 36 | 0.9% |
| 10 or more Apartments | 157 | 4.0% |
| Mobile Home / Other | 480 | 12.1% |
| Total | 3,971 | 100.0% |
Housing Structures by Occupancy in Johnson County
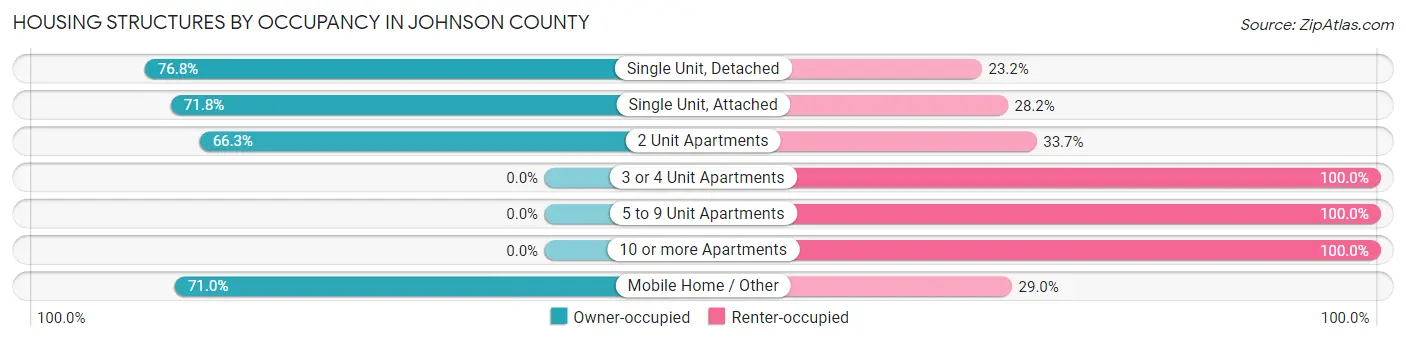
| Structure Type | Owner-occupied | Renter-occupied |
| Single Unit, Detached | 2,281 (76.8%) | 688 (23.2%) |
| Single Unit, Attached | 158 (71.8%) | 62 (28.2%) |
| 2 Unit Apartments | 57 (66.3%) | 29 (33.7%) |
| 3 or 4 Unit Apartments | 0 (0.0%) | 23 (100.0%) |
| 5 to 9 Unit Apartments | 0 (0.0%) | 36 (100.0%) |
| 10 or more Apartments | 0 (0.0%) | 157 (100.0%) |
| Mobile Home / Other | 341 (71.0%) | 139 (29.0%) |
| Total | 2,837 (71.4%) | 1,134 (28.6%) |
Housing Structures by Number of Rooms in Johnson County
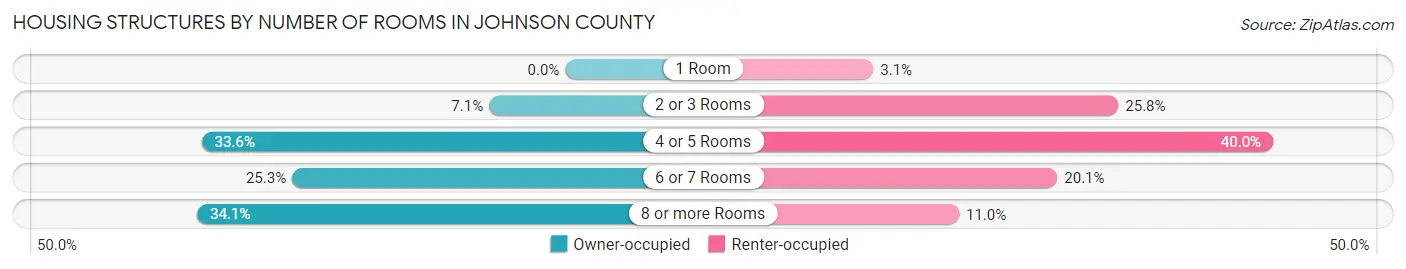
| Number of Rooms | Owner-occupied | Renter-occupied |
| 1 Room | 0 (0.0%) | 35 (3.1%) |
| 2 or 3 Rooms | 200 (7.0%) | 292 (25.8%) |
| 4 or 5 Rooms | 954 (33.6%) | 454 (40.0%) |
| 6 or 7 Rooms | 717 (25.3%) | 228 (20.1%) |
| 8 or more Rooms | 966 (34.1%) | 125 (11.0%) |
| Total | 2,837 (100.0%) | 1,134 (100.0%) |
Housing Structure by Heating Type in Johnson County
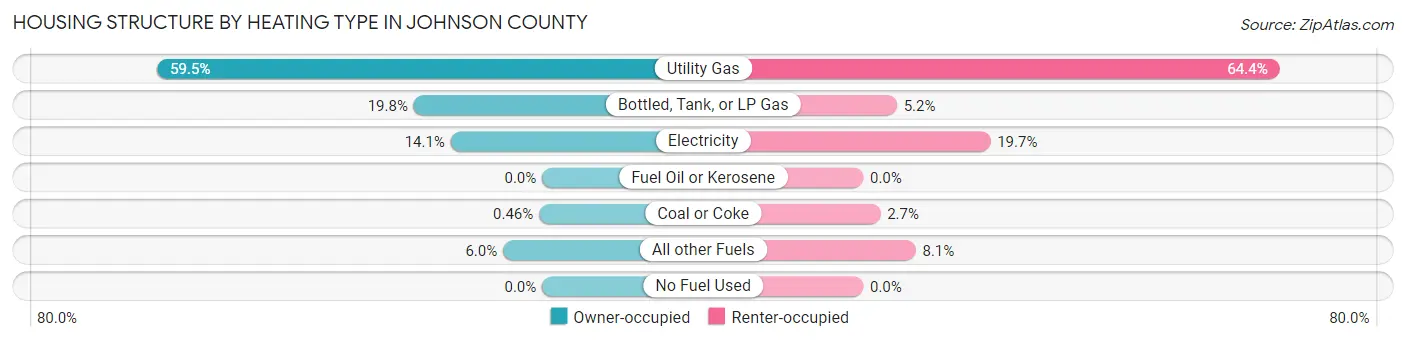
| Heating Type | Owner-occupied | Renter-occupied |
| Utility Gas | 1,689 (59.5%) | 730 (64.4%) |
| Bottled, Tank, or LP Gas | 563 (19.8%) | 59 (5.2%) |
| Electricity | 401 (14.1%) | 223 (19.7%) |
| Fuel Oil or Kerosene | 0 (0.0%) | 0 (0.0%) |
| Coal or Coke | 13 (0.5%) | 30 (2.6%) |
| All other Fuels | 171 (6.0%) | 92 (8.1%) |
| No Fuel Used | 0 (0.0%) | 0 (0.0%) |
| Total | 2,837 (100.0%) | 1,134 (100.0%) |
Household Vehicle Usage in Johnson County
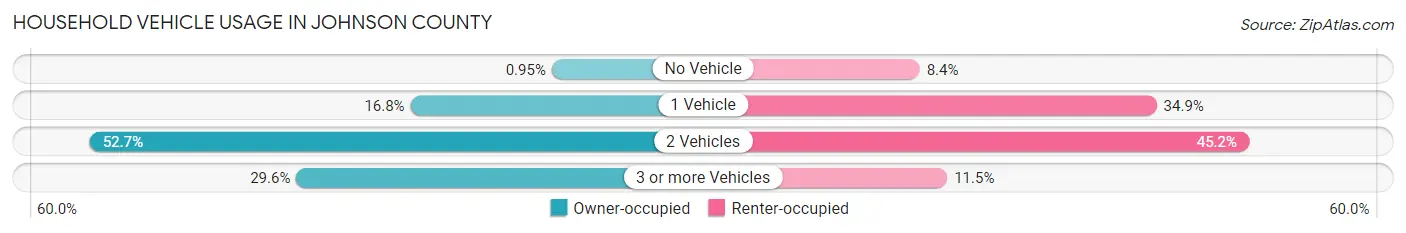
| Vehicles per Household | Owner-occupied | Renter-occupied |
| No Vehicle | 27 (0.9%) | 95 (8.4%) |
| 1 Vehicle | 476 (16.8%) | 396 (34.9%) |
| 2 Vehicles | 1,495 (52.7%) | 513 (45.2%) |
| 3 or more Vehicles | 839 (29.6%) | 130 (11.5%) |
| Total | 2,837 (100.0%) | 1,134 (100.0%) |
Real Estate & Mortgages in Johnson County
Real Estate and Mortgage Overview in Johnson County
| Characteristic | Without Mortgage | With Mortgage |
| Housing Units | 1,577 | 1,260 |
| Median Property Value | $288,200 | $305,100 |
| Median Household Income | $62,972 | $325 |
| Monthly Housing Costs | $525 | $43 |
| Real Estate Taxes | $1,650 | $21 |
Property Value by Mortgage Status in Johnson County

| Property Value | Without Mortgage | With Mortgage |
| Less than $50,000 | 209 (13.3%) | 31 (2.5%) |
| $50,000 to $99,999 | 64 (4.1%) | 49 (3.9%) |
| $100,000 to $299,999 | 563 (35.7%) | 531 (42.1%) |
| $300,000 to $499,999 | 399 (25.3%) | 450 (35.7%) |
| $500,000 to $749,999 | 187 (11.9%) | 162 (12.9%) |
| $750,000 to $999,999 | 65 (4.1%) | 26 (2.1%) |
| $1,000,000 or more | 90 (5.7%) | 11 (0.9%) |
| Total | 1,577 (100.0%) | 1,260 (100.0%) |
Household Income by Mortgage Status in Johnson County

| Household Income | Without Mortgage | With Mortgage |
| Less than $10,000 | 62 (3.9%) | 15 (1.2%) |
| $10,000 to $24,999 | 241 (15.3%) | 99 (7.9%) |
| $25,000 to $34,999 | 203 (12.9%) | 46 (3.6%) |
| $35,000 to $49,999 | 177 (11.2%) | 25 (2.0%) |
| $50,000 to $74,999 | 215 (13.6%) | 30 (2.4%) |
| $75,000 to $99,999 | 165 (10.5%) | 324 (25.7%) |
| $100,000 to $149,999 | 254 (16.1%) | 107 (8.5%) |
| $150,000 or more | 260 (16.5%) | 304 (24.1%) |
| Total | 1,577 (100.0%) | 1,260 (100.0%) |
Property Value to Household Income Ratio in Johnson County
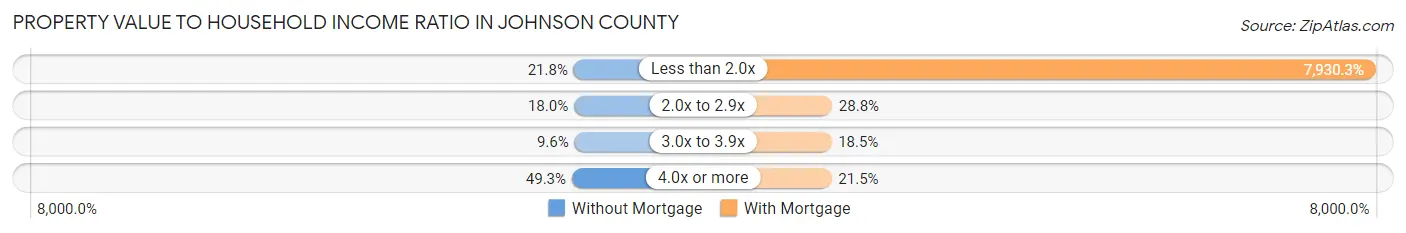
| Value-to-Income Ratio | Without Mortgage | With Mortgage |
| Less than 2.0x | 344 (21.8%) | 99,922 (7,930.3%) |
| 2.0x to 2.9x | 283 (17.9%) | 363 (28.8%) |
| 3.0x to 3.9x | 152 (9.6%) | 233 (18.5%) |
| 4.0x or more | 778 (49.3%) | 271 (21.5%) |
| Total | 1,577 (100.0%) | 1,260 (100.0%) |
Real Estate Taxes by Mortgage Status in Johnson County
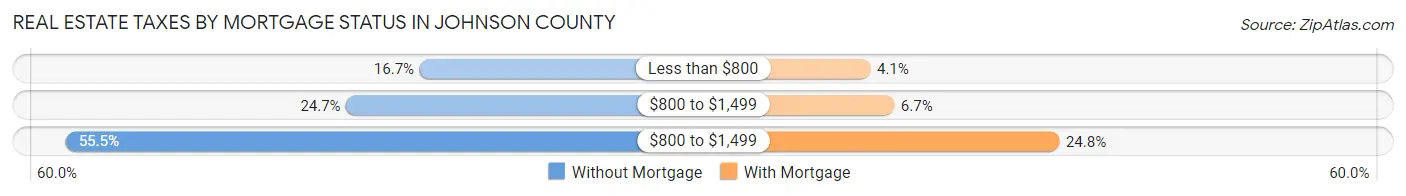
| Property Taxes | Without Mortgage | With Mortgage |
| Less than $800 | 263 (16.7%) | 51 (4.1%) |
| $800 to $1,499 | 390 (24.7%) | 84 (6.7%) |
| $800 to $1,499 | 875 (55.5%) | 312 (24.8%) |
| Total | 1,577 (100.0%) | 1,260 (100.0%) |
Health & Disability in Johnson County
Health Insurance Coverage by Age in Johnson County
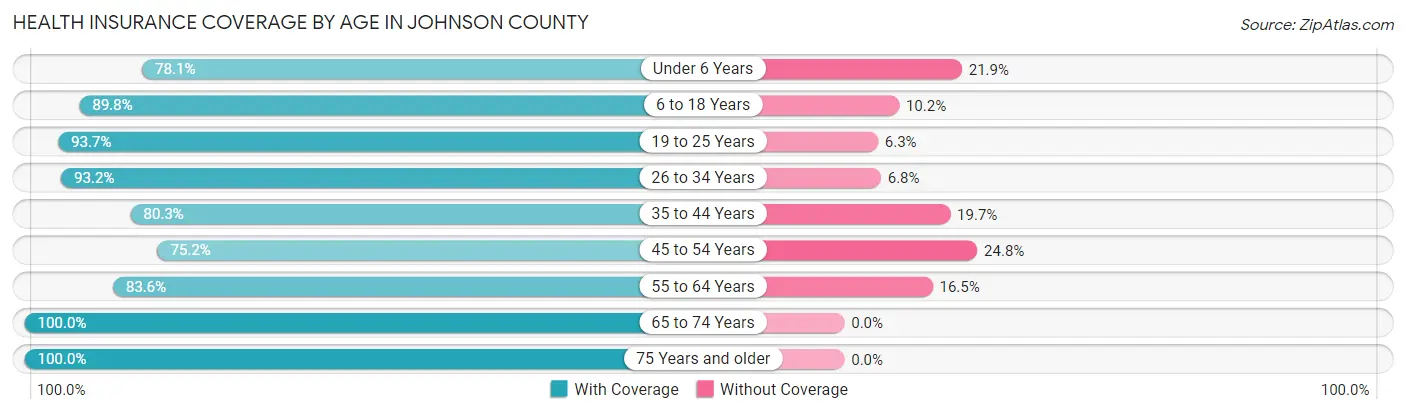
| Age Bracket | With Coverage | Without Coverage |
| Under 6 Years | 367 (78.1%) | 103 (21.9%) |
| 6 to 18 Years | 1,189 (89.8%) | 135 (10.2%) |
| 19 to 25 Years | 404 (93.7%) | 27 (6.3%) |
| 26 to 34 Years | 671 (93.2%) | 49 (6.8%) |
| 35 to 44 Years | 931 (80.3%) | 229 (19.7%) |
| 45 to 54 Years | 683 (75.2%) | 225 (24.8%) |
| 55 to 64 Years | 1,031 (83.6%) | 203 (16.5%) |
| 65 to 74 Years | 1,304 (100.0%) | 0 (0.0%) |
| 75 Years and older | 856 (100.0%) | 0 (0.0%) |
| Total | 7,436 (88.4%) | 971 (11.6%) |
Health Insurance Coverage by Citizenship Status in Johnson County
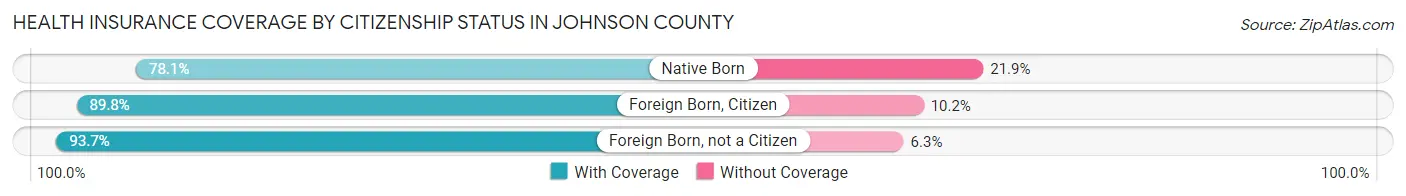
| Citizenship Status | With Coverage | Without Coverage |
| Native Born | 367 (78.1%) | 103 (21.9%) |
| Foreign Born, Citizen | 1,189 (89.8%) | 135 (10.2%) |
| Foreign Born, not a Citizen | 404 (93.7%) | 27 (6.3%) |
Health Insurance Coverage by Household Income in Johnson County
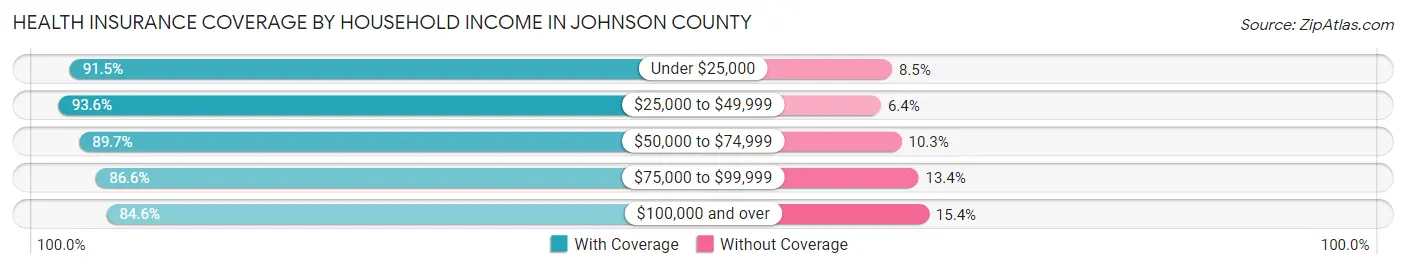
| Household Income | With Coverage | Without Coverage |
| Under $25,000 | 1,295 (91.5%) | 120 (8.5%) |
| $25,000 to $49,999 | 1,373 (93.6%) | 94 (6.4%) |
| $50,000 to $74,999 | 1,434 (89.7%) | 164 (10.3%) |
| $75,000 to $99,999 | 483 (86.6%) | 75 (13.4%) |
| $100,000 and over | 2,834 (84.6%) | 515 (15.4%) |
Public vs Private Health Insurance Coverage by Age in Johnson County
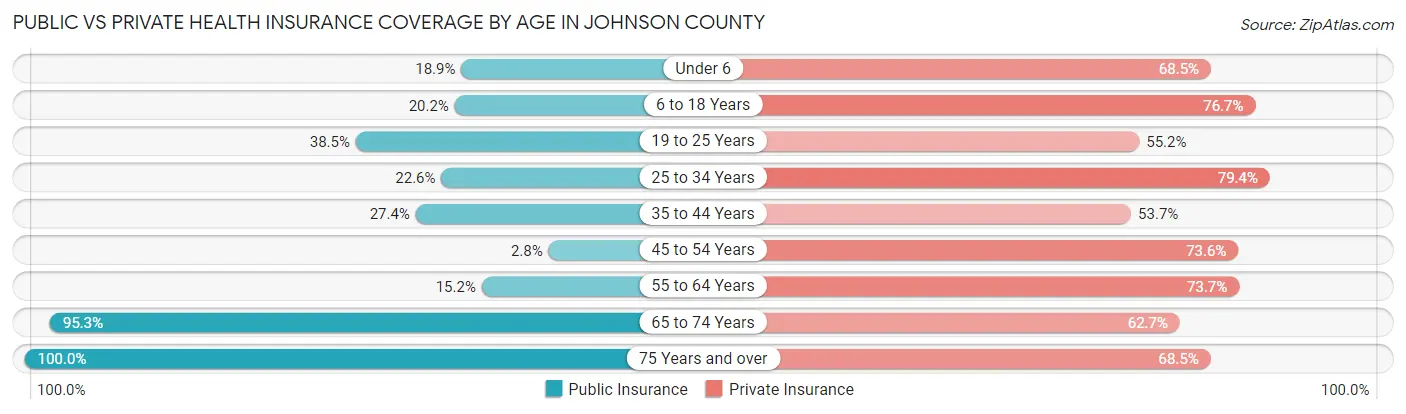
| Age Bracket | Public Insurance | Private Insurance |
| Under 6 | 89 (18.9%) | 322 (68.5%) |
| 6 to 18 Years | 267 (20.2%) | 1,016 (76.7%) |
| 19 to 25 Years | 166 (38.5%) | 238 (55.2%) |
| 25 to 34 Years | 163 (22.6%) | 572 (79.4%) |
| 35 to 44 Years | 318 (27.4%) | 623 (53.7%) |
| 45 to 54 Years | 25 (2.8%) | 668 (73.6%) |
| 55 to 64 Years | 187 (15.1%) | 910 (73.7%) |
| 65 to 74 Years | 1,243 (95.3%) | 818 (62.7%) |
| 75 Years and over | 856 (100.0%) | 586 (68.5%) |
| Total | 3,314 (39.4%) | 5,753 (68.4%) |
Disability Status by Sex by Age in Johnson County

| Age Bracket | Male | Female |
| Under 5 Years | 0 (0.0%) | 0 (0.0%) |
| 5 to 17 Years | 46 (7.6%) | 14 (2.1%) |
| 18 to 34 Years | 16 (2.0%) | 35 (7.1%) |
| 35 to 64 Years | 315 (19.1%) | 141 (8.5%) |
| 65 to 74 Years | 165 (24.1%) | 47 (7.6%) |
| 75 Years and over | 173 (37.9%) | 162 (40.5%) |
Disability Class by Sex by Age in Johnson County
Disability Class: Hearing Difficulty
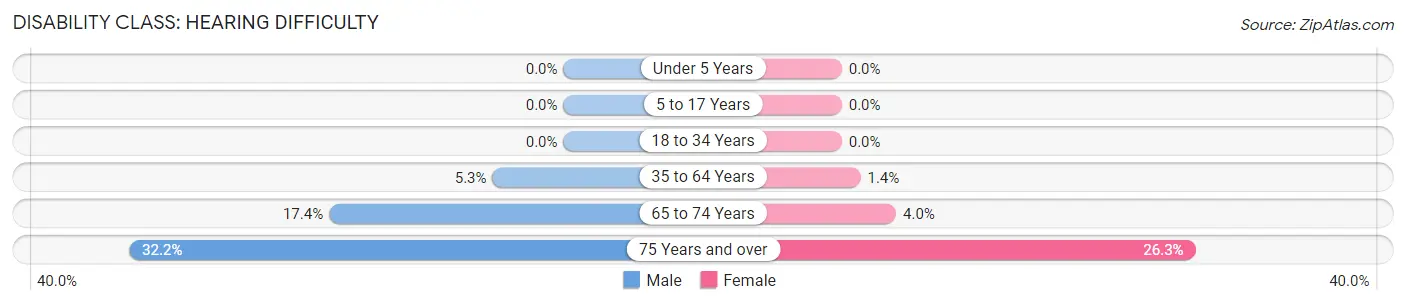
| Age Bracket | Male | Female |
| Under 5 Years | 0 (0.0%) | 0 (0.0%) |
| 5 to 17 Years | 0 (0.0%) | 0 (0.0%) |
| 18 to 34 Years | 0 (0.0%) | 0 (0.0%) |
| 35 to 64 Years | 87 (5.3%) | 23 (1.4%) |
| 65 to 74 Years | 119 (17.4%) | 25 (4.0%) |
| 75 Years and over | 147 (32.2%) | 105 (26.3%) |
Disability Class: Vision Difficulty
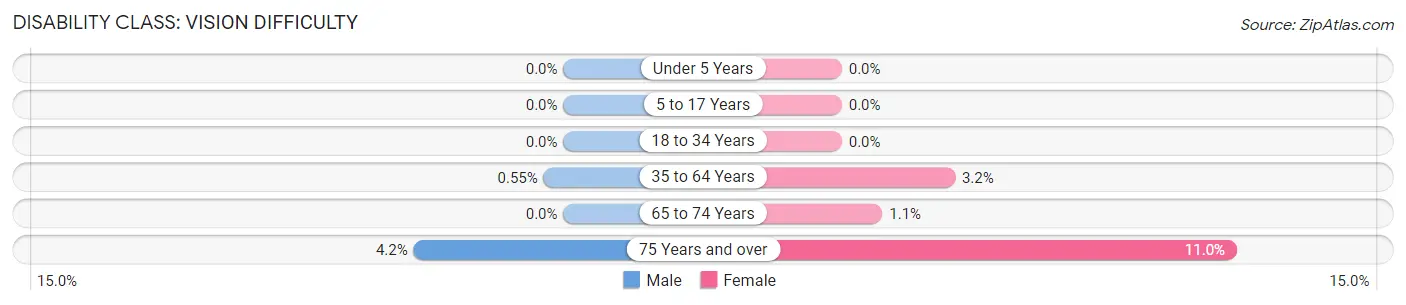
| Age Bracket | Male | Female |
| Under 5 Years | 0 (0.0%) | 0 (0.0%) |
| 5 to 17 Years | 0 (0.0%) | 0 (0.0%) |
| 18 to 34 Years | 0 (0.0%) | 0 (0.0%) |
| 35 to 64 Years | 9 (0.5%) | 52 (3.2%) |
| 65 to 74 Years | 0 (0.0%) | 7 (1.1%) |
| 75 Years and over | 19 (4.2%) | 44 (11.0%) |
Disability Class: Cognitive Difficulty
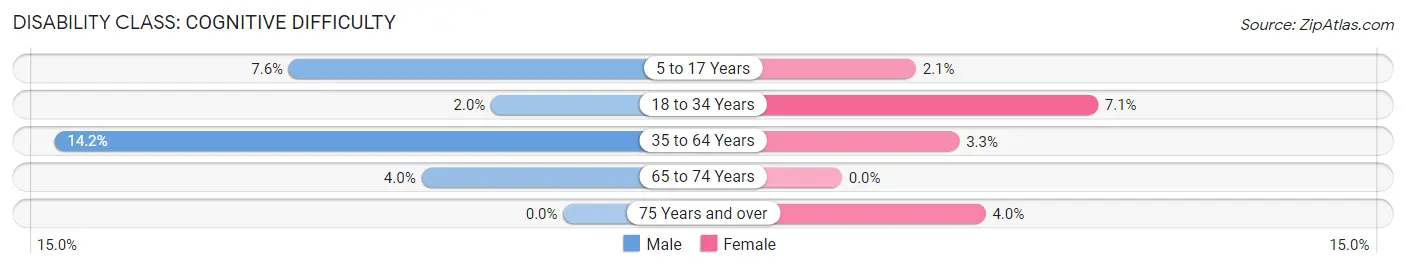
| Age Bracket | Male | Female |
| 5 to 17 Years | 46 (7.6%) | 14 (2.1%) |
| 18 to 34 Years | 16 (2.0%) | 35 (7.1%) |
| 35 to 64 Years | 234 (14.2%) | 54 (3.3%) |
| 65 to 74 Years | 27 (4.0%) | 0 (0.0%) |
| 75 Years and over | 0 (0.0%) | 16 (4.0%) |
Disability Class: Ambulatory Difficulty
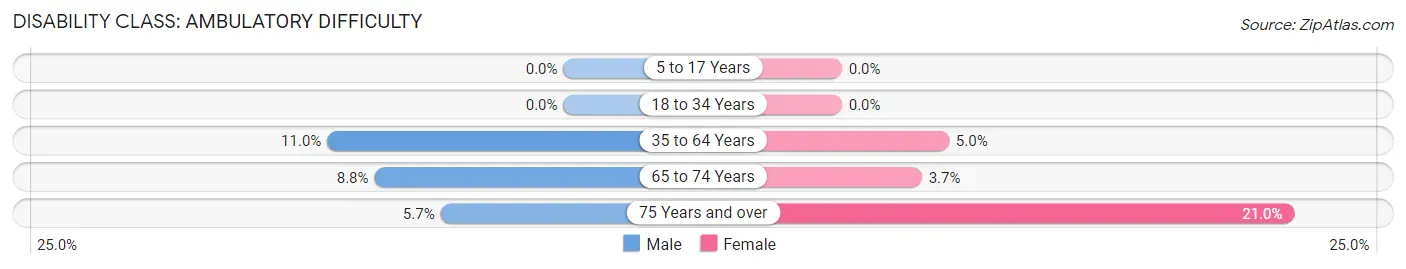
| Age Bracket | Male | Female |
| 5 to 17 Years | 0 (0.0%) | 0 (0.0%) |
| 18 to 34 Years | 0 (0.0%) | 0 (0.0%) |
| 35 to 64 Years | 181 (11.0%) | 82 (5.0%) |
| 65 to 74 Years | 60 (8.8%) | 23 (3.7%) |
| 75 Years and over | 26 (5.7%) | 84 (21.0%) |
Disability Class: Self-Care Difficulty
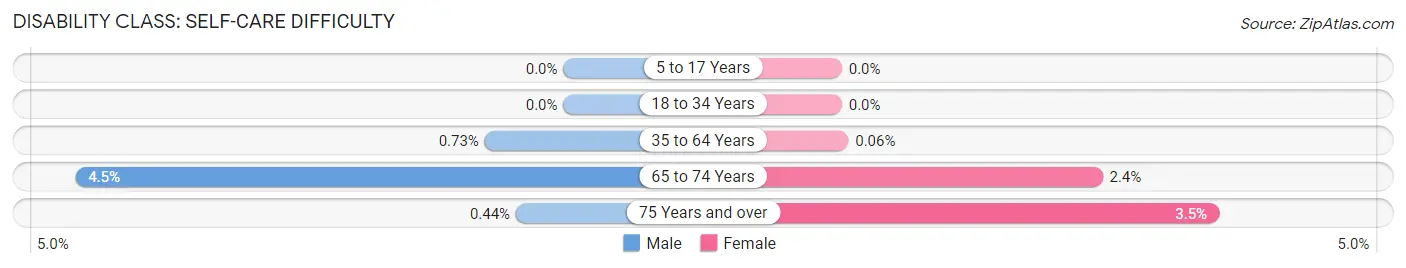
| Age Bracket | Male | Female |
| 5 to 17 Years | 0 (0.0%) | 0 (0.0%) |
| 18 to 34 Years | 0 (0.0%) | 0 (0.0%) |
| 35 to 64 Years | 12 (0.7%) | 1 (0.1%) |
| 65 to 74 Years | 31 (4.5%) | 15 (2.4%) |
| 75 Years and over | 2 (0.4%) | 14 (3.5%) |
Technology Access in Johnson County
Computing Device Access in Johnson County
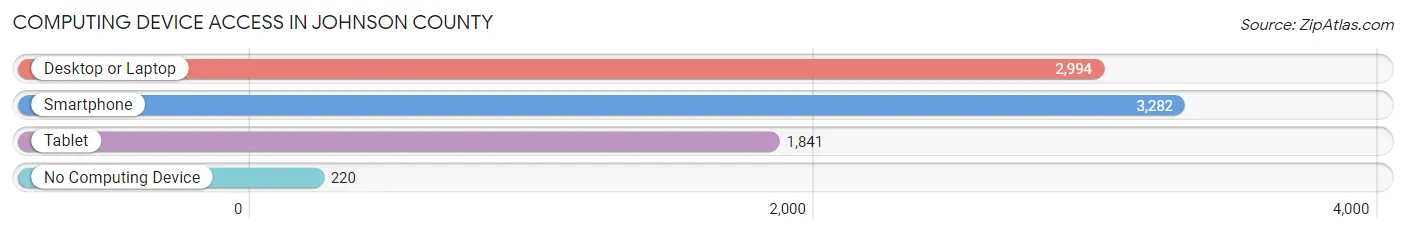
| Device Type | # Households | % Households |
| Desktop or Laptop | 2,994 | 75.4% |
| Smartphone | 3,282 | 82.7% |
| Tablet | 1,841 | 46.4% |
| No Computing Device | 220 | 5.5% |
| Total | 3,971 | 100.0% |
Internet Access in Johnson County
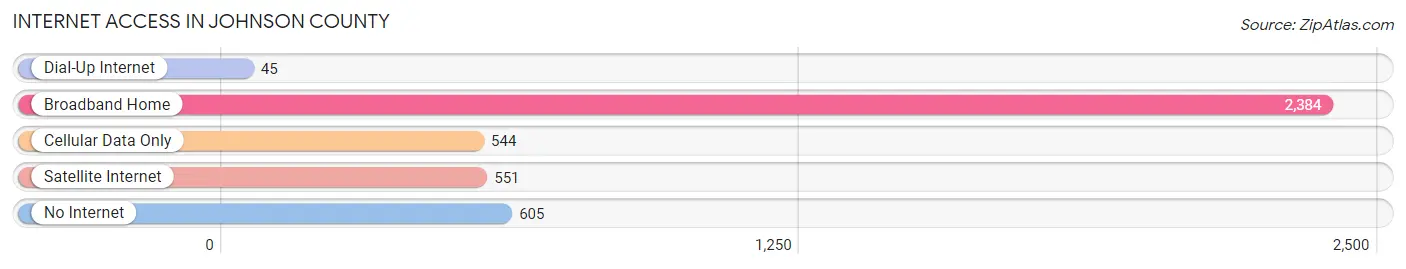
| Internet Type | # Households | % Households |
| Dial-Up Internet | 45 | 1.1% |
| Broadband Home | 2,384 | 60.0% |
| Cellular Data Only | 544 | 13.7% |
| Satellite Internet | 551 | 13.9% |
| No Internet | 605 | 15.2% |
| Total | 3,971 | 100.0% |
Johnson County Summary
Johnson County, Wyoming is located in the northeastern corner of the state and is bordered by Montana to the north, South Dakota to the east, and the state of Wyoming to the south and west. The county seat is Buffalo, and the county is named after Edward Johnson, a Union Army officer who served in the Civil War.
Geography
Johnson County is located in the northeastern corner of Wyoming and is bordered by Montana to the north, South Dakota to the east, and the state of Wyoming to the south and west. The county covers an area of 2,914 square miles and is the second largest county in the state. The county is mostly mountainous, with the Bighorn Mountains to the west and the Black Hills to the east. The county is also home to the Cloud Peak Wilderness, which is part of the Bighorn National Forest. The county is also home to the Big Horn River, which flows through the county from north to south.
The county has a semi-arid climate, with hot summers and cold winters. The average annual temperature is 45°F, and the average annual precipitation is 13.5 inches.
Economy
The economy of Johnson County is largely based on agriculture and tourism. The county is home to several large ranches, and the county is also home to several tourist attractions, including the Bighorn National Forest, the Cloud Peak Wilderness, and the Big Horn River.
Agriculture is the main economic activity in the county, with cattle and sheep ranching being the primary agricultural activities. The county is also home to several large farms, which produce hay, wheat, and other crops.
Tourism is also an important part of the economy, with the county being home to several tourist attractions, including the Bighorn National Forest, the Cloud Peak Wilderness, and the Big Horn River. The county is also home to several historic sites, including the Johnson County Courthouse, the Johnson County Museum, and the Johnson County Historical Society.
Demographics
As of the 2010 census, the population of Johnson County was 8,945. The population is mostly white (94.2%), with small percentages of Native American (2.2%), African American (0.7%), Asian (0.4%), and other races (2.5%). The median household income in the county is $45,813, and the median age is 44.
The county is home to several small towns, including Buffalo, Kaycee, and Story. Buffalo is the county seat and the largest town in the county, with a population of 4,585. Kaycee is the second largest town, with a population of 545, and Story is the third largest town, with a population of 441.
Conclusion
Johnson County, Wyoming is a large county located in the northeastern corner of the state. The county is mostly mountainous, with the Bighorn Mountains to the west and the Black Hills to the east. The county is home to several large ranches, and the county is also home to several tourist attractions, including the Bighorn National Forest, the Cloud Peak Wilderness, and the Big Horn River. The economy of Johnson County is largely based on agriculture and tourism, and the population of the county is mostly white.
Common Questions
What is the Total Population of Johnson County?
Total Population of Johnson County is 8,536.
What is the Total Male Population of Johnson County?
Total Male Population of Johnson County is 4,406.
What is the Total Female Population of Johnson County?
Total Female Population of Johnson County is 4,130.
What is the Ratio of Males per 100 Females in Johnson County?
There are 106.68 Males per 100 Females in Johnson County.
What is the Ratio of Females per 100 Males in Johnson County?
There are 93.74 Females per 100 Males in Johnson County.
What is the Median Population Age in Johnson County?
Median Population Age in Johnson County is 46.1 Years.
What is the Average Family Size in Johnson County
Average Family Size in Johnson County is 2.9 People.
What is the Average Household Size in Johnson County
Average Household Size in Johnson County is 2.1 People.
What is Per Capita Income in Johnson County?
Per Capita income in Johnson County is $37,691.
What is the Median Family Income in Johnson County?
Median Family Income in Johnson County is $89,837.
What is the Median Household income in Johnson County?
Median Household Income in Johnson County is $60,667.
What is Income or Wage Gap in Johnson County?
Income or Wage Gap in Johnson County is 32.7%.
Women in Johnson County earn 67.3 cents for every dollar earned by a man.
What is Family Income Deficit in Johnson County?
Family Income Deficit in Johnson County is $15,999.
Families that are below poverty line in Johnson County earn $15,999 less on average than the poverty threshold level.
What is Inequality or Gini Index in Johnson County?
Inequality or Gini Index in Johnson County is 0.49.
How Large is the Labor Force in Johnson County?
There are 4,094 People in the Labor Forcein in Johnson County.
What is the Percentage of People in the Labor Force in Johnson County?
57.6% of People are in the Labor Force in Johnson County.
What is the Unemployment Rate in Johnson County?
Unemployment Rate in Johnson County is 2.3%.