Hot Springs County, WY
Hot Springs County Map
Hot Springs County Overview
4,616
TOTAL POPULATION
2,317
MALE POPULATION
2,299
FEMALE POPULATION
100.78
MALES / 100 FEMALES
99.22
FEMALES / 100 MALES
45.8
MEDIAN AGE
2.6
AVG FAMILY SIZE
2.1
AVG HOUSEHOLD SIZE
$33,128
PER CAPITA INCOME
$78,068
AVG FAMILY INCOME
$64,031
AVG HOUSEHOLD INCOME
18.4%
WAGE / INCOME GAP [ % ]
81.6¢/ $1
WAGE / INCOME GAP [ $ ]
$7,063
FAMILY INCOME DEFICIT
0.40
INEQUALITY / GINI INDEX
2,123
LABOR FORCE [ PEOPLE ]
56.8%
PERCENT IN LABOR FORCE
1.4%
UNEMPLOYMENT RATE
Hot Springs County Area Codes
Race in Hot Springs County
The most populous races in Hot Springs County are White / Caucasian (4,261 | 92.3%), Hispanic or Latino (190 | 4.1%), and Two or more Races (190 | 4.1%).
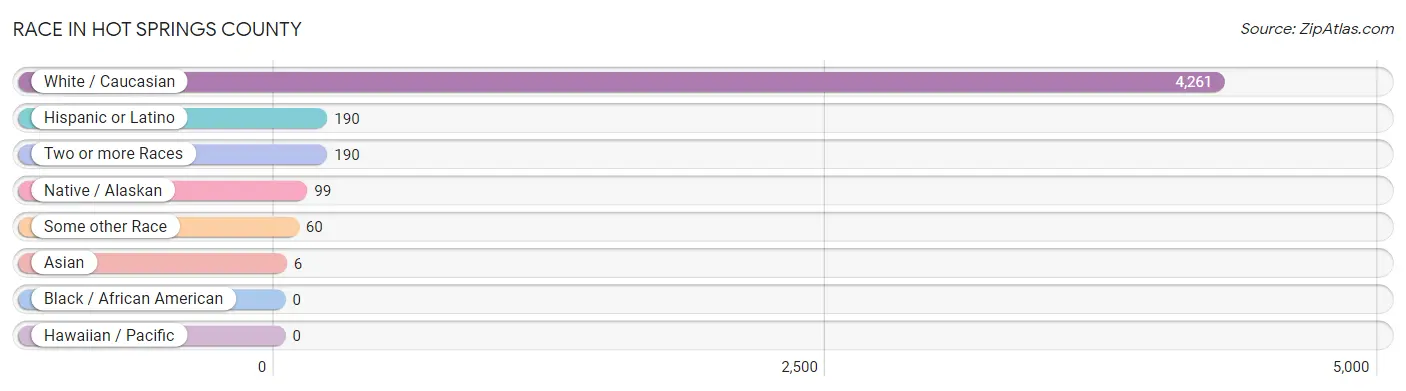
| Race | # Population | % Population |
| Asian | 6 | 0.1% |
| Black / African American | 0 | 0.0% |
| Hawaiian / Pacific | 0 | 0.0% |
| Hispanic or Latino | 190 | 4.1% |
| Native / Alaskan | 99 | 2.1% |
| White / Caucasian | 4,261 | 92.3% |
| Two or more Races | 190 | 4.1% |
| Some other Race | 60 | 1.3% |
| Total | 4,616 | 100.0% |
Ancestry in Hot Springs County
The most populous ancestries reported in Hot Springs County are German (987 | 21.4%), English (981 | 21.2%), Irish (900 | 19.5%), Norwegian (289 | 6.3%), and Scotch-Irish (235 | 5.1%), together accounting for 73.5% of all Hot Springs County residents.
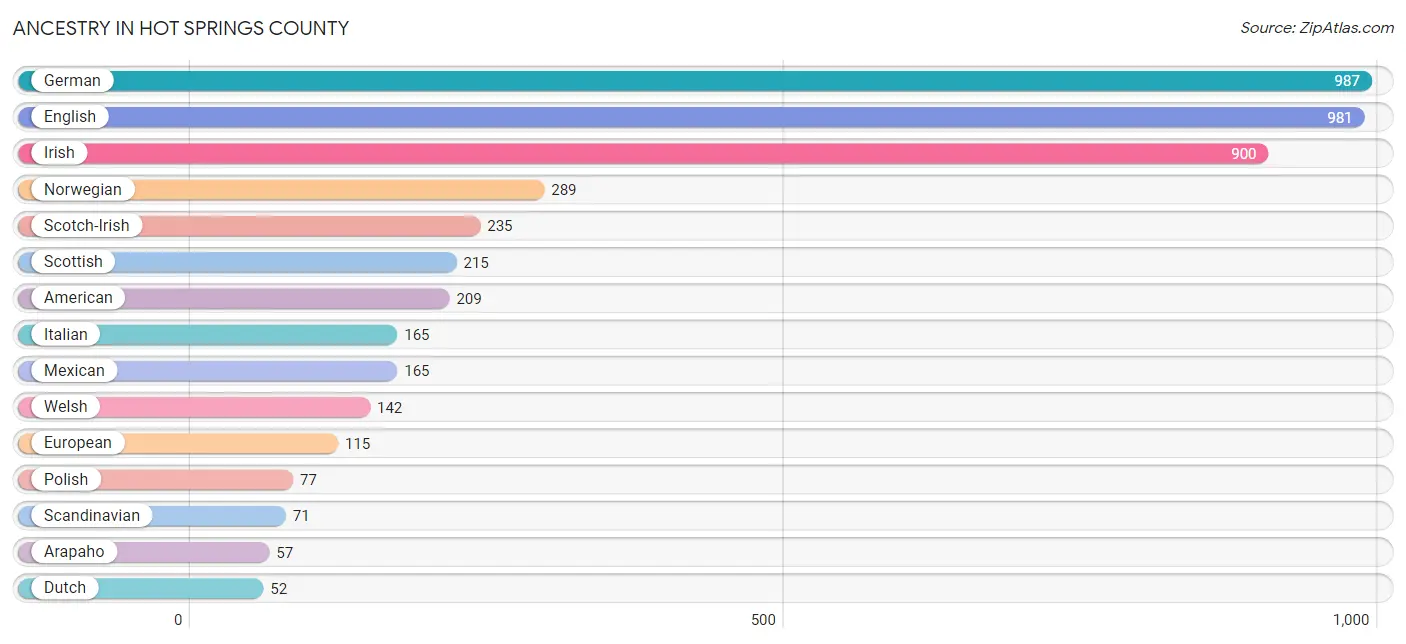
| Ancestry | # Population | % Population |
| Alaska Native | 1 | 0.0% |
| American | 209 | 4.5% |
| Arapaho | 57 | 1.2% |
| Austrian | 1 | 0.0% |
| Belgian | 2 | 0.0% |
| British | 7 | 0.2% |
| Burmese | 6 | 0.1% |
| Cajun | 7 | 0.2% |
| Canadian | 4 | 0.1% |
| Central American | 10 | 0.2% |
| Cherokee | 1 | 0.0% |
| Chinese | 6 | 0.1% |
| Chippewa | 15 | 0.3% |
| Choctaw | 14 | 0.3% |
| Danish | 13 | 0.3% |
| Dutch | 52 | 1.1% |
| Eastern European | 13 | 0.3% |
| English | 981 | 21.2% |
| European | 115 | 2.5% |
| French | 46 | 1.0% |
| French Canadian | 9 | 0.2% |
| German | 987 | 21.4% |
| Hungarian | 1 | 0.0% |
| Indian (Asian) | 8 | 0.2% |
| Inupiat | 4 | 0.1% |
| Irish | 900 | 19.5% |
| Italian | 165 | 3.6% |
| Japanese | 6 | 0.1% |
| Lithuanian | 4 | 0.1% |
| Mexican | 165 | 3.6% |
| Native Hawaiian | 14 | 0.3% |
| Northern European | 9 | 0.2% |
| Norwegian | 289 | 6.3% |
| Peruvian | 4 | 0.1% |
| Polish | 77 | 1.7% |
| Portuguese | 5 | 0.1% |
| Puerto Rican | 7 | 0.2% |
| Russian | 1 | 0.0% |
| Salvadoran | 10 | 0.2% |
| Scandinavian | 71 | 1.5% |
| Scotch-Irish | 235 | 5.1% |
| Scottish | 215 | 4.7% |
| Shoshone | 36 | 0.8% |
| Sioux | 14 | 0.3% |
| South American | 4 | 0.1% |
| Swedish | 42 | 0.9% |
| Swiss | 6 | 0.1% |
| Tlingit-Haida | 2 | 0.0% |
| Welsh | 142 | 3.1% |
| Yugoslavian | 5 | 0.1% | View All 50 Rows |
Immigrants in Hot Springs County
The most numerous immigrant groups reported in Hot Springs County came from Latin America (19 | 0.4%), Central America (15 | 0.3%), Mexico (13 | 0.3%), Europe (9 | 0.2%), and Germany (9 | 0.2%), together accounting for 1.4% of all Hot Springs County residents.
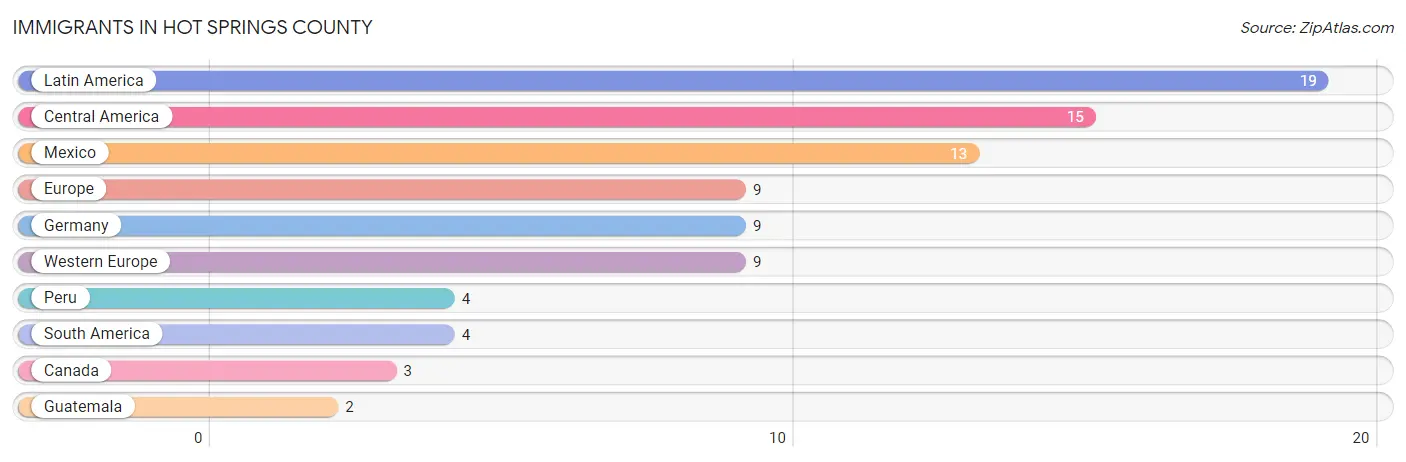
| Immigration Origin | # Population | % Population |
| Canada | 3 | 0.1% |
| Central America | 15 | 0.3% |
| Europe | 9 | 0.2% |
| Germany | 9 | 0.2% |
| Guatemala | 2 | 0.0% |
| Latin America | 19 | 0.4% |
| Mexico | 13 | 0.3% |
| Peru | 4 | 0.1% |
| South America | 4 | 0.1% |
| Western Europe | 9 | 0.2% | View All 10 Rows |
Sex and Age in Hot Springs County
Sex and Age in Hot Springs County
The most populous age groups in Hot Springs County are 55 to 59 Years (226 | 9.8%) for men and 65 to 69 Years (244 | 10.6%) for women.
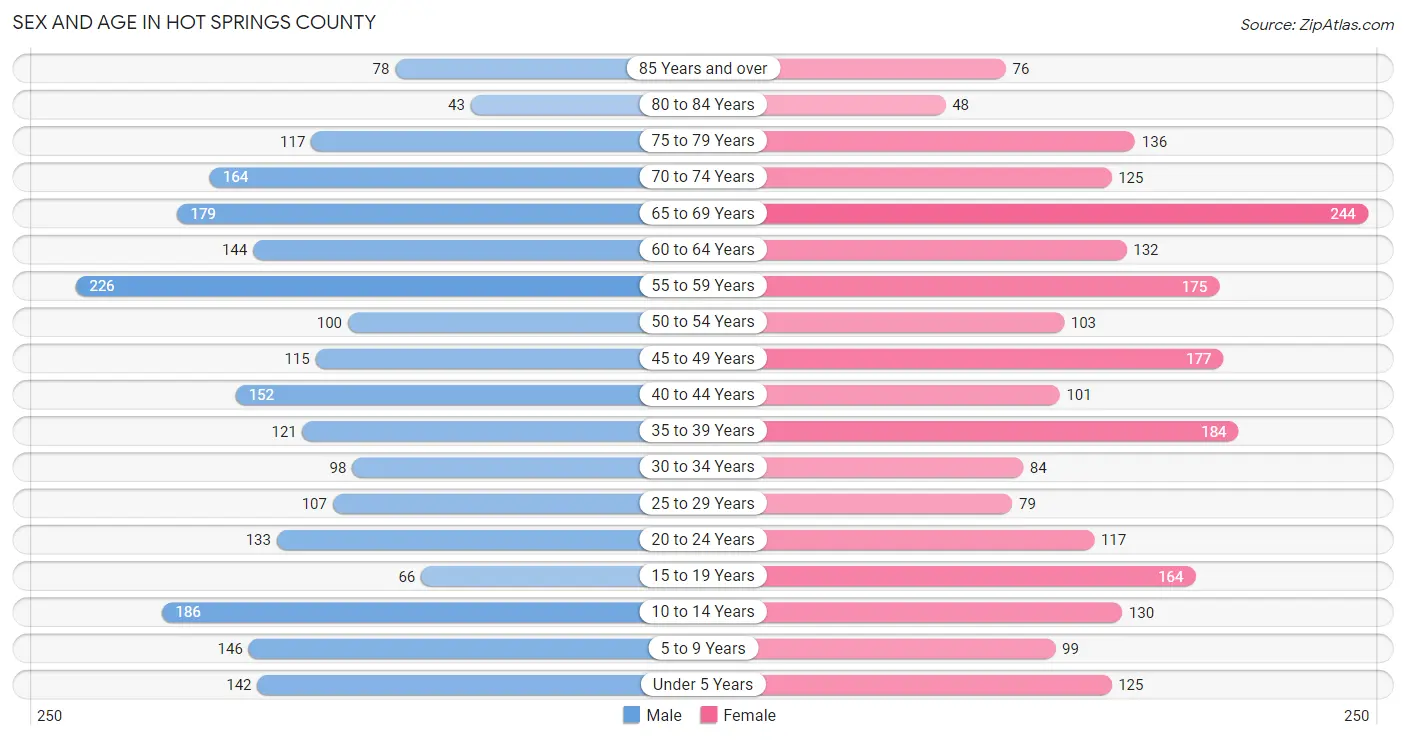
| Age Bracket | Male | Female |
| Under 5 Years | 142 (6.1%) | 125 (5.4%) |
| 5 to 9 Years | 146 (6.3%) | 99 (4.3%) |
| 10 to 14 Years | 186 (8.0%) | 130 (5.7%) |
| 15 to 19 Years | 66 (2.9%) | 164 (7.1%) |
| 20 to 24 Years | 133 (5.7%) | 117 (5.1%) |
| 25 to 29 Years | 107 (4.6%) | 79 (3.4%) |
| 30 to 34 Years | 98 (4.2%) | 84 (3.6%) |
| 35 to 39 Years | 121 (5.2%) | 184 (8.0%) |
| 40 to 44 Years | 152 (6.6%) | 101 (4.4%) |
| 45 to 49 Years | 115 (5.0%) | 177 (7.7%) |
| 50 to 54 Years | 100 (4.3%) | 103 (4.5%) |
| 55 to 59 Years | 226 (9.8%) | 175 (7.6%) |
| 60 to 64 Years | 144 (6.2%) | 132 (5.7%) |
| 65 to 69 Years | 179 (7.7%) | 244 (10.6%) |
| 70 to 74 Years | 164 (7.1%) | 125 (5.4%) |
| 75 to 79 Years | 117 (5.1%) | 136 (5.9%) |
| 80 to 84 Years | 43 (1.9%) | 48 (2.1%) |
| 85 Years and over | 78 (3.4%) | 76 (3.3%) |
| Total | 2,317 (100.0%) | 2,299 (100.0%) |
Families and Households in Hot Springs County
Median Family Size in Hot Springs County
The median family size in Hot Springs County is 2.56 persons per family, with married-couple families (1,051 | 76.0%) accounting for the largest median family size of 2.69 persons per family. On the other hand, single male/father families (145 | 10.5%) represent the smallest median family size with 1.83 persons per family.
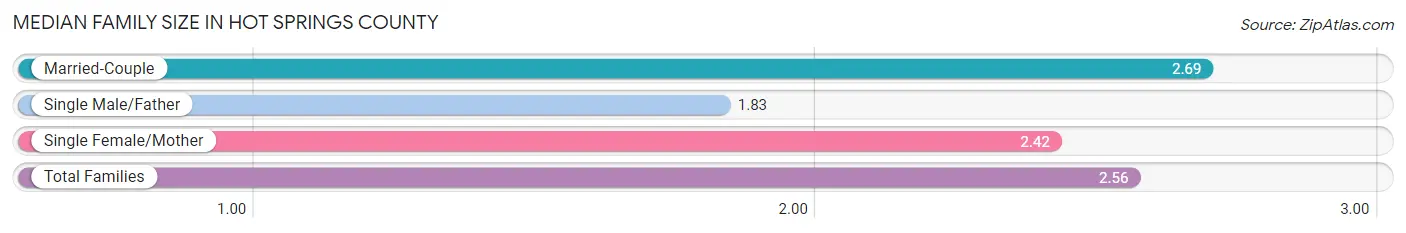
| Family Type | # Families | Family Size |
| Married-Couple | 1,051 (76.0%) | 2.69 |
| Single Male/Father | 145 (10.5%) | 1.83 |
| Single Female/Mother | 187 (13.5%) | 2.42 |
| Total Families | 1,383 (100.0%) | 2.56 |
Median Household Size in Hot Springs County
The median household size in Hot Springs County is 2.15 persons per household, with married-couple households (1,051 | 49.9%) accounting for the largest median household size of 2.72 persons per household. non-family households (722 | 34.3%) represent the smallest median household size with 1.19 persons per household.
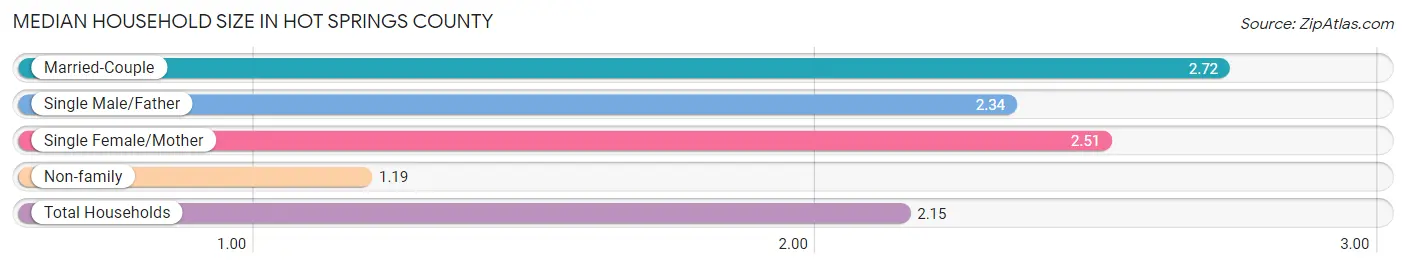
| Household Type | # Households | Household Size |
| Married-Couple | 1,051 (49.9%) | 2.72 |
| Single Male/Father | 145 (6.9%) | 2.34 |
| Single Female/Mother | 187 (8.9%) | 2.51 |
| Non-family | 722 (34.3%) | 1.19 |
| Total Households | 2,105 (100.0%) | 2.15 |
Household Size by Marriage Status in Hot Springs County
Out of a total of 2,105 households in Hot Springs County, 1,383 (65.7%) are family households, while 722 (34.3%) are nonfamily households. The most numerous type of family households are 2-person households, comprising 869, and the most common type of nonfamily households are 1-person households, comprising 676.
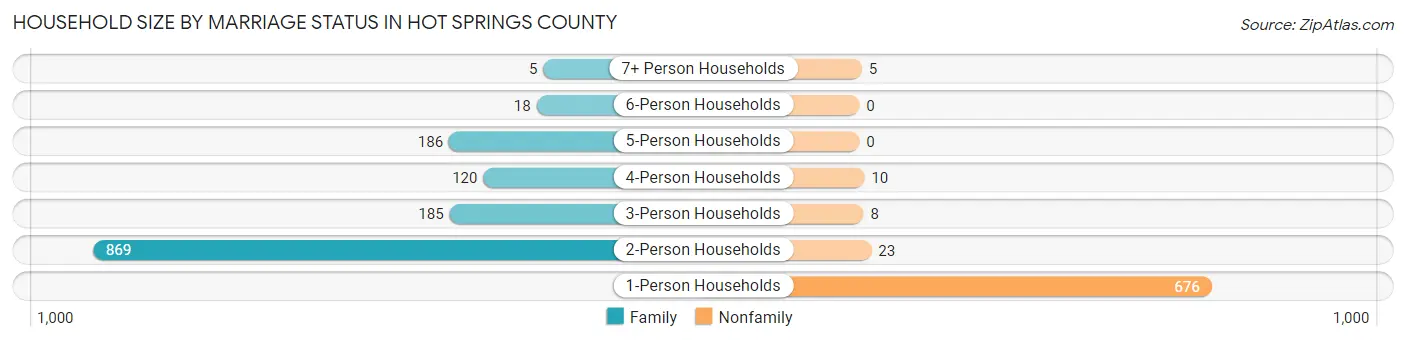
| Household Size | Family Households | Nonfamily Households |
| 1-Person Households | - | 676 (32.1%) |
| 2-Person Households | 869 (41.3%) | 23 (1.1%) |
| 3-Person Households | 185 (8.8%) | 8 (0.4%) |
| 4-Person Households | 120 (5.7%) | 10 (0.5%) |
| 5-Person Households | 186 (8.8%) | 0 (0.0%) |
| 6-Person Households | 18 (0.9%) | 0 (0.0%) |
| 7+ Person Households | 5 (0.2%) | 5 (0.2%) |
| Total | 1,383 (65.7%) | 722 (34.3%) |
Female Fertility in Hot Springs County
Fertility by Age in Hot Springs County
Average fertility rate in Hot Springs County is 117.0 births per 1,000 women. Women in the age bracket of 20 to 34 years have the highest fertility rate with 332.0 births per 1,000 women. Women in the age bracket of 20 to 34 years acount for 86.1% of all women with births.
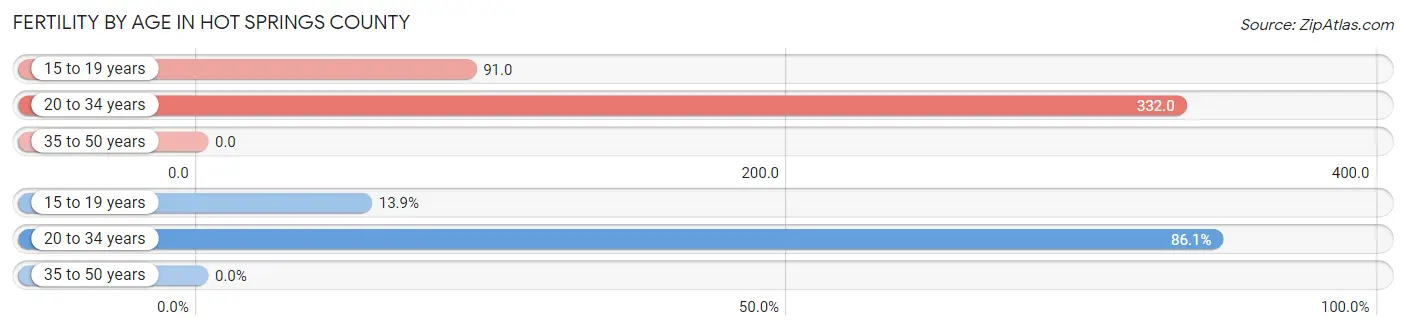
| Age Bracket | Women with Births | Births / 1,000 Women |
| 15 to 19 years | 15 (13.9%) | 91.0 |
| 20 to 34 years | 93 (86.1%) | 332.0 |
| 35 to 50 years | 0 (0.0%) | 0.0 |
| Total | 108 (100.0%) | 117.0 |
Fertility by Age by Marriage Status in Hot Springs County
32.4% of women with births (108) in Hot Springs County are married. The highest percentage of unmarried women with births falls into 15 to 19 years age bracket with 100.0% of them unmarried at the time of birth, while the lowest percentage of unmarried women with births belong to 20 to 34 years age bracket with 62.4% of them unmarried.
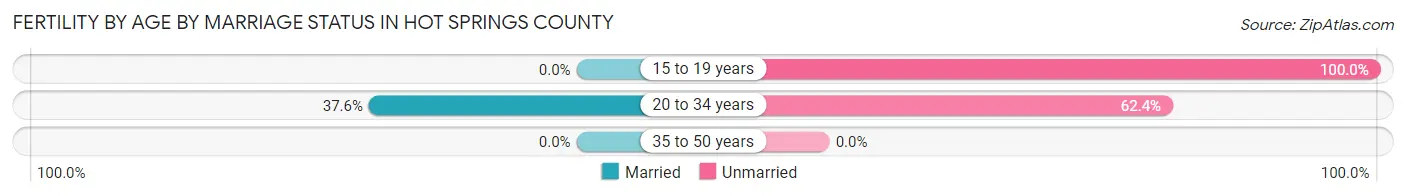
| Age Bracket | Married | Unmarried |
| 15 to 19 years | 0 (0.0%) | 15 (100.0%) |
| 20 to 34 years | 35 (37.6%) | 58 (62.4%) |
| 35 to 50 years | 0 (0.0%) | 0 (0.0%) |
| Total | 35 (32.4%) | 73 (67.6%) |
Fertility by Education in Hot Springs County
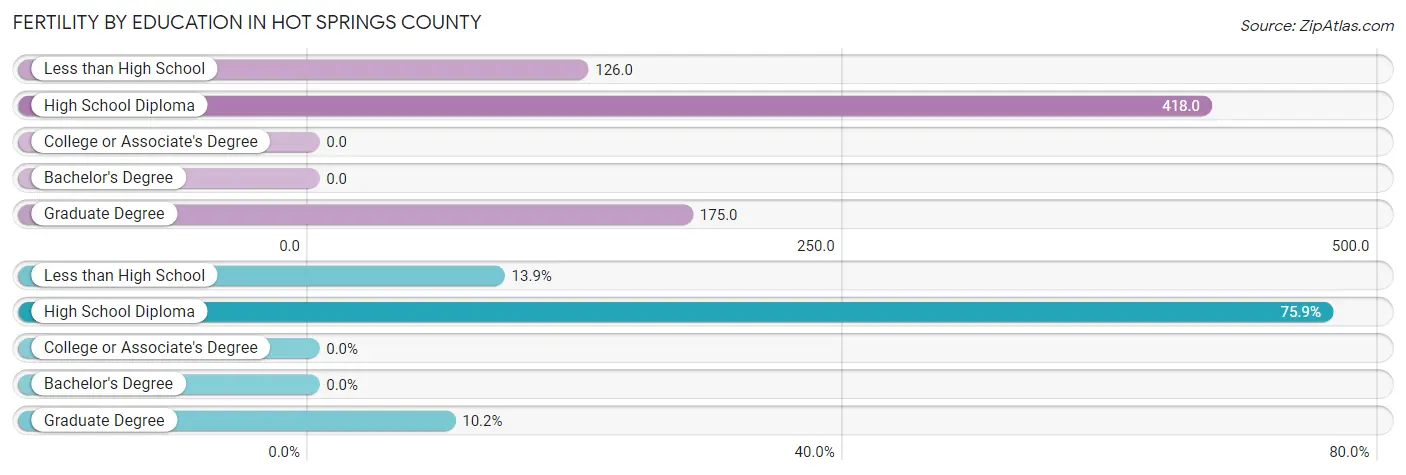
| Educational Attainment | Women with Births | Births / 1,000 Women |
| Less than High School | 15 (13.9%) | 126.0 |
| High School Diploma | 82 (75.9%) | 418.0 |
| College or Associate's Degree | 0 (0.0%) | 0.0 |
| Bachelor's Degree | 0 (0.0%) | 0.0 |
| Graduate Degree | 11 (10.2%) | 175.0 |
| Total | 108 (100.0%) | 117.0 |
Fertility by Education by Marriage Status in Hot Springs County
67.6% of women with births in Hot Springs County are unmarried. Women with the educational attainment of graduate degree are most likely to be married with 100.0% of them married at childbirth, while women with the educational attainment of less than high school are least likely to be married with 100.0% of them unmarried at childbirth.
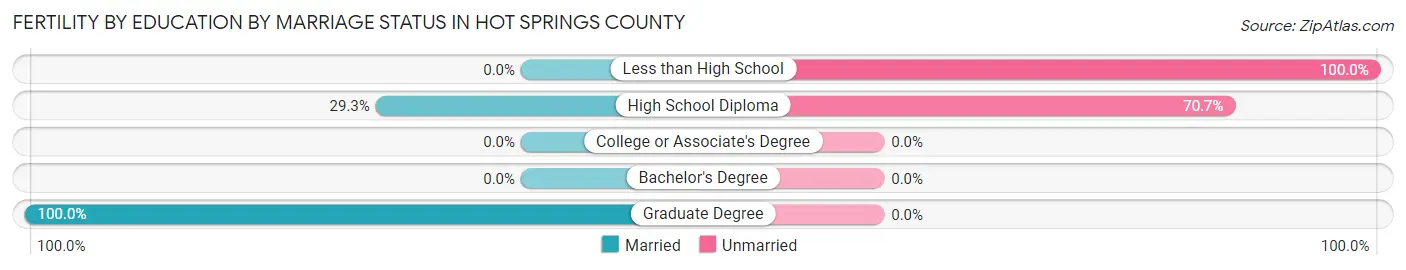
| Educational Attainment | Married | Unmarried |
| Less than High School | 0 (0.0%) | 15 (100.0%) |
| High School Diploma | 24 (29.3%) | 58 (70.7%) |
| College or Associate's Degree | 0 (0.0%) | 0 (0.0%) |
| Bachelor's Degree | 0 (0.0%) | 0 (0.0%) |
| Graduate Degree | 11 (100.0%) | 0 (0.0%) |
| Total | 35 (32.4%) | 73 (67.6%) |
Income in Hot Springs County
Income Overview in Hot Springs County
Per Capita Income in Hot Springs County is $33,128, while median incomes of families and households are $78,068 and $64,031 respectively.
| Characteristic | Number | Measure |
| Per Capita Income | 4,616 | $33,128 |
| Median Family Income | 1,383 | $78,068 |
| Mean Family Income | 1,383 | $84,896 |
| Median Household Income | 2,105 | $64,031 |
| Mean Household Income | 2,105 | $74,052 |
| Income Deficit | 1,383 | $7,063 |
| Wage / Income Gap (%) | 4,616 | 18.36% |
| Wage / Income Gap ($) | 4,616 | 81.64¢ per $1 |
| Gini / Inequality Index | 4,616 | 0.40 |
Earnings by Sex in Hot Springs County
Average Earnings in Hot Springs County are $31,463, $34,833 for men and $28,438 for women, a difference of 18.4%.
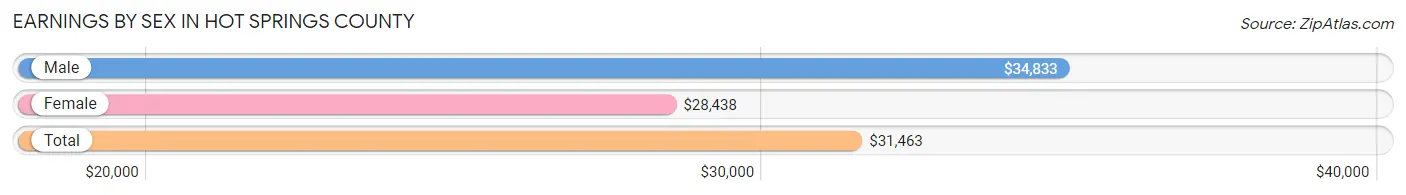
| Sex | Number | Average Earnings |
| Male | 1,212 (52.6%) | $34,833 |
| Female | 1,092 (47.4%) | $28,438 |
| Total | 2,304 (100.0%) | $31,463 |
Earnings by Sex by Income Bracket in Hot Springs County
The most common earnings brackets in Hot Springs County are $75,000 to $99,999 for men (219 | 18.1%) and $5,000 to $7,499 for women (154 | 14.1%).
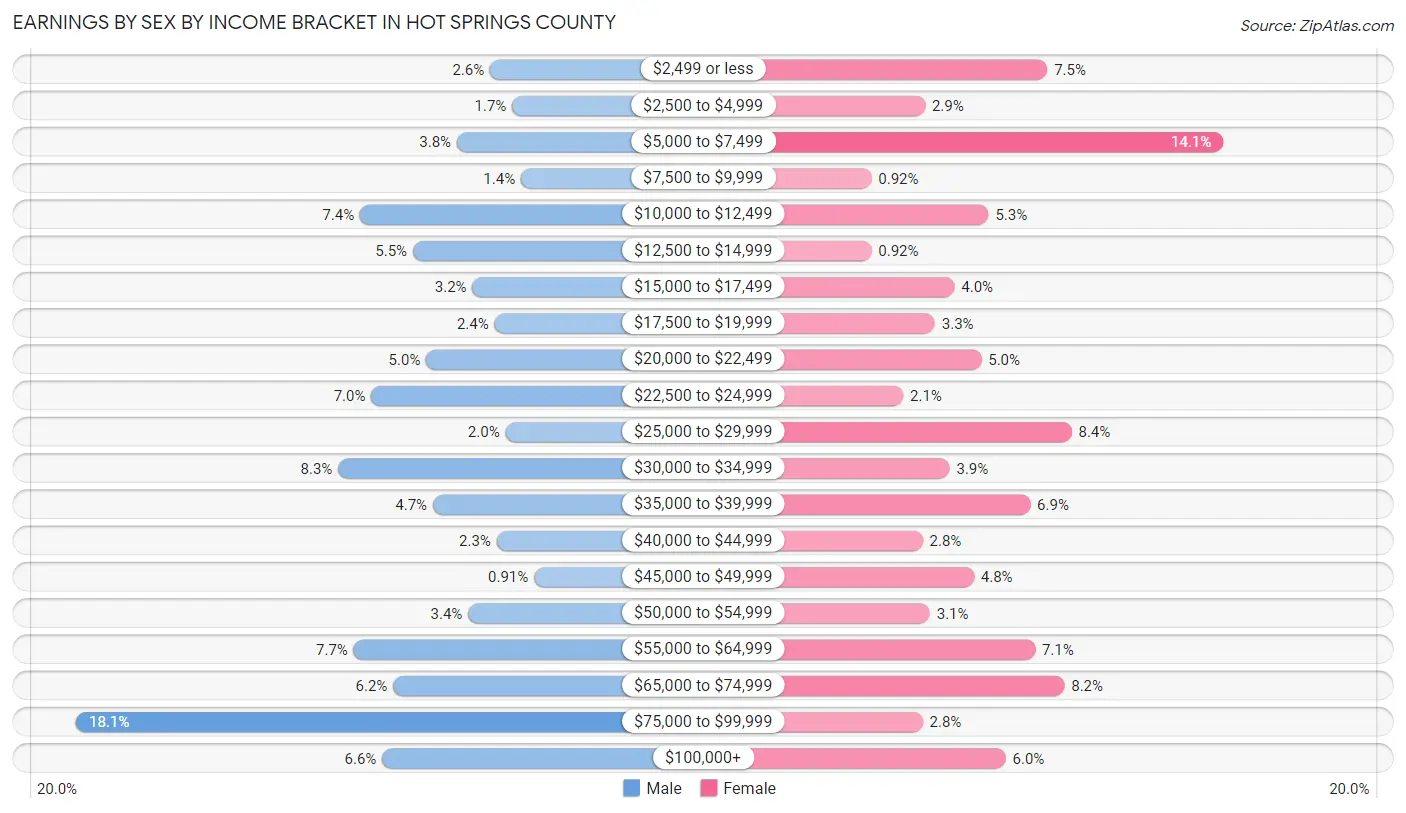
| Income | Male | Female |
| $2,499 or less | 31 (2.6%) | 82 (7.5%) |
| $2,500 to $4,999 | 21 (1.7%) | 32 (2.9%) |
| $5,000 to $7,499 | 46 (3.8%) | 154 (14.1%) |
| $7,500 to $9,999 | 17 (1.4%) | 10 (0.9%) |
| $10,000 to $12,499 | 90 (7.4%) | 58 (5.3%) |
| $12,500 to $14,999 | 66 (5.4%) | 10 (0.9%) |
| $15,000 to $17,499 | 39 (3.2%) | 44 (4.0%) |
| $17,500 to $19,999 | 29 (2.4%) | 36 (3.3%) |
| $20,000 to $22,499 | 60 (5.0%) | 55 (5.0%) |
| $22,500 to $24,999 | 85 (7.0%) | 23 (2.1%) |
| $25,000 to $29,999 | 24 (2.0%) | 92 (8.4%) |
| $30,000 to $34,999 | 100 (8.3%) | 42 (3.8%) |
| $35,000 to $39,999 | 57 (4.7%) | 75 (6.9%) |
| $40,000 to $44,999 | 28 (2.3%) | 31 (2.8%) |
| $45,000 to $49,999 | 11 (0.9%) | 52 (4.8%) |
| $50,000 to $54,999 | 41 (3.4%) | 34 (3.1%) |
| $55,000 to $64,999 | 93 (7.7%) | 77 (7.0%) |
| $65,000 to $74,999 | 75 (6.2%) | 89 (8.2%) |
| $75,000 to $99,999 | 219 (18.1%) | 31 (2.8%) |
| $100,000+ | 80 (6.6%) | 65 (5.9%) |
| Total | 1,212 (100.0%) | 1,092 (100.0%) |
Earnings by Sex by Educational Attainment in Hot Springs County
Average earnings in Hot Springs County are $39,353 for men and $31,563 for women, a difference of 19.8%. Men with an educational attainment of bachelor's degree enjoy the highest average annual earnings of $77,805, while those with less than high school education earn the least with $20,391. Women with an educational attainment of graduate degree earn the most with the average annual earnings of $74,219, while those with less than high school education have the smallest earnings of $31,042.
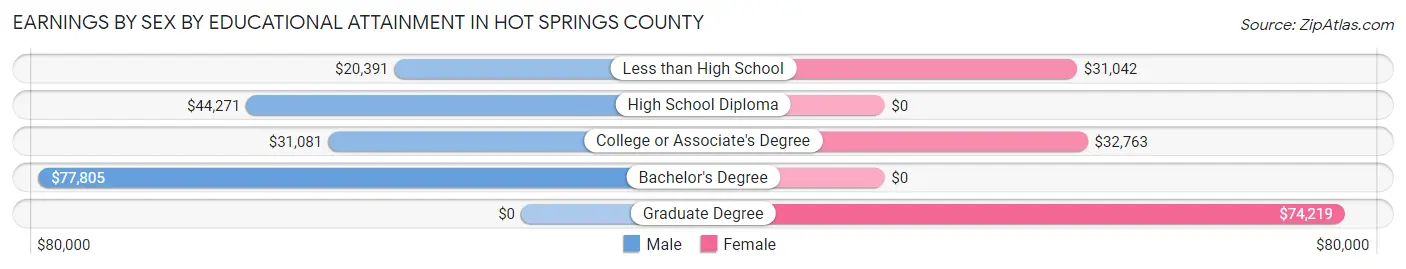
| Educational Attainment | Male Income | Female Income |
| Less than High School | $20,391 | $31,042 |
| High School Diploma | $44,271 | $0 |
| College or Associate's Degree | $31,081 | $32,763 |
| Bachelor's Degree | $77,805 | $0 |
| Graduate Degree | - | - |
| Total | $39,353 | $31,563 |
Family Income in Hot Springs County
Family Income Brackets in Hot Springs County
According to the Hot Springs County family income data, there are 306 families falling into the $100,000 to $149,999 income range, which is the most common income bracket and makes up 22.1% of all families. Conversely, the $10,000 to $14,999 income bracket is the least frequent group with only 4 families (0.3%) belonging to this category.
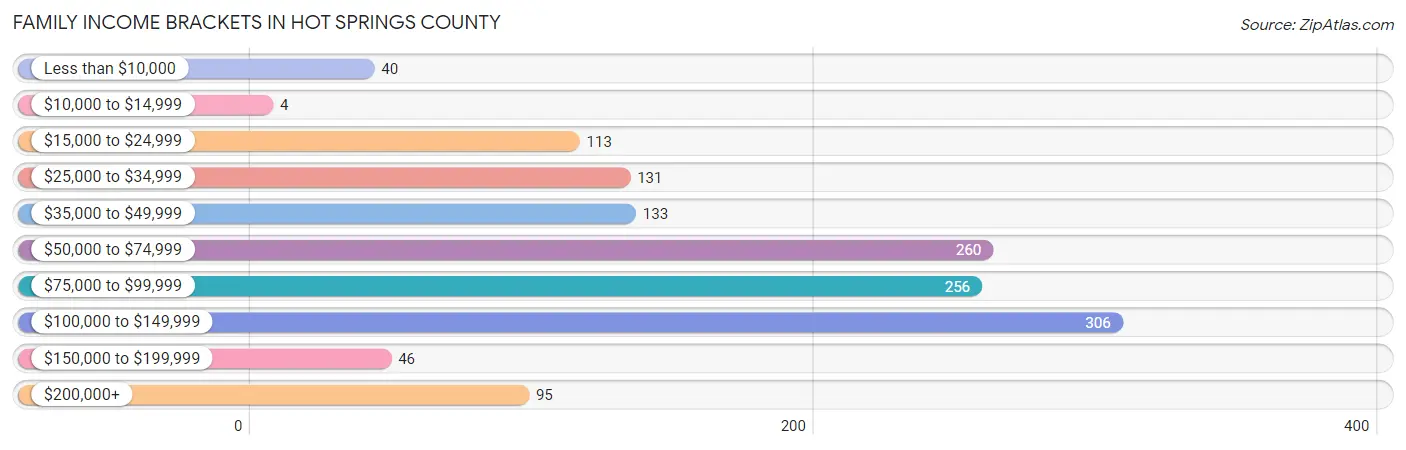
| Income Bracket | # Families | % Families |
| Less than $10,000 | 40 | 2.9% |
| $10,000 to $14,999 | 4 | 0.3% |
| $15,000 to $24,999 | 113 | 8.2% |
| $25,000 to $34,999 | 131 | 9.5% |
| $35,000 to $49,999 | 133 | 9.6% |
| $50,000 to $74,999 | 260 | 18.8% |
| $75,000 to $99,999 | 256 | 18.5% |
| $100,000 to $149,999 | 306 | 22.1% |
| $150,000 to $199,999 | 46 | 3.3% |
| $200,000+ | 95 | 6.9% |
Family Income by Famaliy Size in Hot Springs County
3-person families (92 | 6.7%) account for the highest median family income in Hot Springs County with $110,417 per family, while 3-person families (92 | 6.7%) have the highest median income of $36,806 per family member.
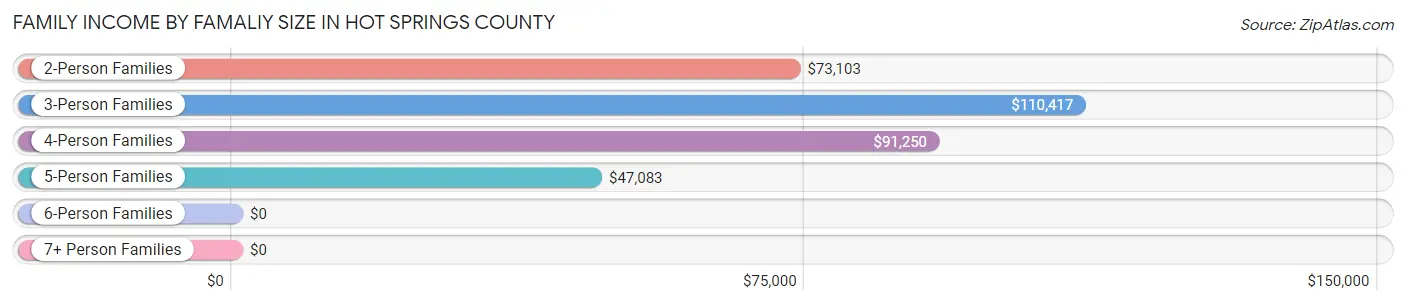
| Income Bracket | # Families | Median Income |
| 2-Person Families | 962 (69.6%) | $73,103 |
| 3-Person Families | 92 (6.7%) | $110,417 |
| 4-Person Families | 154 (11.1%) | $91,250 |
| 5-Person Families | 152 (11.0%) | $47,083 |
| 6-Person Families | 18 (1.3%) | $0 |
| 7+ Person Families | 5 (0.4%) | $0 |
| Total | 1,383 (100.0%) | $78,068 |
Family Income by Number of Earners in Hot Springs County
The median family income in Hot Springs County is $78,068, with families comprising 3+ earners (81) having the highest median family income of $104,886, while families with no earners (244) have the lowest median family income of $54,412, accounting for 5.9% and 17.6% of families, respectively.
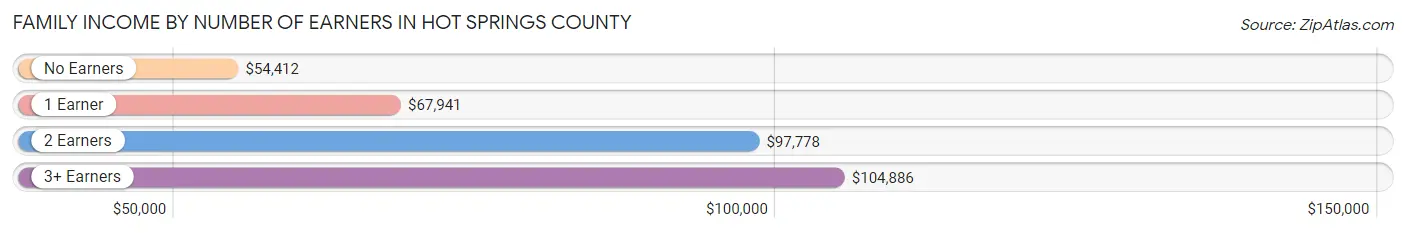
| Number of Earners | # Families | Median Income |
| No Earners | 244 (17.6%) | $54,412 |
| 1 Earner | 550 (39.8%) | $67,941 |
| 2 Earners | 508 (36.7%) | $97,778 |
| 3+ Earners | 81 (5.9%) | $104,886 |
| Total | 1,383 (100.0%) | $78,068 |
Household Income in Hot Springs County
Household Income Brackets in Hot Springs County
With 400 households falling in the category, the $75,000 to $99,999 income range is the most frequent in Hot Springs County, accounting for 19.0% of all households. In contrast, only 55 households (2.6%) fall into the $10,000 to $14,999 income bracket, making it the least populous group.
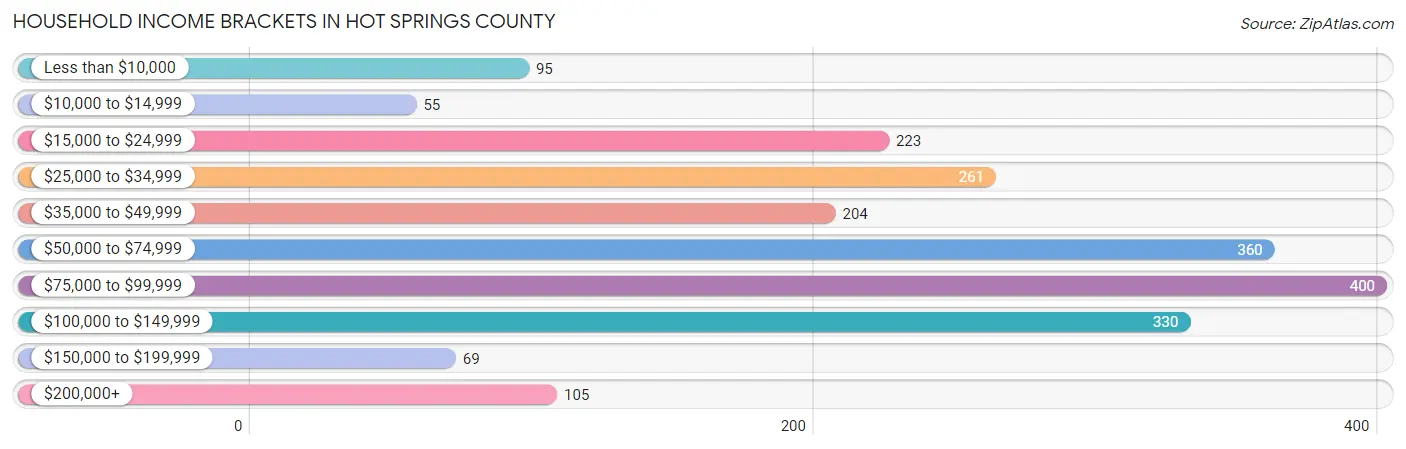
| Income Bracket | # Households | % Households |
| Less than $10,000 | 95 | 4.5% |
| $10,000 to $14,999 | 55 | 2.6% |
| $15,000 to $24,999 | 223 | 10.6% |
| $25,000 to $34,999 | 261 | 12.4% |
| $35,000 to $49,999 | 204 | 9.7% |
| $50,000 to $74,999 | 360 | 17.1% |
| $75,000 to $99,999 | 400 | 19.0% |
| $100,000 to $149,999 | 330 | 15.7% |
| $150,000 to $199,999 | 69 | 3.3% |
| $200,000+ | 105 | 5.0% |
Household Income by Householder Age in Hot Springs County
The median household income in Hot Springs County is $64,031, with the highest median household income of $74,856 found in the 45 to 64 years age bracket for the primary householder. A total of 725 households (34.4%) fall into this category. Meanwhile, the 15 to 24 years age bracket for the primary householder has the lowest median household income of $0, with 147 households (7.0%) in this group.
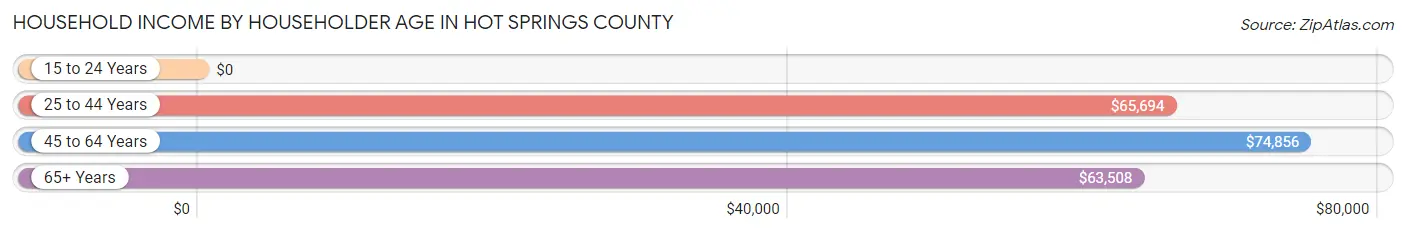
| Income Bracket | # Households | Median Income |
| 15 to 24 Years | 147 (7.0%) | $0 |
| 25 to 44 Years | 470 (22.3%) | $65,694 |
| 45 to 64 Years | 725 (34.4%) | $74,856 |
| 65+ Years | 763 (36.2%) | $63,508 |
| Total | 2,105 (100.0%) | $64,031 |
Poverty in Hot Springs County
Income Below Poverty by Sex and Age in Hot Springs County
With 11.4% poverty level for males and 20.7% for females among the residents of Hot Springs County, 25 to 34 year old males and 5 year old females are the most vulnerable to poverty, with 82 males (41.6%) and 2 females (100.0%) in their respective age groups living below the poverty level.
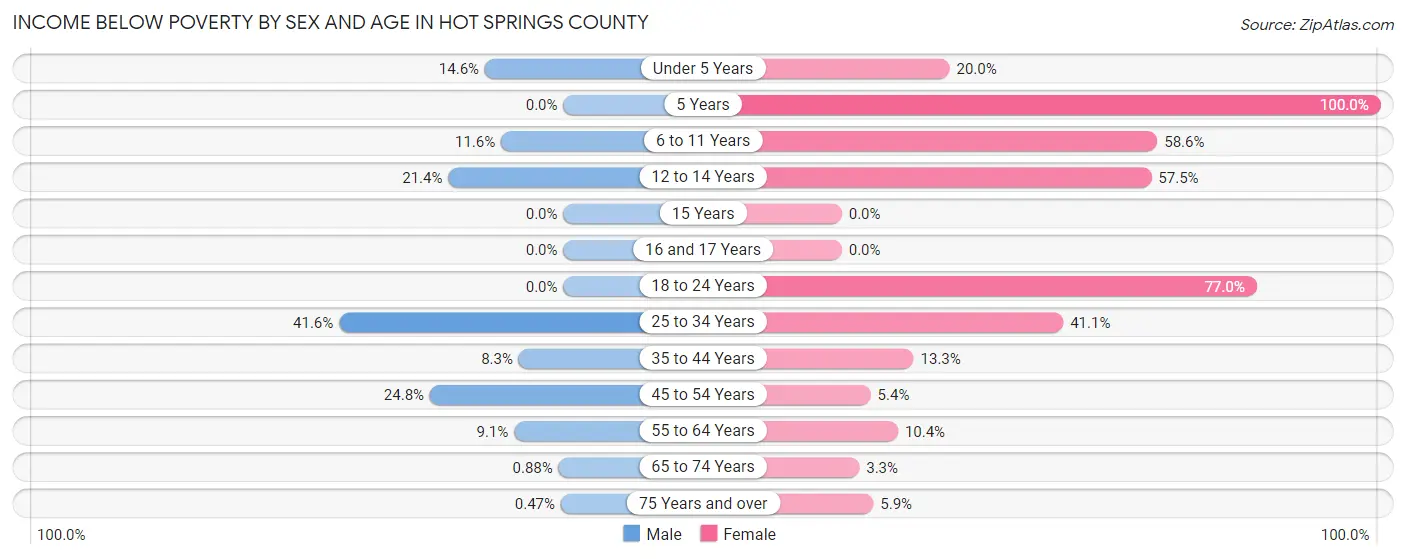
| Age Bracket | Male | Female |
| Under 5 Years | 15 (14.6%) | 23 (20.0%) |
| 5 Years | 0 (0.0%) | 2 (100.0%) |
| 6 to 11 Years | 23 (11.6%) | 82 (58.6%) |
| 12 to 14 Years | 19 (21.3%) | 50 (57.5%) |
| 15 Years | 0 (0.0%) | 0 (0.0%) |
| 16 and 17 Years | 0 (0.0%) | 0 (0.0%) |
| 18 to 24 Years | 0 (0.0%) | 134 (77.0%) |
| 25 to 34 Years | 82 (41.6%) | 67 (41.1%) |
| 35 to 44 Years | 22 (8.3%) | 38 (13.3%) |
| 45 to 54 Years | 53 (24.8%) | 15 (5.4%) |
| 55 to 64 Years | 33 (9.1%) | 32 (10.4%) |
| 65 to 74 Years | 3 (0.9%) | 12 (3.3%) |
| 75 Years and over | 1 (0.5%) | 14 (5.9%) |
| Total | 251 (11.4%) | 469 (20.7%) |
Income Above Poverty by Sex and Age in Hot Springs County
According to the poverty statistics in Hot Springs County, males aged 5 years and females aged 15 years are the age groups that are most secure financially, with 100.0% of males and 100.0% of females in these age groups living above the poverty line.
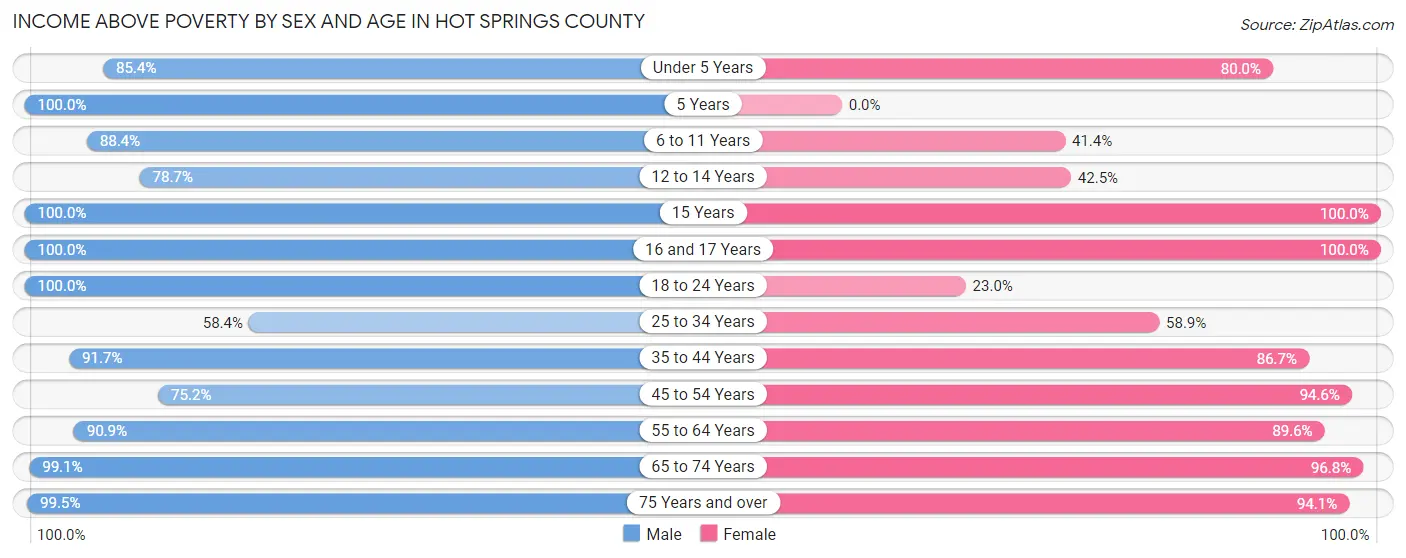
| Age Bracket | Male | Female |
| Under 5 Years | 88 (85.4%) | 92 (80.0%) |
| 5 Years | 29 (100.0%) | 0 (0.0%) |
| 6 to 11 Years | 176 (88.4%) | 58 (41.4%) |
| 12 to 14 Years | 70 (78.6%) | 37 (42.5%) |
| 15 Years | 12 (100.0%) | 37 (100.0%) |
| 16 and 17 Years | 16 (100.0%) | 70 (100.0%) |
| 18 to 24 Years | 170 (100.0%) | 40 (23.0%) |
| 25 to 34 Years | 115 (58.4%) | 96 (58.9%) |
| 35 to 44 Years | 244 (91.7%) | 247 (86.7%) |
| 45 to 54 Years | 161 (75.2%) | 265 (94.6%) |
| 55 to 64 Years | 328 (90.9%) | 275 (89.6%) |
| 65 to 74 Years | 337 (99.1%) | 357 (96.8%) |
| 75 Years and over | 212 (99.5%) | 225 (94.1%) |
| Total | 1,958 (88.6%) | 1,799 (79.3%) |
Income Below Poverty Among Married-Couple Families in Hot Springs County
The poverty statistics for married-couple families in Hot Springs County show that 6.8% or 71 of the total 1,051 families live below the poverty line. Families with 3 or 4 children have the highest poverty rate of 30.3%, comprising of 37 families. On the other hand, families with 1 or 2 children have the lowest poverty rate of 0.0%, which includes 0 families.
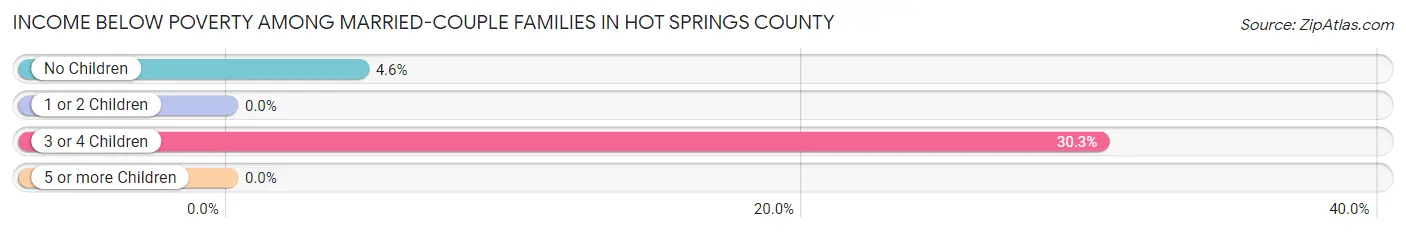
| Children | Above Poverty | Below Poverty |
| No Children | 714 (95.5%) | 34 (4.5%) |
| 1 or 2 Children | 181 (100.0%) | 0 (0.0%) |
| 3 or 4 Children | 85 (69.7%) | 37 (30.3%) |
| 5 or more Children | 0 (0.0%) | 0 (0.0%) |
| Total | 980 (93.2%) | 71 (6.8%) |
Income Below Poverty Among Single-Parent Households in Hot Springs County
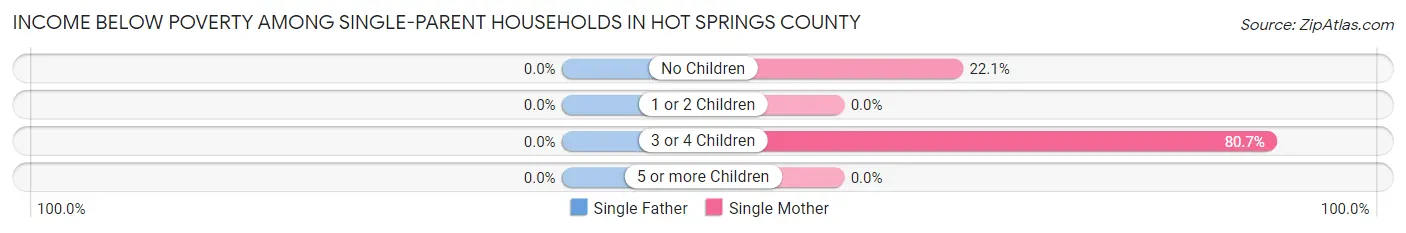
| Children | Single Father | Single Mother |
| No Children | 0 (0.0%) | 27 (22.1%) |
| 1 or 2 Children | 0 (0.0%) | 0 (0.0%) |
| 3 or 4 Children | 0 (0.0%) | 25 (80.6%) |
| 5 or more Children | 0 (0.0%) | 0 (0.0%) |
| Total | 0 (0.0%) | 52 (27.8%) |
Income Below Poverty Among Married-Couple vs Single-Parent Households in Hot Springs County
The poverty data for Hot Springs County shows that 71 of the married-couple family households (6.8%) and 52 of the single-parent households (15.7%) are living below the poverty level. Within the married-couple family households, those with 3 or 4 children have the highest poverty rate, with 37 households (30.3%) falling below the poverty line. Among the single-parent households, those with 3 or 4 children have the highest poverty rate, with 25 household (80.6%) living below poverty.
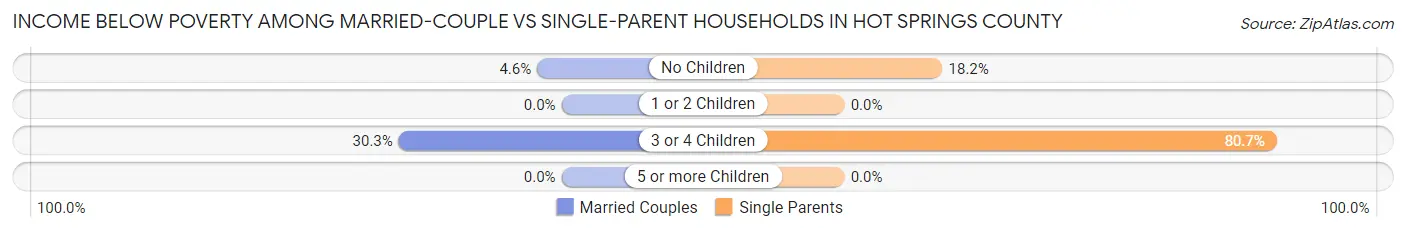
| Children | Married-Couple Families | Single-Parent Households |
| No Children | 34 (4.5%) | 27 (18.2%) |
| 1 or 2 Children | 0 (0.0%) | 0 (0.0%) |
| 3 or 4 Children | 37 (30.3%) | 25 (80.6%) |
| 5 or more Children | 0 (0.0%) | 0 (0.0%) |
| Total | 71 (6.8%) | 52 (15.7%) |
Employment Characteristics in Hot Springs County
Employment by Class of Employer in Hot Springs County
Among the 2,008 employed individuals in Hot Springs County, private company employees (946 | 47.1%), local government employees (244 | 12.1%), and state government employees (241 | 12.0%) make up the most common classes of employment.
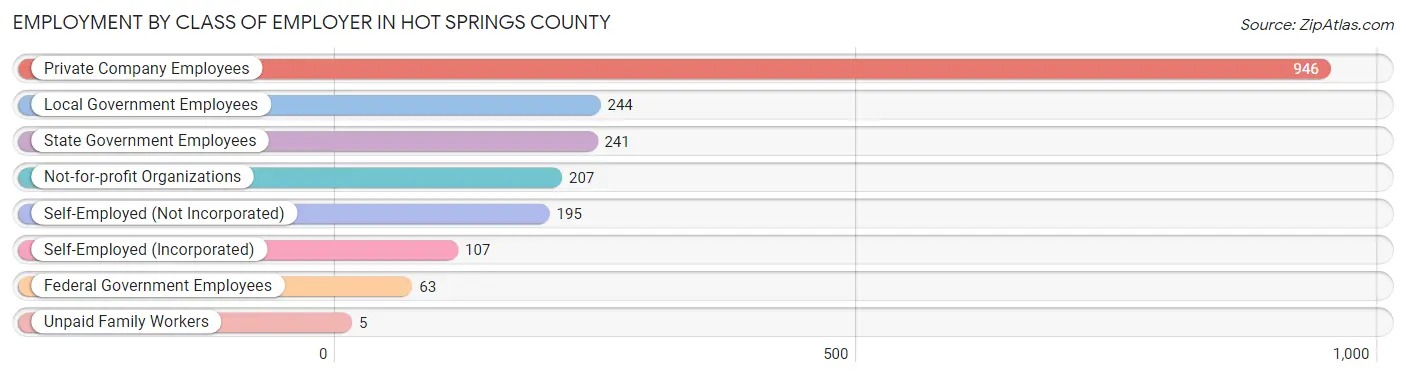
| Employer Class | # Employees | % Employees |
| Private Company Employees | 946 | 47.1% |
| Self-Employed (Incorporated) | 107 | 5.3% |
| Self-Employed (Not Incorporated) | 195 | 9.7% |
| Not-for-profit Organizations | 207 | 10.3% |
| Local Government Employees | 244 | 12.1% |
| State Government Employees | 241 | 12.0% |
| Federal Government Employees | 63 | 3.1% |
| Unpaid Family Workers | 5 | 0.3% |
| Total | 2,008 | 100.0% |
Employment Status by Age in Hot Springs County
According to the labor force statistics for Hot Springs County, out of the total population over 16 years of age (3,738), 56.8% or 2,123 individuals are in the labor force, with 1.4% or 30 of them unemployed. The age group with the highest labor force participation rate is 25 to 29 years, with 90.3% or 168 individuals in the labor force. Within the labor force, the 25 to 29 years age range has the highest percentage of unemployed individuals, with 7.1% or 12 of them being unemployed.
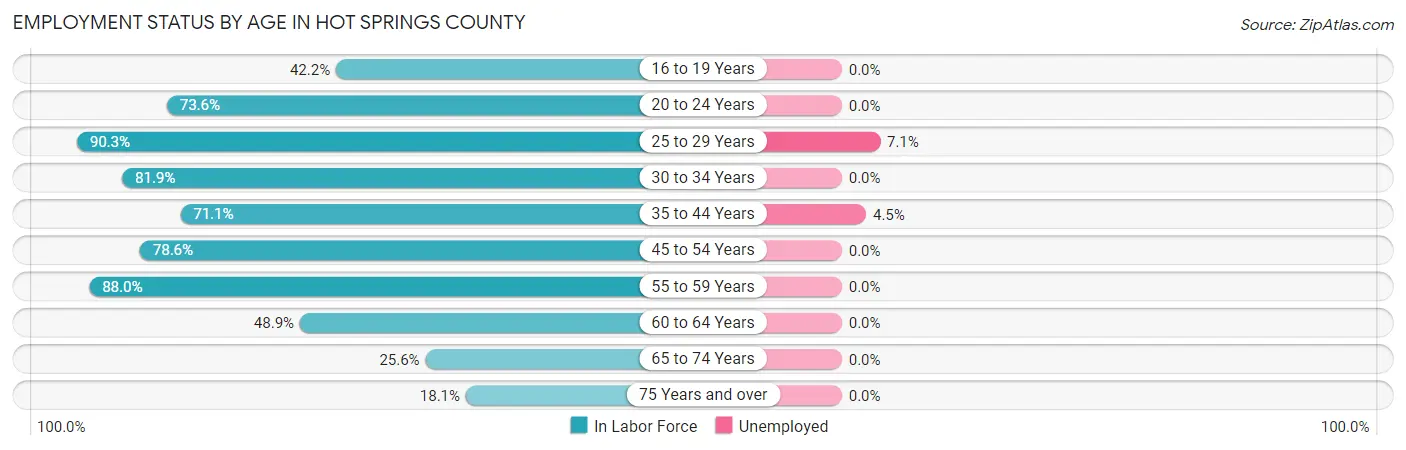
| Age Bracket | In Labor Force | Unemployed |
| 16 to 19 Years | 76 (42.2%) | 0 (0.0%) |
| 20 to 24 Years | 184 (73.6%) | 0 (0.0%) |
| 25 to 29 Years | 168 (90.3%) | 12 (7.1%) |
| 30 to 34 Years | 149 (81.9%) | 0 (0.0%) |
| 35 to 44 Years | 397 (71.1%) | 18 (4.5%) |
| 45 to 54 Years | 389 (78.6%) | 0 (0.0%) |
| 55 to 59 Years | 353 (88.0%) | 0 (0.0%) |
| 60 to 64 Years | 135 (48.9%) | 0 (0.0%) |
| 65 to 74 Years | 182 (25.6%) | 0 (0.0%) |
| 75 Years and over | 90 (18.1%) | 0 (0.0%) |
| Total | 2,123 (56.8%) | 30 (1.4%) |
Employment Status by Educational Attainment in Hot Springs County
According to labor force statistics for Hot Springs County, 75.8% of individuals (1,590) out of the total population between 25 and 64 years of age (2,098) are in the labor force, with 1.9% or 30 of them being unemployed. The group with the highest labor force participation rate are those with the educational attainment of less than high school, with 82.4% or 84 individuals in the labor force. Within the labor force, individuals with high school diploma education have the highest percentage of unemployment, with 2.8% or 8 of them being unemployed.
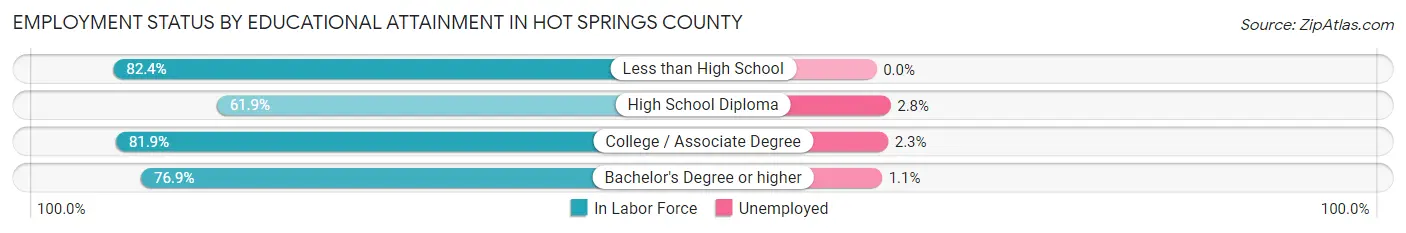
| Educational Attainment | In Labor Force | Unemployed |
| Less than High School | 84 (82.4%) | 0 (0.0%) |
| High School Diploma | 288 (61.9%) | 13 (2.8%) |
| College / Associate Degree | 691 (81.9%) | 19 (2.3%) |
| Bachelor's Degree or higher | 528 (76.9%) | 8 (1.1%) |
| Total | 1,590 (75.8%) | 40 (1.9%) |
Employment Occupations by Sex in Hot Springs County
Management, Business, Science and Arts Occupations
The most common Management, Business, Science and Arts occupations in Hot Springs County are Management (293 | 14.0%), Health Diagnosing & Treating (199 | 9.5%), Community & Social Service (159 | 7.6%), Health Technologists (150 | 7.2%), and Education Instruction & Library (125 | 6.0%).
Management, Business, Science and Arts Occupations by Sex
Within the Management, Business, Science and Arts occupations in Hot Springs County, the most male-oriented occupations are Architecture & Engineering (100.0%), Life, Physical & Social Science (75.9%), and Education, Arts & Media (73.5%), while the most female-oriented occupations are Health Technologists (92.0%), Health Diagnosing & Treating (85.4%), and Computers & Mathematics (70.4%).
| Occupation | Male | Female |
| Management | 178 (60.8%) | 115 (39.3%) |
| Business & Financial | 13 (50.0%) | 13 (50.0%) |
| Computers, Engineering & Science | 54 (67.5%) | 26 (32.5%) |
| Computers & Mathematics | 8 (29.6%) | 19 (70.4%) |
| Architecture & Engineering | 24 (100.0%) | 0 (0.0%) |
| Life, Physical & Social Science | 22 (75.9%) | 7 (24.1%) |
| Community & Social Service | 65 (40.9%) | 94 (59.1%) |
| Education, Arts & Media | 25 (73.5%) | 9 (26.5%) |
| Legal Services & Support | 0 (0.0%) | 0 (0.0%) |
| Education Instruction & Library | 40 (32.0%) | 85 (68.0%) |
| Arts, Media & Entertainment | 0 (0.0%) | 0 (0.0%) |
| Health Diagnosing & Treating | 29 (14.6%) | 170 (85.4%) |
| Health Technologists | 12 (8.0%) | 138 (92.0%) |
| Total (Category) | 339 (44.8%) | 418 (55.2%) |
| Total (Overall) | 1,150 (54.9%) | 943 (45.1%) |
Services Occupations
The most common Services occupations in Hot Springs County are Food Preparation & Serving (173 | 8.3%), Personal Care & Service (139 | 6.6%), Security & Protection (96 | 4.6%), Law Enforcement (96 | 4.6%), and Cleaning & Maintenance (39 | 1.9%).
Services Occupations by Sex
Within the Services occupations in Hot Springs County, the most male-oriented occupations are Security & Protection (81.2%), Law Enforcement (81.2%), and Cleaning & Maintenance (66.7%), while the most female-oriented occupations are Healthcare Support (100.0%), Personal Care & Service (87.8%), and Food Preparation & Serving (53.2%).
| Occupation | Male | Female |
| Healthcare Support | 0 (0.0%) | 18 (100.0%) |
| Security & Protection | 78 (81.2%) | 18 (18.8%) |
| Firefighting & Prevention | 0 (0.0%) | 0 (0.0%) |
| Law Enforcement | 78 (81.2%) | 18 (18.8%) |
| Food Preparation & Serving | 81 (46.8%) | 92 (53.2%) |
| Cleaning & Maintenance | 26 (66.7%) | 13 (33.3%) |
| Personal Care & Service | 17 (12.2%) | 122 (87.8%) |
| Total (Category) | 202 (43.4%) | 263 (56.6%) |
| Total (Overall) | 1,150 (54.9%) | 943 (45.1%) |
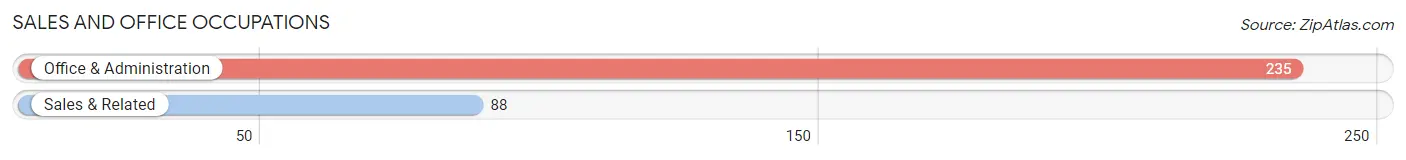
Sales and Office Occupations
The most common Sales and Office occupations in Hot Springs County are Office & Administration (235 | 11.2%), and Sales & Related (88 | 4.2%).
Sales and Office Occupations by Sex
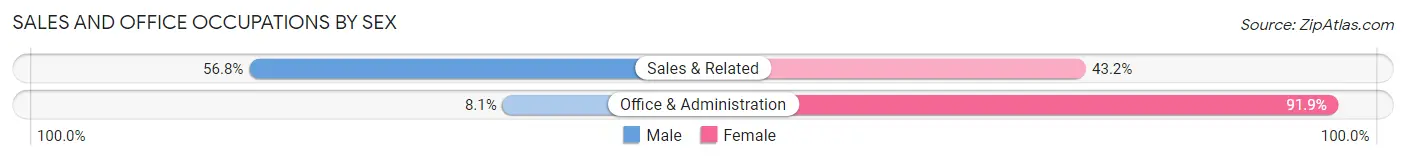
| Occupation | Male | Female |
| Sales & Related | 50 (56.8%) | 38 (43.2%) |
| Office & Administration | 19 (8.1%) | 216 (91.9%) |
| Total (Category) | 69 (21.4%) | 254 (78.6%) |
| Total (Overall) | 1,150 (54.9%) | 943 (45.1%) |
Natural Resources, Construction and Maintenance Occupations
The most common Natural Resources, Construction and Maintenance occupations in Hot Springs County are Construction & Extraction (203 | 9.7%), Installation, Maintenance & Repair (49 | 2.3%), and Farming, Fishing & Forestry (17 | 0.8%).
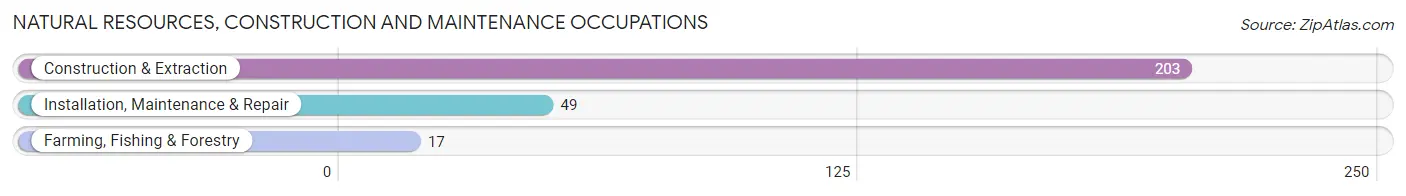
Natural Resources, Construction and Maintenance Occupations by Sex
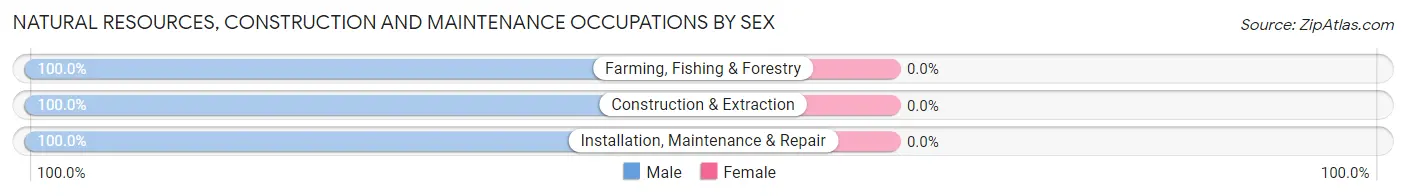
| Occupation | Male | Female |
| Farming, Fishing & Forestry | 17 (100.0%) | 0 (0.0%) |
| Construction & Extraction | 203 (100.0%) | 0 (0.0%) |
| Installation, Maintenance & Repair | 49 (100.0%) | 0 (0.0%) |
| Total (Category) | 269 (100.0%) | 0 (0.0%) |
| Total (Overall) | 1,150 (54.9%) | 943 (45.1%) |
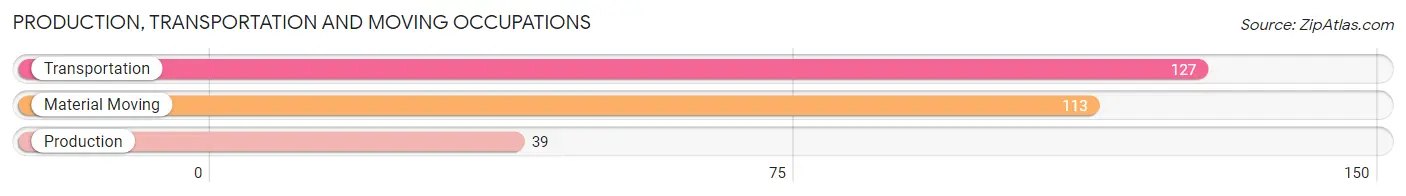
Production, Transportation and Moving Occupations
The most common Production, Transportation and Moving occupations in Hot Springs County are Transportation (127 | 6.1%), Material Moving (113 | 5.4%), and Production (39 | 1.9%).
Production, Transportation and Moving Occupations by Sex
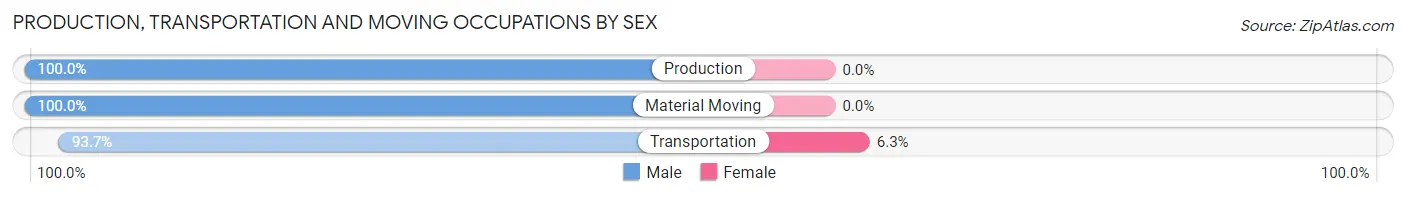
| Occupation | Male | Female |
| Production | 39 (100.0%) | 0 (0.0%) |
| Transportation | 119 (93.7%) | 8 (6.3%) |
| Material Moving | 113 (100.0%) | 0 (0.0%) |
| Total (Category) | 271 (97.1%) | 8 (2.9%) |
| Total (Overall) | 1,150 (54.9%) | 943 (45.1%) |
Employment Industries by Sex in Hot Springs County
Employment Industries in Hot Springs County
The major employment industries in Hot Springs County include Health Care & Social Assistance (365 | 17.4%), Educational Services (292 | 14.0%), Accommodation & Food Services (232 | 11.1%), Public Administration (203 | 9.7%), and Construction (185 | 8.8%).
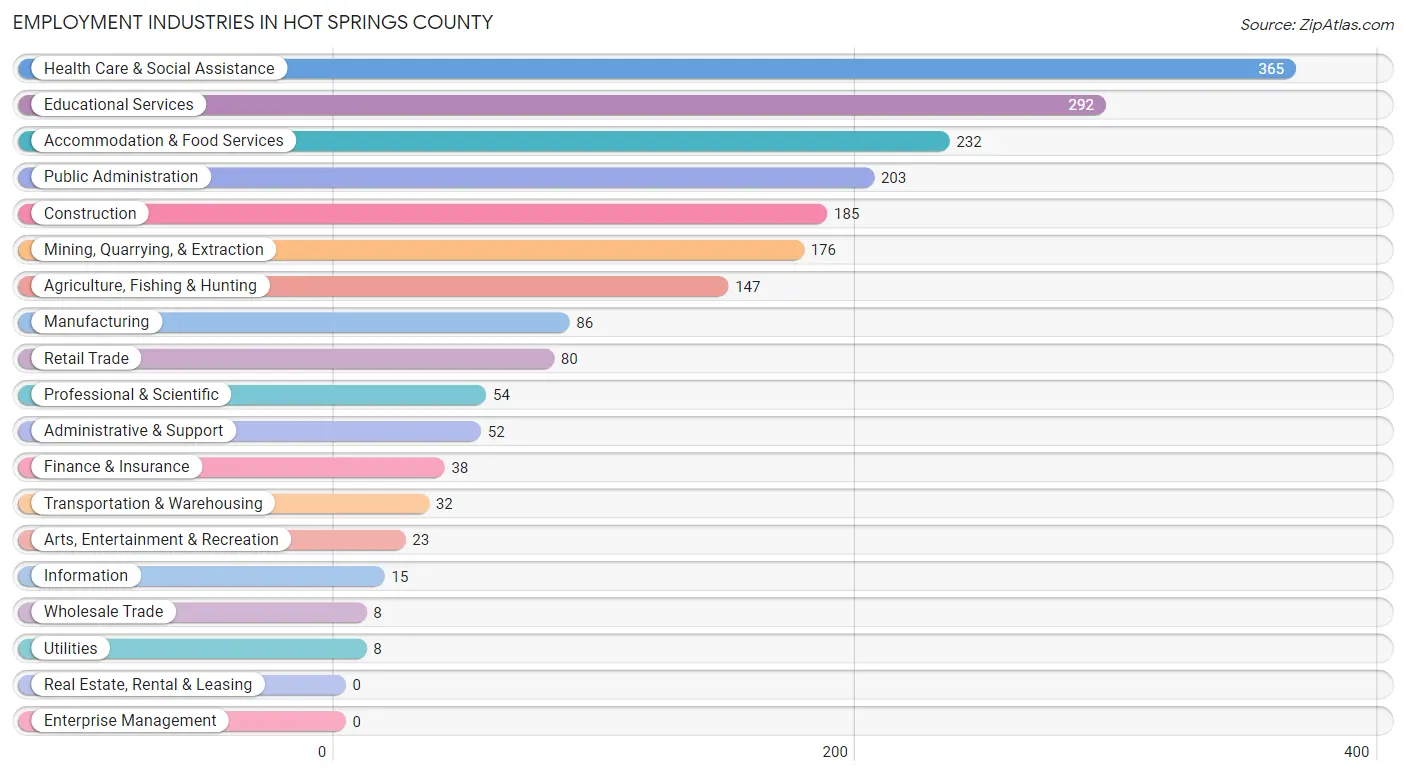
Employment Industries by Sex in Hot Springs County
The Hot Springs County industries that see more men than women are Wholesale Trade (100.0%), Utilities (100.0%), and Mining, Quarrying, & Extraction (95.5%), whereas the industries that tend to have a higher number of women are Professional & Scientific (100.0%), Information (73.3%), and Health Care & Social Assistance (70.7%).
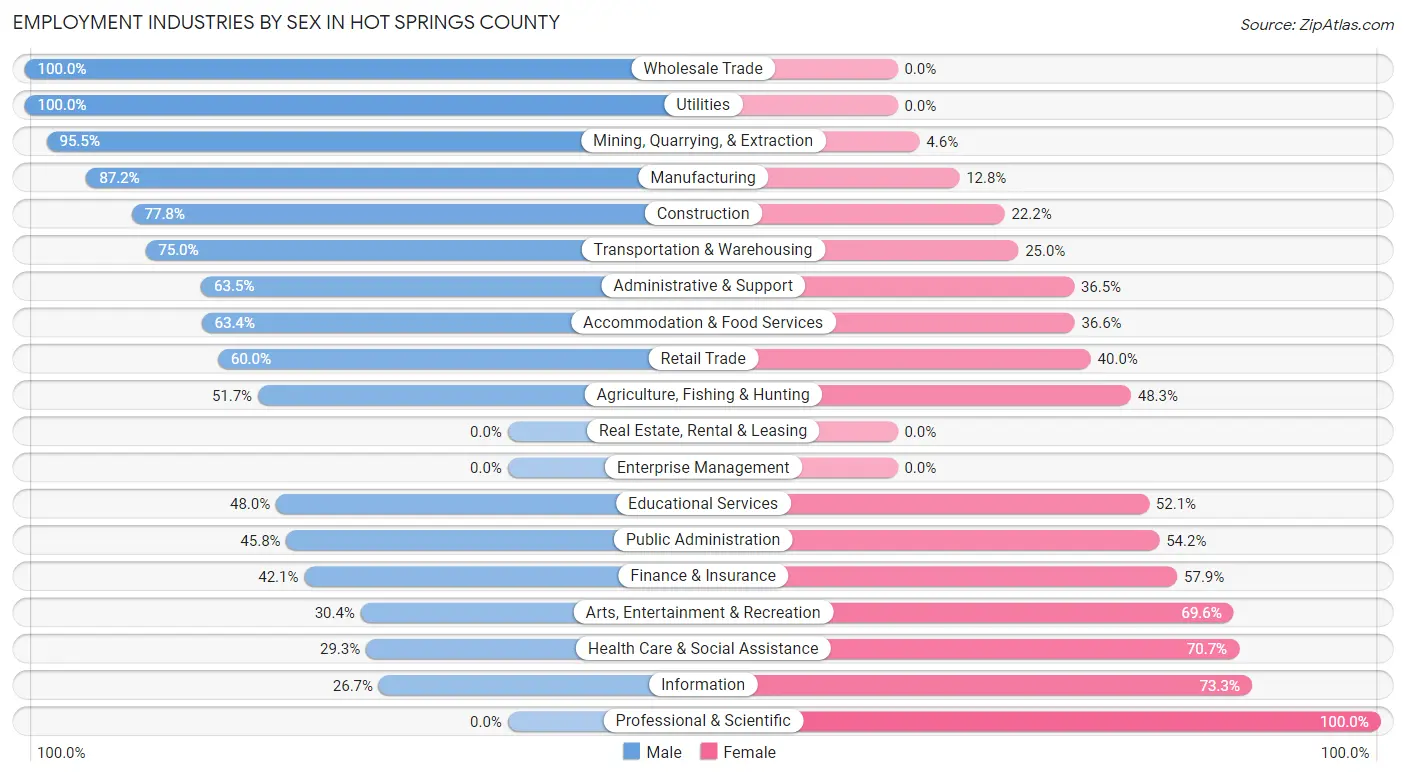
| Industry | Male | Female |
| Agriculture, Fishing & Hunting | 76 (51.7%) | 71 (48.3%) |
| Mining, Quarrying, & Extraction | 168 (95.5%) | 8 (4.5%) |
| Construction | 144 (77.8%) | 41 (22.2%) |
| Manufacturing | 75 (87.2%) | 11 (12.8%) |
| Wholesale Trade | 8 (100.0%) | 0 (0.0%) |
| Retail Trade | 48 (60.0%) | 32 (40.0%) |
| Transportation & Warehousing | 24 (75.0%) | 8 (25.0%) |
| Utilities | 8 (100.0%) | 0 (0.0%) |
| Information | 4 (26.7%) | 11 (73.3%) |
| Finance & Insurance | 16 (42.1%) | 22 (57.9%) |
| Real Estate, Rental & Leasing | 0 (0.0%) | 0 (0.0%) |
| Professional & Scientific | 0 (0.0%) | 54 (100.0%) |
| Enterprise Management | 0 (0.0%) | 0 (0.0%) |
| Administrative & Support | 33 (63.5%) | 19 (36.5%) |
| Educational Services | 140 (47.9%) | 152 (52.0%) |
| Health Care & Social Assistance | 107 (29.3%) | 258 (70.7%) |
| Arts, Entertainment & Recreation | 7 (30.4%) | 16 (69.6%) |
| Accommodation & Food Services | 147 (63.4%) | 85 (36.6%) |
| Public Administration | 93 (45.8%) | 110 (54.2%) |
| Total | 1,150 (54.9%) | 943 (45.1%) |
Education in Hot Springs County
School Enrollment in Hot Springs County
The most common levels of schooling among the 870 students in Hot Springs County are elementary school (231 | 26.6%), middle school (220 | 25.3%), and high school (214 | 24.6%).
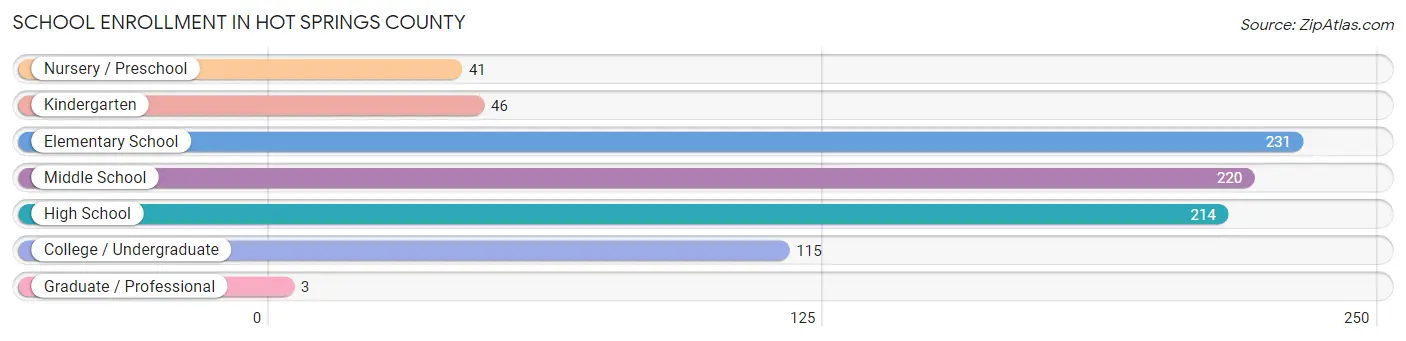
| School Level | # Students | % Students |
| Nursery / Preschool | 41 | 4.7% |
| Kindergarten | 46 | 5.3% |
| Elementary School | 231 | 26.6% |
| Middle School | 220 | 25.3% |
| High School | 214 | 24.6% |
| College / Undergraduate | 115 | 13.2% |
| Graduate / Professional | 3 | 0.3% |
| Total | 870 | 100.0% |
School Enrollment by Age by Funding Source in Hot Springs County
Out of a total of 870 students who are enrolled in schools in Hot Springs County, 48 (5.5%) attend a private institution, while the remaining 822 (94.5%) are enrolled in public schools. The age group of 3 to 4 year olds has the highest likelihood of being enrolled in private schools, with 7 (63.6% in the age bracket) enrolled. Conversely, the age group of 15 to 17 year olds has the lowest likelihood of being enrolled in a private school, with 136 (100.0% in the age bracket) attending a public institution.
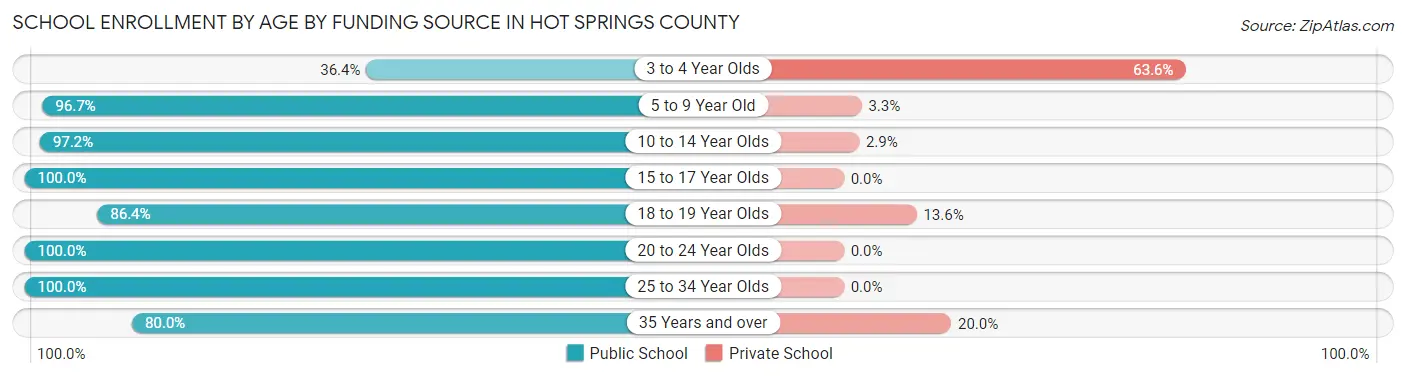
| Age Bracket | Public School | Private School |
| 3 to 4 Year Olds | 4 (36.4%) | 7 (63.6%) |
| 5 to 9 Year Old | 233 (96.7%) | 8 (3.3%) |
| 10 to 14 Year Olds | 307 (97.2%) | 9 (2.9%) |
| 15 to 17 Year Olds | 136 (100.0%) | 0 (0.0%) |
| 18 to 19 Year Olds | 51 (86.4%) | 8 (13.6%) |
| 20 to 24 Year Olds | 21 (100.0%) | 0 (0.0%) |
| 25 to 34 Year Olds | 6 (100.0%) | 0 (0.0%) |
| 35 Years and over | 64 (80.0%) | 16 (20.0%) |
| Total | 822 (94.5%) | 48 (5.5%) |
Educational Attainment by Field of Study in Hot Springs County
Education (191 | 19.5%), science & technology (151 | 15.4%), business (148 | 15.1%), bio, nature & agricultural (134 | 13.7%), and physical & health sciences (75 | 7.6%) are the most common fields of study among 981 individuals in Hot Springs County who have obtained a bachelor's degree or higher.
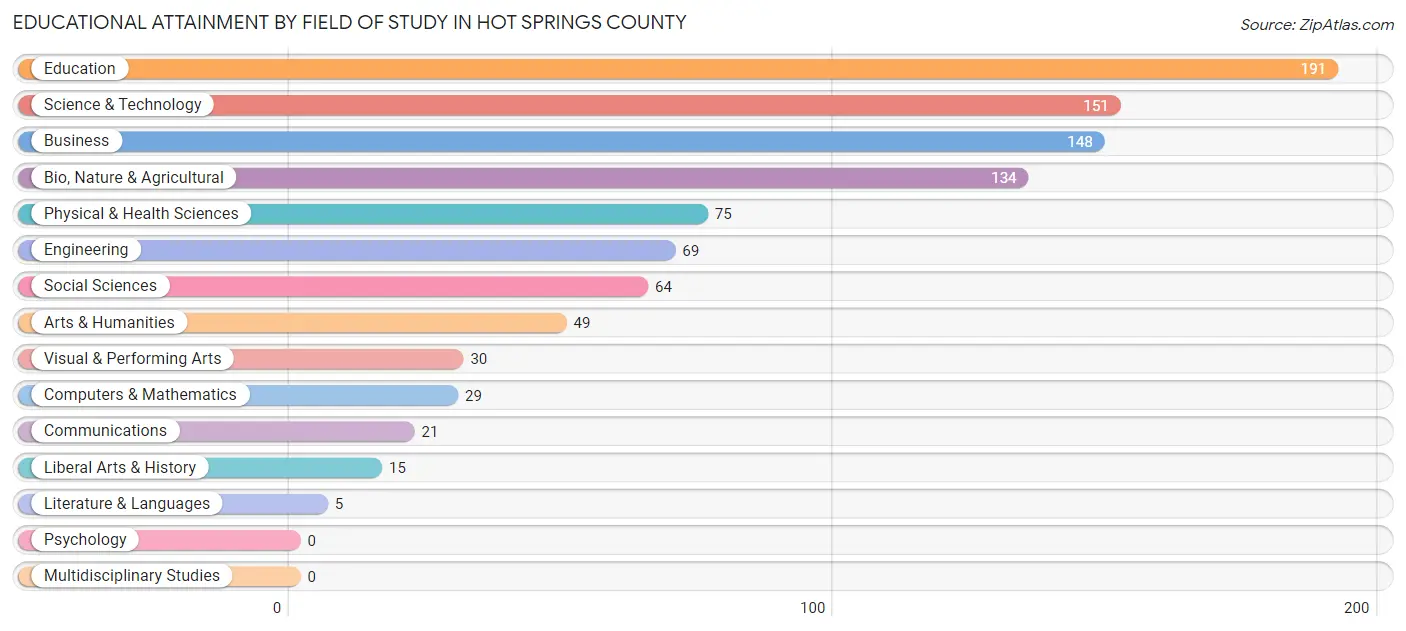
| Field of Study | # Graduates | % Graduates |
| Computers & Mathematics | 29 | 3.0% |
| Bio, Nature & Agricultural | 134 | 13.7% |
| Physical & Health Sciences | 75 | 7.6% |
| Psychology | 0 | 0.0% |
| Social Sciences | 64 | 6.5% |
| Engineering | 69 | 7.0% |
| Multidisciplinary Studies | 0 | 0.0% |
| Science & Technology | 151 | 15.4% |
| Business | 148 | 15.1% |
| Education | 191 | 19.5% |
| Literature & Languages | 5 | 0.5% |
| Liberal Arts & History | 15 | 1.5% |
| Visual & Performing Arts | 30 | 3.1% |
| Communications | 21 | 2.1% |
| Arts & Humanities | 49 | 5.0% |
| Total | 981 | 100.0% |
Transportation & Commute in Hot Springs County
Vehicle Availability by Sex in Hot Springs County
The most prevalent vehicle ownership categories in Hot Springs County are males with 2 vehicles (441, accounting for 39.9%) and females with 2 vehicles (316, making up 49.2%).
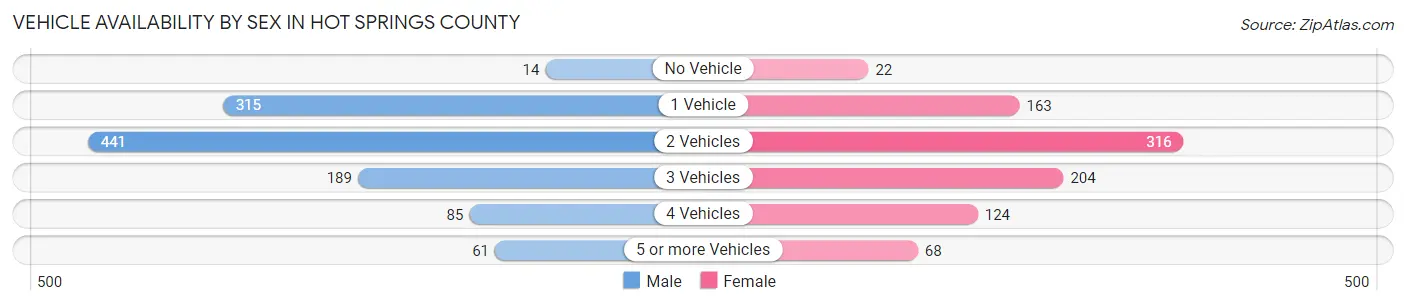
| Vehicles Available | Male | Female |
| No Vehicle | 14 (1.3%) | 22 (2.5%) |
| 1 Vehicle | 315 (28.5%) | 163 (18.2%) |
| 2 Vehicles | 441 (39.9%) | 316 (35.2%) |
| 3 Vehicles | 189 (17.1%) | 204 (22.7%) |
| 4 Vehicles | 85 (7.7%) | 124 (13.8%) |
| 5 or more Vehicles | 61 (5.5%) | 68 (7.6%) |
| Total | 1,105 (100.0%) | 897 (100.0%) |
Commute Time in Hot Springs County
The most frequently occuring commute durations in Hot Springs County are 5 to 9 minutes (783 commuters, 45.7%), less than 5 minutes (301 commuters, 17.5%), and 10 to 14 minutes (178 commuters, 10.4%).
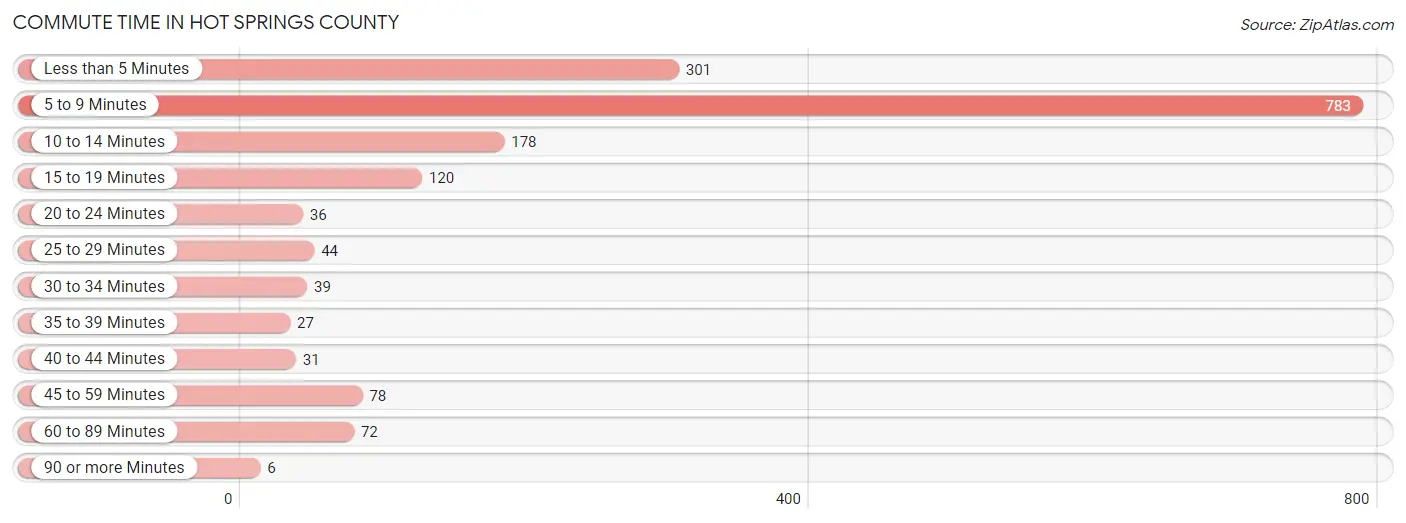
| Commute Time | # Commuters | % Commuters |
| Less than 5 Minutes | 301 | 17.5% |
| 5 to 9 Minutes | 783 | 45.7% |
| 10 to 14 Minutes | 178 | 10.4% |
| 15 to 19 Minutes | 120 | 7.0% |
| 20 to 24 Minutes | 36 | 2.1% |
| 25 to 29 Minutes | 44 | 2.6% |
| 30 to 34 Minutes | 39 | 2.3% |
| 35 to 39 Minutes | 27 | 1.6% |
| 40 to 44 Minutes | 31 | 1.8% |
| 45 to 59 Minutes | 78 | 4.5% |
| 60 to 89 Minutes | 72 | 4.2% |
| 90 or more Minutes | 6 | 0.4% |
Commute Time by Sex in Hot Springs County
The most common commute times in Hot Springs County are 5 to 9 minutes (441 commuters, 45.5%) for males and 5 to 9 minutes (342 commuters, 45.8%) for females.
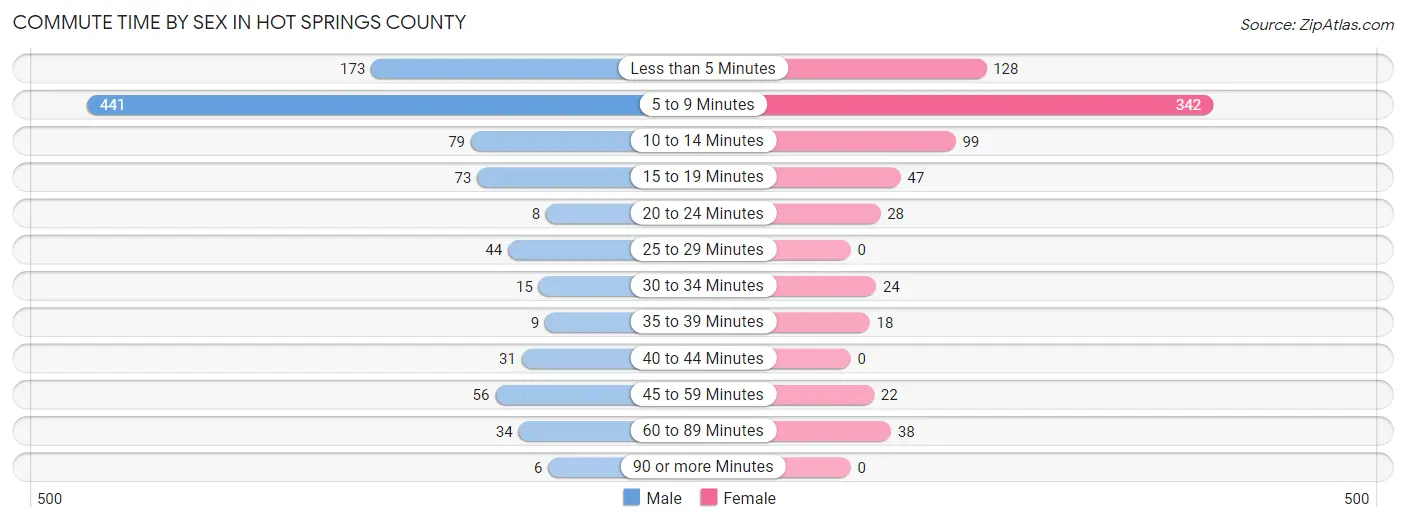
| Commute Time | Male | Female |
| Less than 5 Minutes | 173 (17.8%) | 128 (17.2%) |
| 5 to 9 Minutes | 441 (45.5%) | 342 (45.8%) |
| 10 to 14 Minutes | 79 (8.2%) | 99 (13.3%) |
| 15 to 19 Minutes | 73 (7.5%) | 47 (6.3%) |
| 20 to 24 Minutes | 8 (0.8%) | 28 (3.7%) |
| 25 to 29 Minutes | 44 (4.5%) | 0 (0.0%) |
| 30 to 34 Minutes | 15 (1.5%) | 24 (3.2%) |
| 35 to 39 Minutes | 9 (0.9%) | 18 (2.4%) |
| 40 to 44 Minutes | 31 (3.2%) | 0 (0.0%) |
| 45 to 59 Minutes | 56 (5.8%) | 22 (2.9%) |
| 60 to 89 Minutes | 34 (3.5%) | 38 (5.1%) |
| 90 or more Minutes | 6 (0.6%) | 0 (0.0%) |
Time of Departure to Work by Sex in Hot Springs County
The most frequent times of departure to work in Hot Springs County are 4:00 PM to 11:59 PM (187, 19.3%) for males and 7:30 AM to 7:59 AM (199, 26.7%) for females.
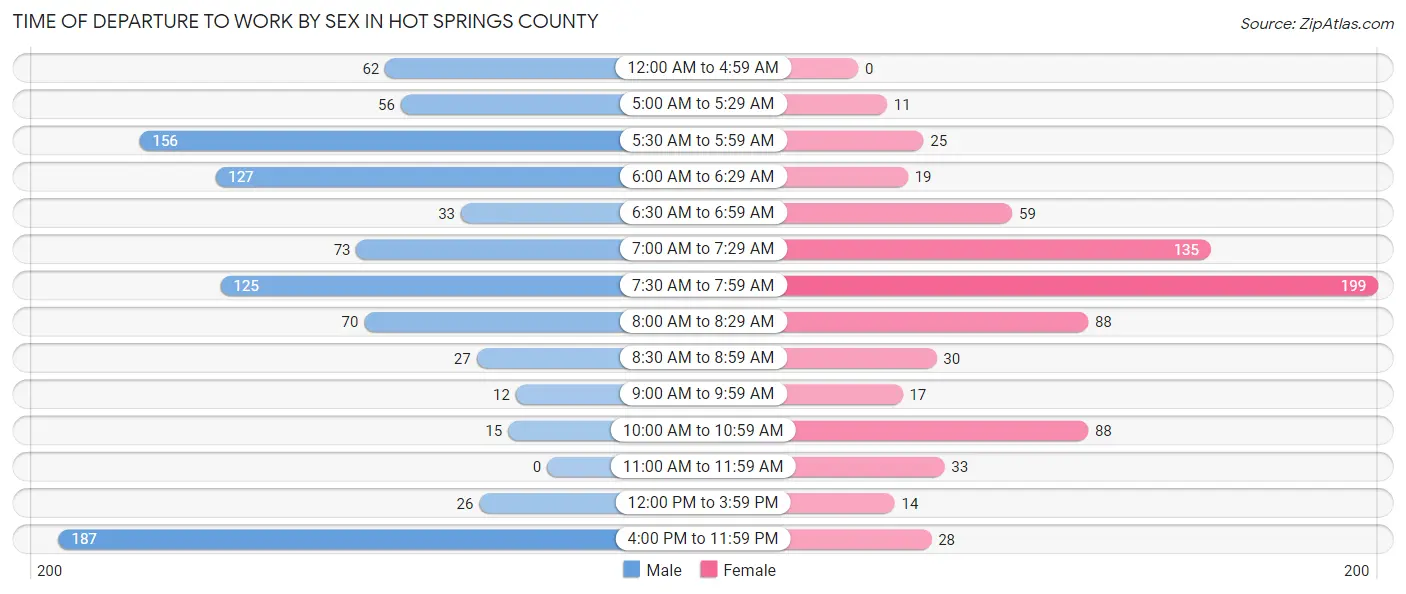
| Time of Departure | Male | Female |
| 12:00 AM to 4:59 AM | 62 (6.4%) | 0 (0.0%) |
| 5:00 AM to 5:29 AM | 56 (5.8%) | 11 (1.5%) |
| 5:30 AM to 5:59 AM | 156 (16.1%) | 25 (3.4%) |
| 6:00 AM to 6:29 AM | 127 (13.1%) | 19 (2.5%) |
| 6:30 AM to 6:59 AM | 33 (3.4%) | 59 (7.9%) |
| 7:00 AM to 7:29 AM | 73 (7.5%) | 135 (18.1%) |
| 7:30 AM to 7:59 AM | 125 (12.9%) | 199 (26.7%) |
| 8:00 AM to 8:29 AM | 70 (7.2%) | 88 (11.8%) |
| 8:30 AM to 8:59 AM | 27 (2.8%) | 30 (4.0%) |
| 9:00 AM to 9:59 AM | 12 (1.2%) | 17 (2.3%) |
| 10:00 AM to 10:59 AM | 15 (1.5%) | 88 (11.8%) |
| 11:00 AM to 11:59 AM | 0 (0.0%) | 33 (4.4%) |
| 12:00 PM to 3:59 PM | 26 (2.7%) | 14 (1.9%) |
| 4:00 PM to 11:59 PM | 187 (19.3%) | 28 (3.7%) |
| Total | 969 (100.0%) | 746 (100.0%) |
Housing Occupancy in Hot Springs County
Occupancy by Ownership in Hot Springs County
Of the total 2,105 dwellings in Hot Springs County, owner-occupied units account for 1,503 (71.4%), while renter-occupied units make up 602 (28.6%).
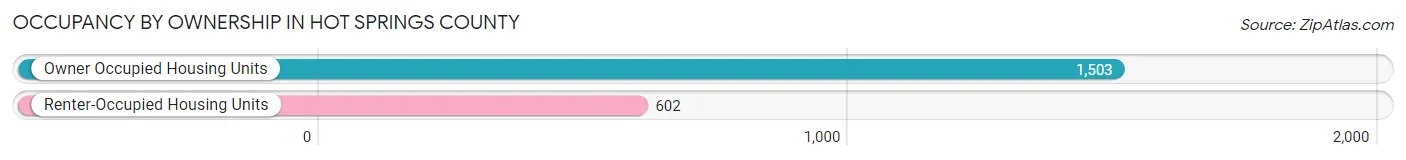
| Occupancy | # Housing Units | % Housing Units |
| Owner Occupied Housing Units | 1,503 | 71.4% |
| Renter-Occupied Housing Units | 602 | 28.6% |
| Total Occupied Housing Units | 2,105 | 100.0% |
Occupancy by Household Size in Hot Springs County
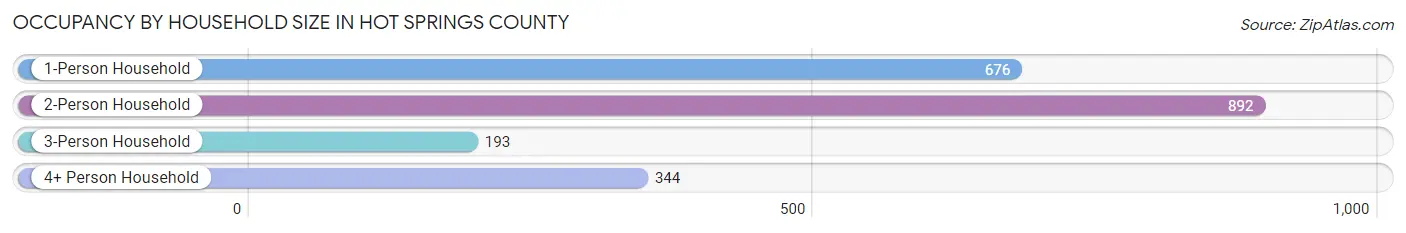
| Household Size | # Housing Units | % Housing Units |
| 1-Person Household | 676 | 32.1% |
| 2-Person Household | 892 | 42.4% |
| 3-Person Household | 193 | 9.2% |
| 4+ Person Household | 344 | 16.3% |
| Total Housing Units | 2,105 | 100.0% |
Occupancy by Ownership by Household Size in Hot Springs County
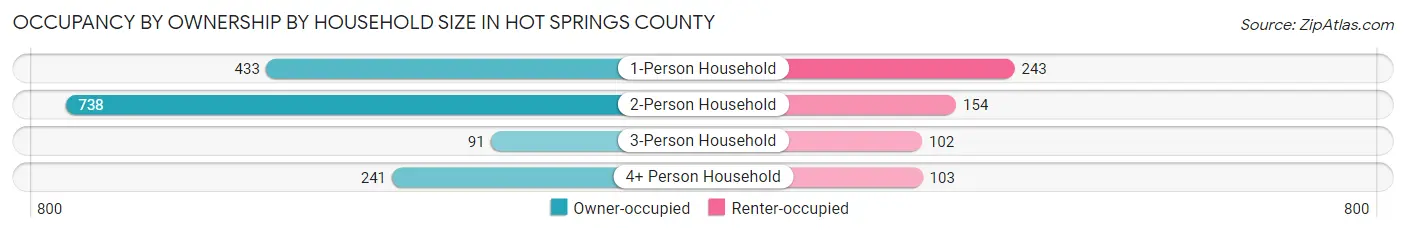
| Household Size | Owner-occupied | Renter-occupied |
| 1-Person Household | 433 (64.0%) | 243 (35.9%) |
| 2-Person Household | 738 (82.7%) | 154 (17.3%) |
| 3-Person Household | 91 (47.1%) | 102 (52.8%) |
| 4+ Person Household | 241 (70.1%) | 103 (29.9%) |
| Total Housing Units | 1,503 (71.4%) | 602 (28.6%) |
Occupancy by Educational Attainment in Hot Springs County
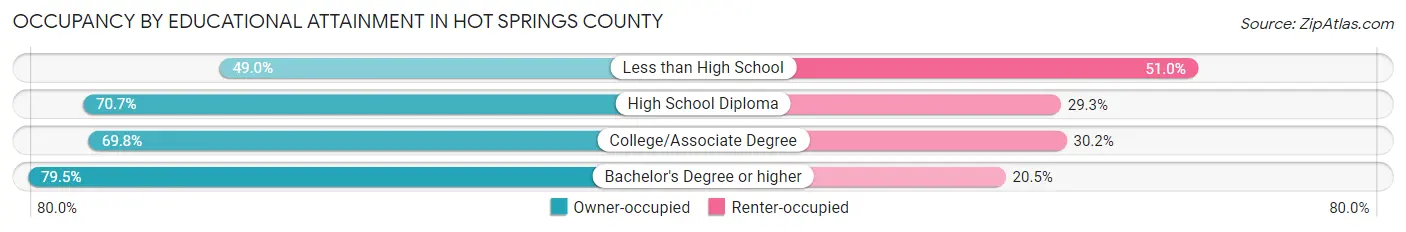
| Household Size | Owner-occupied | Renter-occupied |
| Less than High School | 51 (49.0%) | 53 (51.0%) |
| High School Diploma | 425 (70.7%) | 176 (29.3%) |
| College/Associate Degree | 617 (69.8%) | 267 (30.2%) |
| Bachelor's Degree or higher | 410 (79.5%) | 106 (20.5%) |
Occupancy by Age of Householder in Hot Springs County
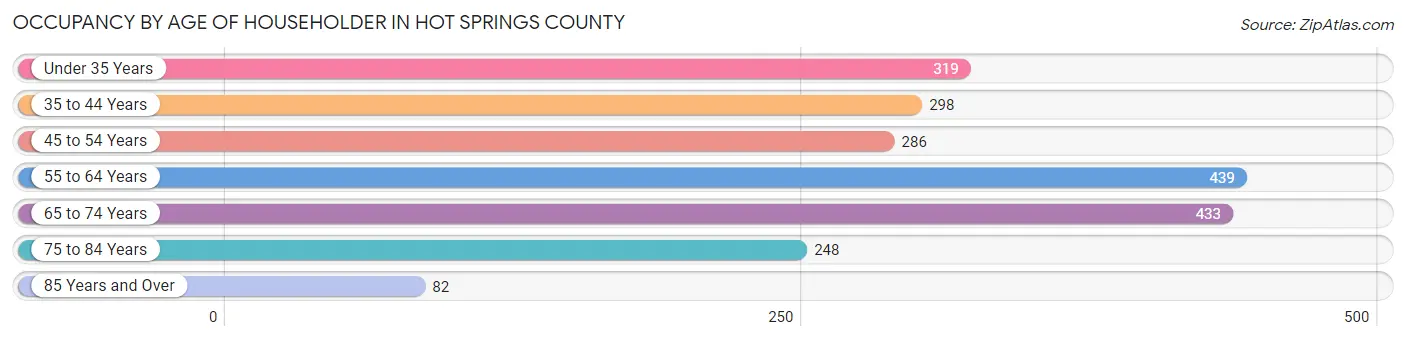
| Age Bracket | # Households | % Households |
| Under 35 Years | 319 | 15.1% |
| 35 to 44 Years | 298 | 14.2% |
| 45 to 54 Years | 286 | 13.6% |
| 55 to 64 Years | 439 | 20.9% |
| 65 to 74 Years | 433 | 20.6% |
| 75 to 84 Years | 248 | 11.8% |
| 85 Years and Over | 82 | 3.9% |
| Total | 2,105 | 100.0% |
Housing Finances in Hot Springs County
Median Income by Occupancy in Hot Springs County
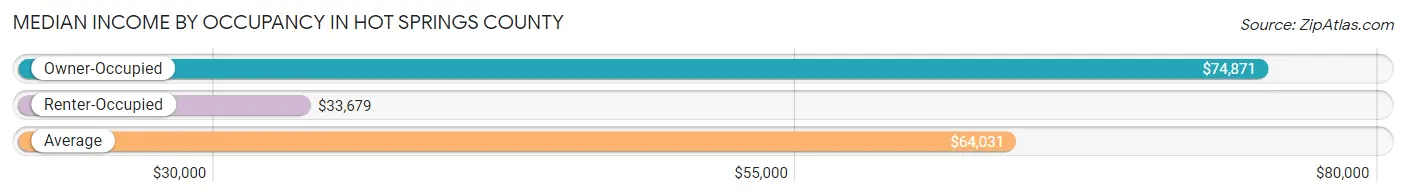
| Occupancy Type | # Households | Median Income |
| Owner-Occupied | 1,503 (71.4%) | $74,871 |
| Renter-Occupied | 602 (28.6%) | $33,679 |
| Average | 2,105 (100.0%) | $64,031 |
Occupancy by Householder Income Bracket in Hot Springs County
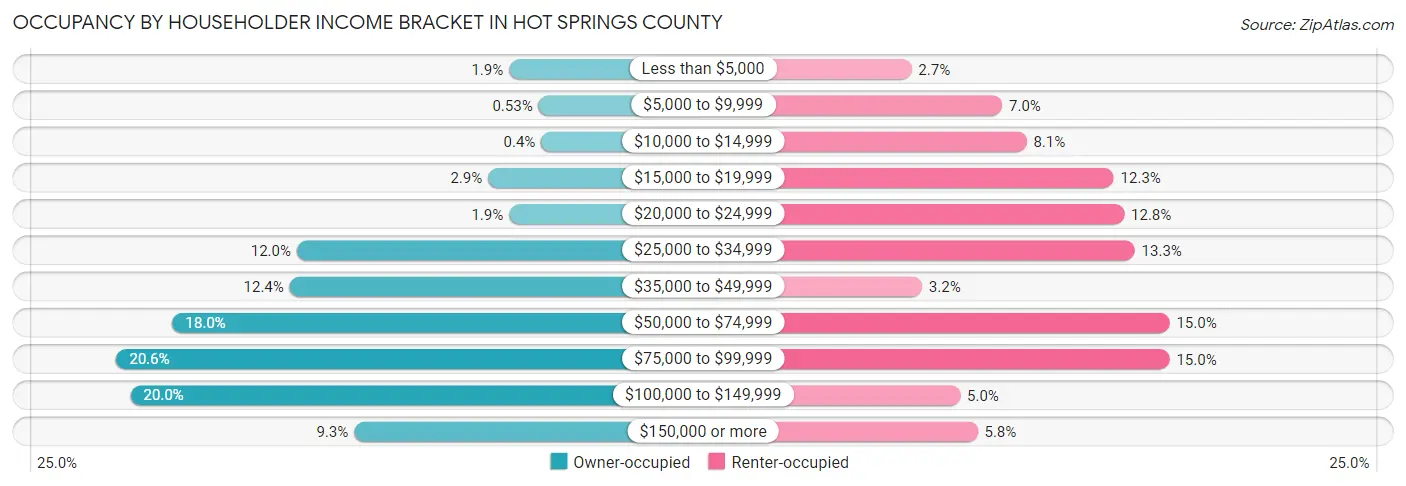
| Income Bracket | Owner-occupied | Renter-occupied |
| Less than $5,000 | 29 (1.9%) | 16 (2.7%) |
| $5,000 to $9,999 | 8 (0.5%) | 42 (7.0%) |
| $10,000 to $14,999 | 6 (0.4%) | 49 (8.1%) |
| $15,000 to $19,999 | 44 (2.9%) | 74 (12.3%) |
| $20,000 to $24,999 | 29 (1.9%) | 77 (12.8%) |
| $25,000 to $34,999 | 181 (12.0%) | 80 (13.3%) |
| $35,000 to $49,999 | 186 (12.4%) | 19 (3.2%) |
| $50,000 to $74,999 | 270 (18.0%) | 90 (14.9%) |
| $75,000 to $99,999 | 310 (20.6%) | 90 (14.9%) |
| $100,000 to $149,999 | 300 (20.0%) | 30 (5.0%) |
| $150,000 or more | 140 (9.3%) | 35 (5.8%) |
| Total | 1,503 (100.0%) | 602 (100.0%) |
Monthly Housing Cost Tiers in Hot Springs County
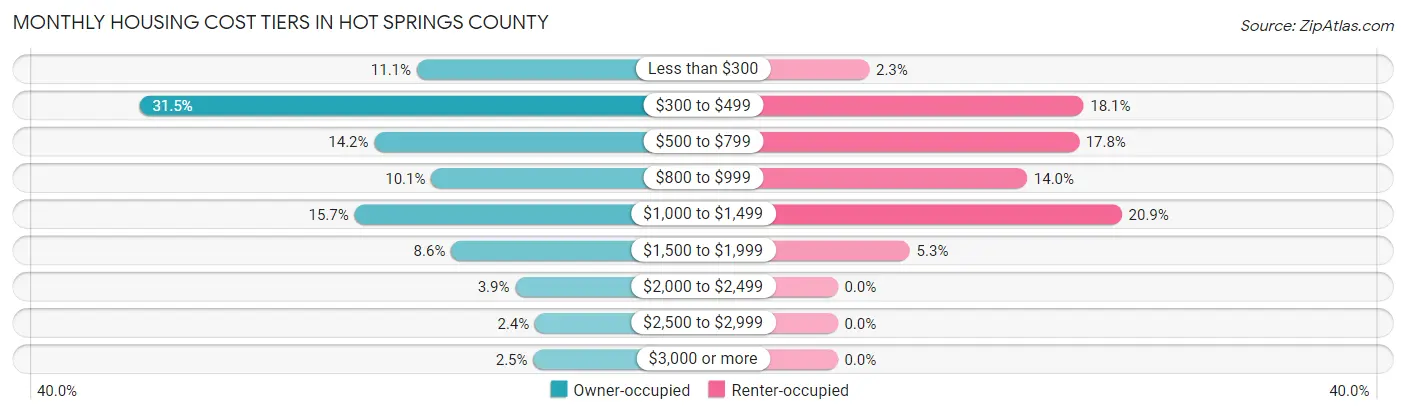
| Monthly Cost | Owner-occupied | Renter-occupied |
| Less than $300 | 167 (11.1%) | 14 (2.3%) |
| $300 to $499 | 474 (31.5%) | 109 (18.1%) |
| $500 to $799 | 214 (14.2%) | 107 (17.8%) |
| $800 to $999 | 151 (10.1%) | 84 (14.0%) |
| $1,000 to $1,499 | 236 (15.7%) | 126 (20.9%) |
| $1,500 to $1,999 | 129 (8.6%) | 32 (5.3%) |
| $2,000 to $2,499 | 58 (3.9%) | 0 (0.0%) |
| $2,500 to $2,999 | 36 (2.4%) | 0 (0.0%) |
| $3,000 or more | 38 (2.5%) | 0 (0.0%) |
| Total | 1,503 (100.0%) | 602 (100.0%) |
Physical Housing Characteristics in Hot Springs County
Housing Structures in Hot Springs County
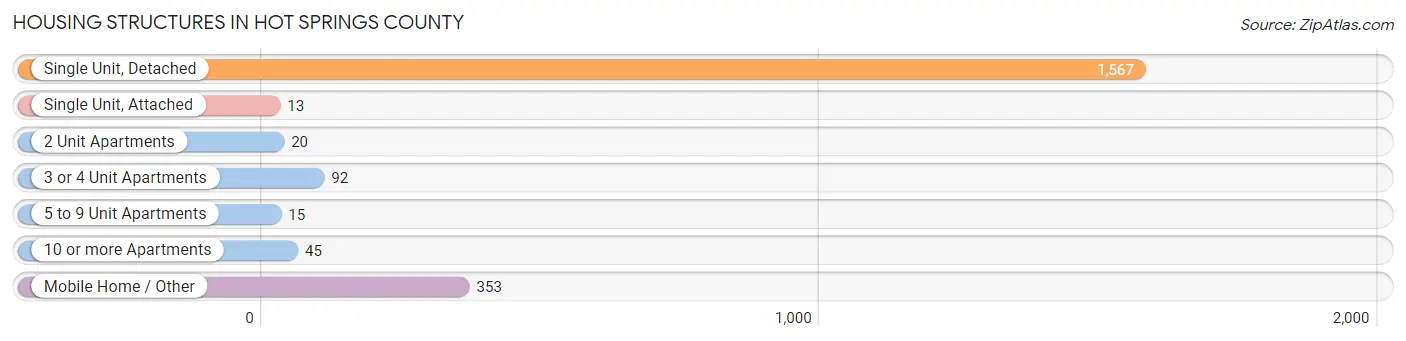
| Structure Type | # Housing Units | % Housing Units |
| Single Unit, Detached | 1,567 | 74.4% |
| Single Unit, Attached | 13 | 0.6% |
| 2 Unit Apartments | 20 | 0.9% |
| 3 or 4 Unit Apartments | 92 | 4.4% |
| 5 to 9 Unit Apartments | 15 | 0.7% |
| 10 or more Apartments | 45 | 2.1% |
| Mobile Home / Other | 353 | 16.8% |
| Total | 2,105 | 100.0% |
Housing Structures by Occupancy in Hot Springs County
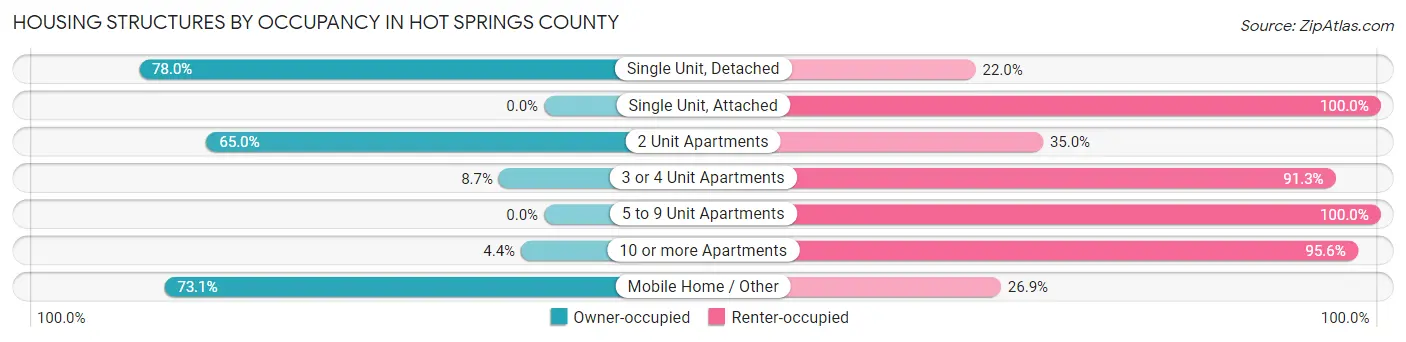
| Structure Type | Owner-occupied | Renter-occupied |
| Single Unit, Detached | 1,222 (78.0%) | 345 (22.0%) |
| Single Unit, Attached | 0 (0.0%) | 13 (100.0%) |
| 2 Unit Apartments | 13 (65.0%) | 7 (35.0%) |
| 3 or 4 Unit Apartments | 8 (8.7%) | 84 (91.3%) |
| 5 to 9 Unit Apartments | 0 (0.0%) | 15 (100.0%) |
| 10 or more Apartments | 2 (4.4%) | 43 (95.6%) |
| Mobile Home / Other | 258 (73.1%) | 95 (26.9%) |
| Total | 1,503 (71.4%) | 602 (28.6%) |
Housing Structures by Number of Rooms in Hot Springs County
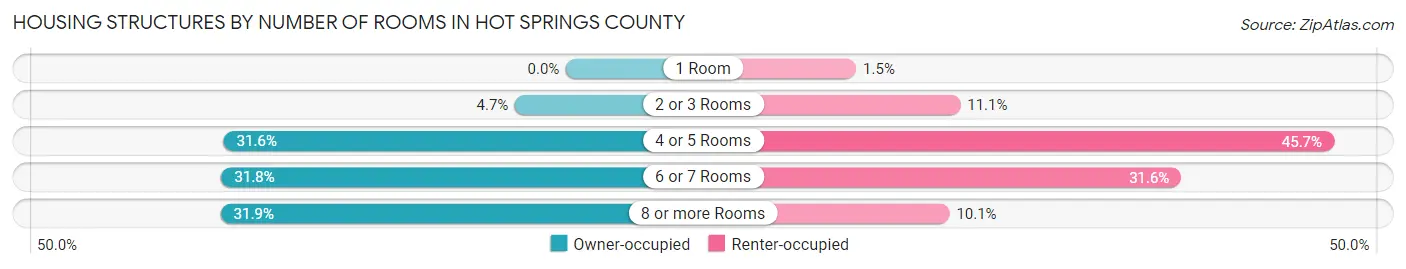
| Number of Rooms | Owner-occupied | Renter-occupied |
| 1 Room | 0 (0.0%) | 9 (1.5%) |
| 2 or 3 Rooms | 71 (4.7%) | 67 (11.1%) |
| 4 or 5 Rooms | 475 (31.6%) | 275 (45.7%) |
| 6 or 7 Rooms | 478 (31.8%) | 190 (31.6%) |
| 8 or more Rooms | 479 (31.9%) | 61 (10.1%) |
| Total | 1,503 (100.0%) | 602 (100.0%) |
Housing Structure by Heating Type in Hot Springs County
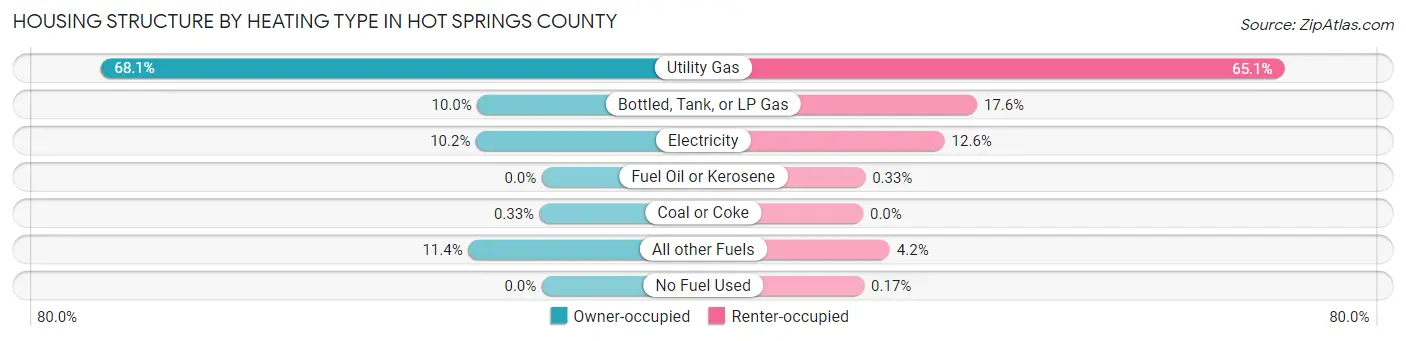
| Heating Type | Owner-occupied | Renter-occupied |
| Utility Gas | 1,024 (68.1%) | 392 (65.1%) |
| Bottled, Tank, or LP Gas | 150 (10.0%) | 106 (17.6%) |
| Electricity | 153 (10.2%) | 76 (12.6%) |
| Fuel Oil or Kerosene | 0 (0.0%) | 2 (0.3%) |
| Coal or Coke | 5 (0.3%) | 0 (0.0%) |
| All other Fuels | 171 (11.4%) | 25 (4.2%) |
| No Fuel Used | 0 (0.0%) | 1 (0.2%) |
| Total | 1,503 (100.0%) | 602 (100.0%) |
Household Vehicle Usage in Hot Springs County
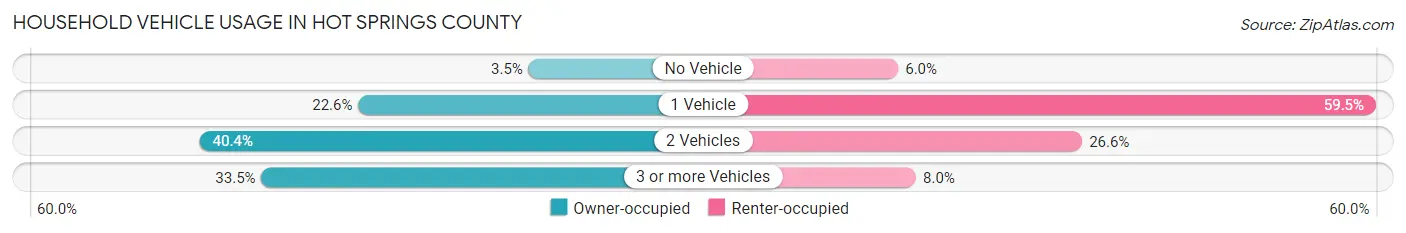
| Vehicles per Household | Owner-occupied | Renter-occupied |
| No Vehicle | 53 (3.5%) | 36 (6.0%) |
| 1 Vehicle | 340 (22.6%) | 358 (59.5%) |
| 2 Vehicles | 607 (40.4%) | 160 (26.6%) |
| 3 or more Vehicles | 503 (33.5%) | 48 (8.0%) |
| Total | 1,503 (100.0%) | 602 (100.0%) |
Real Estate & Mortgages in Hot Springs County
Real Estate and Mortgage Overview in Hot Springs County
| Characteristic | Without Mortgage | With Mortgage |
| Housing Units | 868 | 635 |
| Median Property Value | $168,800 | $232,000 |
| Median Household Income | $62,500 | $114 |
| Monthly Housing Costs | $422 | $38 |
| Real Estate Taxes | $1,040 | $4 |
Property Value by Mortgage Status in Hot Springs County
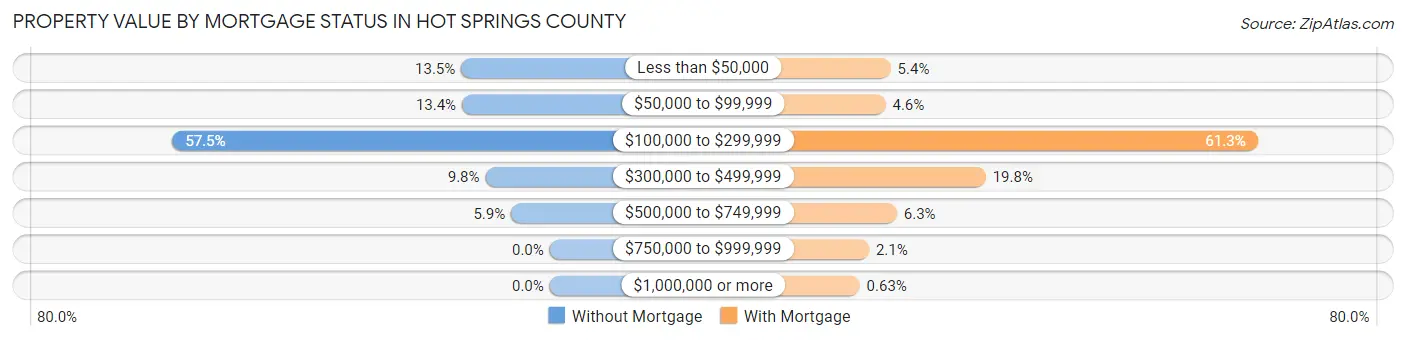
| Property Value | Without Mortgage | With Mortgage |
| Less than $50,000 | 117 (13.5%) | 34 (5.3%) |
| $50,000 to $99,999 | 116 (13.4%) | 29 (4.6%) |
| $100,000 to $299,999 | 499 (57.5%) | 389 (61.3%) |
| $300,000 to $499,999 | 85 (9.8%) | 126 (19.8%) |
| $500,000 to $749,999 | 51 (5.9%) | 40 (6.3%) |
| $750,000 to $999,999 | 0 (0.0%) | 13 (2.1%) |
| $1,000,000 or more | 0 (0.0%) | 4 (0.6%) |
| Total | 868 (100.0%) | 635 (100.0%) |
Household Income by Mortgage Status in Hot Springs County
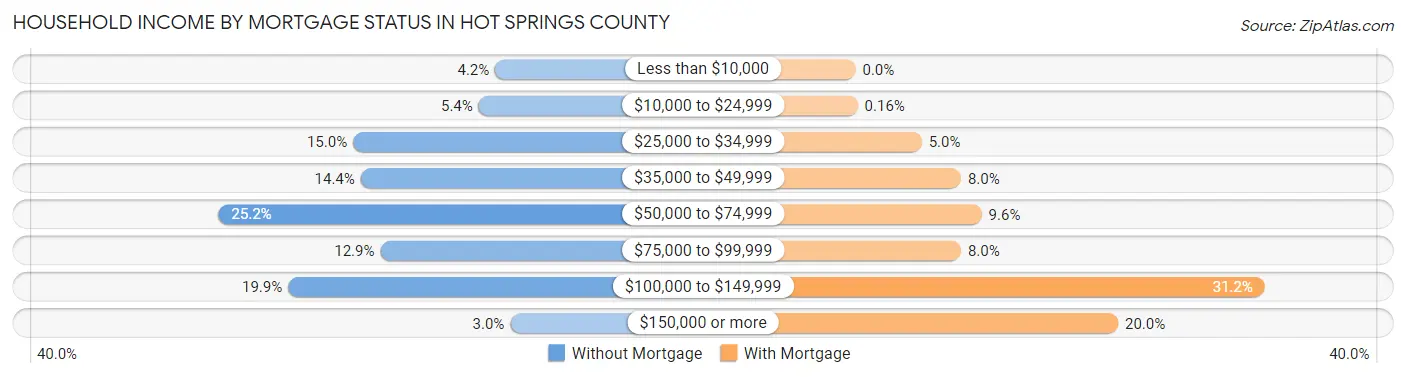
| Household Income | Without Mortgage | With Mortgage |
| Less than $10,000 | 36 (4.2%) | 0 (0.0%) |
| $10,000 to $24,999 | 47 (5.4%) | 1 (0.2%) |
| $25,000 to $34,999 | 130 (15.0%) | 32 (5.0%) |
| $35,000 to $49,999 | 125 (14.4%) | 51 (8.0%) |
| $50,000 to $74,999 | 219 (25.2%) | 61 (9.6%) |
| $75,000 to $99,999 | 112 (12.9%) | 51 (8.0%) |
| $100,000 to $149,999 | 173 (19.9%) | 198 (31.2%) |
| $150,000 or more | 26 (3.0%) | 127 (20.0%) |
| Total | 868 (100.0%) | 635 (100.0%) |
Property Value to Household Income Ratio in Hot Springs County
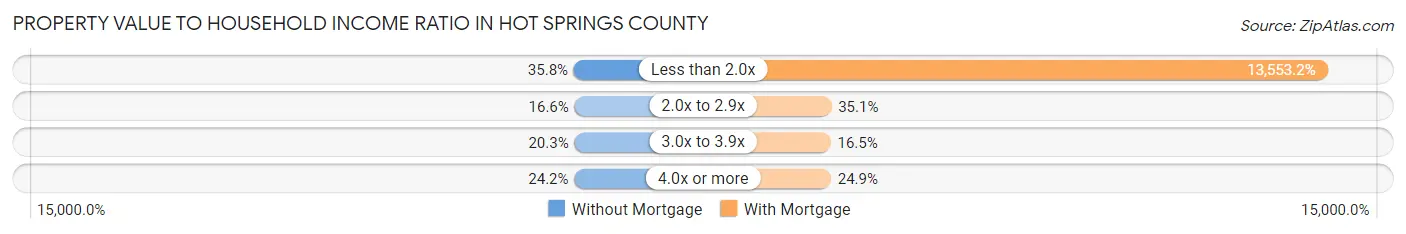
| Value-to-Income Ratio | Without Mortgage | With Mortgage |
| Less than 2.0x | 311 (35.8%) | 86,063 (13,553.2%) |
| 2.0x to 2.9x | 144 (16.6%) | 223 (35.1%) |
| 3.0x to 3.9x | 176 (20.3%) | 105 (16.5%) |
| 4.0x or more | 210 (24.2%) | 158 (24.9%) |
| Total | 868 (100.0%) | 635 (100.0%) |
Real Estate Taxes by Mortgage Status in Hot Springs County
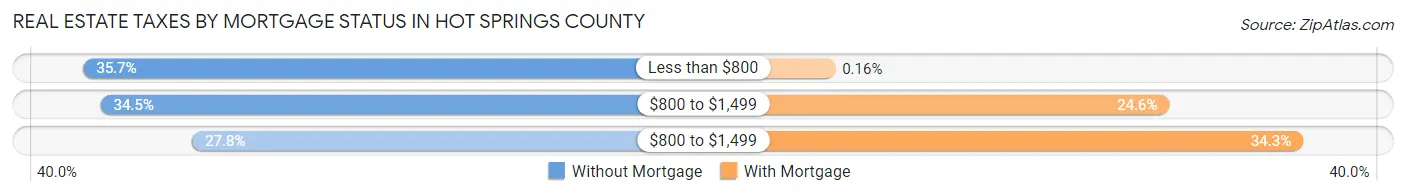
| Property Taxes | Without Mortgage | With Mortgage |
| Less than $800 | 310 (35.7%) | 1 (0.2%) |
| $800 to $1,499 | 299 (34.4%) | 156 (24.6%) |
| $800 to $1,499 | 241 (27.8%) | 218 (34.3%) |
| Total | 868 (100.0%) | 635 (100.0%) |
Health & Disability in Hot Springs County
Health Insurance Coverage by Age in Hot Springs County
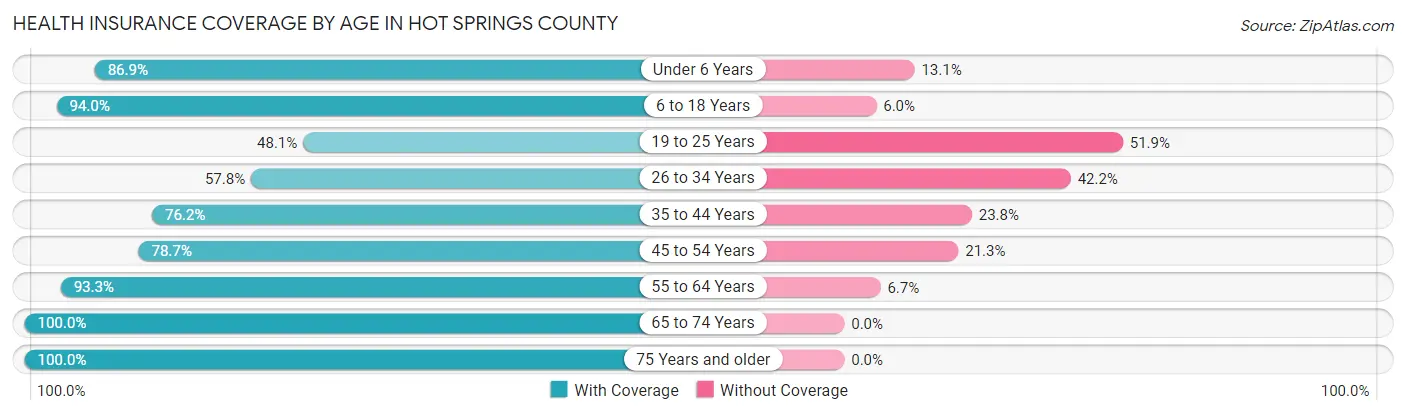
| Age Bracket | With Coverage | Without Coverage |
| Under 6 Years | 259 (86.9%) | 39 (13.1%) |
| 6 to 18 Years | 647 (94.0%) | 41 (6.0%) |
| 19 to 25 Years | 173 (48.1%) | 187 (51.9%) |
| 26 to 34 Years | 182 (57.8%) | 133 (42.2%) |
| 35 to 44 Years | 420 (76.2%) | 131 (23.8%) |
| 45 to 54 Years | 389 (78.7%) | 105 (21.3%) |
| 55 to 64 Years | 623 (93.3%) | 45 (6.7%) |
| 65 to 74 Years | 709 (100.0%) | 0 (0.0%) |
| 75 Years and older | 452 (100.0%) | 0 (0.0%) |
| Total | 3,854 (85.0%) | 681 (15.0%) |
Health Insurance Coverage by Citizenship Status in Hot Springs County
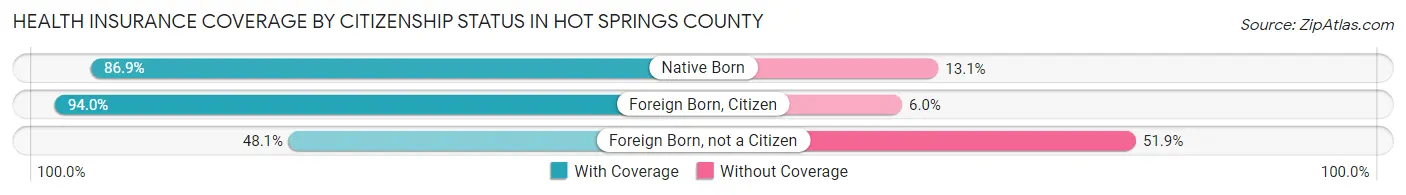
| Citizenship Status | With Coverage | Without Coverage |
| Native Born | 259 (86.9%) | 39 (13.1%) |
| Foreign Born, Citizen | 647 (94.0%) | 41 (6.0%) |
| Foreign Born, not a Citizen | 173 (48.1%) | 187 (51.9%) |
Health Insurance Coverage by Household Income in Hot Springs County
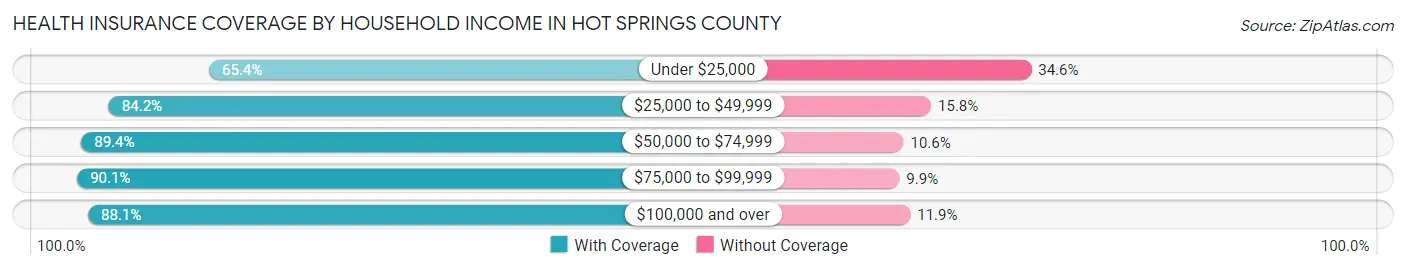
| Household Income | With Coverage | Without Coverage |
| Under $25,000 | 369 (65.4%) | 195 (34.6%) |
| $25,000 to $49,999 | 890 (84.2%) | 167 (15.8%) |
| $50,000 to $74,999 | 656 (89.4%) | 78 (10.6%) |
| $75,000 to $99,999 | 795 (90.1%) | 87 (9.9%) |
| $100,000 and over | 1,133 (88.1%) | 153 (11.9%) |
Public vs Private Health Insurance Coverage by Age in Hot Springs County
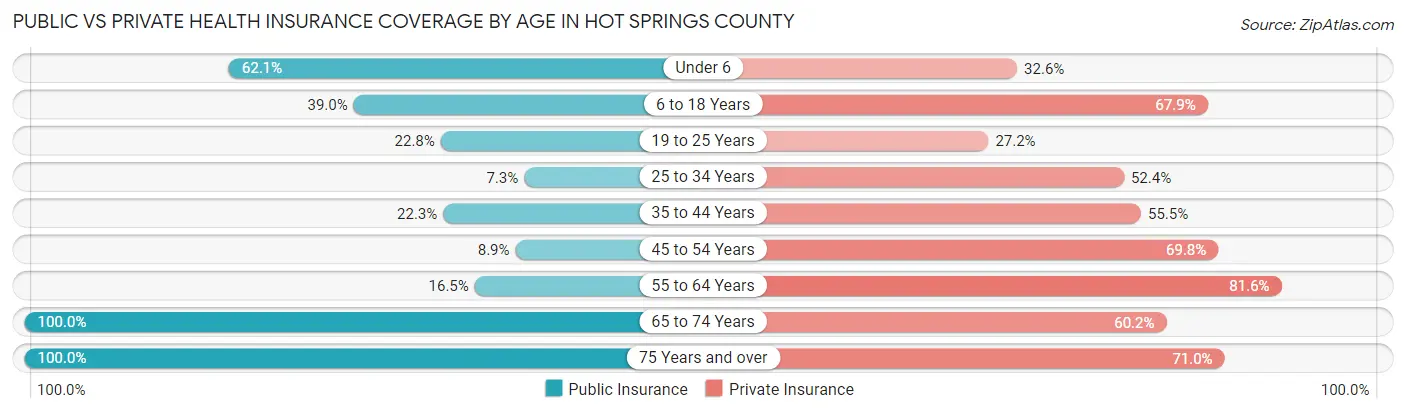
| Age Bracket | Public Insurance | Private Insurance |
| Under 6 | 185 (62.1%) | 97 (32.6%) |
| 6 to 18 Years | 268 (39.0%) | 467 (67.9%) |
| 19 to 25 Years | 82 (22.8%) | 98 (27.2%) |
| 25 to 34 Years | 23 (7.3%) | 165 (52.4%) |
| 35 to 44 Years | 123 (22.3%) | 306 (55.5%) |
| 45 to 54 Years | 44 (8.9%) | 345 (69.8%) |
| 55 to 64 Years | 110 (16.5%) | 545 (81.6%) |
| 65 to 74 Years | 709 (100.0%) | 427 (60.2%) |
| 75 Years and over | 452 (100.0%) | 321 (71.0%) |
| Total | 1,996 (44.0%) | 2,771 (61.1%) |
Disability Status by Sex by Age in Hot Springs County
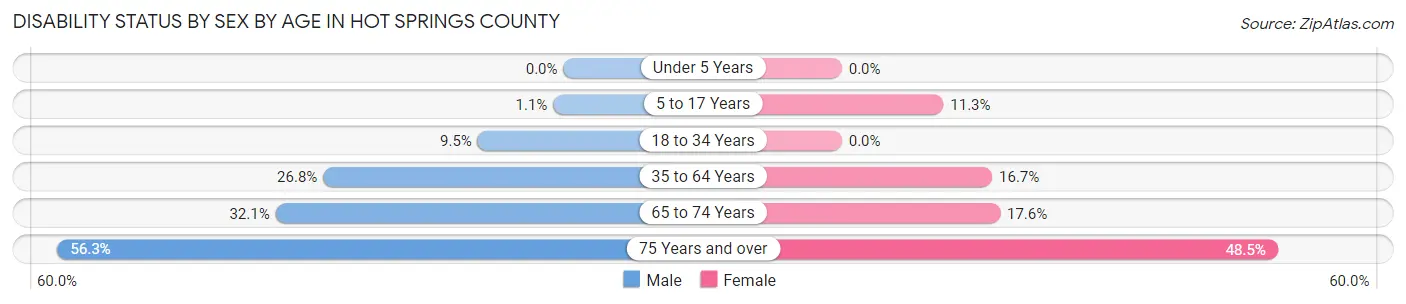
| Age Bracket | Male | Female |
| Under 5 Years | 0 (0.0%) | 0 (0.0%) |
| 5 to 17 Years | 4 (1.1%) | 38 (11.3%) |
| 18 to 34 Years | 35 (9.5%) | 0 (0.0%) |
| 35 to 64 Years | 225 (26.8%) | 146 (16.7%) |
| 65 to 74 Years | 109 (32.1%) | 65 (17.6%) |
| 75 Years and over | 120 (56.3%) | 116 (48.5%) |
Disability Class by Sex by Age in Hot Springs County
Disability Class: Hearing Difficulty
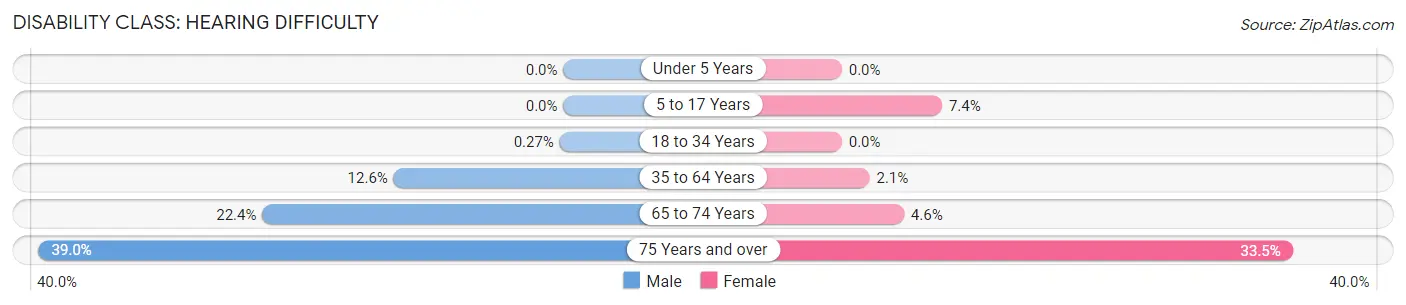
| Age Bracket | Male | Female |
| Under 5 Years | 0 (0.0%) | 0 (0.0%) |
| 5 to 17 Years | 0 (0.0%) | 25 (7.4%) |
| 18 to 34 Years | 1 (0.3%) | 0 (0.0%) |
| 35 to 64 Years | 106 (12.6%) | 18 (2.1%) |
| 65 to 74 Years | 76 (22.4%) | 17 (4.6%) |
| 75 Years and over | 83 (39.0%) | 80 (33.5%) |
Disability Class: Vision Difficulty
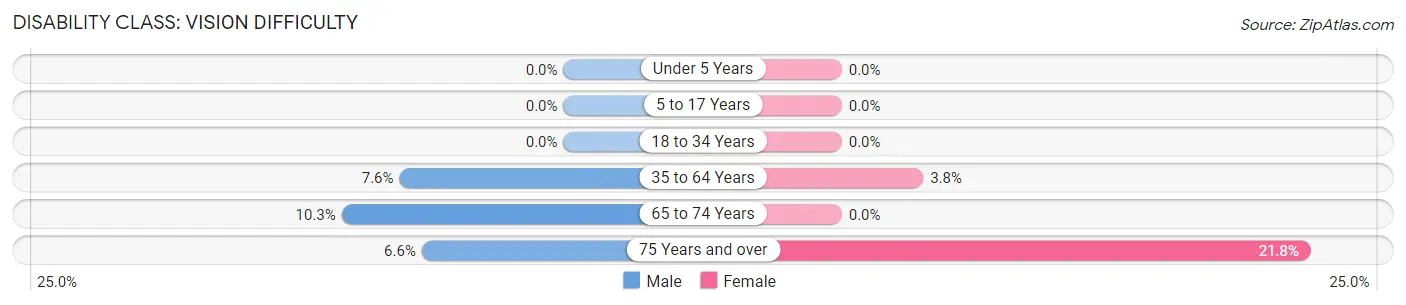
| Age Bracket | Male | Female |
| Under 5 Years | 0 (0.0%) | 0 (0.0%) |
| 5 to 17 Years | 0 (0.0%) | 0 (0.0%) |
| 18 to 34 Years | 0 (0.0%) | 0 (0.0%) |
| 35 to 64 Years | 64 (7.6%) | 33 (3.8%) |
| 65 to 74 Years | 35 (10.3%) | 0 (0.0%) |
| 75 Years and over | 14 (6.6%) | 52 (21.8%) |
Disability Class: Cognitive Difficulty
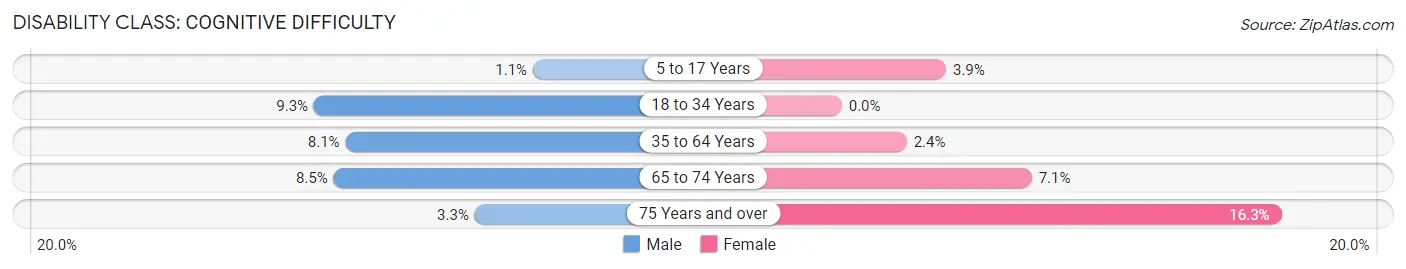
| Age Bracket | Male | Female |
| 5 to 17 Years | 4 (1.1%) | 13 (3.9%) |
| 18 to 34 Years | 34 (9.3%) | 0 (0.0%) |
| 35 to 64 Years | 68 (8.1%) | 21 (2.4%) |
| 65 to 74 Years | 29 (8.5%) | 26 (7.0%) |
| 75 Years and over | 7 (3.3%) | 39 (16.3%) |
Disability Class: Ambulatory Difficulty
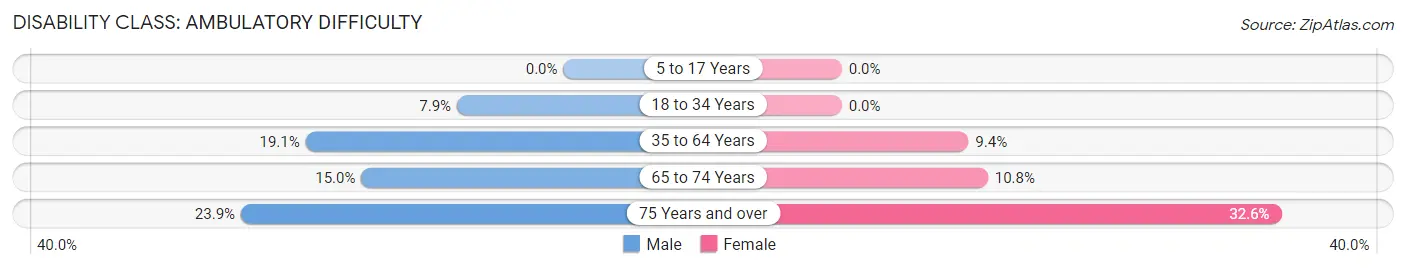
| Age Bracket | Male | Female |
| 5 to 17 Years | 0 (0.0%) | 0 (0.0%) |
| 18 to 34 Years | 29 (7.9%) | 0 (0.0%) |
| 35 to 64 Years | 161 (19.1%) | 82 (9.4%) |
| 65 to 74 Years | 51 (15.0%) | 40 (10.8%) |
| 75 Years and over | 51 (23.9%) | 78 (32.6%) |
Disability Class: Self-Care Difficulty
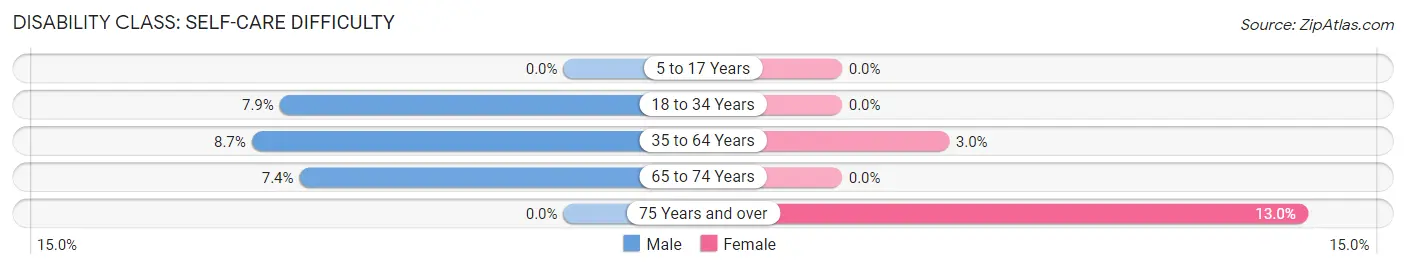
| Age Bracket | Male | Female |
| 5 to 17 Years | 0 (0.0%) | 0 (0.0%) |
| 18 to 34 Years | 29 (7.9%) | 0 (0.0%) |
| 35 to 64 Years | 73 (8.7%) | 26 (3.0%) |
| 65 to 74 Years | 25 (7.3%) | 0 (0.0%) |
| 75 Years and over | 0 (0.0%) | 31 (13.0%) |
Technology Access in Hot Springs County
Computing Device Access in Hot Springs County
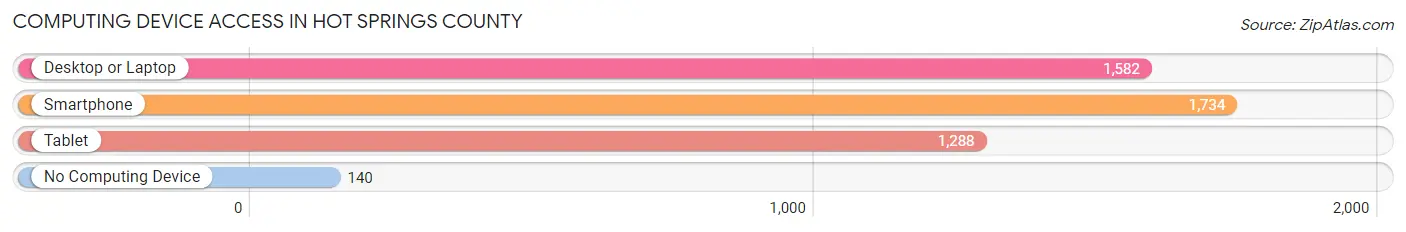
| Device Type | # Households | % Households |
| Desktop or Laptop | 1,582 | 75.1% |
| Smartphone | 1,734 | 82.4% |
| Tablet | 1,288 | 61.2% |
| No Computing Device | 140 | 6.7% |
| Total | 2,105 | 100.0% |
Internet Access in Hot Springs County
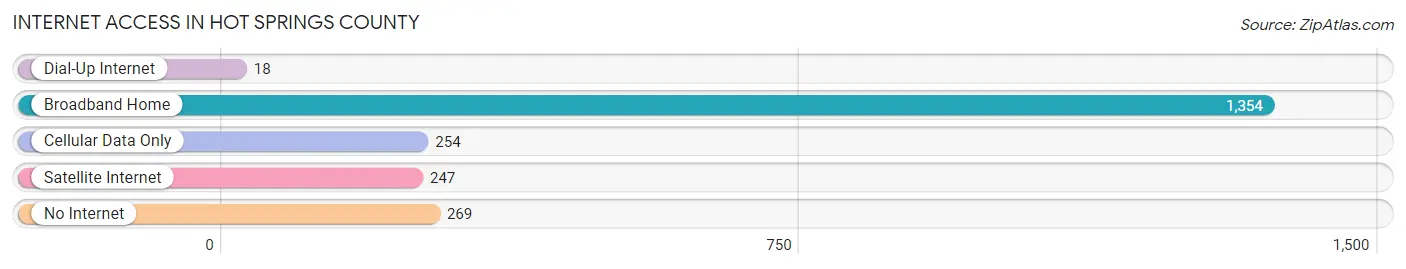
| Internet Type | # Households | % Households |
| Dial-Up Internet | 18 | 0.9% |
| Broadband Home | 1,354 | 64.3% |
| Cellular Data Only | 254 | 12.1% |
| Satellite Internet | 247 | 11.7% |
| No Internet | 269 | 12.8% |
| Total | 2,105 | 100.0% |
Hot Springs County Summary
History
Hot Springs County, Wyoming is located in the Big Horn Basin of the Rocky Mountains. It was established in 1911 and is the second largest county in the state. The county was named for the hot springs located in the area. The county seat is Thermopolis, which is the largest town in the county.
The area was first inhabited by the Shoshone and Arapaho tribes. The first white settlers arrived in the late 1800s and the area was opened up for homesteading in the early 1900s. The county was officially established in 1911 and the town of Thermopolis was founded in 1912.
The county has a rich history of ranching and farming. The area was known for its cattle and sheep ranches, as well as its wheat and alfalfa farms. The county also had a thriving mining industry, with coal, oil, and natural gas being the main resources.
Geography
Hot Springs County is located in the Big Horn Basin of the Rocky Mountains. It is bordered by Big Horn County to the north, Park County to the east, Fremont County to the south, and Washakie County to the west. The county covers an area of 2,717 square miles and has an elevation of 4,000 feet.
The county is mostly mountainous, with the Big Horn Mountains to the north and the Owl Creek Mountains to the south. The county is home to several rivers, including the Big Horn River, the Wind River, and the Shoshone River. The county also has several lakes, including Boysen Reservoir, Buffalo Bill Reservoir, and the Hot Springs State Park.
Economy
The economy of Hot Springs County is largely based on agriculture and tourism. The county is home to several large ranches and farms, which produce cattle, sheep, wheat, and alfalfa. The county also has a thriving tourism industry, with the Hot Springs State Park being the main attraction. The park is home to the world’s largest mineral hot springs and attracts thousands of visitors each year.
The county also has a growing energy industry, with coal, oil, and natural gas being the main resources. The county is home to several coal mines and oil and gas wells.
Demographics
As of the 2010 census, Hot Springs County had a population of 5,719. The population is mostly white (93.3%), with small percentages of Native American (2.2%), Hispanic (2.1%), and African American (0.7%) populations. The median household income is $41,944 and the median age is 44.7 years.
Conclusion
Hot Springs County, Wyoming is a beautiful and diverse county located in the Big Horn Basin of the Rocky Mountains. The county has a rich history of ranching and farming, as well as a thriving tourism industry. The county also has a growing energy industry, with coal, oil, and natural gas being the main resources. The population is mostly white, with small percentages of Native American, Hispanic, and African American populations. The median household income is $41,944 and the median age is 44.7 years.
Common Questions
What is the Total Population of Hot Springs County?
Total Population of Hot Springs County is 4,616.
What is the Total Male Population of Hot Springs County?
Total Male Population of Hot Springs County is 2,317.
What is the Total Female Population of Hot Springs County?
Total Female Population of Hot Springs County is 2,299.
What is the Ratio of Males per 100 Females in Hot Springs County?
There are 100.78 Males per 100 Females in Hot Springs County.
What is the Ratio of Females per 100 Males in Hot Springs County?
There are 99.22 Females per 100 Males in Hot Springs County.
What is the Median Population Age in Hot Springs County?
Median Population Age in Hot Springs County is 45.8 Years.
What is the Average Family Size in Hot Springs County
Average Family Size in Hot Springs County is 2.6 People.
What is the Average Household Size in Hot Springs County
Average Household Size in Hot Springs County is 2.1 People.
What is Per Capita Income in Hot Springs County?
Per Capita income in Hot Springs County is $33,128.
What is the Median Family Income in Hot Springs County?
Median Family Income in Hot Springs County is $78,068.
What is the Median Household income in Hot Springs County?
Median Household Income in Hot Springs County is $64,031.
What is Income or Wage Gap in Hot Springs County?
Income or Wage Gap in Hot Springs County is 18.4%.
Women in Hot Springs County earn 81.6 cents for every dollar earned by a man.
What is Family Income Deficit in Hot Springs County?
Family Income Deficit in Hot Springs County is $7,063.
Families that are below poverty line in Hot Springs County earn $7,063 less on average than the poverty threshold level.
What is Inequality or Gini Index in Hot Springs County?
Inequality or Gini Index in Hot Springs County is 0.40.
How Large is the Labor Force in Hot Springs County?
There are 2,123 People in the Labor Forcein in Hot Springs County.
What is the Percentage of People in the Labor Force in Hot Springs County?
56.8% of People are in the Labor Force in Hot Springs County.
What is the Unemployment Rate in Hot Springs County?
Unemployment Rate in Hot Springs County is 1.4%.