Fremont County, WY
Fremont County Map
Fremont County Overview
39,402
TOTAL POPULATION
19,959
MALE POPULATION
19,443
FEMALE POPULATION
102.65
MALES / 100 FEMALES
97.41
FEMALES / 100 MALES
38.9
MEDIAN AGE
3.4
AVG FAMILY SIZE
2.6
AVG HOUSEHOLD SIZE
$30,414
PER CAPITA INCOME
$76,114
AVG FAMILY INCOME
$60,030
AVG HOUSEHOLD INCOME
27.5%
WAGE / INCOME GAP [ % ]
72.5¢/ $1
WAGE / INCOME GAP [ $ ]
$11,507
FAMILY INCOME DEFICIT
0.42
INEQUALITY / GINI INDEX
18,821
LABOR FORCE [ PEOPLE ]
61.2%
PERCENT IN LABOR FORCE
8.2%
UNEMPLOYMENT RATE
Fremont County Area Codes
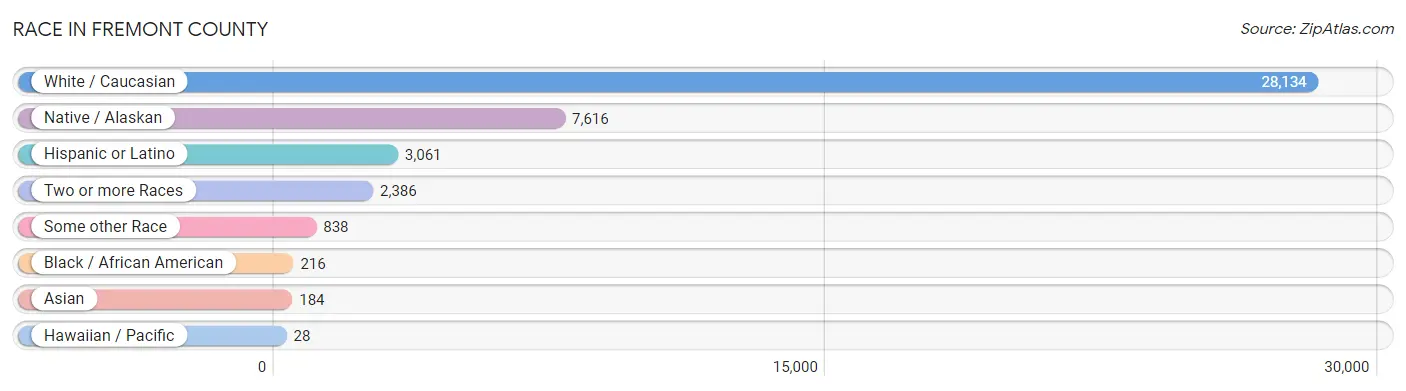
Race in Fremont County
The most populous races in Fremont County are White / Caucasian (28,134 | 71.4%), Native / Alaskan (7,616 | 19.3%), and Hispanic or Latino (3,061 | 7.8%).
| Race | # Population | % Population |
| Asian | 184 | 0.5% |
| Black / African American | 216 | 0.5% |
| Hawaiian / Pacific | 28 | 0.1% |
| Hispanic or Latino | 3,061 | 7.8% |
| Native / Alaskan | 7,616 | 19.3% |
| White / Caucasian | 28,134 | 71.4% |
| Two or more Races | 2,386 | 6.1% |
| Some other Race | 838 | 2.1% |
| Total | 39,402 | 100.0% |
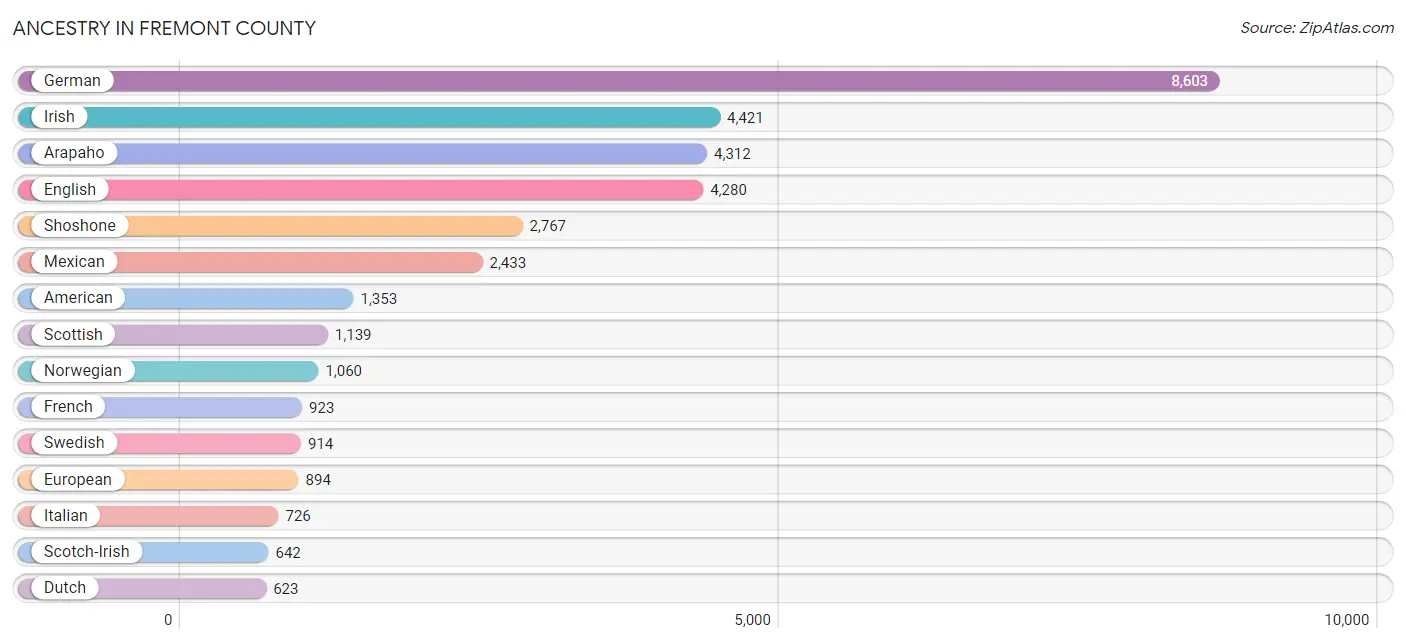
Ancestry in Fremont County
The most populous ancestries reported in Fremont County are German (8,603 | 21.8%), Irish (4,421 | 11.2%), Arapaho (4,312 | 10.9%), English (4,280 | 10.9%), and Shoshone (2,767 | 7.0%), together accounting for 61.9% of all Fremont County residents.
| Ancestry | # Population | % Population |
| Alaska Native | 2 | 0.0% |
| American | 1,353 | 3.4% |
| Apache | 324 | 0.8% |
| Arab | 44 | 0.1% |
| Arapaho | 4,312 | 10.9% |
| Australian | 41 | 0.1% |
| Austrian | 125 | 0.3% |
| Basque | 110 | 0.3% |
| Belgian | 273 | 0.7% |
| Bhutanese | 9 | 0.0% |
| Blackfeet | 49 | 0.1% |
| British | 141 | 0.4% |
| Burmese | 42 | 0.1% |
| Cajun | 9 | 0.0% |
| Canadian | 44 | 0.1% |
| Central American | 24 | 0.1% |
| Cherokee | 178 | 0.4% |
| Cheyenne | 129 | 0.3% |
| Chickasaw | 4 | 0.0% |
| Chippewa | 115 | 0.3% |
| Choctaw | 51 | 0.1% |
| Colombian | 4 | 0.0% |
| Colville | 2 | 0.0% |
| Creek | 3 | 0.0% |
| Croatian | 41 | 0.1% |
| Crow | 72 | 0.2% |
| Cuban | 18 | 0.1% |
| Czech | 189 | 0.5% |
| Czechoslovakian | 36 | 0.1% |
| Danish | 333 | 0.9% |
| Dominican | 4 | 0.0% |
| Dutch | 623 | 1.6% |
| Eastern European | 42 | 0.1% |
| Ecuadorian | 10 | 0.0% |
| Egyptian | 3 | 0.0% |
| English | 4,280 | 10.9% |
| Estonian | 3 | 0.0% |
| Ethiopian | 22 | 0.1% |
| European | 894 | 2.3% |
| Filipino | 20 | 0.1% |
| Finnish | 150 | 0.4% |
| French | 923 | 2.3% |
| French American Indian | 15 | 0.0% |
| French Canadian | 140 | 0.4% |
| German | 8,603 | 21.8% |
| Greek | 98 | 0.3% |
| Hungarian | 108 | 0.3% |
| Icelander | 21 | 0.1% |
| Indian (Asian) | 29 | 0.1% |
| Irish | 4,421 | 11.2% |
| Iroquois | 7 | 0.0% |
| Italian | 726 | 1.8% |
| Jamaican | 10 | 0.0% |
| Korean | 242 | 0.6% |
| Lebanese | 8 | 0.0% |
| Lithuanian | 25 | 0.1% |
| Mexican | 2,433 | 6.2% |
| Mexican American Indian | 17 | 0.0% |
| Moroccan | 27 | 0.1% |
| Native Hawaiian | 5 | 0.0% |
| Navajo | 333 | 0.9% |
| Nigerian | 3 | 0.0% |
| Northern European | 36 | 0.1% |
| Norwegian | 1,060 | 2.7% |
| Osage | 8 | 0.0% |
| Paiute | 1 | 0.0% |
| Pennsylvania German | 43 | 0.1% |
| Pima | 16 | 0.0% |
| Polish | 440 | 1.1% |
| Portuguese | 161 | 0.4% |
| Pueblo | 1 | 0.0% |
| Puerto Rican | 40 | 0.1% |
| Romanian | 118 | 0.3% |
| Russian | 227 | 0.6% |
| Salvadoran | 24 | 0.1% |
| Samoan | 38 | 0.1% |
| Scandinavian | 231 | 0.6% |
| Scotch-Irish | 642 | 1.6% |
| Scottish | 1,139 | 2.9% |
| Shoshone | 2,767 | 7.0% |
| Sioux | 359 | 0.9% |
| Slavic | 38 | 0.1% |
| Slovak | 19 | 0.1% |
| Slovene | 28 | 0.1% |
| South American | 25 | 0.1% |
| Spaniard | 68 | 0.2% |
| Spanish | 257 | 0.6% |
| Spanish American | 11 | 0.0% |
| Sri Lankan | 33 | 0.1% |
| Subsaharan African | 25 | 0.1% |
| Swedish | 914 | 2.3% |
| Swiss | 140 | 0.4% |
| Thai | 4 | 0.0% |
| Tlingit-Haida | 9 | 0.0% |
| Tohono O'Odham | 12 | 0.0% |
| Turkish | 8 | 0.0% |
| Ukrainian | 40 | 0.1% |
| Ute | 10 | 0.0% |
| Venezuelan | 11 | 0.0% |
| Welsh | 300 | 0.8% |
| West Indian | 1 | 0.0% |
| Yugoslavian | 10 | 0.0% |
| Yuman | 15 | 0.0% | View All 103 Rows |
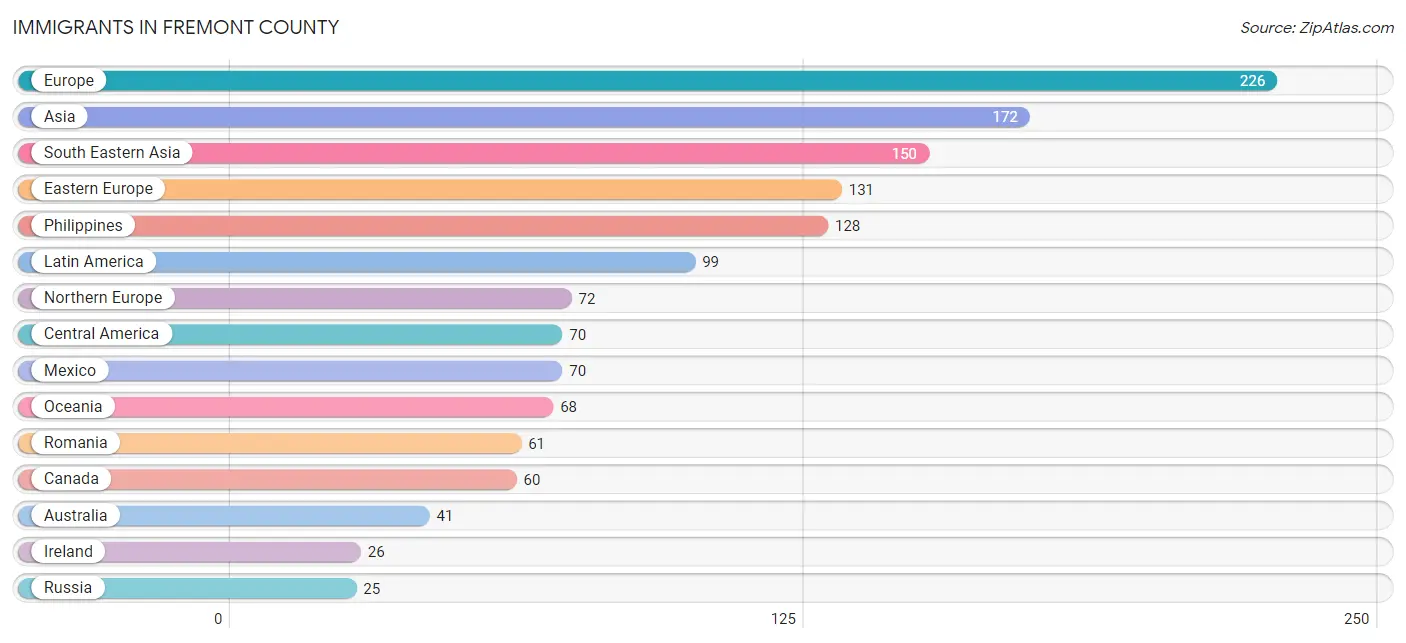
Immigrants in Fremont County
The most numerous immigrant groups reported in Fremont County came from Europe (226 | 0.6%), Asia (172 | 0.4%), South Eastern Asia (150 | 0.4%), Eastern Europe (131 | 0.3%), and Philippines (128 | 0.3%), together accounting for 2.0% of all Fremont County residents.
| Immigration Origin | # Population | % Population |
| Argentina | 20 | 0.1% |
| Asia | 172 | 0.4% |
| Australia | 41 | 0.1% |
| Bulgaria | 16 | 0.0% |
| Canada | 60 | 0.2% |
| Caribbean | 9 | 0.0% |
| Central America | 70 | 0.2% |
| China | 3 | 0.0% |
| Eastern Asia | 12 | 0.0% |
| Eastern Europe | 131 | 0.3% |
| England | 15 | 0.0% |
| Europe | 226 | 0.6% |
| Germany | 15 | 0.0% |
| Indonesia | 15 | 0.0% |
| Ireland | 26 | 0.1% |
| Jamaica | 9 | 0.0% |
| Korea | 9 | 0.0% |
| Latin America | 99 | 0.3% |
| Mexico | 70 | 0.2% |
| Northern Europe | 72 | 0.2% |
| Oceania | 68 | 0.2% |
| Philippines | 128 | 0.3% |
| Poland | 4 | 0.0% |
| Portugal | 8 | 0.0% |
| Romania | 61 | 0.2% |
| Russia | 25 | 0.1% |
| Scotland | 22 | 0.1% |
| South America | 20 | 0.1% |
| South Eastern Asia | 150 | 0.4% |
| Southern Europe | 8 | 0.0% |
| Ukraine | 8 | 0.0% |
| Vietnam | 7 | 0.0% |
| Western Asia | 10 | 0.0% |
| Western Europe | 15 | 0.0% | View All 34 Rows |
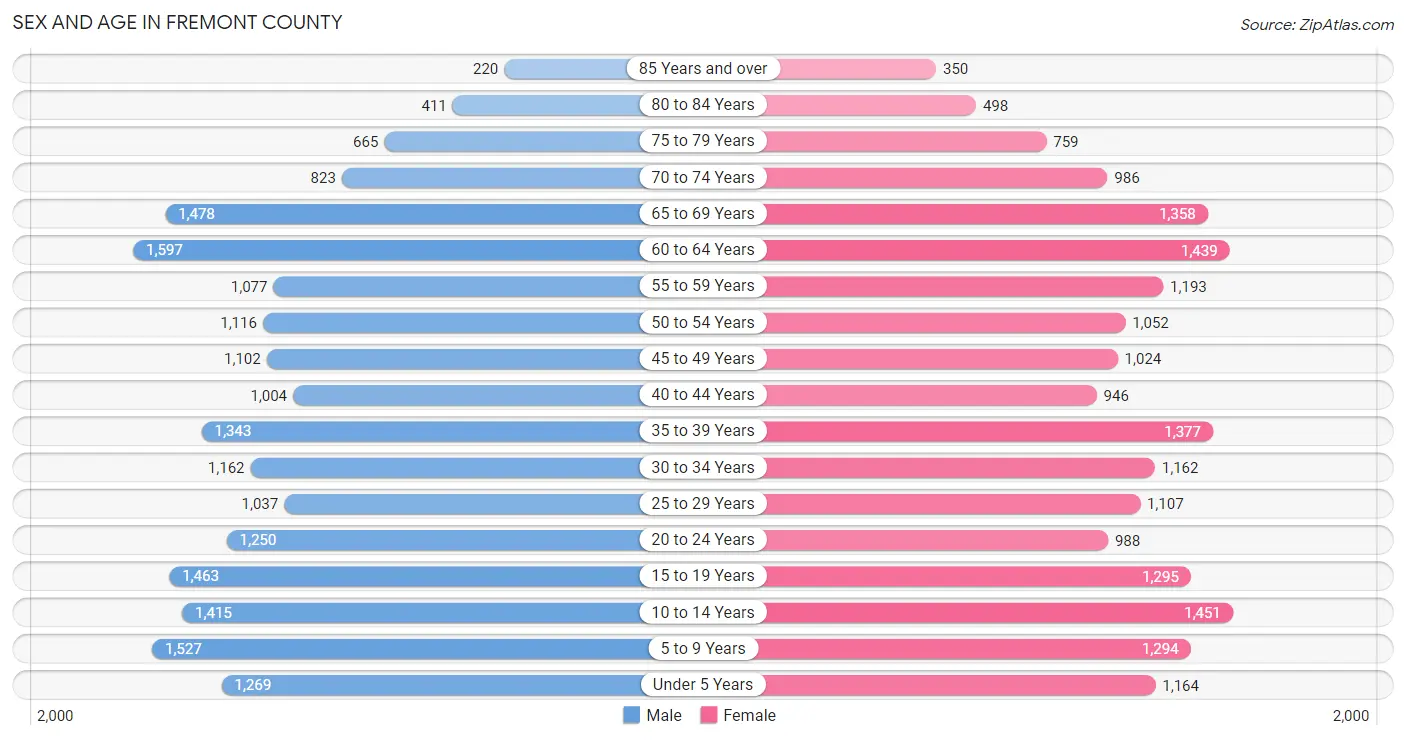
Sex and Age in Fremont County
Sex and Age in Fremont County
The most populous age groups in Fremont County are 60 to 64 Years (1,597 | 8.0%) for men and 10 to 14 Years (1,451 | 7.5%) for women.
| Age Bracket | Male | Female |
| Under 5 Years | 1,269 (6.4%) | 1,164 (6.0%) |
| 5 to 9 Years | 1,527 (7.6%) | 1,294 (6.7%) |
| 10 to 14 Years | 1,415 (7.1%) | 1,451 (7.5%) |
| 15 to 19 Years | 1,463 (7.3%) | 1,295 (6.7%) |
| 20 to 24 Years | 1,250 (6.3%) | 988 (5.1%) |
| 25 to 29 Years | 1,037 (5.2%) | 1,107 (5.7%) |
| 30 to 34 Years | 1,162 (5.8%) | 1,162 (6.0%) |
| 35 to 39 Years | 1,343 (6.7%) | 1,377 (7.1%) |
| 40 to 44 Years | 1,004 (5.0%) | 946 (4.9%) |
| 45 to 49 Years | 1,102 (5.5%) | 1,024 (5.3%) |
| 50 to 54 Years | 1,116 (5.6%) | 1,052 (5.4%) |
| 55 to 59 Years | 1,077 (5.4%) | 1,193 (6.1%) |
| 60 to 64 Years | 1,597 (8.0%) | 1,439 (7.4%) |
| 65 to 69 Years | 1,478 (7.4%) | 1,358 (7.0%) |
| 70 to 74 Years | 823 (4.1%) | 986 (5.1%) |
| 75 to 79 Years | 665 (3.3%) | 759 (3.9%) |
| 80 to 84 Years | 411 (2.1%) | 498 (2.6%) |
| 85 Years and over | 220 (1.1%) | 350 (1.8%) |
| Total | 19,959 (100.0%) | 19,443 (100.0%) |
Families and Households in Fremont County
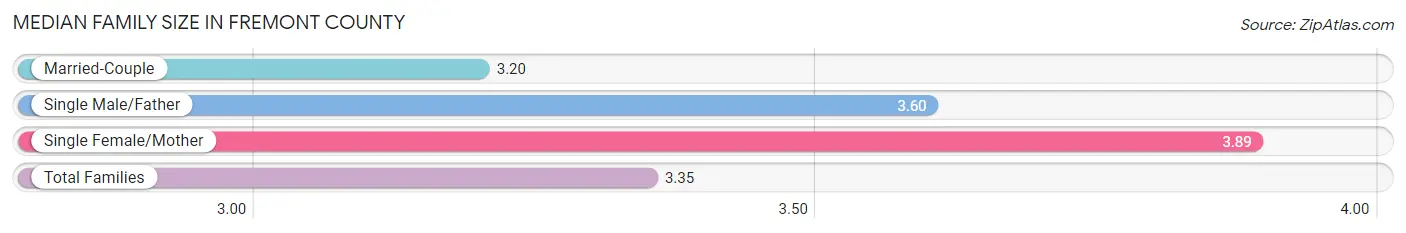
Median Family Size in Fremont County
The median family size in Fremont County is 3.35 persons per family, with single female/mother families (1,576 | 17.1%) accounting for the largest median family size of 3.89 persons per family. On the other hand, married-couple families (6,745 | 73.2%) represent the smallest median family size with 3.20 persons per family.
| Family Type | # Families | Family Size |
| Married-Couple | 6,745 (73.2%) | 3.20 |
| Single Male/Father | 896 (9.7%) | 3.60 |
| Single Female/Mother | 1,576 (17.1%) | 3.89 |
| Total Families | 9,217 (100.0%) | 3.35 |
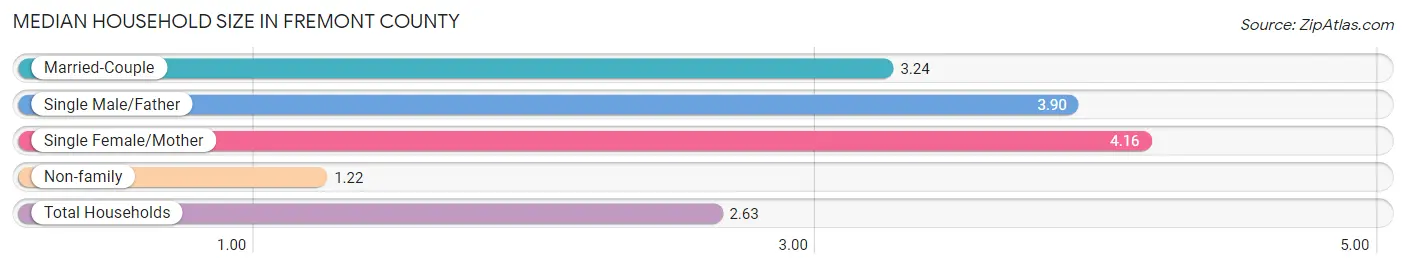
Median Household Size in Fremont County
The median household size in Fremont County is 2.63 persons per household, with single female/mother households (1,576 | 10.8%) accounting for the largest median household size of 4.16 persons per household. non-family households (5,400 | 36.9%) represent the smallest median household size with 1.22 persons per household.
| Household Type | # Households | Household Size |
| Married-Couple | 6,745 (46.1%) | 3.24 |
| Single Male/Father | 896 (6.1%) | 3.90 |
| Single Female/Mother | 1,576 (10.8%) | 4.16 |
| Non-family | 5,400 (36.9%) | 1.22 |
| Total Households | 14,617 (100.0%) | 2.63 |
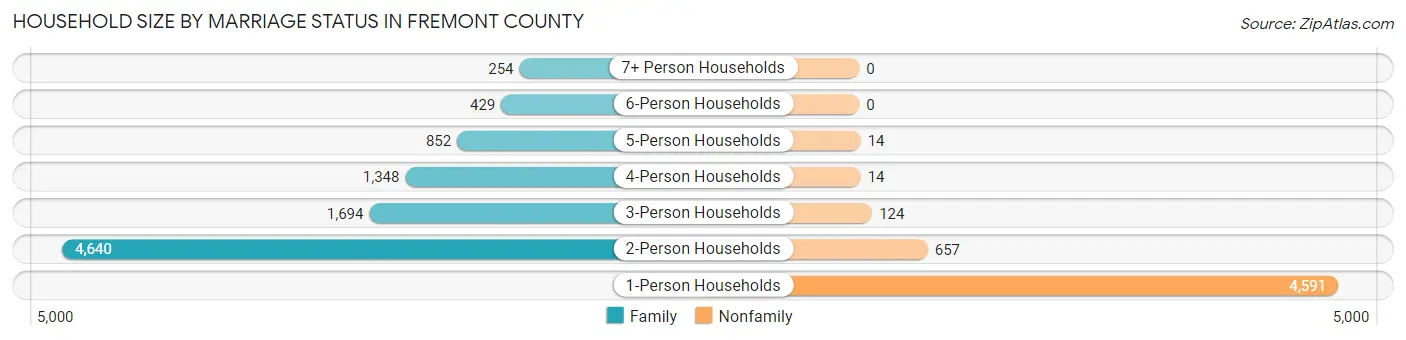
Household Size by Marriage Status in Fremont County
Out of a total of 14,617 households in Fremont County, 9,217 (63.1%) are family households, while 5,400 (36.9%) are nonfamily households. The most numerous type of family households are 2-person households, comprising 4,640, and the most common type of nonfamily households are 1-person households, comprising 4,591.
| Household Size | Family Households | Nonfamily Households |
| 1-Person Households | - | 4,591 (31.4%) |
| 2-Person Households | 4,640 (31.7%) | 657 (4.5%) |
| 3-Person Households | 1,694 (11.6%) | 124 (0.9%) |
| 4-Person Households | 1,348 (9.2%) | 14 (0.1%) |
| 5-Person Households | 852 (5.8%) | 14 (0.1%) |
| 6-Person Households | 429 (2.9%) | 0 (0.0%) |
| 7+ Person Households | 254 (1.7%) | 0 (0.0%) |
| Total | 9,217 (63.1%) | 5,400 (36.9%) |
Female Fertility in Fremont County
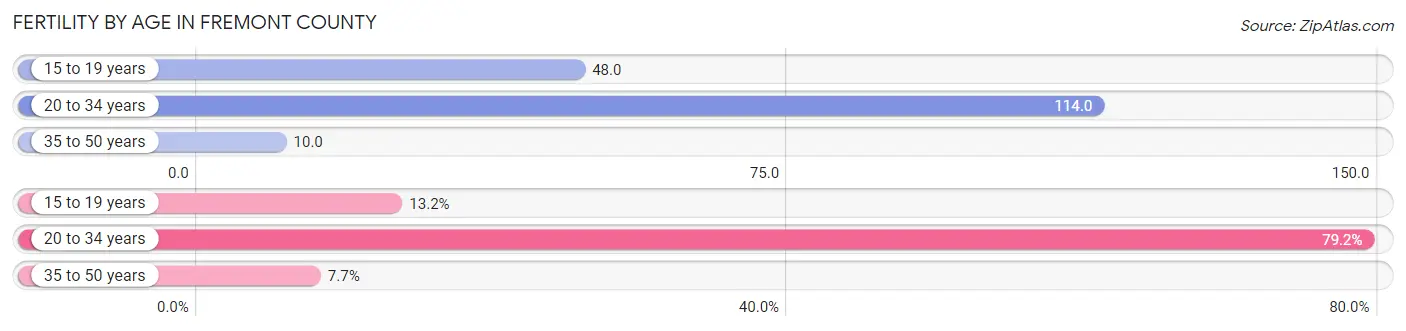
Fertility by Age in Fremont County
Average fertility rate in Fremont County is 58.0 births per 1,000 women. Women in the age bracket of 20 to 34 years have the highest fertility rate with 114.0 births per 1,000 women. Women in the age bracket of 20 to 34 years acount for 79.1% of all women with births.
| Age Bracket | Women with Births | Births / 1,000 Women |
| 15 to 19 years | 62 (13.2%) | 48.0 |
| 20 to 34 years | 372 (79.1%) | 114.0 |
| 35 to 50 years | 36 (7.7%) | 10.0 |
| Total | 470 (100.0%) | 58.0 |
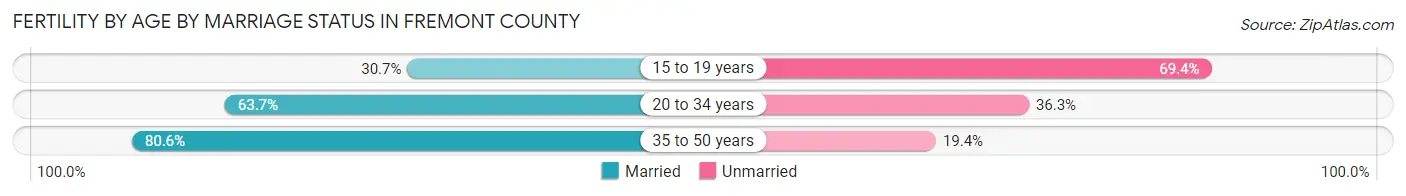
Fertility by Age by Marriage Status in Fremont County
60.6% of women with births (470) in Fremont County are married. The highest percentage of unmarried women with births falls into 15 to 19 years age bracket with 69.4% of them unmarried at the time of birth, while the lowest percentage of unmarried women with births belong to 35 to 50 years age bracket with 19.4% of them unmarried.
| Age Bracket | Married | Unmarried |
| 15 to 19 years | 19 (30.6%) | 43 (69.4%) |
| 20 to 34 years | 237 (63.7%) | 135 (36.3%) |
| 35 to 50 years | 29 (80.6%) | 7 (19.4%) |
| Total | 285 (60.6%) | 185 (39.4%) |
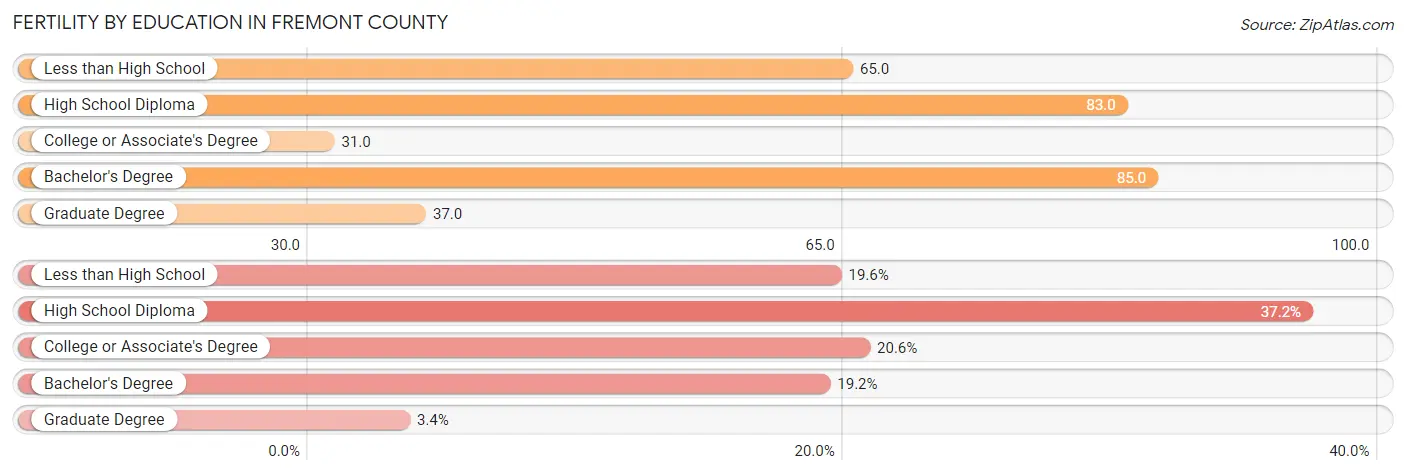
Fertility by Education in Fremont County
Average fertility rate in Fremont County is 58.0 births per 1,000 women. Women with the education attainment of bachelor's degree have the highest fertility rate of 85.0 births per 1,000 women, while women with the education attainment of college or associate's degree have the lowest fertility at 31.0 births per 1,000 women. Women with the education attainment of high school diploma represent 37.2% of all women with births.
| Educational Attainment | Women with Births | Births / 1,000 Women |
| Less than High School | 92 (19.6%) | 65.0 |
| High School Diploma | 175 (37.2%) | 83.0 |
| College or Associate's Degree | 97 (20.6%) | 31.0 |
| Bachelor's Degree | 90 (19.2%) | 85.0 |
| Graduate Degree | 16 (3.4%) | 37.0 |
| Total | 470 (100.0%) | 58.0 |
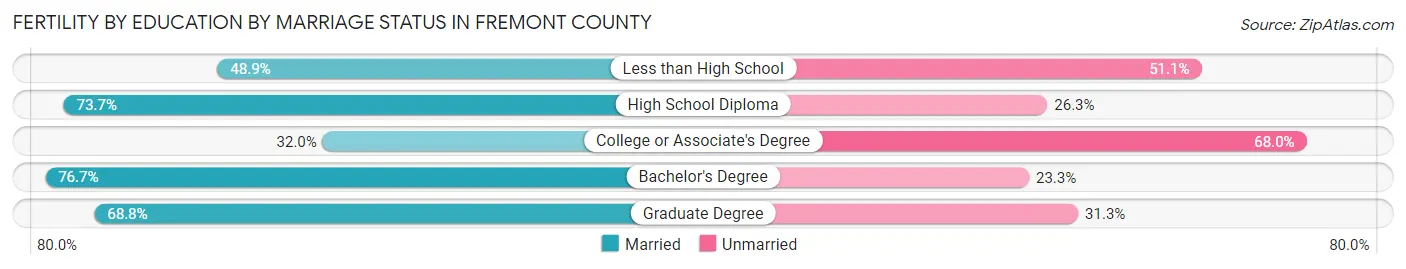
Fertility by Education by Marriage Status in Fremont County
39.4% of women with births in Fremont County are unmarried. Women with the educational attainment of bachelor's degree are most likely to be married with 76.7% of them married at childbirth, while women with the educational attainment of college or associate's degree are least likely to be married with 68.0% of them unmarried at childbirth.
| Educational Attainment | Married | Unmarried |
| Less than High School | 45 (48.9%) | 47 (51.1%) |
| High School Diploma | 129 (73.7%) | 46 (26.3%) |
| College or Associate's Degree | 31 (32.0%) | 66 (68.0%) |
| Bachelor's Degree | 69 (76.7%) | 21 (23.3%) |
| Graduate Degree | 11 (68.8%) | 5 (31.2%) |
| Total | 285 (60.6%) | 185 (39.4%) |
Income in Fremont County
Income Overview in Fremont County
Per Capita Income in Fremont County is $30,414, while median incomes of families and households are $76,114 and $60,030 respectively.
| Characteristic | Number | Measure |
| Per Capita Income | 39,402 | $30,414 |
| Median Family Income | 9,217 | $76,114 |
| Mean Family Income | 9,217 | $91,050 |
| Median Household Income | 14,617 | $60,030 |
| Mean Household Income | 14,617 | $77,246 |
| Income Deficit | 9,217 | $11,507 |
| Wage / Income Gap (%) | 39,402 | 27.53% |
| Wage / Income Gap ($) | 39,402 | 72.47¢ per $1 |
| Gini / Inequality Index | 39,402 | 0.42 |
Earnings by Sex in Fremont County
Average Earnings in Fremont County are $33,439, $37,969 for men and $27,518 for women, a difference of 27.5%.
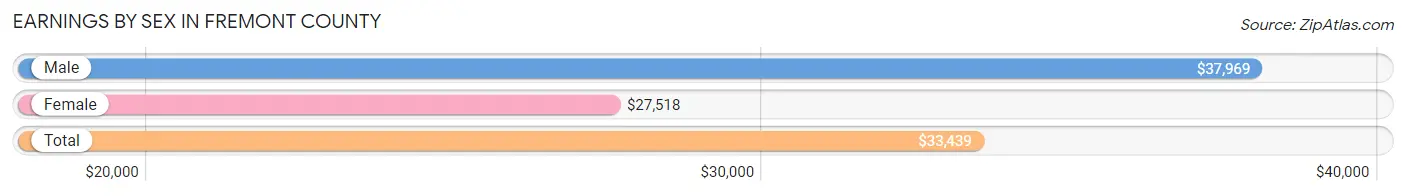
| Sex | Number | Average Earnings |
| Male | 10,702 (53.6%) | $37,969 |
| Female | 9,278 (46.4%) | $27,518 |
| Total | 19,980 (100.0%) | $33,439 |
Earnings by Sex by Income Bracket in Fremont County
The most common earnings brackets in Fremont County are $75,000 to $99,999 for men (1,226 | 11.5%) and $30,000 to $34,999 for women (712 | 7.7%).
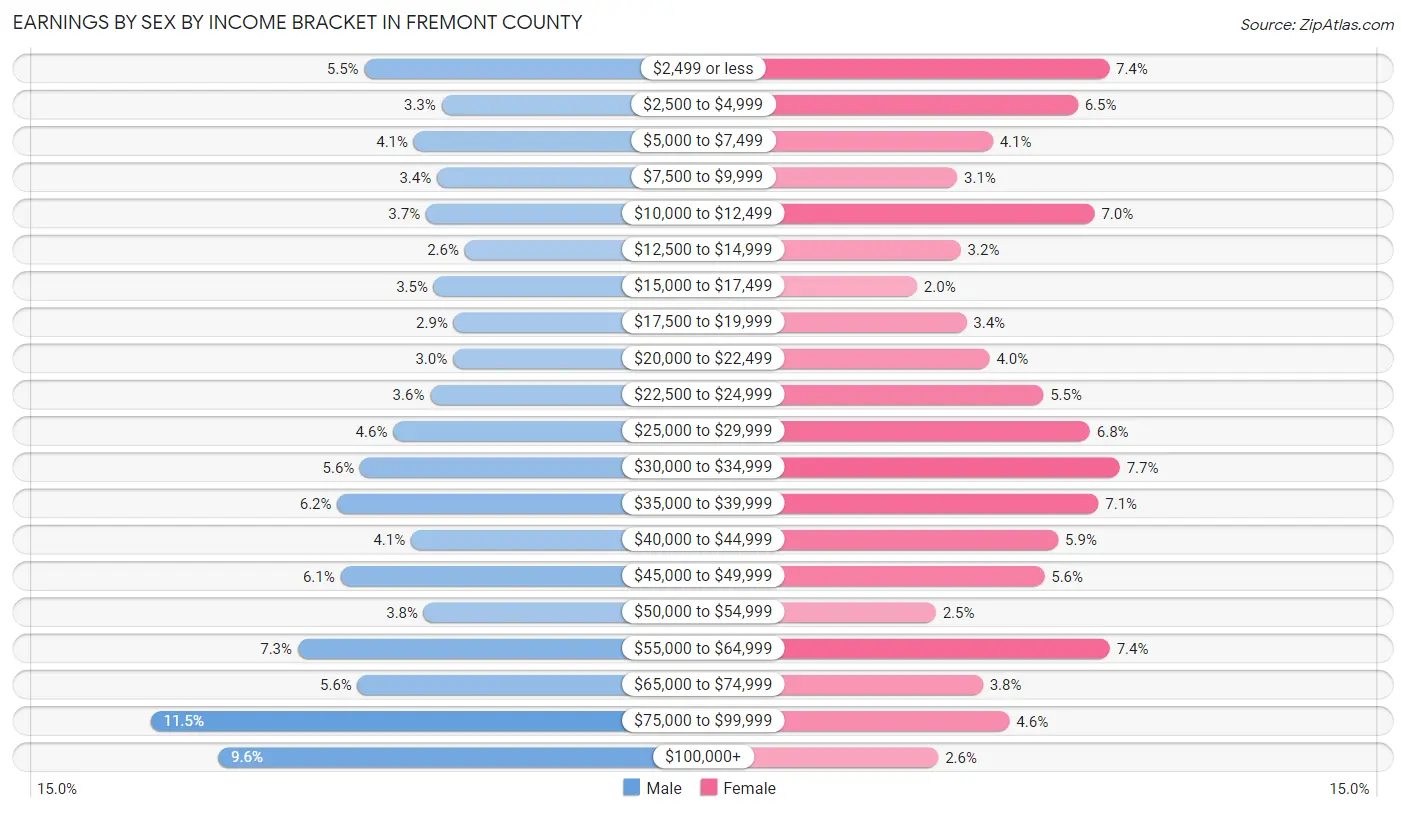
| Income | Male | Female |
| $2,499 or less | 583 (5.4%) | 684 (7.4%) |
| $2,500 to $4,999 | 351 (3.3%) | 602 (6.5%) |
| $5,000 to $7,499 | 435 (4.1%) | 380 (4.1%) |
| $7,500 to $9,999 | 365 (3.4%) | 288 (3.1%) |
| $10,000 to $12,499 | 398 (3.7%) | 646 (7.0%) |
| $12,500 to $14,999 | 281 (2.6%) | 297 (3.2%) |
| $15,000 to $17,499 | 375 (3.5%) | 183 (2.0%) |
| $17,500 to $19,999 | 315 (2.9%) | 312 (3.4%) |
| $20,000 to $22,499 | 317 (3.0%) | 372 (4.0%) |
| $22,500 to $24,999 | 385 (3.6%) | 512 (5.5%) |
| $25,000 to $29,999 | 497 (4.6%) | 634 (6.8%) |
| $30,000 to $34,999 | 596 (5.6%) | 712 (7.7%) |
| $35,000 to $39,999 | 665 (6.2%) | 656 (7.1%) |
| $40,000 to $44,999 | 443 (4.1%) | 551 (5.9%) |
| $45,000 to $49,999 | 655 (6.1%) | 515 (5.6%) |
| $50,000 to $54,999 | 405 (3.8%) | 232 (2.5%) |
| $55,000 to $64,999 | 783 (7.3%) | 686 (7.4%) |
| $65,000 to $74,999 | 604 (5.6%) | 354 (3.8%) |
| $75,000 to $99,999 | 1,226 (11.5%) | 424 (4.6%) |
| $100,000+ | 1,023 (9.6%) | 238 (2.6%) |
| Total | 10,702 (100.0%) | 9,278 (100.0%) |
Earnings by Sex by Educational Attainment in Fremont County
Average earnings in Fremont County are $45,295 for men and $32,616 for women, a difference of 28.0%. Men with an educational attainment of graduate degree enjoy the highest average annual earnings of $79,889, while those with less than high school education earn the least with $27,321. Women with an educational attainment of graduate degree earn the most with the average annual earnings of $56,283, while those with high school diploma education have the smallest earnings of $23,408.
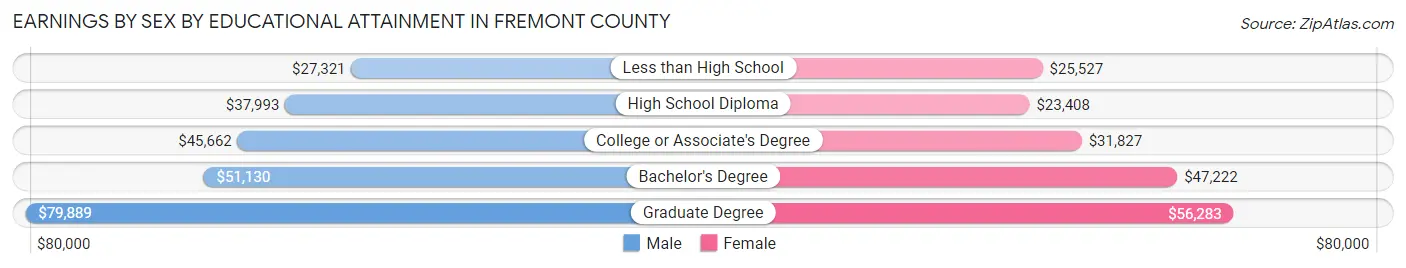
| Educational Attainment | Male Income | Female Income |
| Less than High School | $27,321 | $25,527 |
| High School Diploma | $37,993 | $23,408 |
| College or Associate's Degree | $45,662 | $31,827 |
| Bachelor's Degree | $51,130 | $47,222 |
| Graduate Degree | $79,889 | $56,283 |
| Total | $45,295 | $32,616 |
Family Income in Fremont County
Family Income Brackets in Fremont County
According to the Fremont County family income data, there are 1,972 families falling into the $100,000 to $149,999 income range, which is the most common income bracket and makes up 21.4% of all families. Conversely, the less than $10,000 income bracket is the least frequent group with only 230 families (2.5%) belonging to this category.
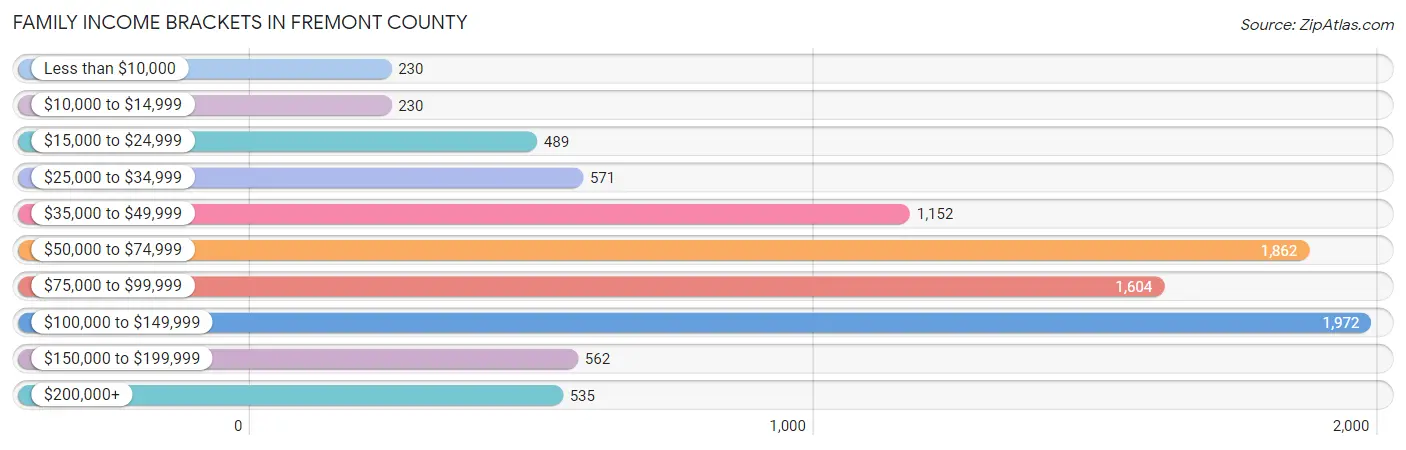
| Income Bracket | # Families | % Families |
| Less than $10,000 | 230 | 2.5% |
| $10,000 to $14,999 | 230 | 2.5% |
| $15,000 to $24,999 | 489 | 5.3% |
| $25,000 to $34,999 | 571 | 6.2% |
| $35,000 to $49,999 | 1,152 | 12.5% |
| $50,000 to $74,999 | 1,862 | 20.2% |
| $75,000 to $99,999 | 1,604 | 17.4% |
| $100,000 to $149,999 | 1,972 | 21.4% |
| $150,000 to $199,999 | 562 | 6.1% |
| $200,000+ | 535 | 5.8% |
Family Income by Famaliy Size in Fremont County
7+ person families (245 | 2.7%) account for the highest median family income in Fremont County with $98,984 per family, while 2-person families (4,924 | 53.4%) have the highest median income of $36,154 per family member.
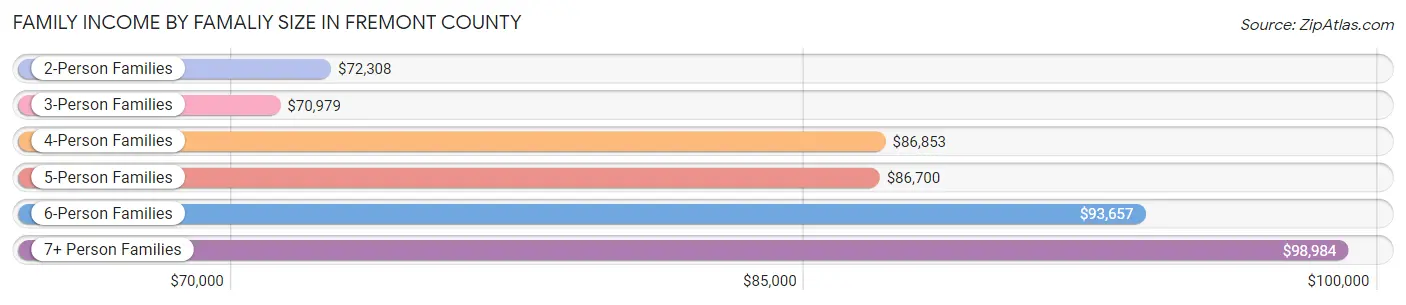
| Income Bracket | # Families | Median Income |
| 2-Person Families | 4,924 (53.4%) | $72,308 |
| 3-Person Families | 1,650 (17.9%) | $70,979 |
| 4-Person Families | 1,275 (13.8%) | $86,853 |
| 5-Person Families | 780 (8.5%) | $86,700 |
| 6-Person Families | 343 (3.7%) | $93,657 |
| 7+ Person Families | 245 (2.7%) | $98,984 |
| Total | 9,217 (100.0%) | $76,114 |
Family Income by Number of Earners in Fremont County
The median family income in Fremont County is $76,114, with families comprising 3+ earners (828) having the highest median family income of $105,056, while families with no earners (1,610) have the lowest median family income of $41,105, accounting for 9.0% and 17.5% of families, respectively.
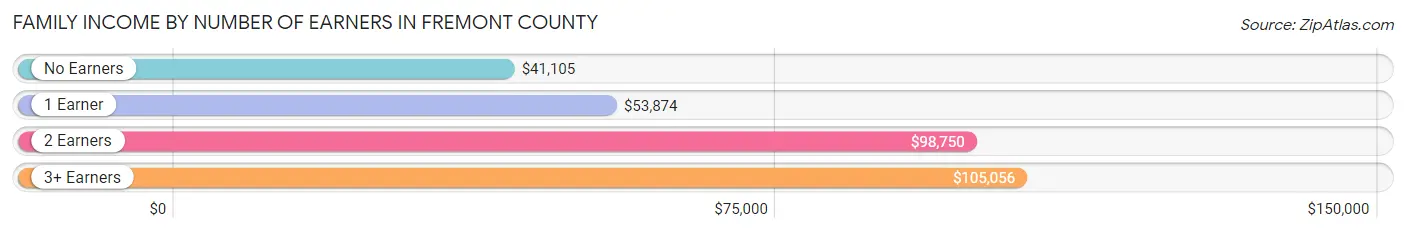
| Number of Earners | # Families | Median Income |
| No Earners | 1,610 (17.5%) | $41,105 |
| 1 Earner | 2,753 (29.9%) | $53,874 |
| 2 Earners | 4,026 (43.7%) | $98,750 |
| 3+ Earners | 828 (9.0%) | $105,056 |
| Total | 9,217 (100.0%) | $76,114 |
Household Income in Fremont County
Household Income Brackets in Fremont County
With 2,967 households falling in the category, the $50,000 to $74,999 income range is the most frequent in Fremont County, accounting for 20.3% of all households. In contrast, only 585 households (4.0%) fall into the less than $10,000 income bracket, making it the least populous group.
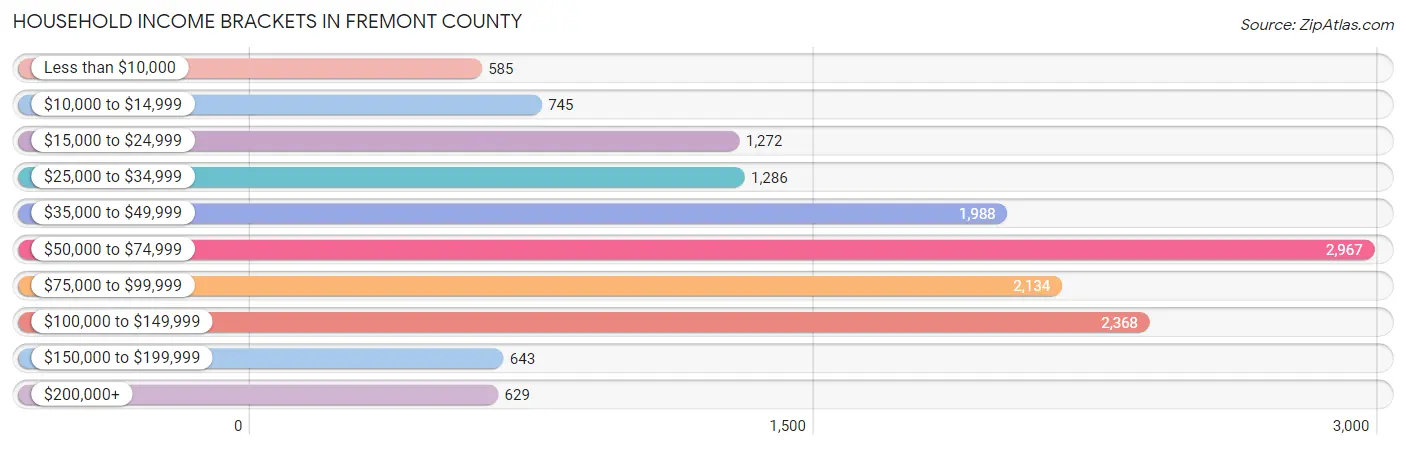
| Income Bracket | # Households | % Households |
| Less than $10,000 | 585 | 4.0% |
| $10,000 to $14,999 | 745 | 5.1% |
| $15,000 to $24,999 | 1,272 | 8.7% |
| $25,000 to $34,999 | 1,286 | 8.8% |
| $35,000 to $49,999 | 1,988 | 13.6% |
| $50,000 to $74,999 | 2,967 | 20.3% |
| $75,000 to $99,999 | 2,134 | 14.6% |
| $100,000 to $149,999 | 2,368 | 16.2% |
| $150,000 to $199,999 | 643 | 4.4% |
| $200,000+ | 629 | 4.3% |
Household Income by Householder Age in Fremont County
The median household income in Fremont County is $60,030, with the highest median household income of $66,105 found in the 45 to 64 years age bracket for the primary householder. A total of 5,692 households (38.9%) fall into this category. Meanwhile, the 15 to 24 years age bracket for the primary householder has the lowest median household income of $37,303, with 479 households (3.3%) in this group.
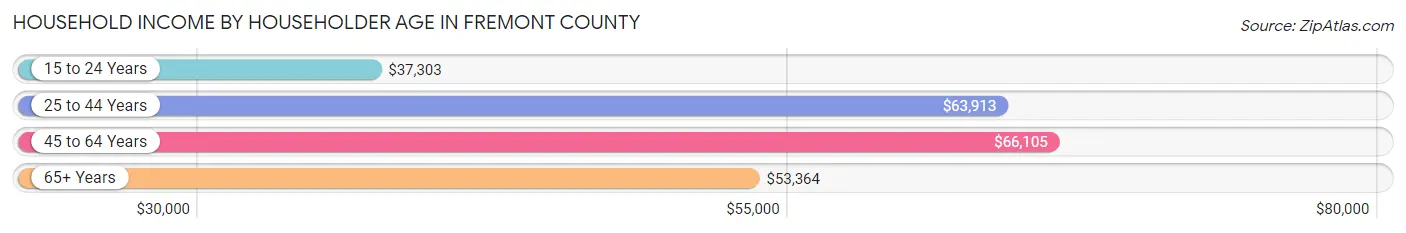
| Income Bracket | # Households | Median Income |
| 15 to 24 Years | 479 (3.3%) | $37,303 |
| 25 to 44 Years | 4,022 (27.5%) | $63,913 |
| 45 to 64 Years | 5,692 (38.9%) | $66,105 |
| 65+ Years | 4,424 (30.3%) | $53,364 |
| Total | 14,617 (100.0%) | $60,030 |
Poverty in Fremont County
Income Below Poverty by Sex and Age in Fremont County
With 12.9% poverty level for males and 14.8% for females among the residents of Fremont County, 5 year old males and 5 year old females are the most vulnerable to poverty, with 81 males (38.9%) and 63 females (39.1%) in their respective age groups living below the poverty level.
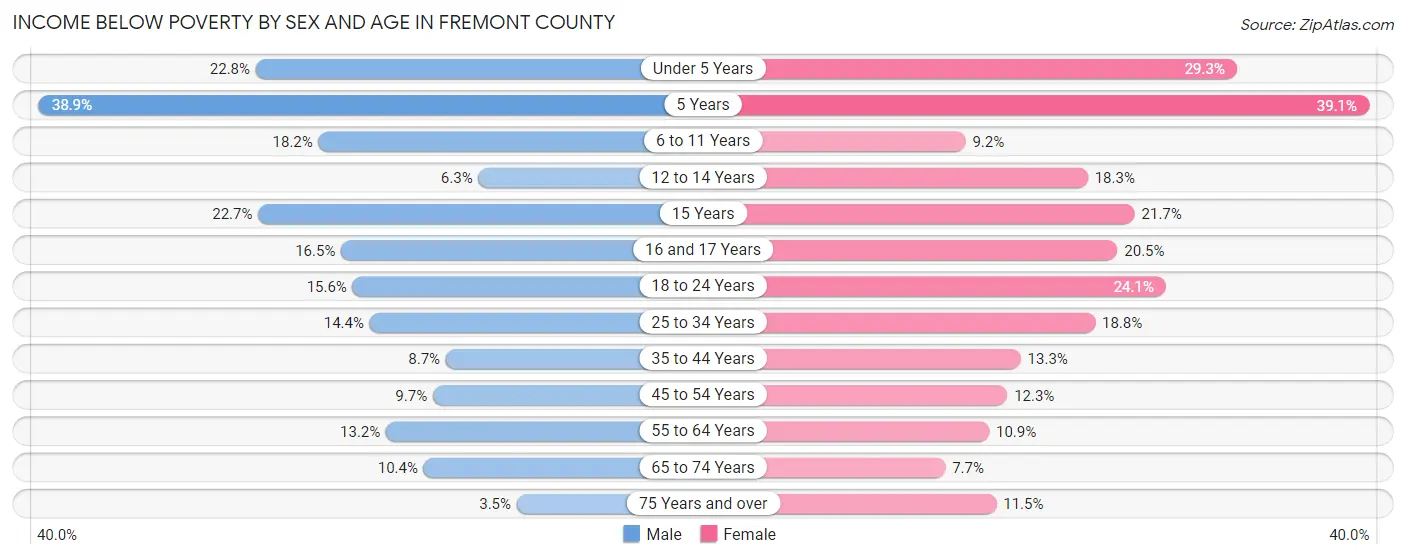
| Age Bracket | Male | Female |
| Under 5 Years | 287 (22.8%) | 326 (29.3%) |
| 5 Years | 81 (38.9%) | 63 (39.1%) |
| 6 to 11 Years | 329 (18.2%) | 149 (9.2%) |
| 12 to 14 Years | 54 (6.3%) | 162 (18.3%) |
| 15 Years | 41 (22.7%) | 75 (21.7%) |
| 16 and 17 Years | 108 (16.5%) | 97 (20.5%) |
| 18 to 24 Years | 272 (15.6%) | 330 (24.0%) |
| 25 to 34 Years | 301 (14.4%) | 418 (18.8%) |
| 35 to 44 Years | 194 (8.7%) | 308 (13.3%) |
| 45 to 54 Years | 212 (9.7%) | 253 (12.3%) |
| 55 to 64 Years | 346 (13.2%) | 287 (10.9%) |
| 65 to 74 Years | 235 (10.4%) | 178 (7.7%) |
| 75 Years and over | 43 (3.5%) | 173 (11.5%) |
| Total | 2,503 (12.9%) | 2,819 (14.8%) |
Income Above Poverty by Sex and Age in Fremont County
According to the poverty statistics in Fremont County, males aged 75 years and over and females aged 65 to 74 years are the age groups that are most secure financially, with 96.6% of males and 92.3% of females in these age groups living above the poverty line.
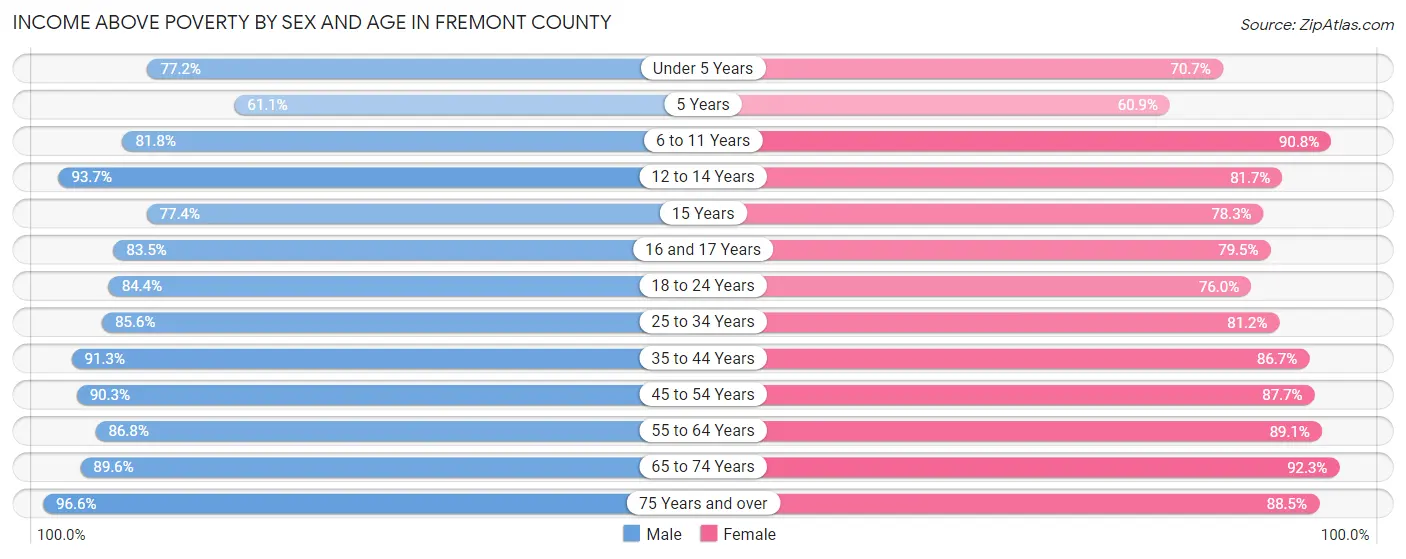
| Age Bracket | Male | Female |
| Under 5 Years | 970 (77.2%) | 786 (70.7%) |
| 5 Years | 127 (61.1%) | 98 (60.9%) |
| 6 to 11 Years | 1,482 (81.8%) | 1,474 (90.8%) |
| 12 to 14 Years | 803 (93.7%) | 725 (81.7%) |
| 15 Years | 140 (77.3%) | 270 (78.3%) |
| 16 and 17 Years | 547 (83.5%) | 377 (79.5%) |
| 18 to 24 Years | 1,467 (84.4%) | 1,042 (75.9%) |
| 25 to 34 Years | 1,794 (85.6%) | 1,805 (81.2%) |
| 35 to 44 Years | 2,031 (91.3%) | 2,012 (86.7%) |
| 45 to 54 Years | 1,979 (90.3%) | 1,808 (87.7%) |
| 55 to 64 Years | 2,284 (86.8%) | 2,338 (89.1%) |
| 65 to 74 Years | 2,034 (89.6%) | 2,139 (92.3%) |
| 75 Years and over | 1,202 (96.6%) | 1,335 (88.5%) |
| Total | 16,860 (87.1%) | 16,209 (85.2%) |
Income Below Poverty Among Married-Couple Families in Fremont County
The poverty statistics for married-couple families in Fremont County show that 3.0% or 203 of the total 6,745 families live below the poverty line. Families with 5 or more children have the highest poverty rate of 16.8%, comprising of 20 families. On the other hand, families with 1 or 2 children have the lowest poverty rate of 2.0%, which includes 33 families.
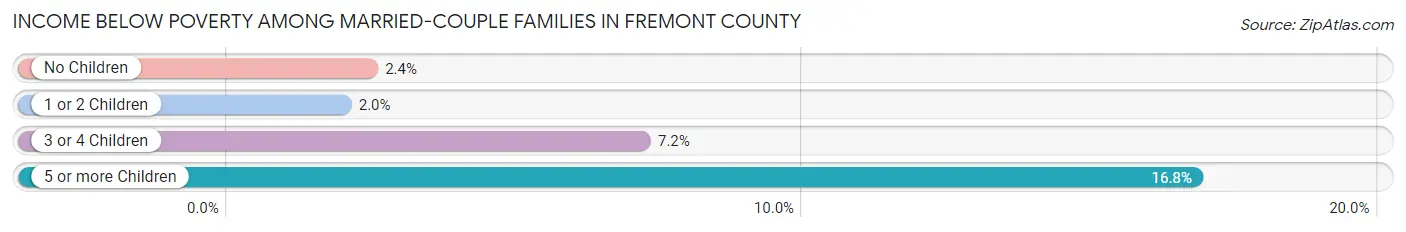
| Children | Above Poverty | Below Poverty |
| No Children | 4,241 (97.6%) | 106 (2.4%) |
| 1 or 2 Children | 1,634 (98.0%) | 33 (2.0%) |
| 3 or 4 Children | 568 (92.8%) | 44 (7.2%) |
| 5 or more Children | 99 (83.2%) | 20 (16.8%) |
| Total | 6,542 (97.0%) | 203 (3.0%) |
Income Below Poverty Among Single-Parent Households in Fremont County
According to the poverty data in Fremont County, 21.6% or 194 single-father households and 27.2% or 428 single-mother households are living below the poverty line. Among single-father households, those with 5 or more children have the highest poverty rate, with 23 households (53.5%) experiencing poverty. Likewise, among single-mother households, those with 3 or 4 children have the highest poverty rate, with 102 households (54.0%) falling below the poverty line.
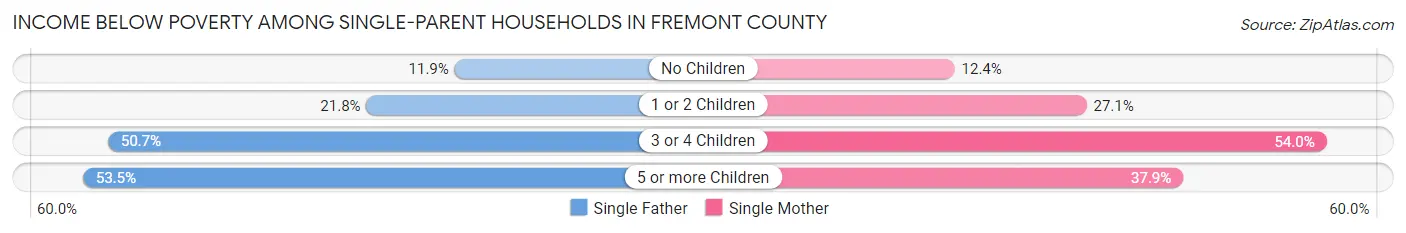
| Children | Single Father | Single Mother |
| No Children | 43 (11.9%) | 45 (12.4%) |
| 1 or 2 Children | 92 (21.8%) | 270 (27.1%) |
| 3 or 4 Children | 36 (50.7%) | 102 (54.0%) |
| 5 or more Children | 23 (53.5%) | 11 (37.9%) |
| Total | 194 (21.6%) | 428 (27.2%) |
Income Below Poverty Among Married-Couple vs Single-Parent Households in Fremont County
The poverty data for Fremont County shows that 203 of the married-couple family households (3.0%) and 622 of the single-parent households (25.2%) are living below the poverty level. Within the married-couple family households, those with 5 or more children have the highest poverty rate, with 20 households (16.8%) falling below the poverty line. Among the single-parent households, those with 3 or 4 children have the highest poverty rate, with 138 household (53.1%) living below poverty.
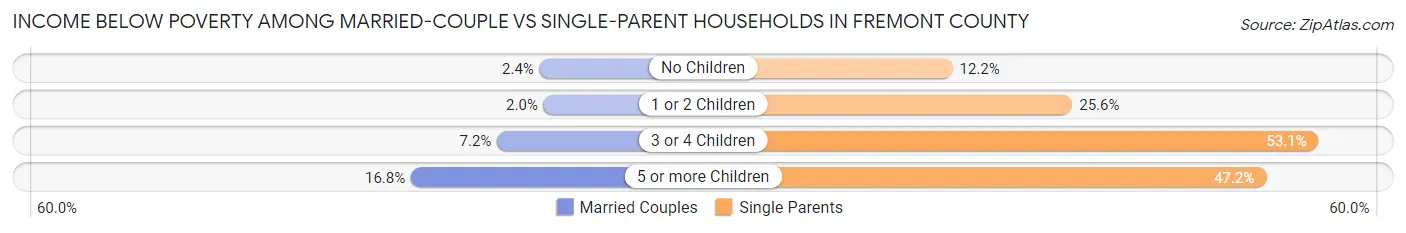
| Children | Married-Couple Families | Single-Parent Households |
| No Children | 106 (2.4%) | 88 (12.2%) |
| 1 or 2 Children | 33 (2.0%) | 362 (25.6%) |
| 3 or 4 Children | 44 (7.2%) | 138 (53.1%) |
| 5 or more Children | 20 (16.8%) | 34 (47.2%) |
| Total | 203 (3.0%) | 622 (25.2%) |
Employment Characteristics in Fremont County
Employment by Class of Employer in Fremont County
Among the 16,314 employed individuals in Fremont County, private company employees (8,152 | 50.0%), local government employees (2,649 | 16.2%), and self-employed (not incorporated) (1,600 | 9.8%) make up the most common classes of employment.
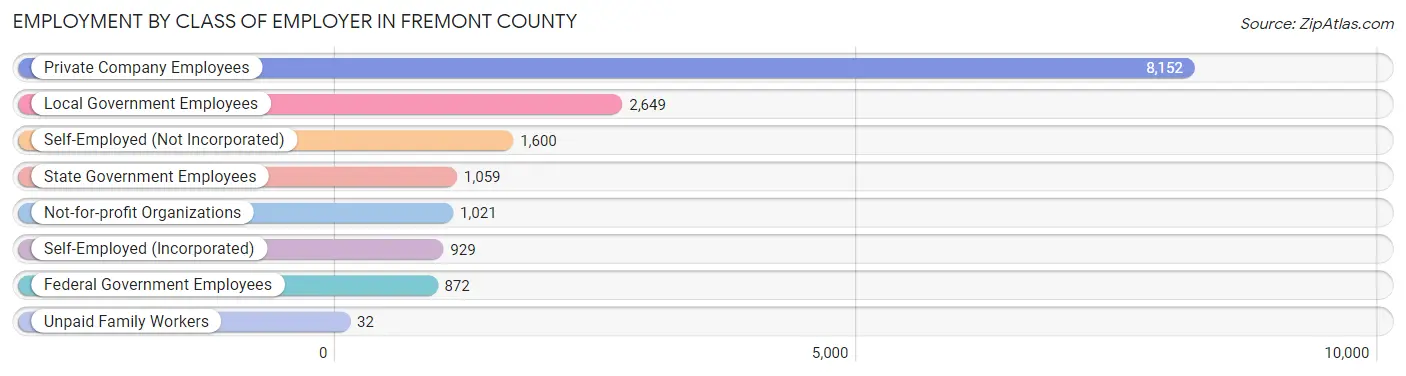
| Employer Class | # Employees | % Employees |
| Private Company Employees | 8,152 | 50.0% |
| Self-Employed (Incorporated) | 929 | 5.7% |
| Self-Employed (Not Incorporated) | 1,600 | 9.8% |
| Not-for-profit Organizations | 1,021 | 6.3% |
| Local Government Employees | 2,649 | 16.2% |
| State Government Employees | 1,059 | 6.5% |
| Federal Government Employees | 872 | 5.3% |
| Unpaid Family Workers | 32 | 0.2% |
| Total | 16,314 | 100.0% |
Employment Status by Age in Fremont County
According to the labor force statistics for Fremont County, out of the total population over 16 years of age (30,754), 61.2% or 18,821 individuals are in the labor force, with 8.2% or 1,543 of them unemployed. The age group with the highest labor force participation rate is 35 to 44 years, with 82.1% or 3,834 individuals in the labor force. Within the labor force, the 16 to 19 years age range has the highest percentage of unemployed individuals, with 20.5% or 212 of them being unemployed.
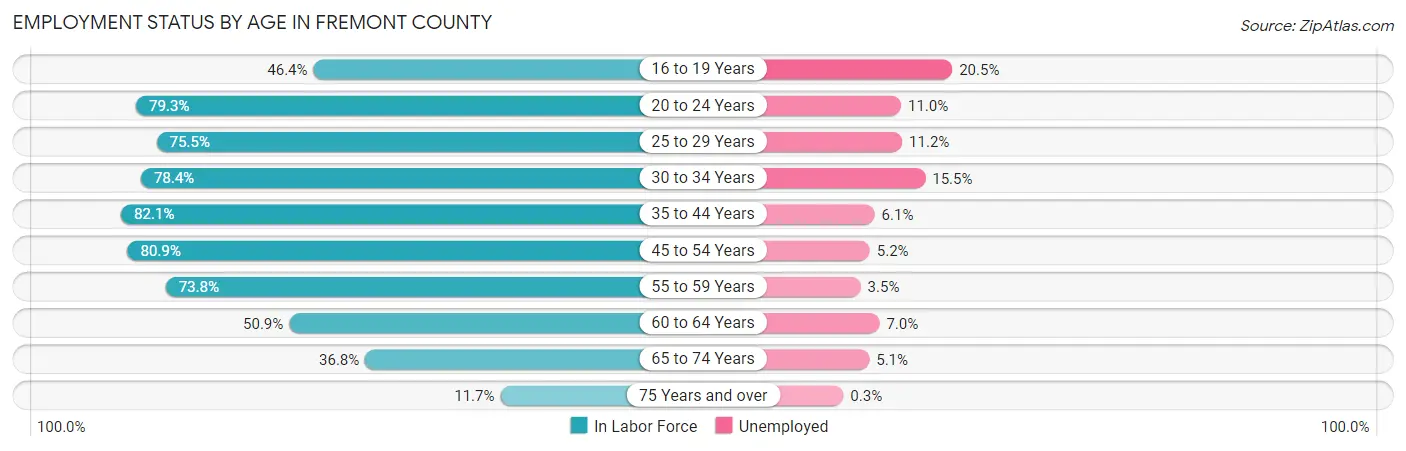
| Age Bracket | In Labor Force | Unemployed |
| 16 to 19 Years | 1,035 (46.4%) | 212 (20.5%) |
| 20 to 24 Years | 1,775 (79.3%) | 195 (11.0%) |
| 25 to 29 Years | 1,619 (75.5%) | 181 (11.2%) |
| 30 to 34 Years | 1,822 (78.4%) | 282 (15.5%) |
| 35 to 44 Years | 3,834 (82.1%) | 234 (6.1%) |
| 45 to 54 Years | 3,474 (80.9%) | 181 (5.2%) |
| 55 to 59 Years | 1,675 (73.8%) | 59 (3.5%) |
| 60 to 64 Years | 1,545 (50.9%) | 108 (7.0%) |
| 65 to 74 Years | 1,709 (36.8%) | 87 (5.1%) |
| 75 Years and over | 340 (11.7%) | 1 (0.3%) |
| Total | 18,821 (61.2%) | 1,543 (8.2%) |
Employment Status by Educational Attainment in Fremont County
According to labor force statistics for Fremont County, 74.5% of individuals (13,960) out of the total population between 25 and 64 years of age (18,738) are in the labor force, with 7.5% or 1,047 of them being unemployed. The group with the highest labor force participation rate are those with the educational attainment of bachelor's degree or higher, with 82.4% or 3,537 individuals in the labor force. Within the labor force, individuals with less than high school education have the highest percentage of unemployment, with 24.6% or 180 of them being unemployed.
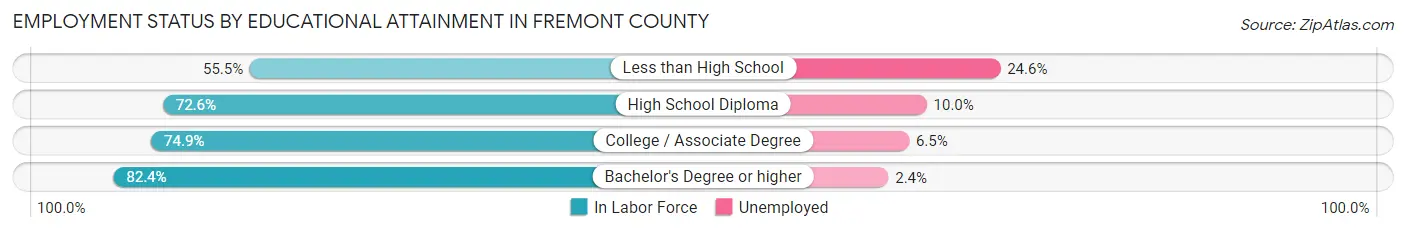
| Educational Attainment | In Labor Force | Unemployed |
| Less than High School | 733 (55.5%) | 325 (24.6%) |
| High School Diploma | 4,226 (72.6%) | 582 (10.0%) |
| College / Associate Degree | 5,471 (74.9%) | 475 (6.5%) |
| Bachelor's Degree or higher | 3,537 (82.4%) | 103 (2.4%) |
| Total | 13,960 (74.5%) | 1,405 (7.5%) |
Employment Occupations by Sex in Fremont County
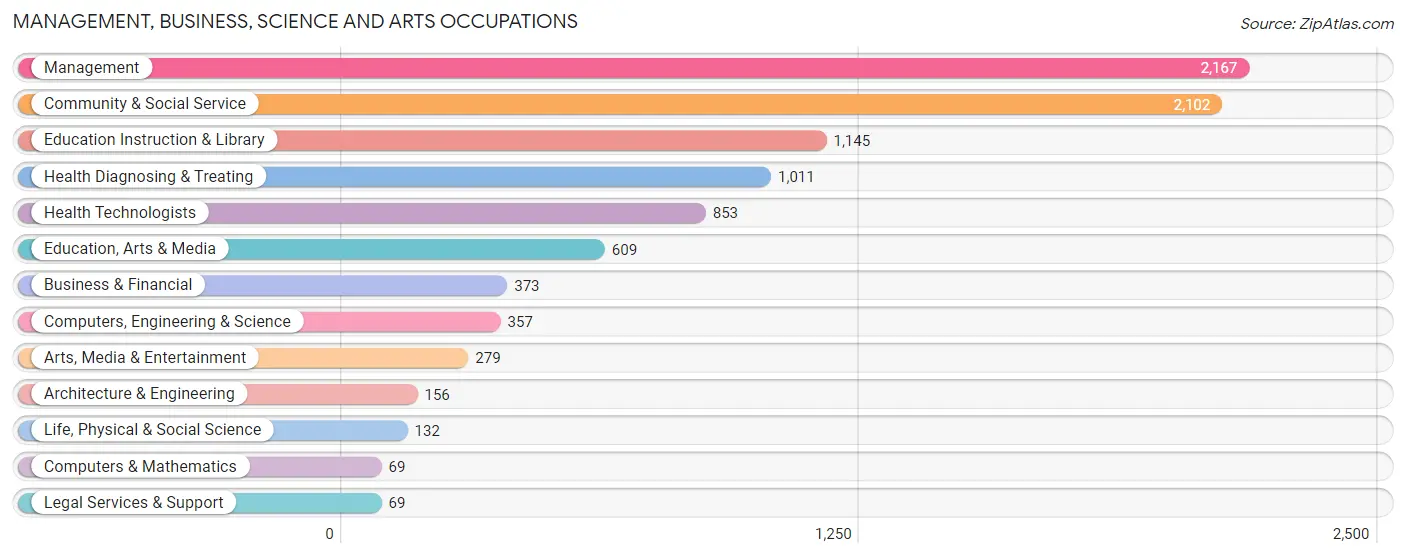
Management, Business, Science and Arts Occupations
The most common Management, Business, Science and Arts occupations in Fremont County are Management (2,167 | 12.5%), Community & Social Service (2,102 | 12.2%), Education Instruction & Library (1,145 | 6.6%), Health Diagnosing & Treating (1,011 | 5.9%), and Health Technologists (853 | 4.9%).
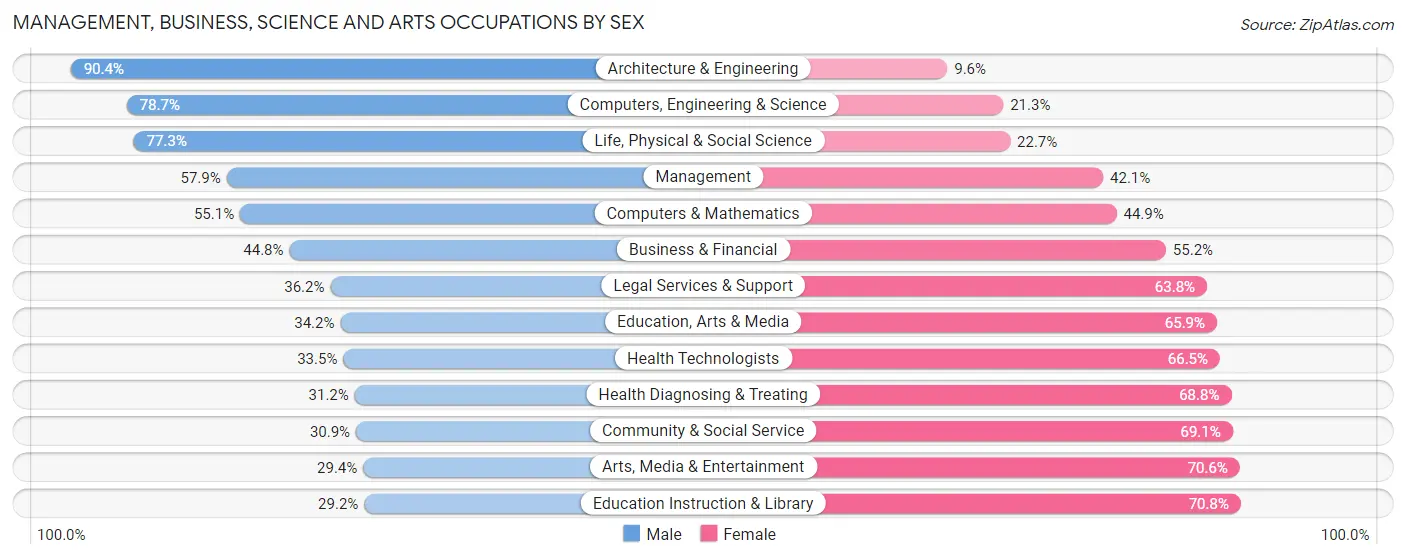
Management, Business, Science and Arts Occupations by Sex
Within the Management, Business, Science and Arts occupations in Fremont County, the most male-oriented occupations are Architecture & Engineering (90.4%), Computers, Engineering & Science (78.7%), and Life, Physical & Social Science (77.3%), while the most female-oriented occupations are Education Instruction & Library (70.8%), Arts, Media & Entertainment (70.6%), and Community & Social Service (69.1%).
| Occupation | Male | Female |
| Management | 1,254 (57.9%) | 913 (42.1%) |
| Business & Financial | 167 (44.8%) | 206 (55.2%) |
| Computers, Engineering & Science | 281 (78.7%) | 76 (21.3%) |
| Computers & Mathematics | 38 (55.1%) | 31 (44.9%) |
| Architecture & Engineering | 141 (90.4%) | 15 (9.6%) |
| Life, Physical & Social Science | 102 (77.3%) | 30 (22.7%) |
| Community & Social Service | 649 (30.9%) | 1,453 (69.1%) |
| Education, Arts & Media | 208 (34.2%) | 401 (65.8%) |
| Legal Services & Support | 25 (36.2%) | 44 (63.8%) |
| Education Instruction & Library | 334 (29.2%) | 811 (70.8%) |
| Arts, Media & Entertainment | 82 (29.4%) | 197 (70.6%) |
| Health Diagnosing & Treating | 315 (31.2%) | 696 (68.8%) |
| Health Technologists | 286 (33.5%) | 567 (66.5%) |
| Total (Category) | 2,666 (44.4%) | 3,344 (55.6%) |
| Total (Overall) | 9,035 (52.3%) | 8,250 (47.7%) |
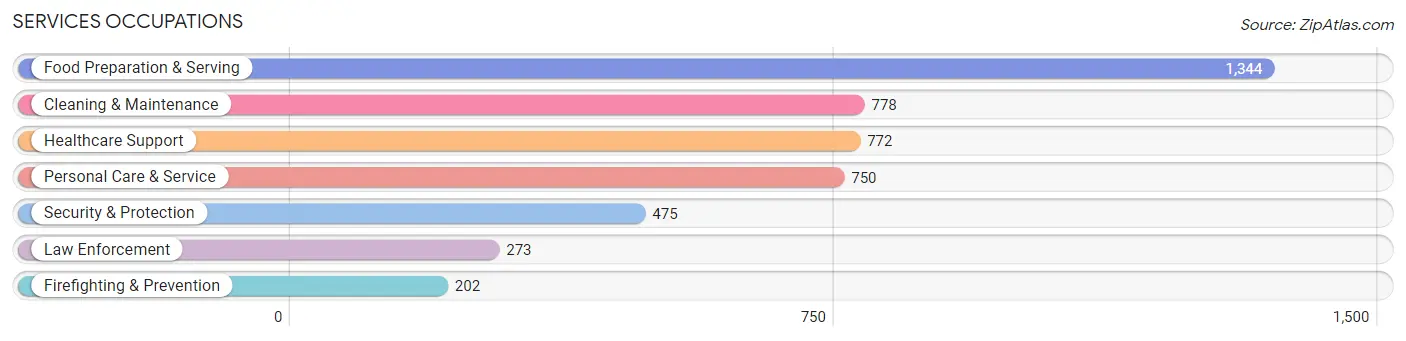
Services Occupations
The most common Services occupations in Fremont County are Food Preparation & Serving (1,344 | 7.8%), Cleaning & Maintenance (778 | 4.5%), Healthcare Support (772 | 4.5%), Personal Care & Service (750 | 4.3%), and Security & Protection (475 | 2.8%).
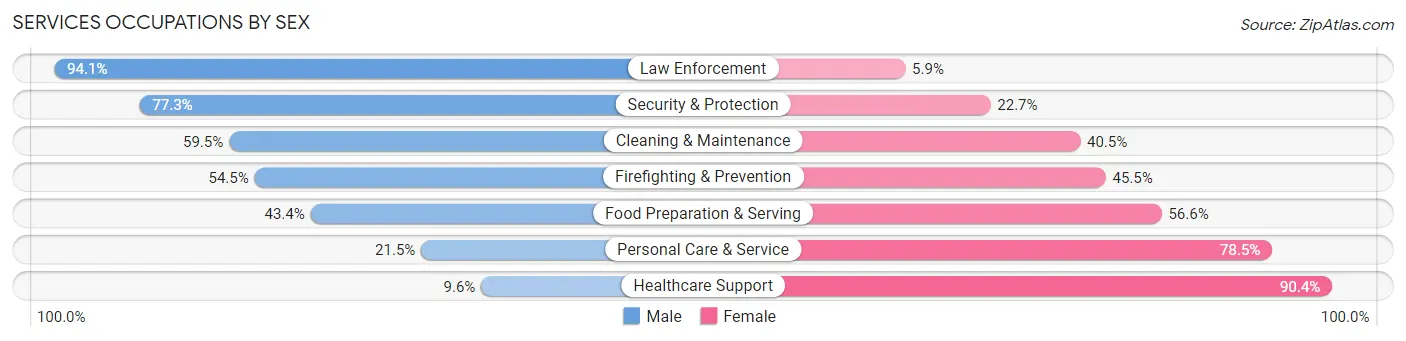
Services Occupations by Sex
Within the Services occupations in Fremont County, the most male-oriented occupations are Law Enforcement (94.1%), Security & Protection (77.3%), and Cleaning & Maintenance (59.5%), while the most female-oriented occupations are Healthcare Support (90.4%), Personal Care & Service (78.5%), and Food Preparation & Serving (56.6%).
| Occupation | Male | Female |
| Healthcare Support | 74 (9.6%) | 698 (90.4%) |
| Security & Protection | 367 (77.3%) | 108 (22.7%) |
| Firefighting & Prevention | 110 (54.5%) | 92 (45.5%) |
| Law Enforcement | 257 (94.1%) | 16 (5.9%) |
| Food Preparation & Serving | 583 (43.4%) | 761 (56.6%) |
| Cleaning & Maintenance | 463 (59.5%) | 315 (40.5%) |
| Personal Care & Service | 161 (21.5%) | 589 (78.5%) |
| Total (Category) | 1,648 (40.0%) | 2,471 (60.0%) |
| Total (Overall) | 9,035 (52.3%) | 8,250 (47.7%) |
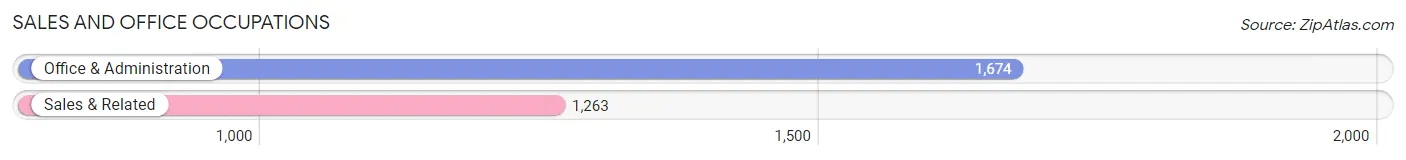
Sales and Office Occupations
The most common Sales and Office occupations in Fremont County are Office & Administration (1,674 | 9.7%), and Sales & Related (1,263 | 7.3%).
Sales and Office Occupations by Sex
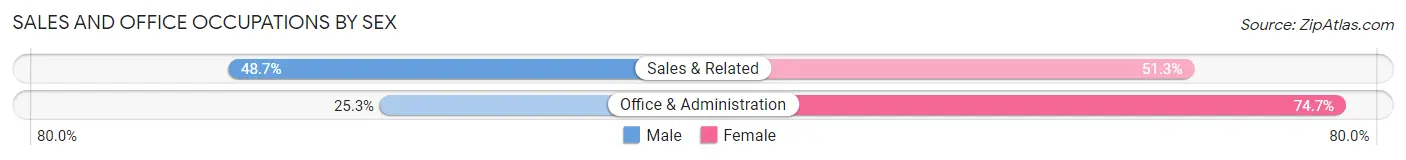
| Occupation | Male | Female |
| Sales & Related | 615 (48.7%) | 648 (51.3%) |
| Office & Administration | 424 (25.3%) | 1,250 (74.7%) |
| Total (Category) | 1,039 (35.4%) | 1,898 (64.6%) |
| Total (Overall) | 9,035 (52.3%) | 8,250 (47.7%) |
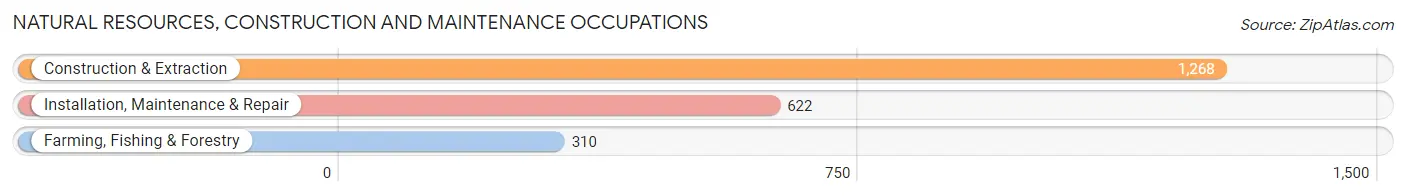
Natural Resources, Construction and Maintenance Occupations
The most common Natural Resources, Construction and Maintenance occupations in Fremont County are Construction & Extraction (1,268 | 7.3%), Installation, Maintenance & Repair (622 | 3.6%), and Farming, Fishing & Forestry (310 | 1.8%).
Natural Resources, Construction and Maintenance Occupations by Sex
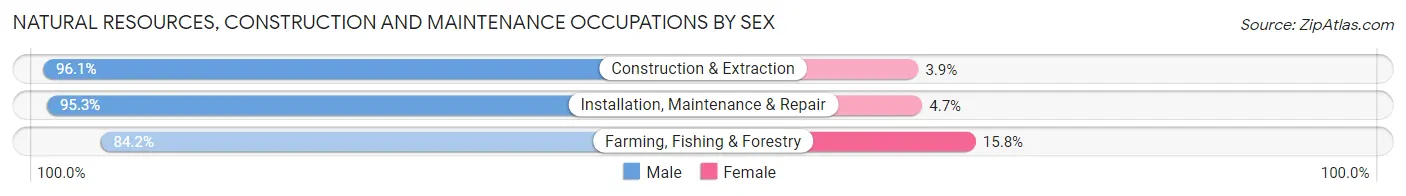
| Occupation | Male | Female |
| Farming, Fishing & Forestry | 261 (84.2%) | 49 (15.8%) |
| Construction & Extraction | 1,219 (96.1%) | 49 (3.9%) |
| Installation, Maintenance & Repair | 593 (95.3%) | 29 (4.7%) |
| Total (Category) | 2,073 (94.2%) | 127 (5.8%) |
| Total (Overall) | 9,035 (52.3%) | 8,250 (47.7%) |
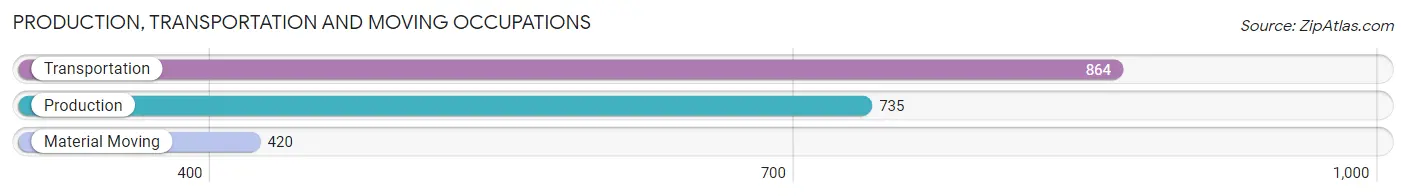
Production, Transportation and Moving Occupations
The most common Production, Transportation and Moving occupations in Fremont County are Transportation (864 | 5.0%), Production (735 | 4.3%), and Material Moving (420 | 2.4%).
Production, Transportation and Moving Occupations by Sex
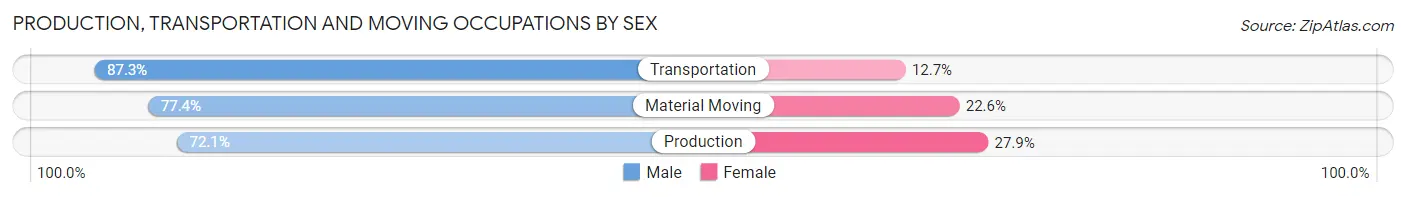
| Occupation | Male | Female |
| Production | 530 (72.1%) | 205 (27.9%) |
| Transportation | 754 (87.3%) | 110 (12.7%) |
| Material Moving | 325 (77.4%) | 95 (22.6%) |
| Total (Category) | 1,609 (79.7%) | 410 (20.3%) |
| Total (Overall) | 9,035 (52.3%) | 8,250 (47.7%) |
Employment Industries by Sex in Fremont County
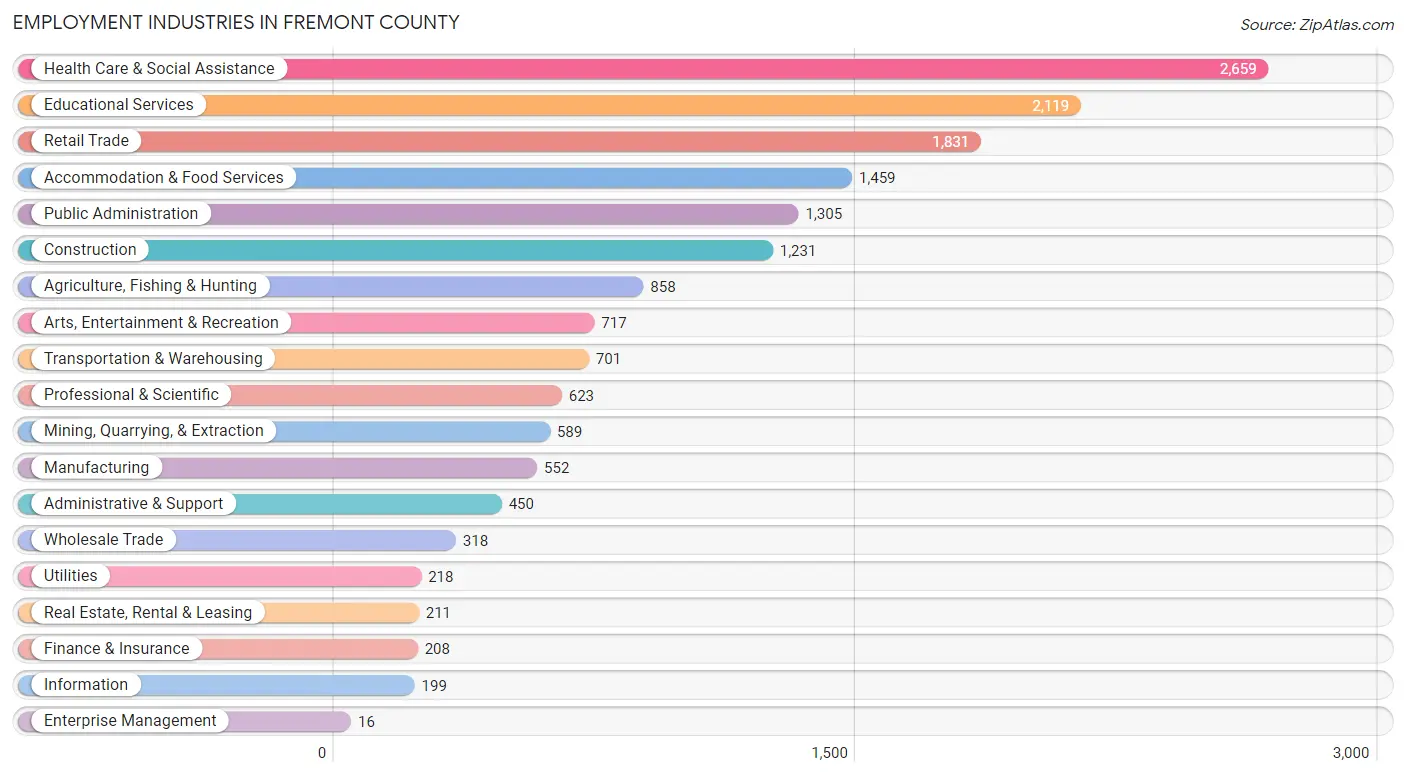
Employment Industries in Fremont County
The major employment industries in Fremont County include Health Care & Social Assistance (2,659 | 15.4%), Educational Services (2,119 | 12.3%), Retail Trade (1,831 | 10.6%), Accommodation & Food Services (1,459 | 8.4%), and Public Administration (1,305 | 7.5%).
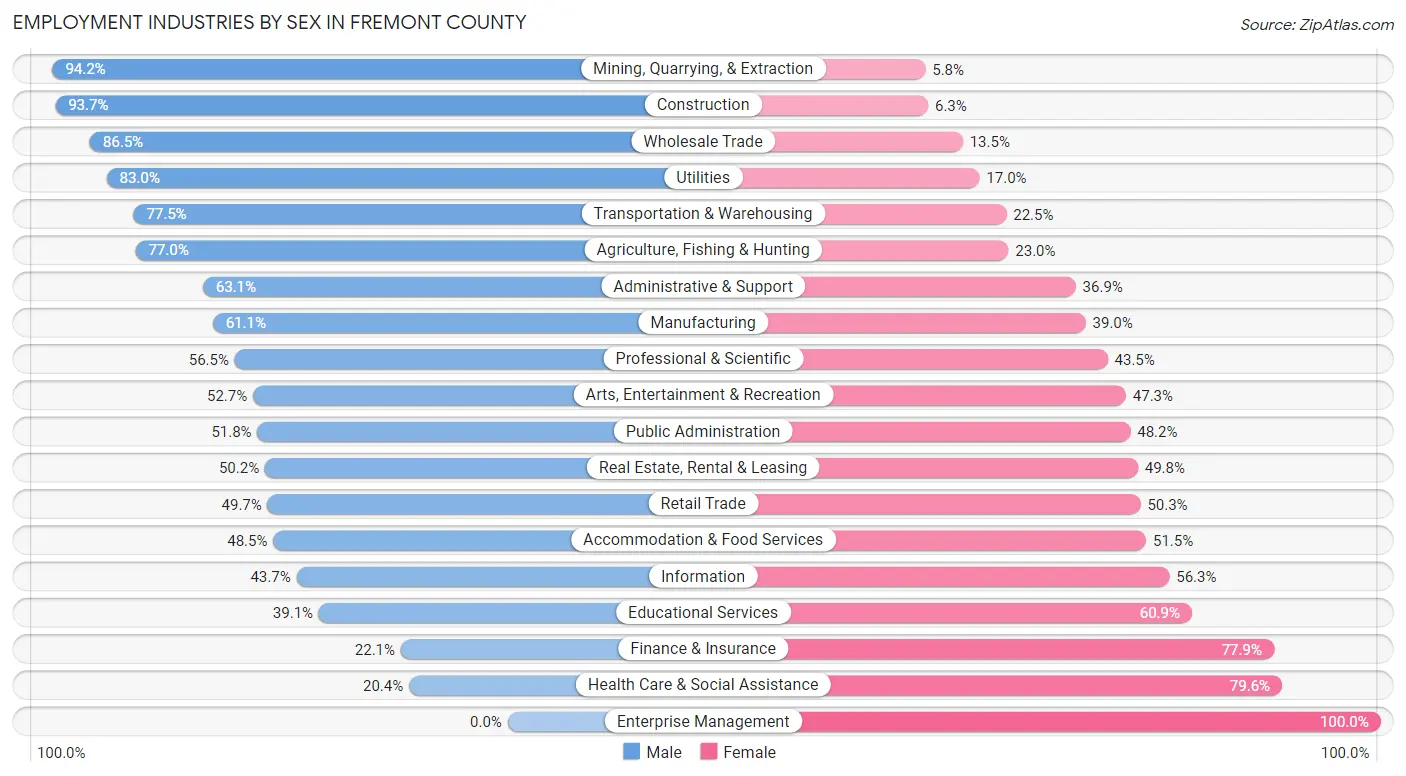
Employment Industries by Sex in Fremont County
The Fremont County industries that see more men than women are Mining, Quarrying, & Extraction (94.2%), Construction (93.7%), and Wholesale Trade (86.5%), whereas the industries that tend to have a higher number of women are Enterprise Management (100.0%), Health Care & Social Assistance (79.6%), and Finance & Insurance (77.9%).
| Industry | Male | Female |
| Agriculture, Fishing & Hunting | 661 (77.0%) | 197 (23.0%) |
| Mining, Quarrying, & Extraction | 555 (94.2%) | 34 (5.8%) |
| Construction | 1,153 (93.7%) | 78 (6.3%) |
| Manufacturing | 337 (61.1%) | 215 (39.0%) |
| Wholesale Trade | 275 (86.5%) | 43 (13.5%) |
| Retail Trade | 910 (49.7%) | 921 (50.3%) |
| Transportation & Warehousing | 543 (77.5%) | 158 (22.5%) |
| Utilities | 181 (83.0%) | 37 (17.0%) |
| Information | 87 (43.7%) | 112 (56.3%) |
| Finance & Insurance | 46 (22.1%) | 162 (77.9%) |
| Real Estate, Rental & Leasing | 106 (50.2%) | 105 (49.8%) |
| Professional & Scientific | 352 (56.5%) | 271 (43.5%) |
| Enterprise Management | 0 (0.0%) | 16 (100.0%) |
| Administrative & Support | 284 (63.1%) | 166 (36.9%) |
| Educational Services | 828 (39.1%) | 1,291 (60.9%) |
| Health Care & Social Assistance | 543 (20.4%) | 2,116 (79.6%) |
| Arts, Entertainment & Recreation | 378 (52.7%) | 339 (47.3%) |
| Accommodation & Food Services | 708 (48.5%) | 751 (51.5%) |
| Public Administration | 676 (51.8%) | 629 (48.2%) |
| Total | 9,035 (52.3%) | 8,250 (47.7%) |
Education in Fremont County
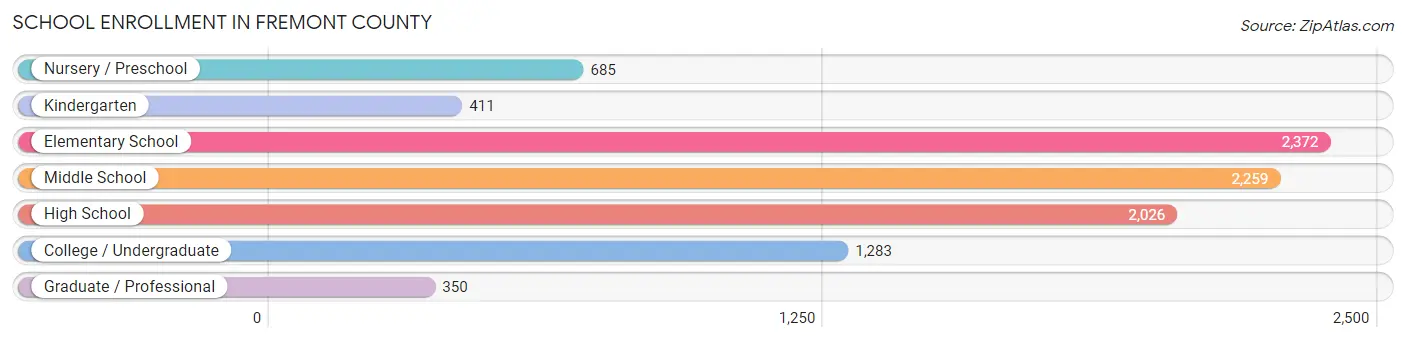
School Enrollment in Fremont County
The most common levels of schooling among the 9,386 students in Fremont County are elementary school (2,372 | 25.3%), middle school (2,259 | 24.1%), and high school (2,026 | 21.6%).
| School Level | # Students | % Students |
| Nursery / Preschool | 685 | 7.3% |
| Kindergarten | 411 | 4.4% |
| Elementary School | 2,372 | 25.3% |
| Middle School | 2,259 | 24.1% |
| High School | 2,026 | 21.6% |
| College / Undergraduate | 1,283 | 13.7% |
| Graduate / Professional | 350 | 3.7% |
| Total | 9,386 | 100.0% |
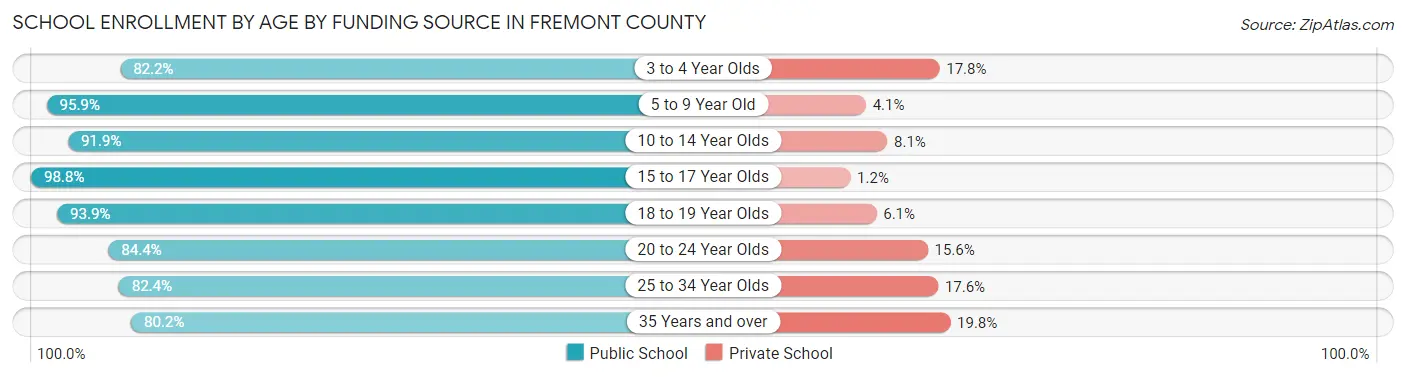
School Enrollment by Age by Funding Source in Fremont County
Out of a total of 9,386 students who are enrolled in schools in Fremont County, 723 (7.7%) attend a private institution, while the remaining 8,663 (92.3%) are enrolled in public schools. The age group of 35 years and over has the highest likelihood of being enrolled in private schools, with 119 (19.8% in the age bracket) enrolled. Conversely, the age group of 15 to 17 year olds has the lowest likelihood of being enrolled in a private school, with 1,393 (98.8% in the age bracket) attending a public institution.
| Age Bracket | Public School | Private School |
| 3 to 4 Year Olds | 420 (82.2%) | 91 (17.8%) |
| 5 to 9 Year Old | 2,571 (95.9%) | 110 (4.1%) |
| 10 to 14 Year Olds | 2,511 (91.9%) | 221 (8.1%) |
| 15 to 17 Year Olds | 1,393 (98.8%) | 17 (1.2%) |
| 18 to 19 Year Olds | 681 (93.9%) | 44 (6.1%) |
| 20 to 24 Year Olds | 378 (84.4%) | 70 (15.6%) |
| 25 to 34 Year Olds | 230 (82.4%) | 49 (17.6%) |
| 35 Years and over | 481 (80.2%) | 119 (19.8%) |
| Total | 8,663 (92.3%) | 723 (7.7%) |
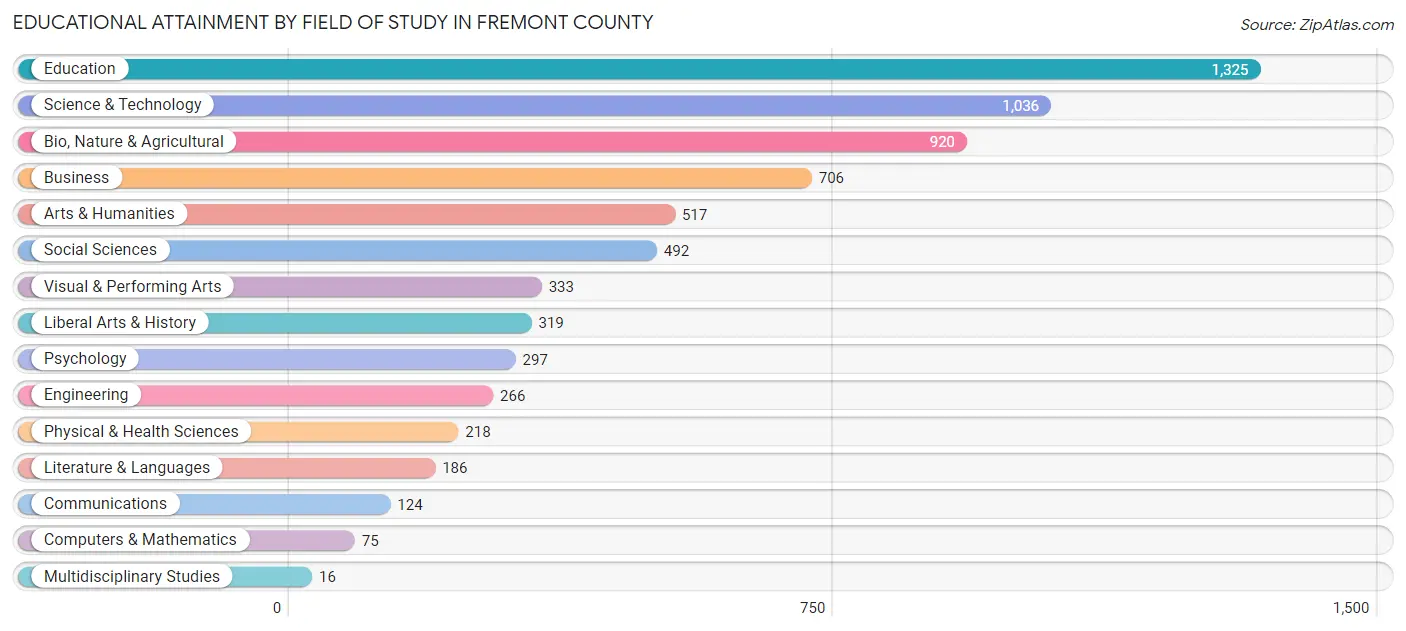
Educational Attainment by Field of Study in Fremont County
Education (1,325 | 19.4%), science & technology (1,036 | 15.2%), bio, nature & agricultural (920 | 13.5%), business (706 | 10.3%), and arts & humanities (517 | 7.6%) are the most common fields of study among 6,830 individuals in Fremont County who have obtained a bachelor's degree or higher.
| Field of Study | # Graduates | % Graduates |
| Computers & Mathematics | 75 | 1.1% |
| Bio, Nature & Agricultural | 920 | 13.5% |
| Physical & Health Sciences | 218 | 3.2% |
| Psychology | 297 | 4.3% |
| Social Sciences | 492 | 7.2% |
| Engineering | 266 | 3.9% |
| Multidisciplinary Studies | 16 | 0.2% |
| Science & Technology | 1,036 | 15.2% |
| Business | 706 | 10.3% |
| Education | 1,325 | 19.4% |
| Literature & Languages | 186 | 2.7% |
| Liberal Arts & History | 319 | 4.7% |
| Visual & Performing Arts | 333 | 4.9% |
| Communications | 124 | 1.8% |
| Arts & Humanities | 517 | 7.6% |
| Total | 6,830 | 100.0% |
Transportation & Commute in Fremont County
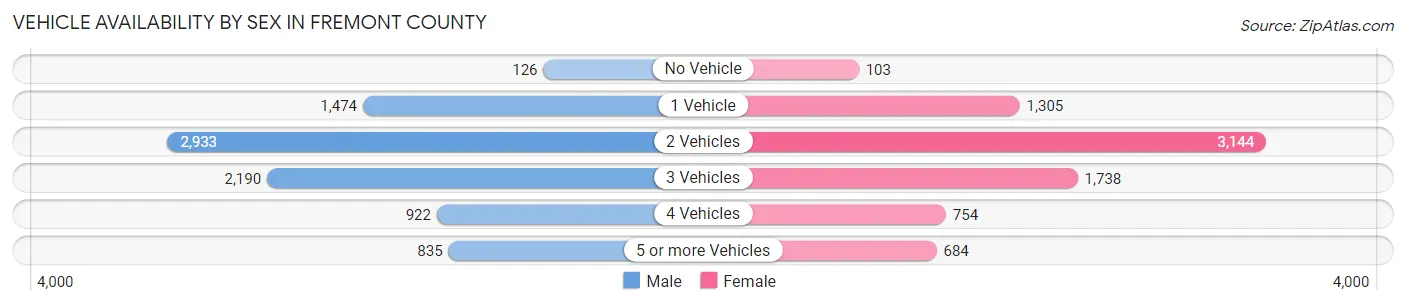
Vehicle Availability by Sex in Fremont County
The most prevalent vehicle ownership categories in Fremont County are males with 2 vehicles (2,933, accounting for 34.6%) and females with 2 vehicles (3,144, making up 38.0%).
| Vehicles Available | Male | Female |
| No Vehicle | 126 (1.5%) | 103 (1.3%) |
| 1 Vehicle | 1,474 (17.4%) | 1,305 (16.9%) |
| 2 Vehicles | 2,933 (34.6%) | 3,144 (40.7%) |
| 3 Vehicles | 2,190 (25.8%) | 1,738 (22.5%) |
| 4 Vehicles | 922 (10.9%) | 754 (9.8%) |
| 5 or more Vehicles | 835 (9.9%) | 684 (8.8%) |
| Total | 8,480 (100.0%) | 7,728 (100.0%) |
Commute Time in Fremont County
The most frequently occuring commute durations in Fremont County are 5 to 9 minutes (4,239 commuters, 28.5%), 10 to 14 minutes (2,741 commuters, 18.4%), and 15 to 19 minutes (1,868 commuters, 12.6%).
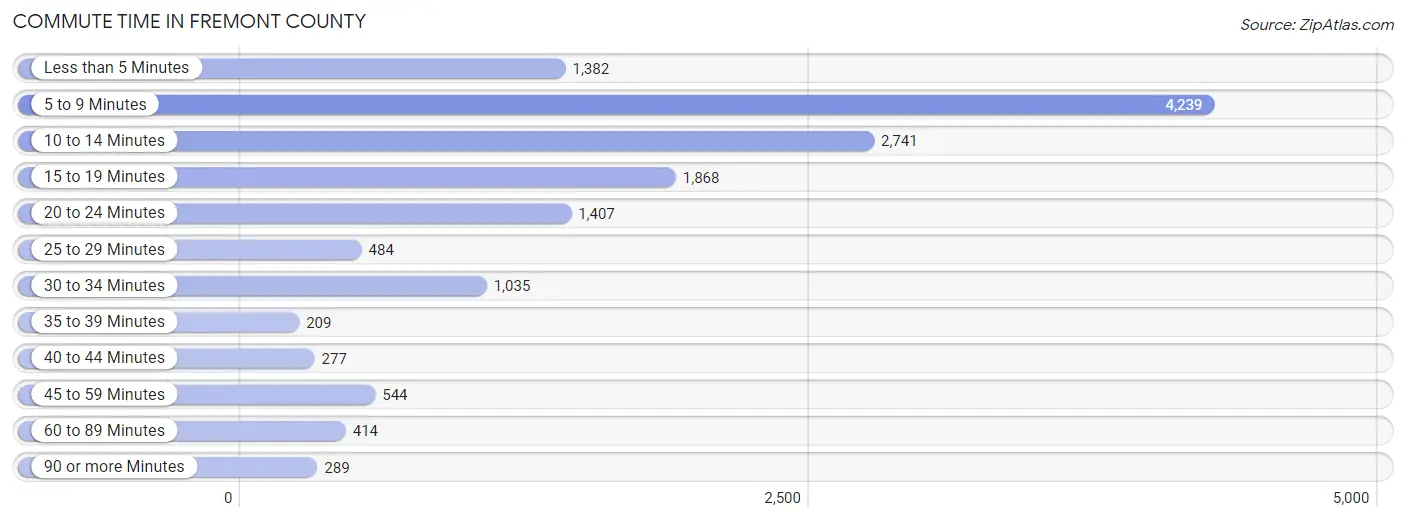
| Commute Time | # Commuters | % Commuters |
| Less than 5 Minutes | 1,382 | 9.3% |
| 5 to 9 Minutes | 4,239 | 28.5% |
| 10 to 14 Minutes | 2,741 | 18.4% |
| 15 to 19 Minutes | 1,868 | 12.6% |
| 20 to 24 Minutes | 1,407 | 9.5% |
| 25 to 29 Minutes | 484 | 3.3% |
| 30 to 34 Minutes | 1,035 | 7.0% |
| 35 to 39 Minutes | 209 | 1.4% |
| 40 to 44 Minutes | 277 | 1.9% |
| 45 to 59 Minutes | 544 | 3.6% |
| 60 to 89 Minutes | 414 | 2.8% |
| 90 or more Minutes | 289 | 1.9% |
Commute Time by Sex in Fremont County
The most common commute times in Fremont County are 5 to 9 minutes (2,150 commuters, 27.1%) for males and 5 to 9 minutes (2,089 commuters, 30.0%) for females.
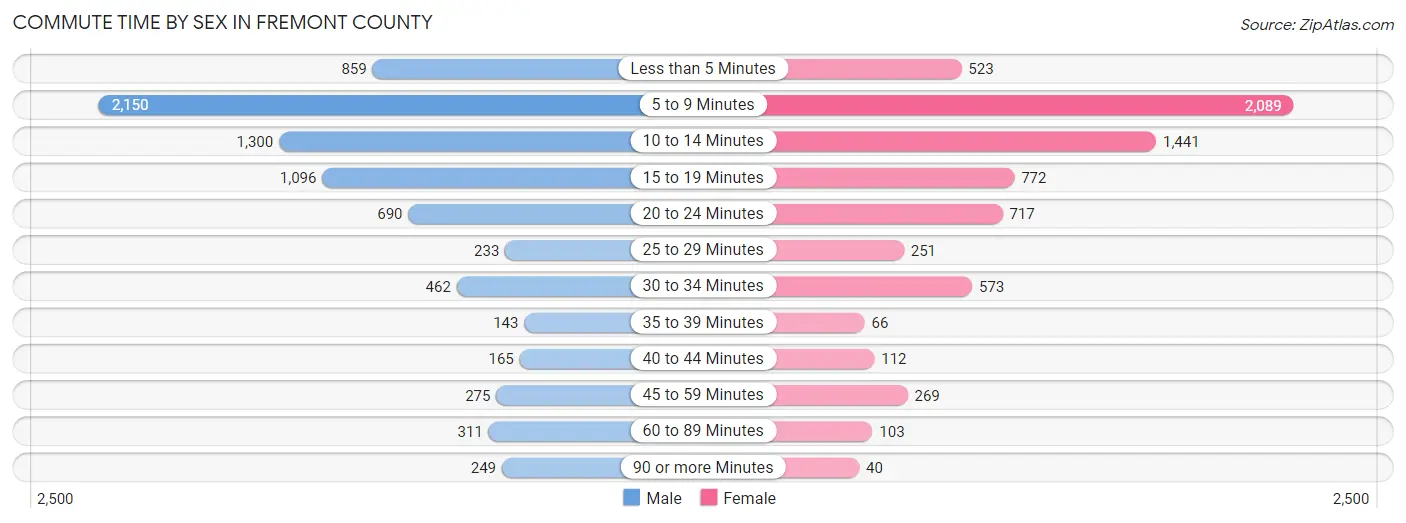
| Commute Time | Male | Female |
| Less than 5 Minutes | 859 (10.8%) | 523 (7.5%) |
| 5 to 9 Minutes | 2,150 (27.1%) | 2,089 (30.0%) |
| 10 to 14 Minutes | 1,300 (16.4%) | 1,441 (20.7%) |
| 15 to 19 Minutes | 1,096 (13.8%) | 772 (11.1%) |
| 20 to 24 Minutes | 690 (8.7%) | 717 (10.3%) |
| 25 to 29 Minutes | 233 (2.9%) | 251 (3.6%) |
| 30 to 34 Minutes | 462 (5.8%) | 573 (8.2%) |
| 35 to 39 Minutes | 143 (1.8%) | 66 (0.9%) |
| 40 to 44 Minutes | 165 (2.1%) | 112 (1.6%) |
| 45 to 59 Minutes | 275 (3.5%) | 269 (3.9%) |
| 60 to 89 Minutes | 311 (3.9%) | 103 (1.5%) |
| 90 or more Minutes | 249 (3.1%) | 40 (0.6%) |
Time of Departure to Work by Sex in Fremont County
The most frequent times of departure to work in Fremont County are 7:00 AM to 7:29 AM (1,255, 15.8%) for males and 7:30 AM to 7:59 AM (1,608, 23.1%) for females.
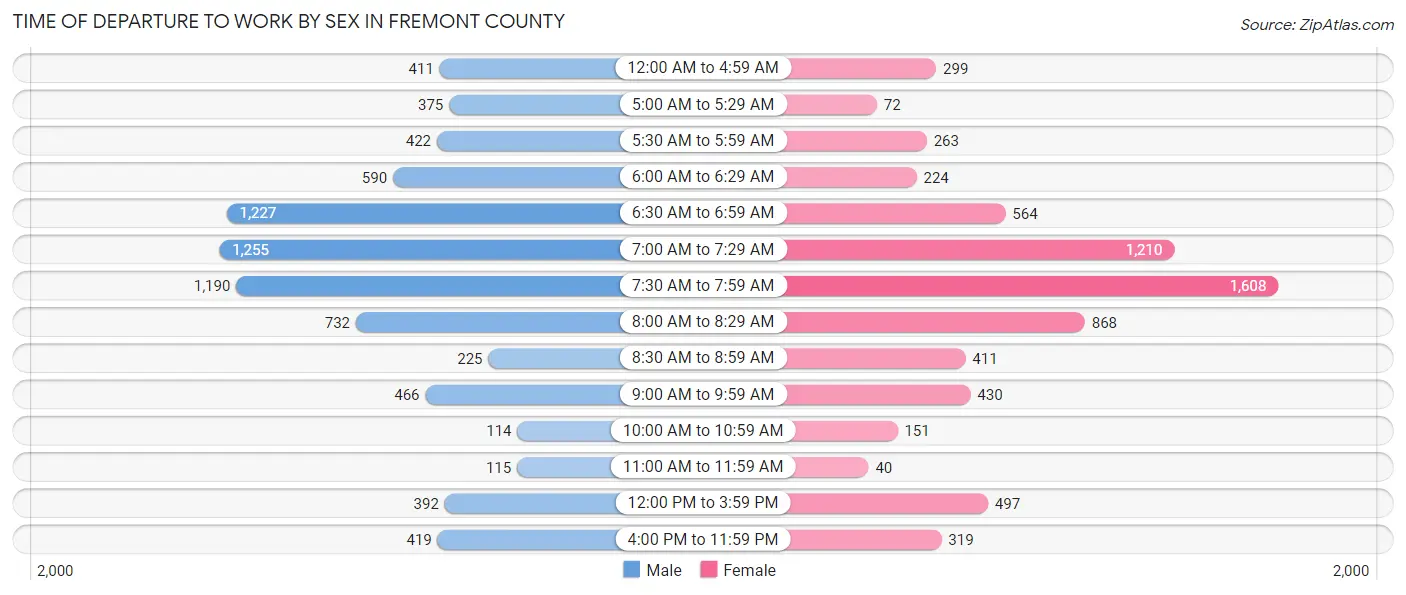
| Time of Departure | Male | Female |
| 12:00 AM to 4:59 AM | 411 (5.2%) | 299 (4.3%) |
| 5:00 AM to 5:29 AM | 375 (4.7%) | 72 (1.0%) |
| 5:30 AM to 5:59 AM | 422 (5.3%) | 263 (3.8%) |
| 6:00 AM to 6:29 AM | 590 (7.4%) | 224 (3.2%) |
| 6:30 AM to 6:59 AM | 1,227 (15.5%) | 564 (8.1%) |
| 7:00 AM to 7:29 AM | 1,255 (15.8%) | 1,210 (17.4%) |
| 7:30 AM to 7:59 AM | 1,190 (15.0%) | 1,608 (23.1%) |
| 8:00 AM to 8:29 AM | 732 (9.2%) | 868 (12.5%) |
| 8:30 AM to 8:59 AM | 225 (2.8%) | 411 (5.9%) |
| 9:00 AM to 9:59 AM | 466 (5.9%) | 430 (6.2%) |
| 10:00 AM to 10:59 AM | 114 (1.4%) | 151 (2.2%) |
| 11:00 AM to 11:59 AM | 115 (1.5%) | 40 (0.6%) |
| 12:00 PM to 3:59 PM | 392 (4.9%) | 497 (7.1%) |
| 4:00 PM to 11:59 PM | 419 (5.3%) | 319 (4.6%) |
| Total | 7,933 (100.0%) | 6,956 (100.0%) |
Housing Occupancy in Fremont County
Occupancy by Ownership in Fremont County
Of the total 14,617 dwellings in Fremont County, owner-occupied units account for 10,333 (70.7%), while renter-occupied units make up 4,284 (29.3%).
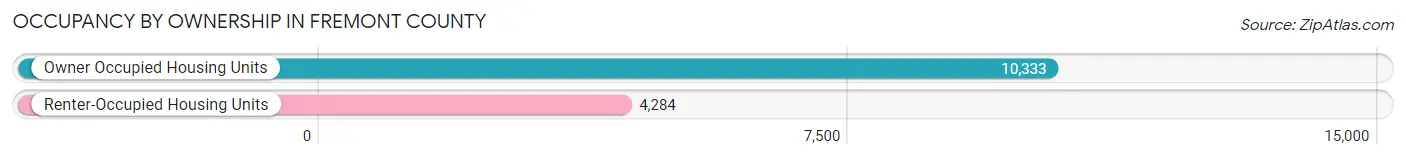
| Occupancy | # Housing Units | % Housing Units |
| Owner Occupied Housing Units | 10,333 | 70.7% |
| Renter-Occupied Housing Units | 4,284 | 29.3% |
| Total Occupied Housing Units | 14,617 | 100.0% |
Occupancy by Household Size in Fremont County
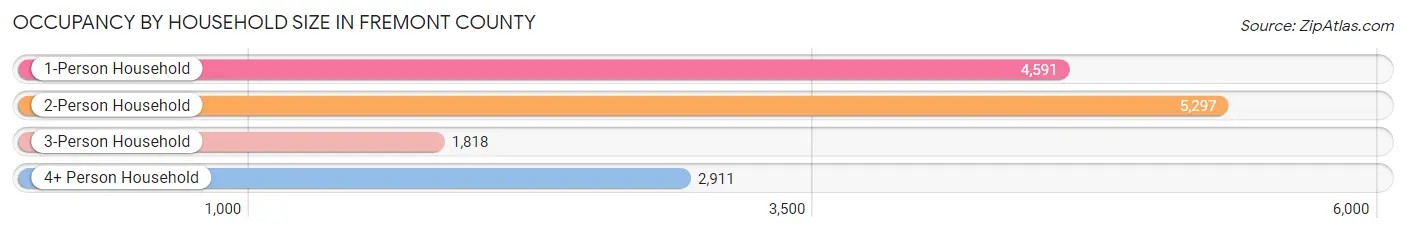
| Household Size | # Housing Units | % Housing Units |
| 1-Person Household | 4,591 | 31.4% |
| 2-Person Household | 5,297 | 36.2% |
| 3-Person Household | 1,818 | 12.4% |
| 4+ Person Household | 2,911 | 19.9% |
| Total Housing Units | 14,617 | 100.0% |
Occupancy by Ownership by Household Size in Fremont County
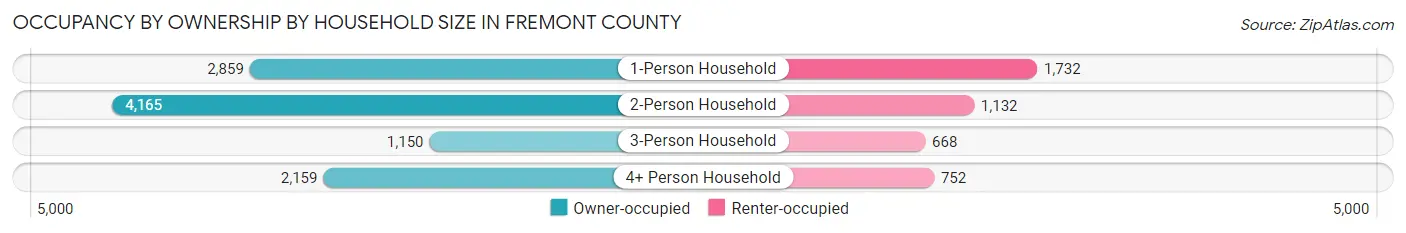
| Household Size | Owner-occupied | Renter-occupied |
| 1-Person Household | 2,859 (62.3%) | 1,732 (37.7%) |
| 2-Person Household | 4,165 (78.6%) | 1,132 (21.4%) |
| 3-Person Household | 1,150 (63.3%) | 668 (36.7%) |
| 4+ Person Household | 2,159 (74.2%) | 752 (25.8%) |
| Total Housing Units | 10,333 (70.7%) | 4,284 (29.3%) |
Occupancy by Educational Attainment in Fremont County
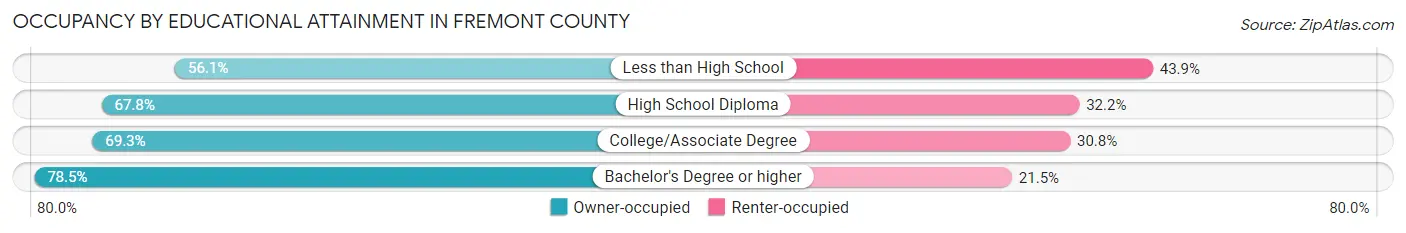
| Household Size | Owner-occupied | Renter-occupied |
| Less than High School | 485 (56.1%) | 379 (43.9%) |
| High School Diploma | 2,616 (67.8%) | 1,243 (32.2%) |
| College/Associate Degree | 3,996 (69.3%) | 1,774 (30.7%) |
| Bachelor's Degree or higher | 3,236 (78.5%) | 888 (21.5%) |
Occupancy by Age of Householder in Fremont County
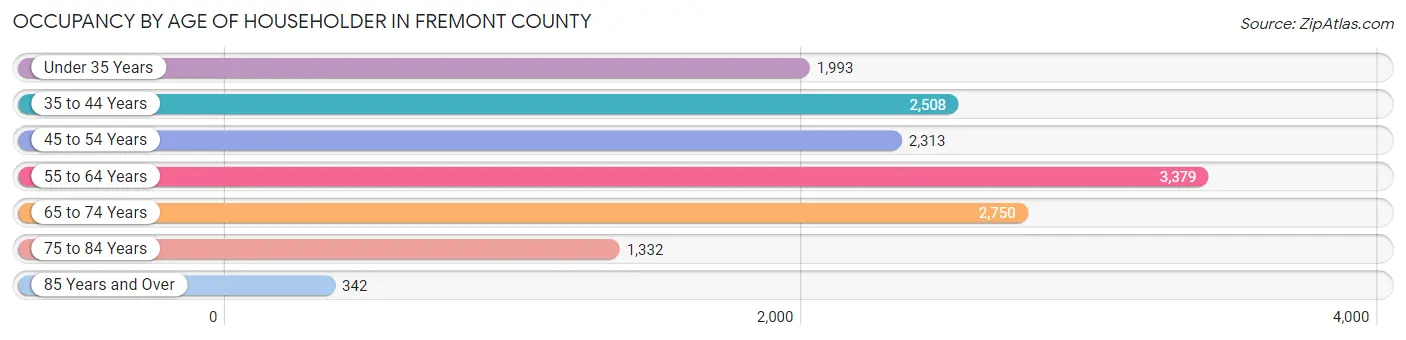
| Age Bracket | # Households | % Households |
| Under 35 Years | 1,993 | 13.6% |
| 35 to 44 Years | 2,508 | 17.2% |
| 45 to 54 Years | 2,313 | 15.8% |
| 55 to 64 Years | 3,379 | 23.1% |
| 65 to 74 Years | 2,750 | 18.8% |
| 75 to 84 Years | 1,332 | 9.1% |
| 85 Years and Over | 342 | 2.3% |
| Total | 14,617 | 100.0% |
Housing Finances in Fremont County
Median Income by Occupancy in Fremont County
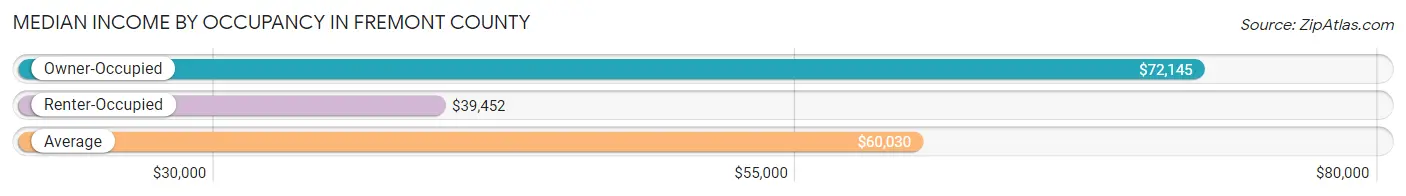
| Occupancy Type | # Households | Median Income |
| Owner-Occupied | 10,333 (70.7%) | $72,145 |
| Renter-Occupied | 4,284 (29.3%) | $39,452 |
| Average | 14,617 (100.0%) | $60,030 |
Occupancy by Householder Income Bracket in Fremont County
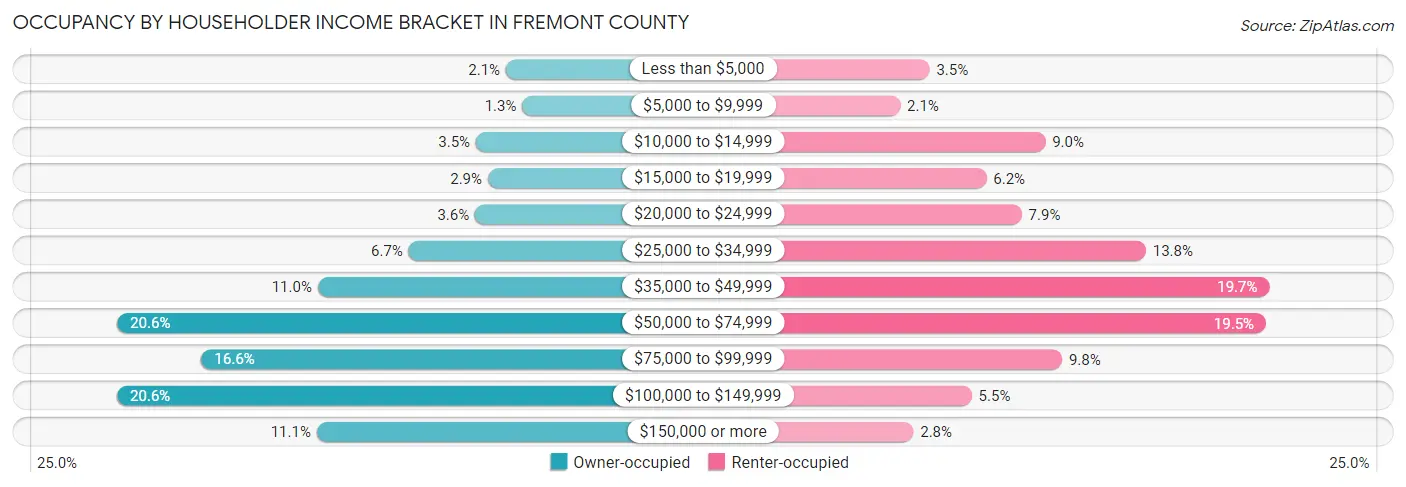
| Income Bracket | Owner-occupied | Renter-occupied |
| Less than $5,000 | 215 (2.1%) | 151 (3.5%) |
| $5,000 to $9,999 | 134 (1.3%) | 91 (2.1%) |
| $10,000 to $14,999 | 363 (3.5%) | 387 (9.0%) |
| $15,000 to $19,999 | 304 (2.9%) | 267 (6.2%) |
| $20,000 to $24,999 | 367 (3.5%) | 339 (7.9%) |
| $25,000 to $34,999 | 693 (6.7%) | 592 (13.8%) |
| $35,000 to $49,999 | 1,141 (11.0%) | 844 (19.7%) |
| $50,000 to $74,999 | 2,128 (20.6%) | 837 (19.5%) |
| $75,000 to $99,999 | 1,713 (16.6%) | 421 (9.8%) |
| $100,000 to $149,999 | 2,129 (20.6%) | 237 (5.5%) |
| $150,000 or more | 1,146 (11.1%) | 118 (2.8%) |
| Total | 10,333 (100.0%) | 4,284 (100.0%) |
Monthly Housing Cost Tiers in Fremont County
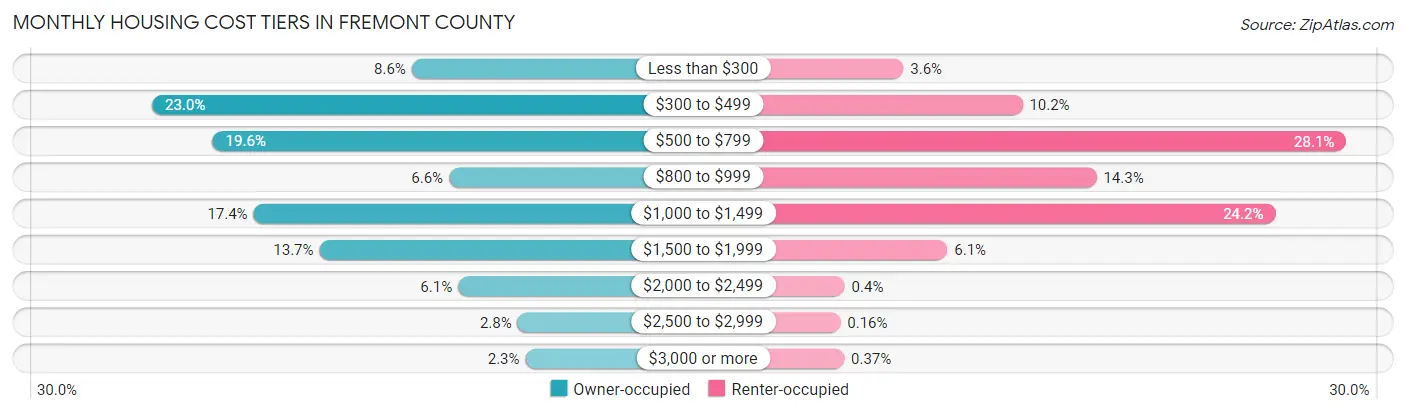
| Monthly Cost | Owner-occupied | Renter-occupied |
| Less than $300 | 891 (8.6%) | 156 (3.6%) |
| $300 to $499 | 2,372 (23.0%) | 438 (10.2%) |
| $500 to $799 | 2,026 (19.6%) | 1,204 (28.1%) |
| $800 to $999 | 678 (6.6%) | 613 (14.3%) |
| $1,000 to $1,499 | 1,794 (17.4%) | 1,036 (24.2%) |
| $1,500 to $1,999 | 1,418 (13.7%) | 260 (6.1%) |
| $2,000 to $2,499 | 626 (6.1%) | 17 (0.4%) |
| $2,500 to $2,999 | 286 (2.8%) | 7 (0.2%) |
| $3,000 or more | 242 (2.3%) | 16 (0.4%) |
| Total | 10,333 (100.0%) | 4,284 (100.0%) |
Physical Housing Characteristics in Fremont County
Housing Structures in Fremont County
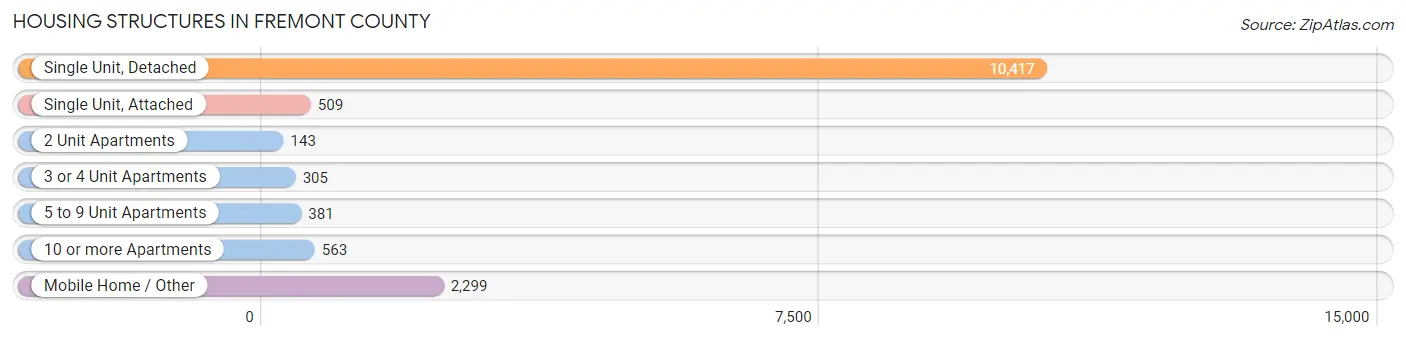
| Structure Type | # Housing Units | % Housing Units |
| Single Unit, Detached | 10,417 | 71.3% |
| Single Unit, Attached | 509 | 3.5% |
| 2 Unit Apartments | 143 | 1.0% |
| 3 or 4 Unit Apartments | 305 | 2.1% |
| 5 to 9 Unit Apartments | 381 | 2.6% |
| 10 or more Apartments | 563 | 3.8% |
| Mobile Home / Other | 2,299 | 15.7% |
| Total | 14,617 | 100.0% |
Housing Structures by Occupancy in Fremont County
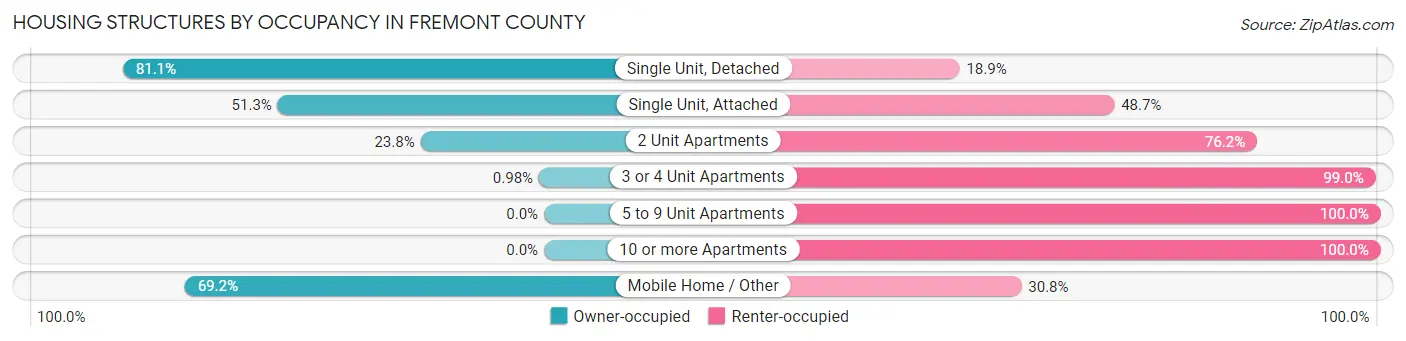
| Structure Type | Owner-occupied | Renter-occupied |
| Single Unit, Detached | 8,445 (81.1%) | 1,972 (18.9%) |
| Single Unit, Attached | 261 (51.3%) | 248 (48.7%) |
| 2 Unit Apartments | 34 (23.8%) | 109 (76.2%) |
| 3 or 4 Unit Apartments | 3 (1.0%) | 302 (99.0%) |
| 5 to 9 Unit Apartments | 0 (0.0%) | 381 (100.0%) |
| 10 or more Apartments | 0 (0.0%) | 563 (100.0%) |
| Mobile Home / Other | 1,590 (69.2%) | 709 (30.8%) |
| Total | 10,333 (70.7%) | 4,284 (29.3%) |
Housing Structures by Number of Rooms in Fremont County
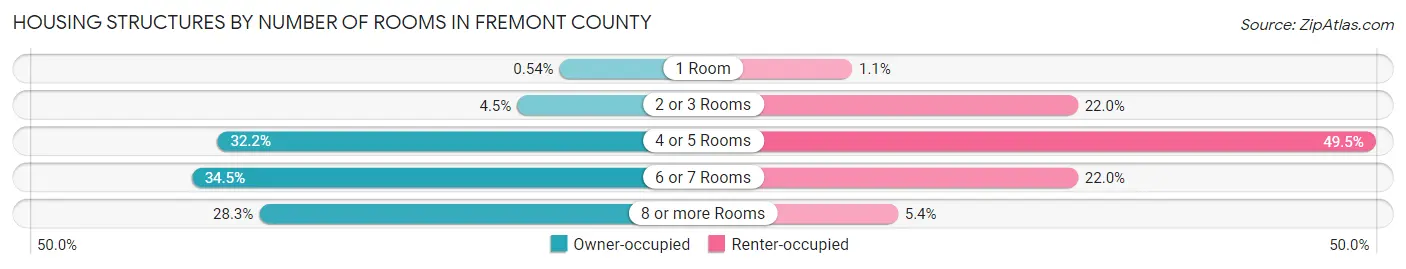
| Number of Rooms | Owner-occupied | Renter-occupied |
| 1 Room | 56 (0.5%) | 48 (1.1%) |
| 2 or 3 Rooms | 460 (4.4%) | 942 (22.0%) |
| 4 or 5 Rooms | 3,323 (32.2%) | 2,122 (49.5%) |
| 6 or 7 Rooms | 3,569 (34.5%) | 943 (22.0%) |
| 8 or more Rooms | 2,925 (28.3%) | 229 (5.3%) |
| Total | 10,333 (100.0%) | 4,284 (100.0%) |
Housing Structure by Heating Type in Fremont County
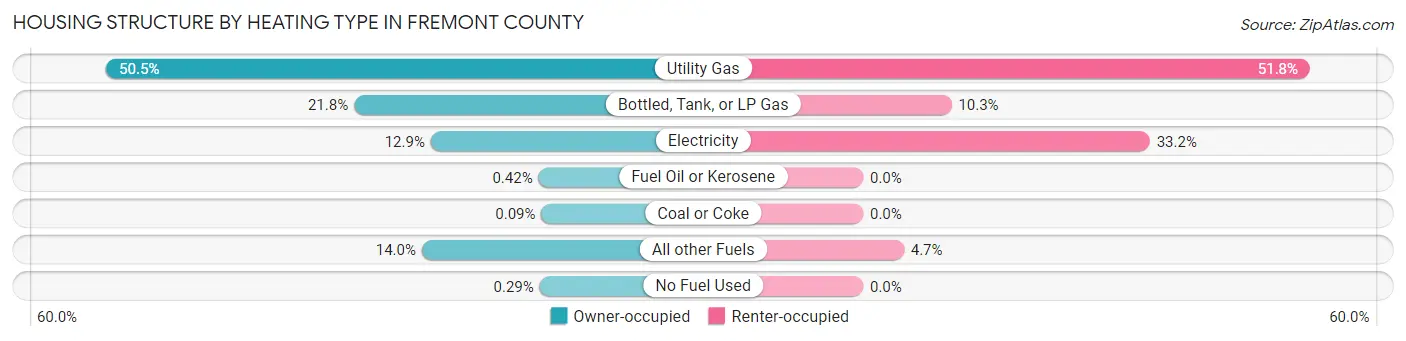
| Heating Type | Owner-occupied | Renter-occupied |
| Utility Gas | 5,222 (50.5%) | 2,219 (51.8%) |
| Bottled, Tank, or LP Gas | 2,254 (21.8%) | 439 (10.2%) |
| Electricity | 1,334 (12.9%) | 1,424 (33.2%) |
| Fuel Oil or Kerosene | 43 (0.4%) | 0 (0.0%) |
| Coal or Coke | 9 (0.1%) | 0 (0.0%) |
| All other Fuels | 1,441 (14.0%) | 202 (4.7%) |
| No Fuel Used | 30 (0.3%) | 0 (0.0%) |
| Total | 10,333 (100.0%) | 4,284 (100.0%) |
Household Vehicle Usage in Fremont County
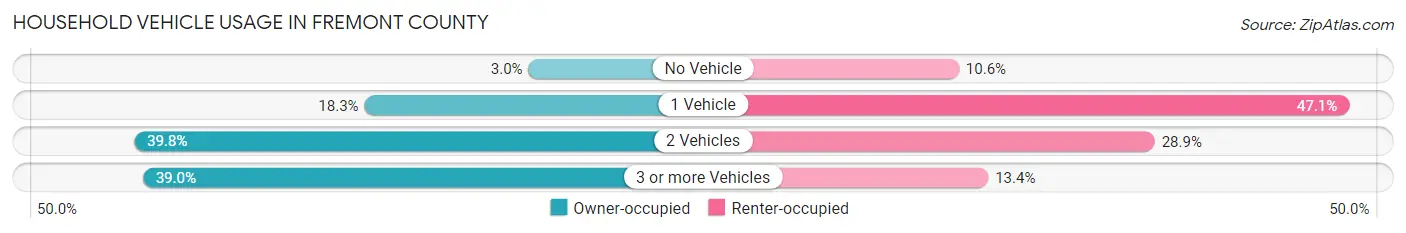
| Vehicles per Household | Owner-occupied | Renter-occupied |
| No Vehicle | 307 (3.0%) | 456 (10.6%) |
| 1 Vehicle | 1,889 (18.3%) | 2,016 (47.1%) |
| 2 Vehicles | 4,110 (39.8%) | 1,239 (28.9%) |
| 3 or more Vehicles | 4,027 (39.0%) | 573 (13.4%) |
| Total | 10,333 (100.0%) | 4,284 (100.0%) |
Real Estate & Mortgages in Fremont County
Real Estate and Mortgage Overview in Fremont County
| Characteristic | Without Mortgage | With Mortgage |
| Housing Units | 5,419 | 4,914 |
| Median Property Value | $213,400 | $261,600 |
| Median Household Income | $59,802 | $641 |
| Monthly Housing Costs | $456 | $235 |
| Real Estate Taxes | $1,429 | $203 |
Property Value by Mortgage Status in Fremont County
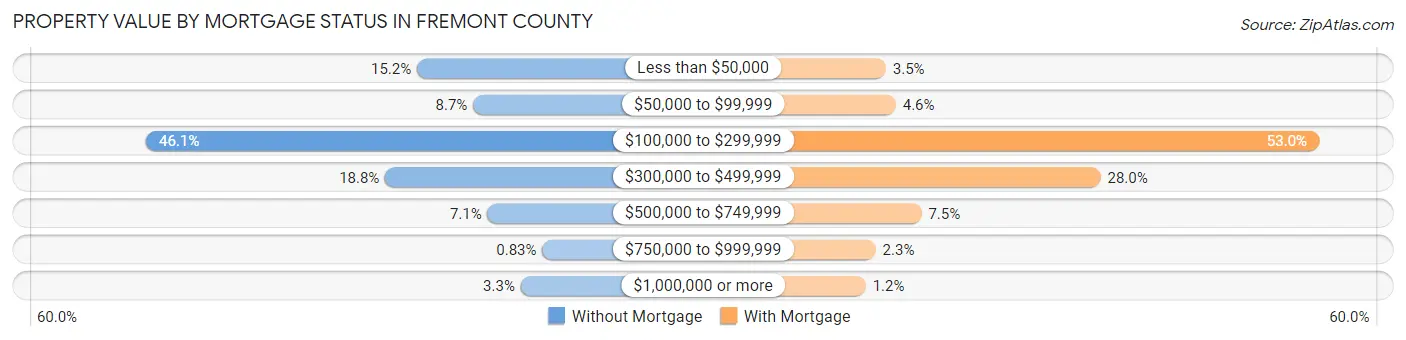
| Property Value | Without Mortgage | With Mortgage |
| Less than $50,000 | 821 (15.1%) | 170 (3.5%) |
| $50,000 to $99,999 | 473 (8.7%) | 226 (4.6%) |
| $100,000 to $299,999 | 2,499 (46.1%) | 2,602 (52.9%) |
| $300,000 to $499,999 | 1,018 (18.8%) | 1,376 (28.0%) |
| $500,000 to $749,999 | 384 (7.1%) | 370 (7.5%) |
| $750,000 to $999,999 | 45 (0.8%) | 113 (2.3%) |
| $1,000,000 or more | 179 (3.3%) | 57 (1.2%) |
| Total | 5,419 (100.0%) | 4,914 (100.0%) |
Household Income by Mortgage Status in Fremont County
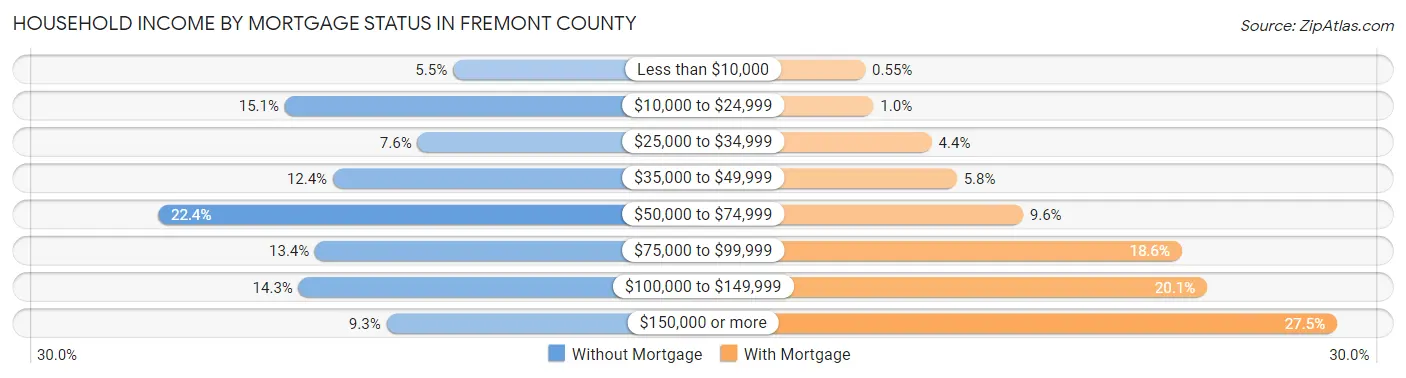
| Household Income | Without Mortgage | With Mortgage |
| Less than $10,000 | 299 (5.5%) | 27 (0.5%) |
| $10,000 to $24,999 | 820 (15.1%) | 50 (1.0%) |
| $25,000 to $34,999 | 409 (7.5%) | 214 (4.3%) |
| $35,000 to $49,999 | 671 (12.4%) | 284 (5.8%) |
| $50,000 to $74,999 | 1,212 (22.4%) | 470 (9.6%) |
| $75,000 to $99,999 | 726 (13.4%) | 916 (18.6%) |
| $100,000 to $149,999 | 777 (14.3%) | 987 (20.1%) |
| $150,000 or more | 505 (9.3%) | 1,352 (27.5%) |
| Total | 5,419 (100.0%) | 4,914 (100.0%) |
Property Value to Household Income Ratio in Fremont County
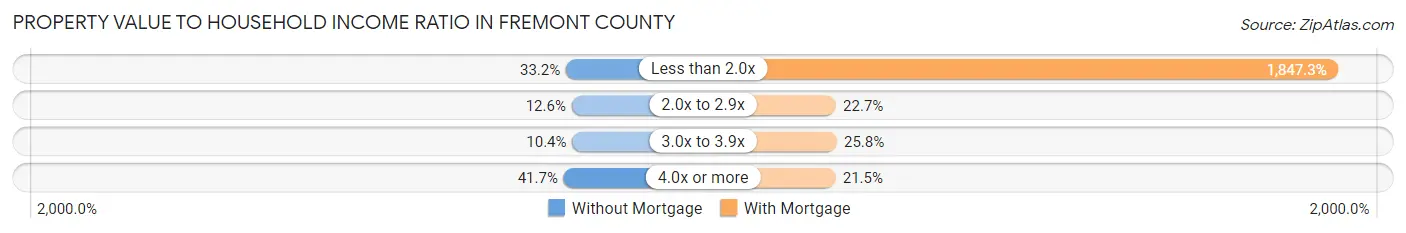
| Value-to-Income Ratio | Without Mortgage | With Mortgage |
| Less than 2.0x | 1,800 (33.2%) | 90,778 (1,847.3%) |
| 2.0x to 2.9x | 685 (12.6%) | 1,113 (22.7%) |
| 3.0x to 3.9x | 566 (10.4%) | 1,267 (25.8%) |
| 4.0x or more | 2,259 (41.7%) | 1,055 (21.5%) |
| Total | 5,419 (100.0%) | 4,914 (100.0%) |
Real Estate Taxes by Mortgage Status in Fremont County
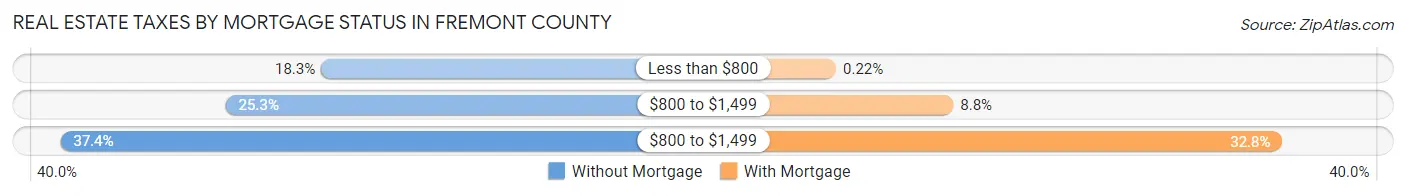
| Property Taxes | Without Mortgage | With Mortgage |
| Less than $800 | 994 (18.3%) | 11 (0.2%) |
| $800 to $1,499 | 1,372 (25.3%) | 432 (8.8%) |
| $800 to $1,499 | 2,026 (37.4%) | 1,613 (32.8%) |
| Total | 5,419 (100.0%) | 4,914 (100.0%) |
Health & Disability in Fremont County
Health Insurance Coverage by Age in Fremont County
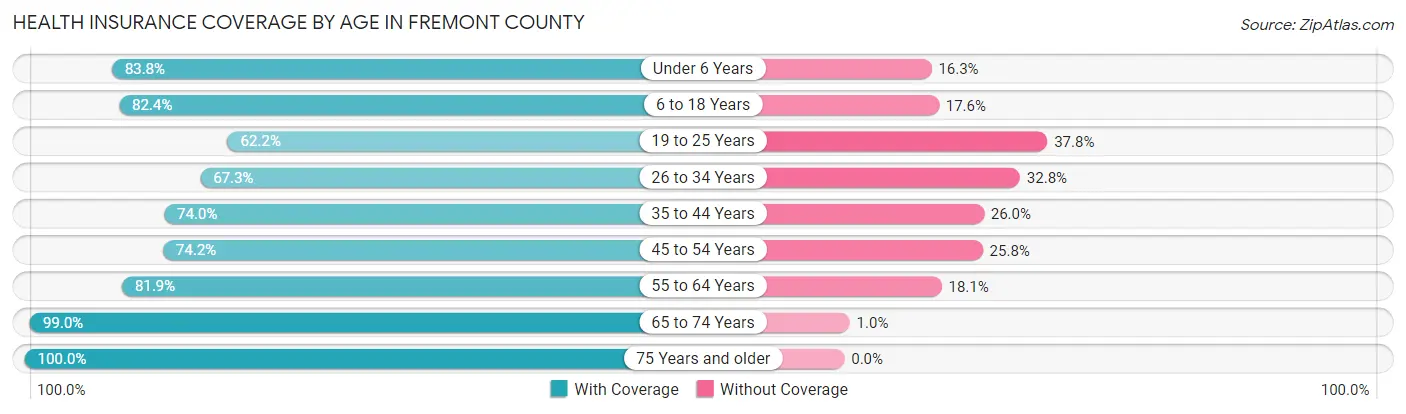
| Age Bracket | With Coverage | Without Coverage |
| Under 6 Years | 2,355 (83.8%) | 457 (16.3%) |
| 6 to 18 Years | 6,227 (82.4%) | 1,332 (17.6%) |
| 19 to 25 Years | 1,894 (62.2%) | 1,153 (37.8%) |
| 26 to 34 Years | 2,684 (67.2%) | 1,307 (32.8%) |
| 35 to 44 Years | 3,363 (74.0%) | 1,182 (26.0%) |
| 45 to 54 Years | 3,155 (74.2%) | 1,097 (25.8%) |
| 55 to 64 Years | 4,302 (81.9%) | 953 (18.1%) |
| 65 to 74 Years | 4,540 (99.0%) | 46 (1.0%) |
| 75 Years and older | 2,753 (100.0%) | 0 (0.0%) |
| Total | 31,273 (80.6%) | 7,527 (19.4%) |
Health Insurance Coverage by Citizenship Status in Fremont County
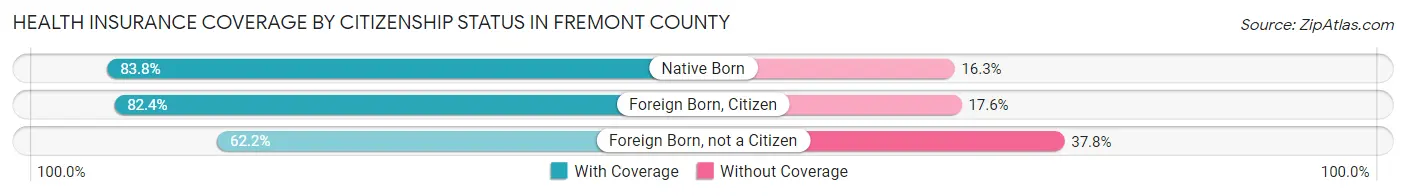
| Citizenship Status | With Coverage | Without Coverage |
| Native Born | 2,355 (83.8%) | 457 (16.3%) |
| Foreign Born, Citizen | 6,227 (82.4%) | 1,332 (17.6%) |
| Foreign Born, not a Citizen | 1,894 (62.2%) | 1,153 (37.8%) |
Health Insurance Coverage by Household Income in Fremont County
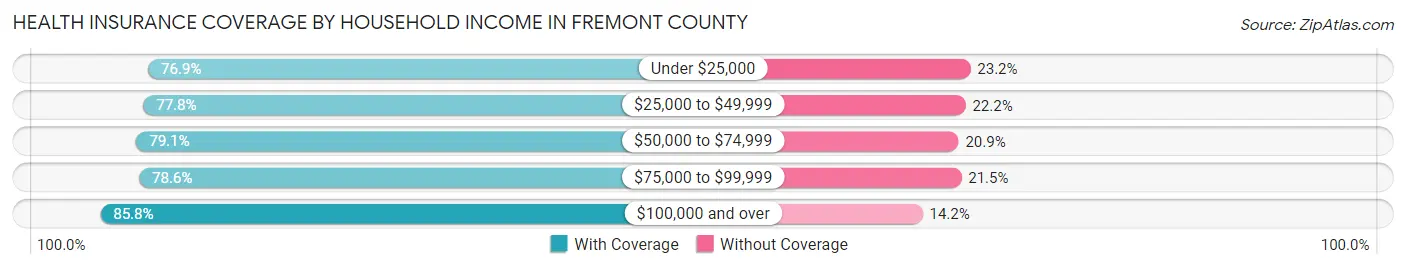
| Household Income | With Coverage | Without Coverage |
| Under $25,000 | 3,576 (76.8%) | 1,077 (23.2%) |
| $25,000 to $49,999 | 5,528 (77.8%) | 1,581 (22.2%) |
| $50,000 to $74,999 | 6,476 (79.1%) | 1,714 (20.9%) |
| $75,000 to $99,999 | 4,917 (78.5%) | 1,343 (21.4%) |
| $100,000 and over | 10,544 (85.8%) | 1,743 (14.2%) |
Public vs Private Health Insurance Coverage by Age in Fremont County
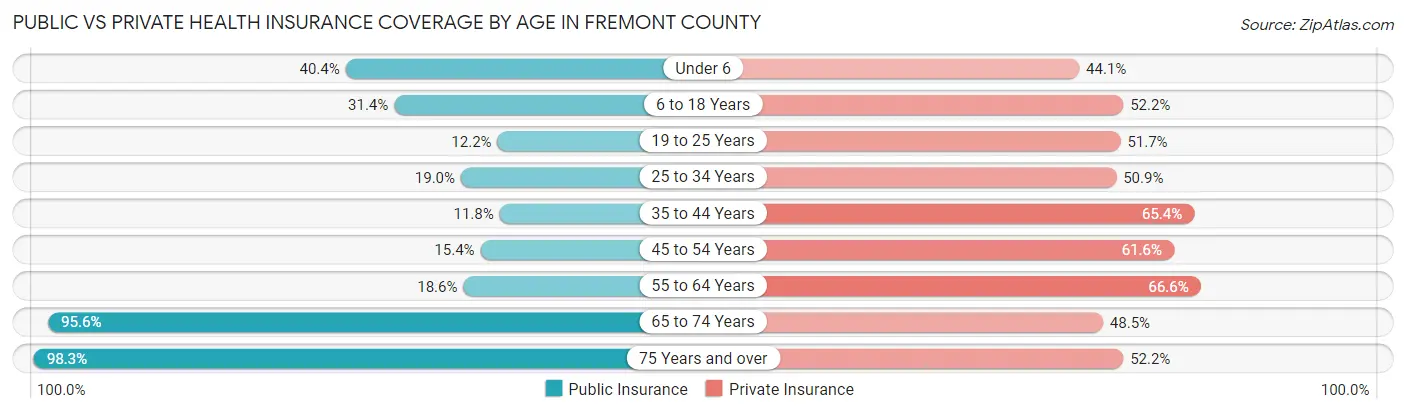
| Age Bracket | Public Insurance | Private Insurance |
| Under 6 | 1,137 (40.4%) | 1,239 (44.1%) |
| 6 to 18 Years | 2,374 (31.4%) | 3,948 (52.2%) |
| 19 to 25 Years | 373 (12.2%) | 1,576 (51.7%) |
| 25 to 34 Years | 759 (19.0%) | 2,033 (50.9%) |
| 35 to 44 Years | 538 (11.8%) | 2,971 (65.4%) |
| 45 to 54 Years | 655 (15.4%) | 2,620 (61.6%) |
| 55 to 64 Years | 976 (18.6%) | 3,499 (66.6%) |
| 65 to 74 Years | 4,385 (95.6%) | 2,223 (48.5%) |
| 75 Years and over | 2,706 (98.3%) | 1,438 (52.2%) |
| Total | 13,903 (35.8%) | 21,547 (55.5%) |
Disability Status by Sex by Age in Fremont County
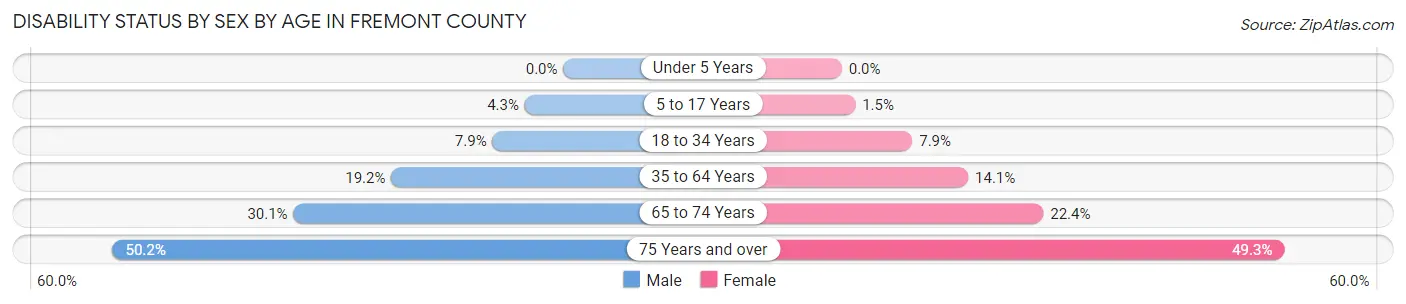
| Age Bracket | Male | Female |
| Under 5 Years | 0 (0.0%) | 0 (0.0%) |
| 5 to 17 Years | 162 (4.3%) | 53 (1.5%) |
| 18 to 34 Years | 311 (7.9%) | 290 (7.9%) |
| 35 to 64 Years | 1,350 (19.2%) | 986 (14.1%) |
| 65 to 74 Years | 682 (30.1%) | 520 (22.4%) |
| 75 Years and over | 625 (50.2%) | 743 (49.3%) |
Disability Class by Sex by Age in Fremont County
Disability Class: Hearing Difficulty
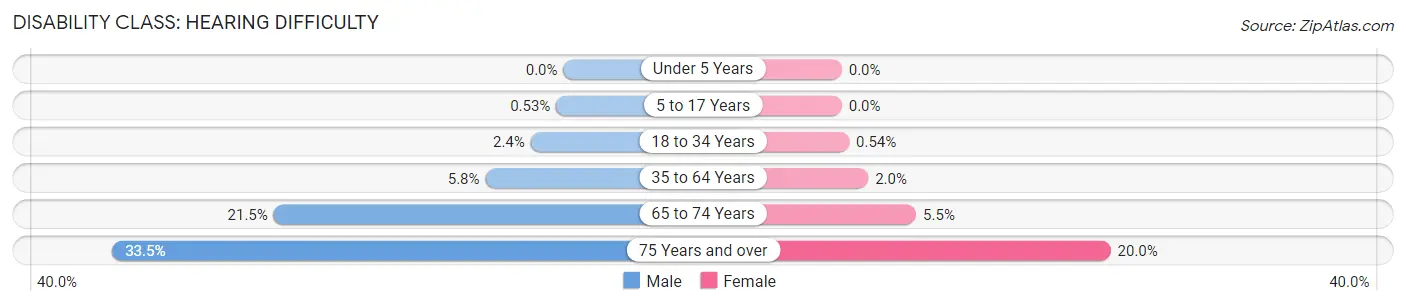
| Age Bracket | Male | Female |
| Under 5 Years | 0 (0.0%) | 0 (0.0%) |
| 5 to 17 Years | 20 (0.5%) | 0 (0.0%) |
| 18 to 34 Years | 96 (2.4%) | 20 (0.5%) |
| 35 to 64 Years | 408 (5.8%) | 137 (2.0%) |
| 65 to 74 Years | 488 (21.5%) | 128 (5.5%) |
| 75 Years and over | 417 (33.5%) | 301 (20.0%) |
Disability Class: Vision Difficulty
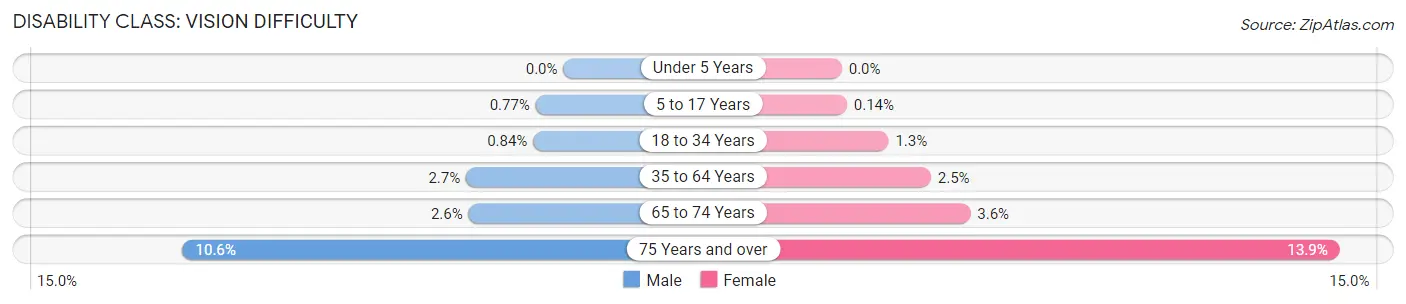
| Age Bracket | Male | Female |
| Under 5 Years | 0 (0.0%) | 0 (0.0%) |
| 5 to 17 Years | 29 (0.8%) | 5 (0.1%) |
| 18 to 34 Years | 33 (0.8%) | 48 (1.3%) |
| 35 to 64 Years | 191 (2.7%) | 174 (2.5%) |
| 65 to 74 Years | 60 (2.6%) | 83 (3.6%) |
| 75 Years and over | 132 (10.6%) | 209 (13.9%) |
Disability Class: Cognitive Difficulty
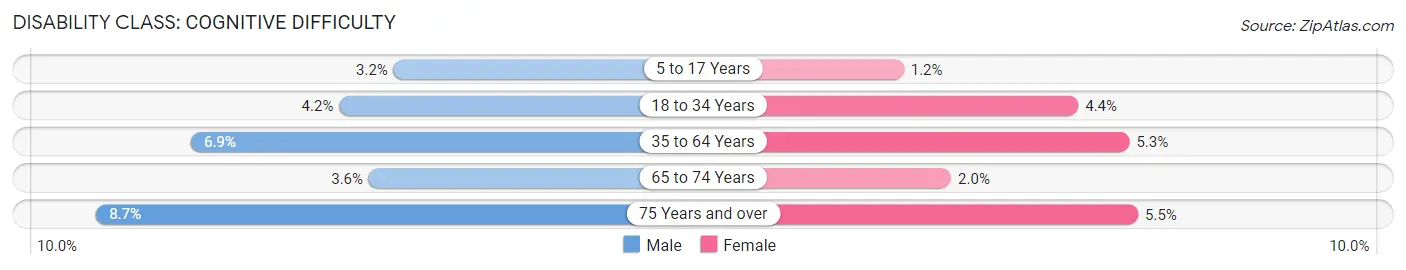
| Age Bracket | Male | Female |
| 5 to 17 Years | 119 (3.2%) | 41 (1.1%) |
| 18 to 34 Years | 164 (4.2%) | 162 (4.4%) |
| 35 to 64 Years | 487 (6.9%) | 374 (5.3%) |
| 65 to 74 Years | 82 (3.6%) | 47 (2.0%) |
| 75 Years and over | 108 (8.7%) | 83 (5.5%) |
Disability Class: Ambulatory Difficulty
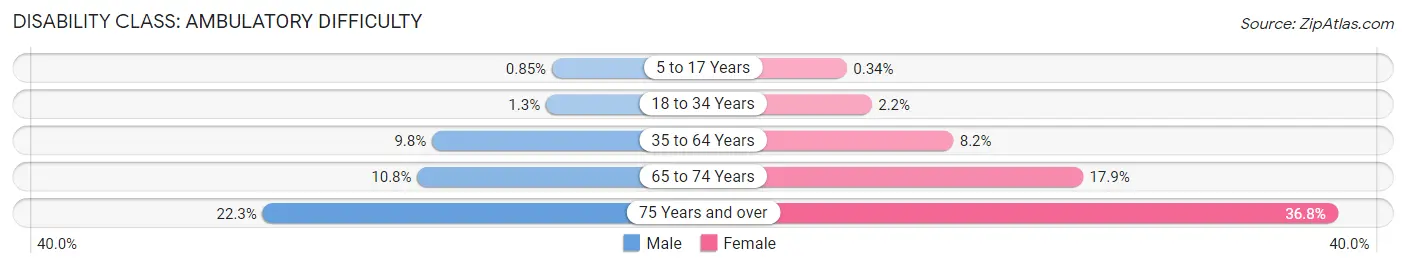
| Age Bracket | Male | Female |
| 5 to 17 Years | 32 (0.9%) | 12 (0.3%) |
| 18 to 34 Years | 51 (1.3%) | 81 (2.2%) |
| 35 to 64 Years | 687 (9.8%) | 577 (8.2%) |
| 65 to 74 Years | 246 (10.8%) | 414 (17.9%) |
| 75 Years and over | 278 (22.3%) | 555 (36.8%) |
Disability Class: Self-Care Difficulty
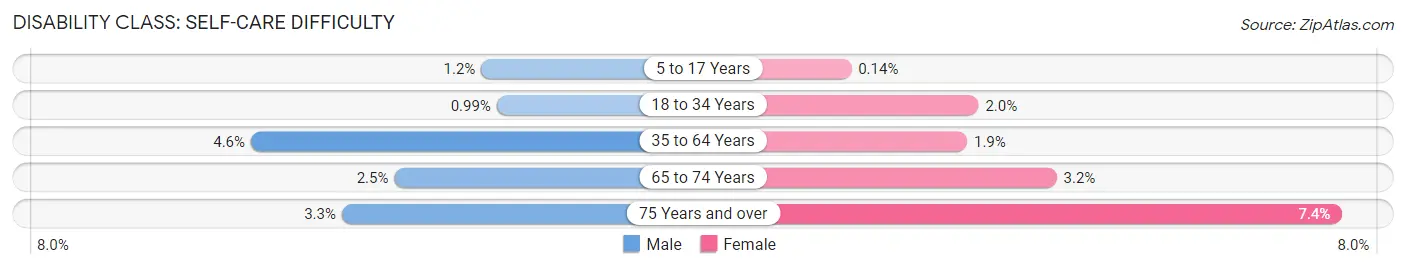
| Age Bracket | Male | Female |
| 5 to 17 Years | 46 (1.2%) | 5 (0.1%) |
| 18 to 34 Years | 39 (1.0%) | 75 (2.0%) |
| 35 to 64 Years | 327 (4.6%) | 130 (1.9%) |
| 65 to 74 Years | 57 (2.5%) | 74 (3.2%) |
| 75 Years and over | 41 (3.3%) | 112 (7.4%) |
Technology Access in Fremont County
Computing Device Access in Fremont County
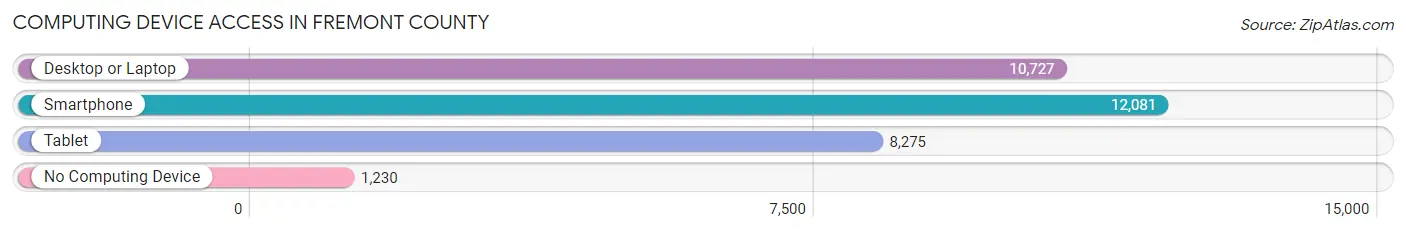
| Device Type | # Households | % Households |
| Desktop or Laptop | 10,727 | 73.4% |
| Smartphone | 12,081 | 82.7% |
| Tablet | 8,275 | 56.6% |
| No Computing Device | 1,230 | 8.4% |
| Total | 14,617 | 100.0% |
Internet Access in Fremont County
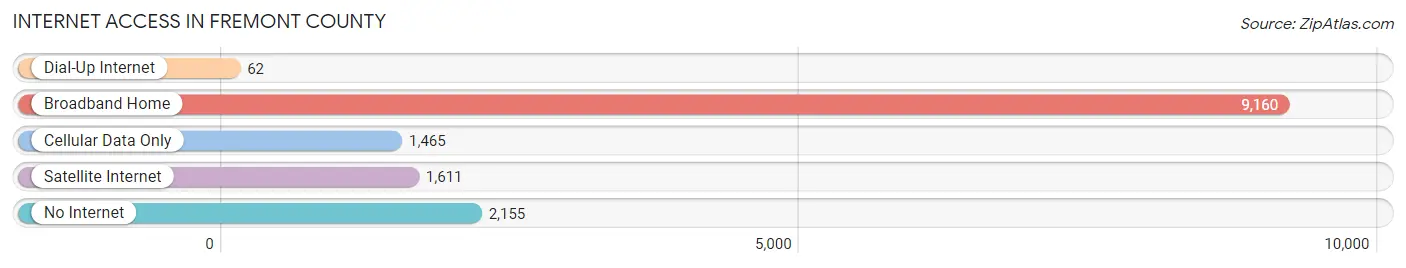
| Internet Type | # Households | % Households |
| Dial-Up Internet | 62 | 0.4% |
| Broadband Home | 9,160 | 62.7% |
| Cellular Data Only | 1,465 | 10.0% |
| Satellite Internet | 1,611 | 11.0% |
| No Internet | 2,155 | 14.7% |
| Total | 14,617 | 100.0% |
Fremont County Summary
Fremont County, Wyoming is located in the western part of the state and is the second largest county in the state. It is bordered by Park County to the north, Hot Springs County to the east, Sweetwater County to the south, and Sublette County to the west. The county seat is Lander, and the largest city is Riverton.
History
Fremont County was created in 1884 and named after John C. Fremont, an explorer and politician. The county was originally part of Sweetwater County, but was split off in 1884. The county was originally populated by Native American tribes, including the Shoshone, Arapaho, and Crow.
The first settlers in the area were ranchers and miners, who arrived in the late 1800s. The first town in the county was Lander, which was founded in 1884. The town was named after General F.W. Lander, who surveyed the area in the 1860s.
The county was also home to the Wind River Indian Reservation, which was established in 1868. The reservation is home to the Eastern Shoshone and Northern Arapaho tribes.
Geography
Fremont County is located in the western part of Wyoming and covers an area of 7,921 square miles. The county is located in the Rocky Mountains and is home to the Wind River Range, which includes the highest peak in the state, Gannett Peak. The county is also home to the Wind River Canyon, which is a popular tourist destination.
The county is mostly mountainous, with the Wind River Range dominating the landscape. The county also has several lakes, including Fremont Lake, which is the largest natural lake in the state.
The county has a semi-arid climate, with hot summers and cold winters. The average annual precipitation is 11.5 inches.
Economy
Fremont County has a diverse economy, with the largest industries being tourism, agriculture, and energy.
Tourism is a major industry in the county, with the Wind River Canyon and other natural attractions drawing visitors from around the world. The county is also home to several national parks, including the Wind River Indian Reservation, which is a popular destination for outdoor recreation.
Agriculture is also an important part of the economy, with the county being home to several large ranches. The county is also home to several wineries, which produce award-winning wines.
Energy is also an important part of the economy, with the county being home to several oil and gas fields. The county is also home to several wind farms, which generate electricity for the region.
Demographics
As of the 2010 census, Fremont County had a population of 40,123. The county is predominantly white, with the largest ethnic group being Native American, at 11.3%. The county also has a large Hispanic population, at 8.3%.
The median household income in the county is $50,845, and the median home value is $179,400. The unemployment rate in the county is 4.2%.
Conclusion
Fremont County, Wyoming is a large and diverse county located in the western part of the state. The county is home to several national parks and other attractions, making it a popular destination for tourists. The county also has a diverse economy, with the largest industries being tourism, agriculture, and energy. The county has a population of 40,123, with the largest ethnic group being Native American. The median household income in the county is $50,845, and the median home value is $179,400.
Common Questions
What is the Total Population of Fremont County?
Total Population of Fremont County is 39,402.
What is the Total Male Population of Fremont County?
Total Male Population of Fremont County is 19,959.
What is the Total Female Population of Fremont County?
Total Female Population of Fremont County is 19,443.
What is the Ratio of Males per 100 Females in Fremont County?
There are 102.65 Males per 100 Females in Fremont County.
What is the Ratio of Females per 100 Males in Fremont County?
There are 97.41 Females per 100 Males in Fremont County.
What is the Median Population Age in Fremont County?
Median Population Age in Fremont County is 38.9 Years.
What is the Average Family Size in Fremont County
Average Family Size in Fremont County is 3.4 People.
What is the Average Household Size in Fremont County
Average Household Size in Fremont County is 2.6 People.
What is Per Capita Income in Fremont County?
Per Capita income in Fremont County is $30,414.
What is the Median Family Income in Fremont County?
Median Family Income in Fremont County is $76,114.
What is the Median Household income in Fremont County?
Median Household Income in Fremont County is $60,030.
What is Income or Wage Gap in Fremont County?
Income or Wage Gap in Fremont County is 27.5%.
Women in Fremont County earn 72.5 cents for every dollar earned by a man.
What is Family Income Deficit in Fremont County?
Family Income Deficit in Fremont County is $11,507.
Families that are below poverty line in Fremont County earn $11,507 less on average than the poverty threshold level.
What is Inequality or Gini Index in Fremont County?
Inequality or Gini Index in Fremont County is 0.42.
How Large is the Labor Force in Fremont County?
There are 18,821 People in the Labor Forcein in Fremont County.
What is the Percentage of People in the Labor Force in Fremont County?
61.2% of People are in the Labor Force in Fremont County.
What is the Unemployment Rate in Fremont County?
Unemployment Rate in Fremont County is 8.2%.