Crook County, WY
Crook County Map
Crook County Overview
7,258
TOTAL POPULATION
3,634
MALE POPULATION
3,624
FEMALE POPULATION
100.28
MALES / 100 FEMALES
99.72
FEMALES / 100 MALES
44.2
MEDIAN AGE
3.2
AVG FAMILY SIZE
2.6
AVG HOUSEHOLD SIZE
$33,386
PER CAPITA INCOME
$90,372
AVG FAMILY INCOME
$68,876
AVG HOUSEHOLD INCOME
36.7%
WAGE / INCOME GAP [ % ]
63.3¢/ $1
WAGE / INCOME GAP [ $ ]
$9,533
FAMILY INCOME DEFICIT
0.39
INEQUALITY / GINI INDEX
3,490
LABOR FORCE [ PEOPLE ]
62.8%
PERCENT IN LABOR FORCE
1.0%
UNEMPLOYMENT RATE
Crook County Area Codes
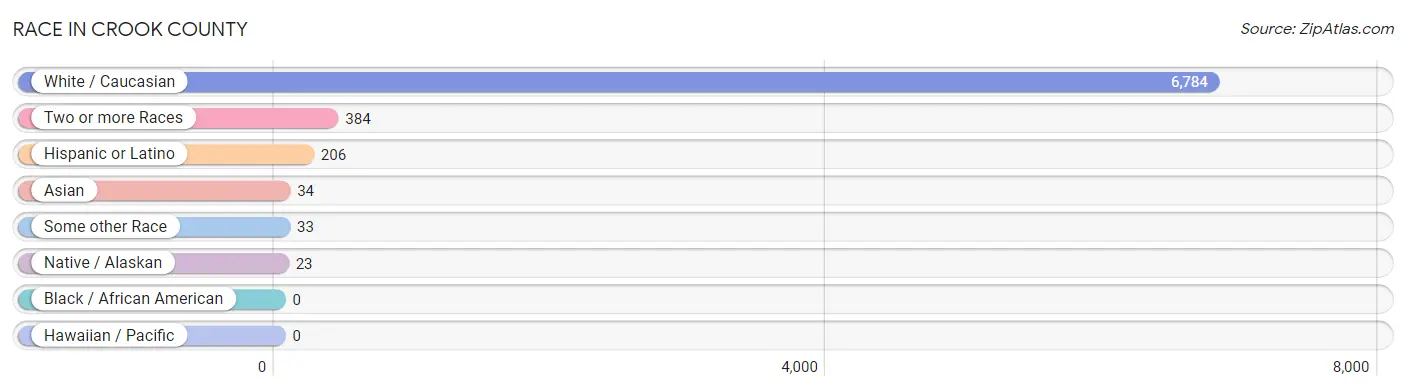
Race in Crook County
The most populous races in Crook County are White / Caucasian (6,784 | 93.5%), Two or more Races (384 | 5.3%), and Hispanic or Latino (206 | 2.8%).
| Race | # Population | % Population |
| Asian | 34 | 0.5% |
| Black / African American | 0 | 0.0% |
| Hawaiian / Pacific | 0 | 0.0% |
| Hispanic or Latino | 206 | 2.8% |
| Native / Alaskan | 23 | 0.3% |
| White / Caucasian | 6,784 | 93.5% |
| Two or more Races | 384 | 5.3% |
| Some other Race | 33 | 0.4% |
| Total | 7,258 | 100.0% |
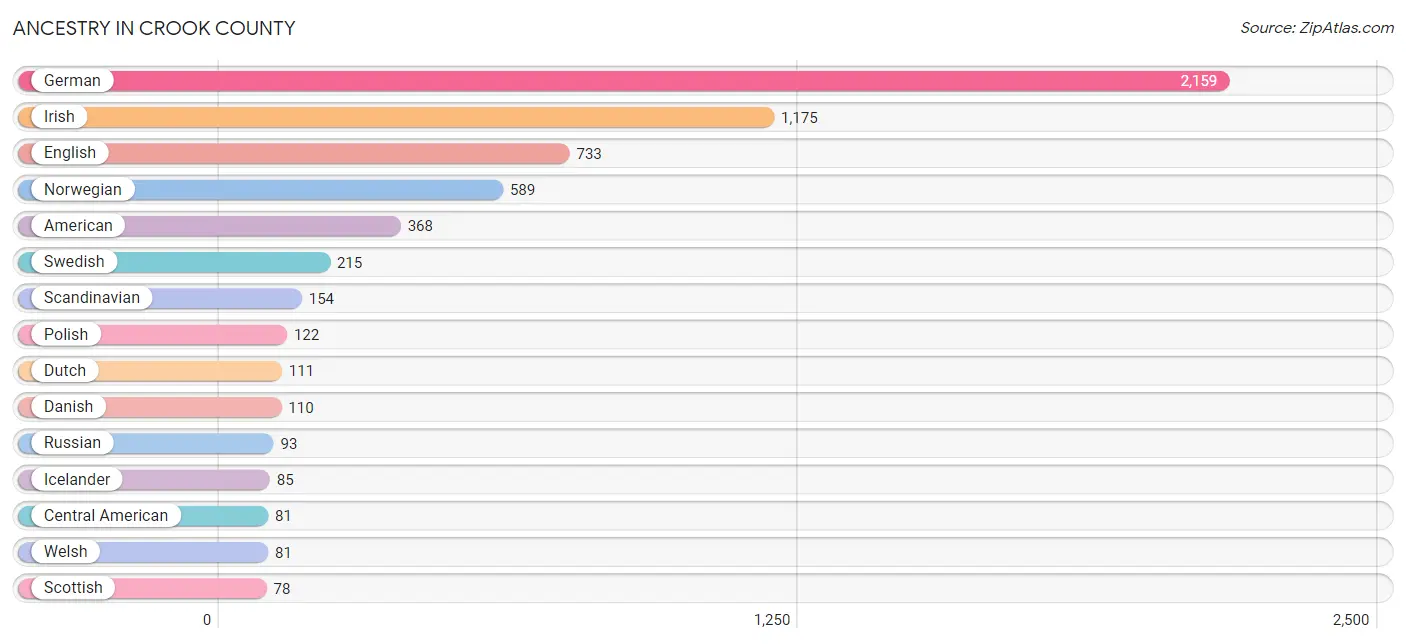
Ancestry in Crook County
The most populous ancestries reported in Crook County are German (2,159 | 29.7%), Irish (1,175 | 16.2%), English (733 | 10.1%), Norwegian (589 | 8.1%), and American (368 | 5.1%), together accounting for 69.2% of all Crook County residents.
| Ancestry | # Population | % Population |
| Aleut | 11 | 0.2% |
| American | 368 | 5.1% |
| Apache | 1 | 0.0% |
| Austrian | 23 | 0.3% |
| Basque | 10 | 0.1% |
| Belgian | 3 | 0.0% |
| Blackfeet | 2 | 0.0% |
| British | 2 | 0.0% |
| Canadian | 58 | 0.8% |
| Central American | 81 | 1.1% |
| Central American Indian | 1 | 0.0% |
| Cherokee | 68 | 0.9% |
| Cree | 1 | 0.0% |
| Croatian | 9 | 0.1% |
| Cuban | 13 | 0.2% |
| Czech | 4 | 0.1% |
| Czechoslovakian | 8 | 0.1% |
| Danish | 110 | 1.5% |
| Dutch | 111 | 1.5% |
| Eastern European | 34 | 0.5% |
| English | 733 | 10.1% |
| European | 40 | 0.5% |
| Finnish | 34 | 0.5% |
| French | 75 | 1.0% |
| French American Indian | 16 | 0.2% |
| French Canadian | 16 | 0.2% |
| German | 2,159 | 29.7% |
| Greek | 2 | 0.0% |
| Honduran | 16 | 0.2% |
| Hungarian | 10 | 0.1% |
| Icelander | 85 | 1.2% |
| Irish | 1,175 | 16.2% |
| Italian | 63 | 0.9% |
| Korean | 9 | 0.1% |
| Latvian | 10 | 0.1% |
| Mexican | 51 | 0.7% |
| Northern European | 2 | 0.0% |
| Norwegian | 589 | 8.1% |
| Panamanian | 65 | 0.9% |
| Pennsylvania German | 10 | 0.1% |
| Polish | 122 | 1.7% |
| Portuguese | 5 | 0.1% |
| Puerto Rican | 10 | 0.1% |
| Russian | 93 | 1.3% |
| Scandinavian | 154 | 2.1% |
| Scotch-Irish | 76 | 1.1% |
| Scottish | 78 | 1.1% |
| Shoshone | 5 | 0.1% |
| Sioux | 22 | 0.3% |
| Spaniard | 3 | 0.0% |
| Sri Lankan | 25 | 0.3% |
| Swedish | 215 | 3.0% |
| Swiss | 23 | 0.3% |
| Ukrainian | 1 | 0.0% |
| Welsh | 81 | 1.1% | View All 55 Rows |
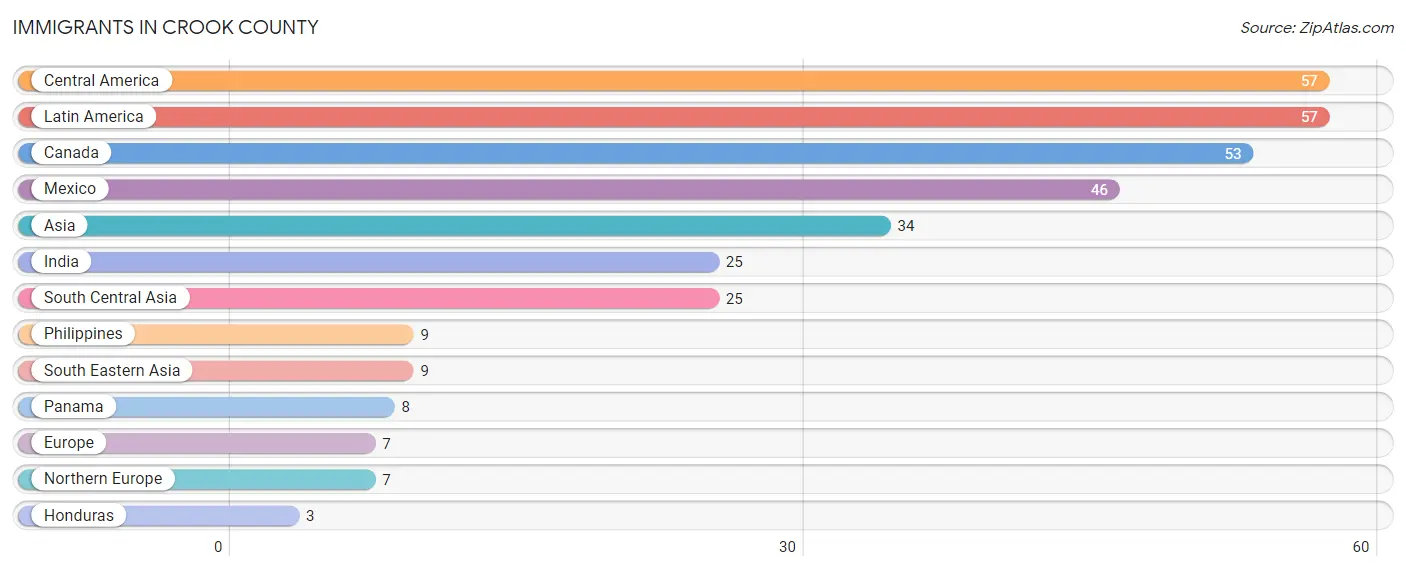
Immigrants in Crook County
The most numerous immigrant groups reported in Crook County came from Central America (57 | 0.8%), Latin America (57 | 0.8%), Canada (53 | 0.7%), Mexico (46 | 0.6%), and Asia (34 | 0.5%), together accounting for 3.4% of all Crook County residents.
| Immigration Origin | # Population | % Population |
| Asia | 34 | 0.5% |
| Canada | 53 | 0.7% |
| Central America | 57 | 0.8% |
| Europe | 7 | 0.1% |
| Honduras | 3 | 0.0% |
| India | 25 | 0.3% |
| Latin America | 57 | 0.8% |
| Mexico | 46 | 0.6% |
| Northern Europe | 7 | 0.1% |
| Panama | 8 | 0.1% |
| Philippines | 9 | 0.1% |
| South Central Asia | 25 | 0.3% |
| South Eastern Asia | 9 | 0.1% | View All 13 Rows |
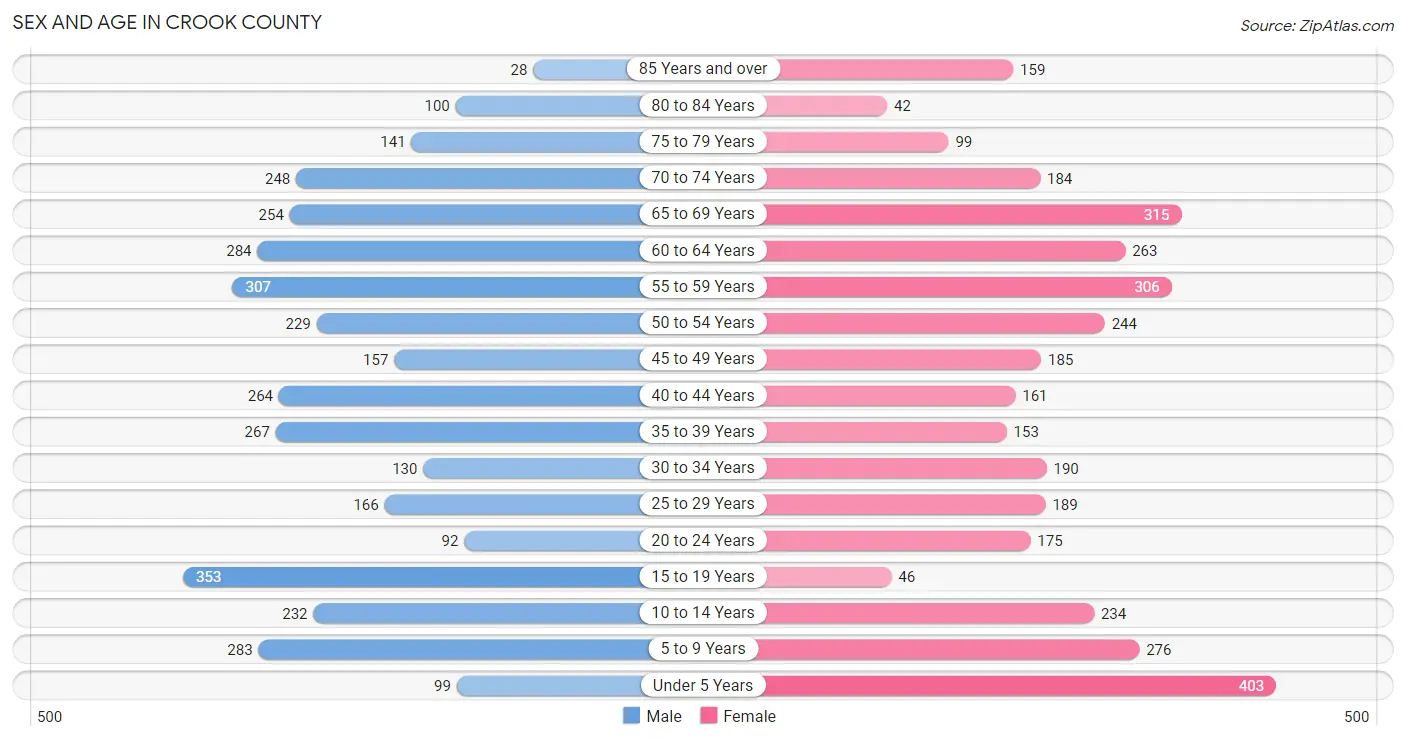
Sex and Age in Crook County
Sex and Age in Crook County
The most populous age groups in Crook County are 15 to 19 Years (353 | 9.7%) for men and Under 5 Years (403 | 11.1%) for women.
| Age Bracket | Male | Female |
| Under 5 Years | 99 (2.7%) | 403 (11.1%) |
| 5 to 9 Years | 283 (7.8%) | 276 (7.6%) |
| 10 to 14 Years | 232 (6.4%) | 234 (6.5%) |
| 15 to 19 Years | 353 (9.7%) | 46 (1.3%) |
| 20 to 24 Years | 92 (2.5%) | 175 (4.8%) |
| 25 to 29 Years | 166 (4.6%) | 189 (5.2%) |
| 30 to 34 Years | 130 (3.6%) | 190 (5.2%) |
| 35 to 39 Years | 267 (7.3%) | 153 (4.2%) |
| 40 to 44 Years | 264 (7.3%) | 161 (4.4%) |
| 45 to 49 Years | 157 (4.3%) | 185 (5.1%) |
| 50 to 54 Years | 229 (6.3%) | 244 (6.7%) |
| 55 to 59 Years | 307 (8.5%) | 306 (8.4%) |
| 60 to 64 Years | 284 (7.8%) | 263 (7.3%) |
| 65 to 69 Years | 254 (7.0%) | 315 (8.7%) |
| 70 to 74 Years | 248 (6.8%) | 184 (5.1%) |
| 75 to 79 Years | 141 (3.9%) | 99 (2.7%) |
| 80 to 84 Years | 100 (2.8%) | 42 (1.2%) |
| 85 Years and over | 28 (0.8%) | 159 (4.4%) |
| Total | 3,634 (100.0%) | 3,624 (100.0%) |
Families and Households in Crook County
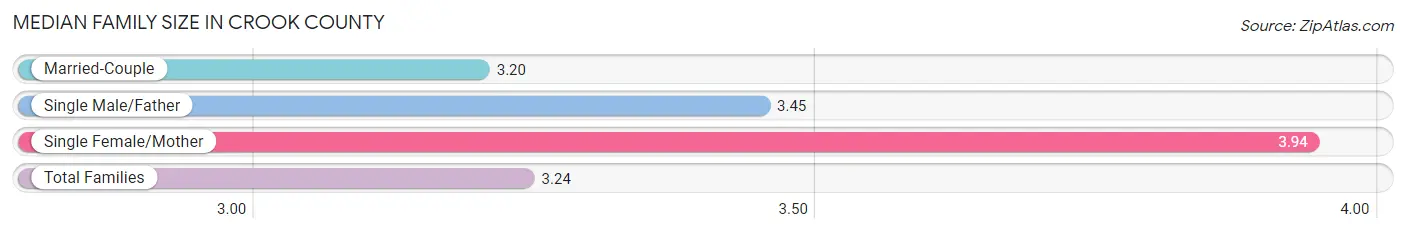
Median Family Size in Crook County
The median family size in Crook County is 3.24 persons per family, with single female/mother families (87 | 4.7%) accounting for the largest median family size of 3.94 persons per family. On the other hand, married-couple families (1,738 | 93.1%) represent the smallest median family size with 3.20 persons per family.
| Family Type | # Families | Family Size |
| Married-Couple | 1,738 (93.1%) | 3.20 |
| Single Male/Father | 42 (2.2%) | 3.45 |
| Single Female/Mother | 87 (4.7%) | 3.94 |
| Total Families | 1,867 (100.0%) | 3.24 |
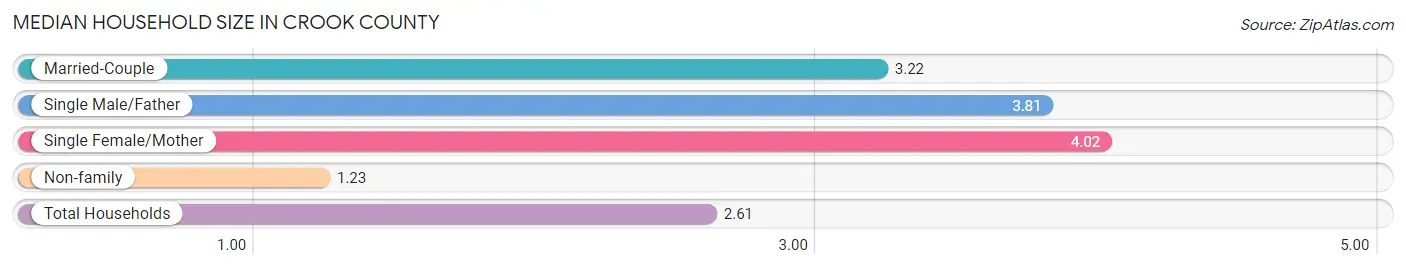
Median Household Size in Crook County
The median household size in Crook County is 2.61 persons per household, with single female/mother households (87 | 3.2%) accounting for the largest median household size of 4.02 persons per household. non-family households (888 | 32.2%) represent the smallest median household size with 1.23 persons per household.
| Household Type | # Households | Household Size |
| Married-Couple | 1,738 (63.1%) | 3.22 |
| Single Male/Father | 42 (1.5%) | 3.81 |
| Single Female/Mother | 87 (3.2%) | 4.02 |
| Non-family | 888 (32.2%) | 1.23 |
| Total Households | 2,755 (100.0%) | 2.61 |
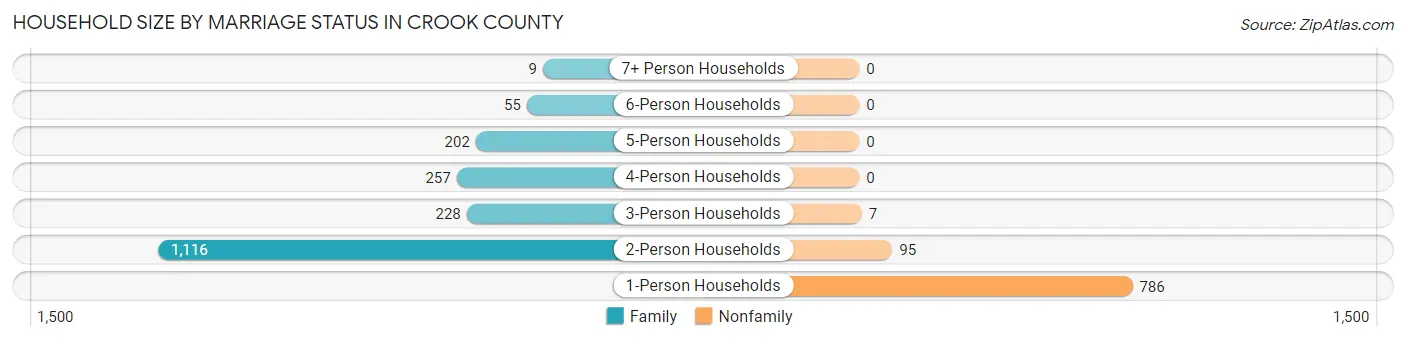
Household Size by Marriage Status in Crook County
Out of a total of 2,755 households in Crook County, 1,867 (67.8%) are family households, while 888 (32.2%) are nonfamily households. The most numerous type of family households are 2-person households, comprising 1,116, and the most common type of nonfamily households are 1-person households, comprising 786.
| Household Size | Family Households | Nonfamily Households |
| 1-Person Households | - | 786 (28.5%) |
| 2-Person Households | 1,116 (40.5%) | 95 (3.5%) |
| 3-Person Households | 228 (8.3%) | 7 (0.3%) |
| 4-Person Households | 257 (9.3%) | 0 (0.0%) |
| 5-Person Households | 202 (7.3%) | 0 (0.0%) |
| 6-Person Households | 55 (2.0%) | 0 (0.0%) |
| 7+ Person Households | 9 (0.3%) | 0 (0.0%) |
| Total | 1,867 (67.8%) | 888 (32.2%) |
Female Fertility in Crook County
Fertility by Age in Crook County
Average fertility rate in Crook County is 83.0 births per 1,000 women. Women in the age bracket of 20 to 34 years have the highest fertility rate with 175.0 births per 1,000 women. Women in the age bracket of 20 to 34 years acount for 100.0% of all women with births.
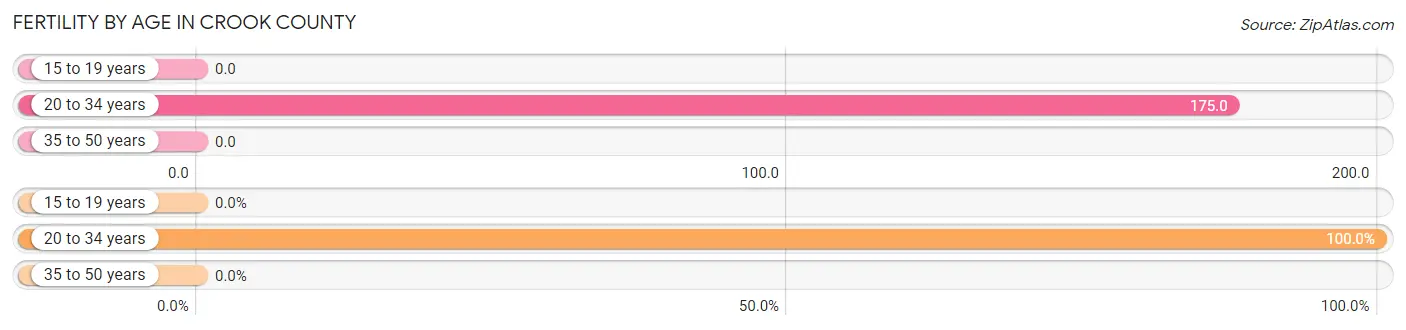
| Age Bracket | Women with Births | Births / 1,000 Women |
| 15 to 19 years | 0 (0.0%) | 0.0 |
| 20 to 34 years | 97 (100.0%) | 175.0 |
| 35 to 50 years | 0 (0.0%) | 0.0 |
| Total | 97 (100.0%) | 83.0 |
Fertility by Age by Marriage Status in Crook County
70.1% of women with births (97) in Crook County are married. The highest percentage of unmarried women with births falls into 20 to 34 years age bracket with 29.9% of them unmarried at the time of birth, while the lowest percentage of unmarried women with births belong to 20 to 34 years age bracket with 29.9% of them unmarried.
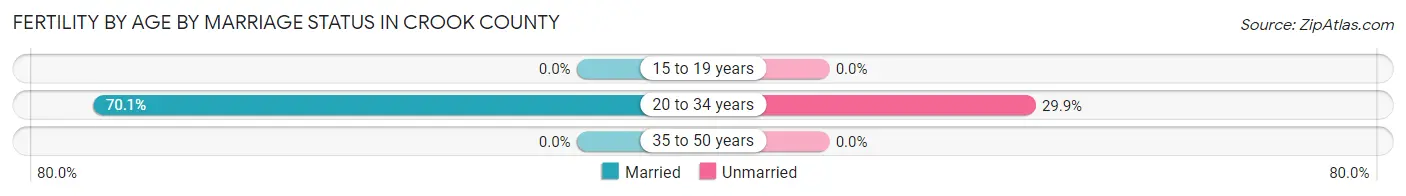
| Age Bracket | Married | Unmarried |
| 15 to 19 years | 0 (0.0%) | 0 (0.0%) |
| 20 to 34 years | 68 (70.1%) | 29 (29.9%) |
| 35 to 50 years | 0 (0.0%) | 0 (0.0%) |
| Total | 68 (70.1%) | 29 (29.9%) |
Fertility by Education in Crook County
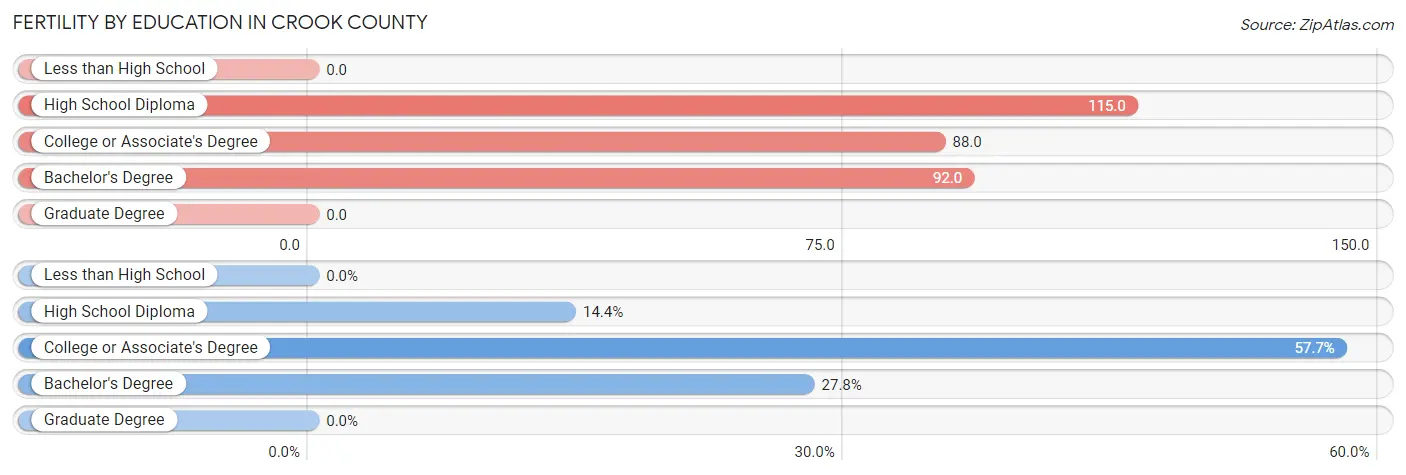
| Educational Attainment | Women with Births | Births / 1,000 Women |
| Less than High School | 0 (0.0%) | 0.0 |
| High School Diploma | 14 (14.4%) | 115.0 |
| College or Associate's Degree | 56 (57.7%) | 88.0 |
| Bachelor's Degree | 27 (27.8%) | 92.0 |
| Graduate Degree | 0 (0.0%) | 0.0 |
| Total | 97 (100.0%) | 83.0 |
Fertility by Education by Marriage Status in Crook County
29.9% of women with births in Crook County are unmarried. Women with the educational attainment of high school diploma are most likely to be married with 100.0% of them married at childbirth, while women with the educational attainment of college or associate's degree are least likely to be married with 51.8% of them unmarried at childbirth.
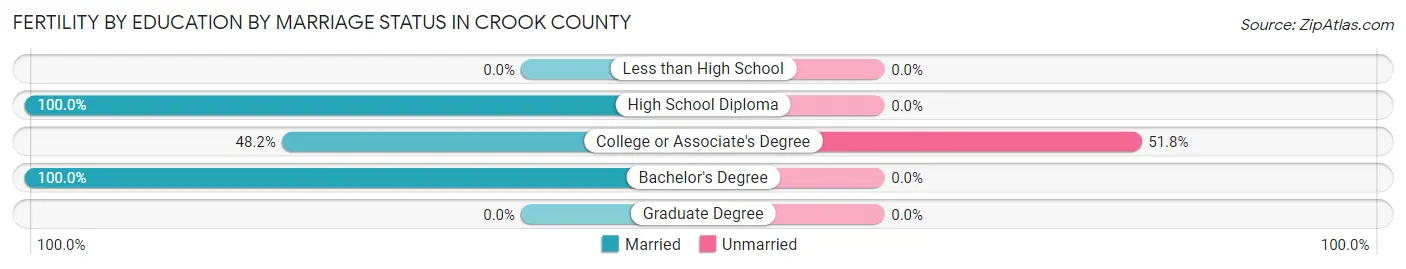
| Educational Attainment | Married | Unmarried |
| Less than High School | 0 (0.0%) | 0 (0.0%) |
| High School Diploma | 14 (100.0%) | 0 (0.0%) |
| College or Associate's Degree | 27 (48.2%) | 29 (51.8%) |
| Bachelor's Degree | 27 (100.0%) | 0 (0.0%) |
| Graduate Degree | 0 (0.0%) | 0 (0.0%) |
| Total | 68 (70.1%) | 29 (29.9%) |
Income in Crook County
Income Overview in Crook County
Per Capita Income in Crook County is $33,386, while median incomes of families and households are $90,372 and $68,876 respectively.
| Characteristic | Number | Measure |
| Per Capita Income | 7,258 | $33,386 |
| Median Family Income | 1,867 | $90,372 |
| Mean Family Income | 1,867 | $99,443 |
| Median Household Income | 2,755 | $68,876 |
| Mean Household Income | 2,755 | $82,651 |
| Income Deficit | 1,867 | $9,533 |
| Wage / Income Gap (%) | 7,258 | 36.72% |
| Wage / Income Gap ($) | 7,258 | 63.28¢ per $1 |
| Gini / Inequality Index | 7,258 | 0.39 |
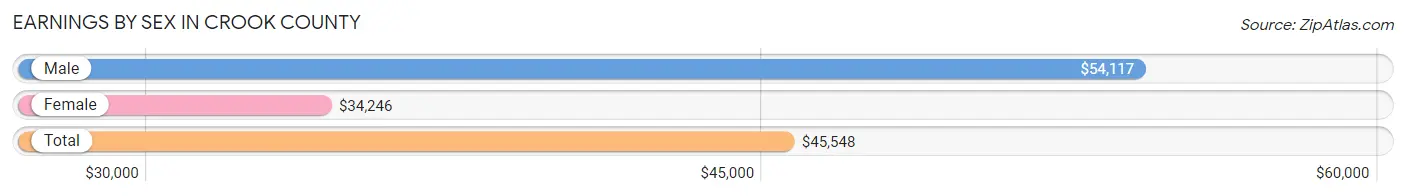
Earnings by Sex in Crook County
Average Earnings in Crook County are $45,548, $54,117 for men and $34,246 for women, a difference of 36.7%.
| Sex | Number | Average Earnings |
| Male | 2,135 (58.3%) | $54,117 |
| Female | 1,526 (41.7%) | $34,246 |
| Total | 3,661 (100.0%) | $45,548 |
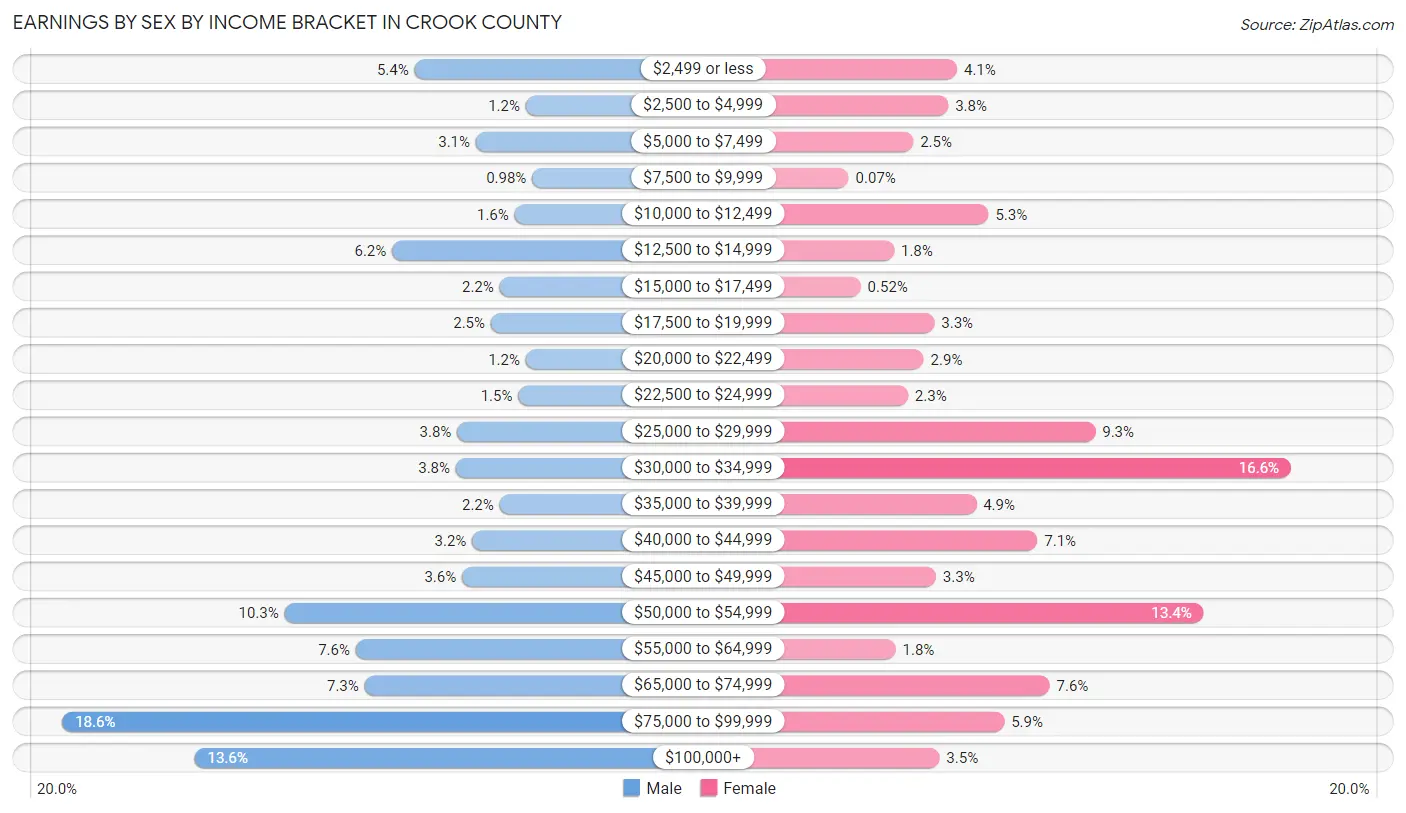
Earnings by Sex by Income Bracket in Crook County
The most common earnings brackets in Crook County are $75,000 to $99,999 for men (397 | 18.6%) and $30,000 to $34,999 for women (254 | 16.6%).
| Income | Male | Female |
| $2,499 or less | 115 (5.4%) | 63 (4.1%) |
| $2,500 to $4,999 | 26 (1.2%) | 58 (3.8%) |
| $5,000 to $7,499 | 66 (3.1%) | 38 (2.5%) |
| $7,500 to $9,999 | 21 (1.0%) | 1 (0.1%) |
| $10,000 to $12,499 | 35 (1.6%) | 81 (5.3%) |
| $12,500 to $14,999 | 133 (6.2%) | 27 (1.8%) |
| $15,000 to $17,499 | 47 (2.2%) | 8 (0.5%) |
| $17,500 to $19,999 | 54 (2.5%) | 50 (3.3%) |
| $20,000 to $22,499 | 26 (1.2%) | 44 (2.9%) |
| $22,500 to $24,999 | 32 (1.5%) | 35 (2.3%) |
| $25,000 to $29,999 | 81 (3.8%) | 142 (9.3%) |
| $30,000 to $34,999 | 82 (3.8%) | 254 (16.6%) |
| $35,000 to $39,999 | 47 (2.2%) | 74 (4.9%) |
| $40,000 to $44,999 | 69 (3.2%) | 109 (7.1%) |
| $45,000 to $49,999 | 77 (3.6%) | 51 (3.3%) |
| $50,000 to $54,999 | 219 (10.3%) | 204 (13.4%) |
| $55,000 to $64,999 | 162 (7.6%) | 28 (1.8%) |
| $65,000 to $74,999 | 155 (7.3%) | 116 (7.6%) |
| $75,000 to $99,999 | 397 (18.6%) | 90 (5.9%) |
| $100,000+ | 291 (13.6%) | 53 (3.5%) |
| Total | 2,135 (100.0%) | 1,526 (100.0%) |
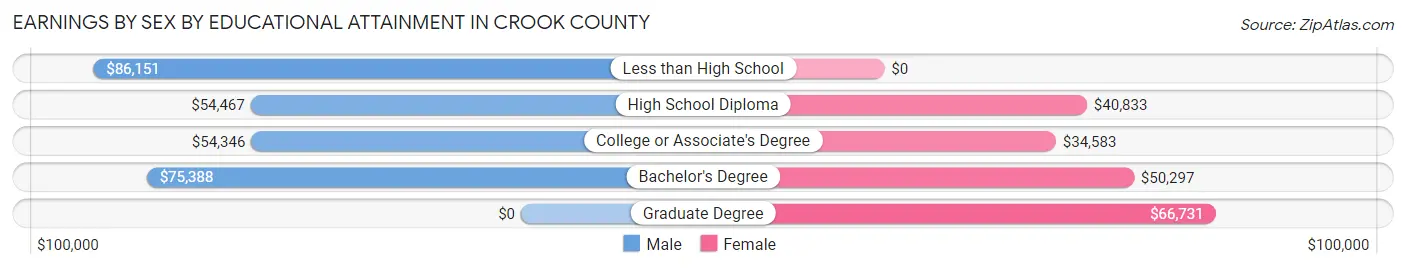
Earnings by Sex by Educational Attainment in Crook County
Average earnings in Crook County are $56,378 for men and $37,042 for women, a difference of 34.3%. Men with an educational attainment of less than high school enjoy the highest average annual earnings of $86,151, while those with college or associate's degree education earn the least with $54,346. Women with an educational attainment of graduate degree earn the most with the average annual earnings of $66,731, while those with college or associate's degree education have the smallest earnings of $34,583.
| Educational Attainment | Male Income | Female Income |
| Less than High School | $86,151 | $0 |
| High School Diploma | $54,467 | $40,833 |
| College or Associate's Degree | $54,346 | $34,583 |
| Bachelor's Degree | $75,388 | $50,297 |
| Graduate Degree | - | - |
| Total | $56,378 | $37,042 |
Family Income in Crook County
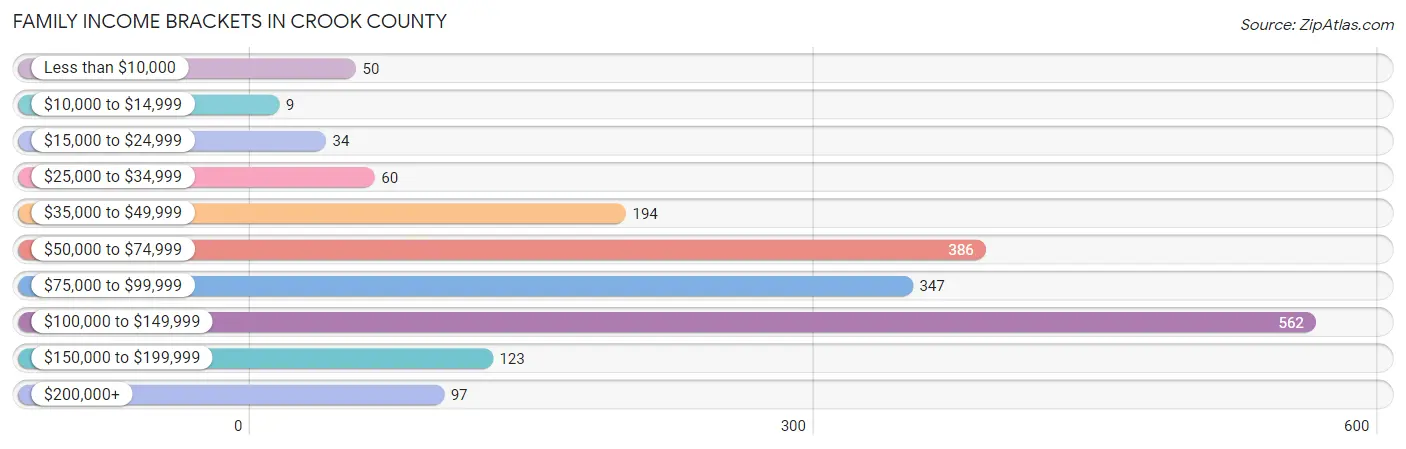
Family Income Brackets in Crook County
According to the Crook County family income data, there are 562 families falling into the $100,000 to $149,999 income range, which is the most common income bracket and makes up 30.1% of all families. Conversely, the $10,000 to $14,999 income bracket is the least frequent group with only 9 families (0.5%) belonging to this category.
| Income Bracket | # Families | % Families |
| Less than $10,000 | 50 | 2.7% |
| $10,000 to $14,999 | 9 | 0.5% |
| $15,000 to $24,999 | 34 | 1.8% |
| $25,000 to $34,999 | 60 | 3.2% |
| $35,000 to $49,999 | 194 | 10.4% |
| $50,000 to $74,999 | 386 | 20.7% |
| $75,000 to $99,999 | 347 | 18.6% |
| $100,000 to $149,999 | 562 | 30.1% |
| $150,000 to $199,999 | 123 | 6.6% |
| $200,000+ | 97 | 5.2% |
Family Income by Famaliy Size in Crook County
5-person families (205 | 11.0%) account for the highest median family income in Crook County with $138,405 per family, while 2-person families (1,137 | 60.9%) have the highest median income of $42,428 per family member.
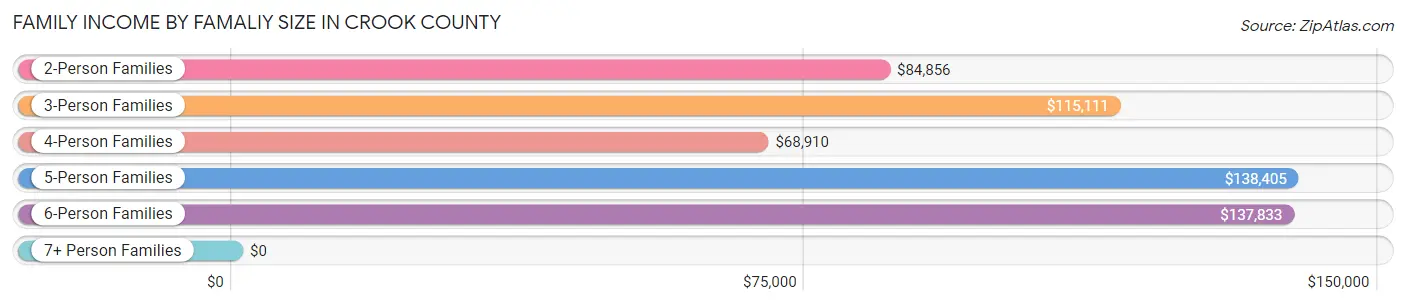
| Income Bracket | # Families | Median Income |
| 2-Person Families | 1,137 (60.9%) | $84,856 |
| 3-Person Families | 220 (11.8%) | $115,111 |
| 4-Person Families | 244 (13.1%) | $68,910 |
| 5-Person Families | 205 (11.0%) | $138,405 |
| 6-Person Families | 52 (2.8%) | $137,833 |
| 7+ Person Families | 9 (0.5%) | $0 |
| Total | 1,867 (100.0%) | $90,372 |
Family Income by Number of Earners in Crook County
The median family income in Crook County is $90,372, with families comprising 3+ earners (115) having the highest median family income of $171,058, while families with no earners (279) have the lowest median family income of $52,969, accounting for 6.2% and 14.9% of families, respectively.
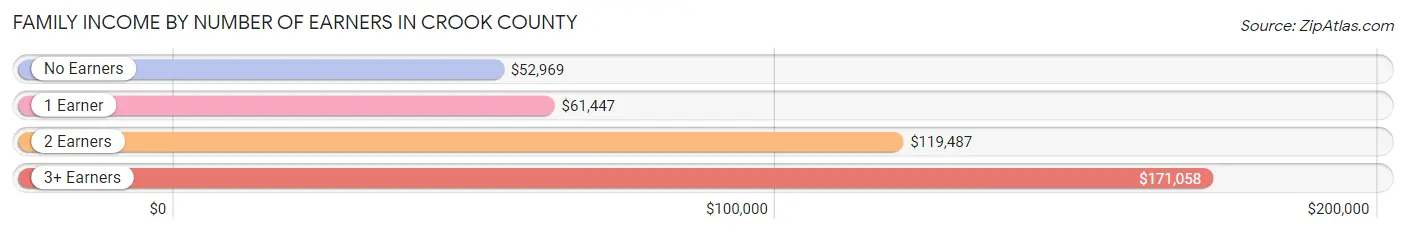
| Number of Earners | # Families | Median Income |
| No Earners | 279 (14.9%) | $52,969 |
| 1 Earner | 578 (31.0%) | $61,447 |
| 2 Earners | 895 (47.9%) | $119,487 |
| 3+ Earners | 115 (6.2%) | $171,058 |
| Total | 1,867 (100.0%) | $90,372 |
Household Income in Crook County
Household Income Brackets in Crook County
With 592 households falling in the category, the $50,000 to $74,999 income range is the most frequent in Crook County, accounting for 21.5% of all households. In contrast, only 85 households (3.1%) fall into the $15,000 to $24,999 income bracket, making it the least populous group.
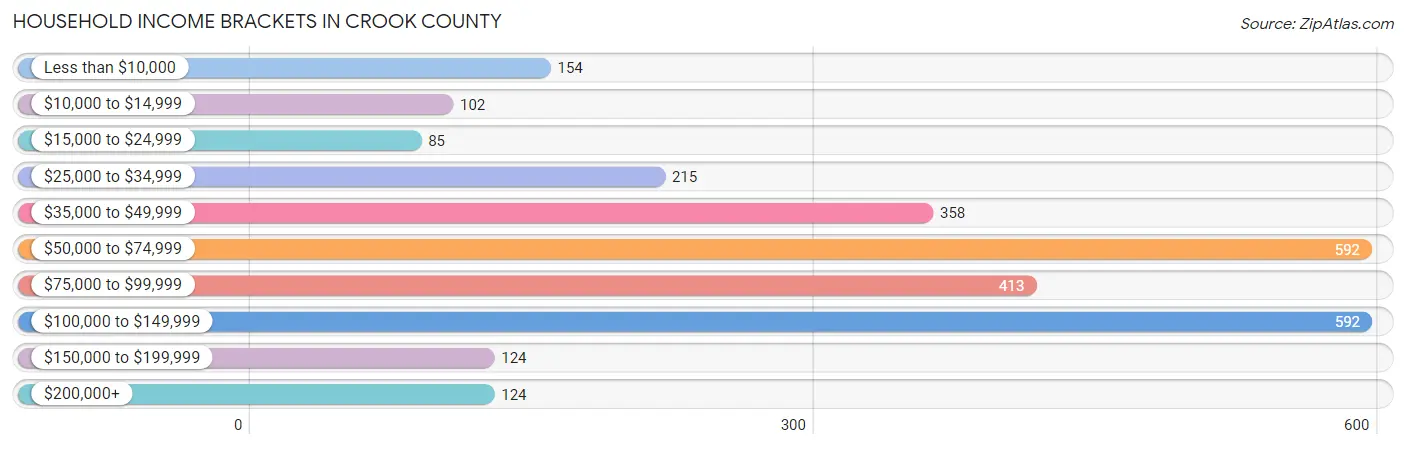
| Income Bracket | # Households | % Households |
| Less than $10,000 | 154 | 5.6% |
| $10,000 to $14,999 | 102 | 3.7% |
| $15,000 to $24,999 | 85 | 3.1% |
| $25,000 to $34,999 | 215 | 7.8% |
| $35,000 to $49,999 | 358 | 13.0% |
| $50,000 to $74,999 | 592 | 21.5% |
| $75,000 to $99,999 | 413 | 15.0% |
| $100,000 to $149,999 | 592 | 21.5% |
| $150,000 to $199,999 | 124 | 4.5% |
| $200,000+ | 124 | 4.5% |
Household Income by Householder Age in Crook County
The median household income in Crook County is $68,876, with the highest median household income of $93,523 found in the 45 to 64 years age bracket for the primary householder. A total of 982 households (35.6%) fall into this category. Meanwhile, the 15 to 24 years age bracket for the primary householder has the lowest median household income of $0, with 48 households (1.7%) in this group.
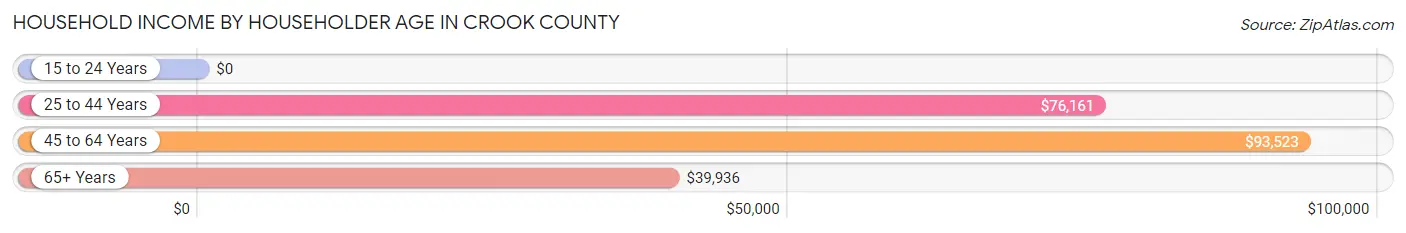
| Income Bracket | # Households | Median Income |
| 15 to 24 Years | 48 (1.7%) | $0 |
| 25 to 44 Years | 843 (30.6%) | $76,161 |
| 45 to 64 Years | 982 (35.6%) | $93,523 |
| 65+ Years | 882 (32.0%) | $39,936 |
| Total | 2,755 (100.0%) | $68,876 |
Poverty in Crook County
Income Below Poverty by Sex and Age in Crook County
With 4.6% poverty level for males and 8.1% for females among the residents of Crook County, 75 year old and over males and 75 year old and over females are the most vulnerable to poverty, with 67 males (25.6%) and 79 females (28.5%) in their respective age groups living below the poverty level.
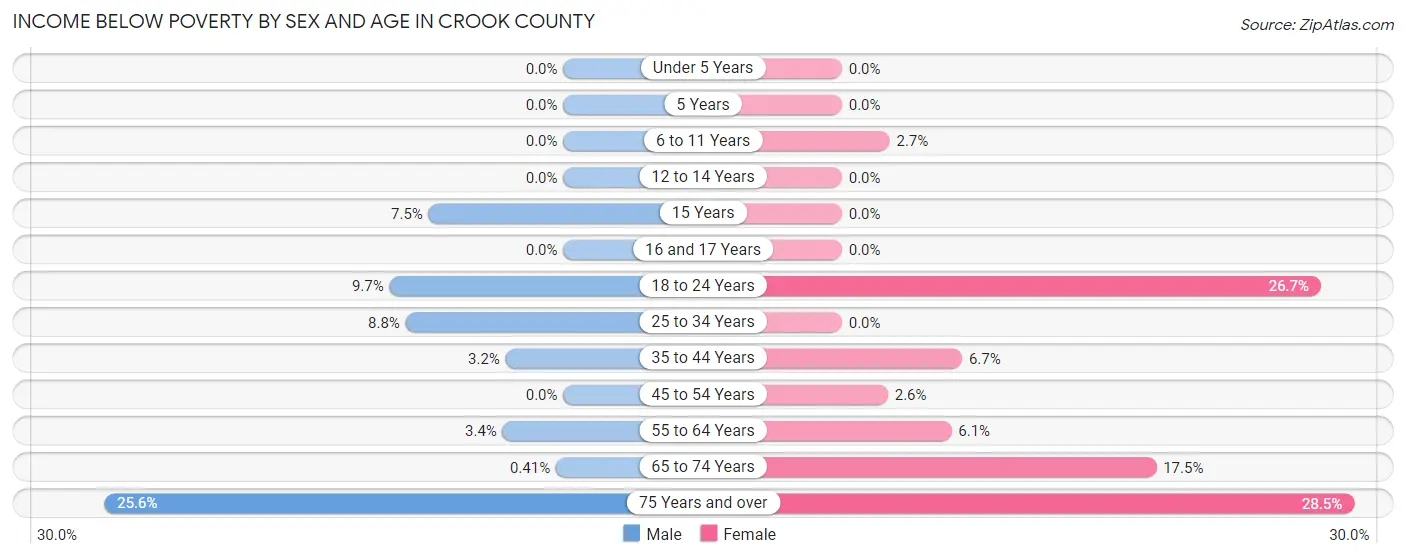
| Age Bracket | Male | Female |
| Under 5 Years | 0 (0.0%) | 0 (0.0%) |
| 5 Years | 0 (0.0%) | 0 (0.0%) |
| 6 to 11 Years | 0 (0.0%) | 10 (2.7%) |
| 12 to 14 Years | 0 (0.0%) | 0 (0.0%) |
| 15 Years | 12 (7.5%) | 0 (0.0%) |
| 16 and 17 Years | 0 (0.0%) | 0 (0.0%) |
| 18 to 24 Years | 21 (9.7%) | 48 (26.7%) |
| 25 to 34 Years | 26 (8.8%) | 0 (0.0%) |
| 35 to 44 Years | 17 (3.2%) | 21 (6.7%) |
| 45 to 54 Years | 0 (0.0%) | 11 (2.6%) |
| 55 to 64 Years | 20 (3.4%) | 34 (6.1%) |
| 65 to 74 Years | 2 (0.4%) | 87 (17.5%) |
| 75 Years and over | 67 (25.6%) | 79 (28.5%) |
| Total | 165 (4.6%) | 290 (8.1%) |
Income Above Poverty by Sex and Age in Crook County
According to the poverty statistics in Crook County, males aged under 5 years and females aged under 5 years are the age groups that are most secure financially, with 100.0% of males and 100.0% of females in these age groups living above the poverty line.
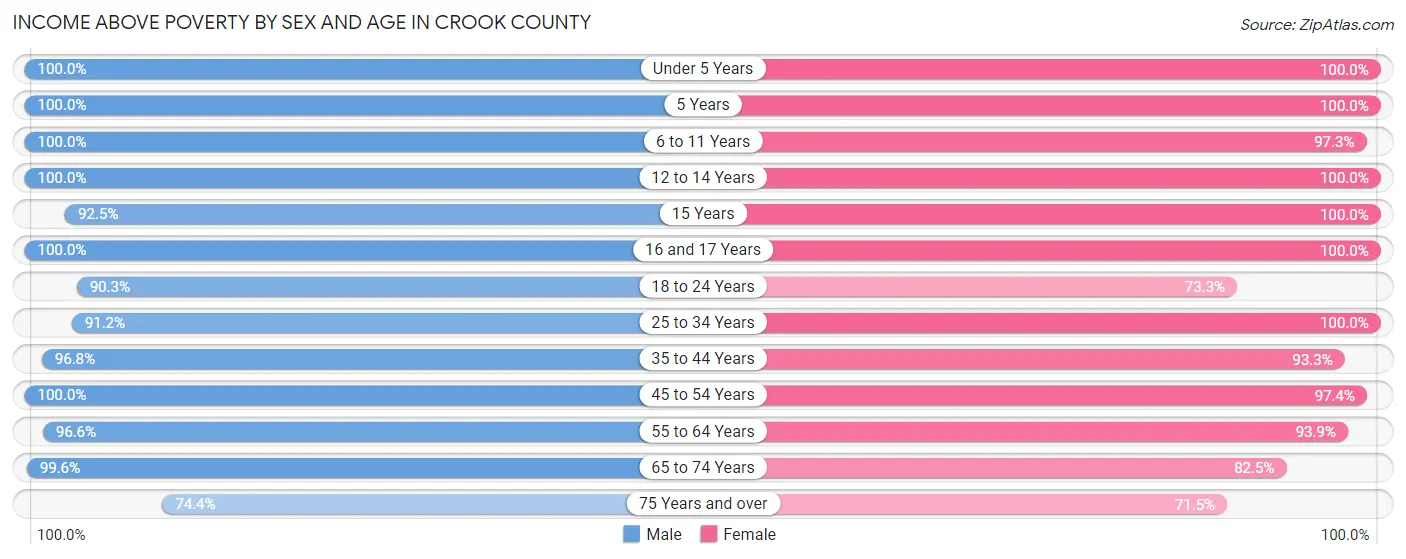
| Age Bracket | Male | Female |
| Under 5 Years | 99 (100.0%) | 403 (100.0%) |
| 5 Years | 59 (100.0%) | 37 (100.0%) |
| 6 to 11 Years | 254 (100.0%) | 366 (97.3%) |
| 12 to 14 Years | 202 (100.0%) | 95 (100.0%) |
| 15 Years | 148 (92.5%) | 13 (100.0%) |
| 16 and 17 Years | 67 (100.0%) | 28 (100.0%) |
| 18 to 24 Years | 196 (90.3%) | 132 (73.3%) |
| 25 to 34 Years | 270 (91.2%) | 379 (100.0%) |
| 35 to 44 Years | 512 (96.8%) | 293 (93.3%) |
| 45 to 54 Years | 384 (100.0%) | 418 (97.4%) |
| 55 to 64 Years | 571 (96.6%) | 523 (93.9%) |
| 65 to 74 Years | 486 (99.6%) | 410 (82.5%) |
| 75 Years and over | 195 (74.4%) | 198 (71.5%) |
| Total | 3,443 (95.4%) | 3,295 (91.9%) |
Income Below Poverty Among Married-Couple Families in Crook County
The poverty statistics for married-couple families in Crook County show that 2.9% or 51 of the total 1,738 families live below the poverty line. Families with no children have the highest poverty rate of 3.9%, comprising of 43 families. On the other hand, families with 3 or 4 children have the lowest poverty rate of 0.0%, which includes 0 families.
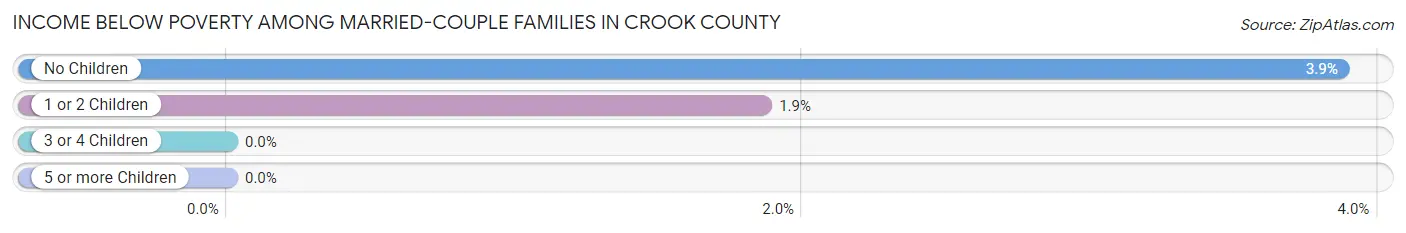
| Children | Above Poverty | Below Poverty |
| No Children | 1,067 (96.1%) | 43 (3.9%) |
| 1 or 2 Children | 422 (98.1%) | 8 (1.9%) |
| 3 or 4 Children | 189 (100.0%) | 0 (0.0%) |
| 5 or more Children | 9 (100.0%) | 0 (0.0%) |
| Total | 1,687 (97.1%) | 51 (2.9%) |
Income Below Poverty Among Single-Parent Households in Crook County
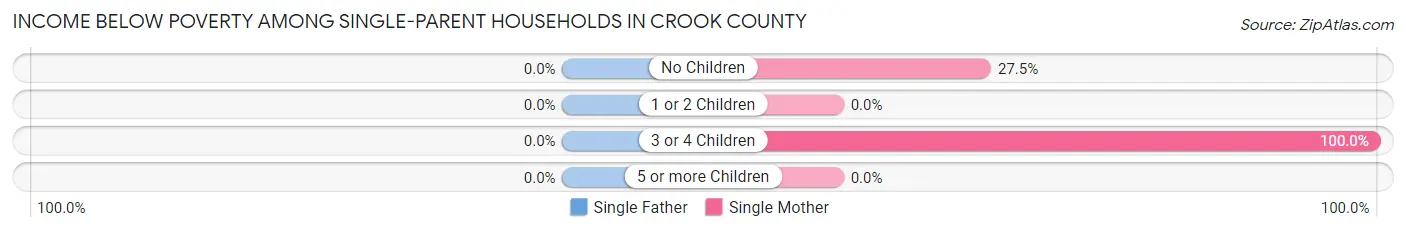
| Children | Single Father | Single Mother |
| No Children | 0 (0.0%) | 14 (27.5%) |
| 1 or 2 Children | 0 (0.0%) | 0 (0.0%) |
| 3 or 4 Children | 0 (0.0%) | 2 (100.0%) |
| 5 or more Children | 0 (0.0%) | 0 (0.0%) |
| Total | 0 (0.0%) | 16 (18.4%) |
Income Below Poverty Among Married-Couple vs Single-Parent Households in Crook County
The poverty data for Crook County shows that 51 of the married-couple family households (2.9%) and 16 of the single-parent households (12.4%) are living below the poverty level. Within the married-couple family households, those with no children have the highest poverty rate, with 43 households (3.9%) falling below the poverty line. Among the single-parent households, those with 3 or 4 children have the highest poverty rate, with 2 household (100.0%) living below poverty.
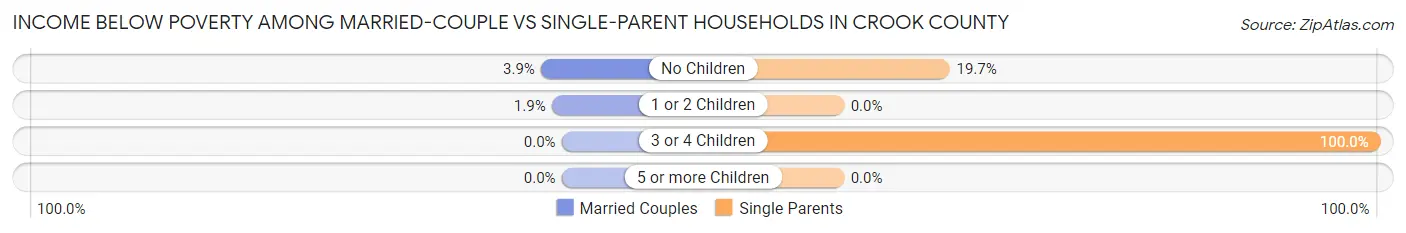
| Children | Married-Couple Families | Single-Parent Households |
| No Children | 43 (3.9%) | 14 (19.7%) |
| 1 or 2 Children | 8 (1.9%) | 0 (0.0%) |
| 3 or 4 Children | 0 (0.0%) | 2 (100.0%) |
| 5 or more Children | 0 (0.0%) | 0 (0.0%) |
| Total | 51 (2.9%) | 16 (12.4%) |
Employment Characteristics in Crook County
Employment by Class of Employer in Crook County
Among the 3,398 employed individuals in Crook County, private company employees (1,955 | 57.5%), local government employees (451 | 13.3%), and self-employed (incorporated) (254 | 7.5%) make up the most common classes of employment.
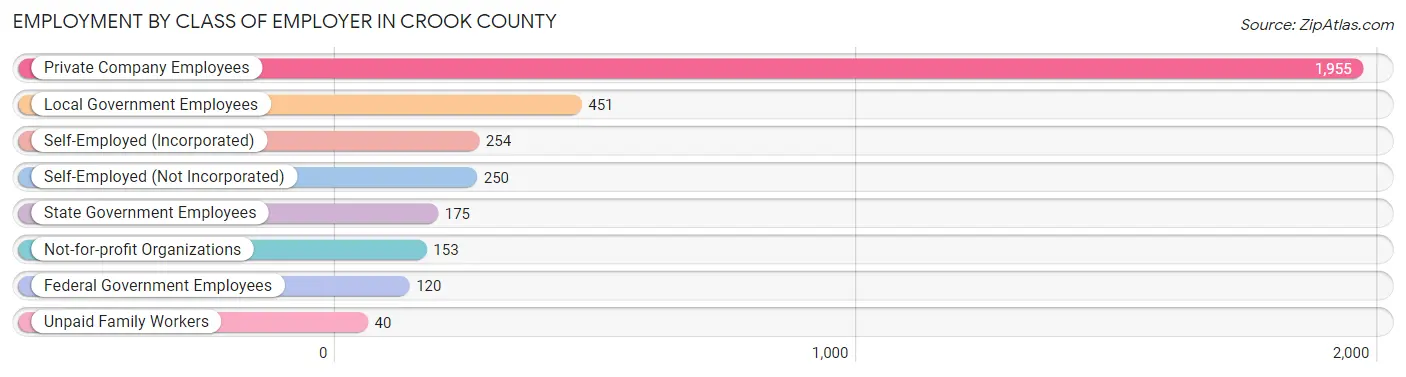
| Employer Class | # Employees | % Employees |
| Private Company Employees | 1,955 | 57.5% |
| Self-Employed (Incorporated) | 254 | 7.5% |
| Self-Employed (Not Incorporated) | 250 | 7.4% |
| Not-for-profit Organizations | 153 | 4.5% |
| Local Government Employees | 451 | 13.3% |
| State Government Employees | 175 | 5.1% |
| Federal Government Employees | 120 | 3.5% |
| Unpaid Family Workers | 40 | 1.2% |
| Total | 3,398 | 100.0% |
Employment Status by Age in Crook County
According to the labor force statistics for Crook County, out of the total population over 16 years of age (5,558), 62.8% or 3,490 individuals are in the labor force, with 1.0% or 35 of them unemployed. The age group with the highest labor force participation rate is 45 to 54 years, with 89.7% or 731 individuals in the labor force. Within the labor force, the 55 to 59 years age range has the highest percentage of unemployed individuals, with 4.7% or 24 of them being unemployed.
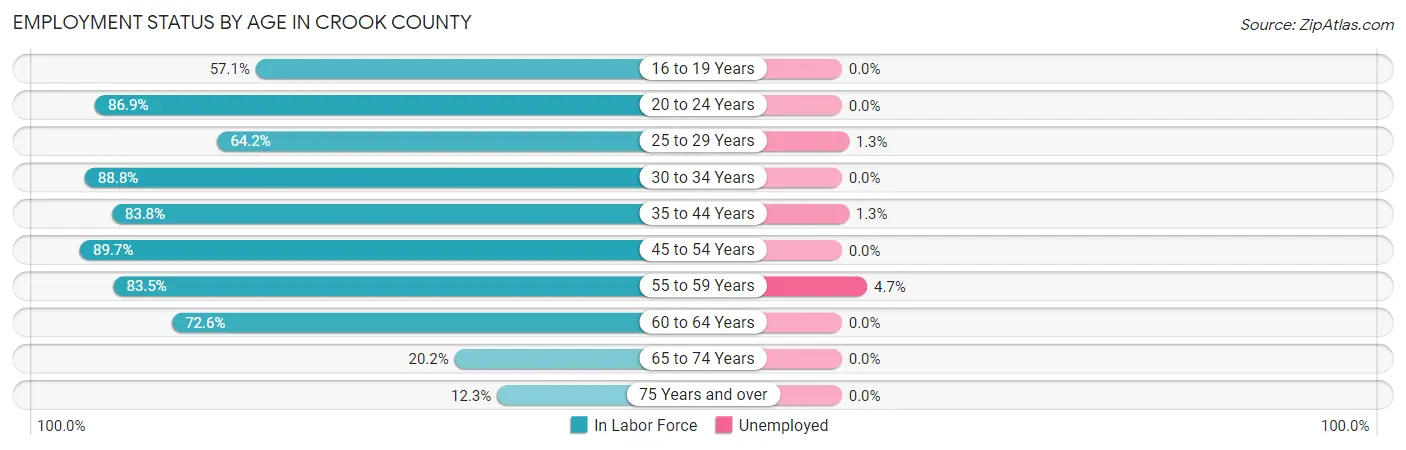
| Age Bracket | In Labor Force | Unemployed |
| 16 to 19 Years | 129 (57.1%) | 0 (0.0%) |
| 20 to 24 Years | 232 (86.9%) | 0 (0.0%) |
| 25 to 29 Years | 228 (64.2%) | 3 (1.3%) |
| 30 to 34 Years | 284 (88.8%) | 0 (0.0%) |
| 35 to 44 Years | 708 (83.8%) | 9 (1.3%) |
| 45 to 54 Years | 731 (89.7%) | 0 (0.0%) |
| 55 to 59 Years | 512 (83.5%) | 24 (4.7%) |
| 60 to 64 Years | 397 (72.6%) | 0 (0.0%) |
| 65 to 74 Years | 202 (20.2%) | 0 (0.0%) |
| 75 Years and over | 70 (12.3%) | 0 (0.0%) |
| Total | 3,490 (62.8%) | 35 (1.0%) |
Employment Status by Educational Attainment in Crook County
According to labor force statistics for Crook County, 81.8% of individuals (2,859) out of the total population between 25 and 64 years of age (3,495) are in the labor force, with 1.3% or 37 of them being unemployed. The group with the highest labor force participation rate are those with the educational attainment of bachelor's degree or higher, with 95.0% or 809 individuals in the labor force. Within the labor force, individuals with college / associate degree education have the highest percentage of unemployment, with 1.9% or 24 of them being unemployed.
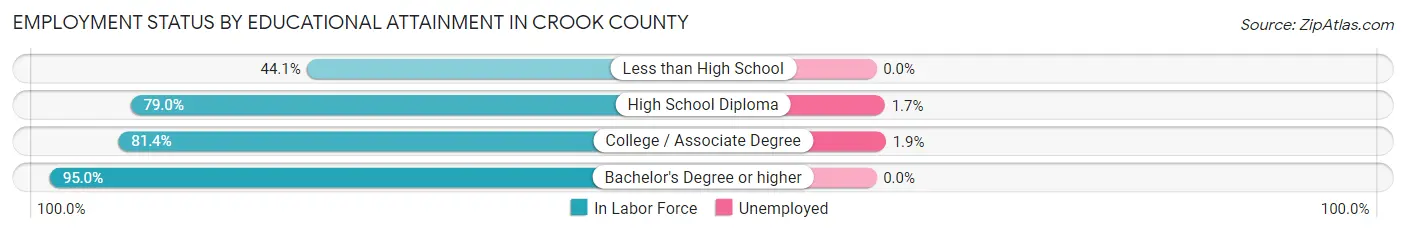
| Educational Attainment | In Labor Force | Unemployed |
| Less than High School | 93 (44.1%) | 0 (0.0%) |
| High School Diploma | 712 (79.0%) | 15 (1.7%) |
| College / Associate Degree | 1,246 (81.4%) | 29 (1.9%) |
| Bachelor's Degree or higher | 809 (95.0%) | 0 (0.0%) |
| Total | 2,859 (81.8%) | 45 (1.3%) |
Employment Occupations by Sex in Crook County
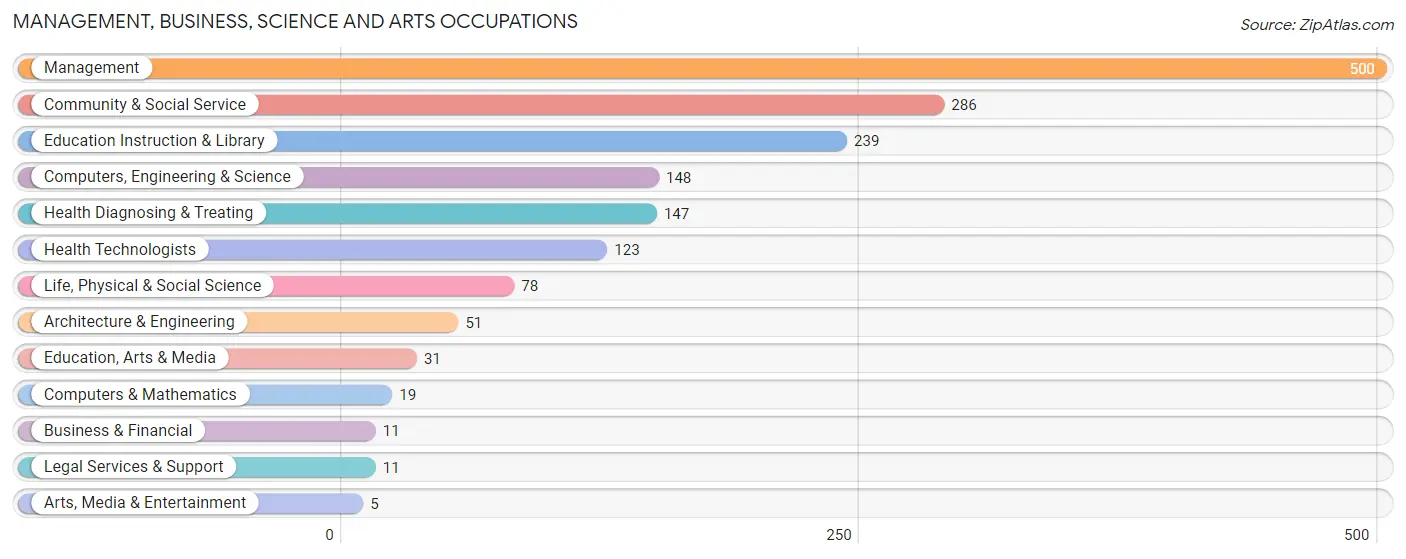
Management, Business, Science and Arts Occupations
The most common Management, Business, Science and Arts occupations in Crook County are Management (500 | 14.5%), Community & Social Service (286 | 8.3%), Education Instruction & Library (239 | 6.9%), Computers, Engineering & Science (148 | 4.3%), and Health Diagnosing & Treating (147 | 4.3%).
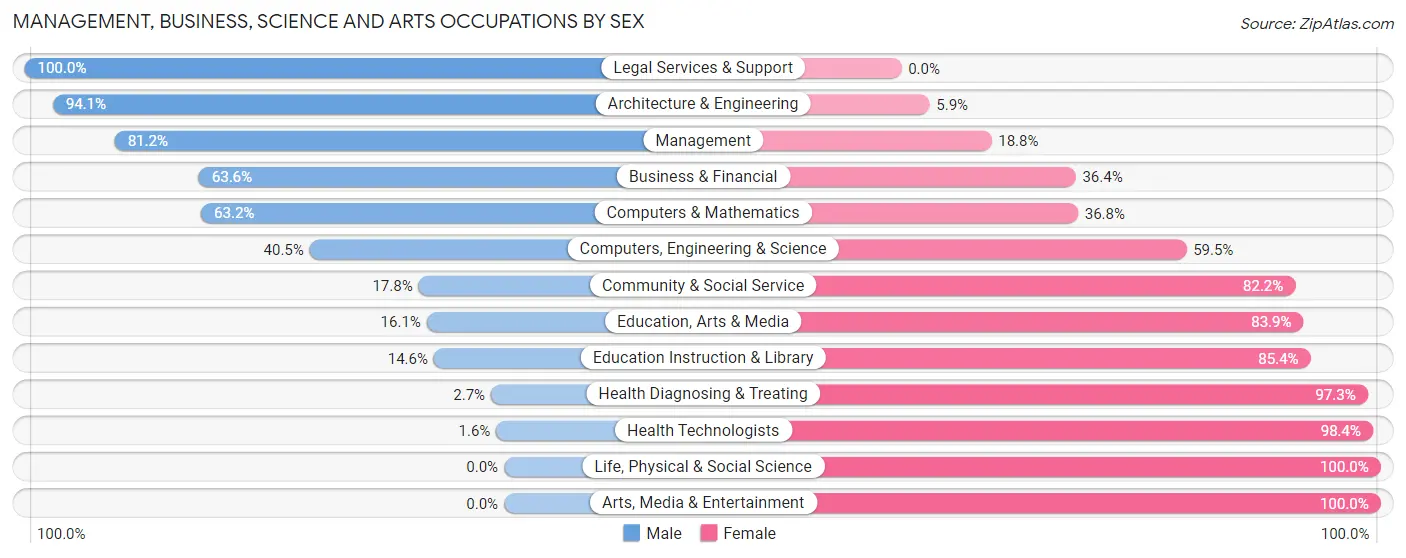
Management, Business, Science and Arts Occupations by Sex
Within the Management, Business, Science and Arts occupations in Crook County, the most male-oriented occupations are Legal Services & Support (100.0%), Architecture & Engineering (94.1%), and Management (81.2%), while the most female-oriented occupations are Life, Physical & Social Science (100.0%), Arts, Media & Entertainment (100.0%), and Health Technologists (98.4%).
| Occupation | Male | Female |
| Management | 406 (81.2%) | 94 (18.8%) |
| Business & Financial | 7 (63.6%) | 4 (36.4%) |
| Computers, Engineering & Science | 60 (40.5%) | 88 (59.5%) |
| Computers & Mathematics | 12 (63.2%) | 7 (36.8%) |
| Architecture & Engineering | 48 (94.1%) | 3 (5.9%) |
| Life, Physical & Social Science | 0 (0.0%) | 78 (100.0%) |
| Community & Social Service | 51 (17.8%) | 235 (82.2%) |
| Education, Arts & Media | 5 (16.1%) | 26 (83.9%) |
| Legal Services & Support | 11 (100.0%) | 0 (0.0%) |
| Education Instruction & Library | 35 (14.6%) | 204 (85.4%) |
| Arts, Media & Entertainment | 0 (0.0%) | 5 (100.0%) |
| Health Diagnosing & Treating | 4 (2.7%) | 143 (97.3%) |
| Health Technologists | 2 (1.6%) | 121 (98.4%) |
| Total (Category) | 528 (48.3%) | 564 (51.6%) |
| Total (Overall) | 2,029 (58.7%) | 1,428 (41.3%) |
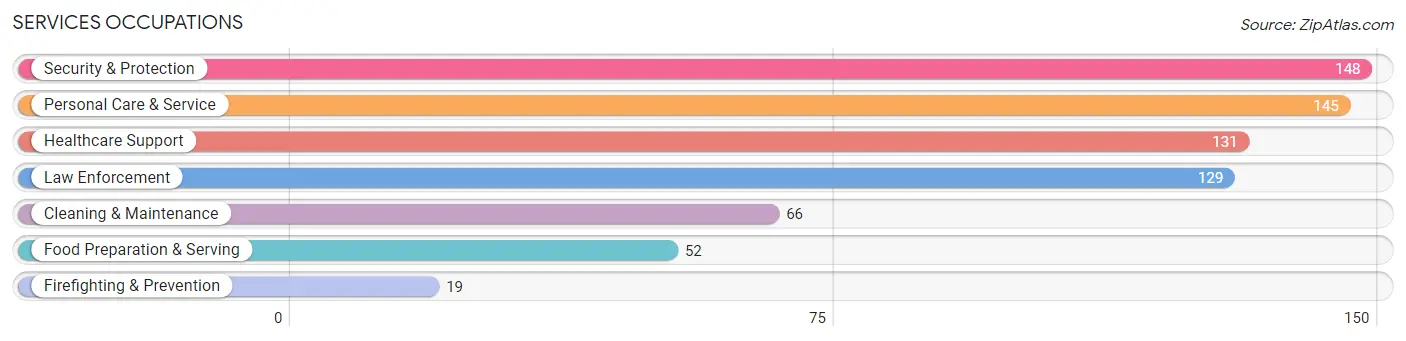
Services Occupations
The most common Services occupations in Crook County are Security & Protection (148 | 4.3%), Personal Care & Service (145 | 4.2%), Healthcare Support (131 | 3.8%), Law Enforcement (129 | 3.7%), and Cleaning & Maintenance (66 | 1.9%).
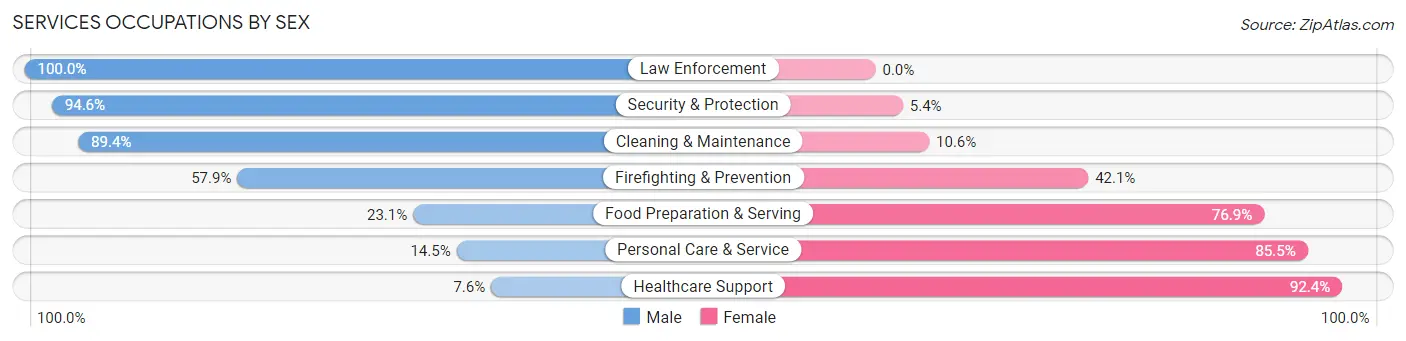
Services Occupations by Sex
Within the Services occupations in Crook County, the most male-oriented occupations are Law Enforcement (100.0%), Security & Protection (94.6%), and Cleaning & Maintenance (89.4%), while the most female-oriented occupations are Healthcare Support (92.4%), Personal Care & Service (85.5%), and Food Preparation & Serving (76.9%).
| Occupation | Male | Female |
| Healthcare Support | 10 (7.6%) | 121 (92.4%) |
| Security & Protection | 140 (94.6%) | 8 (5.4%) |
| Firefighting & Prevention | 11 (57.9%) | 8 (42.1%) |
| Law Enforcement | 129 (100.0%) | 0 (0.0%) |
| Food Preparation & Serving | 12 (23.1%) | 40 (76.9%) |
| Cleaning & Maintenance | 59 (89.4%) | 7 (10.6%) |
| Personal Care & Service | 21 (14.5%) | 124 (85.5%) |
| Total (Category) | 242 (44.7%) | 300 (55.3%) |
| Total (Overall) | 2,029 (58.7%) | 1,428 (41.3%) |
Sales and Office Occupations
The most common Sales and Office occupations in Crook County are Office & Administration (305 | 8.8%), and Sales & Related (205 | 5.9%).

Sales and Office Occupations by Sex

| Occupation | Male | Female |
| Sales & Related | 29 (14.1%) | 176 (85.9%) |
| Office & Administration | 15 (4.9%) | 290 (95.1%) |
| Total (Category) | 44 (8.6%) | 466 (91.4%) |
| Total (Overall) | 2,029 (58.7%) | 1,428 (41.3%) |
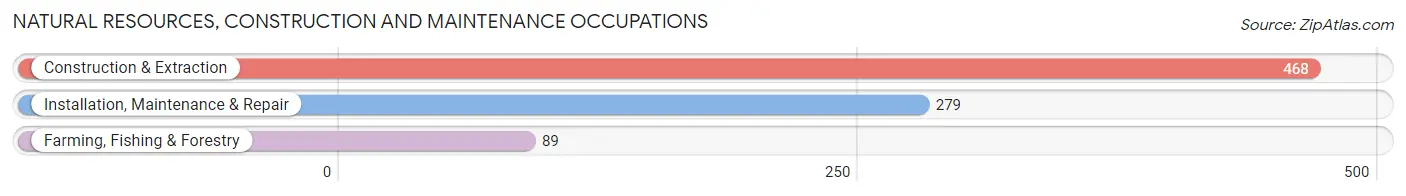
Natural Resources, Construction and Maintenance Occupations
The most common Natural Resources, Construction and Maintenance occupations in Crook County are Construction & Extraction (468 | 13.5%), Installation, Maintenance & Repair (279 | 8.1%), and Farming, Fishing & Forestry (89 | 2.6%).
Natural Resources, Construction and Maintenance Occupations by Sex
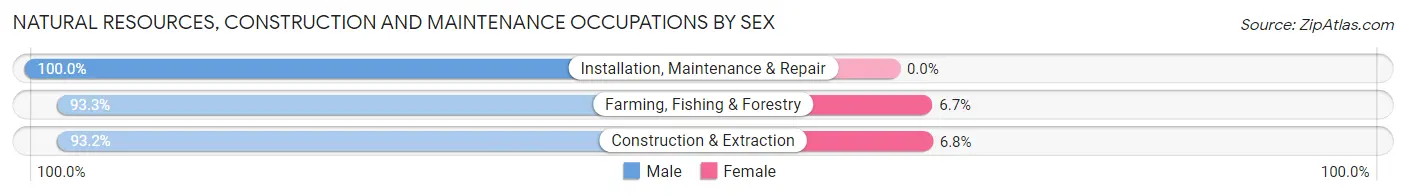
| Occupation | Male | Female |
| Farming, Fishing & Forestry | 83 (93.3%) | 6 (6.7%) |
| Construction & Extraction | 436 (93.2%) | 32 (6.8%) |
| Installation, Maintenance & Repair | 279 (100.0%) | 0 (0.0%) |
| Total (Category) | 798 (95.5%) | 38 (4.5%) |
| Total (Overall) | 2,029 (58.7%) | 1,428 (41.3%) |
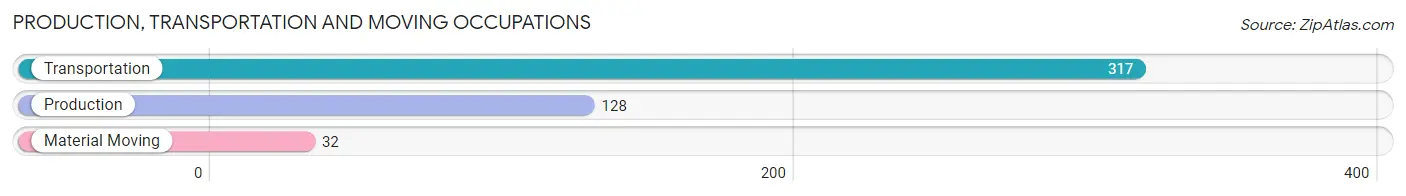
Production, Transportation and Moving Occupations
The most common Production, Transportation and Moving occupations in Crook County are Transportation (317 | 9.2%), Production (128 | 3.7%), and Material Moving (32 | 0.9%).
Production, Transportation and Moving Occupations by Sex
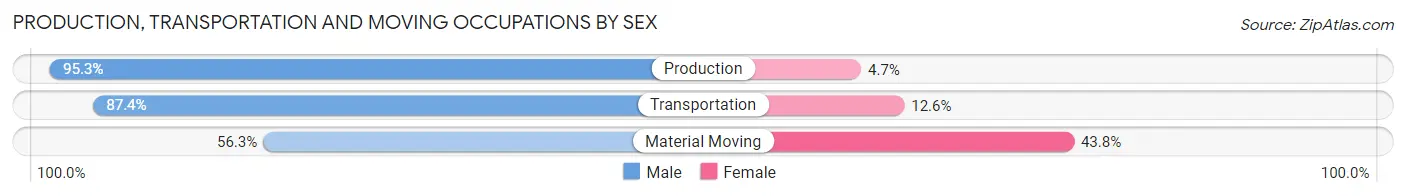
| Occupation | Male | Female |
| Production | 122 (95.3%) | 6 (4.7%) |
| Transportation | 277 (87.4%) | 40 (12.6%) |
| Material Moving | 18 (56.2%) | 14 (43.8%) |
| Total (Category) | 417 (87.4%) | 60 (12.6%) |
| Total (Overall) | 2,029 (58.7%) | 1,428 (41.3%) |
Employment Industries by Sex in Crook County
Employment Industries in Crook County
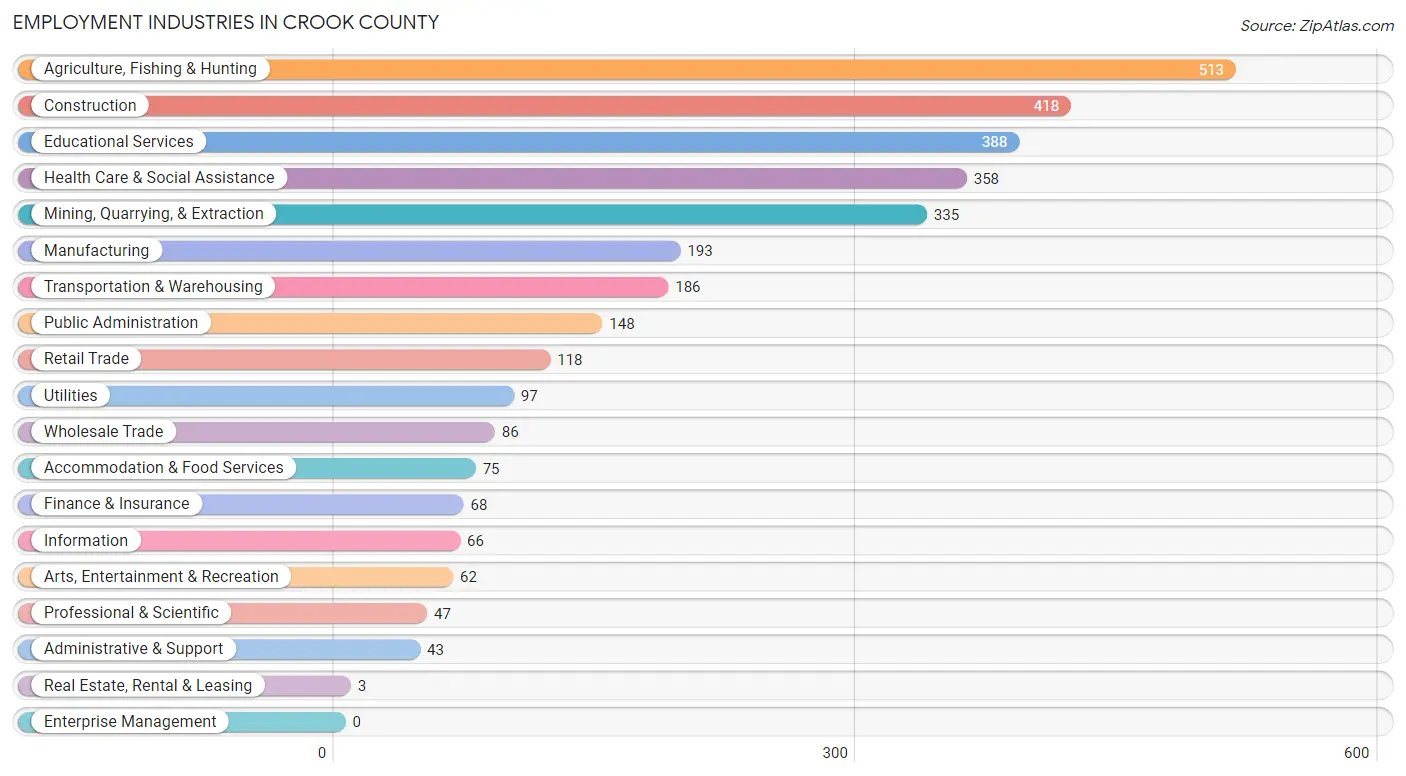
The major employment industries in Crook County include Agriculture, Fishing & Hunting (513 | 14.8%), Construction (418 | 12.1%), Educational Services (388 | 11.2%), Health Care & Social Assistance (358 | 10.4%), and Mining, Quarrying, & Extraction (335 | 9.7%).
Employment Industries by Sex in Crook County
The Crook County industries that see more men than women are Construction (96.2%), Mining, Quarrying, & Extraction (91.9%), and Utilities (89.7%), whereas the industries that tend to have a higher number of women are Real Estate, Rental & Leasing (100.0%), Wholesale Trade (97.7%), and Finance & Insurance (89.7%).
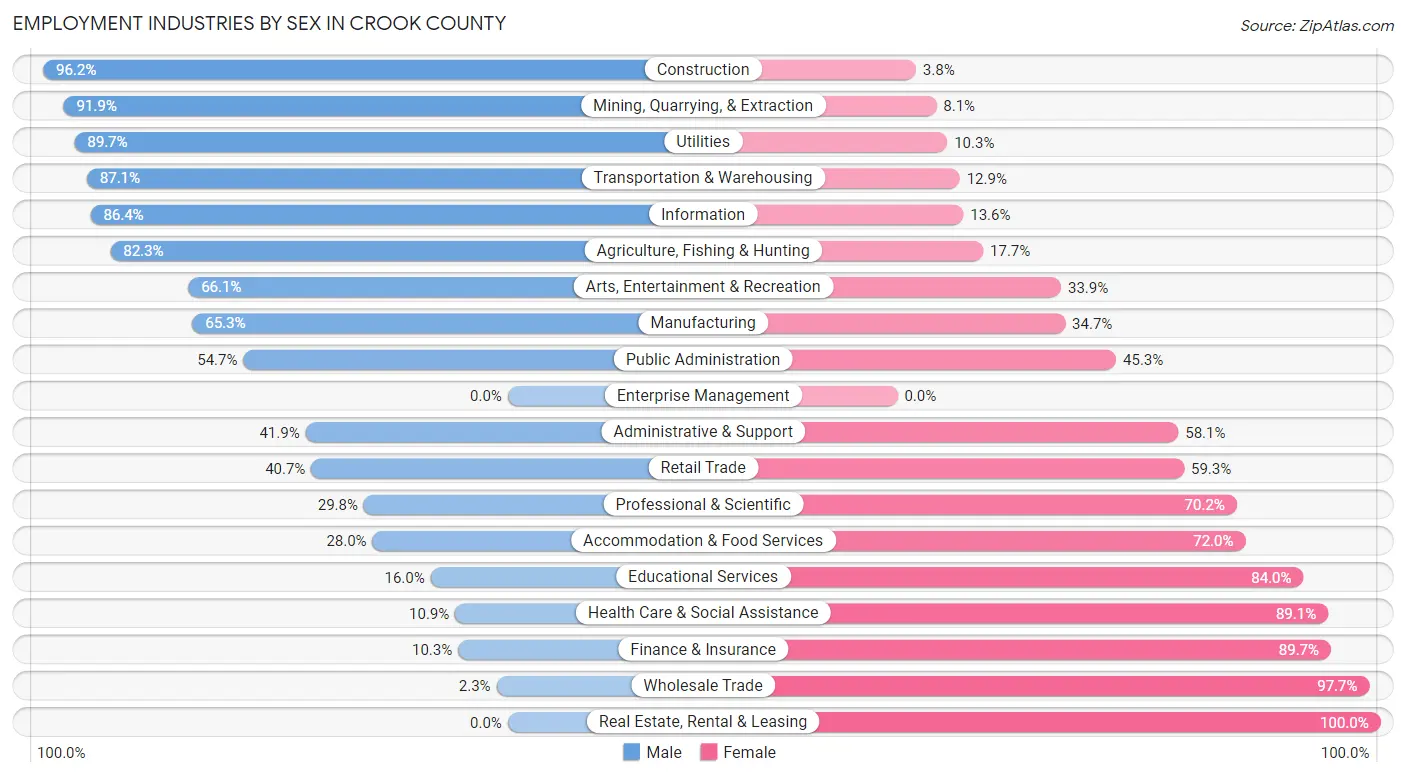
| Industry | Male | Female |
| Agriculture, Fishing & Hunting | 422 (82.3%) | 91 (17.7%) |
| Mining, Quarrying, & Extraction | 308 (91.9%) | 27 (8.1%) |
| Construction | 402 (96.2%) | 16 (3.8%) |
| Manufacturing | 126 (65.3%) | 67 (34.7%) |
| Wholesale Trade | 2 (2.3%) | 84 (97.7%) |
| Retail Trade | 48 (40.7%) | 70 (59.3%) |
| Transportation & Warehousing | 162 (87.1%) | 24 (12.9%) |
| Utilities | 87 (89.7%) | 10 (10.3%) |
| Information | 57 (86.4%) | 9 (13.6%) |
| Finance & Insurance | 7 (10.3%) | 61 (89.7%) |
| Real Estate, Rental & Leasing | 0 (0.0%) | 3 (100.0%) |
| Professional & Scientific | 14 (29.8%) | 33 (70.2%) |
| Enterprise Management | 0 (0.0%) | 0 (0.0%) |
| Administrative & Support | 18 (41.9%) | 25 (58.1%) |
| Educational Services | 62 (16.0%) | 326 (84.0%) |
| Health Care & Social Assistance | 39 (10.9%) | 319 (89.1%) |
| Arts, Entertainment & Recreation | 41 (66.1%) | 21 (33.9%) |
| Accommodation & Food Services | 21 (28.0%) | 54 (72.0%) |
| Public Administration | 81 (54.7%) | 67 (45.3%) |
| Total | 2,029 (58.7%) | 1,428 (41.3%) |
Education in Crook County
School Enrollment in Crook County
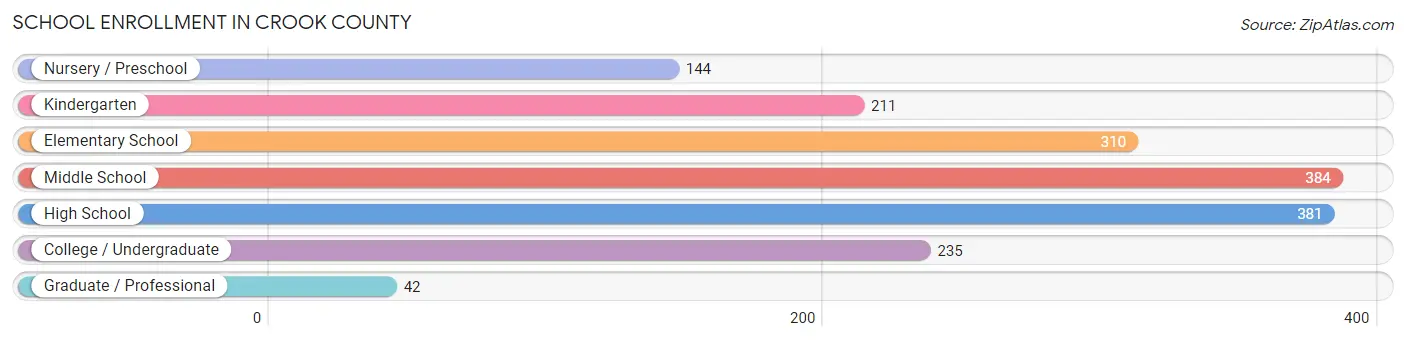
The most common levels of schooling among the 1,707 students in Crook County are middle school (384 | 22.5%), high school (381 | 22.3%), and elementary school (310 | 18.2%).
| School Level | # Students | % Students |
| Nursery / Preschool | 144 | 8.4% |
| Kindergarten | 211 | 12.4% |
| Elementary School | 310 | 18.2% |
| Middle School | 384 | 22.5% |
| High School | 381 | 22.3% |
| College / Undergraduate | 235 | 13.8% |
| Graduate / Professional | 42 | 2.5% |
| Total | 1,707 | 100.0% |
School Enrollment by Age by Funding Source in Crook County
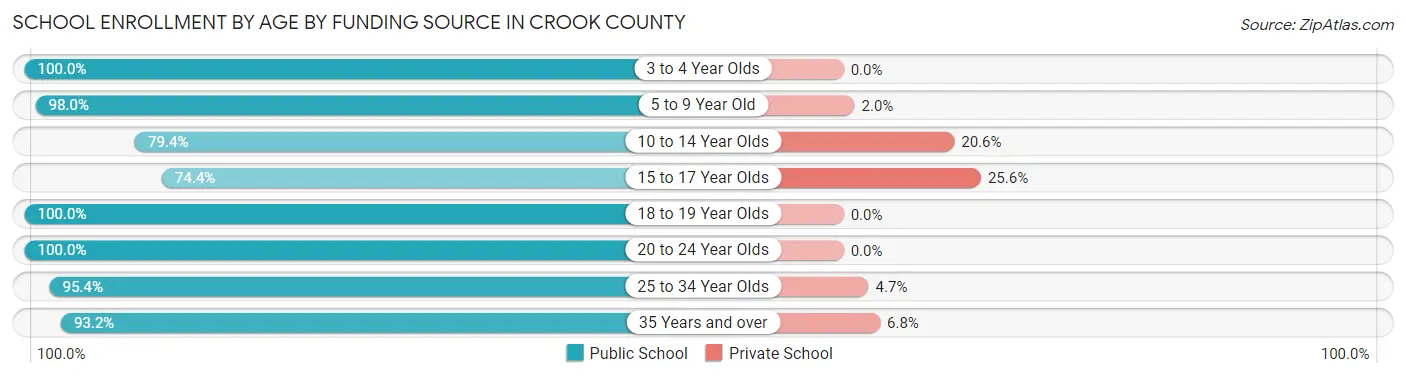
Out of a total of 1,707 students who are enrolled in schools in Crook County, 183 (10.7%) attend a private institution, while the remaining 1,524 (89.3%) are enrolled in public schools. The age group of 15 to 17 year olds has the highest likelihood of being enrolled in private schools, with 66 (25.6% in the age bracket) enrolled. Conversely, the age group of 3 to 4 year olds has the lowest likelihood of being enrolled in a private school, with 59 (100.0% in the age bracket) attending a public institution.
| Age Bracket | Public School | Private School |
| 3 to 4 Year Olds | 59 (100.0%) | 0 (0.0%) |
| 5 to 9 Year Old | 529 (98.0%) | 11 (2.0%) |
| 10 to 14 Year Olds | 370 (79.4%) | 96 (20.6%) |
| 15 to 17 Year Olds | 192 (74.4%) | 66 (25.6%) |
| 18 to 19 Year Olds | 114 (100.0%) | 0 (0.0%) |
| 20 to 24 Year Olds | 109 (100.0%) | 0 (0.0%) |
| 25 to 34 Year Olds | 41 (95.4%) | 2 (4.6%) |
| 35 Years and over | 110 (93.2%) | 8 (6.8%) |
| Total | 1,524 (89.3%) | 183 (10.7%) |
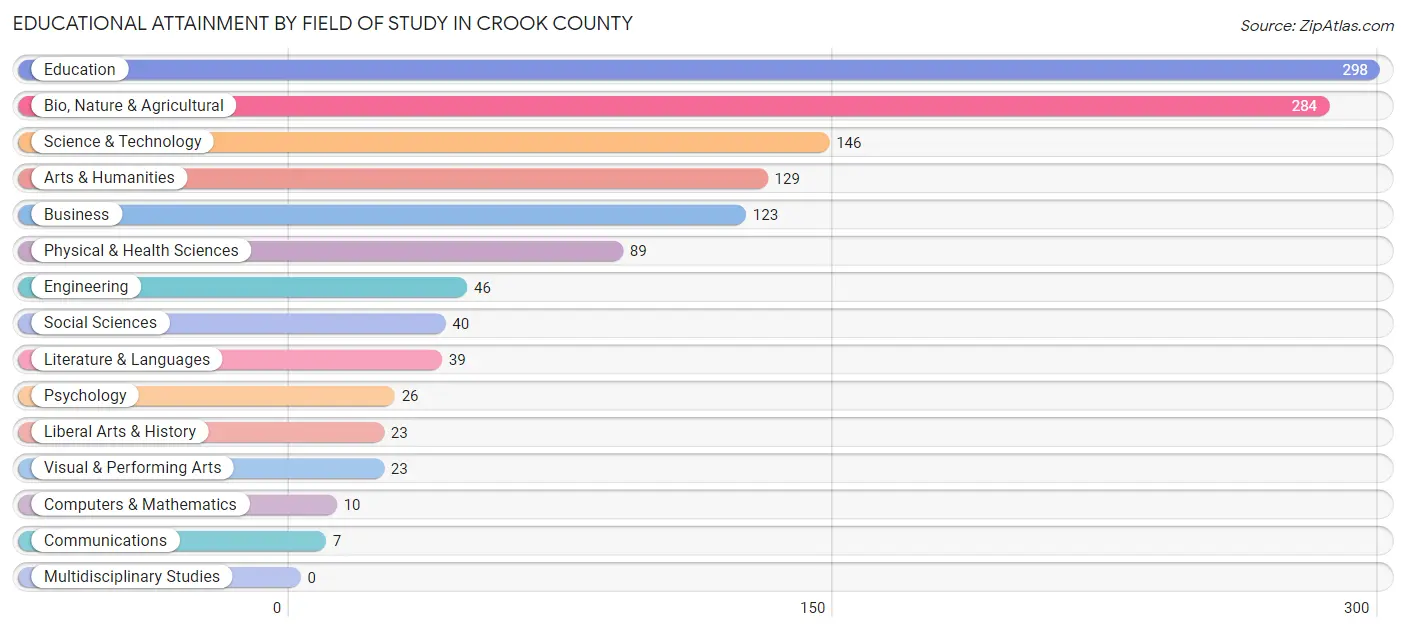
Educational Attainment by Field of Study in Crook County
Education (298 | 23.2%), bio, nature & agricultural (284 | 22.1%), science & technology (146 | 11.4%), arts & humanities (129 | 10.1%), and business (123 | 9.6%) are the most common fields of study among 1,283 individuals in Crook County who have obtained a bachelor's degree or higher.
| Field of Study | # Graduates | % Graduates |
| Computers & Mathematics | 10 | 0.8% |
| Bio, Nature & Agricultural | 284 | 22.1% |
| Physical & Health Sciences | 89 | 6.9% |
| Psychology | 26 | 2.0% |
| Social Sciences | 40 | 3.1% |
| Engineering | 46 | 3.6% |
| Multidisciplinary Studies | 0 | 0.0% |
| Science & Technology | 146 | 11.4% |
| Business | 123 | 9.6% |
| Education | 298 | 23.2% |
| Literature & Languages | 39 | 3.0% |
| Liberal Arts & History | 23 | 1.8% |
| Visual & Performing Arts | 23 | 1.8% |
| Communications | 7 | 0.5% |
| Arts & Humanities | 129 | 10.1% |
| Total | 1,283 | 100.0% |
Transportation & Commute in Crook County
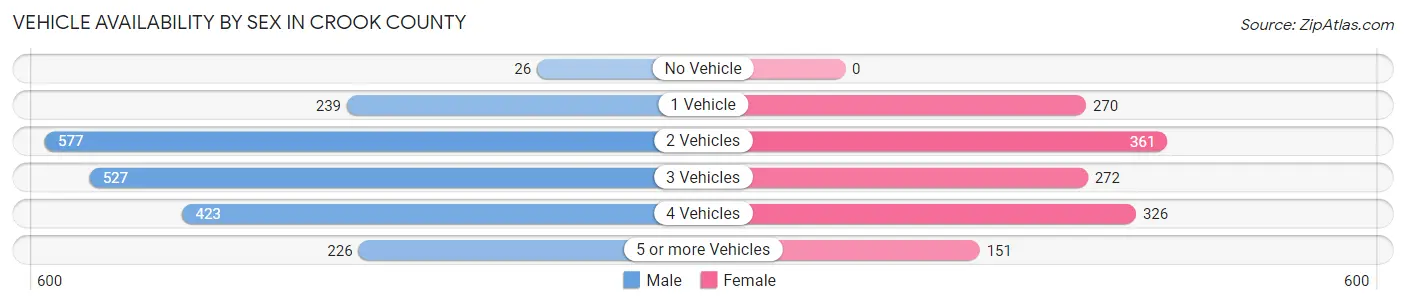
Vehicle Availability by Sex in Crook County
The most prevalent vehicle ownership categories in Crook County are males with 2 vehicles (577, accounting for 28.6%) and females with 2 vehicles (361, making up 41.8%).
| Vehicles Available | Male | Female |
| No Vehicle | 26 (1.3%) | 0 (0.0%) |
| 1 Vehicle | 239 (11.8%) | 270 (19.6%) |
| 2 Vehicles | 577 (28.6%) | 361 (26.2%) |
| 3 Vehicles | 527 (26.1%) | 272 (19.7%) |
| 4 Vehicles | 423 (21.0%) | 326 (23.6%) |
| 5 or more Vehicles | 226 (11.2%) | 151 (10.9%) |
| Total | 2,018 (100.0%) | 1,380 (100.0%) |
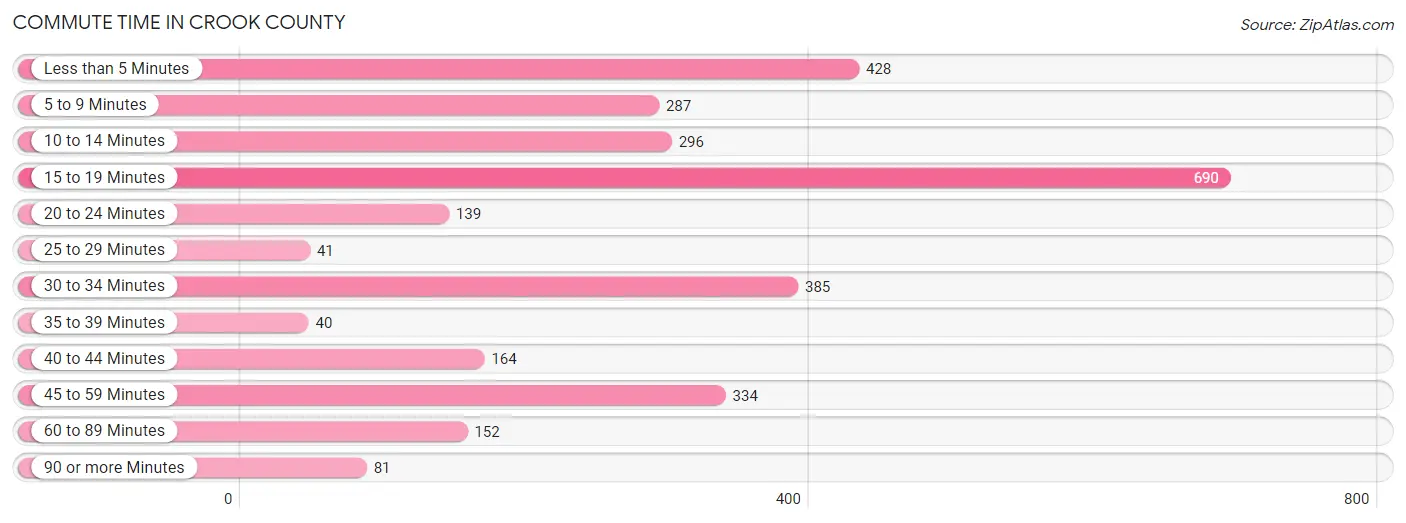
Commute Time in Crook County
The most frequently occuring commute durations in Crook County are 15 to 19 minutes (690 commuters, 22.7%), less than 5 minutes (428 commuters, 14.1%), and 30 to 34 minutes (385 commuters, 12.7%).
| Commute Time | # Commuters | % Commuters |
| Less than 5 Minutes | 428 | 14.1% |
| 5 to 9 Minutes | 287 | 9.5% |
| 10 to 14 Minutes | 296 | 9.8% |
| 15 to 19 Minutes | 690 | 22.7% |
| 20 to 24 Minutes | 139 | 4.6% |
| 25 to 29 Minutes | 41 | 1.3% |
| 30 to 34 Minutes | 385 | 12.7% |
| 35 to 39 Minutes | 40 | 1.3% |
| 40 to 44 Minutes | 164 | 5.4% |
| 45 to 59 Minutes | 334 | 11.0% |
| 60 to 89 Minutes | 152 | 5.0% |
| 90 or more Minutes | 81 | 2.7% |
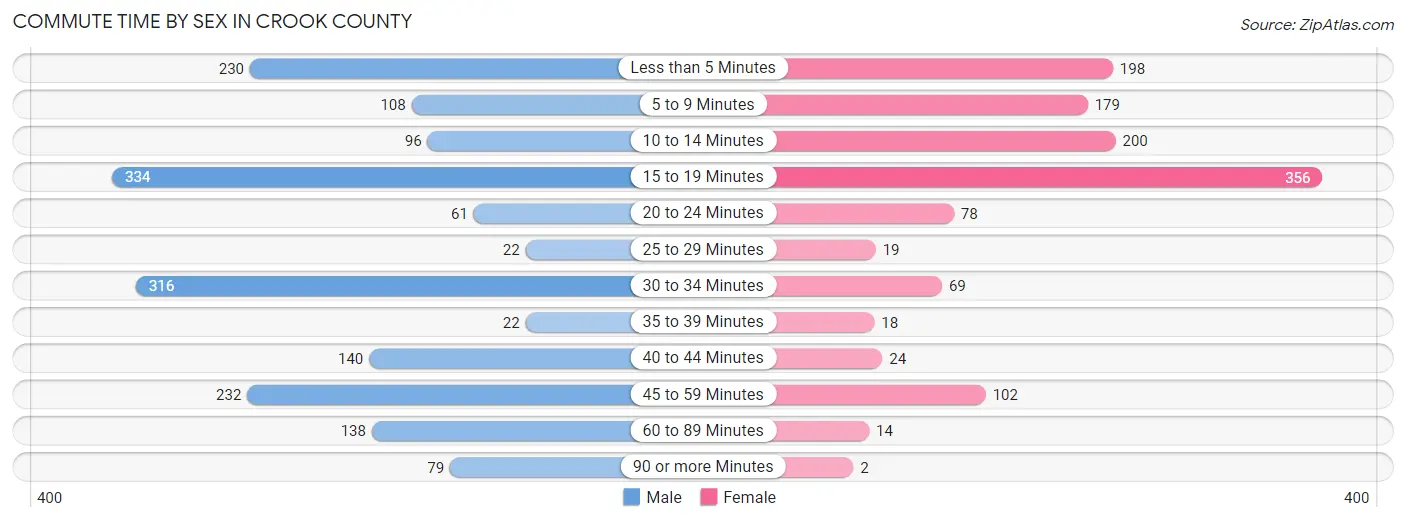
Commute Time by Sex in Crook County
The most common commute times in Crook County are 15 to 19 minutes (334 commuters, 18.8%) for males and 15 to 19 minutes (356 commuters, 28.3%) for females.
| Commute Time | Male | Female |
| Less than 5 Minutes | 230 (12.9%) | 198 (15.7%) |
| 5 to 9 Minutes | 108 (6.1%) | 179 (14.2%) |
| 10 to 14 Minutes | 96 (5.4%) | 200 (15.9%) |
| 15 to 19 Minutes | 334 (18.8%) | 356 (28.3%) |
| 20 to 24 Minutes | 61 (3.4%) | 78 (6.2%) |
| 25 to 29 Minutes | 22 (1.2%) | 19 (1.5%) |
| 30 to 34 Minutes | 316 (17.8%) | 69 (5.5%) |
| 35 to 39 Minutes | 22 (1.2%) | 18 (1.4%) |
| 40 to 44 Minutes | 140 (7.9%) | 24 (1.9%) |
| 45 to 59 Minutes | 232 (13.1%) | 102 (8.1%) |
| 60 to 89 Minutes | 138 (7.8%) | 14 (1.1%) |
| 90 or more Minutes | 79 (4.4%) | 2 (0.2%) |
Time of Departure to Work by Sex in Crook County
The most frequent times of departure to work in Crook County are 7:00 AM to 7:29 AM (383, 21.5%) for males and 7:00 AM to 7:29 AM (344, 27.3%) for females.
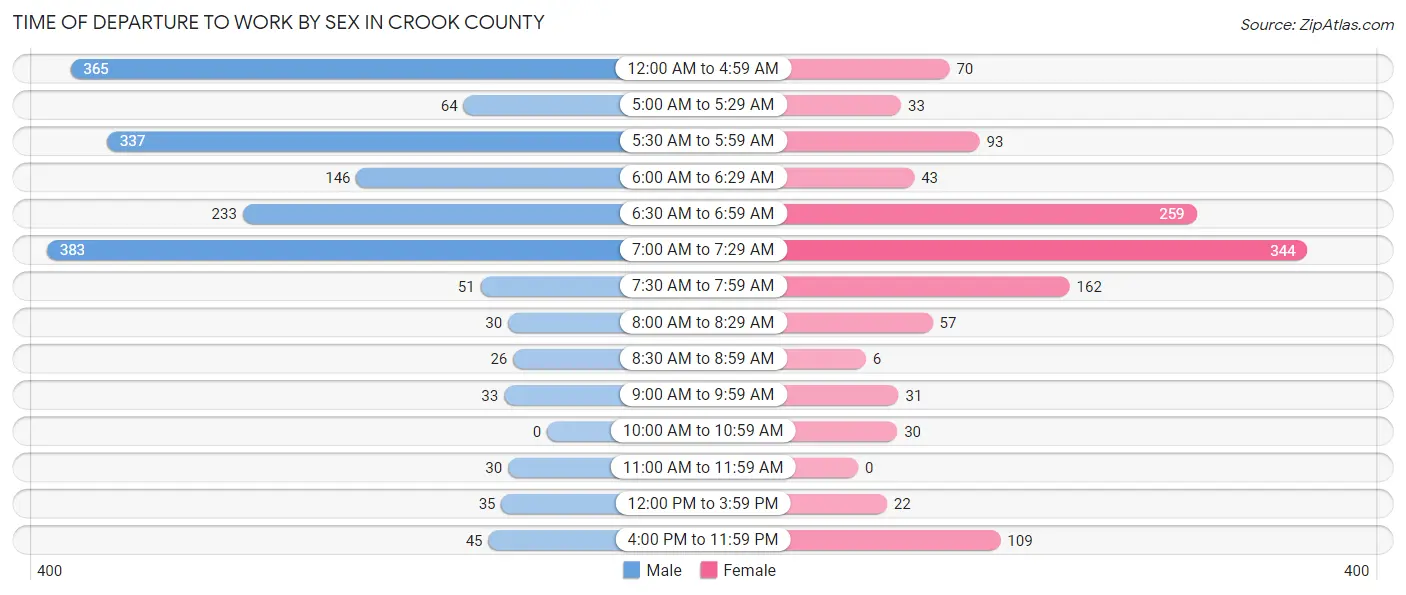
| Time of Departure | Male | Female |
| 12:00 AM to 4:59 AM | 365 (20.5%) | 70 (5.6%) |
| 5:00 AM to 5:29 AM | 64 (3.6%) | 33 (2.6%) |
| 5:30 AM to 5:59 AM | 337 (19.0%) | 93 (7.4%) |
| 6:00 AM to 6:29 AM | 146 (8.2%) | 43 (3.4%) |
| 6:30 AM to 6:59 AM | 233 (13.1%) | 259 (20.6%) |
| 7:00 AM to 7:29 AM | 383 (21.5%) | 344 (27.3%) |
| 7:30 AM to 7:59 AM | 51 (2.9%) | 162 (12.9%) |
| 8:00 AM to 8:29 AM | 30 (1.7%) | 57 (4.5%) |
| 8:30 AM to 8:59 AM | 26 (1.5%) | 6 (0.5%) |
| 9:00 AM to 9:59 AM | 33 (1.9%) | 31 (2.5%) |
| 10:00 AM to 10:59 AM | 0 (0.0%) | 30 (2.4%) |
| 11:00 AM to 11:59 AM | 30 (1.7%) | 0 (0.0%) |
| 12:00 PM to 3:59 PM | 35 (2.0%) | 22 (1.8%) |
| 4:00 PM to 11:59 PM | 45 (2.5%) | 109 (8.7%) |
| Total | 1,778 (100.0%) | 1,259 (100.0%) |
Housing Occupancy in Crook County
Occupancy by Ownership in Crook County
Of the total 2,755 dwellings in Crook County, owner-occupied units account for 2,159 (78.4%), while renter-occupied units make up 596 (21.6%).
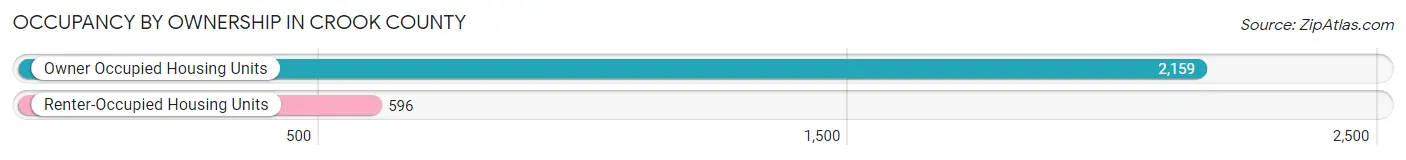
| Occupancy | # Housing Units | % Housing Units |
| Owner Occupied Housing Units | 2,159 | 78.4% |
| Renter-Occupied Housing Units | 596 | 21.6% |
| Total Occupied Housing Units | 2,755 | 100.0% |
Occupancy by Household Size in Crook County
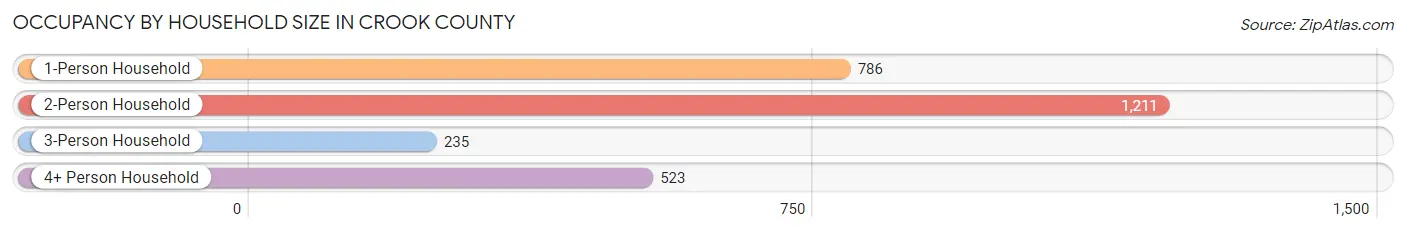
| Household Size | # Housing Units | % Housing Units |
| 1-Person Household | 786 | 28.5% |
| 2-Person Household | 1,211 | 44.0% |
| 3-Person Household | 235 | 8.5% |
| 4+ Person Household | 523 | 19.0% |
| Total Housing Units | 2,755 | 100.0% |
Occupancy by Ownership by Household Size in Crook County
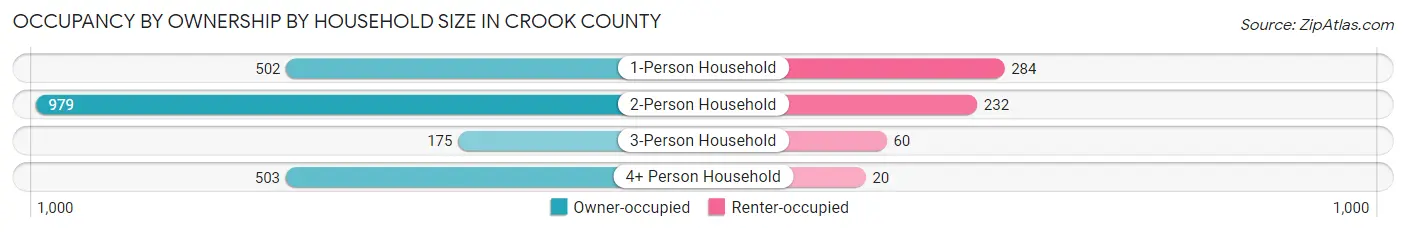
| Household Size | Owner-occupied | Renter-occupied |
| 1-Person Household | 502 (63.9%) | 284 (36.1%) |
| 2-Person Household | 979 (80.8%) | 232 (19.2%) |
| 3-Person Household | 175 (74.5%) | 60 (25.5%) |
| 4+ Person Household | 503 (96.2%) | 20 (3.8%) |
| Total Housing Units | 2,159 (78.4%) | 596 (21.6%) |
Occupancy by Educational Attainment in Crook County
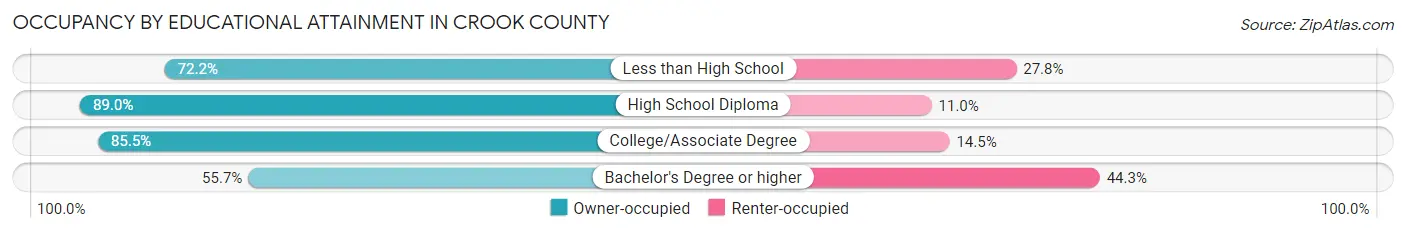
| Household Size | Owner-occupied | Renter-occupied |
| Less than High School | 52 (72.2%) | 20 (27.8%) |
| High School Diploma | 664 (89.0%) | 82 (11.0%) |
| College/Associate Degree | 1,046 (85.5%) | 178 (14.5%) |
| Bachelor's Degree or higher | 397 (55.7%) | 316 (44.3%) |
Occupancy by Age of Householder in Crook County
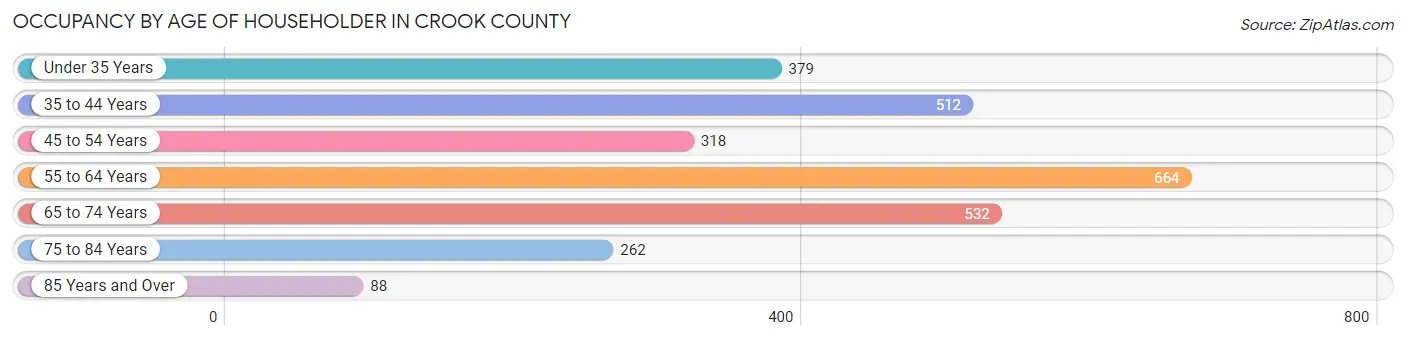
| Age Bracket | # Households | % Households |
| Under 35 Years | 379 | 13.8% |
| 35 to 44 Years | 512 | 18.6% |
| 45 to 54 Years | 318 | 11.5% |
| 55 to 64 Years | 664 | 24.1% |
| 65 to 74 Years | 532 | 19.3% |
| 75 to 84 Years | 262 | 9.5% |
| 85 Years and Over | 88 | 3.2% |
| Total | 2,755 | 100.0% |
Housing Finances in Crook County
Median Income by Occupancy in Crook County
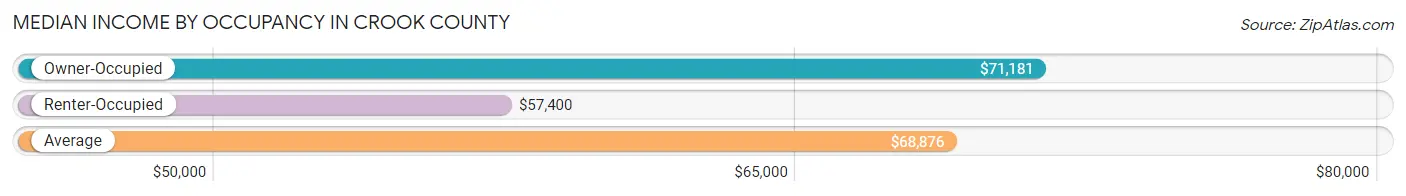
| Occupancy Type | # Households | Median Income |
| Owner-Occupied | 2,159 (78.4%) | $71,181 |
| Renter-Occupied | 596 (21.6%) | $57,400 |
| Average | 2,755 (100.0%) | $68,876 |
Occupancy by Householder Income Bracket in Crook County
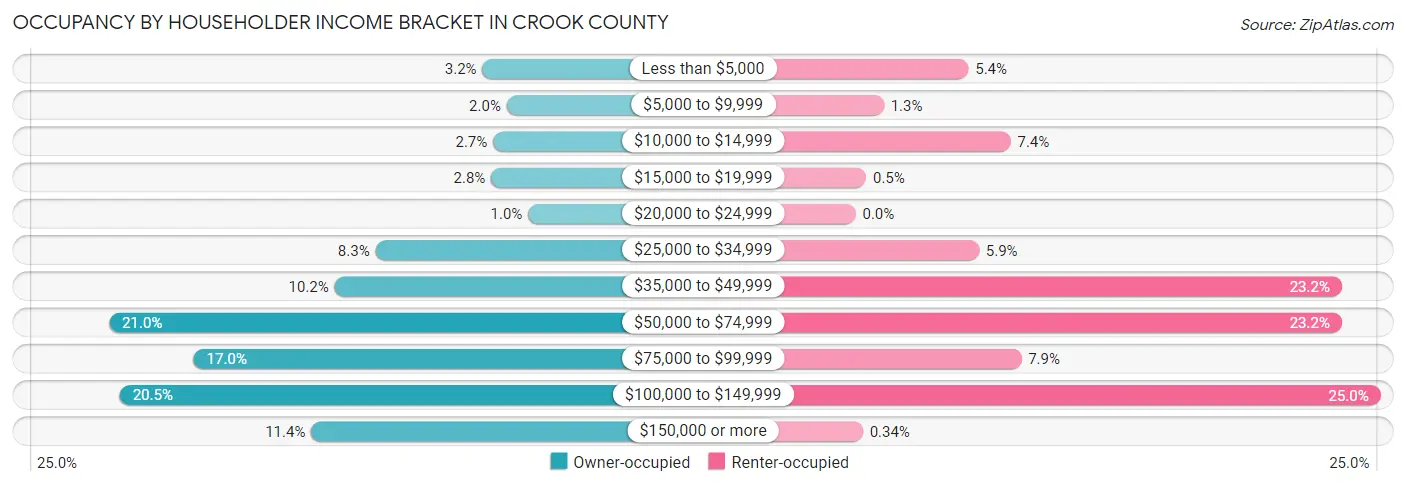
| Income Bracket | Owner-occupied | Renter-occupied |
| Less than $5,000 | 69 (3.2%) | 32 (5.4%) |
| $5,000 to $9,999 | 44 (2.0%) | 8 (1.3%) |
| $10,000 to $14,999 | 58 (2.7%) | 44 (7.4%) |
| $15,000 to $19,999 | 60 (2.8%) | 3 (0.5%) |
| $20,000 to $24,999 | 22 (1.0%) | 0 (0.0%) |
| $25,000 to $34,999 | 179 (8.3%) | 35 (5.9%) |
| $35,000 to $49,999 | 221 (10.2%) | 138 (23.2%) |
| $50,000 to $74,999 | 453 (21.0%) | 138 (23.2%) |
| $75,000 to $99,999 | 366 (17.0%) | 47 (7.9%) |
| $100,000 to $149,999 | 442 (20.5%) | 149 (25.0%) |
| $150,000 or more | 245 (11.4%) | 2 (0.3%) |
| Total | 2,159 (100.0%) | 596 (100.0%) |
Monthly Housing Cost Tiers in Crook County
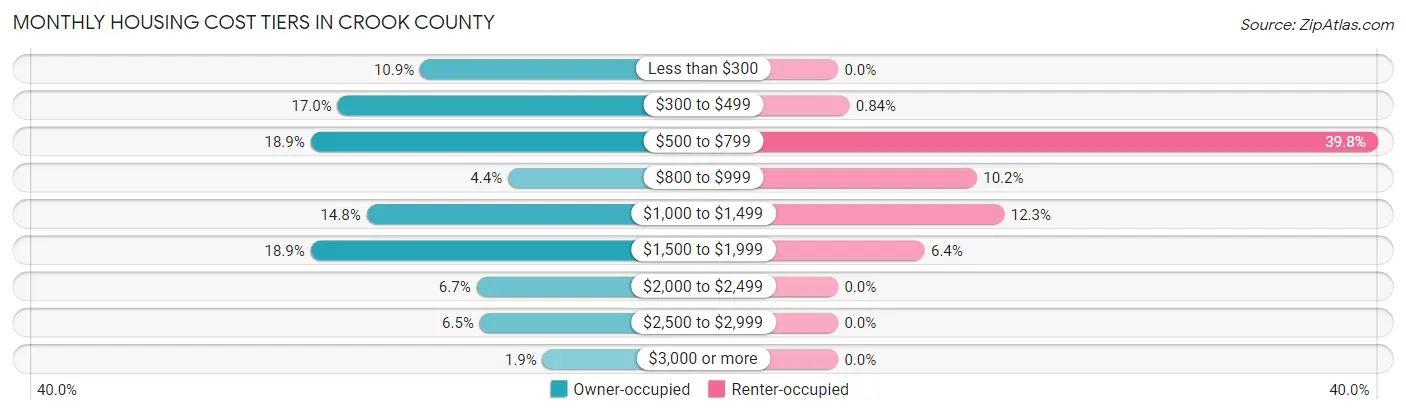
| Monthly Cost | Owner-occupied | Renter-occupied |
| Less than $300 | 235 (10.9%) | 0 (0.0%) |
| $300 to $499 | 366 (17.0%) | 5 (0.8%) |
| $500 to $799 | 409 (18.9%) | 237 (39.8%) |
| $800 to $999 | 95 (4.4%) | 61 (10.2%) |
| $1,000 to $1,499 | 320 (14.8%) | 73 (12.2%) |
| $1,500 to $1,999 | 409 (18.9%) | 38 (6.4%) |
| $2,000 to $2,499 | 145 (6.7%) | 0 (0.0%) |
| $2,500 to $2,999 | 140 (6.5%) | 0 (0.0%) |
| $3,000 or more | 40 (1.8%) | 0 (0.0%) |
| Total | 2,159 (100.0%) | 596 (100.0%) |
Physical Housing Characteristics in Crook County
Housing Structures in Crook County
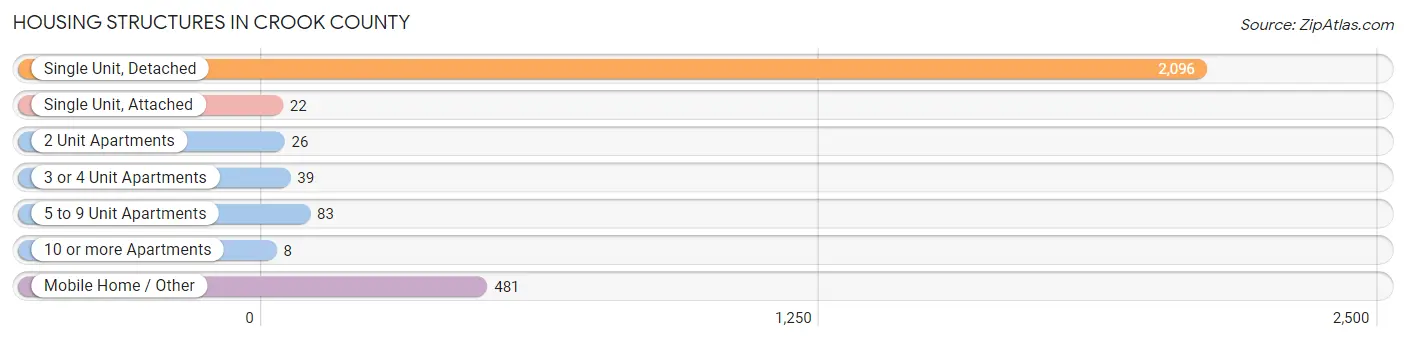
| Structure Type | # Housing Units | % Housing Units |
| Single Unit, Detached | 2,096 | 76.1% |
| Single Unit, Attached | 22 | 0.8% |
| 2 Unit Apartments | 26 | 0.9% |
| 3 or 4 Unit Apartments | 39 | 1.4% |
| 5 to 9 Unit Apartments | 83 | 3.0% |
| 10 or more Apartments | 8 | 0.3% |
| Mobile Home / Other | 481 | 17.5% |
| Total | 2,755 | 100.0% |
Housing Structures by Occupancy in Crook County
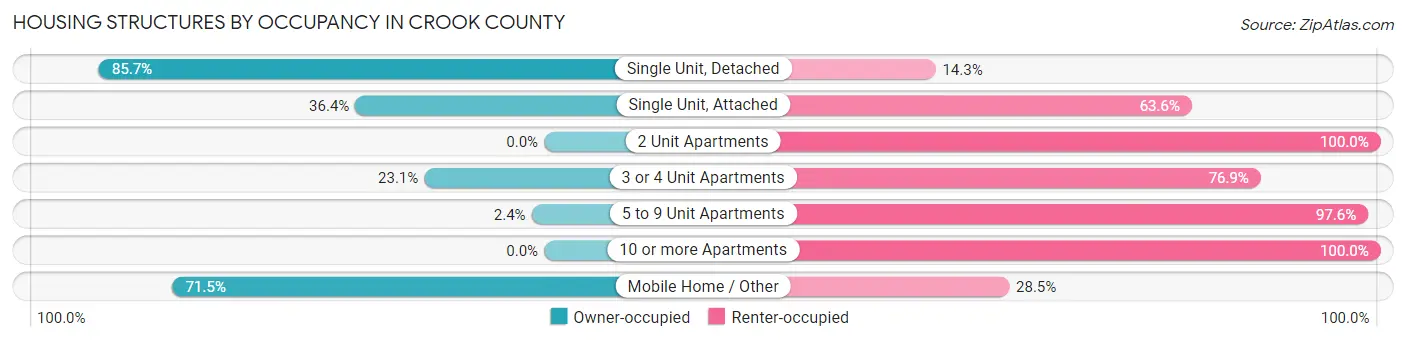
| Structure Type | Owner-occupied | Renter-occupied |
| Single Unit, Detached | 1,796 (85.7%) | 300 (14.3%) |
| Single Unit, Attached | 8 (36.4%) | 14 (63.6%) |
| 2 Unit Apartments | 0 (0.0%) | 26 (100.0%) |
| 3 or 4 Unit Apartments | 9 (23.1%) | 30 (76.9%) |
| 5 to 9 Unit Apartments | 2 (2.4%) | 81 (97.6%) |
| 10 or more Apartments | 0 (0.0%) | 8 (100.0%) |
| Mobile Home / Other | 344 (71.5%) | 137 (28.5%) |
| Total | 2,159 (78.4%) | 596 (21.6%) |
Housing Structures by Number of Rooms in Crook County
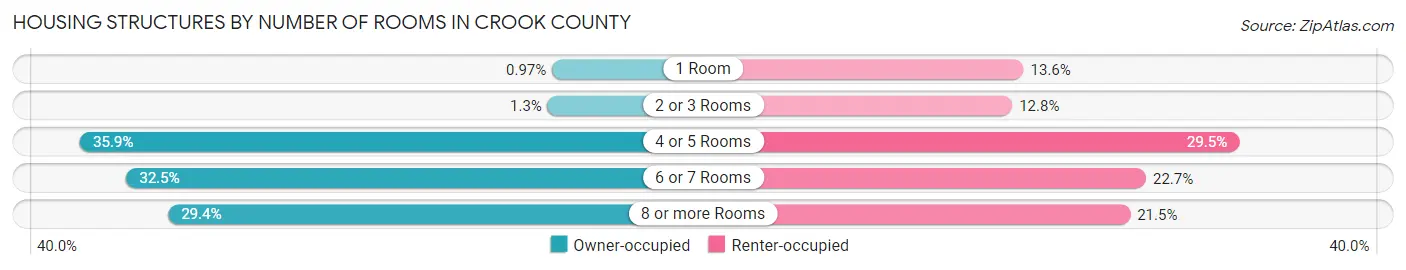
| Number of Rooms | Owner-occupied | Renter-occupied |
| 1 Room | 21 (1.0%) | 81 (13.6%) |
| 2 or 3 Rooms | 28 (1.3%) | 76 (12.8%) |
| 4 or 5 Rooms | 775 (35.9%) | 176 (29.5%) |
| 6 or 7 Rooms | 701 (32.5%) | 135 (22.7%) |
| 8 or more Rooms | 634 (29.4%) | 128 (21.5%) |
| Total | 2,159 (100.0%) | 596 (100.0%) |
Housing Structure by Heating Type in Crook County
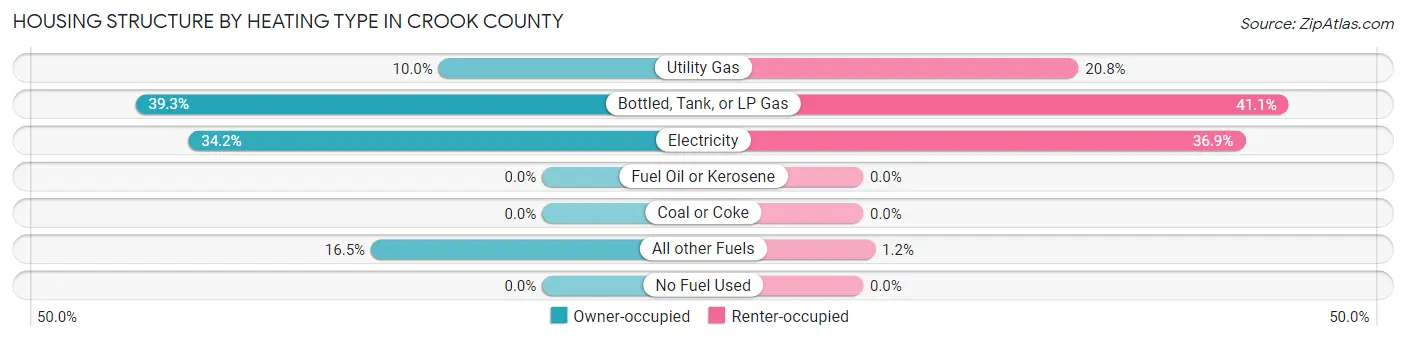
| Heating Type | Owner-occupied | Renter-occupied |
| Utility Gas | 216 (10.0%) | 124 (20.8%) |
| Bottled, Tank, or LP Gas | 848 (39.3%) | 245 (41.1%) |
| Electricity | 738 (34.2%) | 220 (36.9%) |
| Fuel Oil or Kerosene | 0 (0.0%) | 0 (0.0%) |
| Coal or Coke | 0 (0.0%) | 0 (0.0%) |
| All other Fuels | 357 (16.5%) | 7 (1.2%) |
| No Fuel Used | 0 (0.0%) | 0 (0.0%) |
| Total | 2,159 (100.0%) | 596 (100.0%) |
Household Vehicle Usage in Crook County
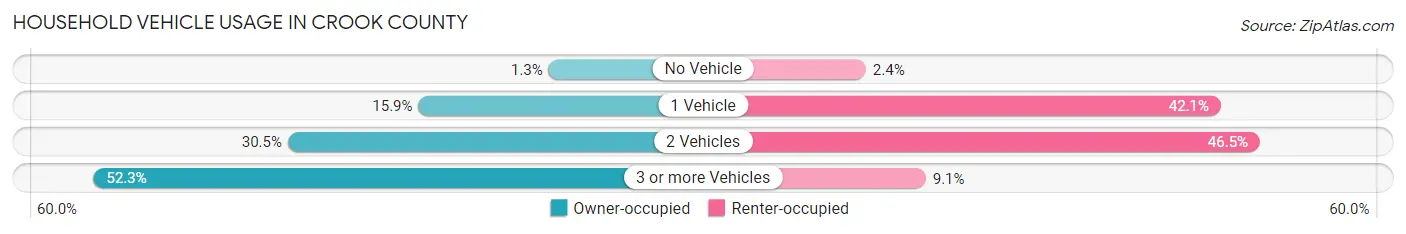
| Vehicles per Household | Owner-occupied | Renter-occupied |
| No Vehicle | 28 (1.3%) | 14 (2.4%) |
| 1 Vehicle | 343 (15.9%) | 251 (42.1%) |
| 2 Vehicles | 659 (30.5%) | 277 (46.5%) |
| 3 or more Vehicles | 1,129 (52.3%) | 54 (9.1%) |
| Total | 2,159 (100.0%) | 596 (100.0%) |
Real Estate & Mortgages in Crook County
Real Estate and Mortgage Overview in Crook County
| Characteristic | Without Mortgage | With Mortgage |
| Housing Units | 1,142 | 1,017 |
| Median Property Value | $250,900 | $295,500 |
| Median Household Income | $58,333 | $97 |
| Monthly Housing Costs | $488 | $40 |
| Real Estate Taxes | $966 | $20 |
Property Value by Mortgage Status in Crook County
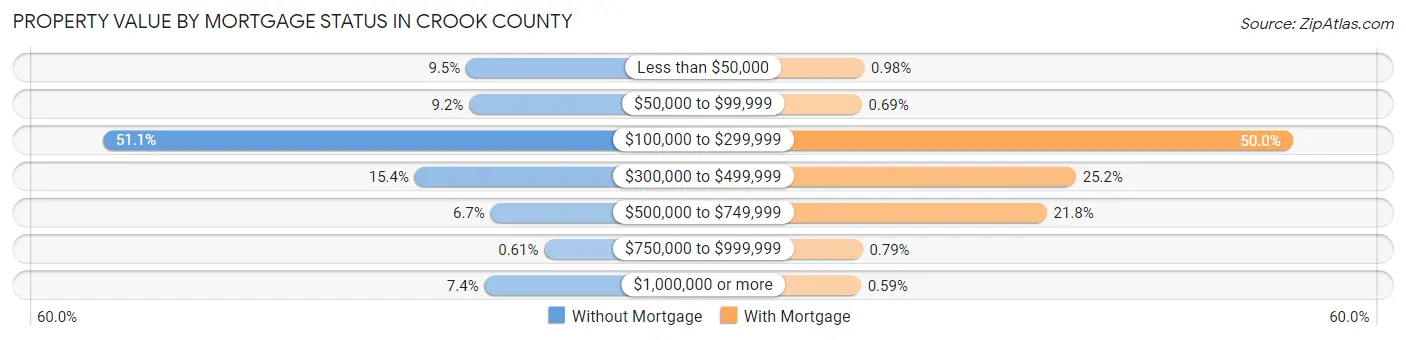
| Property Value | Without Mortgage | With Mortgage |
| Less than $50,000 | 109 (9.5%) | 10 (1.0%) |
| $50,000 to $99,999 | 105 (9.2%) | 7 (0.7%) |
| $100,000 to $299,999 | 583 (51.0%) | 508 (49.9%) |
| $300,000 to $499,999 | 176 (15.4%) | 256 (25.2%) |
| $500,000 to $749,999 | 77 (6.7%) | 222 (21.8%) |
| $750,000 to $999,999 | 7 (0.6%) | 8 (0.8%) |
| $1,000,000 or more | 85 (7.4%) | 6 (0.6%) |
| Total | 1,142 (100.0%) | 1,017 (100.0%) |
Household Income by Mortgage Status in Crook County
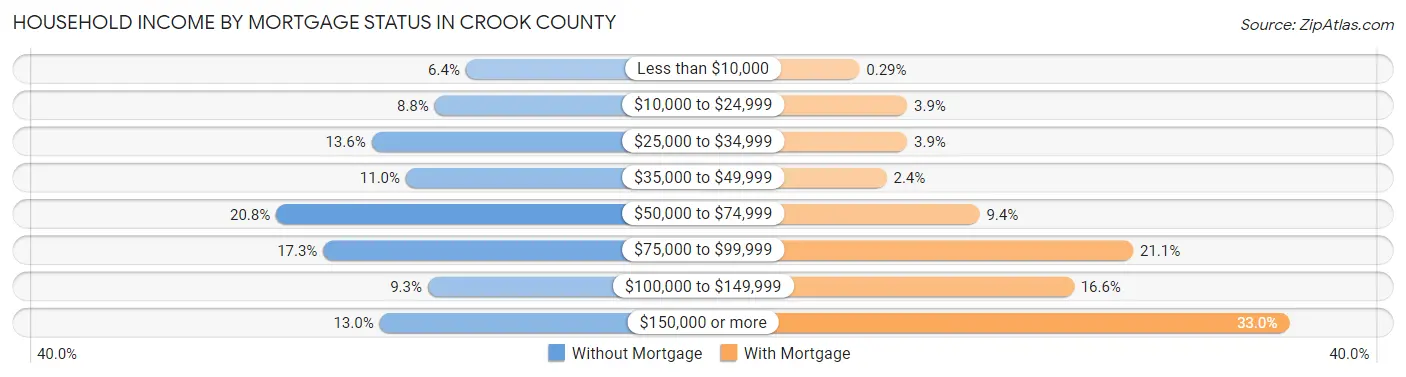
| Household Income | Without Mortgage | With Mortgage |
| Less than $10,000 | 73 (6.4%) | 3 (0.3%) |
| $10,000 to $24,999 | 100 (8.8%) | 40 (3.9%) |
| $25,000 to $34,999 | 155 (13.6%) | 40 (3.9%) |
| $35,000 to $49,999 | 125 (11.0%) | 24 (2.4%) |
| $50,000 to $74,999 | 238 (20.8%) | 96 (9.4%) |
| $75,000 to $99,999 | 197 (17.2%) | 215 (21.1%) |
| $100,000 to $149,999 | 106 (9.3%) | 169 (16.6%) |
| $150,000 or more | 148 (13.0%) | 336 (33.0%) |
| Total | 1,142 (100.0%) | 1,017 (100.0%) |
Property Value to Household Income Ratio in Crook County
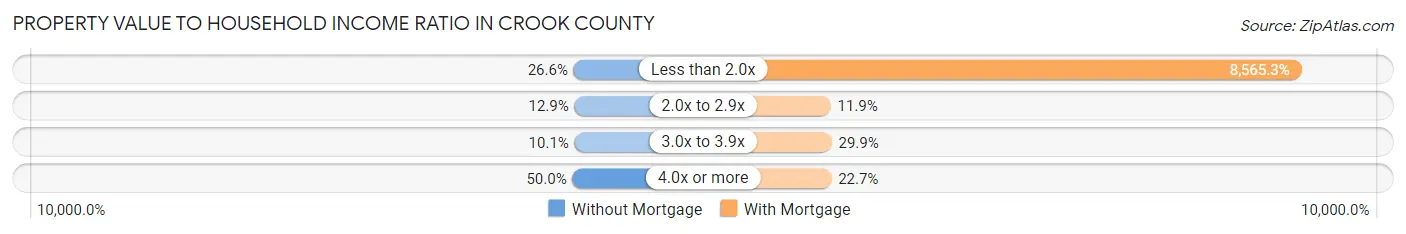
| Value-to-Income Ratio | Without Mortgage | With Mortgage |
| Less than 2.0x | 304 (26.6%) | 87,109 (8,565.3%) |
| 2.0x to 2.9x | 147 (12.9%) | 121 (11.9%) |
| 3.0x to 3.9x | 115 (10.1%) | 304 (29.9%) |
| 4.0x or more | 571 (50.0%) | 231 (22.7%) |
| Total | 1,142 (100.0%) | 1,017 (100.0%) |
Real Estate Taxes by Mortgage Status in Crook County
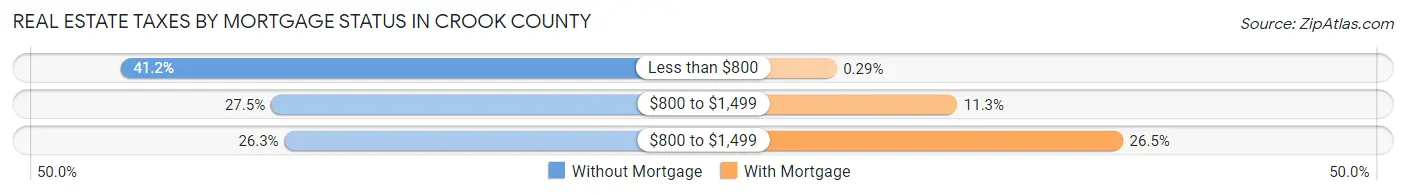
| Property Taxes | Without Mortgage | With Mortgage |
| Less than $800 | 471 (41.2%) | 3 (0.3%) |
| $800 to $1,499 | 314 (27.5%) | 115 (11.3%) |
| $800 to $1,499 | 300 (26.3%) | 269 (26.5%) |
| Total | 1,142 (100.0%) | 1,017 (100.0%) |
Health & Disability in Crook County
Health Insurance Coverage by Age in Crook County
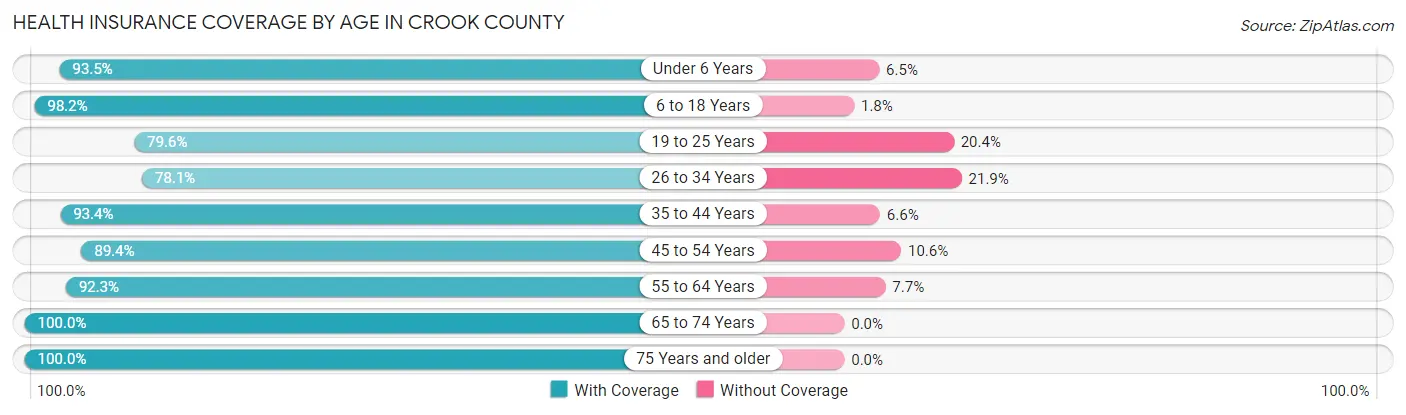
| Age Bracket | With Coverage | Without Coverage |
| Under 6 Years | 561 (93.5%) | 39 (6.5%) |
| 6 to 18 Years | 1,292 (98.2%) | 24 (1.8%) |
| 19 to 25 Years | 273 (79.6%) | 70 (20.4%) |
| 26 to 34 Years | 475 (78.1%) | 133 (21.9%) |
| 35 to 44 Years | 787 (93.4%) | 56 (6.6%) |
| 45 to 54 Years | 727 (89.4%) | 86 (10.6%) |
| 55 to 64 Years | 1,060 (92.3%) | 88 (7.7%) |
| 65 to 74 Years | 985 (100.0%) | 0 (0.0%) |
| 75 Years and older | 539 (100.0%) | 0 (0.0%) |
| Total | 6,699 (93.1%) | 496 (6.9%) |
Health Insurance Coverage by Citizenship Status in Crook County
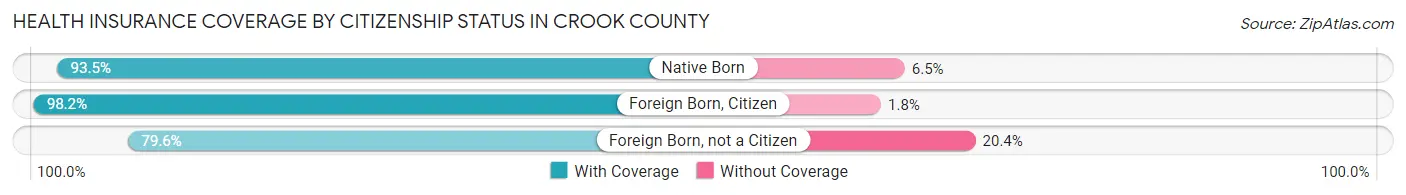
| Citizenship Status | With Coverage | Without Coverage |
| Native Born | 561 (93.5%) | 39 (6.5%) |
| Foreign Born, Citizen | 1,292 (98.2%) | 24 (1.8%) |
| Foreign Born, not a Citizen | 273 (79.6%) | 70 (20.4%) |
Health Insurance Coverage by Household Income in Crook County
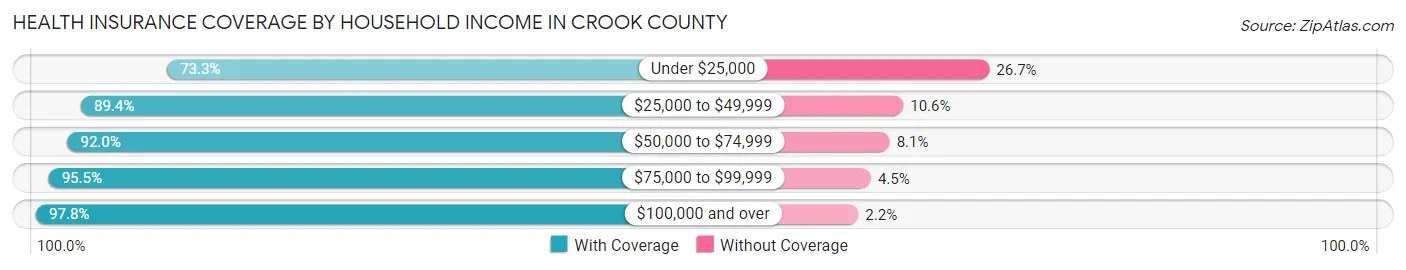
| Household Income | With Coverage | Without Coverage |
| Under $25,000 | 425 (73.3%) | 155 (26.7%) |
| $25,000 to $49,999 | 946 (89.4%) | 112 (10.6%) |
| $50,000 to $74,999 | 1,223 (91.9%) | 107 (8.1%) |
| $75,000 to $99,999 | 1,221 (95.5%) | 58 (4.5%) |
| $100,000 and over | 2,884 (97.8%) | 64 (2.2%) |
Public vs Private Health Insurance Coverage by Age in Crook County
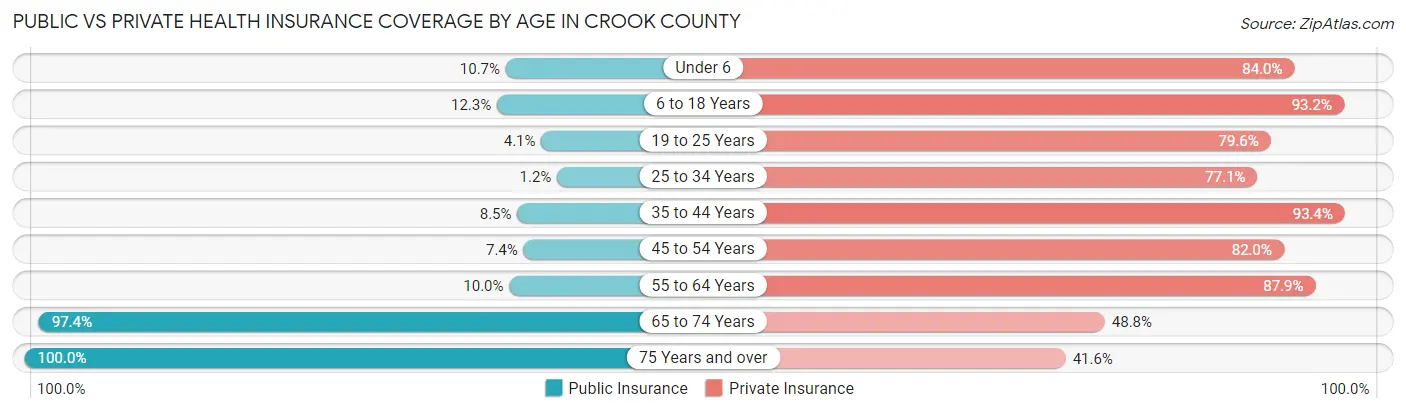
| Age Bracket | Public Insurance | Private Insurance |
| Under 6 | 64 (10.7%) | 504 (84.0%) |
| 6 to 18 Years | 162 (12.3%) | 1,226 (93.2%) |
| 19 to 25 Years | 14 (4.1%) | 273 (79.6%) |
| 25 to 34 Years | 7 (1.1%) | 469 (77.1%) |
| 35 to 44 Years | 72 (8.5%) | 787 (93.4%) |
| 45 to 54 Years | 60 (7.4%) | 667 (82.0%) |
| 55 to 64 Years | 115 (10.0%) | 1,009 (87.9%) |
| 65 to 74 Years | 959 (97.4%) | 481 (48.8%) |
| 75 Years and over | 539 (100.0%) | 224 (41.6%) |
| Total | 1,992 (27.7%) | 5,640 (78.4%) |
Disability Status by Sex by Age in Crook County
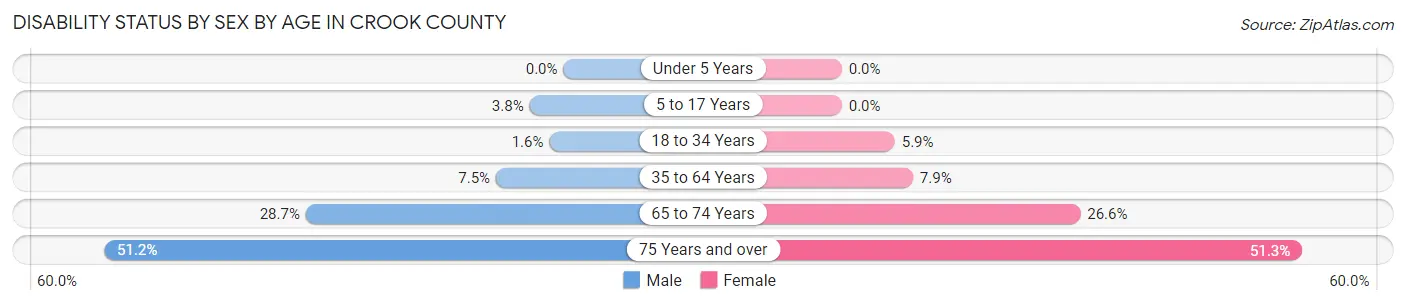
| Age Bracket | Male | Female |
| Under 5 Years | 0 (0.0%) | 0 (0.0%) |
| 5 to 17 Years | 28 (3.8%) | 0 (0.0%) |
| 18 to 34 Years | 8 (1.6%) | 33 (5.9%) |
| 35 to 64 Years | 113 (7.5%) | 103 (7.9%) |
| 65 to 74 Years | 140 (28.7%) | 132 (26.6%) |
| 75 Years and over | 134 (51.1%) | 142 (51.3%) |
Disability Class by Sex by Age in Crook County
Disability Class: Hearing Difficulty
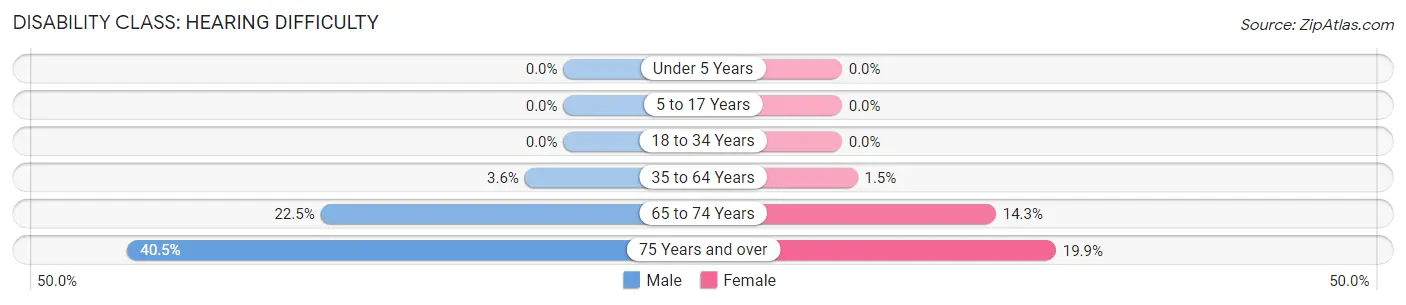
| Age Bracket | Male | Female |
| Under 5 Years | 0 (0.0%) | 0 (0.0%) |
| 5 to 17 Years | 0 (0.0%) | 0 (0.0%) |
| 18 to 34 Years | 0 (0.0%) | 0 (0.0%) |
| 35 to 64 Years | 54 (3.6%) | 19 (1.5%) |
| 65 to 74 Years | 110 (22.5%) | 71 (14.3%) |
| 75 Years and over | 106 (40.5%) | 55 (19.9%) |
Disability Class: Vision Difficulty
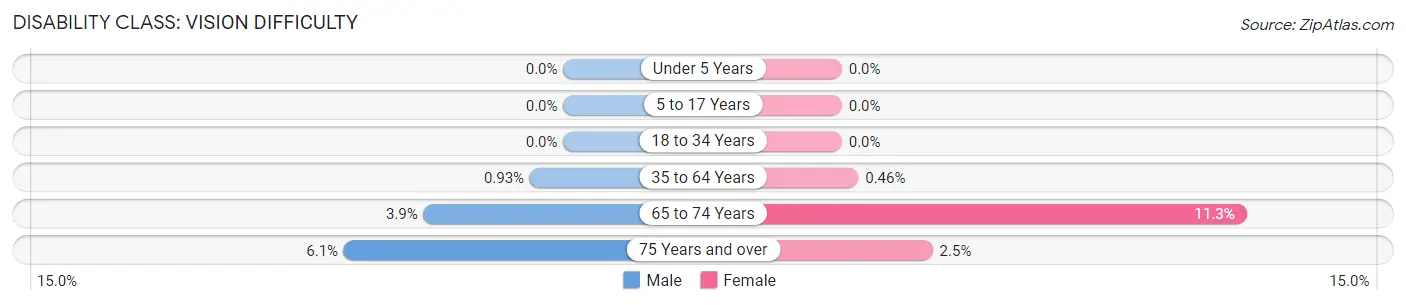
| Age Bracket | Male | Female |
| Under 5 Years | 0 (0.0%) | 0 (0.0%) |
| 5 to 17 Years | 0 (0.0%) | 0 (0.0%) |
| 18 to 34 Years | 0 (0.0%) | 0 (0.0%) |
| 35 to 64 Years | 14 (0.9%) | 6 (0.5%) |
| 65 to 74 Years | 19 (3.9%) | 56 (11.3%) |
| 75 Years and over | 16 (6.1%) | 7 (2.5%) |
Disability Class: Cognitive Difficulty
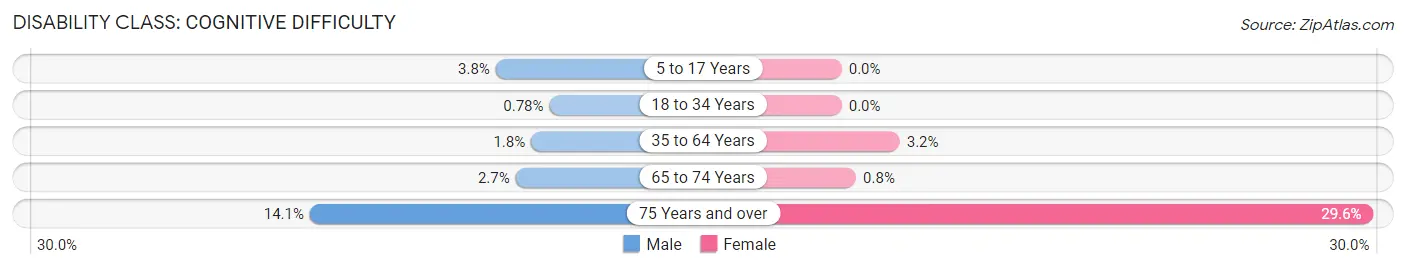
| Age Bracket | Male | Female |
| 5 to 17 Years | 28 (3.8%) | 0 (0.0%) |
| 18 to 34 Years | 4 (0.8%) | 0 (0.0%) |
| 35 to 64 Years | 27 (1.8%) | 42 (3.2%) |
| 65 to 74 Years | 13 (2.7%) | 4 (0.8%) |
| 75 Years and over | 37 (14.1%) | 82 (29.6%) |
Disability Class: Ambulatory Difficulty
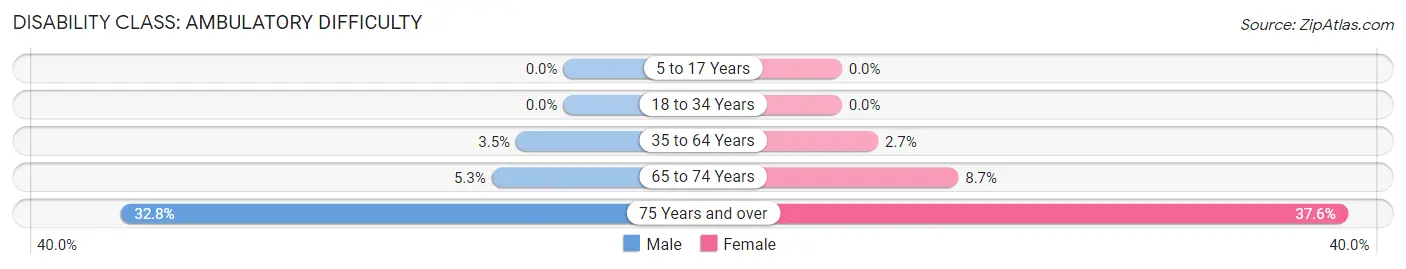
| Age Bracket | Male | Female |
| 5 to 17 Years | 0 (0.0%) | 0 (0.0%) |
| 18 to 34 Years | 0 (0.0%) | 0 (0.0%) |
| 35 to 64 Years | 53 (3.5%) | 35 (2.7%) |
| 65 to 74 Years | 26 (5.3%) | 43 (8.6%) |
| 75 Years and over | 86 (32.8%) | 104 (37.6%) |
Disability Class: Self-Care Difficulty
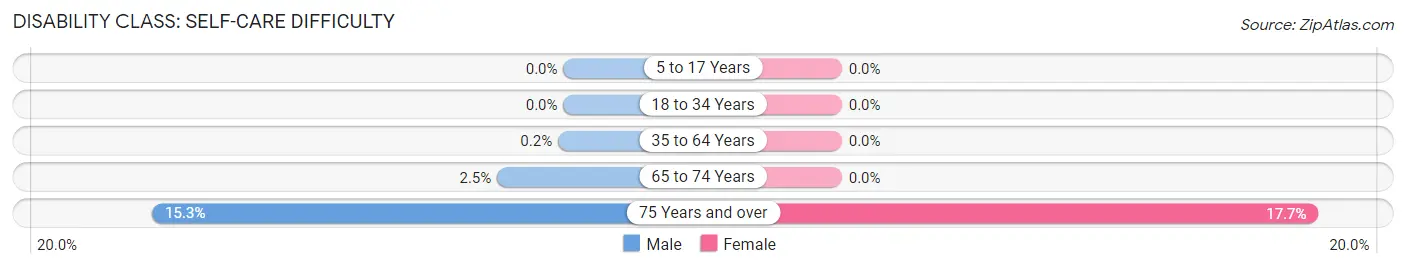
| Age Bracket | Male | Female |
| 5 to 17 Years | 0 (0.0%) | 0 (0.0%) |
| 18 to 34 Years | 0 (0.0%) | 0 (0.0%) |
| 35 to 64 Years | 3 (0.2%) | 0 (0.0%) |
| 65 to 74 Years | 12 (2.5%) | 0 (0.0%) |
| 75 Years and over | 40 (15.3%) | 49 (17.7%) |
Technology Access in Crook County
Computing Device Access in Crook County
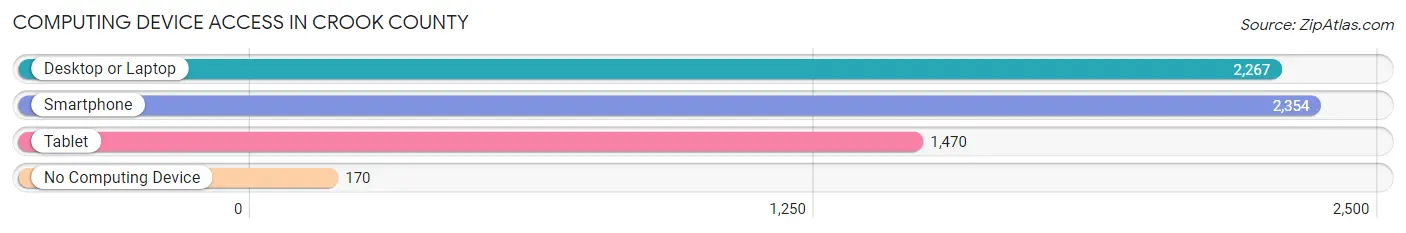
| Device Type | # Households | % Households |
| Desktop or Laptop | 2,267 | 82.3% |
| Smartphone | 2,354 | 85.4% |
| Tablet | 1,470 | 53.4% |
| No Computing Device | 170 | 6.2% |
| Total | 2,755 | 100.0% |
Internet Access in Crook County
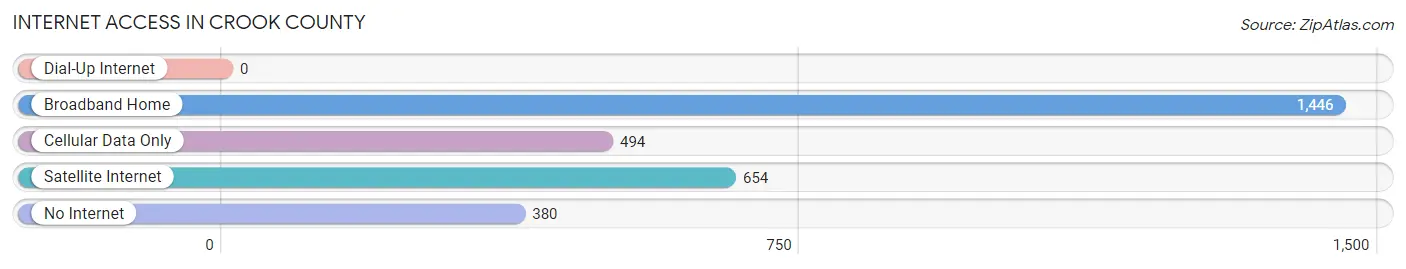
| Internet Type | # Households | % Households |
| Dial-Up Internet | 0 | 0.0% |
| Broadband Home | 1,446 | 52.5% |
| Cellular Data Only | 494 | 17.9% |
| Satellite Internet | 654 | 23.7% |
| No Internet | 380 | 13.8% |
| Total | 2,755 | 100.0% |
Crook County Summary
Crook County, Wyoming is located in the northeastern corner of the state and is bordered by Campbell County to the north, Weston County to the east, Niobrara County to the south, and Johnson County to the west. The county seat is Sundance, and the county was named after General George Crook, a Civil War veteran.
Geography
Crook County is located in the Black Hills region of Wyoming and is home to the Black Hills National Forest. The county covers an area of 2,541 square miles and is the second largest county in the state. The terrain is mostly rolling hills and plains, with some mountains in the northern part of the county. The highest point in the county is located in the Black Hills National Forest, at an elevation of 8,000 feet. The county is home to several rivers, including the Belle Fourche, Cheyenne, and Little Missouri.
Climate
Crook County has a semi-arid climate, with hot summers and cold winters. The average annual temperature is 48°F, with an average high of 79°F in July and an average low of 17°F in January. The average annual precipitation is 16.5 inches, with most of the precipitation occurring in the spring and summer months.
Demographics
As of the 2010 census, Crook County had a population of 7,083. The population was spread out, with 24.3% under the age of 18, 8.2% from 18 to 24, 24.3% from 25 to 44, 28.2% from 45 to 64, and 14.0% who were 65 years of age or older. The median age was 40.3 years. The gender makeup of the county was 50.3% male and 49.7% female.
Economy
Crook County’s economy is largely based on agriculture and tourism. The county is home to several ranches and farms, which produce beef, hay, and other crops. Tourism is also an important part of the economy, with visitors coming to the area to enjoy the outdoor activities, such as camping, fishing, and hunting. The county is also home to several businesses, including restaurants, hotels, and retail stores.
Conclusion
Crook County, Wyoming is a rural county located in the northeastern corner of the state. The county is home to the Black Hills National Forest and is known for its agriculture and tourism. The county has a semi-arid climate, with hot summers and cold winters. As of the 2010 census, the population of Crook County was 7,083. The economy is largely based on agriculture and tourism, with visitors coming to the area to enjoy the outdoor activities.
Common Questions
What is the Total Population of Crook County?
Total Population of Crook County is 7,258.
What is the Total Male Population of Crook County?
Total Male Population of Crook County is 3,634.
What is the Total Female Population of Crook County?
Total Female Population of Crook County is 3,624.
What is the Ratio of Males per 100 Females in Crook County?
There are 100.28 Males per 100 Females in Crook County.
What is the Ratio of Females per 100 Males in Crook County?
There are 99.72 Females per 100 Males in Crook County.
What is the Median Population Age in Crook County?
Median Population Age in Crook County is 44.2 Years.
What is the Average Family Size in Crook County
Average Family Size in Crook County is 3.2 People.
What is the Average Household Size in Crook County
Average Household Size in Crook County is 2.6 People.
What is Per Capita Income in Crook County?
Per Capita income in Crook County is $33,386.
What is the Median Family Income in Crook County?
Median Family Income in Crook County is $90,372.
What is the Median Household income in Crook County?
Median Household Income in Crook County is $68,876.
What is Income or Wage Gap in Crook County?
Income or Wage Gap in Crook County is 36.7%.
Women in Crook County earn 63.3 cents for every dollar earned by a man.
What is Family Income Deficit in Crook County?
Family Income Deficit in Crook County is $9,533.
Families that are below poverty line in Crook County earn $9,533 less on average than the poverty threshold level.
What is Inequality or Gini Index in Crook County?
Inequality or Gini Index in Crook County is 0.39.
How Large is the Labor Force in Crook County?
There are 3,490 People in the Labor Forcein in Crook County.
What is the Percentage of People in the Labor Force in Crook County?
62.8% of People are in the Labor Force in Crook County.
What is the Unemployment Rate in Crook County?
Unemployment Rate in Crook County is 1.0%.