Converse County, WY
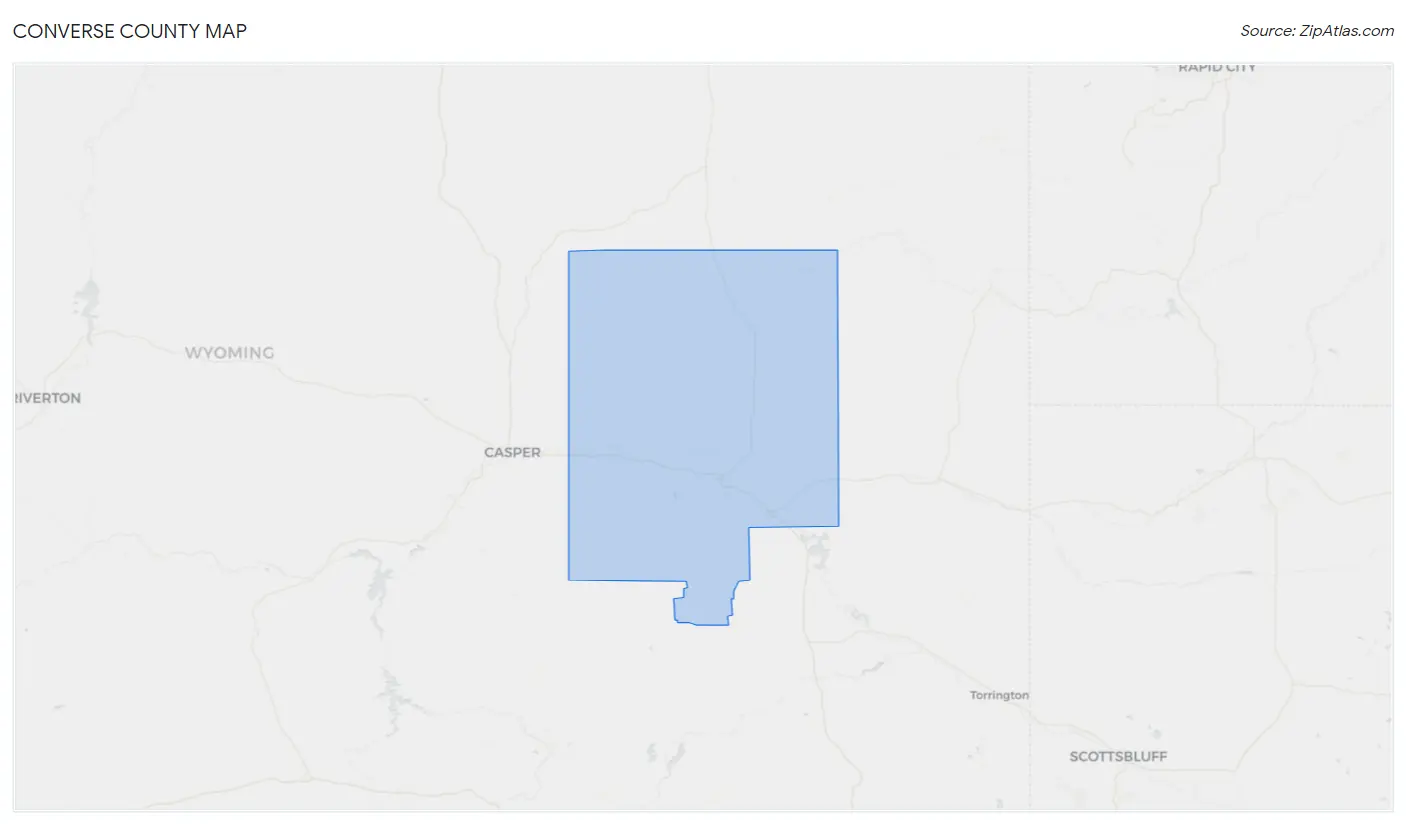
Converse County Map
Converse County Overview
13,729
TOTAL POPULATION
7,066
MALE POPULATION
6,663
FEMALE POPULATION
106.05
MALES / 100 FEMALES
94.30
FEMALES / 100 MALES
41.1
MEDIAN AGE
2.9
AVG FAMILY SIZE
2.4
AVG HOUSEHOLD SIZE
$37,976
PER CAPITA INCOME
$93,012
AVG FAMILY INCOME
$79,235
AVG HOUSEHOLD INCOME
43.3%
WAGE / INCOME GAP [ % ]
56.7¢/ $1
WAGE / INCOME GAP [ $ ]
0.40
INEQUALITY / GINI INDEX
7,192
LABOR FORCE [ PEOPLE ]
66.7%
PERCENT IN LABOR FORCE
4.3%
UNEMPLOYMENT RATE
Converse County Area Codes
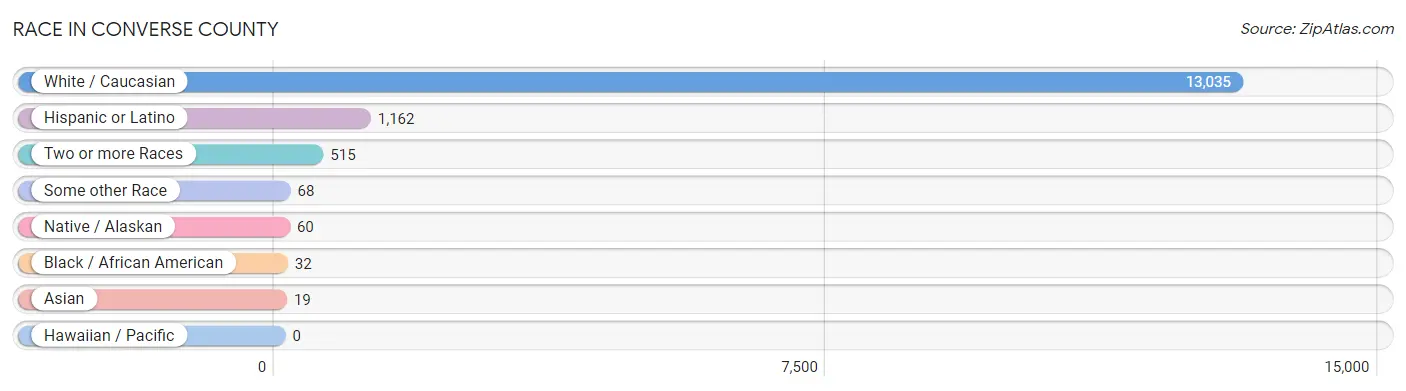
Race in Converse County
The most populous races in Converse County are White / Caucasian (13,035 | 95.0%), Hispanic or Latino (1,162 | 8.5%), and Two or more Races (515 | 3.7%).
| Race | # Population | % Population |
| Asian | 19 | 0.1% |
| Black / African American | 32 | 0.2% |
| Hawaiian / Pacific | 0 | 0.0% |
| Hispanic or Latino | 1,162 | 8.5% |
| Native / Alaskan | 60 | 0.4% |
| White / Caucasian | 13,035 | 95.0% |
| Two or more Races | 515 | 3.7% |
| Some other Race | 68 | 0.5% |
| Total | 13,729 | 100.0% |
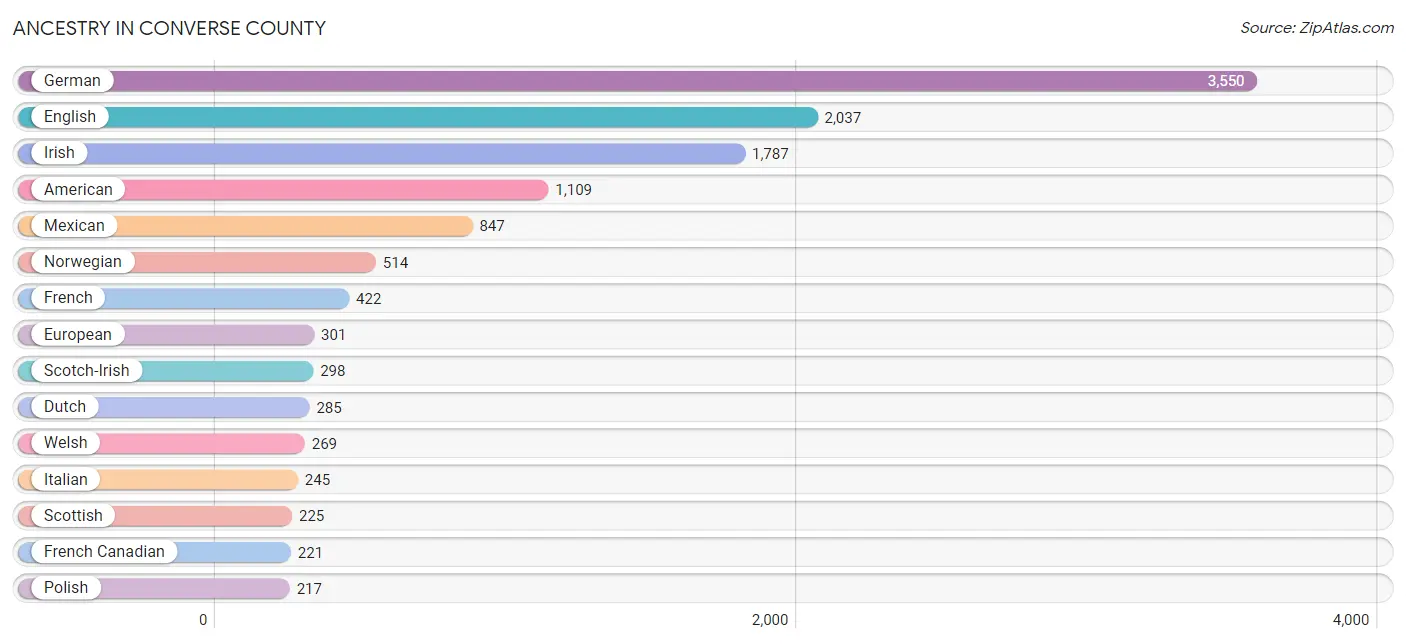
Ancestry in Converse County
The most populous ancestries reported in Converse County are German (3,550 | 25.9%), English (2,037 | 14.8%), Irish (1,787 | 13.0%), American (1,109 | 8.1%), and Mexican (847 | 6.2%), together accounting for 68.0% of all Converse County residents.
| Ancestry | # Population | % Population |
| African | 24 | 0.2% |
| American | 1,109 | 8.1% |
| Apache | 33 | 0.2% |
| Arapaho | 9 | 0.1% |
| Austrian | 18 | 0.1% |
| Bhutanese | 9 | 0.1% |
| British | 47 | 0.3% |
| Burmese | 35 | 0.3% |
| Canadian | 2 | 0.0% |
| Celtic | 5 | 0.0% |
| Central American | 50 | 0.4% |
| Cherokee | 12 | 0.1% |
| Colombian | 1 | 0.0% |
| Croatian | 4 | 0.0% |
| Crow | 1 | 0.0% |
| Czech | 92 | 0.7% |
| Danish | 120 | 0.9% |
| Dutch | 285 | 2.1% |
| English | 2,037 | 14.8% |
| European | 301 | 2.2% |
| Finnish | 47 | 0.3% |
| French | 422 | 3.1% |
| French Canadian | 221 | 1.6% |
| German | 3,550 | 25.9% |
| Guamanian / Chamorro | 5 | 0.0% |
| Guatemalan | 30 | 0.2% |
| Hungarian | 154 | 1.1% |
| Iranian | 3 | 0.0% |
| Irish | 1,787 | 13.0% |
| Iroquois | 6 | 0.0% |
| Italian | 245 | 1.8% |
| Latvian | 57 | 0.4% |
| Lithuanian | 9 | 0.1% |
| Mexican | 847 | 6.2% |
| Northern European | 18 | 0.1% |
| Norwegian | 514 | 3.7% |
| Polish | 217 | 1.6% |
| Portuguese | 77 | 0.6% |
| Russian | 52 | 0.4% |
| Salvadoran | 20 | 0.2% |
| Scandinavian | 55 | 0.4% |
| Scotch-Irish | 298 | 2.2% |
| Scottish | 225 | 1.6% |
| Shoshone | 11 | 0.1% |
| Sioux | 57 | 0.4% |
| Slovak | 9 | 0.1% |
| Slovene | 5 | 0.0% |
| South American | 1 | 0.0% |
| Spaniard | 160 | 1.2% |
| Spanish | 104 | 0.8% |
| Subsaharan African | 24 | 0.2% |
| Swedish | 148 | 1.1% |
| Swiss | 5 | 0.0% |
| Ukrainian | 12 | 0.1% |
| Welsh | 269 | 2.0% | View All 55 Rows |
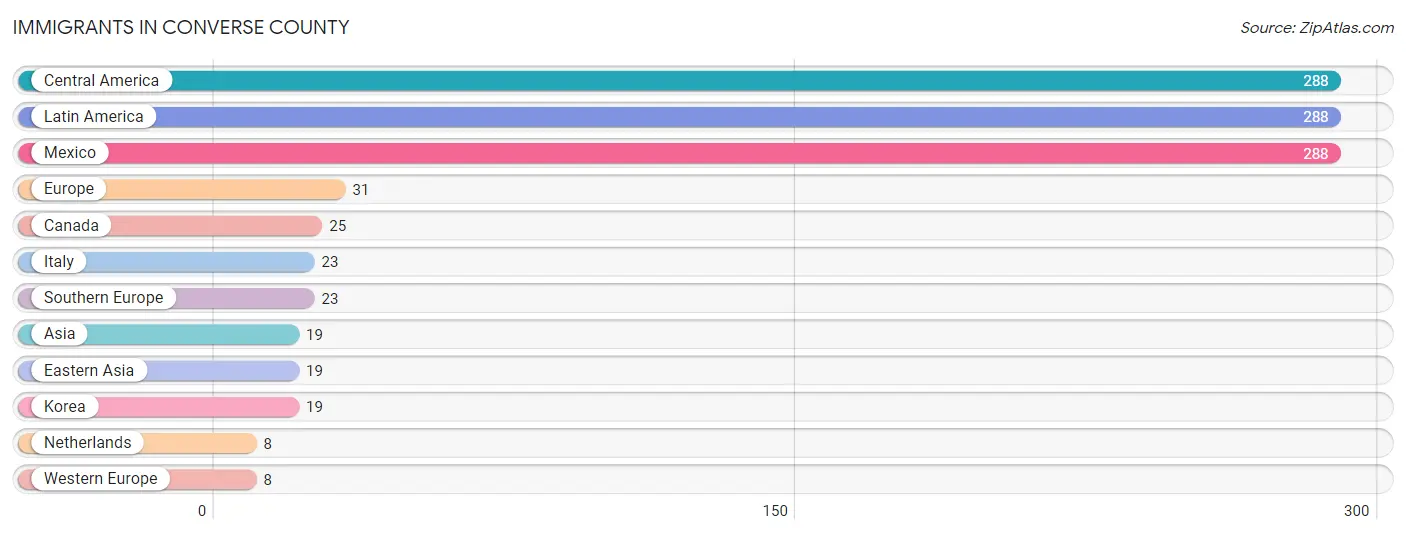
Immigrants in Converse County
The most numerous immigrant groups reported in Converse County came from Central America (288 | 2.1%), Latin America (288 | 2.1%), Mexico (288 | 2.1%), Europe (31 | 0.2%), and Canada (25 | 0.2%), together accounting for 6.7% of all Converse County residents.
| Immigration Origin | # Population | % Population |
| Asia | 19 | 0.1% |
| Canada | 25 | 0.2% |
| Central America | 288 | 2.1% |
| Eastern Asia | 19 | 0.1% |
| Europe | 31 | 0.2% |
| Italy | 23 | 0.2% |
| Korea | 19 | 0.1% |
| Latin America | 288 | 2.1% |
| Mexico | 288 | 2.1% |
| Netherlands | 8 | 0.1% |
| Southern Europe | 23 | 0.2% |
| Western Europe | 8 | 0.1% | View All 12 Rows |
Sex and Age in Converse County
Sex and Age in Converse County
The most populous age groups in Converse County are 55 to 59 Years (584 | 8.3%) for men and 45 to 49 Years (554 | 8.3%) for women.
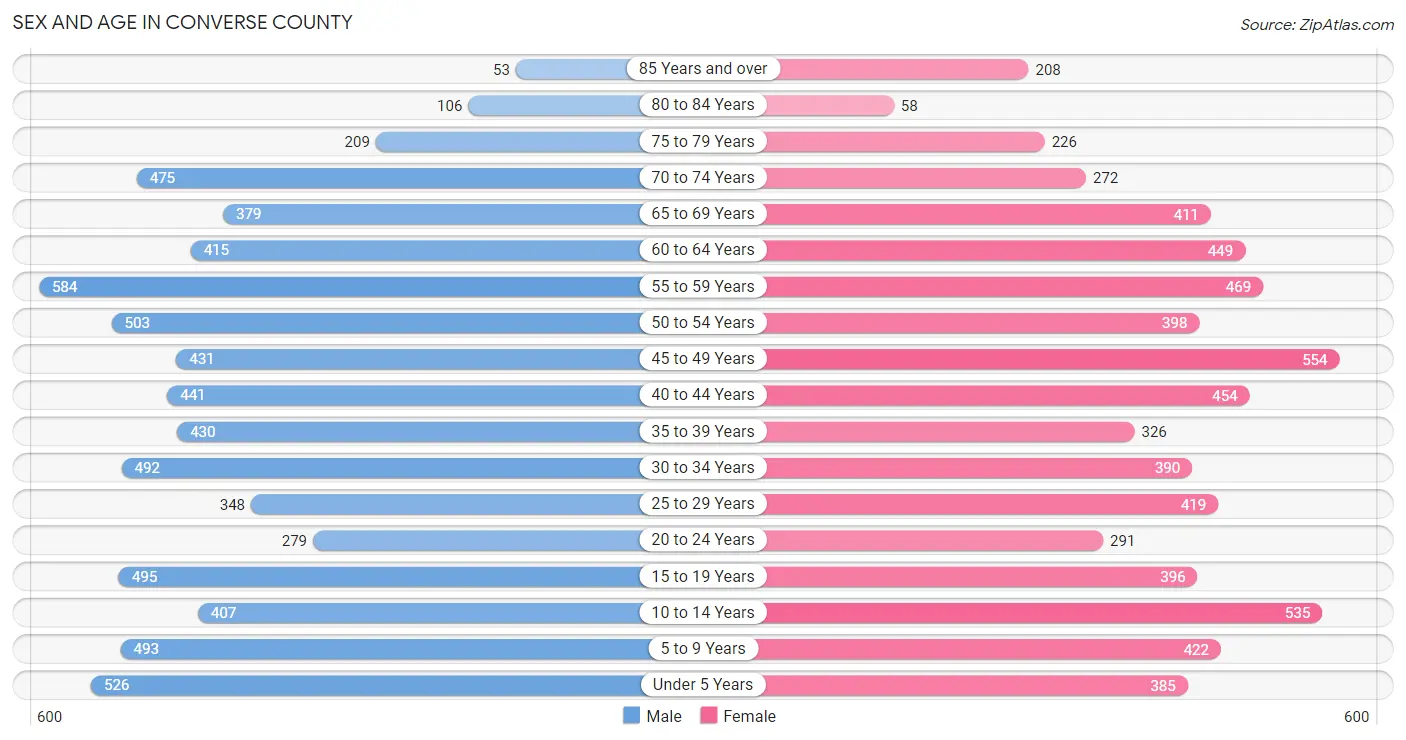
| Age Bracket | Male | Female |
| Under 5 Years | 526 (7.4%) | 385 (5.8%) |
| 5 to 9 Years | 493 (7.0%) | 422 (6.3%) |
| 10 to 14 Years | 407 (5.8%) | 535 (8.0%) |
| 15 to 19 Years | 495 (7.0%) | 396 (5.9%) |
| 20 to 24 Years | 279 (4.0%) | 291 (4.4%) |
| 25 to 29 Years | 348 (4.9%) | 419 (6.3%) |
| 30 to 34 Years | 492 (7.0%) | 390 (5.9%) |
| 35 to 39 Years | 430 (6.1%) | 326 (4.9%) |
| 40 to 44 Years | 441 (6.2%) | 454 (6.8%) |
| 45 to 49 Years | 431 (6.1%) | 554 (8.3%) |
| 50 to 54 Years | 503 (7.1%) | 398 (6.0%) |
| 55 to 59 Years | 584 (8.3%) | 469 (7.0%) |
| 60 to 64 Years | 415 (5.9%) | 449 (6.7%) |
| 65 to 69 Years | 379 (5.4%) | 411 (6.2%) |
| 70 to 74 Years | 475 (6.7%) | 272 (4.1%) |
| 75 to 79 Years | 209 (3.0%) | 226 (3.4%) |
| 80 to 84 Years | 106 (1.5%) | 58 (0.9%) |
| 85 Years and over | 53 (0.7%) | 208 (3.1%) |
| Total | 7,066 (100.0%) | 6,663 (100.0%) |
Families and Households in Converse County
Median Family Size in Converse County
The median family size in Converse County is 2.90 persons per family, with single female/mother families (438 | 11.8%) accounting for the largest median family size of 3.01 persons per family. On the other hand, single male/father families (220 | 5.9%) represent the smallest median family size with 2.42 persons per family.
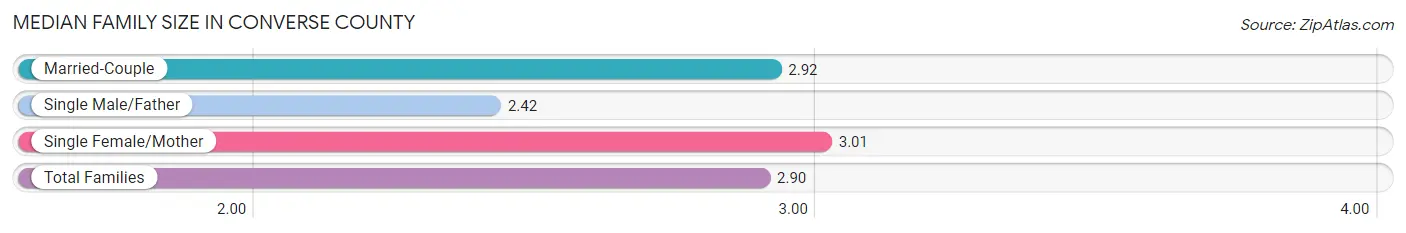
| Family Type | # Families | Family Size |
| Married-Couple | 3,067 (82.3%) | 2.92 |
| Single Male/Father | 220 (5.9%) | 2.42 |
| Single Female/Mother | 438 (11.8%) | 3.01 |
| Total Families | 3,725 (100.0%) | 2.90 |
Median Household Size in Converse County
The median household size in Converse County is 2.41 persons per household, with single female/mother households (438 | 7.7%) accounting for the largest median household size of 3.51 persons per household. non-family households (1,931 | 34.1%) represent the smallest median household size with 1.26 persons per household.
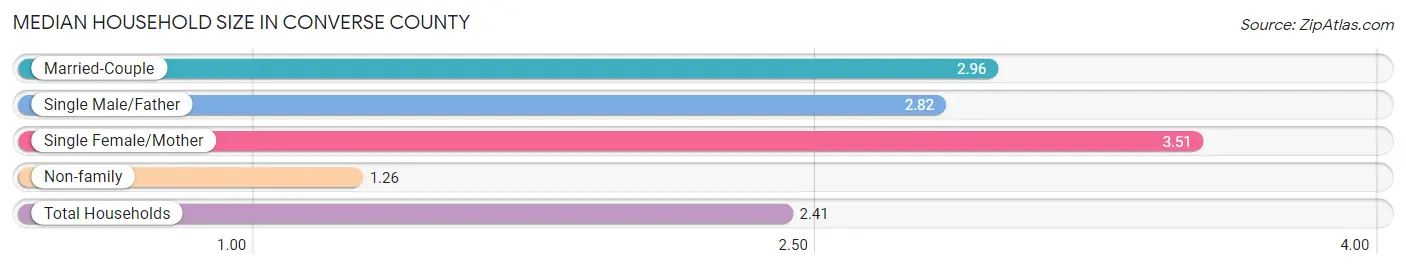
| Household Type | # Households | Household Size |
| Married-Couple | 3,067 (54.2%) | 2.96 |
| Single Male/Father | 220 (3.9%) | 2.82 |
| Single Female/Mother | 438 (7.7%) | 3.51 |
| Non-family | 1,931 (34.1%) | 1.26 |
| Total Households | 5,656 (100.0%) | 2.41 |
Household Size by Marriage Status in Converse County
Out of a total of 5,656 households in Converse County, 3,725 (65.9%) are family households, while 1,931 (34.1%) are nonfamily households. The most numerous type of family households are 2-person households, comprising 1,843, and the most common type of nonfamily households are 1-person households, comprising 1,484.
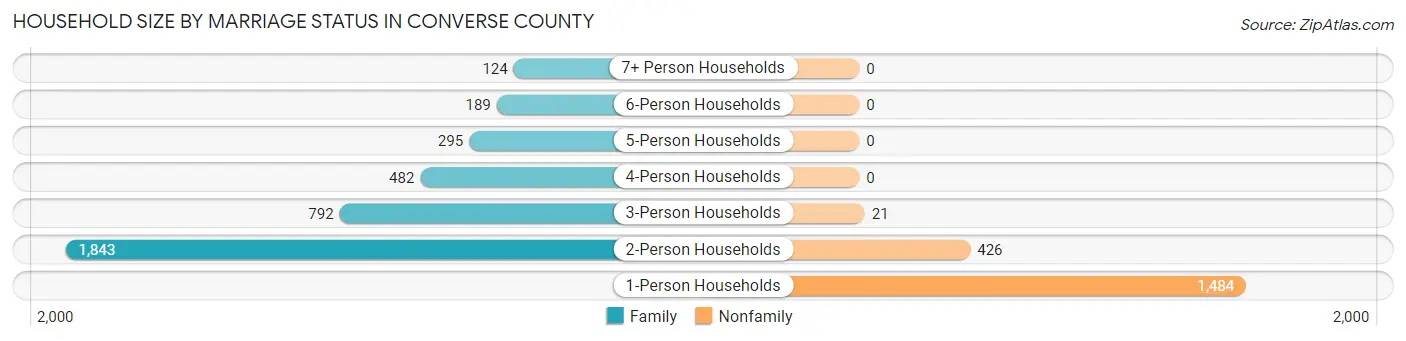
| Household Size | Family Households | Nonfamily Households |
| 1-Person Households | - | 1,484 (26.2%) |
| 2-Person Households | 1,843 (32.6%) | 426 (7.5%) |
| 3-Person Households | 792 (14.0%) | 21 (0.4%) |
| 4-Person Households | 482 (8.5%) | 0 (0.0%) |
| 5-Person Households | 295 (5.2%) | 0 (0.0%) |
| 6-Person Households | 189 (3.3%) | 0 (0.0%) |
| 7+ Person Households | 124 (2.2%) | 0 (0.0%) |
| Total | 3,725 (65.9%) | 1,931 (34.1%) |
Female Fertility in Converse County
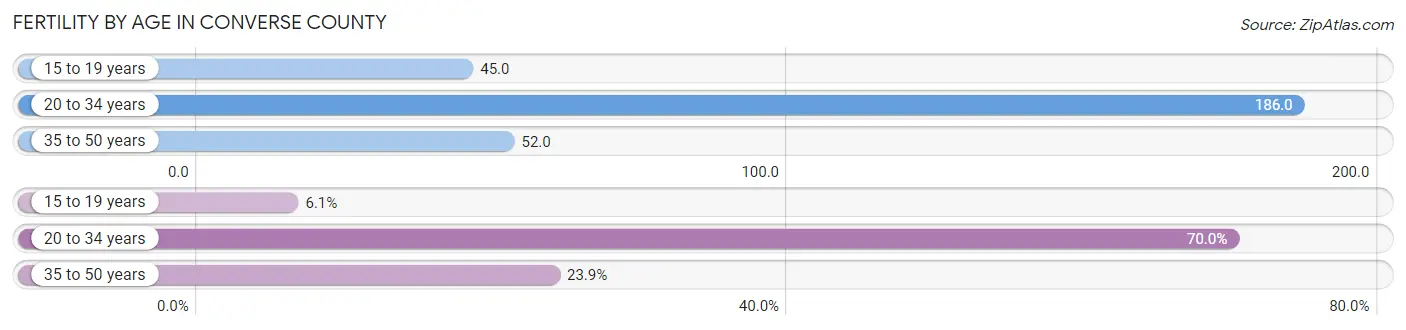
Fertility by Age in Converse County
Average fertility rate in Converse County is 103.0 births per 1,000 women. Women in the age bracket of 20 to 34 years have the highest fertility rate with 186.0 births per 1,000 women. Women in the age bracket of 20 to 34 years acount for 70.0% of all women with births.
| Age Bracket | Women with Births | Births / 1,000 Women |
| 15 to 19 years | 18 (6.1%) | 45.0 |
| 20 to 34 years | 205 (70.0%) | 186.0 |
| 35 to 50 years | 70 (23.9%) | 52.0 |
| Total | 293 (100.0%) | 103.0 |
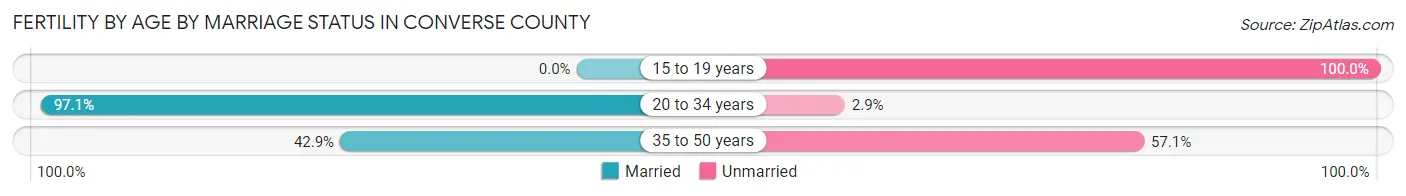
Fertility by Age by Marriage Status in Converse County
78.2% of women with births (293) in Converse County are married. The highest percentage of unmarried women with births falls into 15 to 19 years age bracket with 100.0% of them unmarried at the time of birth, while the lowest percentage of unmarried women with births belong to 20 to 34 years age bracket with 2.9% of them unmarried.
| Age Bracket | Married | Unmarried |
| 15 to 19 years | 0 (0.0%) | 18 (100.0%) |
| 20 to 34 years | 199 (97.1%) | 6 (2.9%) |
| 35 to 50 years | 30 (42.9%) | 40 (57.1%) |
| Total | 229 (78.2%) | 64 (21.8%) |
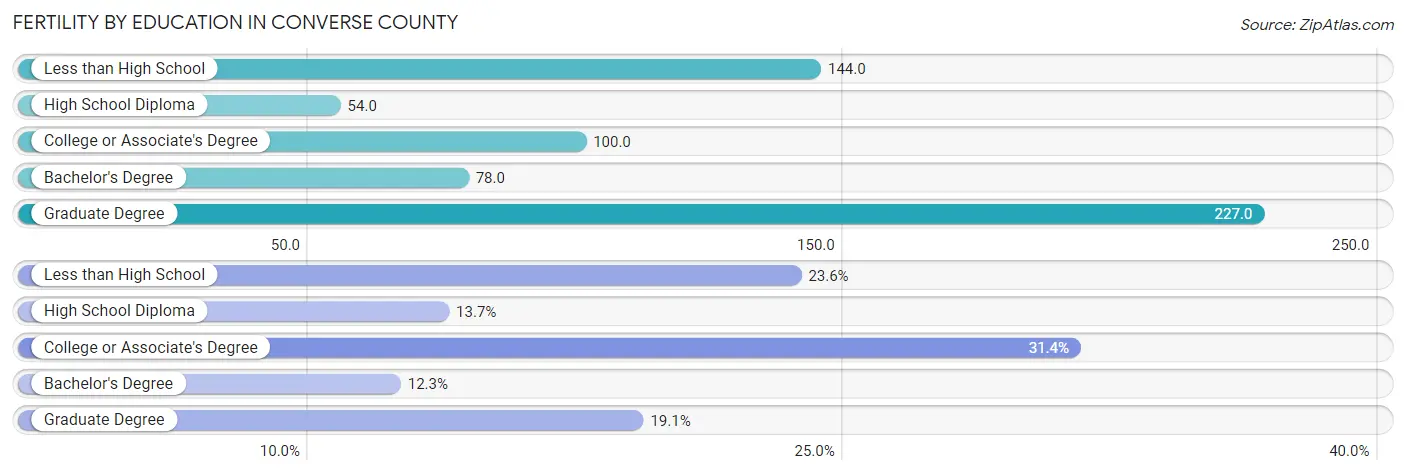
Fertility by Education in Converse County
Average fertility rate in Converse County is 103.0 births per 1,000 women. Women with the education attainment of graduate degree have the highest fertility rate of 227.0 births per 1,000 women, while women with the education attainment of high school diploma have the lowest fertility at 54.0 births per 1,000 women. Women with the education attainment of college or associate's degree represent 31.4% of all women with births.
| Educational Attainment | Women with Births | Births / 1,000 Women |
| Less than High School | 69 (23.5%) | 144.0 |
| High School Diploma | 40 (13.7%) | 54.0 |
| College or Associate's Degree | 92 (31.4%) | 100.0 |
| Bachelor's Degree | 36 (12.3%) | 78.0 |
| Graduate Degree | 56 (19.1%) | 227.0 |
| Total | 293 (100.0%) | 103.0 |
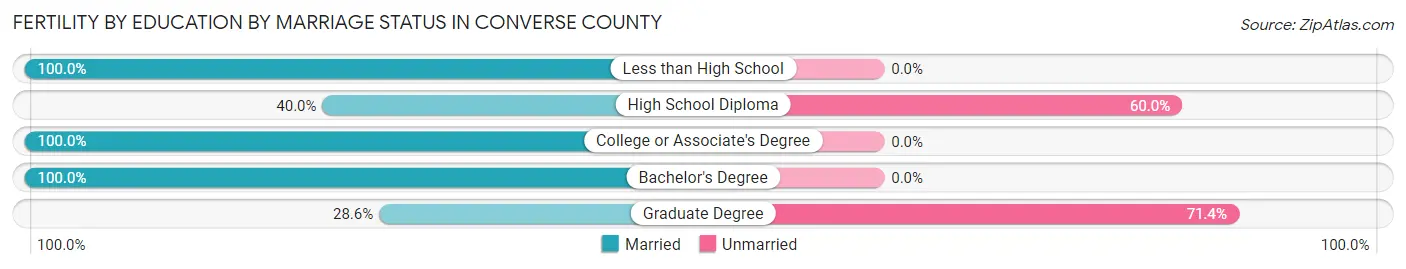
Fertility by Education by Marriage Status in Converse County
21.8% of women with births in Converse County are unmarried. Women with the educational attainment of less than high school are most likely to be married with 100.0% of them married at childbirth, while women with the educational attainment of graduate degree are least likely to be married with 71.4% of them unmarried at childbirth.
| Educational Attainment | Married | Unmarried |
| Less than High School | 69 (100.0%) | 0 (0.0%) |
| High School Diploma | 16 (40.0%) | 24 (60.0%) |
| College or Associate's Degree | 92 (100.0%) | 0 (0.0%) |
| Bachelor's Degree | 36 (100.0%) | 0 (0.0%) |
| Graduate Degree | 16 (28.6%) | 40 (71.4%) |
| Total | 229 (78.2%) | 64 (21.8%) |
Income in Converse County
Income Overview in Converse County
Per Capita Income in Converse County is $37,976, while median incomes of families and households are $93,012 and $79,235 respectively.
| Characteristic | Number | Measure |
| Per Capita Income | 13,729 | $37,976 |
| Median Family Income | 3,725 | $93,012 |
| Mean Family Income | 3,725 | $103,776 |
| Median Household Income | 5,656 | $79,235 |
| Mean Household Income | 5,656 | $92,879 |
| Income Deficit | 3,725 | $0 |
| Wage / Income Gap (%) | 13,729 | 43.29% |
| Wage / Income Gap ($) | 13,729 | 56.71¢ per $1 |
| Gini / Inequality Index | 13,729 | 0.40 |
Earnings by Sex in Converse County
Average Earnings in Converse County are $41,744, $58,876 for men and $33,390 for women, a difference of 43.3%.
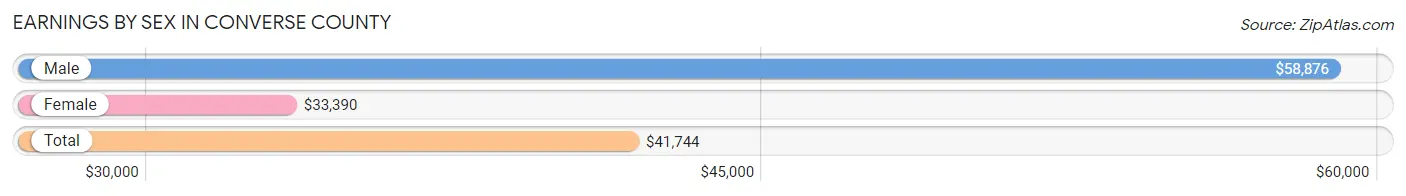
| Sex | Number | Average Earnings |
| Male | 4,236 (55.5%) | $58,876 |
| Female | 3,398 (44.5%) | $33,390 |
| Total | 7,634 (100.0%) | $41,744 |
Earnings by Sex by Income Bracket in Converse County
The most common earnings brackets in Converse County are $100,000+ for men (916 | 21.6%) and $55,000 to $64,999 for women (276 | 8.1%).
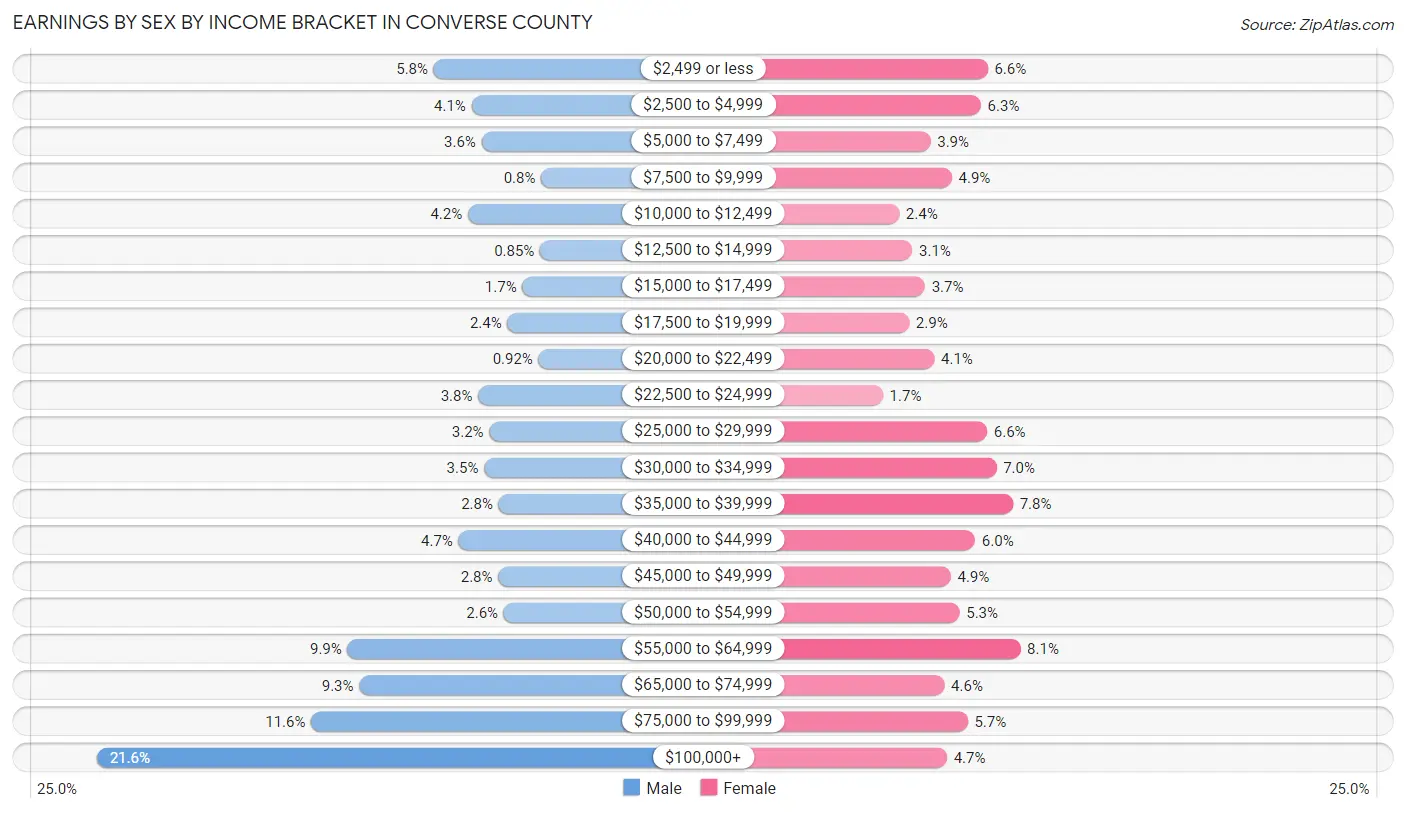
| Income | Male | Female |
| $2,499 or less | 247 (5.8%) | 224 (6.6%) |
| $2,500 to $4,999 | 172 (4.1%) | 213 (6.3%) |
| $5,000 to $7,499 | 152 (3.6%) | 133 (3.9%) |
| $7,500 to $9,999 | 34 (0.8%) | 167 (4.9%) |
| $10,000 to $12,499 | 179 (4.2%) | 83 (2.4%) |
| $12,500 to $14,999 | 36 (0.9%) | 104 (3.1%) |
| $15,000 to $17,499 | 71 (1.7%) | 124 (3.6%) |
| $17,500 to $19,999 | 101 (2.4%) | 99 (2.9%) |
| $20,000 to $22,499 | 39 (0.9%) | 139 (4.1%) |
| $22,500 to $24,999 | 159 (3.7%) | 57 (1.7%) |
| $25,000 to $29,999 | 137 (3.2%) | 223 (6.6%) |
| $30,000 to $34,999 | 147 (3.5%) | 238 (7.0%) |
| $35,000 to $39,999 | 118 (2.8%) | 264 (7.8%) |
| $40,000 to $44,999 | 198 (4.7%) | 204 (6.0%) |
| $45,000 to $49,999 | 119 (2.8%) | 165 (4.9%) |
| $50,000 to $54,999 | 108 (2.5%) | 179 (5.3%) |
| $55,000 to $64,999 | 418 (9.9%) | 276 (8.1%) |
| $65,000 to $74,999 | 395 (9.3%) | 155 (4.6%) |
| $75,000 to $99,999 | 490 (11.6%) | 192 (5.7%) |
| $100,000+ | 916 (21.6%) | 159 (4.7%) |
| Total | 4,236 (100.0%) | 3,398 (100.0%) |
Earnings by Sex by Educational Attainment in Converse County
Average earnings in Converse County are $63,801 for men and $35,060 for women, a difference of 45.1%. Men with an educational attainment of graduate degree enjoy the highest average annual earnings of $75,486, while those with less than high school education earn the least with $29,282. Women with an educational attainment of graduate degree earn the most with the average annual earnings of $54,519, while those with less than high school education have the smallest earnings of $2,499.
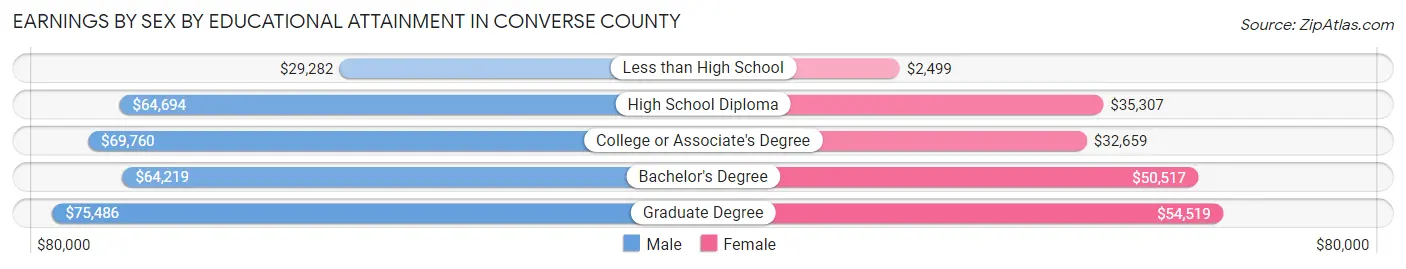
| Educational Attainment | Male Income | Female Income |
| Less than High School | $29,282 | $2,499 |
| High School Diploma | $64,694 | $35,307 |
| College or Associate's Degree | $69,760 | $32,659 |
| Bachelor's Degree | $64,219 | $50,517 |
| Graduate Degree | $75,486 | $54,519 |
| Total | $63,801 | $35,060 |
Family Income in Converse County
Family Income Brackets in Converse County
According to the Converse County family income data, there are 775 families falling into the $100,000 to $149,999 income range, which is the most common income bracket and makes up 20.8% of all families. Conversely, the $15,000 to $24,999 income bracket is the least frequent group with only 26 families (0.7%) belonging to this category.
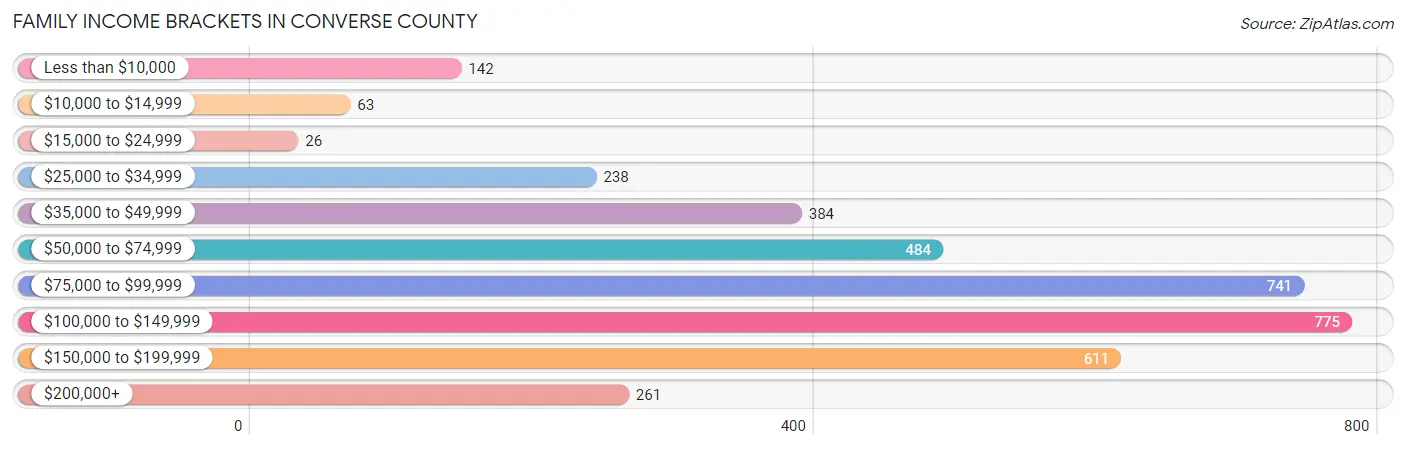
| Income Bracket | # Families | % Families |
| Less than $10,000 | 142 | 3.8% |
| $10,000 to $14,999 | 63 | 1.7% |
| $15,000 to $24,999 | 26 | 0.7% |
| $25,000 to $34,999 | 238 | 6.4% |
| $35,000 to $49,999 | 384 | 10.3% |
| $50,000 to $74,999 | 484 | 13.0% |
| $75,000 to $99,999 | 741 | 19.9% |
| $100,000 to $149,999 | 775 | 20.8% |
| $150,000 to $199,999 | 611 | 16.4% |
| $200,000+ | 261 | 7.0% |
Family Income by Famaliy Size in Converse County
7+ person families (112 | 3.0%) account for the highest median family income in Converse County with $185,000 per family, while 2-person families (1,889 | 50.7%) have the highest median income of $42,924 per family member.
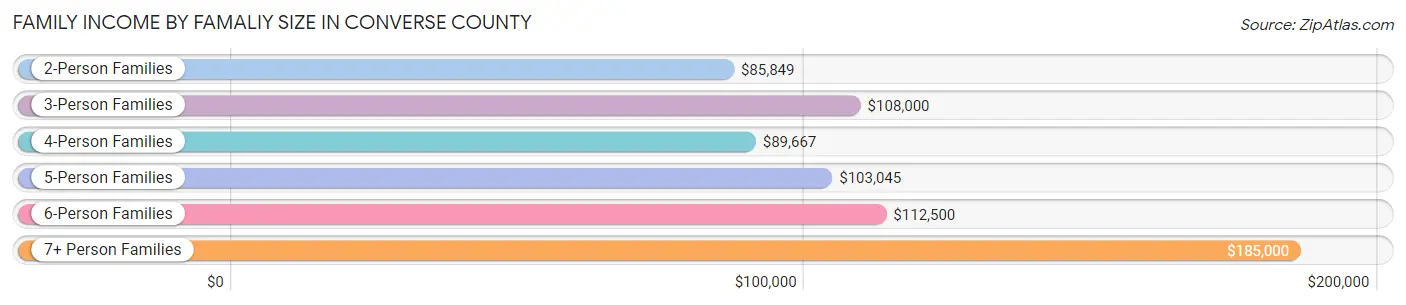
| Income Bracket | # Families | Median Income |
| 2-Person Families | 1,889 (50.7%) | $85,849 |
| 3-Person Families | 938 (25.2%) | $108,000 |
| 4-Person Families | 382 (10.3%) | $89,667 |
| 5-Person Families | 252 (6.8%) | $103,045 |
| 6-Person Families | 152 (4.1%) | $112,500 |
| 7+ Person Families | 112 (3.0%) | $185,000 |
| Total | 3,725 (100.0%) | $93,012 |
Family Income by Number of Earners in Converse County
The median family income in Converse County is $93,012, with families comprising 3+ earners (403) having the highest median family income of $163,679, while families with no earners (463) have the lowest median family income of $50,446, accounting for 10.8% and 12.4% of families, respectively.
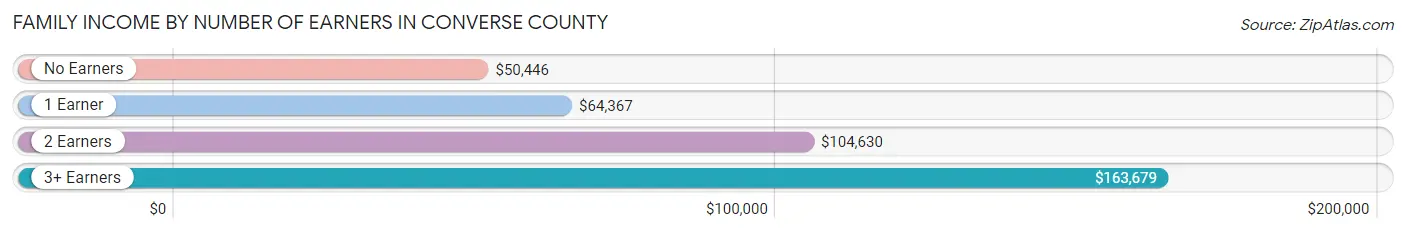
| Number of Earners | # Families | Median Income |
| No Earners | 463 (12.4%) | $50,446 |
| 1 Earner | 973 (26.1%) | $64,367 |
| 2 Earners | 1,886 (50.6%) | $104,630 |
| 3+ Earners | 403 (10.8%) | $163,679 |
| Total | 3,725 (100.0%) | $93,012 |
Household Income in Converse County
Household Income Brackets in Converse County
With 1,126 households falling in the category, the $100,000 to $149,999 income range is the most frequent in Converse County, accounting for 19.9% of all households. In contrast, only 158 households (2.8%) fall into the less than $10,000 income bracket, making it the least populous group.
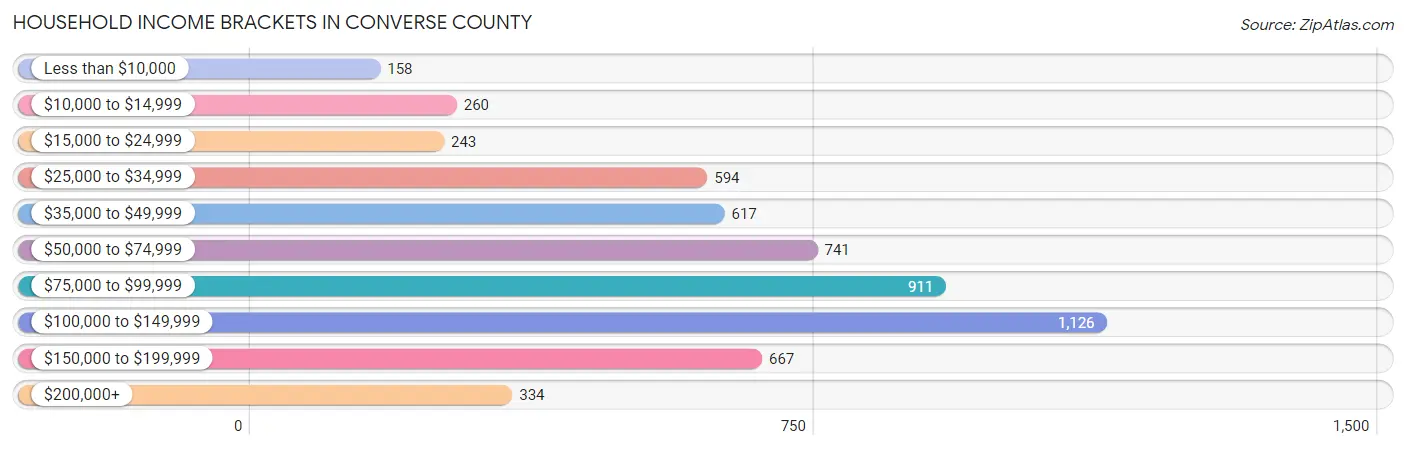
| Income Bracket | # Households | % Households |
| Less than $10,000 | 158 | 2.8% |
| $10,000 to $14,999 | 260 | 4.6% |
| $15,000 to $24,999 | 243 | 4.3% |
| $25,000 to $34,999 | 594 | 10.5% |
| $35,000 to $49,999 | 617 | 10.9% |
| $50,000 to $74,999 | 741 | 13.1% |
| $75,000 to $99,999 | 911 | 16.1% |
| $100,000 to $149,999 | 1,126 | 19.9% |
| $150,000 to $199,999 | 667 | 11.8% |
| $200,000+ | 334 | 5.9% |
Household Income by Householder Age in Converse County
The median household income in Converse County is $79,235, with the highest median household income of $105,156 found in the 25 to 44 years age bracket for the primary householder. A total of 1,531 households (27.1%) fall into this category. Meanwhile, the 15 to 24 years age bracket for the primary householder has the lowest median household income of $0, with 193 households (3.4%) in this group.
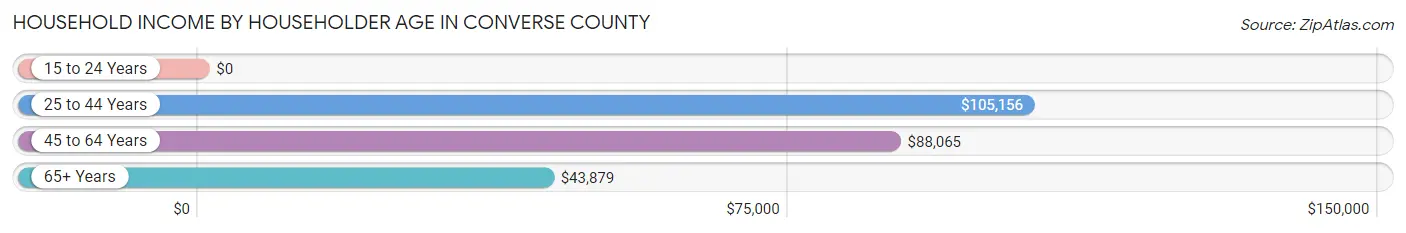
| Income Bracket | # Households | Median Income |
| 15 to 24 Years | 193 (3.4%) | $0 |
| 25 to 44 Years | 1,531 (27.1%) | $105,156 |
| 45 to 64 Years | 2,290 (40.5%) | $88,065 |
| 65+ Years | 1,642 (29.0%) | $43,879 |
| Total | 5,656 (100.0%) | $79,235 |
Poverty in Converse County
Income Below Poverty by Sex and Age in Converse County
With 9.9% poverty level for males and 12.2% for females among the residents of Converse County, 15 year old males and 5 year old females are the most vulnerable to poverty, with 33 males (34.4%) and 74 females (51.4%) in their respective age groups living below the poverty level.
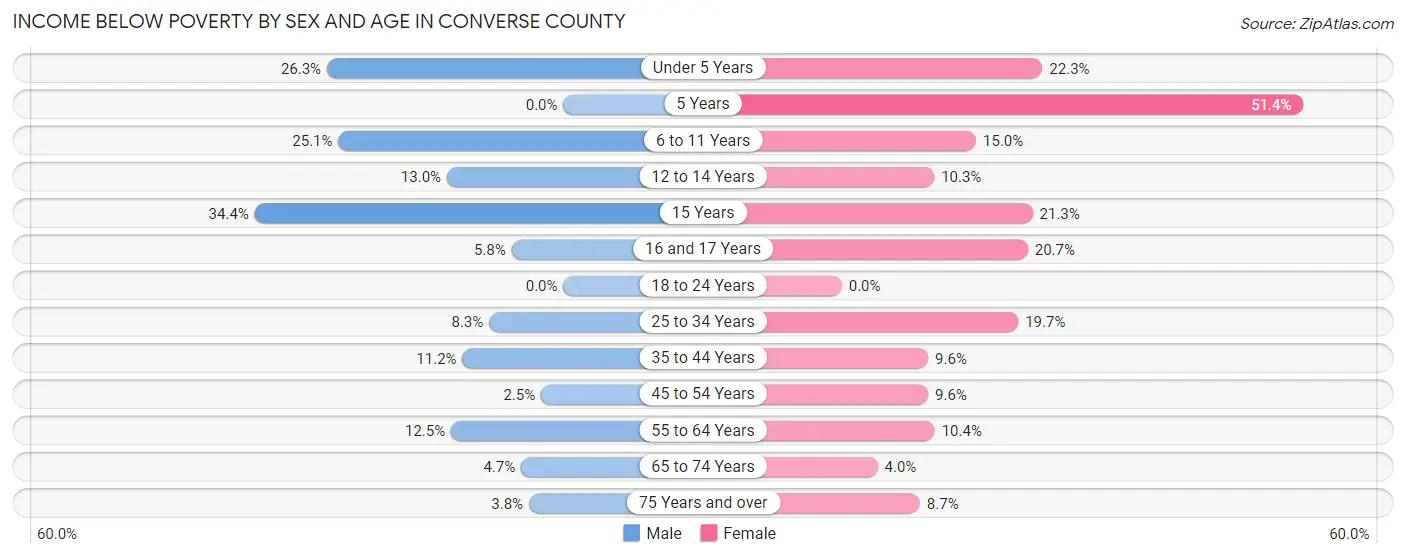
| Age Bracket | Male | Female |
| Under 5 Years | 129 (26.3%) | 86 (22.3%) |
| 5 Years | 0 (0.0%) | 74 (51.4%) |
| 6 to 11 Years | 110 (25.1%) | 70 (15.0%) |
| 12 to 14 Years | 41 (13.0%) | 32 (10.3%) |
| 15 Years | 33 (34.4%) | 17 (21.2%) |
| 16 and 17 Years | 9 (5.8%) | 41 (20.7%) |
| 18 to 24 Years | 0 (0.0%) | 0 (0.0%) |
| 25 to 34 Years | 69 (8.3%) | 159 (19.7%) |
| 35 to 44 Years | 97 (11.2%) | 75 (9.6%) |
| 45 to 54 Years | 23 (2.5%) | 91 (9.6%) |
| 55 to 64 Years | 125 (12.5%) | 95 (10.3%) |
| 65 to 74 Years | 40 (4.7%) | 27 (4.0%) |
| 75 Years and over | 14 (3.8%) | 42 (8.7%) |
| Total | 690 (9.9%) | 809 (12.2%) |
Income Above Poverty by Sex and Age in Converse County
According to the poverty statistics in Converse County, males aged 5 years and females aged 18 to 24 years are the age groups that are most secure financially, with 100.0% of males and 100.0% of females in these age groups living above the poverty line.
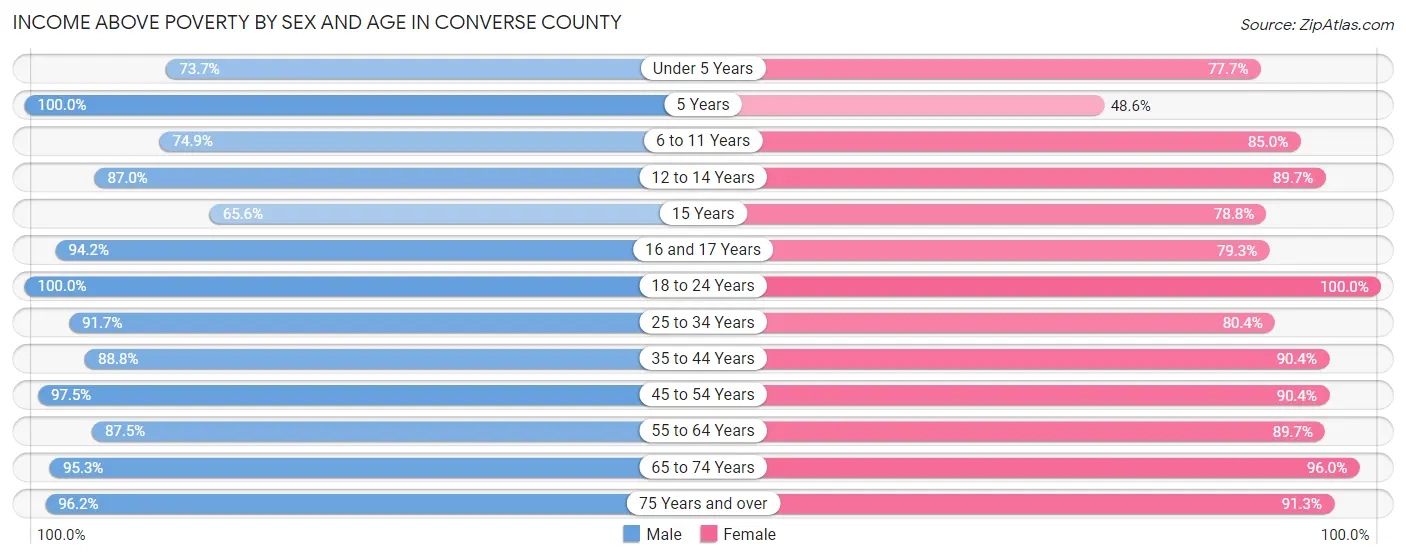
| Age Bracket | Male | Female |
| Under 5 Years | 361 (73.7%) | 299 (77.7%) |
| 5 Years | 142 (100.0%) | 70 (48.6%) |
| 6 to 11 Years | 329 (74.9%) | 398 (85.0%) |
| 12 to 14 Years | 275 (87.0%) | 279 (89.7%) |
| 15 Years | 63 (65.6%) | 63 (78.7%) |
| 16 and 17 Years | 147 (94.2%) | 157 (79.3%) |
| 18 to 24 Years | 515 (100.0%) | 406 (100.0%) |
| 25 to 34 Years | 765 (91.7%) | 650 (80.3%) |
| 35 to 44 Years | 766 (88.8%) | 705 (90.4%) |
| 45 to 54 Years | 905 (97.5%) | 856 (90.4%) |
| 55 to 64 Years | 874 (87.5%) | 823 (89.6%) |
| 65 to 74 Years | 809 (95.3%) | 650 (96.0%) |
| 75 Years and over | 352 (96.2%) | 441 (91.3%) |
| Total | 6,303 (90.1%) | 5,797 (87.7%) |
Income Below Poverty Among Married-Couple Families in Converse County
The poverty statistics for married-couple families in Converse County show that 3.4% or 104 of the total 3,067 families live below the poverty line. Families with 3 or 4 children have the highest poverty rate of 14.5%, comprising of 48 families. On the other hand, families with no children have the lowest poverty rate of 1.5%, which includes 28 families.
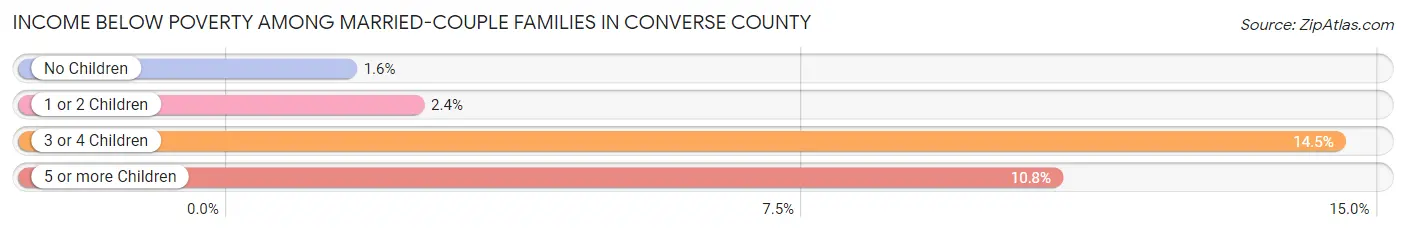
| Children | Above Poverty | Below Poverty |
| No Children | 1,777 (98.5%) | 28 (1.5%) |
| 1 or 2 Children | 844 (97.6%) | 21 (2.4%) |
| 3 or 4 Children | 284 (85.5%) | 48 (14.5%) |
| 5 or more Children | 58 (89.2%) | 7 (10.8%) |
| Total | 2,963 (96.6%) | 104 (3.4%) |
Income Below Poverty Among Single-Parent Households in Converse County
According to the poverty data in Converse County, 7.7% or 17 single-father households and 35.4% or 155 single-mother households are living below the poverty line. Among single-father households, those with 3 or 4 children have the highest poverty rate, with 11 households (100.0%) experiencing poverty. Likewise, among single-mother households, those with 3 or 4 children have the highest poverty rate, with 10 households (38.5%) falling below the poverty line.
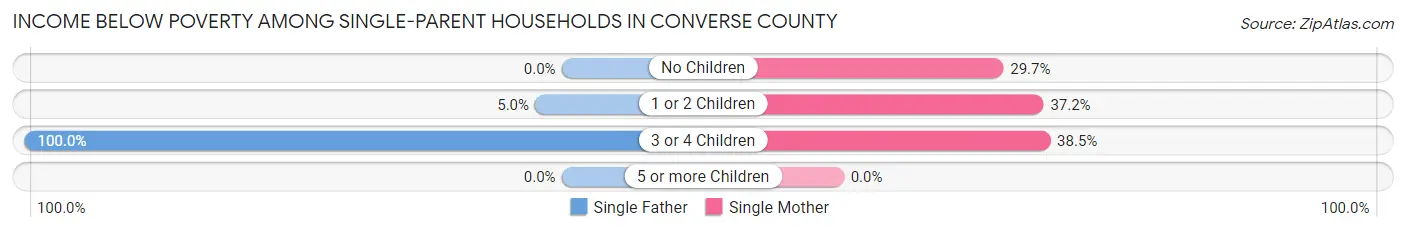
| Children | Single Father | Single Mother |
| No Children | 0 (0.0%) | 33 (29.7%) |
| 1 or 2 Children | 6 (5.0%) | 112 (37.2%) |
| 3 or 4 Children | 11 (100.0%) | 10 (38.5%) |
| 5 or more Children | 0 (0.0%) | 0 (0.0%) |
| Total | 17 (7.7%) | 155 (35.4%) |
Income Below Poverty Among Married-Couple vs Single-Parent Households in Converse County
The poverty data for Converse County shows that 104 of the married-couple family households (3.4%) and 172 of the single-parent households (26.1%) are living below the poverty level. Within the married-couple family households, those with 3 or 4 children have the highest poverty rate, with 48 households (14.5%) falling below the poverty line. Among the single-parent households, those with 3 or 4 children have the highest poverty rate, with 21 household (56.8%) living below poverty.
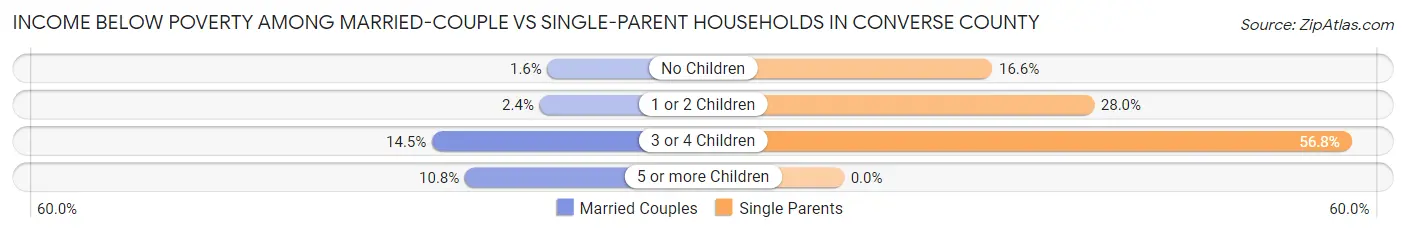
| Children | Married-Couple Families | Single-Parent Households |
| No Children | 28 (1.5%) | 33 (16.6%) |
| 1 or 2 Children | 21 (2.4%) | 118 (28.0%) |
| 3 or 4 Children | 48 (14.5%) | 21 (56.8%) |
| 5 or more Children | 7 (10.8%) | 0 (0.0%) |
| Total | 104 (3.4%) | 172 (26.1%) |
Employment Characteristics in Converse County
Employment by Class of Employer in Converse County
Among the 6,843 employed individuals in Converse County, private company employees (4,206 | 61.5%), local government employees (1,091 | 15.9%), and self-employed (not incorporated) (499 | 7.3%) make up the most common classes of employment.
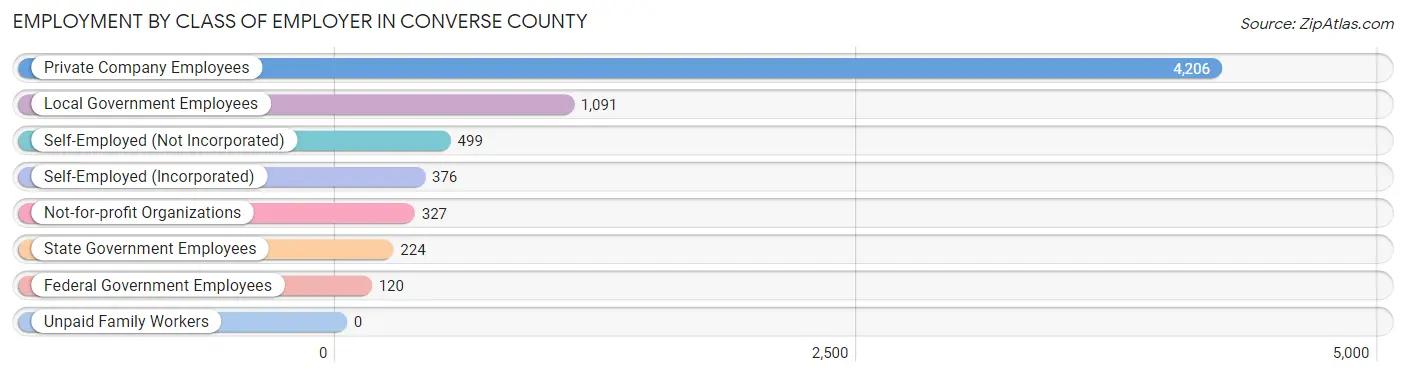
| Employer Class | # Employees | % Employees |
| Private Company Employees | 4,206 | 61.5% |
| Self-Employed (Incorporated) | 376 | 5.5% |
| Self-Employed (Not Incorporated) | 499 | 7.3% |
| Not-for-profit Organizations | 327 | 4.8% |
| Local Government Employees | 1,091 | 15.9% |
| State Government Employees | 224 | 3.3% |
| Federal Government Employees | 120 | 1.8% |
| Unpaid Family Workers | 0 | 0.0% |
| Total | 6,843 | 100.0% |
Employment Status by Age in Converse County
According to the labor force statistics for Converse County, out of the total population over 16 years of age (10,782), 66.7% or 7,192 individuals are in the labor force, with 4.3% or 309 of them unemployed. The age group with the highest labor force participation rate is 20 to 24 years, with 90.0% or 513 individuals in the labor force. Within the labor force, the 16 to 19 years age range has the highest percentage of unemployed individuals, with 24.3% or 106 of them being unemployed.
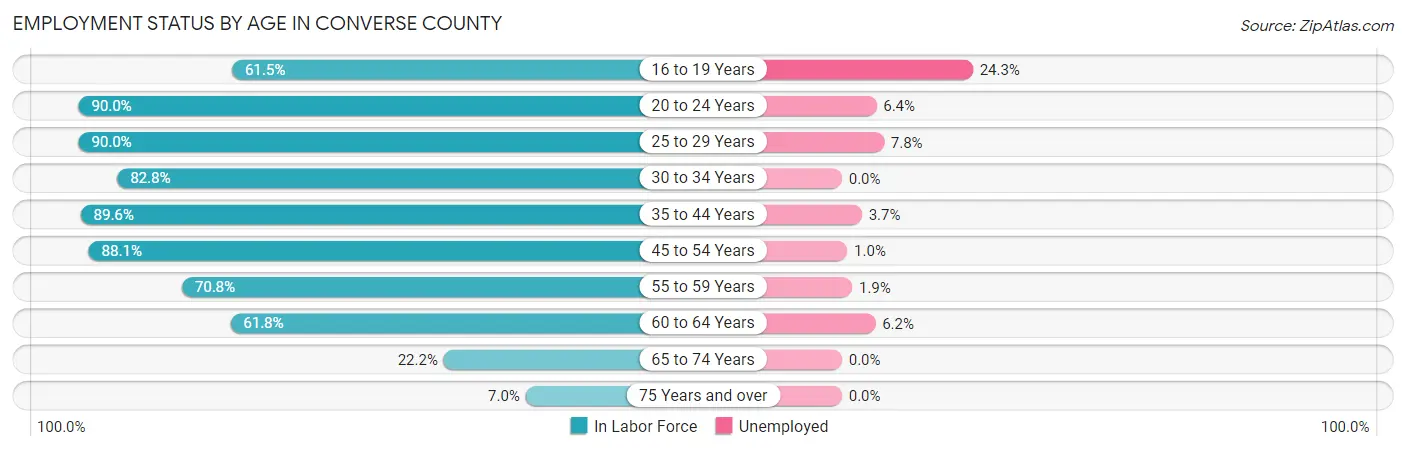
| Age Bracket | In Labor Force | Unemployed |
| 16 to 19 Years | 438 (61.5%) | 106 (24.3%) |
| 20 to 24 Years | 513 (90.0%) | 33 (6.4%) |
| 25 to 29 Years | 690 (90.0%) | 54 (7.8%) |
| 30 to 34 Years | 730 (82.8%) | 0 (0.0%) |
| 35 to 44 Years | 1,479 (89.6%) | 55 (3.7%) |
| 45 to 54 Years | 1,662 (88.1%) | 17 (1.0%) |
| 55 to 59 Years | 746 (70.8%) | 14 (1.9%) |
| 60 to 64 Years | 534 (61.8%) | 33 (6.2%) |
| 65 to 74 Years | 341 (22.2%) | 0 (0.0%) |
| 75 Years and over | 60 (7.0%) | 0 (0.0%) |
| Total | 7,192 (66.7%) | 309 (4.3%) |
Employment Status by Educational Attainment in Converse County
According to labor force statistics for Converse County, 82.2% of individuals (5,839) out of the total population between 25 and 64 years of age (7,103) are in the labor force, with 2.9% or 169 of them being unemployed. The group with the highest labor force participation rate are those with the educational attainment of bachelor's degree or higher, with 91.7% or 1,348 individuals in the labor force. Within the labor force, individuals with bachelor's degree or higher education have the highest percentage of unemployment, with 5.0% or 67 of them being unemployed.
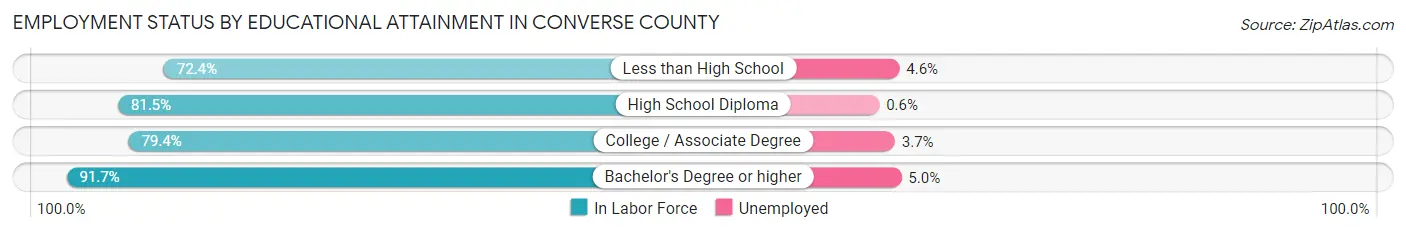
| Educational Attainment | In Labor Force | Unemployed |
| Less than High School | 372 (72.4%) | 24 (4.6%) |
| High School Diploma | 2,165 (81.5%) | 16 (0.6%) |
| College / Associate Degree | 1,956 (79.4%) | 91 (3.7%) |
| Bachelor's Degree or higher | 1,348 (91.7%) | 74 (5.0%) |
| Total | 5,839 (82.2%) | 206 (2.9%) |
Employment Occupations by Sex in Converse County
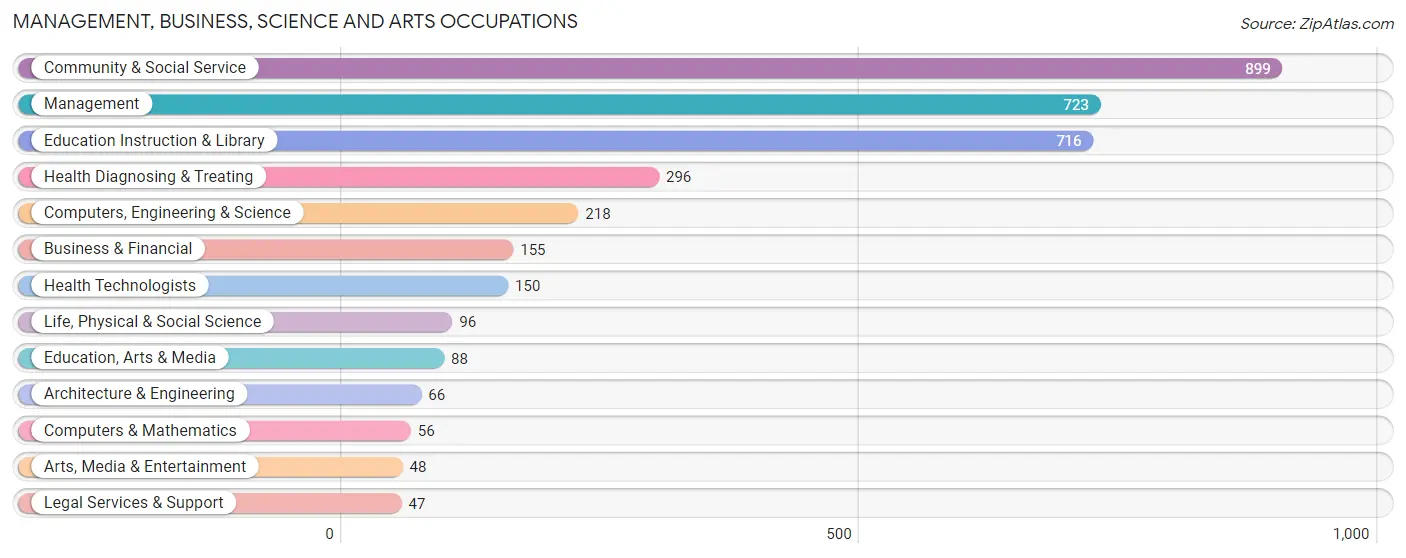
Management, Business, Science and Arts Occupations
The most common Management, Business, Science and Arts occupations in Converse County are Community & Social Service (899 | 13.1%), Management (723 | 10.5%), Education Instruction & Library (716 | 10.4%), Health Diagnosing & Treating (296 | 4.3%), and Computers, Engineering & Science (218 | 3.2%).
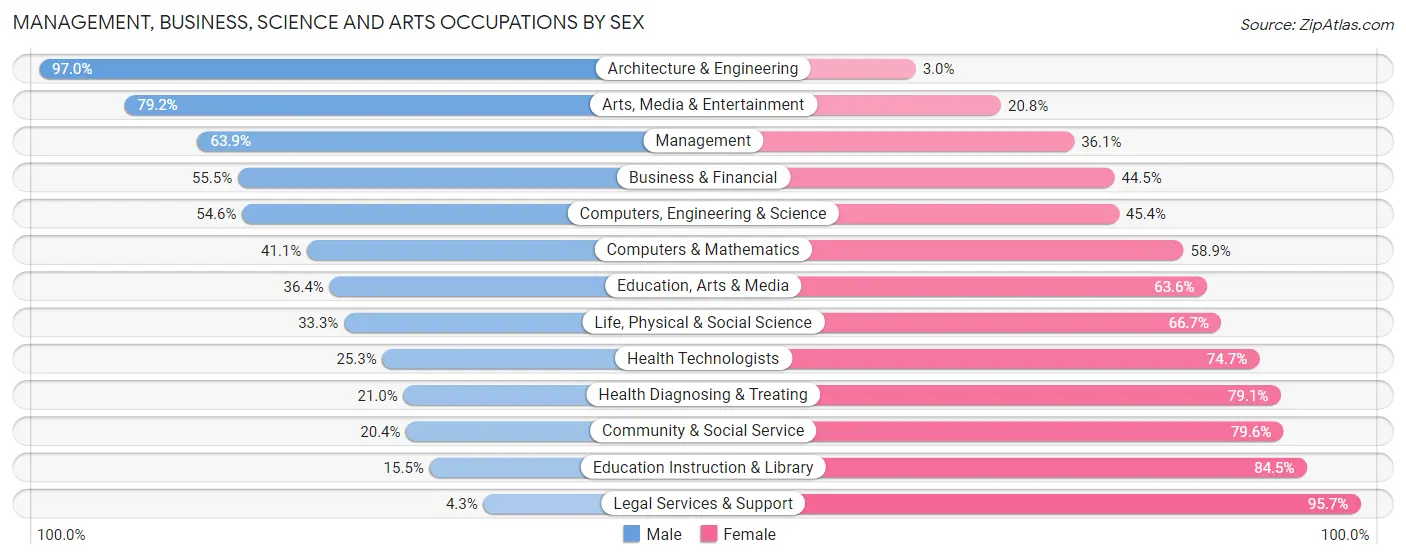
Management, Business, Science and Arts Occupations by Sex
Within the Management, Business, Science and Arts occupations in Converse County, the most male-oriented occupations are Architecture & Engineering (97.0%), Arts, Media & Entertainment (79.2%), and Management (63.9%), while the most female-oriented occupations are Legal Services & Support (95.7%), Education Instruction & Library (84.5%), and Community & Social Service (79.6%).
| Occupation | Male | Female |
| Management | 462 (63.9%) | 261 (36.1%) |
| Business & Financial | 86 (55.5%) | 69 (44.5%) |
| Computers, Engineering & Science | 119 (54.6%) | 99 (45.4%) |
| Computers & Mathematics | 23 (41.1%) | 33 (58.9%) |
| Architecture & Engineering | 64 (97.0%) | 2 (3.0%) |
| Life, Physical & Social Science | 32 (33.3%) | 64 (66.7%) |
| Community & Social Service | 183 (20.4%) | 716 (79.6%) |
| Education, Arts & Media | 32 (36.4%) | 56 (63.6%) |
| Legal Services & Support | 2 (4.3%) | 45 (95.7%) |
| Education Instruction & Library | 111 (15.5%) | 605 (84.5%) |
| Arts, Media & Entertainment | 38 (79.2%) | 10 (20.8%) |
| Health Diagnosing & Treating | 62 (20.9%) | 234 (79.0%) |
| Health Technologists | 38 (25.3%) | 112 (74.7%) |
| Total (Category) | 912 (39.8%) | 1,379 (60.2%) |
| Total (Overall) | 3,771 (54.9%) | 3,096 (45.1%) |
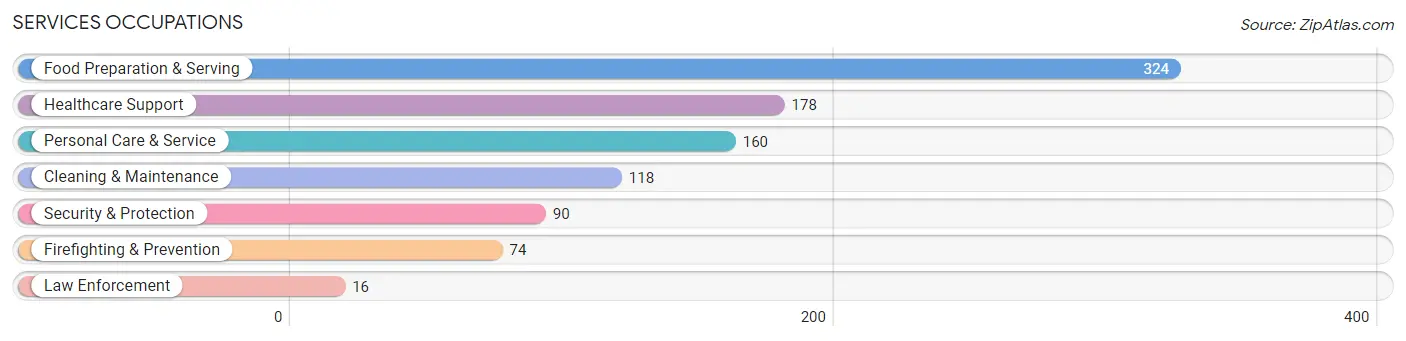
Services Occupations
The most common Services occupations in Converse County are Food Preparation & Serving (324 | 4.7%), Healthcare Support (178 | 2.6%), Personal Care & Service (160 | 2.3%), Cleaning & Maintenance (118 | 1.7%), and Security & Protection (90 | 1.3%).
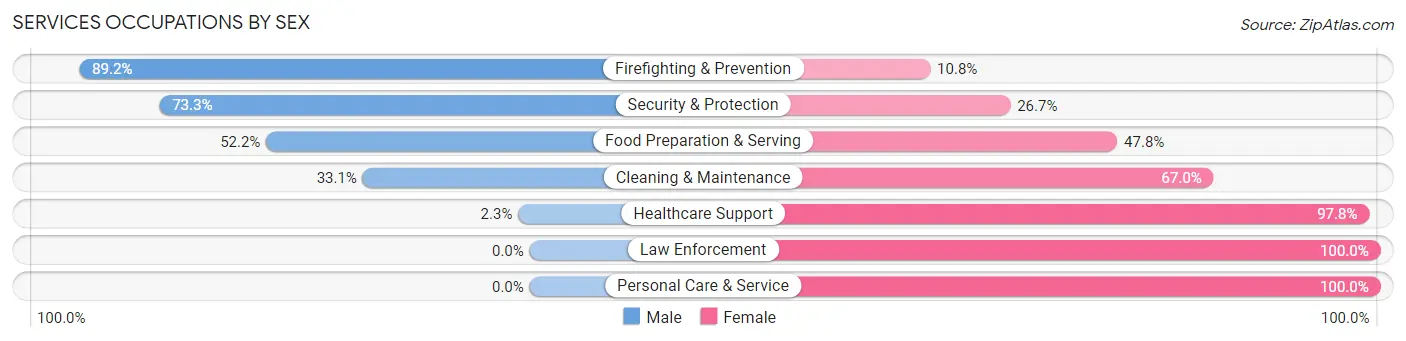
Services Occupations by Sex
Within the Services occupations in Converse County, the most male-oriented occupations are Firefighting & Prevention (89.2%), Security & Protection (73.3%), and Food Preparation & Serving (52.2%), while the most female-oriented occupations are Law Enforcement (100.0%), Personal Care & Service (100.0%), and Healthcare Support (97.8%).
| Occupation | Male | Female |
| Healthcare Support | 4 (2.2%) | 174 (97.8%) |
| Security & Protection | 66 (73.3%) | 24 (26.7%) |
| Firefighting & Prevention | 66 (89.2%) | 8 (10.8%) |
| Law Enforcement | 0 (0.0%) | 16 (100.0%) |
| Food Preparation & Serving | 169 (52.2%) | 155 (47.8%) |
| Cleaning & Maintenance | 39 (33.1%) | 79 (66.9%) |
| Personal Care & Service | 0 (0.0%) | 160 (100.0%) |
| Total (Category) | 278 (32.0%) | 592 (68.0%) |
| Total (Overall) | 3,771 (54.9%) | 3,096 (45.1%) |
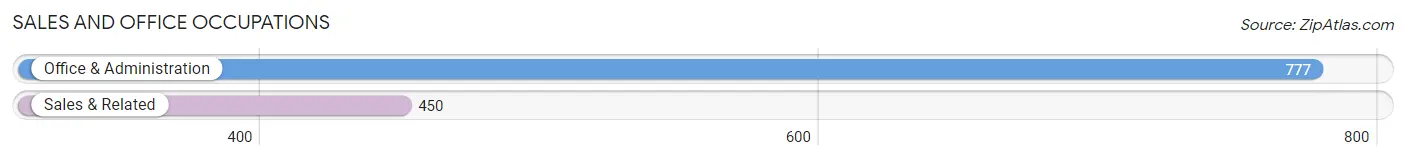
Sales and Office Occupations
The most common Sales and Office occupations in Converse County are Office & Administration (777 | 11.3%), and Sales & Related (450 | 6.6%).
Sales and Office Occupations by Sex
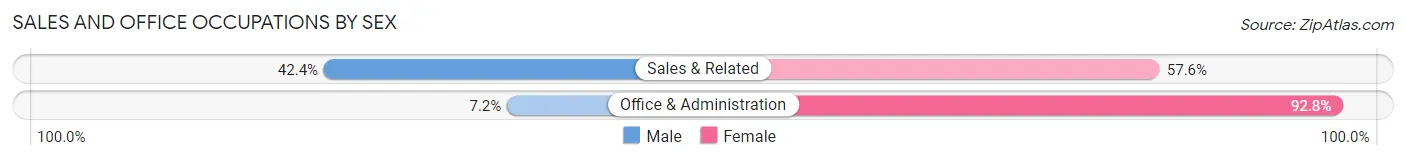
| Occupation | Male | Female |
| Sales & Related | 191 (42.4%) | 259 (57.6%) |
| Office & Administration | 56 (7.2%) | 721 (92.8%) |
| Total (Category) | 247 (20.1%) | 980 (79.9%) |
| Total (Overall) | 3,771 (54.9%) | 3,096 (45.1%) |
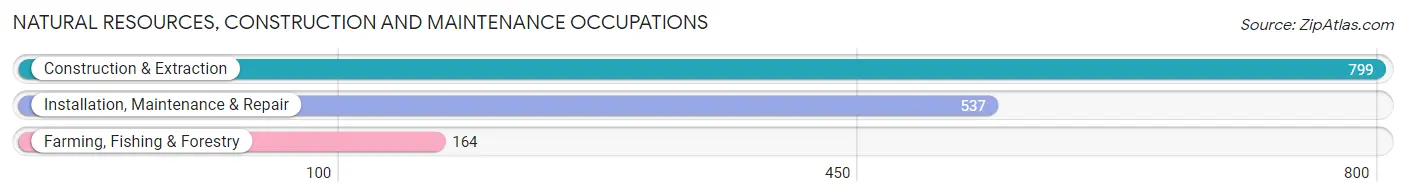
Natural Resources, Construction and Maintenance Occupations
The most common Natural Resources, Construction and Maintenance occupations in Converse County are Construction & Extraction (799 | 11.6%), Installation, Maintenance & Repair (537 | 7.8%), and Farming, Fishing & Forestry (164 | 2.4%).
Natural Resources, Construction and Maintenance Occupations by Sex
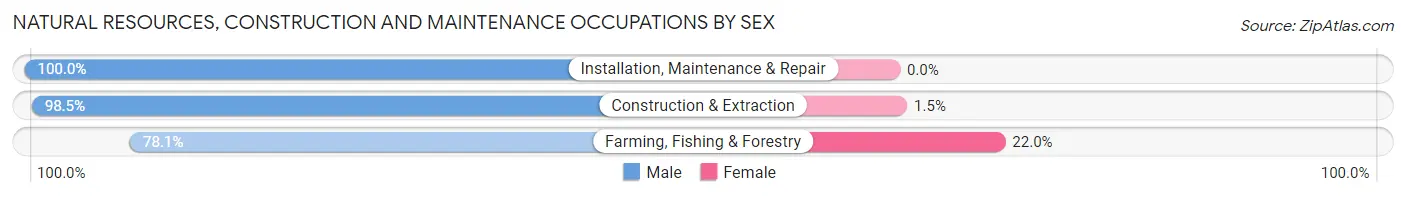
| Occupation | Male | Female |
| Farming, Fishing & Forestry | 128 (78.0%) | 36 (22.0%) |
| Construction & Extraction | 787 (98.5%) | 12 (1.5%) |
| Installation, Maintenance & Repair | 537 (100.0%) | 0 (0.0%) |
| Total (Category) | 1,452 (96.8%) | 48 (3.2%) |
| Total (Overall) | 3,771 (54.9%) | 3,096 (45.1%) |
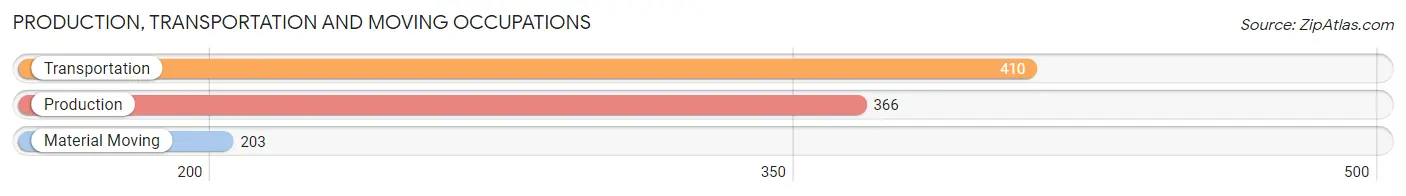
Production, Transportation and Moving Occupations
The most common Production, Transportation and Moving occupations in Converse County are Transportation (410 | 6.0%), Production (366 | 5.3%), and Material Moving (203 | 3.0%).
Production, Transportation and Moving Occupations by Sex
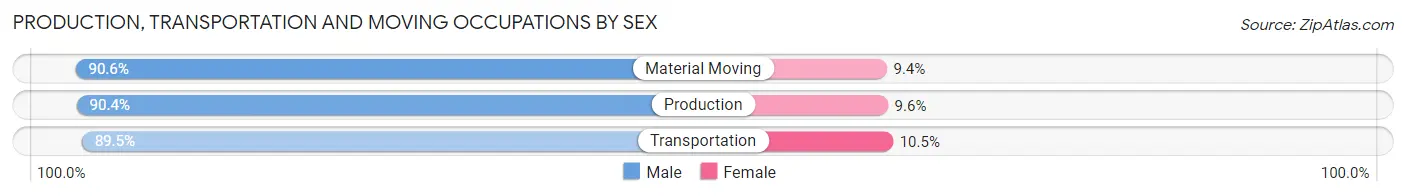
| Occupation | Male | Female |
| Production | 331 (90.4%) | 35 (9.6%) |
| Transportation | 367 (89.5%) | 43 (10.5%) |
| Material Moving | 184 (90.6%) | 19 (9.4%) |
| Total (Category) | 882 (90.1%) | 97 (9.9%) |
| Total (Overall) | 3,771 (54.9%) | 3,096 (45.1%) |
Employment Industries by Sex in Converse County
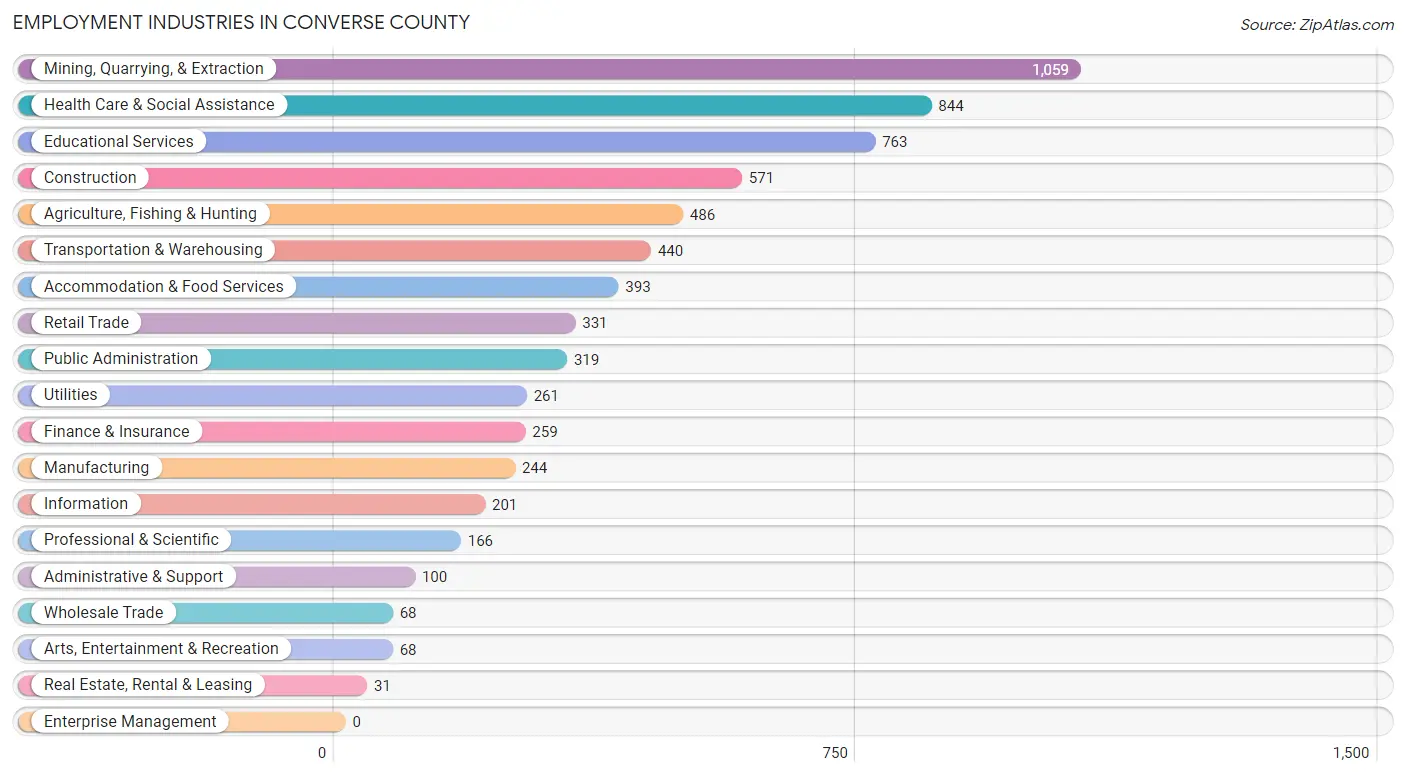
Employment Industries in Converse County
The major employment industries in Converse County include Mining, Quarrying, & Extraction (1,059 | 15.4%), Health Care & Social Assistance (844 | 12.3%), Educational Services (763 | 11.1%), Construction (571 | 8.3%), and Agriculture, Fishing & Hunting (486 | 7.1%).
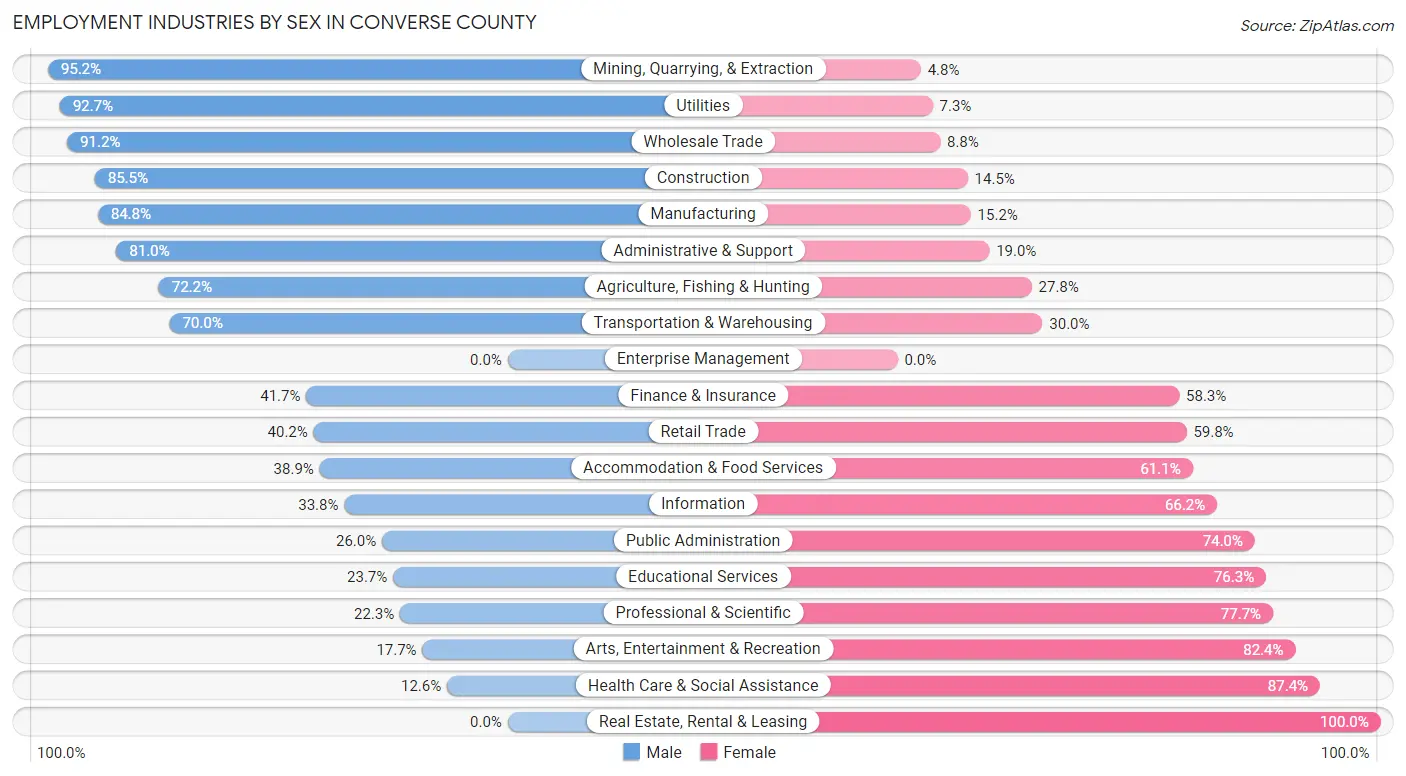
Employment Industries by Sex in Converse County
The Converse County industries that see more men than women are Mining, Quarrying, & Extraction (95.2%), Utilities (92.7%), and Wholesale Trade (91.2%), whereas the industries that tend to have a higher number of women are Real Estate, Rental & Leasing (100.0%), Health Care & Social Assistance (87.4%), and Arts, Entertainment & Recreation (82.4%).
| Industry | Male | Female |
| Agriculture, Fishing & Hunting | 351 (72.2%) | 135 (27.8%) |
| Mining, Quarrying, & Extraction | 1,008 (95.2%) | 51 (4.8%) |
| Construction | 488 (85.5%) | 83 (14.5%) |
| Manufacturing | 207 (84.8%) | 37 (15.2%) |
| Wholesale Trade | 62 (91.2%) | 6 (8.8%) |
| Retail Trade | 133 (40.2%) | 198 (59.8%) |
| Transportation & Warehousing | 308 (70.0%) | 132 (30.0%) |
| Utilities | 242 (92.7%) | 19 (7.3%) |
| Information | 68 (33.8%) | 133 (66.2%) |
| Finance & Insurance | 108 (41.7%) | 151 (58.3%) |
| Real Estate, Rental & Leasing | 0 (0.0%) | 31 (100.0%) |
| Professional & Scientific | 37 (22.3%) | 129 (77.7%) |
| Enterprise Management | 0 (0.0%) | 0 (0.0%) |
| Administrative & Support | 81 (81.0%) | 19 (19.0%) |
| Educational Services | 181 (23.7%) | 582 (76.3%) |
| Health Care & Social Assistance | 106 (12.6%) | 738 (87.4%) |
| Arts, Entertainment & Recreation | 12 (17.6%) | 56 (82.4%) |
| Accommodation & Food Services | 153 (38.9%) | 240 (61.1%) |
| Public Administration | 83 (26.0%) | 236 (74.0%) |
| Total | 3,771 (54.9%) | 3,096 (45.1%) |
Education in Converse County
School Enrollment in Converse County
The most common levels of schooling among the 3,020 students in Converse County are high school (785 | 26.0%), middle school (773 | 25.6%), and elementary school (497 | 16.5%).
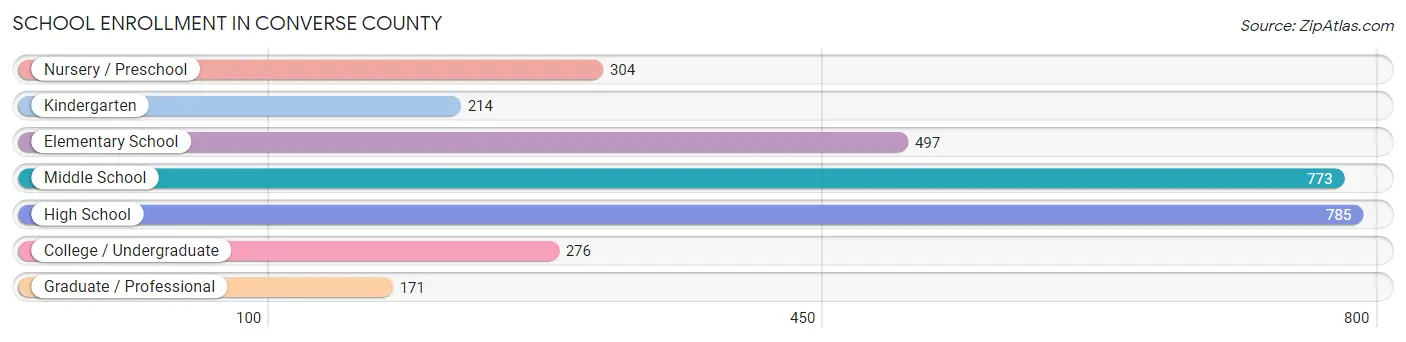
| School Level | # Students | % Students |
| Nursery / Preschool | 304 | 10.1% |
| Kindergarten | 214 | 7.1% |
| Elementary School | 497 | 16.5% |
| Middle School | 773 | 25.6% |
| High School | 785 | 26.0% |
| College / Undergraduate | 276 | 9.1% |
| Graduate / Professional | 171 | 5.7% |
| Total | 3,020 | 100.0% |
School Enrollment by Age by Funding Source in Converse County
Out of a total of 3,020 students who are enrolled in schools in Converse County, 338 (11.2%) attend a private institution, while the remaining 2,682 (88.8%) are enrolled in public schools. The age group of 20 to 24 year olds has the highest likelihood of being enrolled in private schools, with 22 (22.5% in the age bracket) enrolled. Conversely, the age group of 18 to 19 year olds has the lowest likelihood of being enrolled in a private school, with 173 (96.7% in the age bracket) attending a public institution.
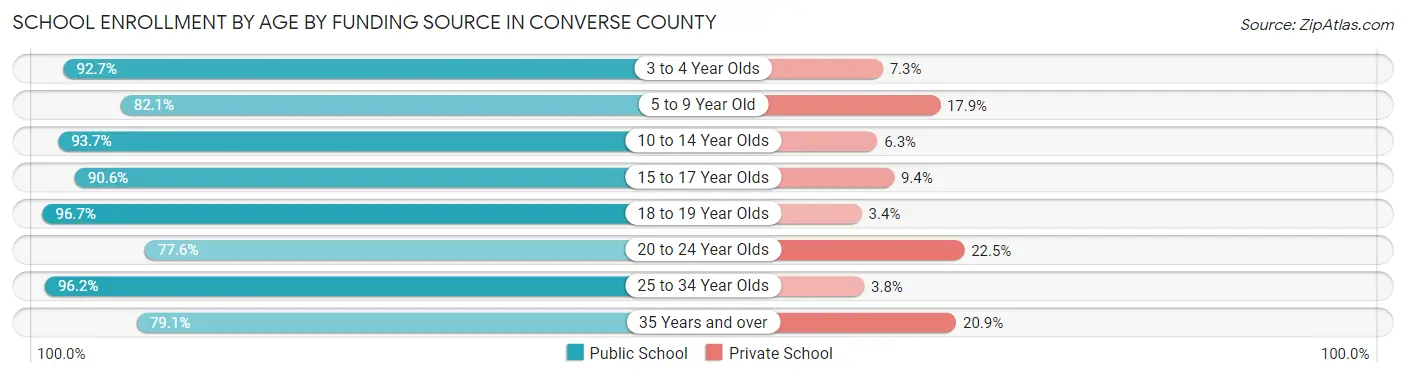
| Age Bracket | Public School | Private School |
| 3 to 4 Year Olds | 102 (92.7%) | 8 (7.3%) |
| 5 to 9 Year Old | 682 (82.1%) | 149 (17.9%) |
| 10 to 14 Year Olds | 882 (93.7%) | 59 (6.3%) |
| 15 to 17 Year Olds | 464 (90.6%) | 48 (9.4%) |
| 18 to 19 Year Olds | 173 (96.7%) | 6 (3.4%) |
| 20 to 24 Year Olds | 76 (77.5%) | 22 (22.5%) |
| 25 to 34 Year Olds | 152 (96.2%) | 6 (3.8%) |
| 35 Years and over | 151 (79.1%) | 40 (20.9%) |
| Total | 2,682 (88.8%) | 338 (11.2%) |
Educational Attainment by Field of Study in Converse County
Education (742 | 32.3%), business (401 | 17.5%), science & technology (350 | 15.2%), bio, nature & agricultural (308 | 13.4%), and arts & humanities (197 | 8.6%) are the most common fields of study among 2,297 individuals in Converse County who have obtained a bachelor's degree or higher.
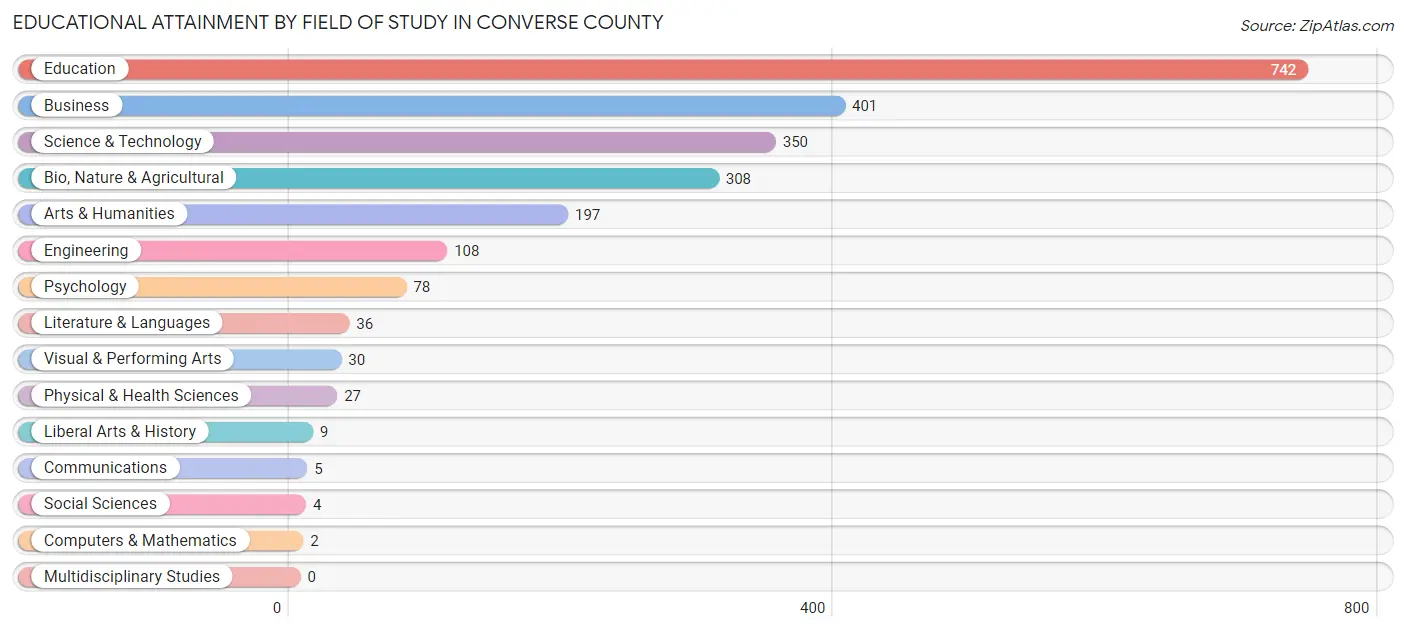
| Field of Study | # Graduates | % Graduates |
| Computers & Mathematics | 2 | 0.1% |
| Bio, Nature & Agricultural | 308 | 13.4% |
| Physical & Health Sciences | 27 | 1.2% |
| Psychology | 78 | 3.4% |
| Social Sciences | 4 | 0.2% |
| Engineering | 108 | 4.7% |
| Multidisciplinary Studies | 0 | 0.0% |
| Science & Technology | 350 | 15.2% |
| Business | 401 | 17.5% |
| Education | 742 | 32.3% |
| Literature & Languages | 36 | 1.6% |
| Liberal Arts & History | 9 | 0.4% |
| Visual & Performing Arts | 30 | 1.3% |
| Communications | 5 | 0.2% |
| Arts & Humanities | 197 | 8.6% |
| Total | 2,297 | 100.0% |
Transportation & Commute in Converse County
Vehicle Availability by Sex in Converse County
The most prevalent vehicle ownership categories in Converse County are males with 3 vehicles (1,168, accounting for 31.3%) and females with 3 vehicles (861, making up 37.6%).
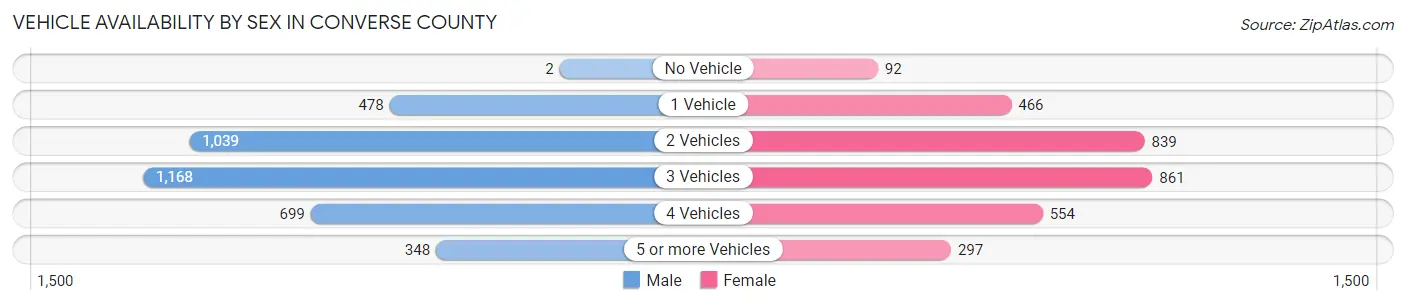
| Vehicles Available | Male | Female |
| No Vehicle | 2 (0.1%) | 92 (3.0%) |
| 1 Vehicle | 478 (12.8%) | 466 (15.0%) |
| 2 Vehicles | 1,039 (27.8%) | 839 (27.0%) |
| 3 Vehicles | 1,168 (31.3%) | 861 (27.7%) |
| 4 Vehicles | 699 (18.7%) | 554 (17.8%) |
| 5 or more Vehicles | 348 (9.3%) | 297 (9.6%) |
| Total | 3,734 (100.0%) | 3,109 (100.0%) |
Commute Time in Converse County
The most frequently occuring commute durations in Converse County are 5 to 9 minutes (1,696 commuters, 26.4%), 10 to 14 minutes (910 commuters, 14.2%), and less than 5 minutes (730 commuters, 11.4%).
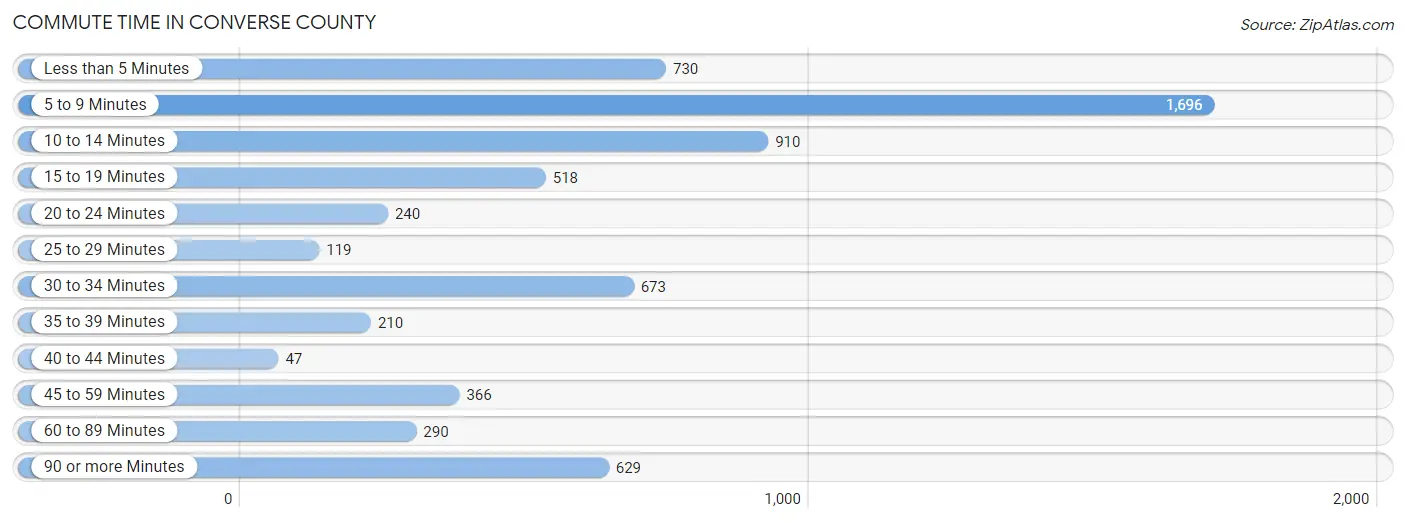
| Commute Time | # Commuters | % Commuters |
| Less than 5 Minutes | 730 | 11.4% |
| 5 to 9 Minutes | 1,696 | 26.4% |
| 10 to 14 Minutes | 910 | 14.2% |
| 15 to 19 Minutes | 518 | 8.1% |
| 20 to 24 Minutes | 240 | 3.7% |
| 25 to 29 Minutes | 119 | 1.8% |
| 30 to 34 Minutes | 673 | 10.5% |
| 35 to 39 Minutes | 210 | 3.3% |
| 40 to 44 Minutes | 47 | 0.7% |
| 45 to 59 Minutes | 366 | 5.7% |
| 60 to 89 Minutes | 290 | 4.5% |
| 90 or more Minutes | 629 | 9.8% |
Commute Time by Sex in Converse County
The most common commute times in Converse County are 5 to 9 minutes (803 commuters, 22.3%) for males and 5 to 9 minutes (893 commuters, 31.6%) for females.
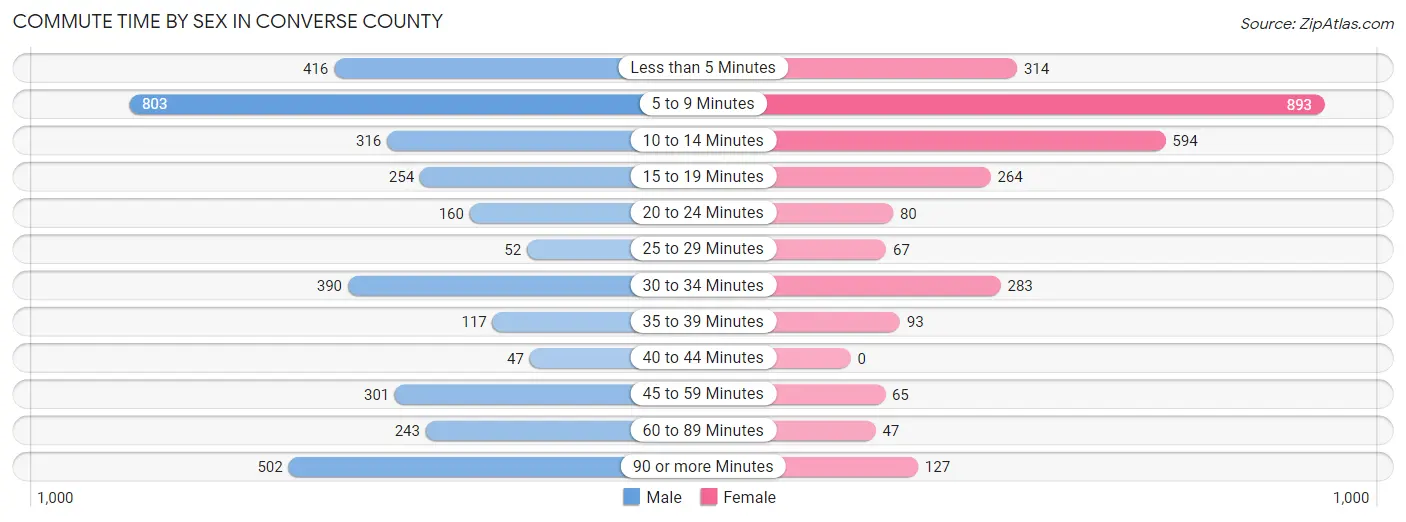
| Commute Time | Male | Female |
| Less than 5 Minutes | 416 (11.6%) | 314 (11.1%) |
| 5 to 9 Minutes | 803 (22.3%) | 893 (31.6%) |
| 10 to 14 Minutes | 316 (8.8%) | 594 (21.0%) |
| 15 to 19 Minutes | 254 (7.0%) | 264 (9.3%) |
| 20 to 24 Minutes | 160 (4.4%) | 80 (2.8%) |
| 25 to 29 Minutes | 52 (1.4%) | 67 (2.4%) |
| 30 to 34 Minutes | 390 (10.8%) | 283 (10.0%) |
| 35 to 39 Minutes | 117 (3.3%) | 93 (3.3%) |
| 40 to 44 Minutes | 47 (1.3%) | 0 (0.0%) |
| 45 to 59 Minutes | 301 (8.4%) | 65 (2.3%) |
| 60 to 89 Minutes | 243 (6.8%) | 47 (1.7%) |
| 90 or more Minutes | 502 (13.9%) | 127 (4.5%) |
Time of Departure to Work by Sex in Converse County
The most frequent times of departure to work in Converse County are 6:30 AM to 6:59 AM (569, 15.8%) for males and 7:00 AM to 7:29 AM (679, 24.0%) for females.
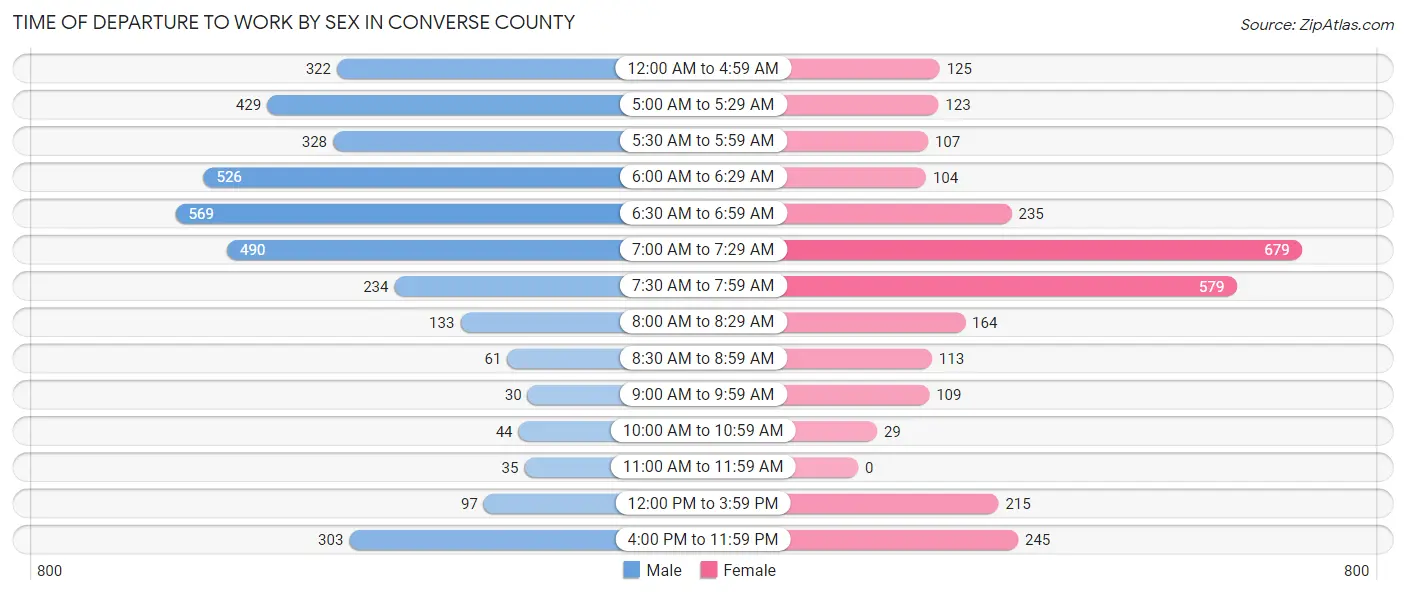
| Time of Departure | Male | Female |
| 12:00 AM to 4:59 AM | 322 (8.9%) | 125 (4.4%) |
| 5:00 AM to 5:29 AM | 429 (11.9%) | 123 (4.3%) |
| 5:30 AM to 5:59 AM | 328 (9.1%) | 107 (3.8%) |
| 6:00 AM to 6:29 AM | 526 (14.6%) | 104 (3.7%) |
| 6:30 AM to 6:59 AM | 569 (15.8%) | 235 (8.3%) |
| 7:00 AM to 7:29 AM | 490 (13.6%) | 679 (24.0%) |
| 7:30 AM to 7:59 AM | 234 (6.5%) | 579 (20.5%) |
| 8:00 AM to 8:29 AM | 133 (3.7%) | 164 (5.8%) |
| 8:30 AM to 8:59 AM | 61 (1.7%) | 113 (4.0%) |
| 9:00 AM to 9:59 AM | 30 (0.8%) | 109 (3.9%) |
| 10:00 AM to 10:59 AM | 44 (1.2%) | 29 (1.0%) |
| 11:00 AM to 11:59 AM | 35 (1.0%) | 0 (0.0%) |
| 12:00 PM to 3:59 PM | 97 (2.7%) | 215 (7.6%) |
| 4:00 PM to 11:59 PM | 303 (8.4%) | 245 (8.7%) |
| Total | 3,601 (100.0%) | 2,827 (100.0%) |
Housing Occupancy in Converse County
Occupancy by Ownership in Converse County
Of the total 5,656 dwellings in Converse County, owner-occupied units account for 4,554 (80.5%), while renter-occupied units make up 1,102 (19.5%).
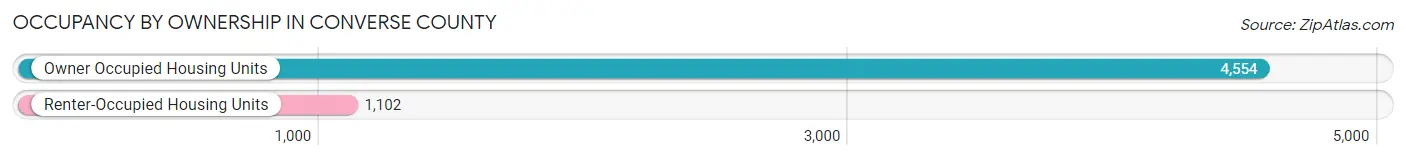
| Occupancy | # Housing Units | % Housing Units |
| Owner Occupied Housing Units | 4,554 | 80.5% |
| Renter-Occupied Housing Units | 1,102 | 19.5% |
| Total Occupied Housing Units | 5,656 | 100.0% |
Occupancy by Household Size in Converse County
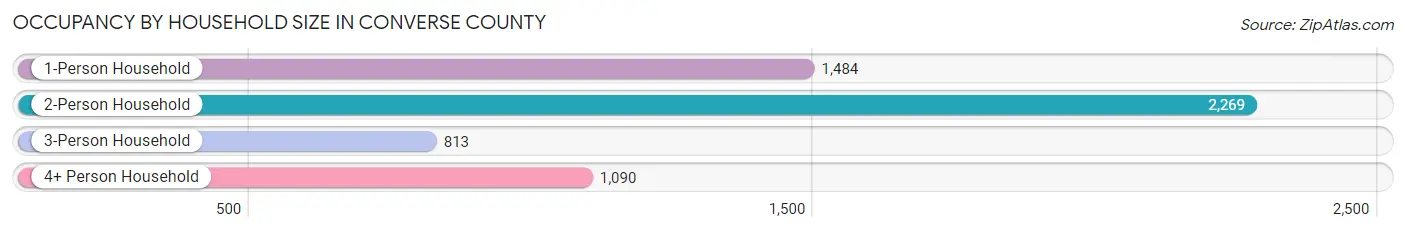
| Household Size | # Housing Units | % Housing Units |
| 1-Person Household | 1,484 | 26.2% |
| 2-Person Household | 2,269 | 40.1% |
| 3-Person Household | 813 | 14.4% |
| 4+ Person Household | 1,090 | 19.3% |
| Total Housing Units | 5,656 | 100.0% |
Occupancy by Ownership by Household Size in Converse County
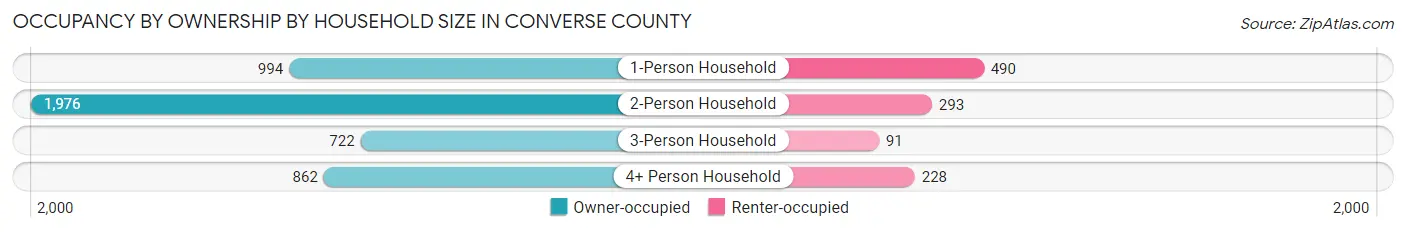
| Household Size | Owner-occupied | Renter-occupied |
| 1-Person Household | 994 (67.0%) | 490 (33.0%) |
| 2-Person Household | 1,976 (87.1%) | 293 (12.9%) |
| 3-Person Household | 722 (88.8%) | 91 (11.2%) |
| 4+ Person Household | 862 (79.1%) | 228 (20.9%) |
| Total Housing Units | 4,554 (80.5%) | 1,102 (19.5%) |
Occupancy by Educational Attainment in Converse County
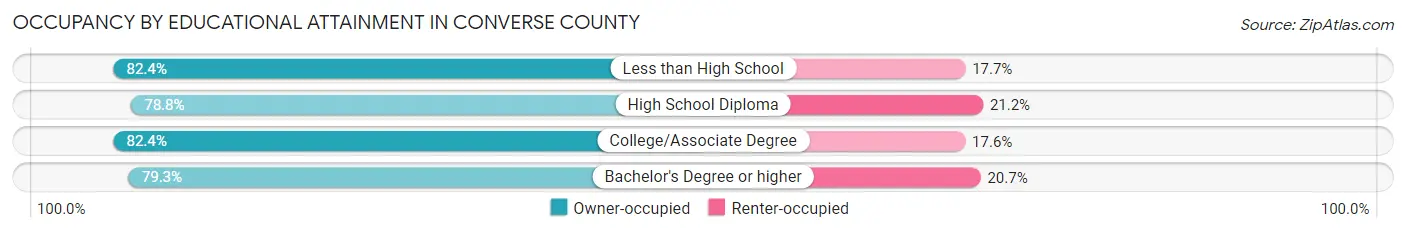
| Household Size | Owner-occupied | Renter-occupied |
| Less than High School | 364 (82.4%) | 78 (17.6%) |
| High School Diploma | 1,471 (78.8%) | 395 (21.2%) |
| College/Associate Degree | 1,718 (82.4%) | 368 (17.6%) |
| Bachelor's Degree or higher | 1,001 (79.3%) | 261 (20.7%) |
Occupancy by Age of Householder in Converse County
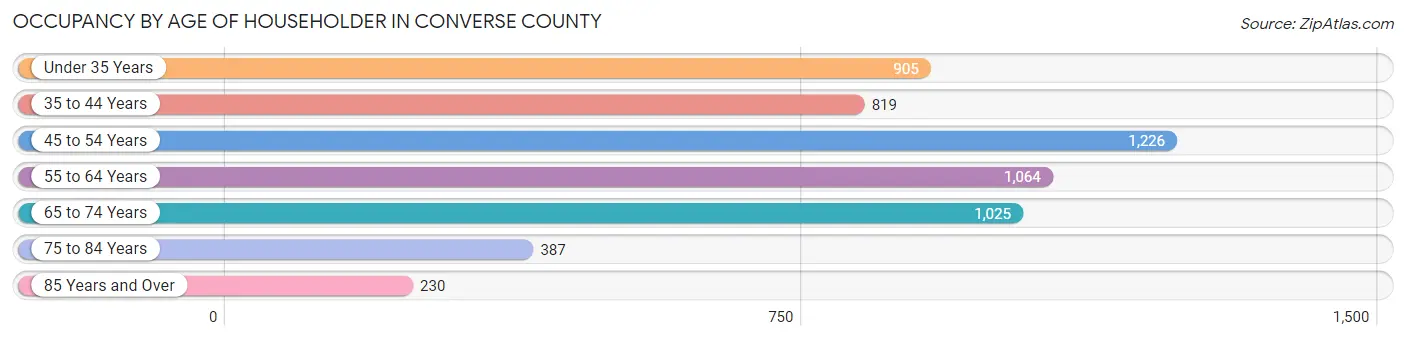
| Age Bracket | # Households | % Households |
| Under 35 Years | 905 | 16.0% |
| 35 to 44 Years | 819 | 14.5% |
| 45 to 54 Years | 1,226 | 21.7% |
| 55 to 64 Years | 1,064 | 18.8% |
| 65 to 74 Years | 1,025 | 18.1% |
| 75 to 84 Years | 387 | 6.8% |
| 85 Years and Over | 230 | 4.1% |
| Total | 5,656 | 100.0% |
Housing Finances in Converse County
Median Income by Occupancy in Converse County
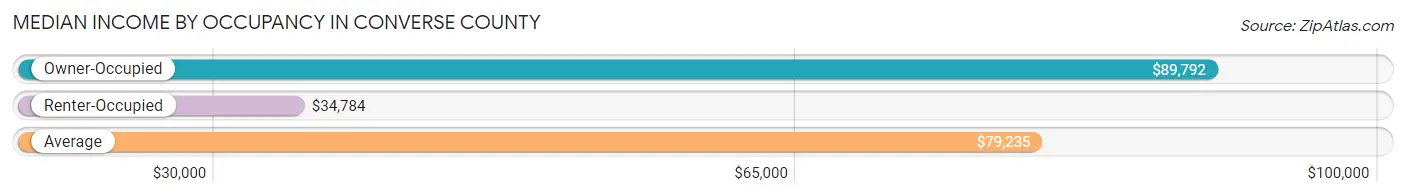
| Occupancy Type | # Households | Median Income |
| Owner-Occupied | 4,554 (80.5%) | $89,792 |
| Renter-Occupied | 1,102 (19.5%) | $34,784 |
| Average | 5,656 (100.0%) | $79,235 |
Occupancy by Householder Income Bracket in Converse County
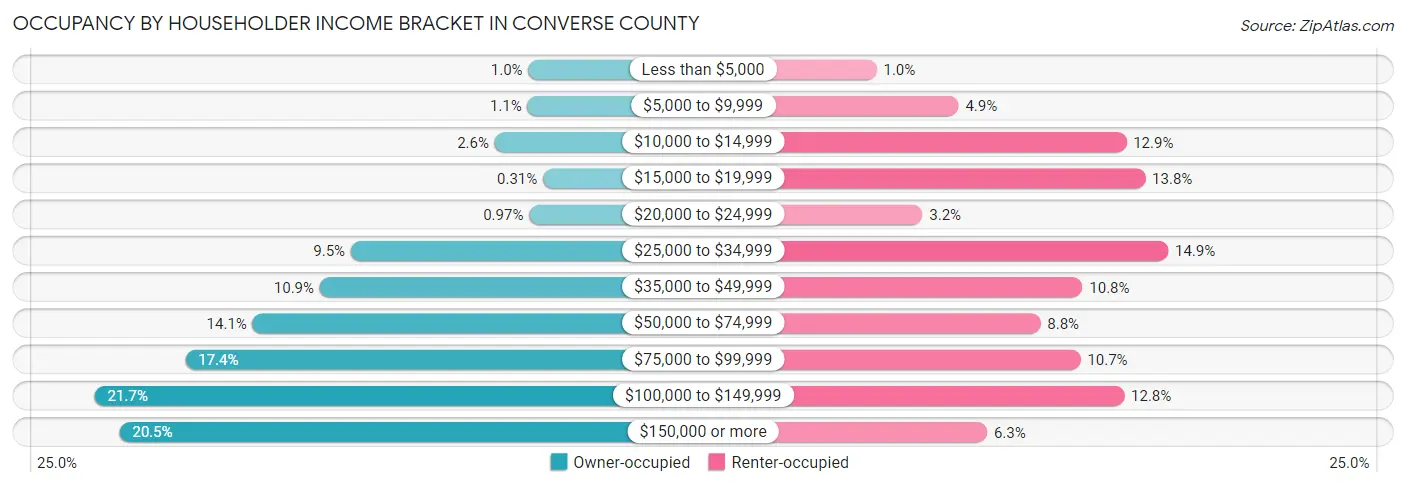
| Income Bracket | Owner-occupied | Renter-occupied |
| Less than $5,000 | 46 (1.0%) | 11 (1.0%) |
| $5,000 to $9,999 | 48 (1.1%) | 54 (4.9%) |
| $10,000 to $14,999 | 119 (2.6%) | 142 (12.9%) |
| $15,000 to $19,999 | 14 (0.3%) | 152 (13.8%) |
| $20,000 to $24,999 | 44 (1.0%) | 35 (3.2%) |
| $25,000 to $34,999 | 431 (9.5%) | 164 (14.9%) |
| $35,000 to $49,999 | 498 (10.9%) | 119 (10.8%) |
| $50,000 to $74,999 | 644 (14.1%) | 97 (8.8%) |
| $75,000 to $99,999 | 790 (17.3%) | 118 (10.7%) |
| $100,000 to $149,999 | 987 (21.7%) | 141 (12.8%) |
| $150,000 or more | 933 (20.5%) | 69 (6.3%) |
| Total | 4,554 (100.0%) | 1,102 (100.0%) |
Monthly Housing Cost Tiers in Converse County
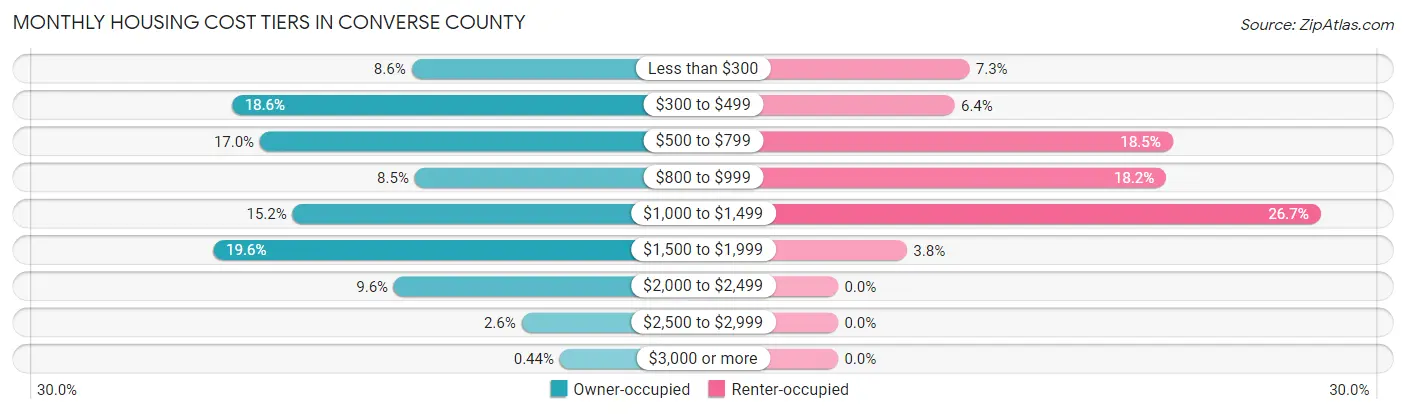
| Monthly Cost | Owner-occupied | Renter-occupied |
| Less than $300 | 393 (8.6%) | 80 (7.3%) |
| $300 to $499 | 845 (18.6%) | 71 (6.4%) |
| $500 to $799 | 774 (17.0%) | 204 (18.5%) |
| $800 to $999 | 385 (8.5%) | 200 (18.1%) |
| $1,000 to $1,499 | 692 (15.2%) | 294 (26.7%) |
| $1,500 to $1,999 | 892 (19.6%) | 42 (3.8%) |
| $2,000 to $2,499 | 437 (9.6%) | 0 (0.0%) |
| $2,500 to $2,999 | 116 (2.5%) | 0 (0.0%) |
| $3,000 or more | 20 (0.4%) | 0 (0.0%) |
| Total | 4,554 (100.0%) | 1,102 (100.0%) |
Physical Housing Characteristics in Converse County
Housing Structures in Converse County
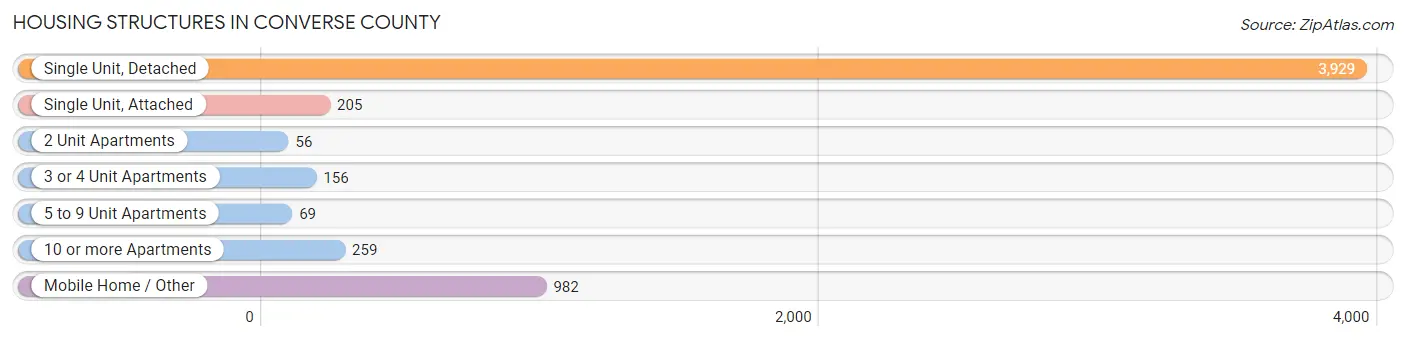
| Structure Type | # Housing Units | % Housing Units |
| Single Unit, Detached | 3,929 | 69.5% |
| Single Unit, Attached | 205 | 3.6% |
| 2 Unit Apartments | 56 | 1.0% |
| 3 or 4 Unit Apartments | 156 | 2.8% |
| 5 to 9 Unit Apartments | 69 | 1.2% |
| 10 or more Apartments | 259 | 4.6% |
| Mobile Home / Other | 982 | 17.4% |
| Total | 5,656 | 100.0% |
Housing Structures by Occupancy in Converse County
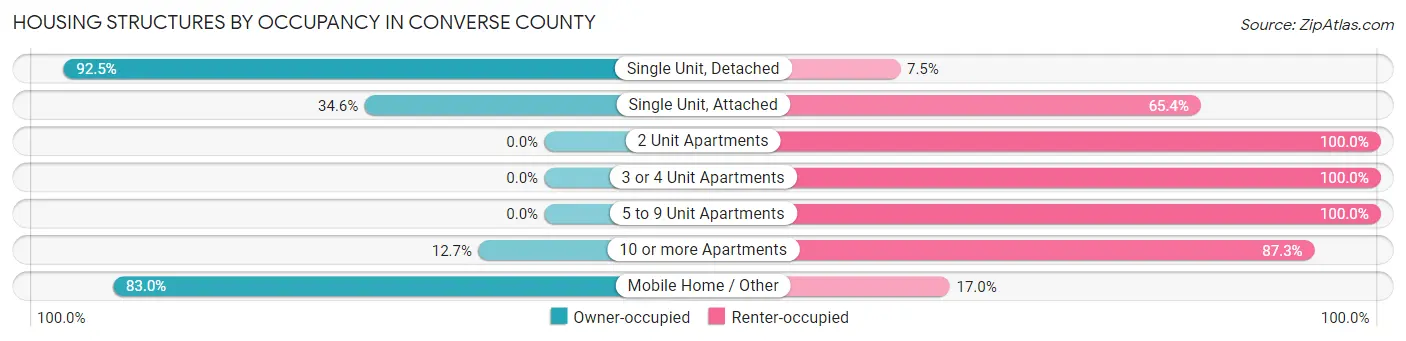
| Structure Type | Owner-occupied | Renter-occupied |
| Single Unit, Detached | 3,635 (92.5%) | 294 (7.5%) |
| Single Unit, Attached | 71 (34.6%) | 134 (65.4%) |
| 2 Unit Apartments | 0 (0.0%) | 56 (100.0%) |
| 3 or 4 Unit Apartments | 0 (0.0%) | 156 (100.0%) |
| 5 to 9 Unit Apartments | 0 (0.0%) | 69 (100.0%) |
| 10 or more Apartments | 33 (12.7%) | 226 (87.3%) |
| Mobile Home / Other | 815 (83.0%) | 167 (17.0%) |
| Total | 4,554 (80.5%) | 1,102 (19.5%) |
Housing Structures by Number of Rooms in Converse County
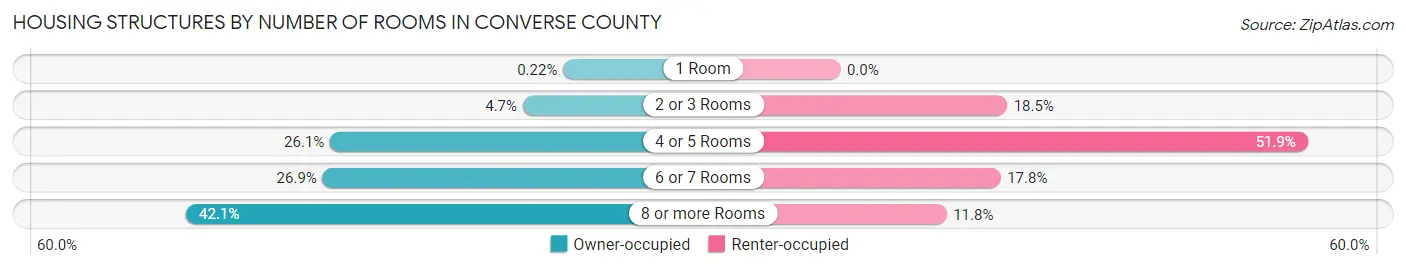
| Number of Rooms | Owner-occupied | Renter-occupied |
| 1 Room | 10 (0.2%) | 0 (0.0%) |
| 2 or 3 Rooms | 214 (4.7%) | 204 (18.5%) |
| 4 or 5 Rooms | 1,188 (26.1%) | 572 (51.9%) |
| 6 or 7 Rooms | 1,226 (26.9%) | 196 (17.8%) |
| 8 or more Rooms | 1,916 (42.1%) | 130 (11.8%) |
| Total | 4,554 (100.0%) | 1,102 (100.0%) |
Housing Structure by Heating Type in Converse County
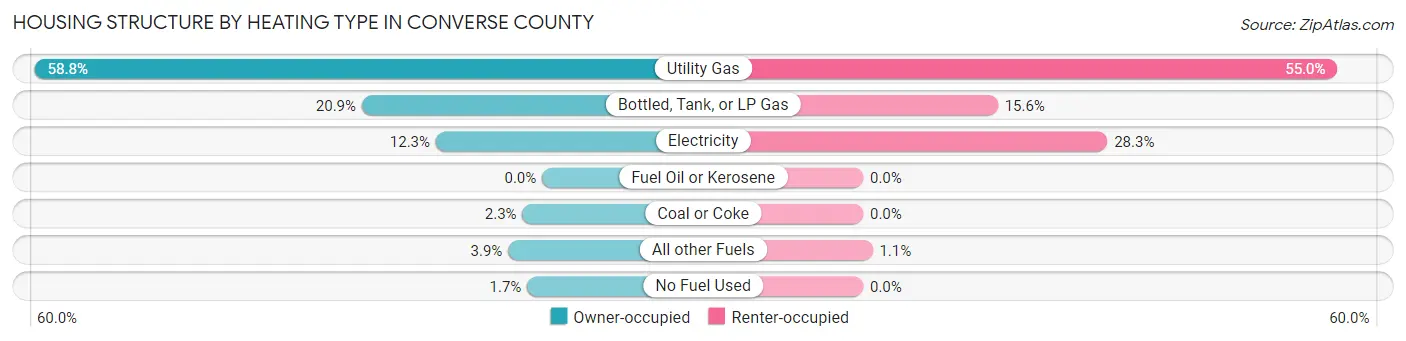
| Heating Type | Owner-occupied | Renter-occupied |
| Utility Gas | 2,679 (58.8%) | 606 (55.0%) |
| Bottled, Tank, or LP Gas | 952 (20.9%) | 172 (15.6%) |
| Electricity | 561 (12.3%) | 312 (28.3%) |
| Fuel Oil or Kerosene | 0 (0.0%) | 0 (0.0%) |
| Coal or Coke | 104 (2.3%) | 0 (0.0%) |
| All other Fuels | 179 (3.9%) | 12 (1.1%) |
| No Fuel Used | 79 (1.7%) | 0 (0.0%) |
| Total | 4,554 (100.0%) | 1,102 (100.0%) |
Household Vehicle Usage in Converse County
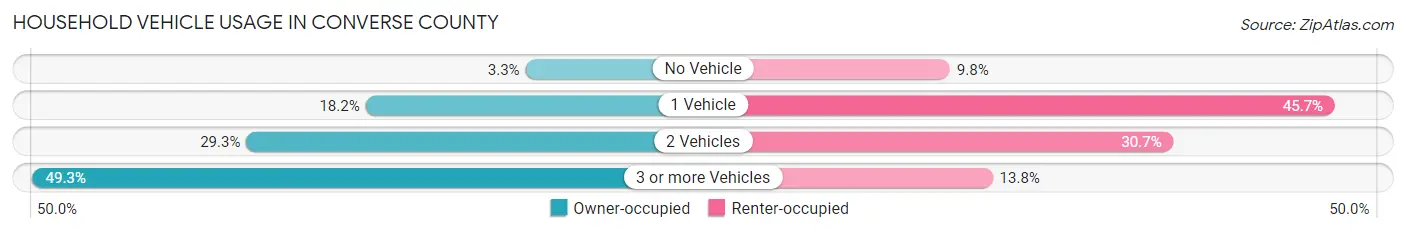
| Vehicles per Household | Owner-occupied | Renter-occupied |
| No Vehicle | 148 (3.3%) | 108 (9.8%) |
| 1 Vehicle | 828 (18.2%) | 504 (45.7%) |
| 2 Vehicles | 1,335 (29.3%) | 338 (30.7%) |
| 3 or more Vehicles | 2,243 (49.2%) | 152 (13.8%) |
| Total | 4,554 (100.0%) | 1,102 (100.0%) |
Real Estate & Mortgages in Converse County
Real Estate and Mortgage Overview in Converse County
| Characteristic | Without Mortgage | With Mortgage |
| Housing Units | 2,268 | 2,286 |
| Median Property Value | $226,000 | $265,800 |
| Median Household Income | $63,840 | $432 |
| Monthly Housing Costs | $486 | $20 |
| Real Estate Taxes | $1,386 | $72 |
Property Value by Mortgage Status in Converse County
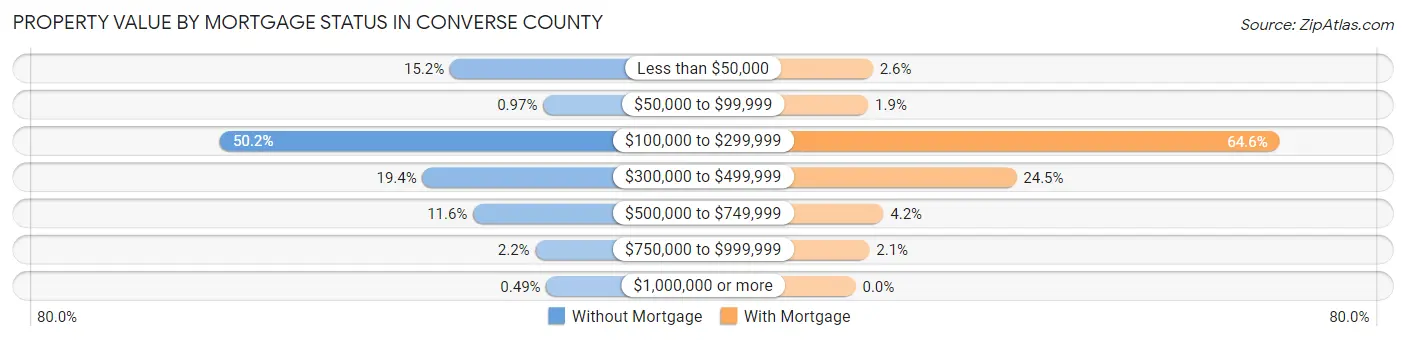
| Property Value | Without Mortgage | With Mortgage |
| Less than $50,000 | 344 (15.2%) | 60 (2.6%) |
| $50,000 to $99,999 | 22 (1.0%) | 44 (1.9%) |
| $100,000 to $299,999 | 1,139 (50.2%) | 1,477 (64.6%) |
| $300,000 to $499,999 | 439 (19.4%) | 560 (24.5%) |
| $500,000 to $749,999 | 264 (11.6%) | 97 (4.2%) |
| $750,000 to $999,999 | 49 (2.2%) | 48 (2.1%) |
| $1,000,000 or more | 11 (0.5%) | 0 (0.0%) |
| Total | 2,268 (100.0%) | 2,286 (100.0%) |
Household Income by Mortgage Status in Converse County
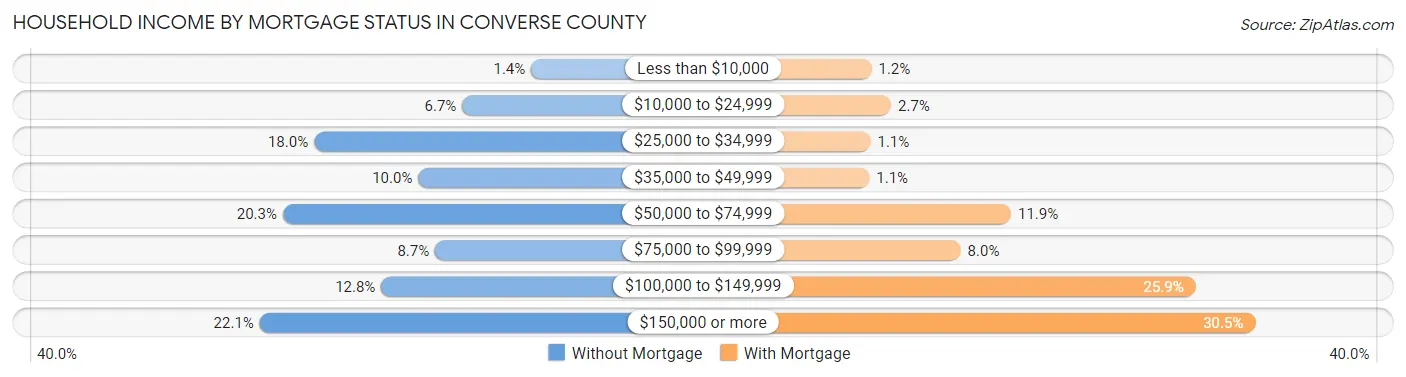
| Household Income | Without Mortgage | With Mortgage |
| Less than $10,000 | 32 (1.4%) | 28 (1.2%) |
| $10,000 to $24,999 | 151 (6.7%) | 62 (2.7%) |
| $25,000 to $34,999 | 407 (17.9%) | 26 (1.1%) |
| $35,000 to $49,999 | 227 (10.0%) | 24 (1.1%) |
| $50,000 to $74,999 | 461 (20.3%) | 271 (11.8%) |
| $75,000 to $99,999 | 198 (8.7%) | 183 (8.0%) |
| $100,000 to $149,999 | 291 (12.8%) | 592 (25.9%) |
| $150,000 or more | 501 (22.1%) | 696 (30.4%) |
| Total | 2,268 (100.0%) | 2,286 (100.0%) |
Property Value to Household Income Ratio in Converse County
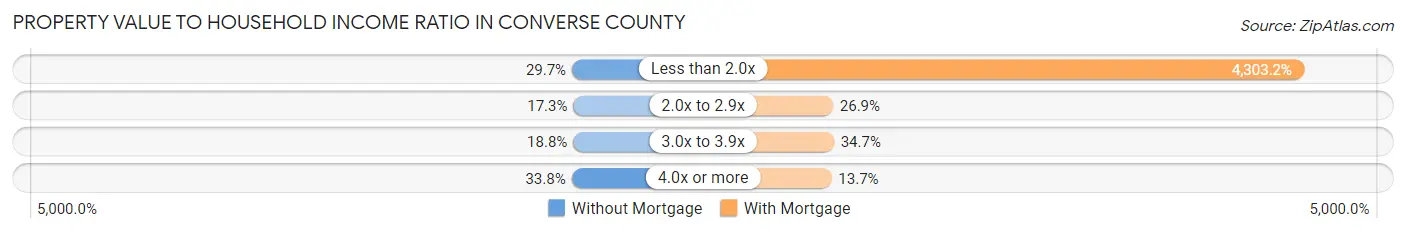
| Value-to-Income Ratio | Without Mortgage | With Mortgage |
| Less than 2.0x | 674 (29.7%) | 98,370 (4,303.2%) |
| 2.0x to 2.9x | 392 (17.3%) | 614 (26.9%) |
| 3.0x to 3.9x | 427 (18.8%) | 792 (34.6%) |
| 4.0x or more | 766 (33.8%) | 312 (13.7%) |
| Total | 2,268 (100.0%) | 2,286 (100.0%) |
Real Estate Taxes by Mortgage Status in Converse County
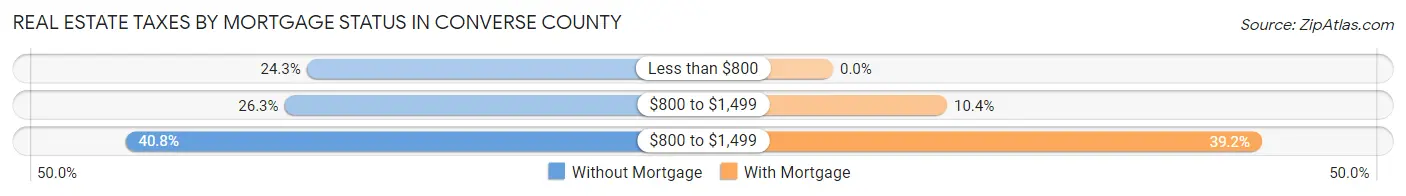
| Property Taxes | Without Mortgage | With Mortgage |
| Less than $800 | 550 (24.2%) | 0 (0.0%) |
| $800 to $1,499 | 596 (26.3%) | 238 (10.4%) |
| $800 to $1,499 | 925 (40.8%) | 895 (39.2%) |
| Total | 2,268 (100.0%) | 2,286 (100.0%) |
Health & Disability in Converse County
Health Insurance Coverage by Age in Converse County
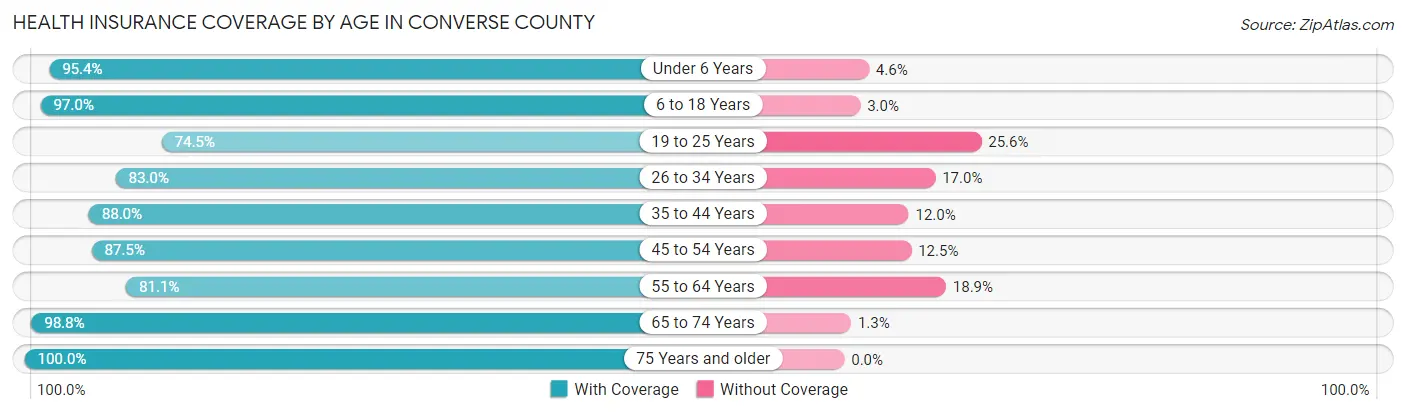
| Age Bracket | With Coverage | Without Coverage |
| Under 6 Years | 1,142 (95.4%) | 55 (4.6%) |
| 6 to 18 Years | 2,322 (97.0%) | 71 (3.0%) |
| 19 to 25 Years | 507 (74.5%) | 174 (25.6%) |
| 26 to 34 Years | 1,302 (83.0%) | 266 (17.0%) |
| 35 to 44 Years | 1,446 (88.0%) | 197 (12.0%) |
| 45 to 54 Years | 1,641 (87.5%) | 234 (12.5%) |
| 55 to 64 Years | 1,554 (81.1%) | 363 (18.9%) |
| 65 to 74 Years | 1,507 (98.8%) | 19 (1.3%) |
| 75 Years and older | 849 (100.0%) | 0 (0.0%) |
| Total | 12,270 (89.9%) | 1,379 (10.1%) |
Health Insurance Coverage by Citizenship Status in Converse County
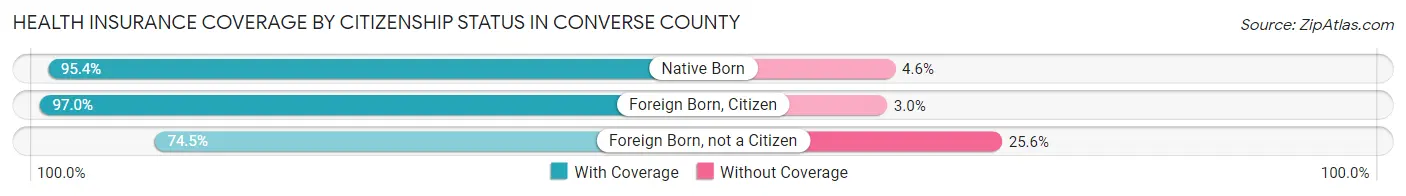
| Citizenship Status | With Coverage | Without Coverage |
| Native Born | 1,142 (95.4%) | 55 (4.6%) |
| Foreign Born, Citizen | 2,322 (97.0%) | 71 (3.0%) |
| Foreign Born, not a Citizen | 507 (74.5%) | 174 (25.6%) |
Health Insurance Coverage by Household Income in Converse County
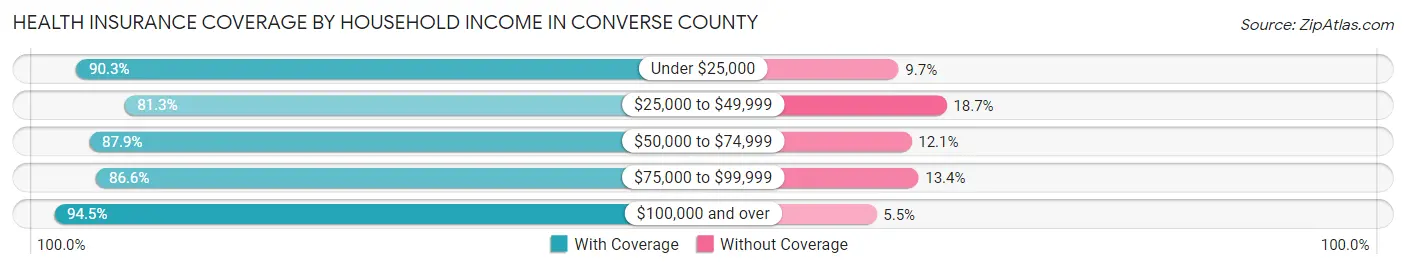
| Household Income | With Coverage | Without Coverage |
| Under $25,000 | 1,083 (90.3%) | 116 (9.7%) |
| $25,000 to $49,999 | 1,865 (81.3%) | 428 (18.7%) |
| $50,000 to $74,999 | 1,331 (87.9%) | 183 (12.1%) |
| $75,000 to $99,999 | 1,881 (86.6%) | 291 (13.4%) |
| $100,000 and over | 6,105 (94.5%) | 358 (5.5%) |
Public vs Private Health Insurance Coverage by Age in Converse County
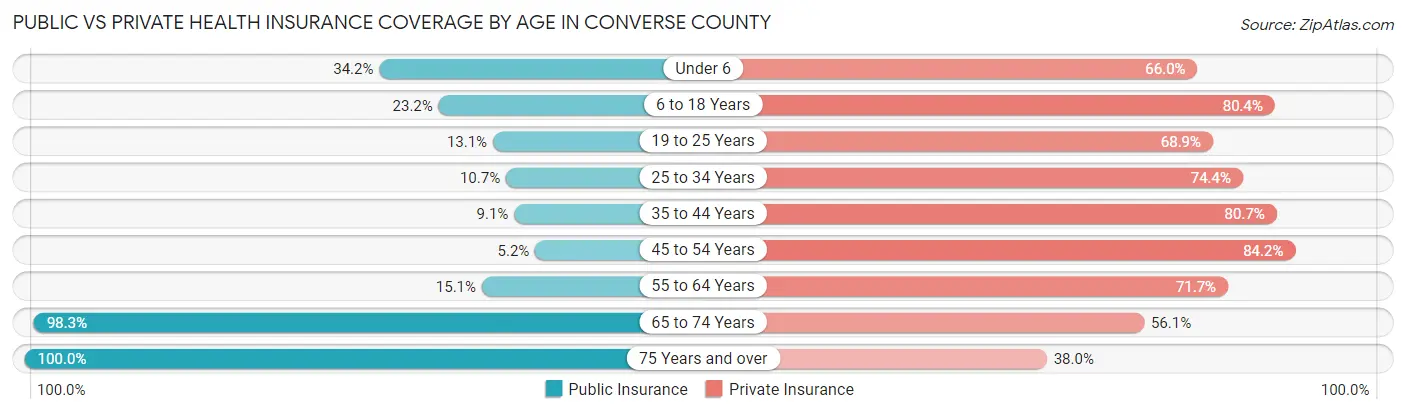
| Age Bracket | Public Insurance | Private Insurance |
| Under 6 | 409 (34.2%) | 790 (66.0%) |
| 6 to 18 Years | 554 (23.2%) | 1,923 (80.4%) |
| 19 to 25 Years | 89 (13.1%) | 469 (68.9%) |
| 25 to 34 Years | 167 (10.6%) | 1,167 (74.4%) |
| 35 to 44 Years | 150 (9.1%) | 1,326 (80.7%) |
| 45 to 54 Years | 98 (5.2%) | 1,578 (84.2%) |
| 55 to 64 Years | 290 (15.1%) | 1,374 (71.7%) |
| 65 to 74 Years | 1,500 (98.3%) | 856 (56.1%) |
| 75 Years and over | 849 (100.0%) | 323 (38.0%) |
| Total | 4,106 (30.1%) | 9,806 (71.8%) |
Disability Status by Sex by Age in Converse County
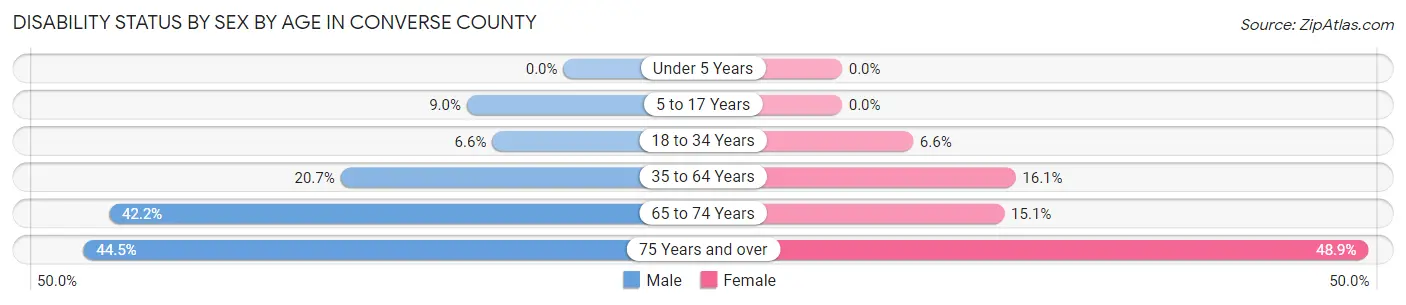
| Age Bracket | Male | Female |
| Under 5 Years | 0 (0.0%) | 0 (0.0%) |
| 5 to 17 Years | 103 (9.0%) | 0 (0.0%) |
| 18 to 34 Years | 89 (6.6%) | 79 (6.6%) |
| 35 to 64 Years | 577 (20.7%) | 426 (16.1%) |
| 65 to 74 Years | 358 (42.2%) | 102 (15.1%) |
| 75 Years and over | 163 (44.5%) | 236 (48.9%) |
Disability Class by Sex by Age in Converse County
Disability Class: Hearing Difficulty
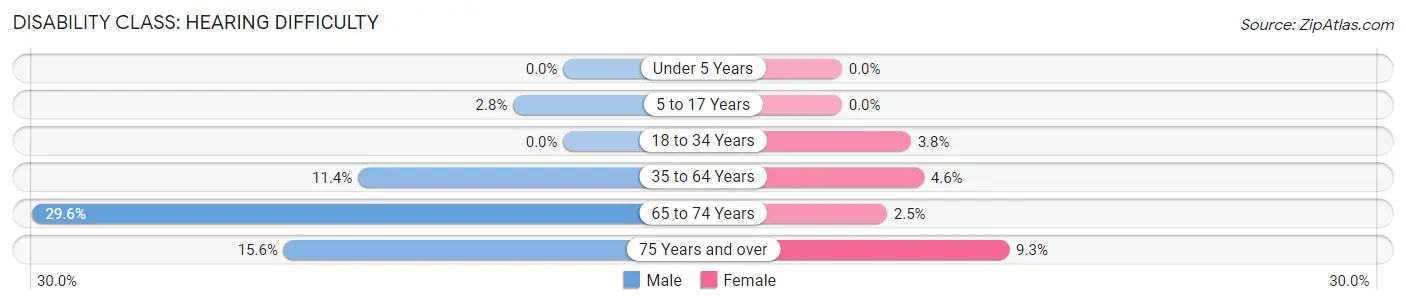
| Age Bracket | Male | Female |
| Under 5 Years | 0 (0.0%) | 0 (0.0%) |
| 5 to 17 Years | 32 (2.8%) | 0 (0.0%) |
| 18 to 34 Years | 0 (0.0%) | 46 (3.8%) |
| 35 to 64 Years | 319 (11.4%) | 121 (4.6%) |
| 65 to 74 Years | 251 (29.6%) | 17 (2.5%) |
| 75 Years and over | 57 (15.6%) | 45 (9.3%) |
Disability Class: Vision Difficulty
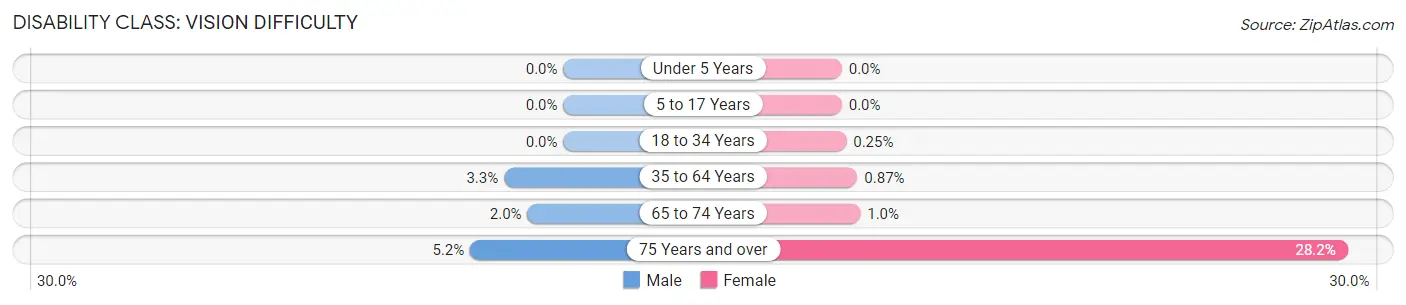
| Age Bracket | Male | Female |
| Under 5 Years | 0 (0.0%) | 0 (0.0%) |
| 5 to 17 Years | 0 (0.0%) | 0 (0.0%) |
| 18 to 34 Years | 0 (0.0%) | 3 (0.3%) |
| 35 to 64 Years | 92 (3.3%) | 23 (0.9%) |
| 65 to 74 Years | 17 (2.0%) | 7 (1.0%) |
| 75 Years and over | 19 (5.2%) | 136 (28.2%) |
Disability Class: Cognitive Difficulty
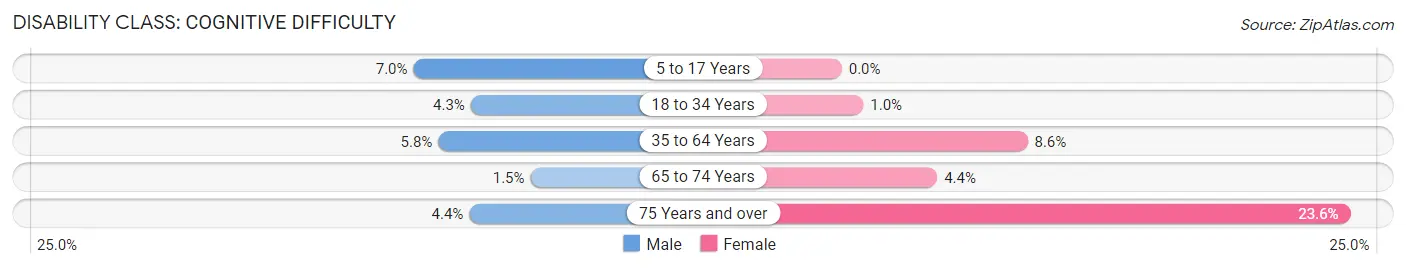
| Age Bracket | Male | Female |
| 5 to 17 Years | 80 (7.0%) | 0 (0.0%) |
| 18 to 34 Years | 58 (4.3%) | 12 (1.0%) |
| 35 to 64 Years | 162 (5.8%) | 228 (8.6%) |
| 65 to 74 Years | 13 (1.5%) | 30 (4.4%) |
| 75 Years and over | 16 (4.4%) | 114 (23.6%) |
Disability Class: Ambulatory Difficulty
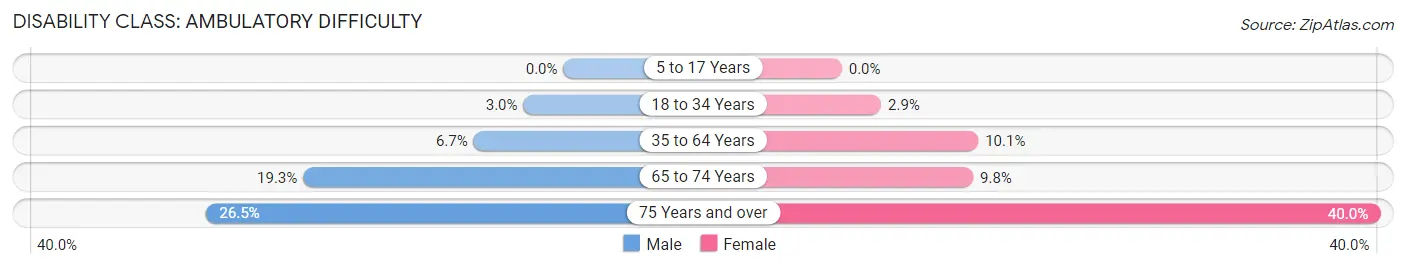
| Age Bracket | Male | Female |
| 5 to 17 Years | 0 (0.0%) | 0 (0.0%) |
| 18 to 34 Years | 40 (3.0%) | 35 (2.9%) |
| 35 to 64 Years | 186 (6.7%) | 268 (10.1%) |
| 65 to 74 Years | 164 (19.3%) | 66 (9.8%) |
| 75 Years and over | 97 (26.5%) | 193 (40.0%) |
Disability Class: Self-Care Difficulty
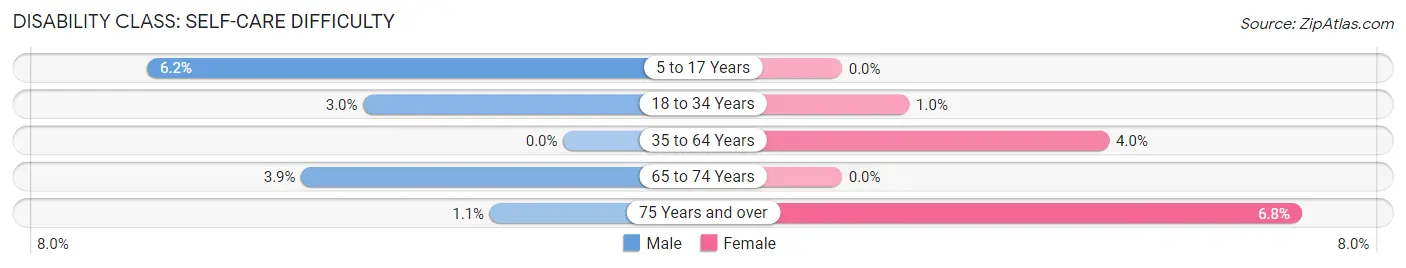
| Age Bracket | Male | Female |
| 5 to 17 Years | 71 (6.2%) | 0 (0.0%) |
| 18 to 34 Years | 40 (3.0%) | 12 (1.0%) |
| 35 to 64 Years | 0 (0.0%) | 105 (4.0%) |
| 65 to 74 Years | 33 (3.9%) | 0 (0.0%) |
| 75 Years and over | 4 (1.1%) | 33 (6.8%) |
Technology Access in Converse County
Computing Device Access in Converse County
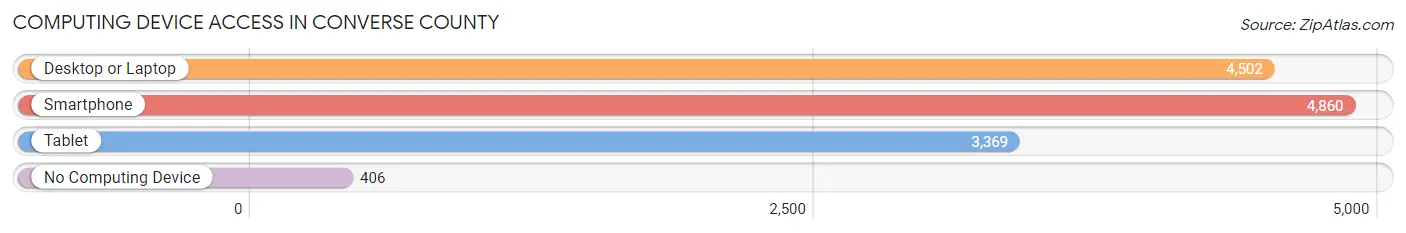
| Device Type | # Households | % Households |
| Desktop or Laptop | 4,502 | 79.6% |
| Smartphone | 4,860 | 85.9% |
| Tablet | 3,369 | 59.6% |
| No Computing Device | 406 | 7.2% |
| Total | 5,656 | 100.0% |
Internet Access in Converse County
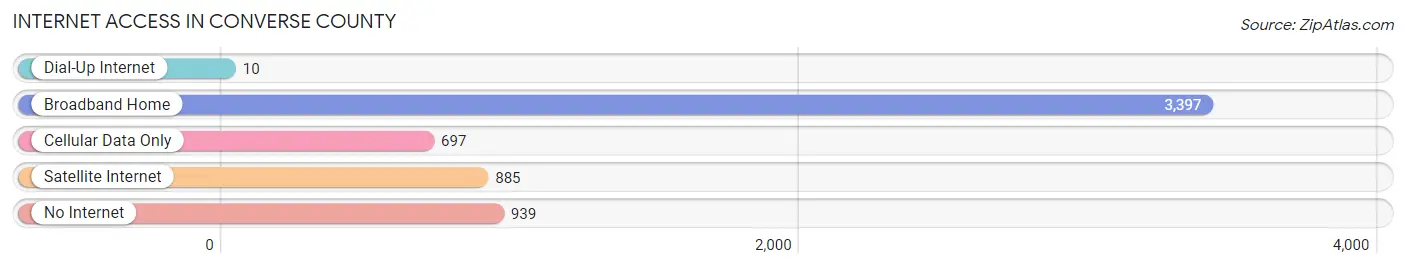
| Internet Type | # Households | % Households |
| Dial-Up Internet | 10 | 0.2% |
| Broadband Home | 3,397 | 60.1% |
| Cellular Data Only | 697 | 12.3% |
| Satellite Internet | 885 | 15.7% |
| No Internet | 939 | 16.6% |
| Total | 5,656 | 100.0% |
Converse County Summary
Converse County, Wyoming is located in the east-central part of the state and is bordered by Niobrara County to the north, Platte County to the east, Goshen County to the south, and Natrona County to the west. The county seat is Douglas, and the largest city is Glenrock. The county was created in 1888 and named after Senator John Converse.
Geography
Converse County covers an area of 2,822 square miles and is the fifth largest county in Wyoming. The county is located in the Great Plains region of the United States and is characterized by rolling hills, grasslands, and sagebrush. The North Platte River runs through the county, and there are several small lakes and reservoirs. The highest point in the county is located in the Laramie Mountains, at an elevation of 8,890 feet.
The climate of Converse County is semi-arid, with hot summers and cold winters. The average annual precipitation is 13.5 inches, and the average annual snowfall is 33.5 inches.
Economy
The economy of Converse County is largely based on agriculture and ranching. The county is home to several large cattle ranches, and the county’s agricultural products include hay, wheat, corn, and barley. The county is also home to several oil and gas fields, and the energy industry is a major contributor to the local economy.
The county is also home to several manufacturing companies, including a large paper mill in Douglas. Tourism is also an important part of the local economy, and the county is home to several state parks and recreational areas.
Demographics
As of the 2010 census, the population of Converse County was 13,833. The population is largely white (94.2%), with small percentages of Native American (2.2%), Hispanic (1.7%), and African American (0.5%) residents. The median household income is $50,845, and the median home value is $164,400.
The largest city in the county is Glenrock, with a population of 2,637. Other cities in the county include Douglas (population 1,890), Lusk (population 1,521), and Guernsey (population 1,068).
Conclusion
Converse County, Wyoming is a rural county located in the east-central part of the state. The county is largely agricultural, with ranching and energy production being major contributors to the local economy. The population is largely white, with small percentages of Native American, Hispanic, and African American residents. Tourism is also an important part of the local economy, and the county is home to several state parks and recreational areas.
Common Questions
What is the Total Population of Converse County?
Total Population of Converse County is 13,729.
What is the Total Male Population of Converse County?
Total Male Population of Converse County is 7,066.
What is the Total Female Population of Converse County?
Total Female Population of Converse County is 6,663.
What is the Ratio of Males per 100 Females in Converse County?
There are 106.05 Males per 100 Females in Converse County.
What is the Ratio of Females per 100 Males in Converse County?
There are 94.30 Females per 100 Males in Converse County.
What is the Median Population Age in Converse County?
Median Population Age in Converse County is 41.1 Years.
What is the Average Family Size in Converse County
Average Family Size in Converse County is 2.9 People.
What is the Average Household Size in Converse County
Average Household Size in Converse County is 2.4 People.
What is Per Capita Income in Converse County?
Per Capita income in Converse County is $37,976.
What is the Median Family Income in Converse County?
Median Family Income in Converse County is $93,012.
What is the Median Household income in Converse County?
Median Household Income in Converse County is $79,235.
What is Income or Wage Gap in Converse County?
Income or Wage Gap in Converse County is 43.3%.
Women in Converse County earn 56.7 cents for every dollar earned by a man.
What is Inequality or Gini Index in Converse County?
Inequality or Gini Index in Converse County is 0.40.
How Large is the Labor Force in Converse County?
There are 7,192 People in the Labor Forcein in Converse County.
What is the Percentage of People in the Labor Force in Converse County?
66.7% of People are in the Labor Force in Converse County.
What is the Unemployment Rate in Converse County?
Unemployment Rate in Converse County is 4.3%.