Campbell County, WY
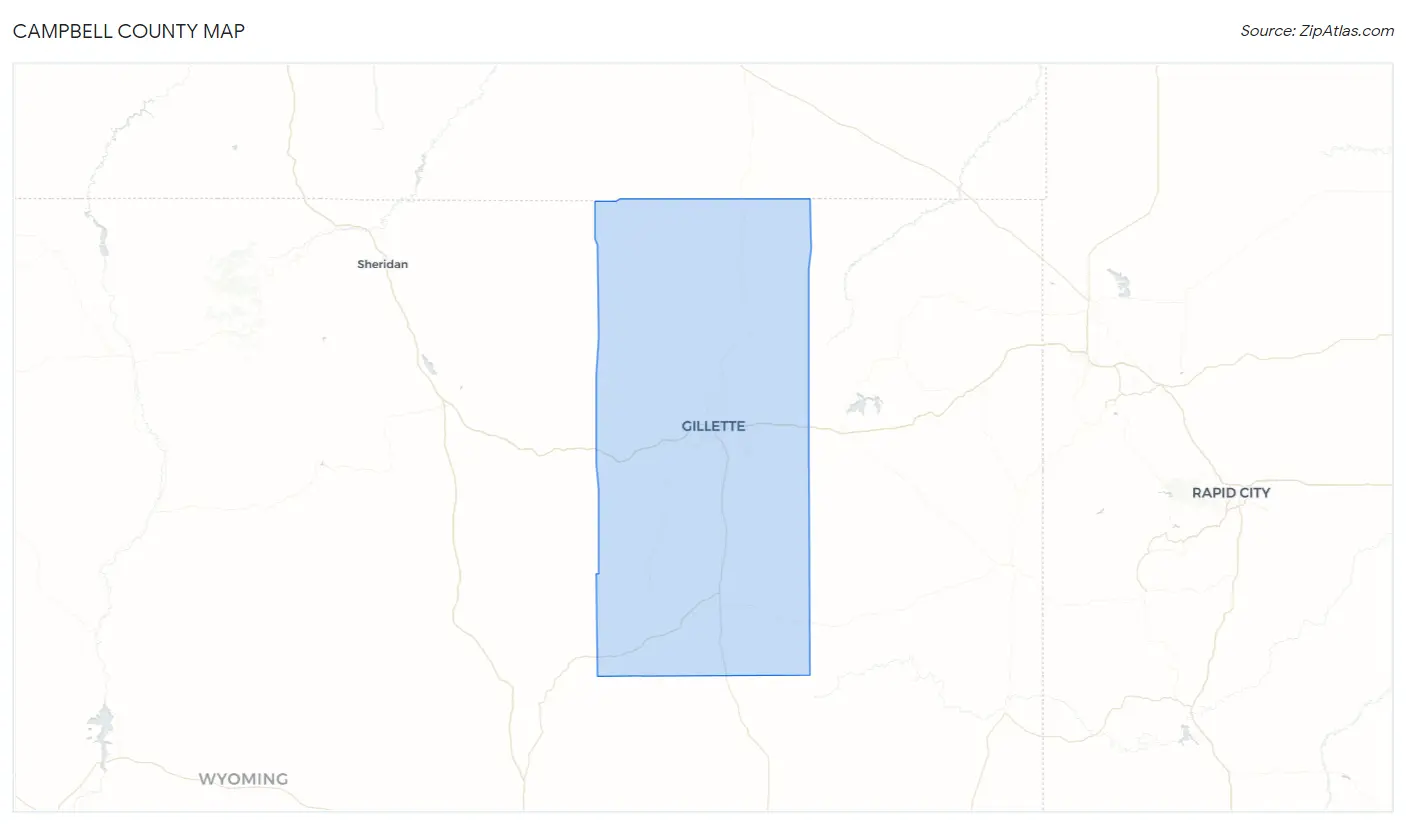
Campbell County Map
Campbell County Overview
46,857
TOTAL POPULATION
24,226
MALE POPULATION
22,631
FEMALE POPULATION
107.05
MALES / 100 FEMALES
93.42
FEMALES / 100 MALES
35.5
MEDIAN AGE
3.1
AVG FAMILY SIZE
2.6
AVG HOUSEHOLD SIZE
$39,781
PER CAPITA INCOME
$101,763
AVG FAMILY INCOME
$93,315
AVG HOUSEHOLD INCOME
47.1%
WAGE / INCOME GAP [ % ]
52.9¢/ $1
WAGE / INCOME GAP [ $ ]
$9,858
FAMILY INCOME DEFICIT
0.39
INEQUALITY / GINI INDEX
25,245
LABOR FORCE [ PEOPLE ]
70.9%
PERCENT IN LABOR FORCE
3.0%
UNEMPLOYMENT RATE
Campbell County Area Codes
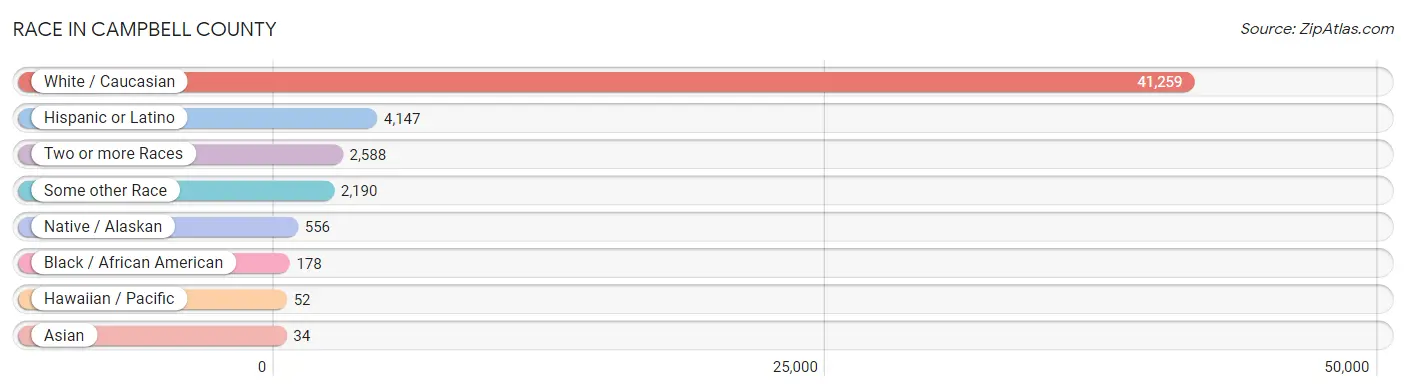
Race in Campbell County
The most populous races in Campbell County are White / Caucasian (41,259 | 88.0%), Hispanic or Latino (4,147 | 8.8%), and Two or more Races (2,588 | 5.5%).
| Race | # Population | % Population |
| Asian | 34 | 0.1% |
| Black / African American | 178 | 0.4% |
| Hawaiian / Pacific | 52 | 0.1% |
| Hispanic or Latino | 4,147 | 8.8% |
| Native / Alaskan | 556 | 1.2% |
| White / Caucasian | 41,259 | 88.0% |
| Two or more Races | 2,588 | 5.5% |
| Some other Race | 2,190 | 4.7% |
| Total | 46,857 | 100.0% |
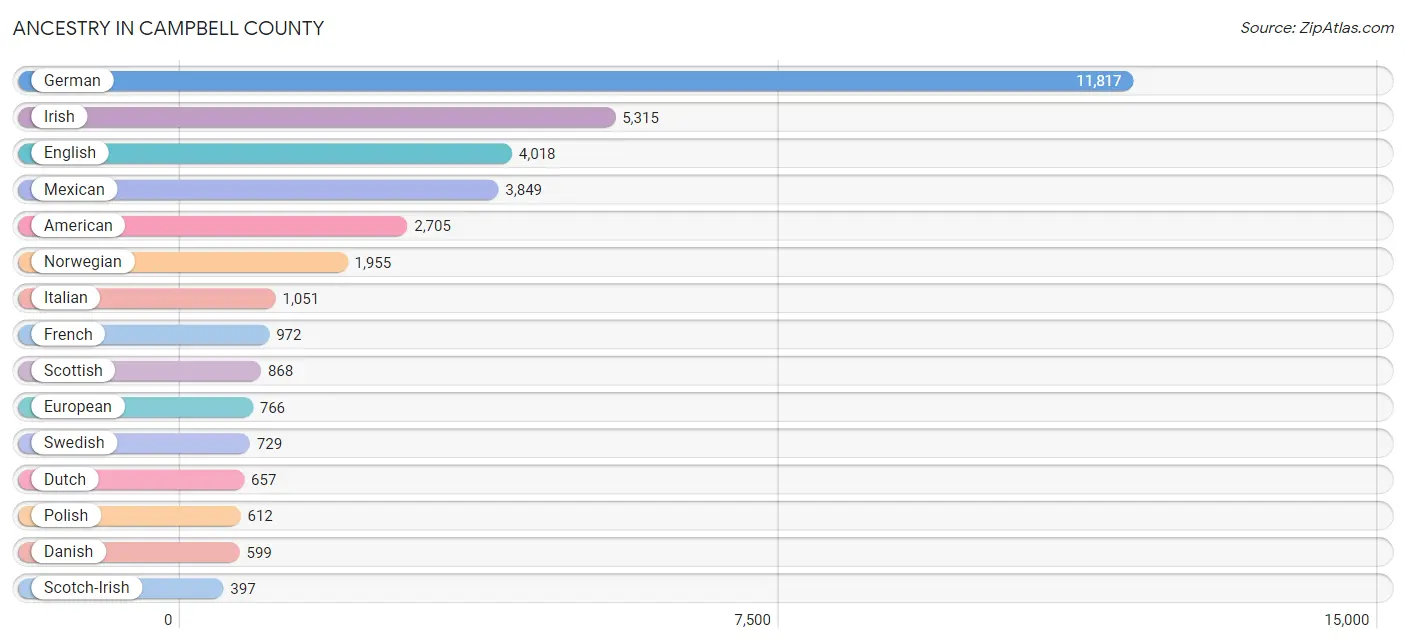
Ancestry in Campbell County
The most populous ancestries reported in Campbell County are German (11,817 | 25.2%), Irish (5,315 | 11.3%), English (4,018 | 8.6%), Mexican (3,849 | 8.2%), and American (2,705 | 5.8%), together accounting for 59.1% of all Campbell County residents.
| Ancestry | # Population | % Population |
| African | 42 | 0.1% |
| American | 2,705 | 5.8% |
| Apache | 16 | 0.0% |
| Arapaho | 12 | 0.0% |
| Austrian | 21 | 0.0% |
| Basque | 83 | 0.2% |
| Belgian | 163 | 0.4% |
| Bhutanese | 16 | 0.0% |
| Blackfeet | 4 | 0.0% |
| British | 304 | 0.6% |
| Burmese | 34 | 0.1% |
| Canadian | 154 | 0.3% |
| Celtic | 24 | 0.1% |
| Central American | 10 | 0.0% |
| Cherokee | 34 | 0.1% |
| Cheyenne | 133 | 0.3% |
| Chippewa | 27 | 0.1% |
| Choctaw | 40 | 0.1% |
| Colombian | 43 | 0.1% |
| Crow | 98 | 0.2% |
| Czech | 289 | 0.6% |
| Czechoslovakian | 10 | 0.0% |
| Danish | 599 | 1.3% |
| Dutch | 657 | 1.4% |
| Eastern European | 18 | 0.0% |
| English | 4,018 | 8.6% |
| European | 766 | 1.6% |
| Finnish | 106 | 0.2% |
| French | 972 | 2.1% |
| French Canadian | 90 | 0.2% |
| German | 11,817 | 25.2% |
| Greek | 19 | 0.0% |
| Guatemalan | 3 | 0.0% |
| Hungarian | 163 | 0.4% |
| Icelander | 22 | 0.1% |
| Irish | 5,315 | 11.3% |
| Iroquois | 53 | 0.1% |
| Italian | 1,051 | 2.2% |
| Kenyan | 122 | 0.3% |
| Korean | 143 | 0.3% |
| Lithuanian | 22 | 0.1% |
| Mexican | 3,849 | 8.2% |
| Mexican American Indian | 67 | 0.1% |
| Native Hawaiian | 68 | 0.2% |
| Navajo | 48 | 0.1% |
| Nigerian | 6 | 0.0% |
| Northern European | 25 | 0.1% |
| Norwegian | 1,955 | 4.2% |
| Pennsylvania German | 14 | 0.0% |
| Peruvian | 37 | 0.1% |
| Polish | 612 | 1.3% |
| Portuguese | 45 | 0.1% |
| Puerto Rican | 20 | 0.0% |
| Romanian | 61 | 0.1% |
| Russian | 378 | 0.8% |
| Salvadoran | 7 | 0.0% |
| Scandinavian | 236 | 0.5% |
| Scotch-Irish | 397 | 0.9% |
| Scottish | 868 | 1.8% |
| Shoshone | 248 | 0.5% |
| Sioux | 235 | 0.5% |
| Slovak | 22 | 0.1% |
| South American | 80 | 0.2% |
| Spaniard | 76 | 0.2% |
| Spanish | 9 | 0.0% |
| Sri Lankan | 16 | 0.0% |
| Subsaharan African | 170 | 0.4% |
| Swedish | 729 | 1.6% |
| Swiss | 68 | 0.2% |
| Welsh | 232 | 0.5% |
| Yakama | 9 | 0.0% |
| Yugoslavian | 59 | 0.1% | View All 72 Rows |
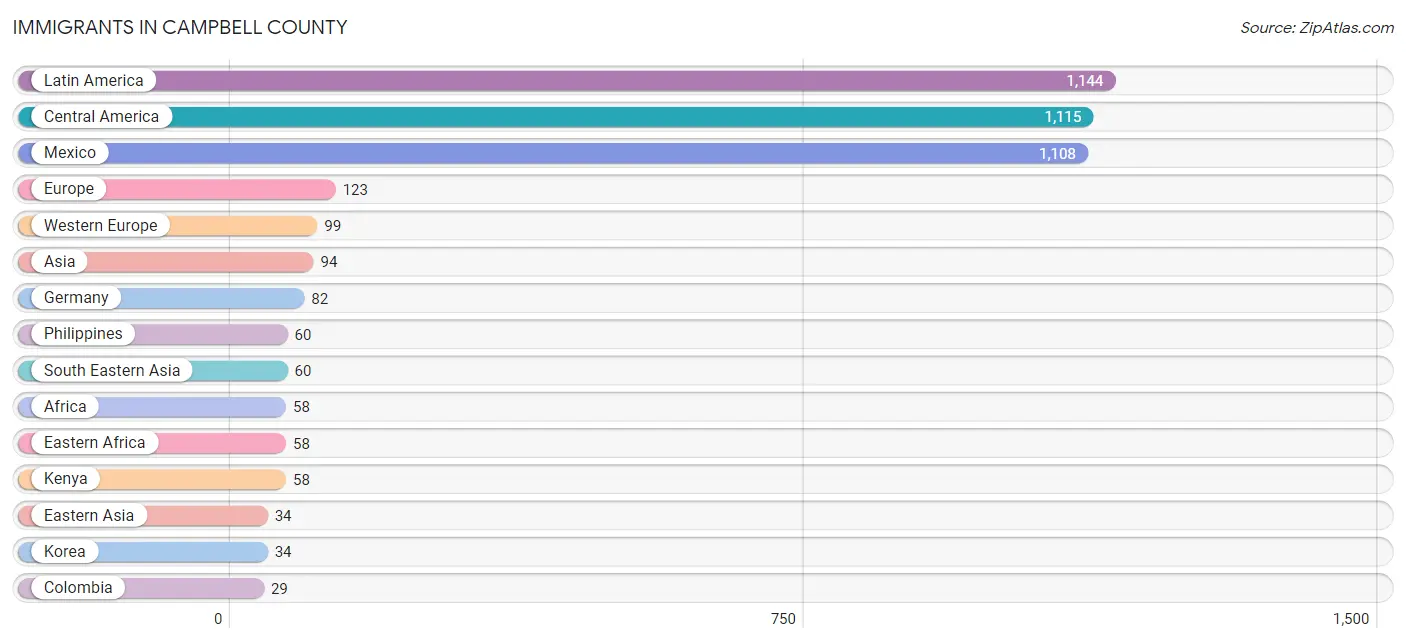
Immigrants in Campbell County
The most numerous immigrant groups reported in Campbell County came from Latin America (1,144 | 2.4%), Central America (1,115 | 2.4%), Mexico (1,108 | 2.4%), Europe (123 | 0.3%), and Western Europe (99 | 0.2%), together accounting for 7.7% of all Campbell County residents.
| Immigration Origin | # Population | % Population |
| Africa | 58 | 0.1% |
| Asia | 94 | 0.2% |
| Canada | 19 | 0.0% |
| Central America | 1,115 | 2.4% |
| Colombia | 29 | 0.1% |
| Eastern Africa | 58 | 0.1% |
| Eastern Asia | 34 | 0.1% |
| Eastern Europe | 24 | 0.1% |
| El Salvador | 7 | 0.0% |
| Europe | 123 | 0.3% |
| France | 17 | 0.0% |
| Germany | 82 | 0.2% |
| Kenya | 58 | 0.1% |
| Korea | 34 | 0.1% |
| Latin America | 1,144 | 2.4% |
| Mexico | 1,108 | 2.4% |
| Philippines | 60 | 0.1% |
| Poland | 24 | 0.1% |
| South America | 29 | 0.1% |
| South Eastern Asia | 60 | 0.1% |
| Western Europe | 99 | 0.2% | View All 21 Rows |
Sex and Age in Campbell County
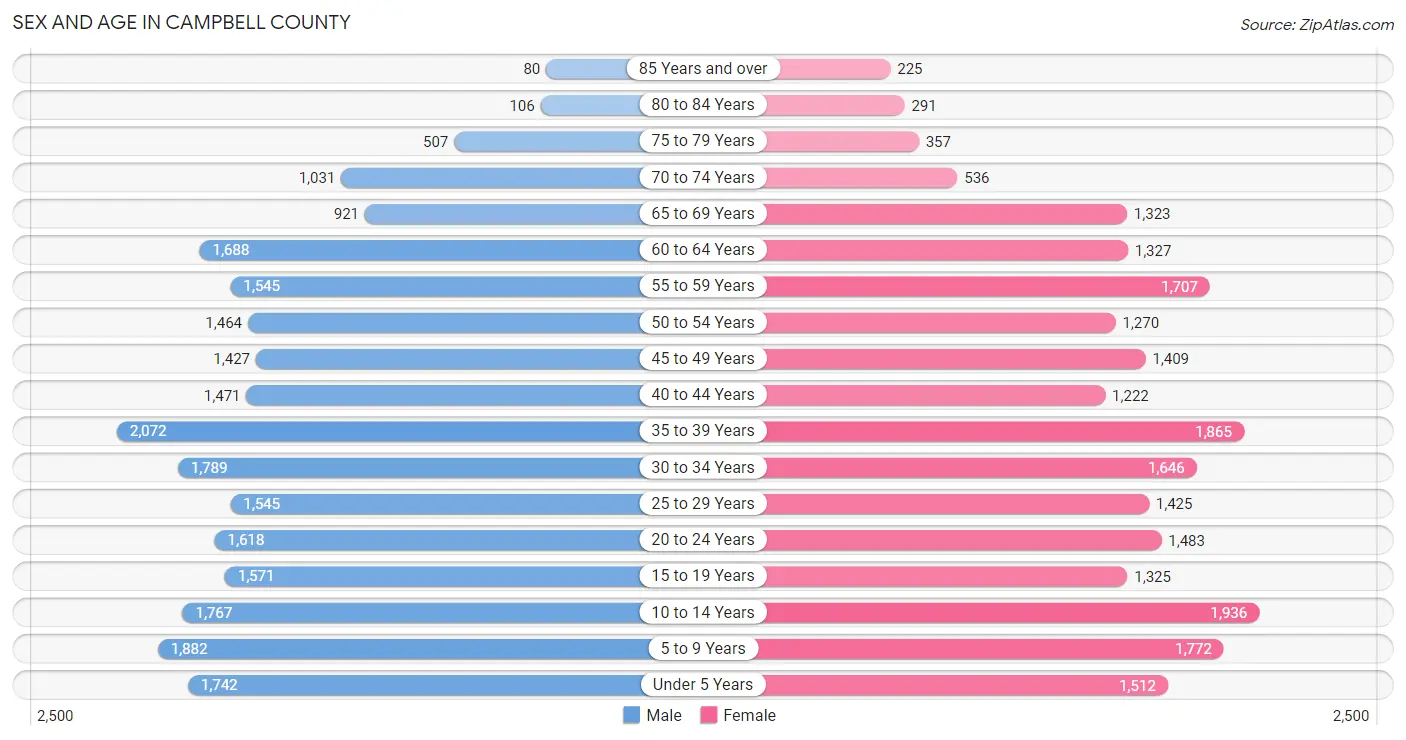
Sex and Age in Campbell County
The most populous age groups in Campbell County are 35 to 39 Years (2,072 | 8.6%) for men and 10 to 14 Years (1,936 | 8.6%) for women.
| Age Bracket | Male | Female |
| Under 5 Years | 1,742 (7.2%) | 1,512 (6.7%) |
| 5 to 9 Years | 1,882 (7.8%) | 1,772 (7.8%) |
| 10 to 14 Years | 1,767 (7.3%) | 1,936 (8.6%) |
| 15 to 19 Years | 1,571 (6.5%) | 1,325 (5.9%) |
| 20 to 24 Years | 1,618 (6.7%) | 1,483 (6.6%) |
| 25 to 29 Years | 1,545 (6.4%) | 1,425 (6.3%) |
| 30 to 34 Years | 1,789 (7.4%) | 1,646 (7.3%) |
| 35 to 39 Years | 2,072 (8.6%) | 1,865 (8.2%) |
| 40 to 44 Years | 1,471 (6.1%) | 1,222 (5.4%) |
| 45 to 49 Years | 1,427 (5.9%) | 1,409 (6.2%) |
| 50 to 54 Years | 1,464 (6.0%) | 1,270 (5.6%) |
| 55 to 59 Years | 1,545 (6.4%) | 1,707 (7.5%) |
| 60 to 64 Years | 1,688 (7.0%) | 1,327 (5.9%) |
| 65 to 69 Years | 921 (3.8%) | 1,323 (5.9%) |
| 70 to 74 Years | 1,031 (4.3%) | 536 (2.4%) |
| 75 to 79 Years | 507 (2.1%) | 357 (1.6%) |
| 80 to 84 Years | 106 (0.4%) | 291 (1.3%) |
| 85 Years and over | 80 (0.3%) | 225 (1.0%) |
| Total | 24,226 (100.0%) | 22,631 (100.0%) |
Families and Households in Campbell County
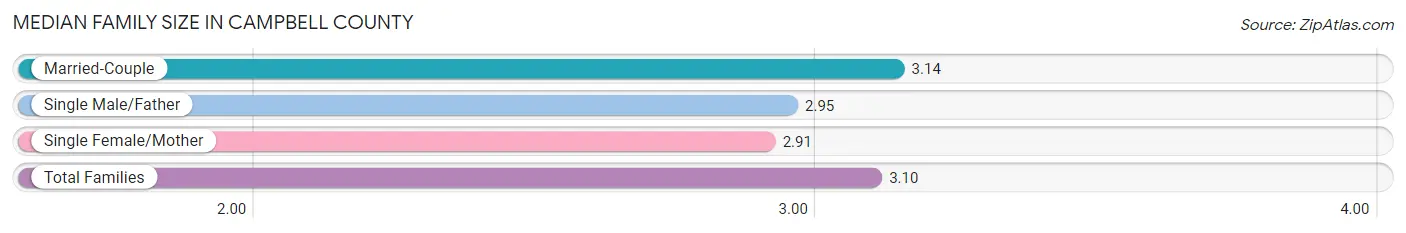
Median Family Size in Campbell County
The median family size in Campbell County is 3.10 persons per family, with married-couple families (10,117 | 81.6%) accounting for the largest median family size of 3.14 persons per family. On the other hand, single female/mother families (1,375 | 11.1%) represent the smallest median family size with 2.91 persons per family.
| Family Type | # Families | Family Size |
| Married-Couple | 10,117 (81.6%) | 3.14 |
| Single Male/Father | 907 (7.3%) | 2.95 |
| Single Female/Mother | 1,375 (11.1%) | 2.91 |
| Total Families | 12,399 (100.0%) | 3.10 |
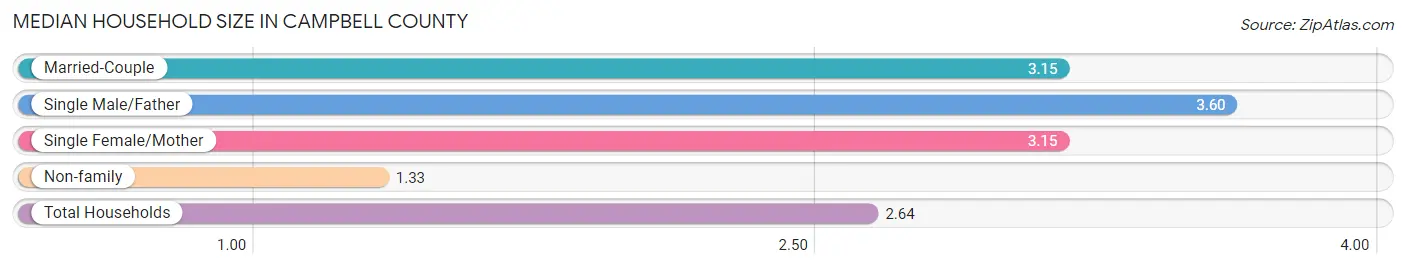
Median Household Size in Campbell County
The median household size in Campbell County is 2.64 persons per household, with single male/father households (907 | 5.2%) accounting for the largest median household size of 3.6 persons per household. non-family households (5,110 | 29.2%) represent the smallest median household size with 1.33 persons per household.
| Household Type | # Households | Household Size |
| Married-Couple | 10,117 (57.8%) | 3.15 |
| Single Male/Father | 907 (5.2%) | 3.60 |
| Single Female/Mother | 1,375 (7.9%) | 3.15 |
| Non-family | 5,110 (29.2%) | 1.33 |
| Total Households | 17,509 (100.0%) | 2.64 |
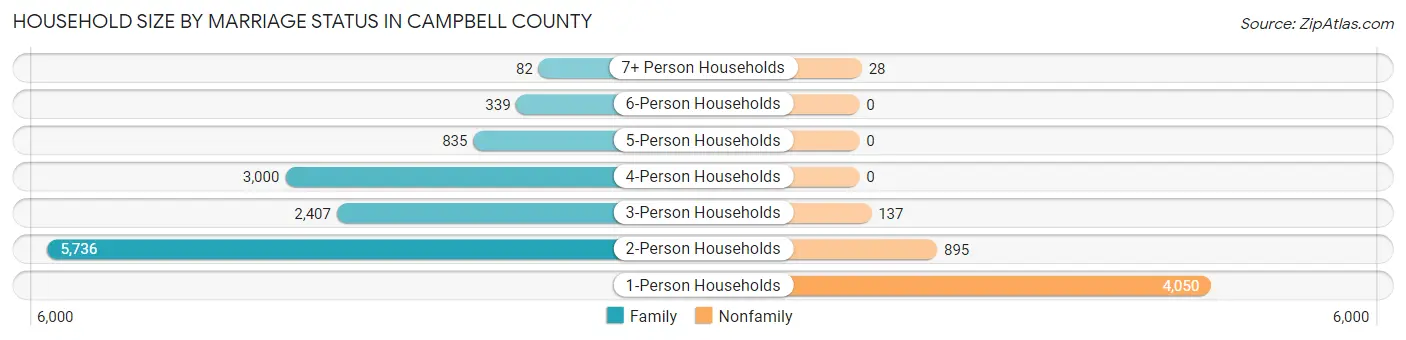
Household Size by Marriage Status in Campbell County
Out of a total of 17,509 households in Campbell County, 12,399 (70.8%) are family households, while 5,110 (29.2%) are nonfamily households. The most numerous type of family households are 2-person households, comprising 5,736, and the most common type of nonfamily households are 1-person households, comprising 4,050.
| Household Size | Family Households | Nonfamily Households |
| 1-Person Households | - | 4,050 (23.1%) |
| 2-Person Households | 5,736 (32.8%) | 895 (5.1%) |
| 3-Person Households | 2,407 (13.8%) | 137 (0.8%) |
| 4-Person Households | 3,000 (17.1%) | 0 (0.0%) |
| 5-Person Households | 835 (4.8%) | 0 (0.0%) |
| 6-Person Households | 339 (1.9%) | 0 (0.0%) |
| 7+ Person Households | 82 (0.5%) | 28 (0.2%) |
| Total | 12,399 (70.8%) | 5,110 (29.2%) |
Female Fertility in Campbell County
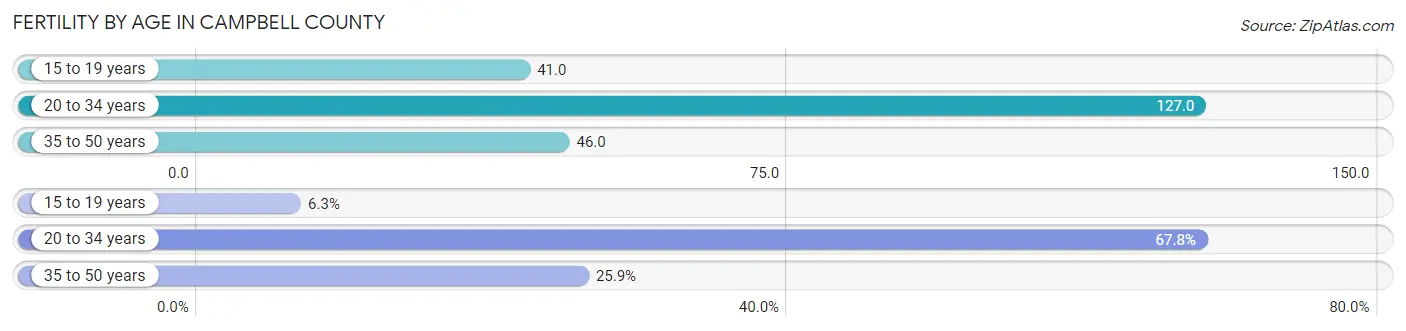
Fertility by Age in Campbell County
Average fertility rate in Campbell County is 80.0 births per 1,000 women. Women in the age bracket of 20 to 34 years have the highest fertility rate with 127.0 births per 1,000 women. Women in the age bracket of 20 to 34 years acount for 67.8% of all women with births.
| Age Bracket | Women with Births | Births / 1,000 Women |
| 15 to 19 years | 54 (6.3%) | 41.0 |
| 20 to 34 years | 580 (67.8%) | 127.0 |
| 35 to 50 years | 221 (25.9%) | 46.0 |
| Total | 855 (100.0%) | 80.0 |
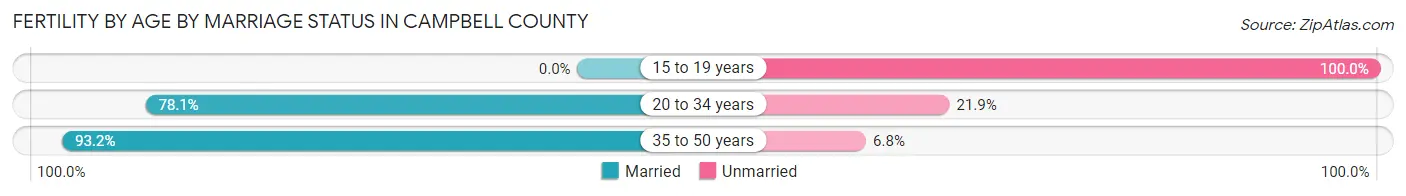
Fertility by Age by Marriage Status in Campbell County
77.1% of women with births (855) in Campbell County are married. The highest percentage of unmarried women with births falls into 15 to 19 years age bracket with 100.0% of them unmarried at the time of birth, while the lowest percentage of unmarried women with births belong to 35 to 50 years age bracket with 6.8% of them unmarried.
| Age Bracket | Married | Unmarried |
| 15 to 19 years | 0 (0.0%) | 54 (100.0%) |
| 20 to 34 years | 453 (78.1%) | 127 (21.9%) |
| 35 to 50 years | 206 (93.2%) | 15 (6.8%) |
| Total | 659 (77.1%) | 196 (22.9%) |
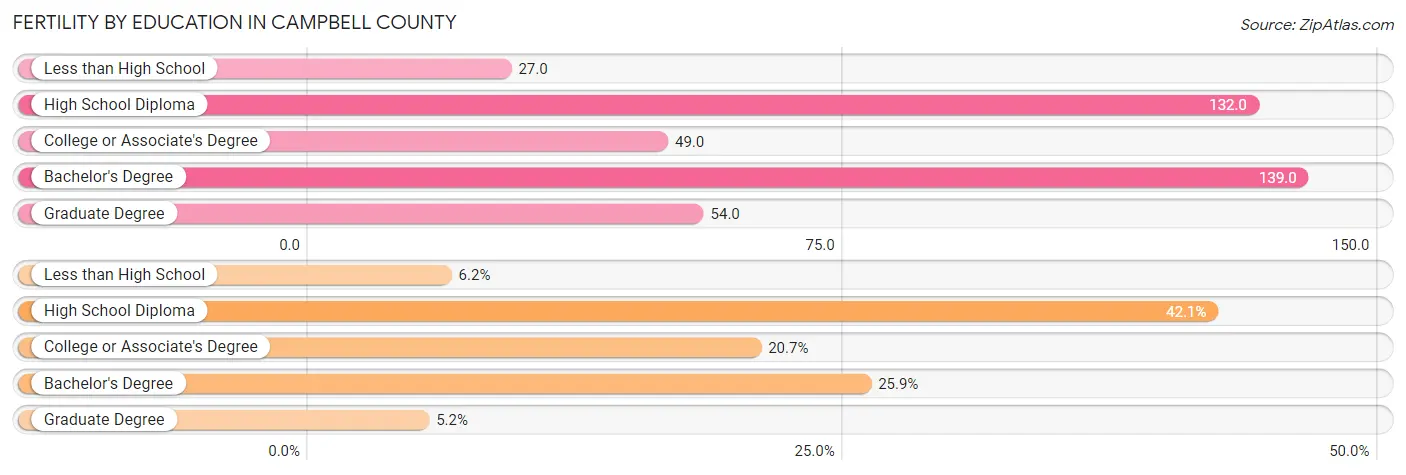
Fertility by Education in Campbell County
Average fertility rate in Campbell County is 80.0 births per 1,000 women. Women with the education attainment of bachelor's degree have the highest fertility rate of 139.0 births per 1,000 women, while women with the education attainment of less than high school have the lowest fertility at 27.0 births per 1,000 women. Women with the education attainment of high school diploma represent 42.1% of all women with births.
| Educational Attainment | Women with Births | Births / 1,000 Women |
| Less than High School | 53 (6.2%) | 27.0 |
| High School Diploma | 360 (42.1%) | 132.0 |
| College or Associate's Degree | 177 (20.7%) | 49.0 |
| Bachelor's Degree | 221 (25.9%) | 139.0 |
| Graduate Degree | 44 (5.1%) | 54.0 |
| Total | 855 (100.0%) | 80.0 |
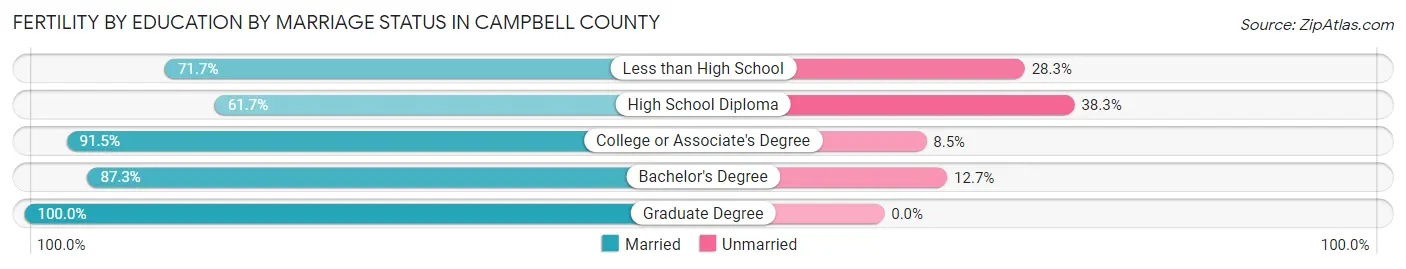
Fertility by Education by Marriage Status in Campbell County
22.9% of women with births in Campbell County are unmarried. Women with the educational attainment of graduate degree are most likely to be married with 100.0% of them married at childbirth, while women with the educational attainment of high school diploma are least likely to be married with 38.3% of them unmarried at childbirth.
| Educational Attainment | Married | Unmarried |
| Less than High School | 38 (71.7%) | 15 (28.3%) |
| High School Diploma | 222 (61.7%) | 138 (38.3%) |
| College or Associate's Degree | 162 (91.5%) | 15 (8.5%) |
| Bachelor's Degree | 193 (87.3%) | 28 (12.7%) |
| Graduate Degree | 44 (100.0%) | 0 (0.0%) |
| Total | 659 (77.1%) | 196 (22.9%) |
Income in Campbell County
Income Overview in Campbell County
Per Capita Income in Campbell County is $39,781, while median incomes of families and households are $101,763 and $93,315 respectively.
| Characteristic | Number | Measure |
| Per Capita Income | 46,857 | $39,781 |
| Median Family Income | 12,399 | $101,763 |
| Mean Family Income | 12,399 | $114,757 |
| Median Household Income | 17,509 | $93,315 |
| Mean Household Income | 17,509 | $104,257 |
| Income Deficit | 12,399 | $9,858 |
| Wage / Income Gap (%) | 46,857 | 47.09% |
| Wage / Income Gap ($) | 46,857 | 52.91¢ per $1 |
| Gini / Inequality Index | 46,857 | 0.39 |
Earnings by Sex in Campbell County
Average Earnings in Campbell County are $50,956, $68,175 for men and $36,073 for women, a difference of 47.1%.
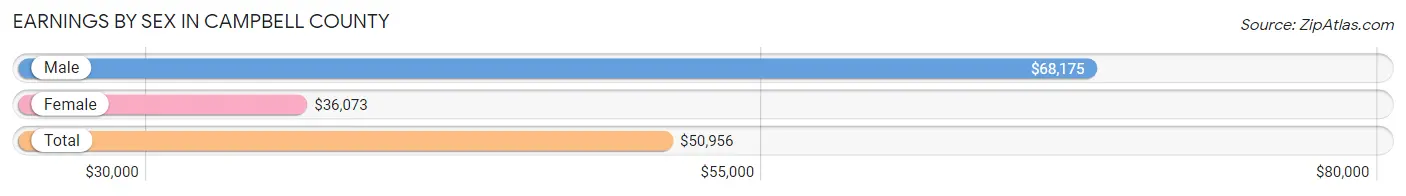
| Sex | Number | Average Earnings |
| Male | 15,372 (58.3%) | $68,175 |
| Female | 11,002 (41.7%) | $36,073 |
| Total | 26,374 (100.0%) | $50,956 |
Earnings by Sex by Income Bracket in Campbell County
The most common earnings brackets in Campbell County are $100,000+ for men (3,980 | 25.9%) and $75,000 to $99,999 for women (1,315 | 11.9%).
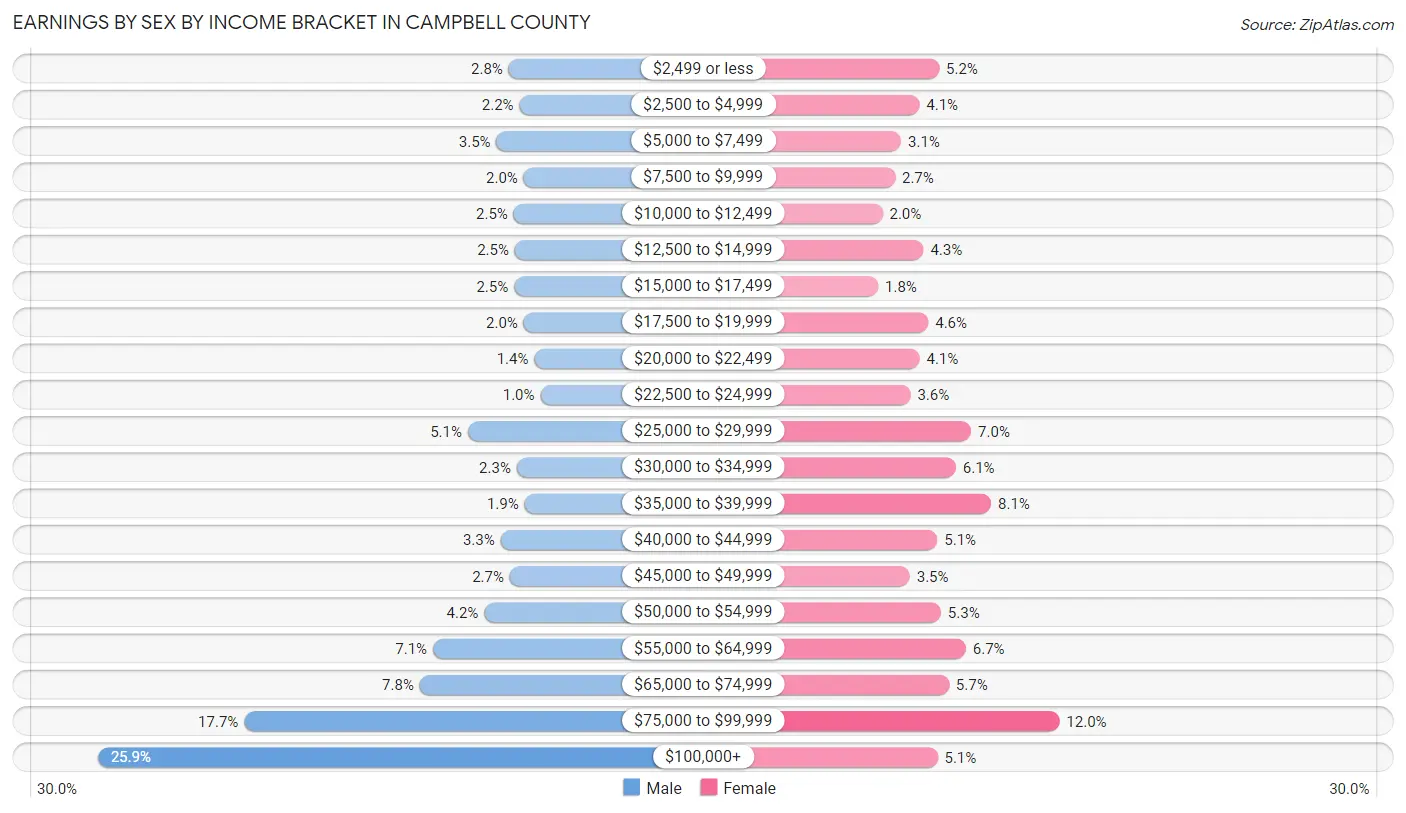
| Income | Male | Female |
| $2,499 or less | 429 (2.8%) | 571 (5.2%) |
| $2,500 to $4,999 | 336 (2.2%) | 449 (4.1%) |
| $5,000 to $7,499 | 535 (3.5%) | 336 (3.0%) |
| $7,500 to $9,999 | 299 (1.9%) | 298 (2.7%) |
| $10,000 to $12,499 | 386 (2.5%) | 221 (2.0%) |
| $12,500 to $14,999 | 376 (2.5%) | 474 (4.3%) |
| $15,000 to $17,499 | 383 (2.5%) | 194 (1.8%) |
| $17,500 to $19,999 | 300 (1.9%) | 504 (4.6%) |
| $20,000 to $22,499 | 207 (1.3%) | 450 (4.1%) |
| $22,500 to $24,999 | 155 (1.0%) | 394 (3.6%) |
| $25,000 to $29,999 | 782 (5.1%) | 769 (7.0%) |
| $30,000 to $34,999 | 359 (2.3%) | 674 (6.1%) |
| $35,000 to $39,999 | 292 (1.9%) | 892 (8.1%) |
| $40,000 to $44,999 | 499 (3.3%) | 560 (5.1%) |
| $45,000 to $49,999 | 419 (2.7%) | 390 (3.5%) |
| $50,000 to $54,999 | 641 (4.2%) | 582 (5.3%) |
| $55,000 to $64,999 | 1,083 (7.0%) | 736 (6.7%) |
| $65,000 to $74,999 | 1,197 (7.8%) | 632 (5.7%) |
| $75,000 to $99,999 | 2,714 (17.7%) | 1,315 (11.9%) |
| $100,000+ | 3,980 (25.9%) | 561 (5.1%) |
| Total | 15,372 (100.0%) | 11,002 (100.0%) |
Earnings by Sex by Educational Attainment in Campbell County
Average earnings in Campbell County are $75,029 for men and $40,209 for women, a difference of 46.4%. Men with an educational attainment of bachelor's degree enjoy the highest average annual earnings of $88,193, while those with less than high school education earn the least with $52,540. Women with an educational attainment of bachelor's degree earn the most with the average annual earnings of $65,550, while those with less than high school education have the smallest earnings of $25,933.
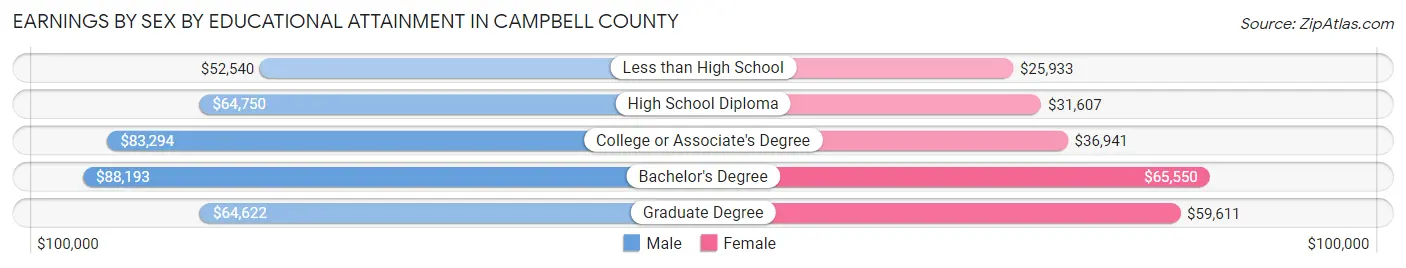
| Educational Attainment | Male Income | Female Income |
| Less than High School | $52,540 | $25,933 |
| High School Diploma | $64,750 | $31,607 |
| College or Associate's Degree | $83,294 | $36,941 |
| Bachelor's Degree | $88,193 | $65,550 |
| Graduate Degree | $64,622 | $59,611 |
| Total | $75,029 | $40,209 |
Family Income in Campbell County
Family Income Brackets in Campbell County
According to the Campbell County family income data, there are 3,249 families falling into the $100,000 to $149,999 income range, which is the most common income bracket and makes up 26.2% of all families. Conversely, the $10,000 to $14,999 income bracket is the least frequent group with only 161 families (1.3%) belonging to this category.
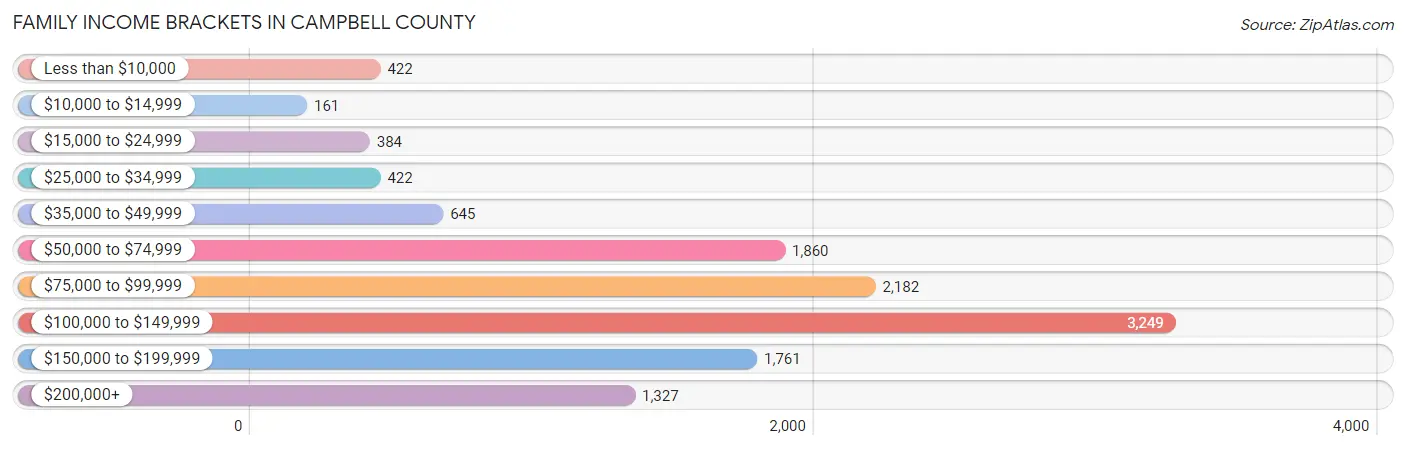
| Income Bracket | # Families | % Families |
| Less than $10,000 | 422 | 3.4% |
| $10,000 to $14,999 | 161 | 1.3% |
| $15,000 to $24,999 | 384 | 3.1% |
| $25,000 to $34,999 | 422 | 3.4% |
| $35,000 to $49,999 | 645 | 5.2% |
| $50,000 to $74,999 | 1,860 | 15.0% |
| $75,000 to $99,999 | 2,182 | 17.6% |
| $100,000 to $149,999 | 3,249 | 26.2% |
| $150,000 to $199,999 | 1,761 | 14.2% |
| $200,000+ | 1,327 | 10.7% |
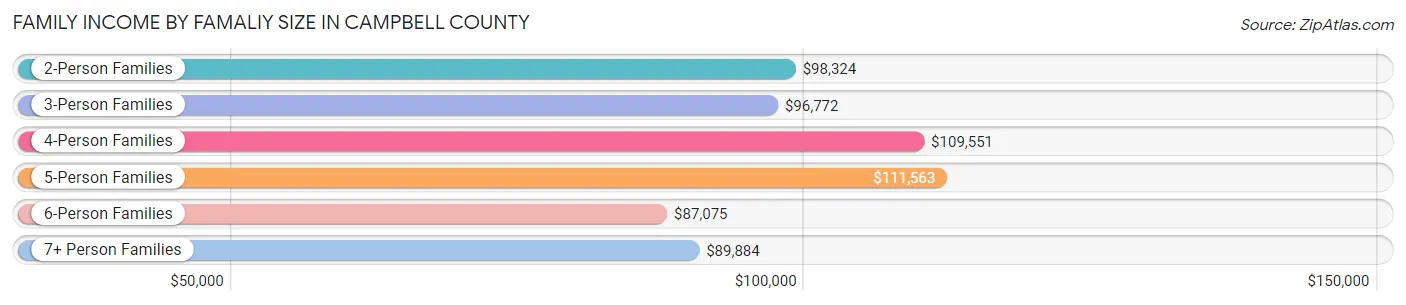
Family Income by Famaliy Size in Campbell County
5-person families (719 | 5.8%) account for the highest median family income in Campbell County with $111,563 per family, while 2-person families (5,970 | 48.1%) have the highest median income of $49,162 per family member.
| Income Bracket | # Families | Median Income |
| 2-Person Families | 5,970 (48.1%) | $98,324 |
| 3-Person Families | 2,510 (20.2%) | $96,772 |
| 4-Person Families | 2,899 (23.4%) | $109,551 |
| 5-Person Families | 719 (5.8%) | $111,563 |
| 6-Person Families | 219 (1.8%) | $87,075 |
| 7+ Person Families | 82 (0.7%) | $89,884 |
| Total | 12,399 (100.0%) | $101,763 |
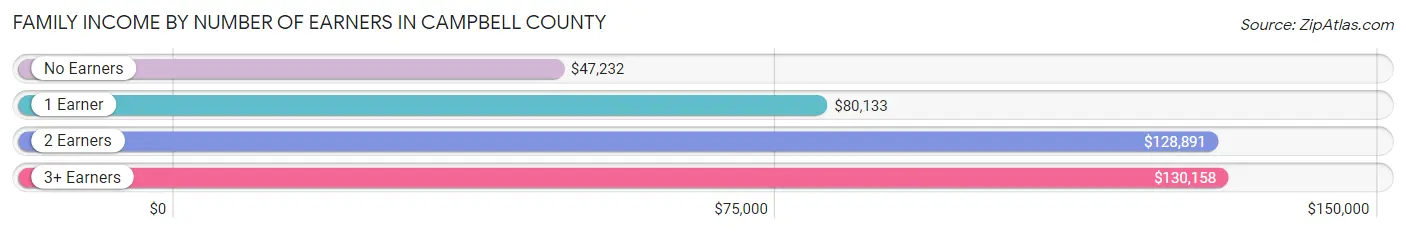
Family Income by Number of Earners in Campbell County
The median family income in Campbell County is $101,763, with families comprising 3+ earners (1,179) having the highest median family income of $130,158, while families with no earners (1,326) have the lowest median family income of $47,232, accounting for 9.5% and 10.7% of families, respectively.
| Number of Earners | # Families | Median Income |
| No Earners | 1,326 (10.7%) | $47,232 |
| 1 Earner | 3,941 (31.8%) | $80,133 |
| 2 Earners | 5,953 (48.0%) | $128,891 |
| 3+ Earners | 1,179 (9.5%) | $130,158 |
| Total | 12,399 (100.0%) | $101,763 |
Household Income in Campbell County
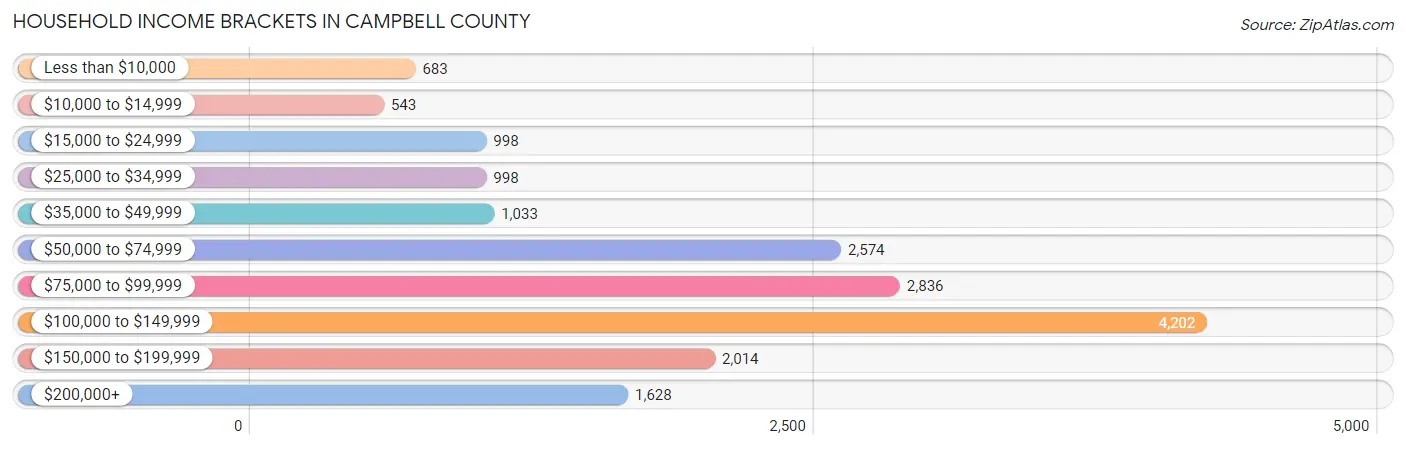
Household Income Brackets in Campbell County
With 4,202 households falling in the category, the $100,000 to $149,999 income range is the most frequent in Campbell County, accounting for 24.0% of all households. In contrast, only 543 households (3.1%) fall into the $10,000 to $14,999 income bracket, making it the least populous group.
| Income Bracket | # Households | % Households |
| Less than $10,000 | 683 | 3.9% |
| $10,000 to $14,999 | 543 | 3.1% |
| $15,000 to $24,999 | 998 | 5.7% |
| $25,000 to $34,999 | 998 | 5.7% |
| $35,000 to $49,999 | 1,033 | 5.9% |
| $50,000 to $74,999 | 2,574 | 14.7% |
| $75,000 to $99,999 | 2,836 | 16.2% |
| $100,000 to $149,999 | 4,202 | 24.0% |
| $150,000 to $199,999 | 2,014 | 11.5% |
| $200,000+ | 1,628 | 9.3% |
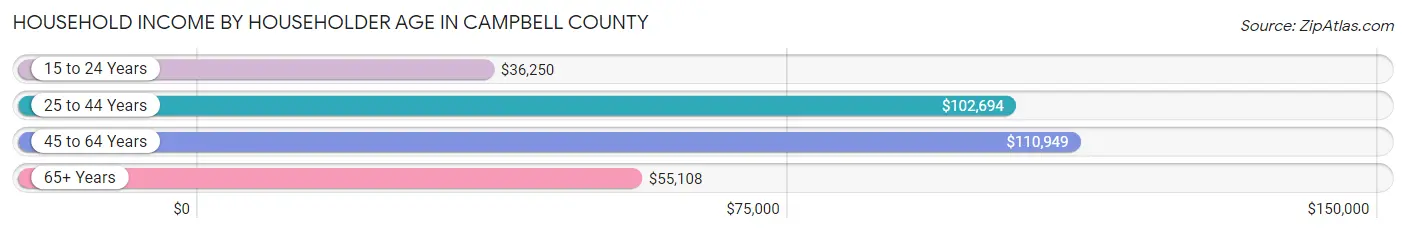
Household Income by Householder Age in Campbell County
The median household income in Campbell County is $93,315, with the highest median household income of $110,949 found in the 45 to 64 years age bracket for the primary householder. A total of 6,219 households (35.5%) fall into this category. Meanwhile, the 15 to 24 years age bracket for the primary householder has the lowest median household income of $36,250, with 972 households (5.6%) in this group.
| Income Bracket | # Households | Median Income |
| 15 to 24 Years | 972 (5.6%) | $36,250 |
| 25 to 44 Years | 6,726 (38.4%) | $102,694 |
| 45 to 64 Years | 6,219 (35.5%) | $110,949 |
| 65+ Years | 3,592 (20.5%) | $55,108 |
| Total | 17,509 (100.0%) | $93,315 |
Poverty in Campbell County
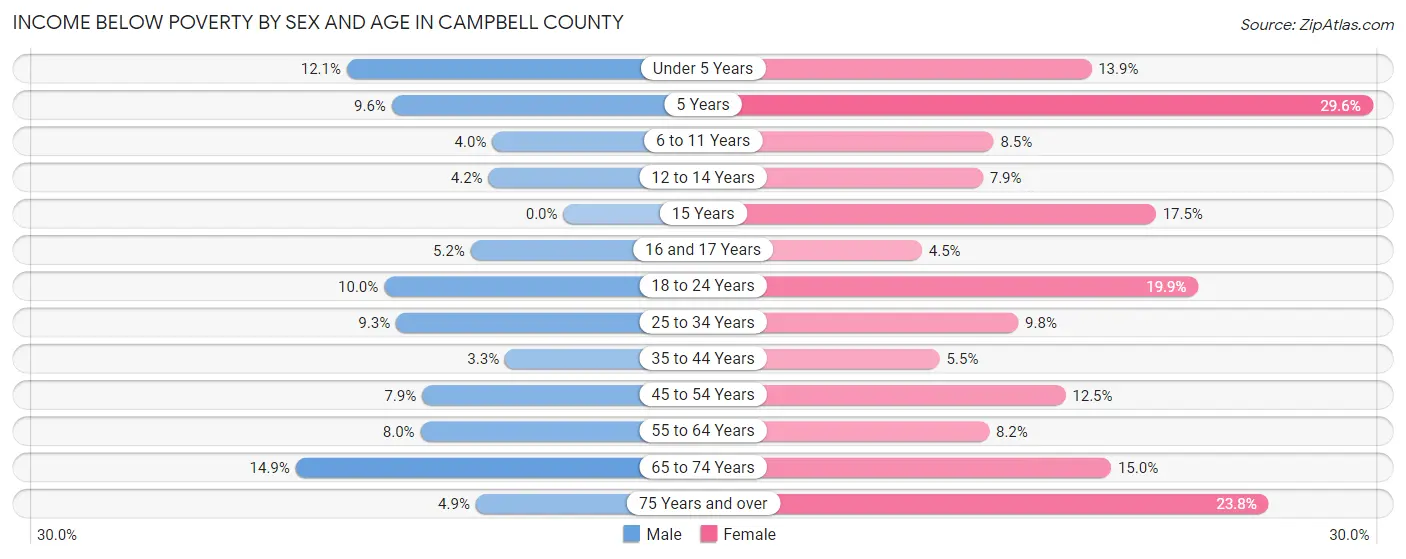
Income Below Poverty by Sex and Age in Campbell County
With 7.7% poverty level for males and 11.4% for females among the residents of Campbell County, 65 to 74 year old males and 5 year old females are the most vulnerable to poverty, with 291 males (14.9%) and 104 females (29.5%) in their respective age groups living below the poverty level.
| Age Bracket | Male | Female |
| Under 5 Years | 210 (12.1%) | 197 (13.9%) |
| 5 Years | 41 (9.6%) | 104 (29.5%) |
| 6 to 11 Years | 80 (4.0%) | 161 (8.5%) |
| 12 to 14 Years | 48 (4.2%) | 109 (7.9%) |
| 15 Years | 0 (0.0%) | 75 (17.5%) |
| 16 and 17 Years | 43 (5.2%) | 22 (4.5%) |
| 18 to 24 Years | 202 (10.0%) | 366 (19.9%) |
| 25 to 34 Years | 304 (9.3%) | 297 (9.8%) |
| 35 to 44 Years | 114 (3.3%) | 167 (5.4%) |
| 45 to 54 Years | 226 (7.9%) | 333 (12.4%) |
| 55 to 64 Years | 257 (8.0%) | 248 (8.2%) |
| 65 to 74 Years | 291 (14.9%) | 278 (15.0%) |
| 75 Years and over | 32 (4.9%) | 192 (23.8%) |
| Total | 1,848 (7.7%) | 2,549 (11.4%) |
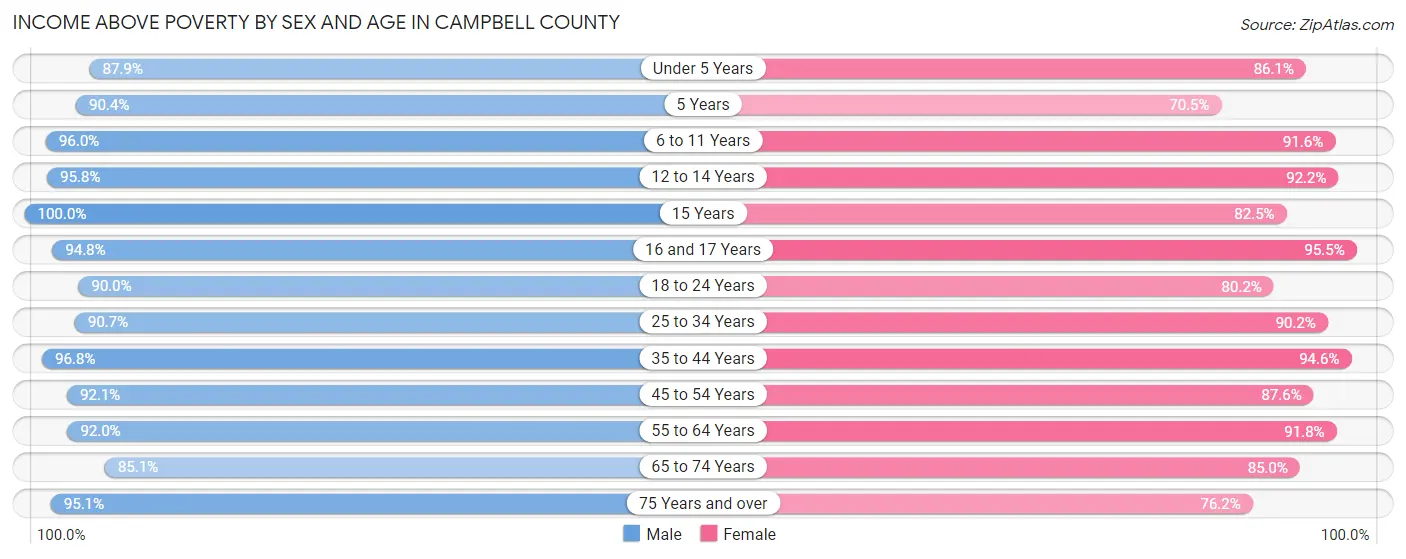
Income Above Poverty by Sex and Age in Campbell County
According to the poverty statistics in Campbell County, males aged 15 years and females aged 16 and 17 years are the age groups that are most secure financially, with 100.0% of males and 95.5% of females in these age groups living above the poverty line.
| Age Bracket | Male | Female |
| Under 5 Years | 1,532 (87.9%) | 1,221 (86.1%) |
| 5 Years | 388 (90.4%) | 248 (70.5%) |
| 6 to 11 Years | 1,942 (96.0%) | 1,745 (91.5%) |
| 12 to 14 Years | 1,103 (95.8%) | 1,279 (92.1%) |
| 15 Years | 201 (100.0%) | 354 (82.5%) |
| 16 and 17 Years | 791 (94.8%) | 471 (95.5%) |
| 18 to 24 Years | 1,822 (90.0%) | 1,478 (80.1%) |
| 25 to 34 Years | 2,959 (90.7%) | 2,728 (90.2%) |
| 35 to 44 Years | 3,389 (96.8%) | 2,897 (94.6%) |
| 45 to 54 Years | 2,645 (92.1%) | 2,342 (87.5%) |
| 55 to 64 Years | 2,971 (92.0%) | 2,777 (91.8%) |
| 65 to 74 Years | 1,661 (85.1%) | 1,577 (85.0%) |
| 75 Years and over | 624 (95.1%) | 616 (76.2%) |
| Total | 22,028 (92.3%) | 19,733 (88.6%) |
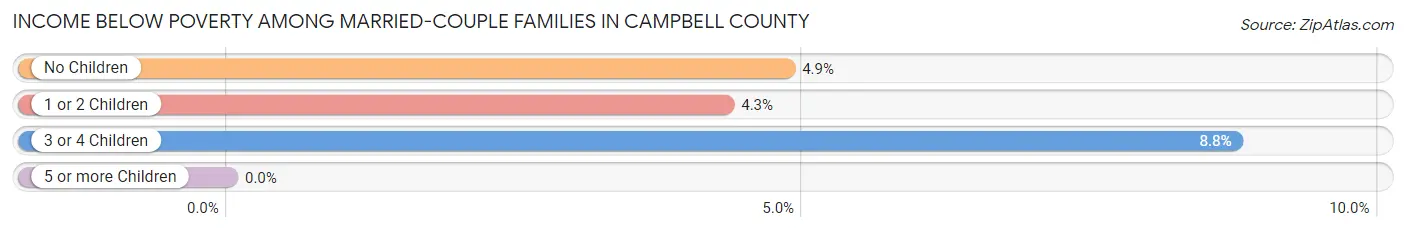
Income Below Poverty Among Married-Couple Families in Campbell County
The poverty statistics for married-couple families in Campbell County show that 4.9% or 499 of the total 10,117 families live below the poverty line. Families with 3 or 4 children have the highest poverty rate of 8.7%, comprising of 65 families. On the other hand, families with 5 or more children have the lowest poverty rate of 0.0%, which includes 0 families.
| Children | Above Poverty | Below Poverty |
| No Children | 5,333 (95.2%) | 272 (4.9%) |
| 1 or 2 Children | 3,590 (95.7%) | 162 (4.3%) |
| 3 or 4 Children | 678 (91.2%) | 65 (8.7%) |
| 5 or more Children | 17 (100.0%) | 0 (0.0%) |
| Total | 9,618 (95.1%) | 499 (4.9%) |
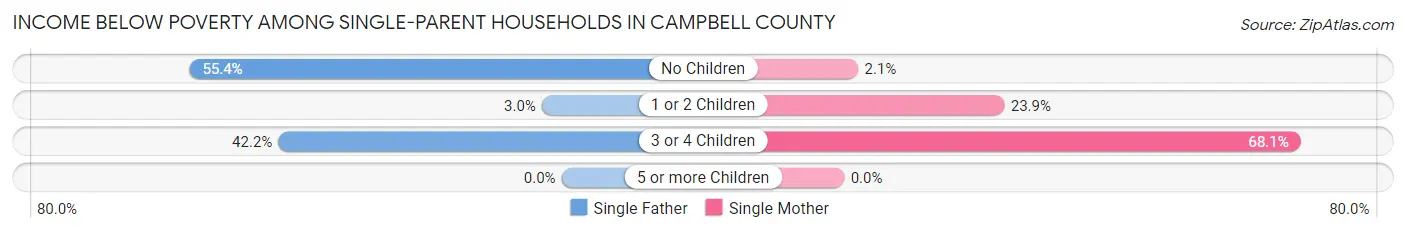
Income Below Poverty Among Single-Parent Households in Campbell County
According to the poverty data in Campbell County, 15.5% or 141 single-father households and 23.1% or 318 single-mother households are living below the poverty line. Among single-father households, those with no children have the highest poverty rate, with 102 households (55.4%) experiencing poverty. Likewise, among single-mother households, those with 3 or 4 children have the highest poverty rate, with 81 households (68.1%) falling below the poverty line.
| Children | Single Father | Single Mother |
| No Children | 102 (55.4%) | 6 (2.1%) |
| 1 or 2 Children | 20 (2.9%) | 231 (23.9%) |
| 3 or 4 Children | 19 (42.2%) | 81 (68.1%) |
| 5 or more Children | 0 (0.0%) | 0 (0.0%) |
| Total | 141 (15.5%) | 318 (23.1%) |
Income Below Poverty Among Married-Couple vs Single-Parent Households in Campbell County
The poverty data for Campbell County shows that 499 of the married-couple family households (4.9%) and 459 of the single-parent households (20.1%) are living below the poverty level. Within the married-couple family households, those with 3 or 4 children have the highest poverty rate, with 65 households (8.7%) falling below the poverty line. Among the single-parent households, those with 3 or 4 children have the highest poverty rate, with 100 household (61.0%) living below poverty.
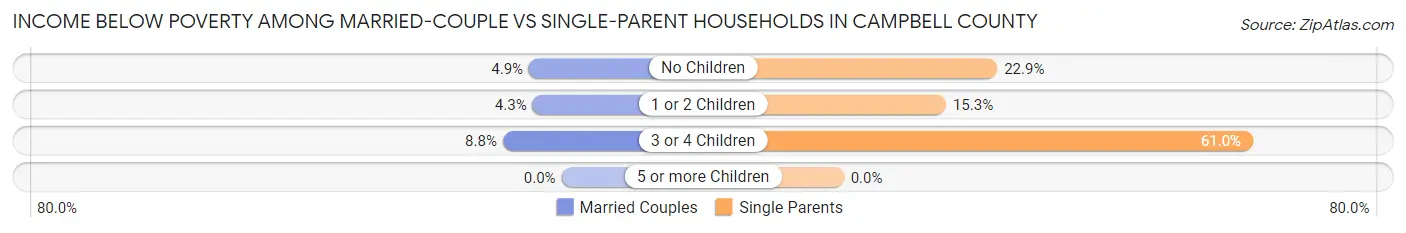
| Children | Married-Couple Families | Single-Parent Households |
| No Children | 272 (4.9%) | 108 (22.9%) |
| 1 or 2 Children | 162 (4.3%) | 251 (15.2%) |
| 3 or 4 Children | 65 (8.7%) | 100 (61.0%) |
| 5 or more Children | 0 (0.0%) | 0 (0.0%) |
| Total | 499 (4.9%) | 459 (20.1%) |
Employment Characteristics in Campbell County
Employment by Class of Employer in Campbell County
Among the 23,900 employed individuals in Campbell County, private company employees (15,940 | 66.7%), local government employees (3,283 | 13.7%), and self-employed (not incorporated) (1,163 | 4.9%) make up the most common classes of employment.
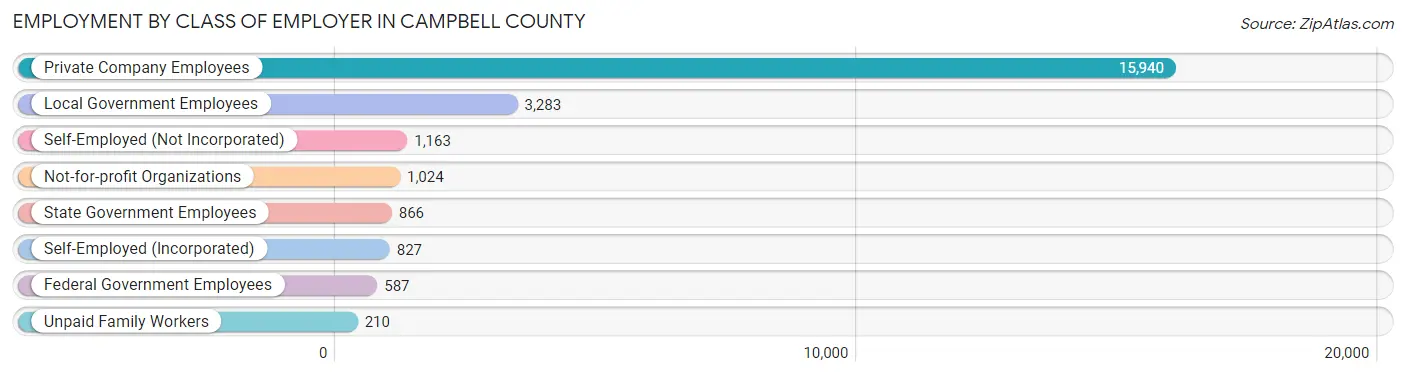
| Employer Class | # Employees | % Employees |
| Private Company Employees | 15,940 | 66.7% |
| Self-Employed (Incorporated) | 827 | 3.5% |
| Self-Employed (Not Incorporated) | 1,163 | 4.9% |
| Not-for-profit Organizations | 1,024 | 4.3% |
| Local Government Employees | 3,283 | 13.7% |
| State Government Employees | 866 | 3.6% |
| Federal Government Employees | 587 | 2.5% |
| Unpaid Family Workers | 210 | 0.9% |
| Total | 23,900 | 100.0% |
Employment Status by Age in Campbell County
According to the labor force statistics for Campbell County, out of the total population over 16 years of age (35,606), 70.9% or 25,245 individuals are in the labor force, with 3.0% or 757 of them unemployed. The age group with the highest labor force participation rate is 35 to 44 years, with 90.7% or 6,013 individuals in the labor force. Within the labor force, the 75 years and over age range has the highest percentage of unemployed individuals, with 30.5% or 18 of them being unemployed.
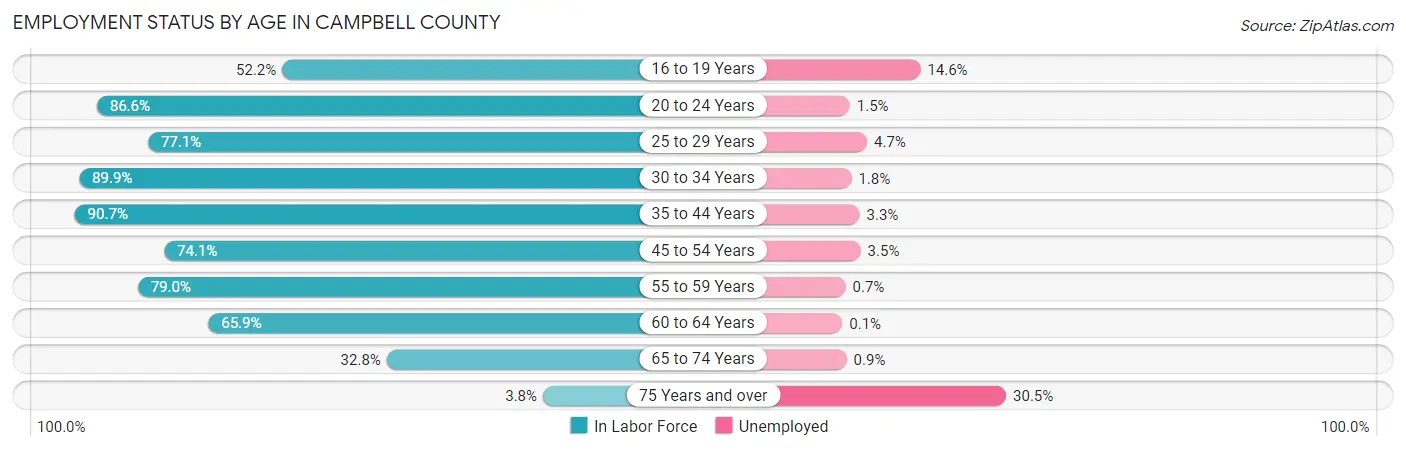
| Age Bracket | In Labor Force | Unemployed |
| 16 to 19 Years | 1,178 (52.2%) | 172 (14.6%) |
| 20 to 24 Years | 2,685 (86.6%) | 40 (1.5%) |
| 25 to 29 Years | 2,290 (77.1%) | 108 (4.7%) |
| 30 to 34 Years | 3,088 (89.9%) | 56 (1.8%) |
| 35 to 44 Years | 6,013 (90.7%) | 198 (3.3%) |
| 45 to 54 Years | 4,127 (74.1%) | 144 (3.5%) |
| 55 to 59 Years | 2,569 (79.0%) | 18 (0.7%) |
| 60 to 64 Years | 1,987 (65.9%) | 2 (0.1%) |
| 65 to 74 Years | 1,250 (32.8%) | 11 (0.9%) |
| 75 Years and over | 60 (3.8%) | 18 (30.5%) |
| Total | 25,245 (70.9%) | 757 (3.0%) |
Employment Status by Educational Attainment in Campbell County
According to labor force statistics for Campbell County, 80.7% of individuals (20,072) out of the total population between 25 and 64 years of age (24,872) are in the labor force, with 2.6% or 522 of them being unemployed. The group with the highest labor force participation rate are those with the educational attainment of college / associate degree, with 84.2% or 7,786 individuals in the labor force. Within the labor force, individuals with less than high school education have the highest percentage of unemployment, with 11.7% or 150 of them being unemployed.
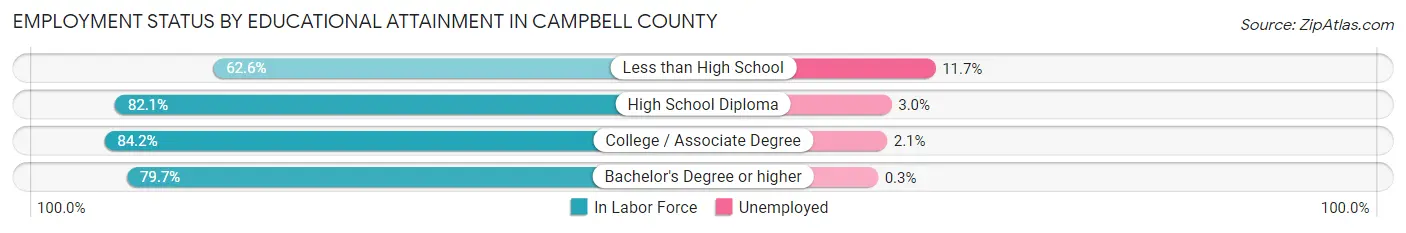
| Educational Attainment | In Labor Force | Unemployed |
| Less than High School | 1,281 (62.6%) | 239 (11.7%) |
| High School Diploma | 6,496 (82.1%) | 237 (3.0%) |
| College / Associate Degree | 7,786 (84.2%) | 194 (2.1%) |
| Bachelor's Degree or higher | 4,517 (79.7%) | 17 (0.3%) |
| Total | 20,072 (80.7%) | 647 (2.6%) |
Employment Occupations by Sex in Campbell County
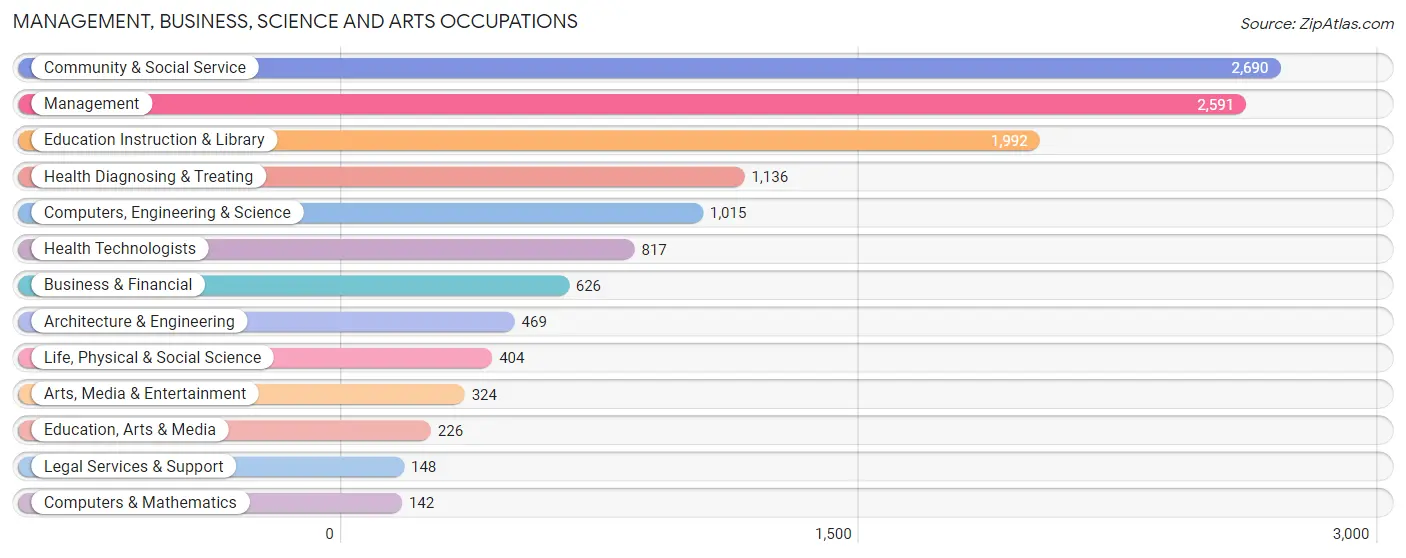
Management, Business, Science and Arts Occupations
The most common Management, Business, Science and Arts occupations in Campbell County are Community & Social Service (2,690 | 11.1%), Management (2,591 | 10.7%), Education Instruction & Library (1,992 | 8.2%), Health Diagnosing & Treating (1,136 | 4.7%), and Computers, Engineering & Science (1,015 | 4.2%).
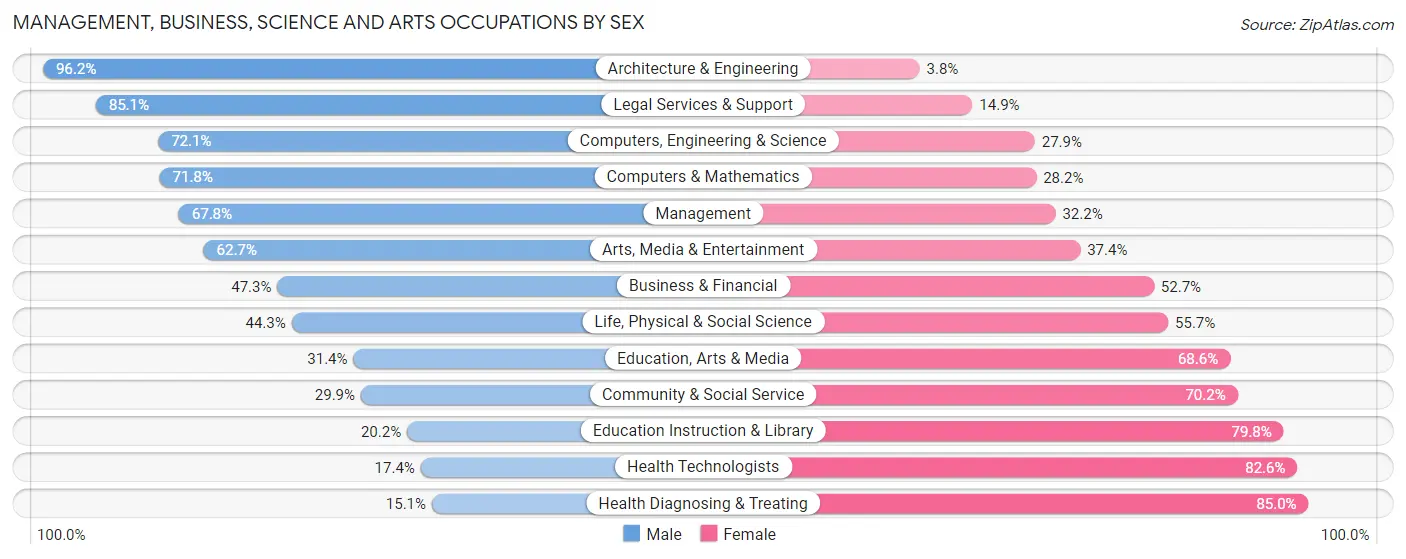
Management, Business, Science and Arts Occupations by Sex
Within the Management, Business, Science and Arts occupations in Campbell County, the most male-oriented occupations are Architecture & Engineering (96.2%), Legal Services & Support (85.1%), and Computers, Engineering & Science (72.1%), while the most female-oriented occupations are Health Diagnosing & Treating (85.0%), Health Technologists (82.6%), and Education Instruction & Library (79.8%).
| Occupation | Male | Female |
| Management | 1,757 (67.8%) | 834 (32.2%) |
| Business & Financial | 296 (47.3%) | 330 (52.7%) |
| Computers, Engineering & Science | 732 (72.1%) | 283 (27.9%) |
| Computers & Mathematics | 102 (71.8%) | 40 (28.2%) |
| Architecture & Engineering | 451 (96.2%) | 18 (3.8%) |
| Life, Physical & Social Science | 179 (44.3%) | 225 (55.7%) |
| Community & Social Service | 803 (29.8%) | 1,887 (70.2%) |
| Education, Arts & Media | 71 (31.4%) | 155 (68.6%) |
| Legal Services & Support | 126 (85.1%) | 22 (14.9%) |
| Education Instruction & Library | 403 (20.2%) | 1,589 (79.8%) |
| Arts, Media & Entertainment | 203 (62.6%) | 121 (37.3%) |
| Health Diagnosing & Treating | 171 (15.0%) | 965 (85.0%) |
| Health Technologists | 142 (17.4%) | 675 (82.6%) |
| Total (Category) | 3,759 (46.7%) | 4,299 (53.3%) |
| Total (Overall) | 14,157 (58.3%) | 10,125 (41.7%) |
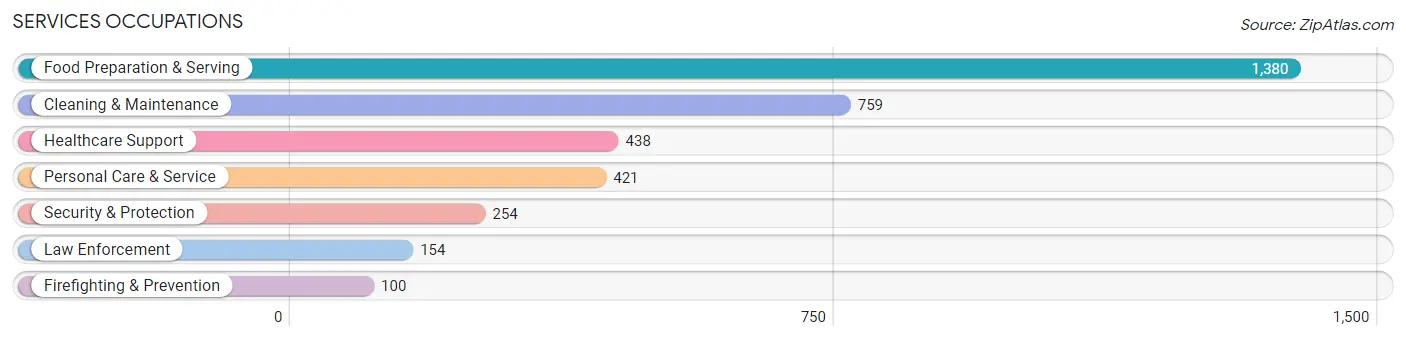
Services Occupations
The most common Services occupations in Campbell County are Food Preparation & Serving (1,380 | 5.7%), Cleaning & Maintenance (759 | 3.1%), Healthcare Support (438 | 1.8%), Personal Care & Service (421 | 1.7%), and Security & Protection (254 | 1.1%).
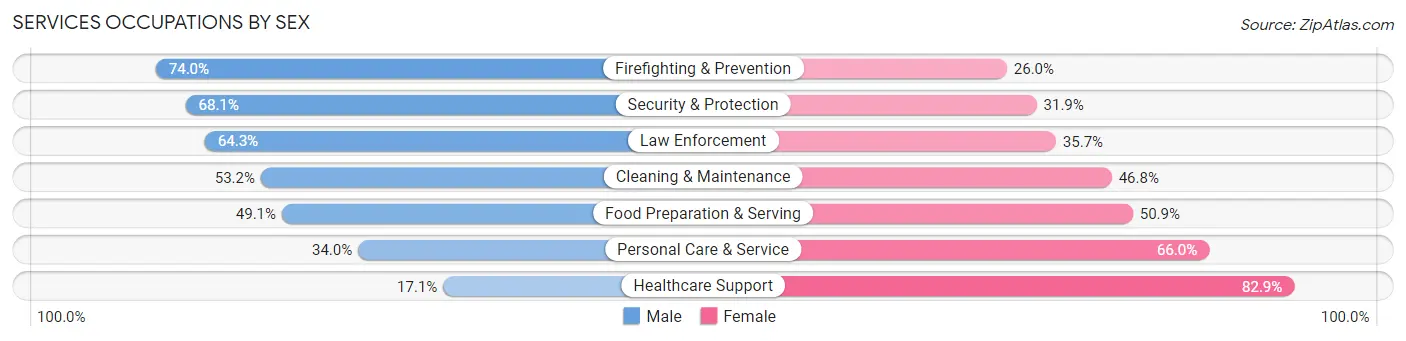
Services Occupations by Sex
Within the Services occupations in Campbell County, the most male-oriented occupations are Firefighting & Prevention (74.0%), Security & Protection (68.1%), and Law Enforcement (64.3%), while the most female-oriented occupations are Healthcare Support (82.9%), Personal Care & Service (66.0%), and Food Preparation & Serving (50.9%).
| Occupation | Male | Female |
| Healthcare Support | 75 (17.1%) | 363 (82.9%) |
| Security & Protection | 173 (68.1%) | 81 (31.9%) |
| Firefighting & Prevention | 74 (74.0%) | 26 (26.0%) |
| Law Enforcement | 99 (64.3%) | 55 (35.7%) |
| Food Preparation & Serving | 677 (49.1%) | 703 (50.9%) |
| Cleaning & Maintenance | 404 (53.2%) | 355 (46.8%) |
| Personal Care & Service | 143 (34.0%) | 278 (66.0%) |
| Total (Category) | 1,472 (45.3%) | 1,780 (54.7%) |
| Total (Overall) | 14,157 (58.3%) | 10,125 (41.7%) |
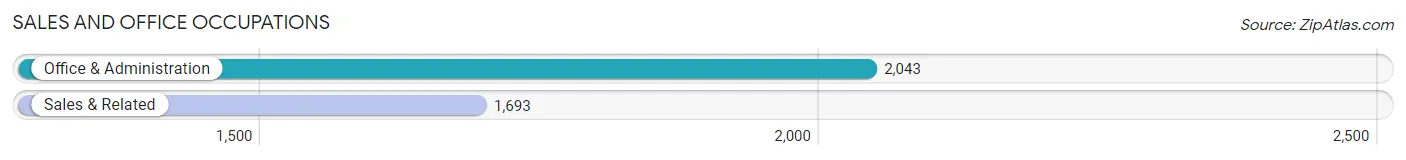
Sales and Office Occupations
The most common Sales and Office occupations in Campbell County are Office & Administration (2,043 | 8.4%), and Sales & Related (1,693 | 7.0%).
Sales and Office Occupations by Sex
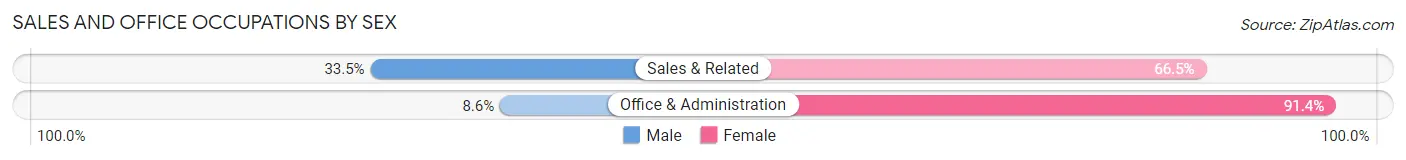
| Occupation | Male | Female |
| Sales & Related | 567 (33.5%) | 1,126 (66.5%) |
| Office & Administration | 175 (8.6%) | 1,868 (91.4%) |
| Total (Category) | 742 (19.9%) | 2,994 (80.1%) |
| Total (Overall) | 14,157 (58.3%) | 10,125 (41.7%) |
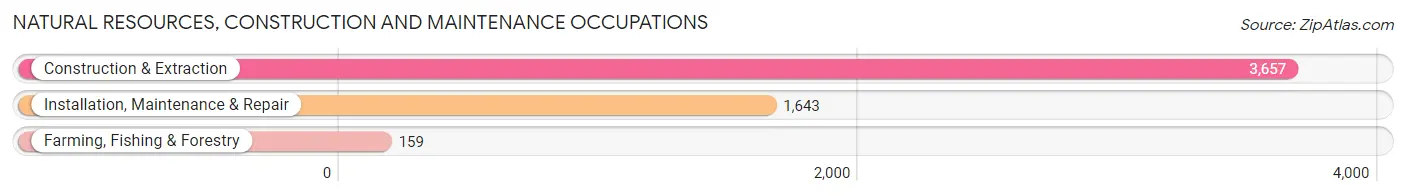
Natural Resources, Construction and Maintenance Occupations
The most common Natural Resources, Construction and Maintenance occupations in Campbell County are Construction & Extraction (3,657 | 15.1%), Installation, Maintenance & Repair (1,643 | 6.8%), and Farming, Fishing & Forestry (159 | 0.6%).
Natural Resources, Construction and Maintenance Occupations by Sex
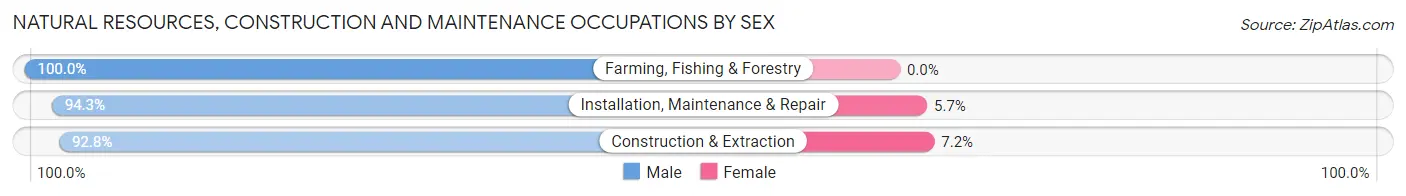
| Occupation | Male | Female |
| Farming, Fishing & Forestry | 159 (100.0%) | 0 (0.0%) |
| Construction & Extraction | 3,395 (92.8%) | 262 (7.2%) |
| Installation, Maintenance & Repair | 1,550 (94.3%) | 93 (5.7%) |
| Total (Category) | 5,104 (93.5%) | 355 (6.5%) |
| Total (Overall) | 14,157 (58.3%) | 10,125 (41.7%) |
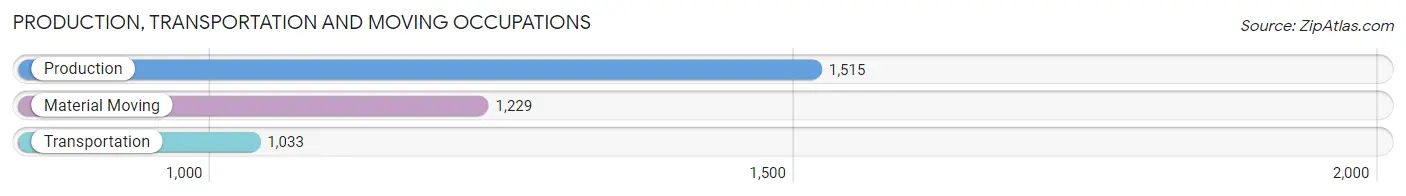
Production, Transportation and Moving Occupations
The most common Production, Transportation and Moving occupations in Campbell County are Production (1,515 | 6.2%), Material Moving (1,229 | 5.1%), and Transportation (1,033 | 4.3%).
Production, Transportation and Moving Occupations by Sex
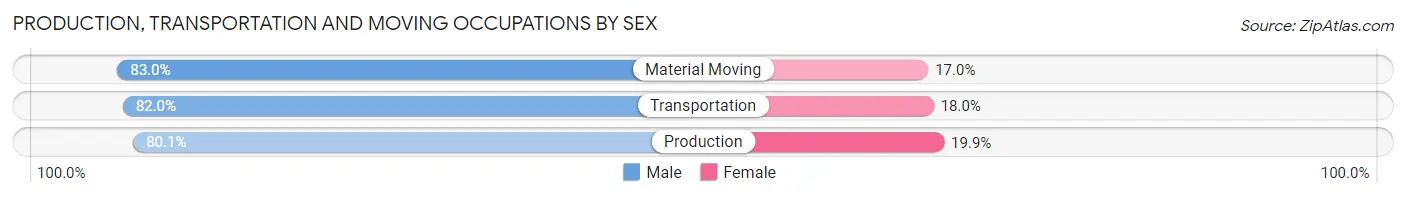
| Occupation | Male | Female |
| Production | 1,213 (80.1%) | 302 (19.9%) |
| Transportation | 847 (82.0%) | 186 (18.0%) |
| Material Moving | 1,020 (83.0%) | 209 (17.0%) |
| Total (Category) | 3,080 (81.6%) | 697 (18.4%) |
| Total (Overall) | 14,157 (58.3%) | 10,125 (41.7%) |
Employment Industries by Sex in Campbell County
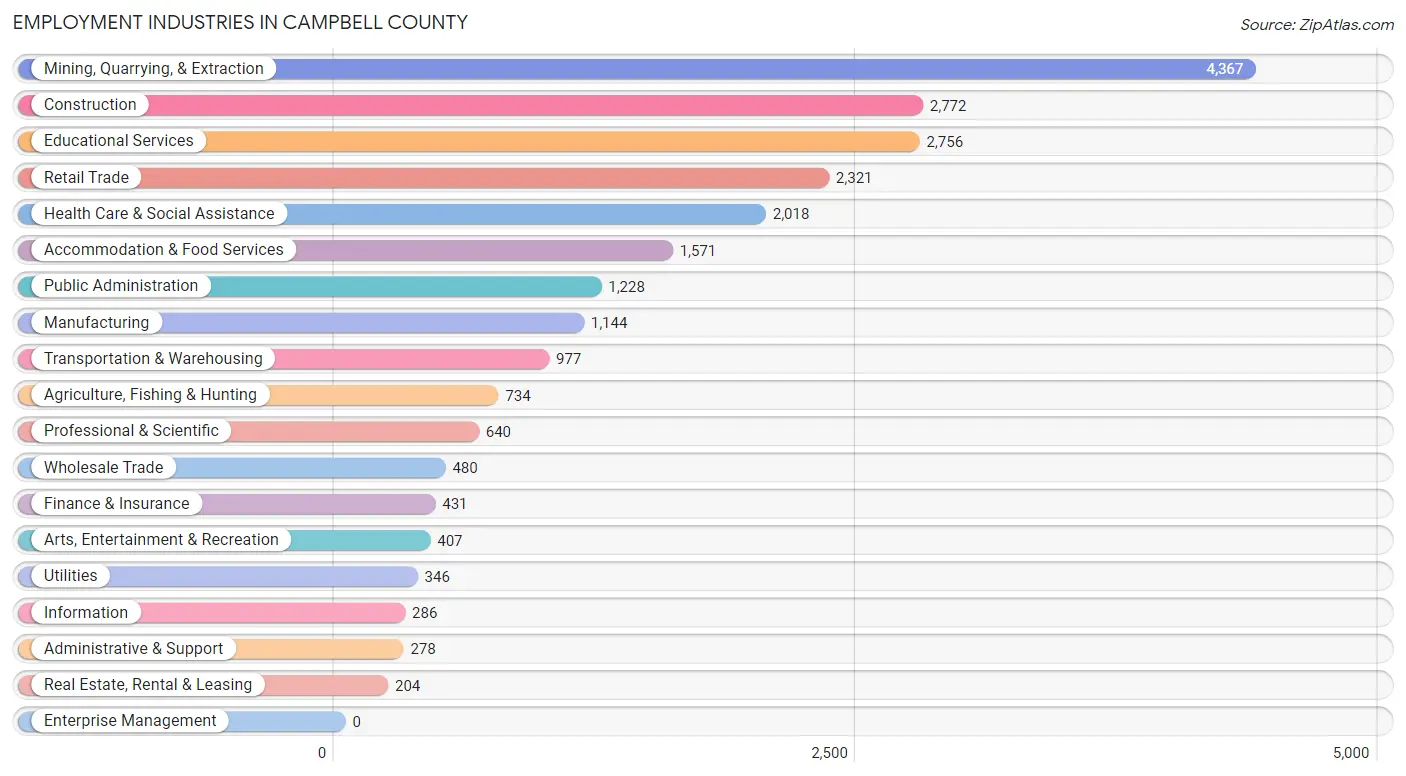
Employment Industries in Campbell County
The major employment industries in Campbell County include Mining, Quarrying, & Extraction (4,367 | 18.0%), Construction (2,772 | 11.4%), Educational Services (2,756 | 11.4%), Retail Trade (2,321 | 9.6%), and Health Care & Social Assistance (2,018 | 8.3%).
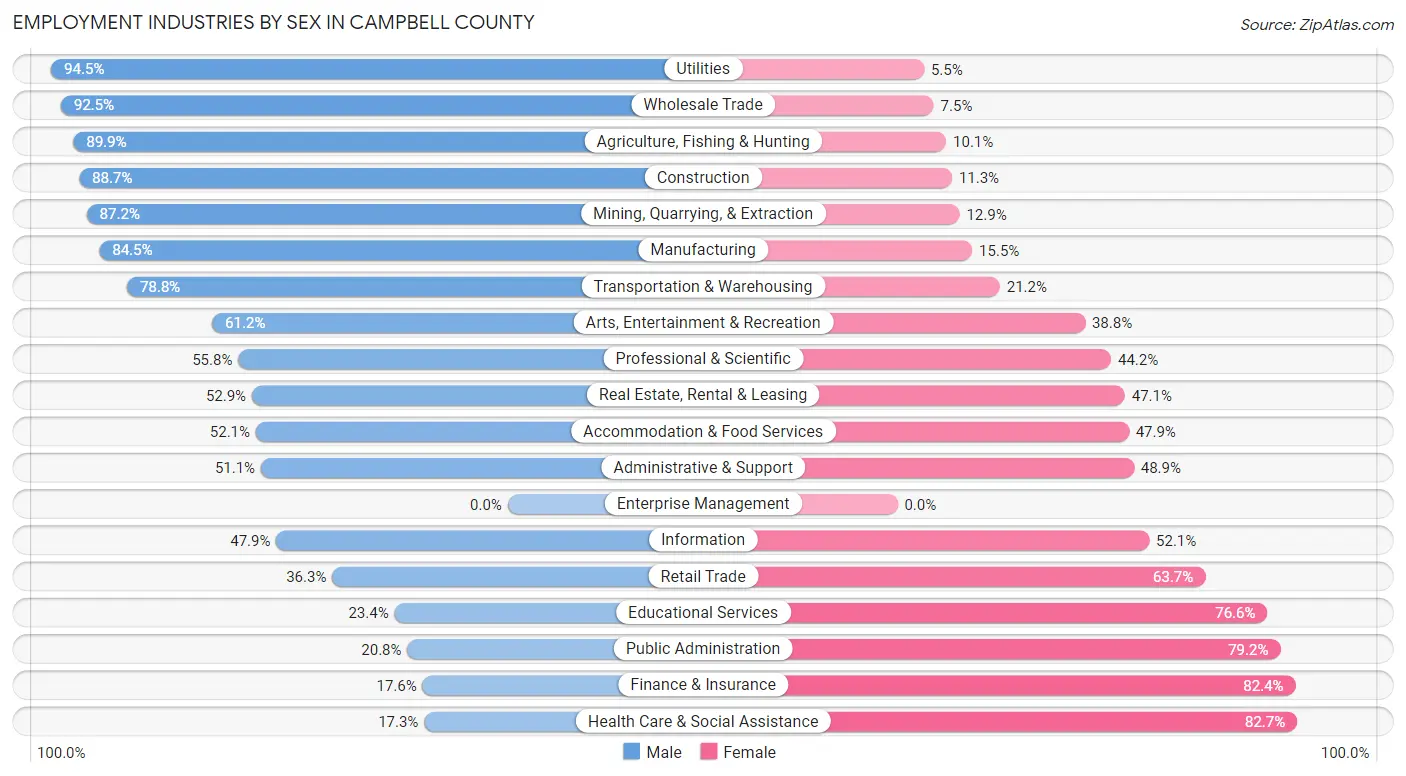
Employment Industries by Sex in Campbell County
The Campbell County industries that see more men than women are Utilities (94.5%), Wholesale Trade (92.5%), and Agriculture, Fishing & Hunting (89.9%), whereas the industries that tend to have a higher number of women are Health Care & Social Assistance (82.7%), Finance & Insurance (82.4%), and Public Administration (79.2%).
| Industry | Male | Female |
| Agriculture, Fishing & Hunting | 660 (89.9%) | 74 (10.1%) |
| Mining, Quarrying, & Extraction | 3,806 (87.2%) | 561 (12.9%) |
| Construction | 2,459 (88.7%) | 313 (11.3%) |
| Manufacturing | 967 (84.5%) | 177 (15.5%) |
| Wholesale Trade | 444 (92.5%) | 36 (7.5%) |
| Retail Trade | 843 (36.3%) | 1,478 (63.7%) |
| Transportation & Warehousing | 770 (78.8%) | 207 (21.2%) |
| Utilities | 327 (94.5%) | 19 (5.5%) |
| Information | 137 (47.9%) | 149 (52.1%) |
| Finance & Insurance | 76 (17.6%) | 355 (82.4%) |
| Real Estate, Rental & Leasing | 108 (52.9%) | 96 (47.1%) |
| Professional & Scientific | 357 (55.8%) | 283 (44.2%) |
| Enterprise Management | 0 (0.0%) | 0 (0.0%) |
| Administrative & Support | 142 (51.1%) | 136 (48.9%) |
| Educational Services | 646 (23.4%) | 2,110 (76.6%) |
| Health Care & Social Assistance | 349 (17.3%) | 1,669 (82.7%) |
| Arts, Entertainment & Recreation | 249 (61.2%) | 158 (38.8%) |
| Accommodation & Food Services | 819 (52.1%) | 752 (47.9%) |
| Public Administration | 255 (20.8%) | 973 (79.2%) |
| Total | 14,157 (58.3%) | 10,125 (41.7%) |
Education in Campbell County
School Enrollment in Campbell County
The most common levels of schooling among the 11,969 students in Campbell County are middle school (3,142 | 26.3%), elementary school (2,736 | 22.9%), and high school (2,457 | 20.5%).
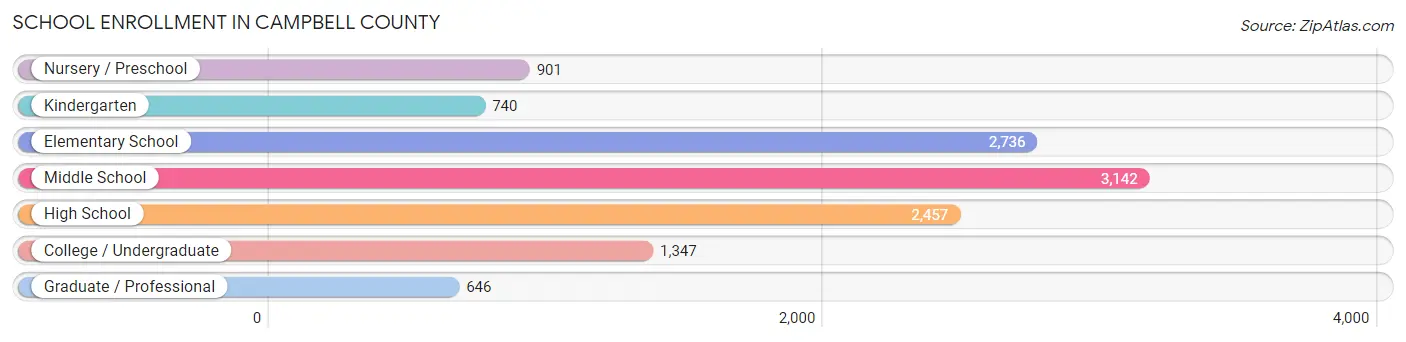
| School Level | # Students | % Students |
| Nursery / Preschool | 901 | 7.5% |
| Kindergarten | 740 | 6.2% |
| Elementary School | 2,736 | 22.9% |
| Middle School | 3,142 | 26.3% |
| High School | 2,457 | 20.5% |
| College / Undergraduate | 1,347 | 11.3% |
| Graduate / Professional | 646 | 5.4% |
| Total | 11,969 | 100.0% |
School Enrollment by Age by Funding Source in Campbell County
Out of a total of 11,969 students who are enrolled in schools in Campbell County, 993 (8.3%) attend a private institution, while the remaining 10,976 (91.7%) are enrolled in public schools. The age group of 35 years and over has the highest likelihood of being enrolled in private schools, with 256 (34.9% in the age bracket) enrolled. Conversely, the age group of 15 to 17 year olds has the lowest likelihood of being enrolled in a private school, with 1,902 (99.2% in the age bracket) attending a public institution.
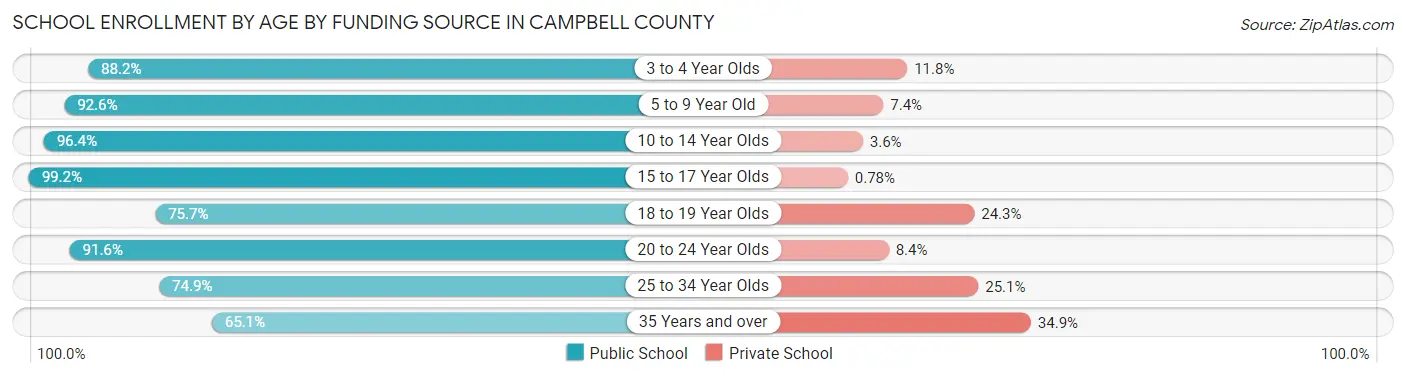
| Age Bracket | Public School | Private School |
| 3 to 4 Year Olds | 588 (88.2%) | 79 (11.8%) |
| 5 to 9 Year Old | 3,234 (92.6%) | 258 (7.4%) |
| 10 to 14 Year Olds | 3,543 (96.4%) | 131 (3.6%) |
| 15 to 17 Year Olds | 1,902 (99.2%) | 15 (0.8%) |
| 18 to 19 Year Olds | 311 (75.7%) | 100 (24.3%) |
| 20 to 24 Year Olds | 655 (91.6%) | 60 (8.4%) |
| 25 to 34 Year Olds | 269 (74.9%) | 90 (25.1%) |
| 35 Years and over | 478 (65.1%) | 256 (34.9%) |
| Total | 10,976 (91.7%) | 993 (8.3%) |
Educational Attainment by Field of Study in Campbell County
Education (1,613 | 21.7%), science & technology (974 | 13.1%), business (914 | 12.3%), bio, nature & agricultural (798 | 10.8%), and arts & humanities (718 | 9.7%) are the most common fields of study among 7,419 individuals in Campbell County who have obtained a bachelor's degree or higher.
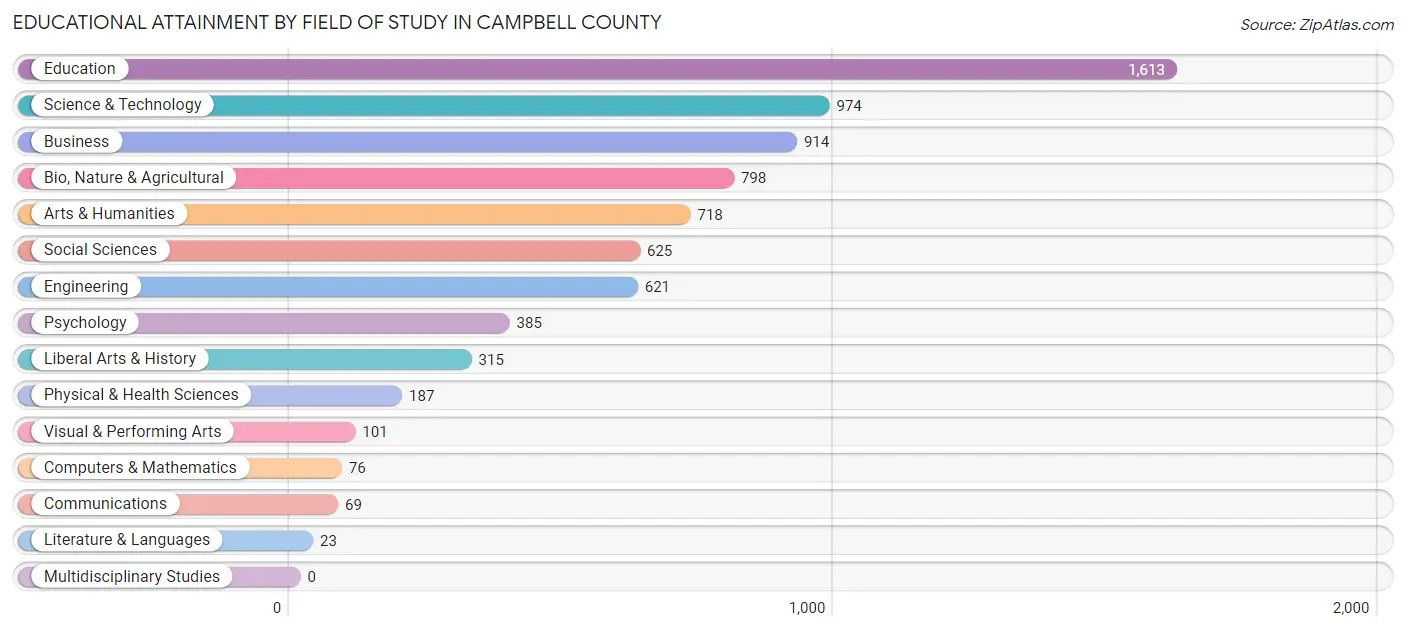
| Field of Study | # Graduates | % Graduates |
| Computers & Mathematics | 76 | 1.0% |
| Bio, Nature & Agricultural | 798 | 10.8% |
| Physical & Health Sciences | 187 | 2.5% |
| Psychology | 385 | 5.2% |
| Social Sciences | 625 | 8.4% |
| Engineering | 621 | 8.4% |
| Multidisciplinary Studies | 0 | 0.0% |
| Science & Technology | 974 | 13.1% |
| Business | 914 | 12.3% |
| Education | 1,613 | 21.7% |
| Literature & Languages | 23 | 0.3% |
| Liberal Arts & History | 315 | 4.3% |
| Visual & Performing Arts | 101 | 1.4% |
| Communications | 69 | 0.9% |
| Arts & Humanities | 718 | 9.7% |
| Total | 7,419 | 100.0% |
Transportation & Commute in Campbell County
Vehicle Availability by Sex in Campbell County
The most prevalent vehicle ownership categories in Campbell County are males with 2 vehicles (4,897, accounting for 34.9%) and females with 2 vehicles (3,405, making up 49.7%).
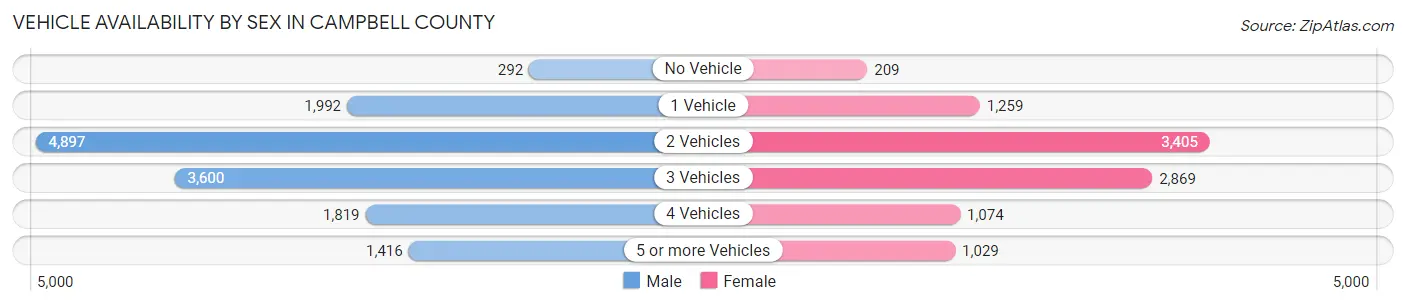
| Vehicles Available | Male | Female |
| No Vehicle | 292 (2.1%) | 209 (2.1%) |
| 1 Vehicle | 1,992 (14.2%) | 1,259 (12.8%) |
| 2 Vehicles | 4,897 (34.9%) | 3,405 (34.6%) |
| 3 Vehicles | 3,600 (25.7%) | 2,869 (29.1%) |
| 4 Vehicles | 1,819 (13.0%) | 1,074 (10.9%) |
| 5 or more Vehicles | 1,416 (10.1%) | 1,029 (10.4%) |
| Total | 14,016 (100.0%) | 9,845 (100.0%) |
Commute Time in Campbell County
The most frequently occuring commute durations in Campbell County are 10 to 14 minutes (5,054 commuters, 22.2%), 5 to 9 minutes (4,623 commuters, 20.3%), and 15 to 19 minutes (3,810 commuters, 16.8%).
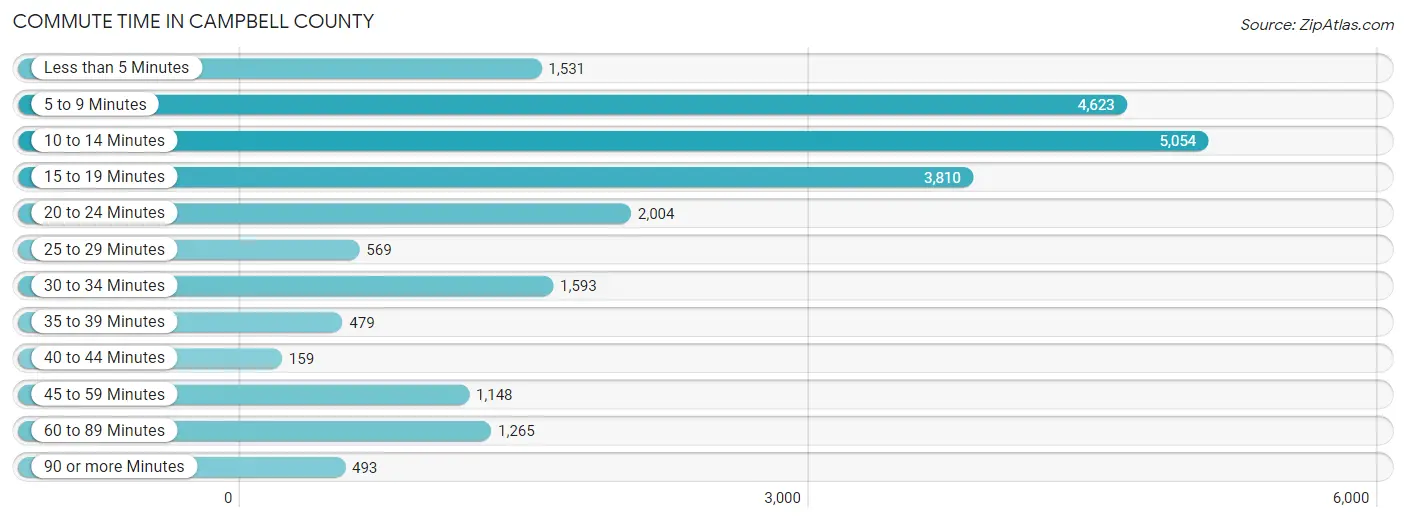
| Commute Time | # Commuters | % Commuters |
| Less than 5 Minutes | 1,531 | 6.7% |
| 5 to 9 Minutes | 4,623 | 20.3% |
| 10 to 14 Minutes | 5,054 | 22.2% |
| 15 to 19 Minutes | 3,810 | 16.8% |
| 20 to 24 Minutes | 2,004 | 8.8% |
| 25 to 29 Minutes | 569 | 2.5% |
| 30 to 34 Minutes | 1,593 | 7.0% |
| 35 to 39 Minutes | 479 | 2.1% |
| 40 to 44 Minutes | 159 | 0.7% |
| 45 to 59 Minutes | 1,148 | 5.1% |
| 60 to 89 Minutes | 1,265 | 5.6% |
| 90 or more Minutes | 493 | 2.2% |
Commute Time by Sex in Campbell County
The most common commute times in Campbell County are 10 to 14 minutes (2,687 commuters, 20.1%) for males and 5 to 9 minutes (2,396 commuters, 25.6%) for females.
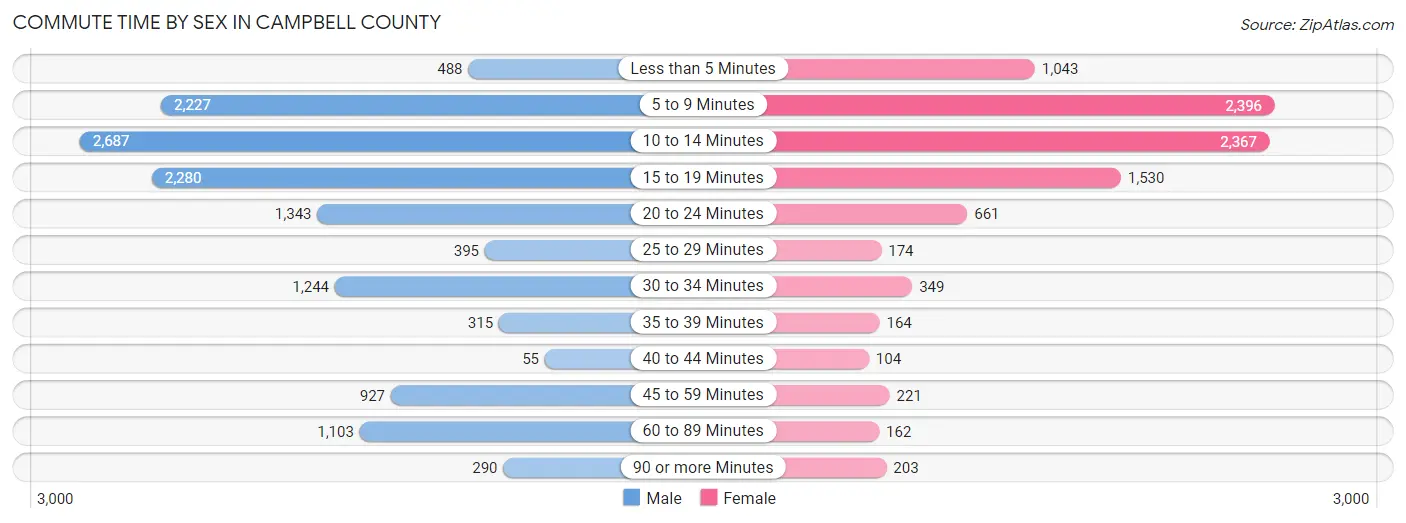
| Commute Time | Male | Female |
| Less than 5 Minutes | 488 (3.6%) | 1,043 (11.1%) |
| 5 to 9 Minutes | 2,227 (16.7%) | 2,396 (25.6%) |
| 10 to 14 Minutes | 2,687 (20.1%) | 2,367 (25.3%) |
| 15 to 19 Minutes | 2,280 (17.1%) | 1,530 (16.3%) |
| 20 to 24 Minutes | 1,343 (10.1%) | 661 (7.0%) |
| 25 to 29 Minutes | 395 (3.0%) | 174 (1.9%) |
| 30 to 34 Minutes | 1,244 (9.3%) | 349 (3.7%) |
| 35 to 39 Minutes | 315 (2.4%) | 164 (1.8%) |
| 40 to 44 Minutes | 55 (0.4%) | 104 (1.1%) |
| 45 to 59 Minutes | 927 (6.9%) | 221 (2.4%) |
| 60 to 89 Minutes | 1,103 (8.3%) | 162 (1.7%) |
| 90 or more Minutes | 290 (2.2%) | 203 (2.2%) |
Time of Departure to Work by Sex in Campbell County
The most frequent times of departure to work in Campbell County are 12:00 AM to 4:59 AM (2,017, 15.1%) for males and 7:30 AM to 7:59 AM (1,545, 16.5%) for females.
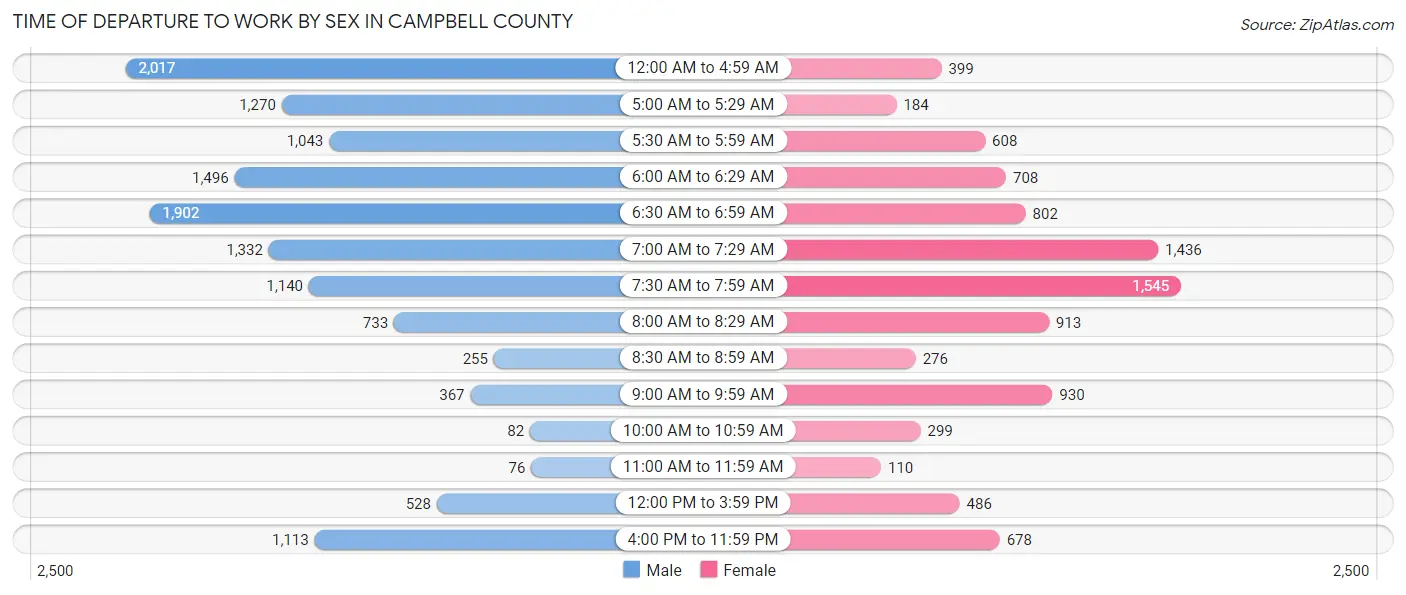
| Time of Departure | Male | Female |
| 12:00 AM to 4:59 AM | 2,017 (15.1%) | 399 (4.3%) |
| 5:00 AM to 5:29 AM | 1,270 (9.5%) | 184 (2.0%) |
| 5:30 AM to 5:59 AM | 1,043 (7.8%) | 608 (6.5%) |
| 6:00 AM to 6:29 AM | 1,496 (11.2%) | 708 (7.5%) |
| 6:30 AM to 6:59 AM | 1,902 (14.2%) | 802 (8.6%) |
| 7:00 AM to 7:29 AM | 1,332 (10.0%) | 1,436 (15.3%) |
| 7:30 AM to 7:59 AM | 1,140 (8.5%) | 1,545 (16.5%) |
| 8:00 AM to 8:29 AM | 733 (5.5%) | 913 (9.7%) |
| 8:30 AM to 8:59 AM | 255 (1.9%) | 276 (2.9%) |
| 9:00 AM to 9:59 AM | 367 (2.8%) | 930 (9.9%) |
| 10:00 AM to 10:59 AM | 82 (0.6%) | 299 (3.2%) |
| 11:00 AM to 11:59 AM | 76 (0.6%) | 110 (1.2%) |
| 12:00 PM to 3:59 PM | 528 (4.0%) | 486 (5.2%) |
| 4:00 PM to 11:59 PM | 1,113 (8.3%) | 678 (7.2%) |
| Total | 13,354 (100.0%) | 9,374 (100.0%) |
Housing Occupancy in Campbell County
Occupancy by Ownership in Campbell County
Of the total 17,509 dwellings in Campbell County, owner-occupied units account for 13,703 (78.3%), while renter-occupied units make up 3,806 (21.7%).
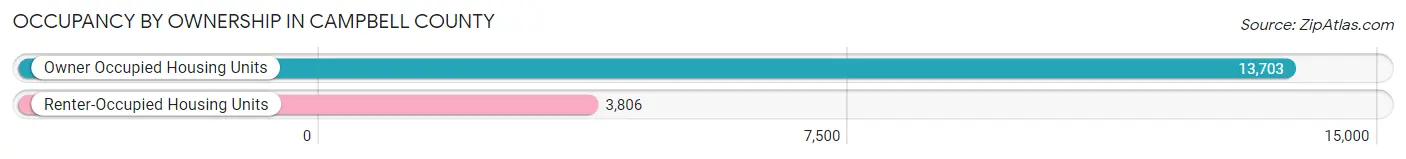
| Occupancy | # Housing Units | % Housing Units |
| Owner Occupied Housing Units | 13,703 | 78.3% |
| Renter-Occupied Housing Units | 3,806 | 21.7% |
| Total Occupied Housing Units | 17,509 | 100.0% |
Occupancy by Household Size in Campbell County
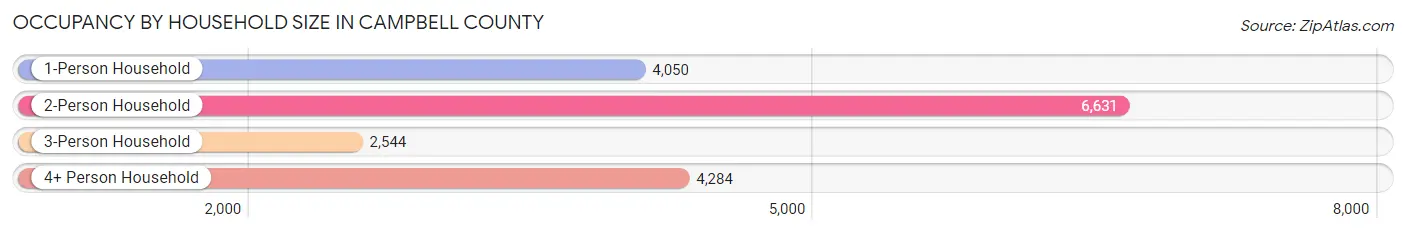
| Household Size | # Housing Units | % Housing Units |
| 1-Person Household | 4,050 | 23.1% |
| 2-Person Household | 6,631 | 37.9% |
| 3-Person Household | 2,544 | 14.5% |
| 4+ Person Household | 4,284 | 24.5% |
| Total Housing Units | 17,509 | 100.0% |
Occupancy by Ownership by Household Size in Campbell County
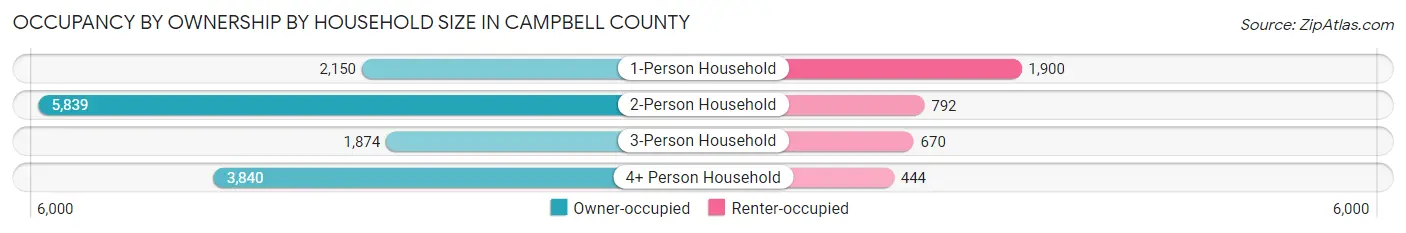
| Household Size | Owner-occupied | Renter-occupied |
| 1-Person Household | 2,150 (53.1%) | 1,900 (46.9%) |
| 2-Person Household | 5,839 (88.1%) | 792 (11.9%) |
| 3-Person Household | 1,874 (73.7%) | 670 (26.3%) |
| 4+ Person Household | 3,840 (89.6%) | 444 (10.4%) |
| Total Housing Units | 13,703 (78.3%) | 3,806 (21.7%) |
Occupancy by Educational Attainment in Campbell County
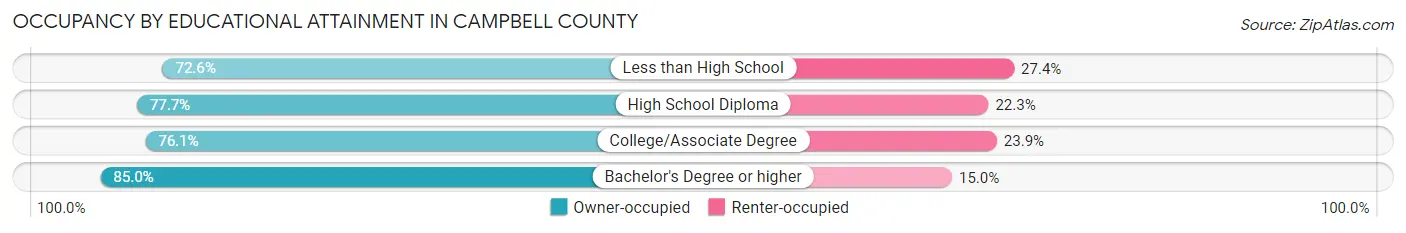
| Household Size | Owner-occupied | Renter-occupied |
| Less than High School | 945 (72.6%) | 356 (27.4%) |
| High School Diploma | 4,095 (77.7%) | 1,173 (22.3%) |
| College/Associate Degree | 5,399 (76.1%) | 1,699 (23.9%) |
| Bachelor's Degree or higher | 3,264 (85.0%) | 578 (15.0%) |
Occupancy by Age of Householder in Campbell County
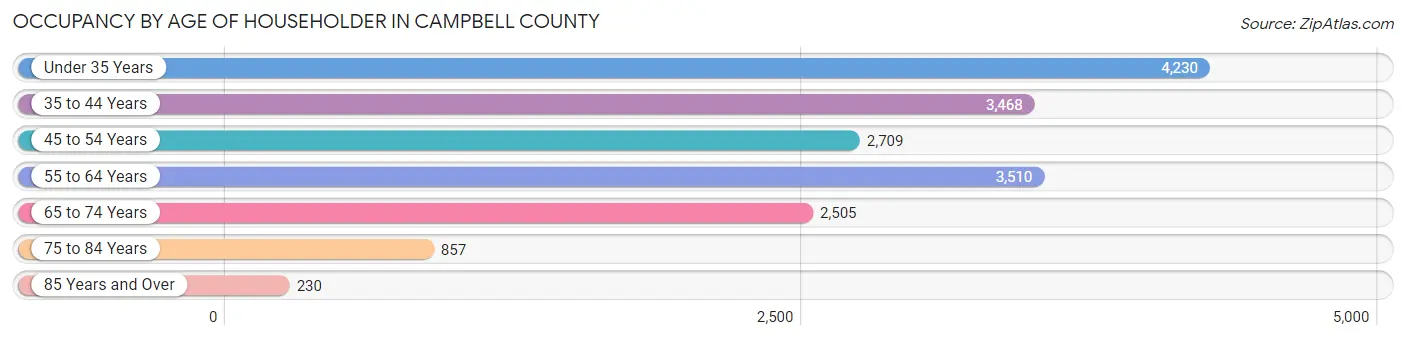
| Age Bracket | # Households | % Households |
| Under 35 Years | 4,230 | 24.2% |
| 35 to 44 Years | 3,468 | 19.8% |
| 45 to 54 Years | 2,709 | 15.5% |
| 55 to 64 Years | 3,510 | 20.1% |
| 65 to 74 Years | 2,505 | 14.3% |
| 75 to 84 Years | 857 | 4.9% |
| 85 Years and Over | 230 | 1.3% |
| Total | 17,509 | 100.0% |
Housing Finances in Campbell County
Median Income by Occupancy in Campbell County
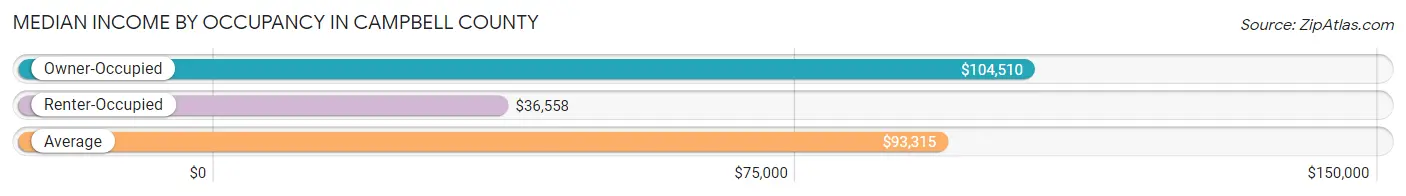
| Occupancy Type | # Households | Median Income |
| Owner-Occupied | 13,703 (78.3%) | $104,510 |
| Renter-Occupied | 3,806 (21.7%) | $36,558 |
| Average | 17,509 (100.0%) | $93,315 |
Occupancy by Householder Income Bracket in Campbell County
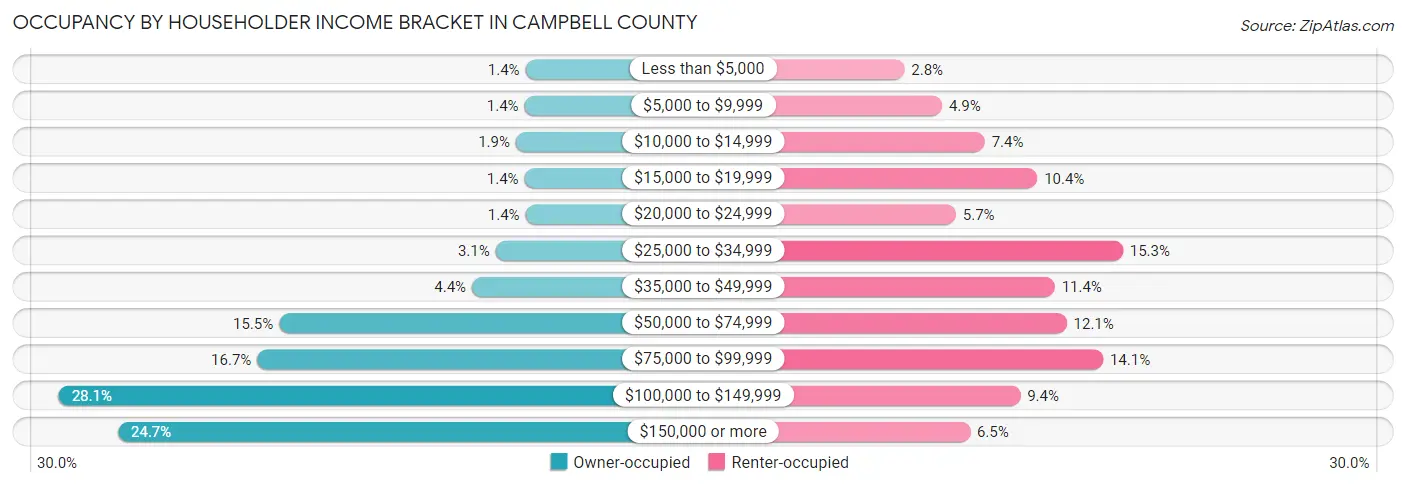
| Income Bracket | Owner-occupied | Renter-occupied |
| Less than $5,000 | 189 (1.4%) | 106 (2.8%) |
| $5,000 to $9,999 | 197 (1.4%) | 188 (4.9%) |
| $10,000 to $14,999 | 265 (1.9%) | 281 (7.4%) |
| $15,000 to $19,999 | 198 (1.4%) | 395 (10.4%) |
| $20,000 to $24,999 | 189 (1.4%) | 218 (5.7%) |
| $25,000 to $34,999 | 423 (3.1%) | 581 (15.3%) |
| $35,000 to $49,999 | 608 (4.4%) | 433 (11.4%) |
| $50,000 to $74,999 | 2,119 (15.5%) | 459 (12.1%) |
| $75,000 to $99,999 | 2,290 (16.7%) | 538 (14.1%) |
| $100,000 to $149,999 | 3,844 (28.1%) | 358 (9.4%) |
| $150,000 or more | 3,381 (24.7%) | 249 (6.5%) |
| Total | 13,703 (100.0%) | 3,806 (100.0%) |
Monthly Housing Cost Tiers in Campbell County
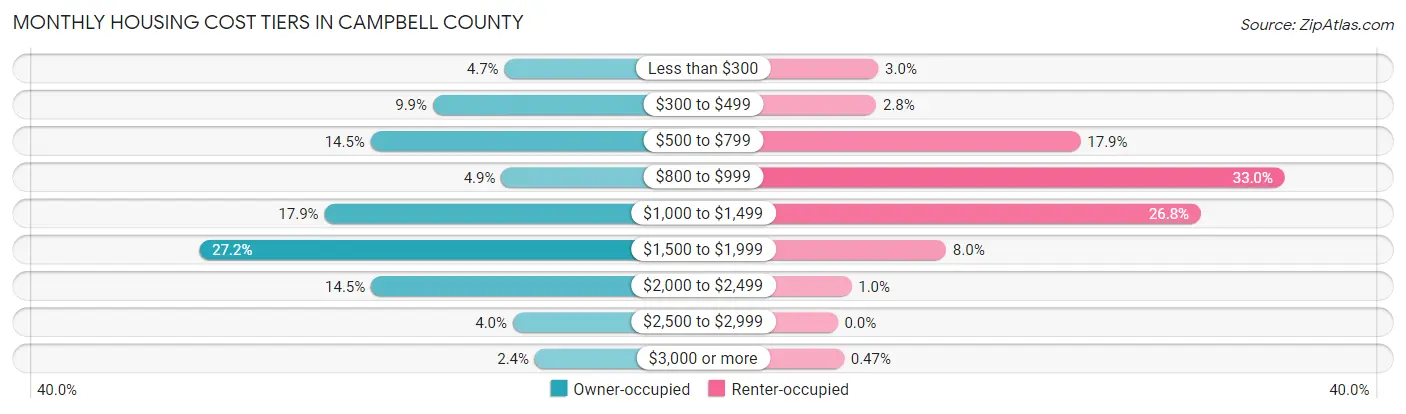
| Monthly Cost | Owner-occupied | Renter-occupied |
| Less than $300 | 638 (4.7%) | 114 (3.0%) |
| $300 to $499 | 1,361 (9.9%) | 108 (2.8%) |
| $500 to $799 | 1,988 (14.5%) | 681 (17.9%) |
| $800 to $999 | 670 (4.9%) | 1,254 (33.0%) |
| $1,000 to $1,499 | 2,456 (17.9%) | 1,019 (26.8%) |
| $1,500 to $1,999 | 3,721 (27.2%) | 304 (8.0%) |
| $2,000 to $2,499 | 1,984 (14.5%) | 39 (1.0%) |
| $2,500 to $2,999 | 554 (4.0%) | 0 (0.0%) |
| $3,000 or more | 331 (2.4%) | 18 (0.5%) |
| Total | 13,703 (100.0%) | 3,806 (100.0%) |
Physical Housing Characteristics in Campbell County
Housing Structures in Campbell County
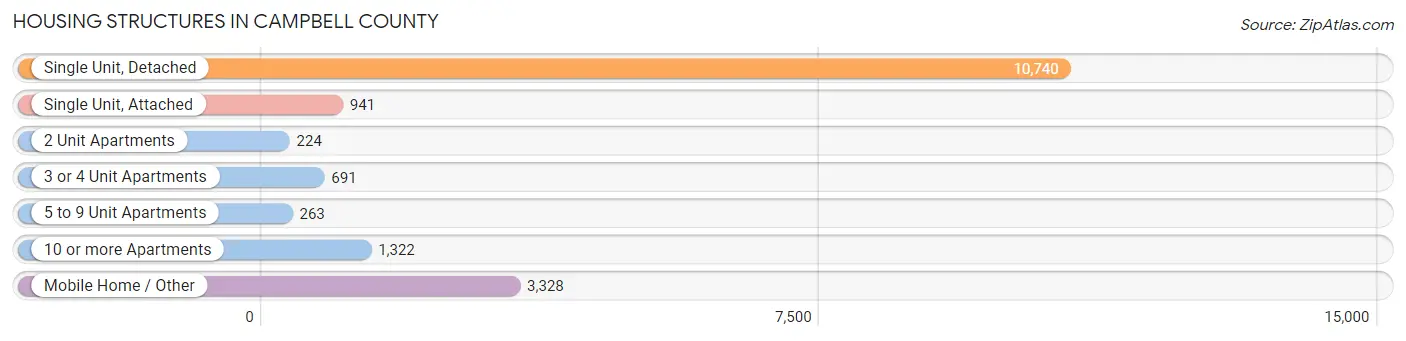
| Structure Type | # Housing Units | % Housing Units |
| Single Unit, Detached | 10,740 | 61.3% |
| Single Unit, Attached | 941 | 5.4% |
| 2 Unit Apartments | 224 | 1.3% |
| 3 or 4 Unit Apartments | 691 | 4.0% |
| 5 to 9 Unit Apartments | 263 | 1.5% |
| 10 or more Apartments | 1,322 | 7.5% |
| Mobile Home / Other | 3,328 | 19.0% |
| Total | 17,509 | 100.0% |
Housing Structures by Occupancy in Campbell County
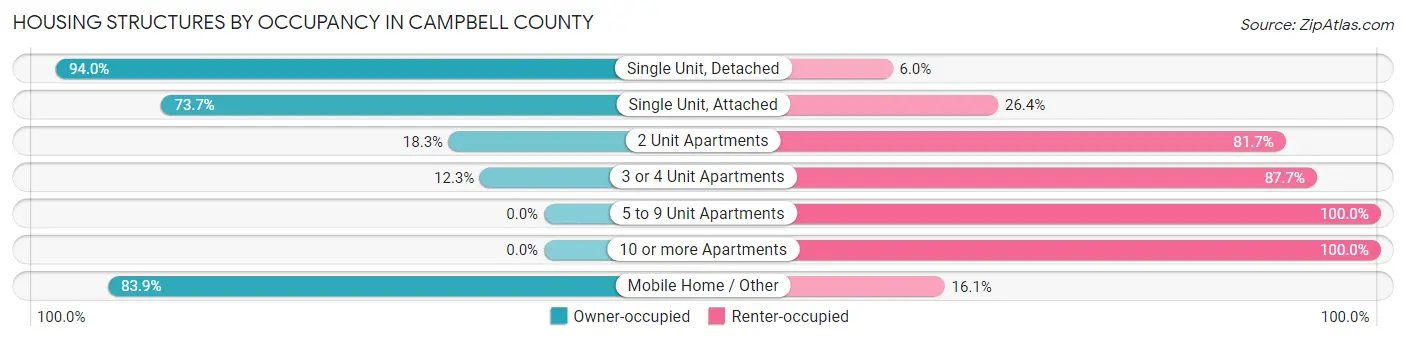
| Structure Type | Owner-occupied | Renter-occupied |
| Single Unit, Detached | 10,091 (94.0%) | 649 (6.0%) |
| Single Unit, Attached | 693 (73.7%) | 248 (26.4%) |
| 2 Unit Apartments | 41 (18.3%) | 183 (81.7%) |
| 3 or 4 Unit Apartments | 85 (12.3%) | 606 (87.7%) |
| 5 to 9 Unit Apartments | 0 (0.0%) | 263 (100.0%) |
| 10 or more Apartments | 0 (0.0%) | 1,322 (100.0%) |
| Mobile Home / Other | 2,793 (83.9%) | 535 (16.1%) |
| Total | 13,703 (78.3%) | 3,806 (21.7%) |
Housing Structures by Number of Rooms in Campbell County
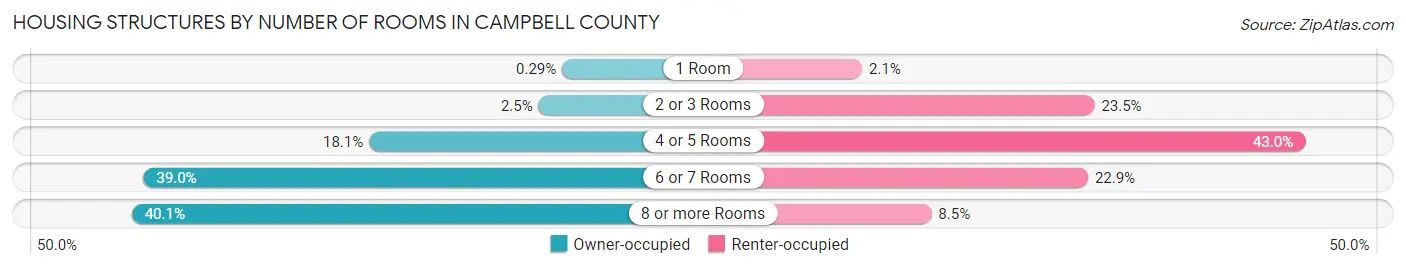
| Number of Rooms | Owner-occupied | Renter-occupied |
| 1 Room | 40 (0.3%) | 78 (2.1%) |
| 2 or 3 Rooms | 338 (2.5%) | 896 (23.5%) |
| 4 or 5 Rooms | 2,486 (18.1%) | 1,637 (43.0%) |
| 6 or 7 Rooms | 5,345 (39.0%) | 873 (22.9%) |
| 8 or more Rooms | 5,494 (40.1%) | 322 (8.5%) |
| Total | 13,703 (100.0%) | 3,806 (100.0%) |
Housing Structure by Heating Type in Campbell County
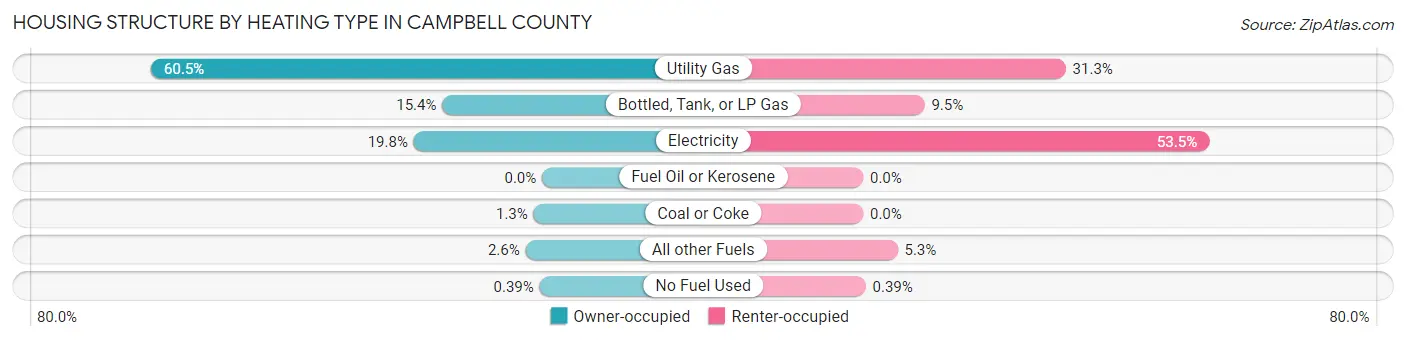
| Heating Type | Owner-occupied | Renter-occupied |
| Utility Gas | 8,286 (60.5%) | 1,192 (31.3%) |
| Bottled, Tank, or LP Gas | 2,115 (15.4%) | 361 (9.5%) |
| Electricity | 2,718 (19.8%) | 2,035 (53.5%) |
| Fuel Oil or Kerosene | 0 (0.0%) | 0 (0.0%) |
| Coal or Coke | 179 (1.3%) | 0 (0.0%) |
| All other Fuels | 351 (2.6%) | 203 (5.3%) |
| No Fuel Used | 54 (0.4%) | 15 (0.4%) |
| Total | 13,703 (100.0%) | 3,806 (100.0%) |
Household Vehicle Usage in Campbell County
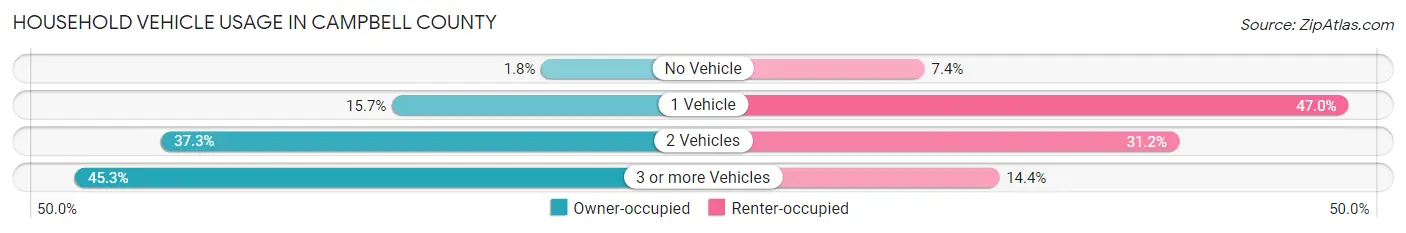
| Vehicles per Household | Owner-occupied | Renter-occupied |
| No Vehicle | 242 (1.8%) | 283 (7.4%) |
| 1 Vehicle | 2,150 (15.7%) | 1,789 (47.0%) |
| 2 Vehicles | 5,105 (37.2%) | 1,186 (31.2%) |
| 3 or more Vehicles | 6,206 (45.3%) | 548 (14.4%) |
| Total | 13,703 (100.0%) | 3,806 (100.0%) |
Real Estate & Mortgages in Campbell County
Real Estate and Mortgage Overview in Campbell County
| Characteristic | Without Mortgage | With Mortgage |
| Housing Units | 4,527 | 9,176 |
| Median Property Value | $231,400 | $252,900 |
| Median Household Income | $78,419 | $2,576 |
| Monthly Housing Costs | $540 | $326 |
| Real Estate Taxes | $1,319 | $193 |
Property Value by Mortgage Status in Campbell County
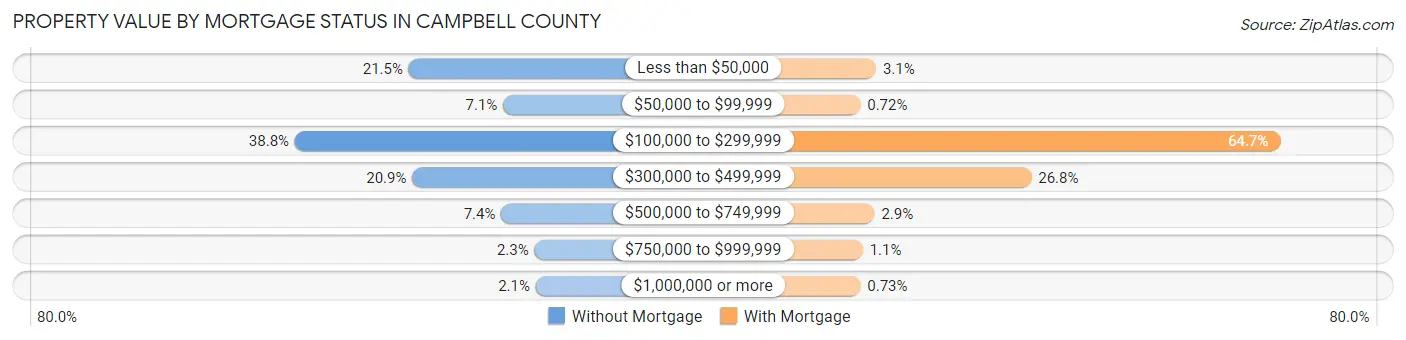
| Property Value | Without Mortgage | With Mortgage |
| Less than $50,000 | 971 (21.4%) | 285 (3.1%) |
| $50,000 to $99,999 | 320 (7.1%) | 66 (0.7%) |
| $100,000 to $299,999 | 1,757 (38.8%) | 5,937 (64.7%) |
| $300,000 to $499,999 | 947 (20.9%) | 2,457 (26.8%) |
| $500,000 to $749,999 | 333 (7.4%) | 264 (2.9%) |
| $750,000 to $999,999 | 104 (2.3%) | 100 (1.1%) |
| $1,000,000 or more | 95 (2.1%) | 67 (0.7%) |
| Total | 4,527 (100.0%) | 9,176 (100.0%) |
Household Income by Mortgage Status in Campbell County
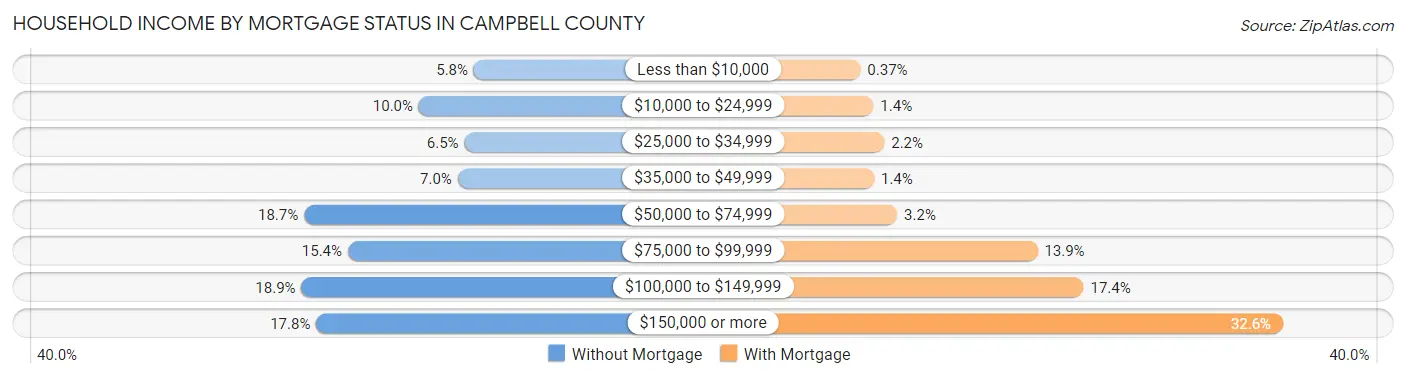
| Household Income | Without Mortgage | With Mortgage |
| Less than $10,000 | 261 (5.8%) | 34 (0.4%) |
| $10,000 to $24,999 | 451 (10.0%) | 125 (1.4%) |
| $25,000 to $34,999 | 294 (6.5%) | 201 (2.2%) |
| $35,000 to $49,999 | 317 (7.0%) | 129 (1.4%) |
| $50,000 to $74,999 | 847 (18.7%) | 291 (3.2%) |
| $75,000 to $99,999 | 696 (15.4%) | 1,272 (13.9%) |
| $100,000 to $149,999 | 856 (18.9%) | 1,594 (17.4%) |
| $150,000 or more | 805 (17.8%) | 2,988 (32.6%) |
| Total | 4,527 (100.0%) | 9,176 (100.0%) |
Property Value to Household Income Ratio in Campbell County
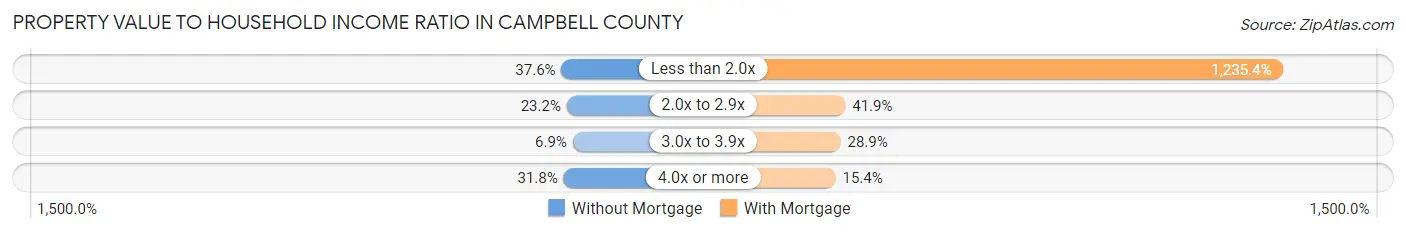
| Value-to-Income Ratio | Without Mortgage | With Mortgage |
| Less than 2.0x | 1,702 (37.6%) | 113,362 (1,235.4%) |
| 2.0x to 2.9x | 1,049 (23.2%) | 3,845 (41.9%) |
| 3.0x to 3.9x | 310 (6.9%) | 2,647 (28.8%) |
| 4.0x or more | 1,440 (31.8%) | 1,414 (15.4%) |
| Total | 4,527 (100.0%) | 9,176 (100.0%) |
Real Estate Taxes by Mortgage Status in Campbell County
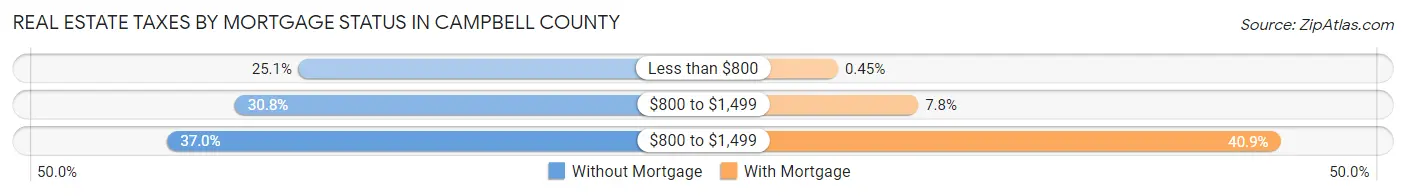
| Property Taxes | Without Mortgage | With Mortgage |
| Less than $800 | 1,134 (25.1%) | 41 (0.4%) |
| $800 to $1,499 | 1,394 (30.8%) | 714 (7.8%) |
| $800 to $1,499 | 1,673 (37.0%) | 3,748 (40.8%) |
| Total | 4,527 (100.0%) | 9,176 (100.0%) |
Health & Disability in Campbell County
Health Insurance Coverage by Age in Campbell County
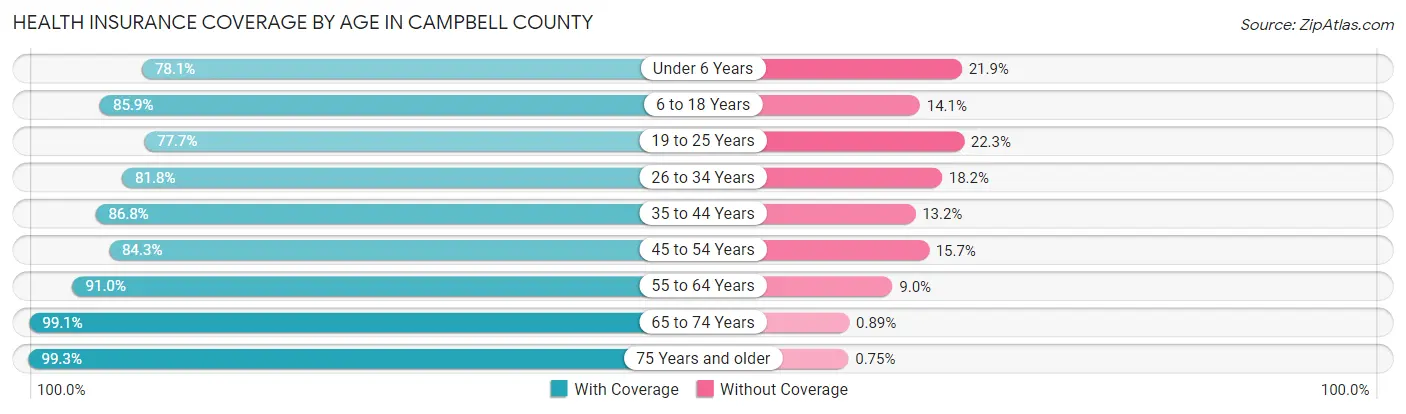
| Age Bracket | With Coverage | Without Coverage |
| Under 6 Years | 3,154 (78.1%) | 884 (21.9%) |
| 6 to 18 Years | 7,883 (85.9%) | 1,292 (14.1%) |
| 19 to 25 Years | 3,060 (77.7%) | 877 (22.3%) |
| 26 to 34 Years | 4,590 (81.8%) | 1,020 (18.2%) |
| 35 to 44 Years | 5,678 (86.8%) | 865 (13.2%) |
| 45 to 54 Years | 4,555 (84.3%) | 851 (15.7%) |
| 55 to 64 Years | 5,693 (91.0%) | 560 (9.0%) |
| 65 to 74 Years | 3,773 (99.1%) | 34 (0.9%) |
| 75 Years and older | 1,453 (99.3%) | 11 (0.7%) |
| Total | 39,839 (86.2%) | 6,394 (13.8%) |
Health Insurance Coverage by Citizenship Status in Campbell County
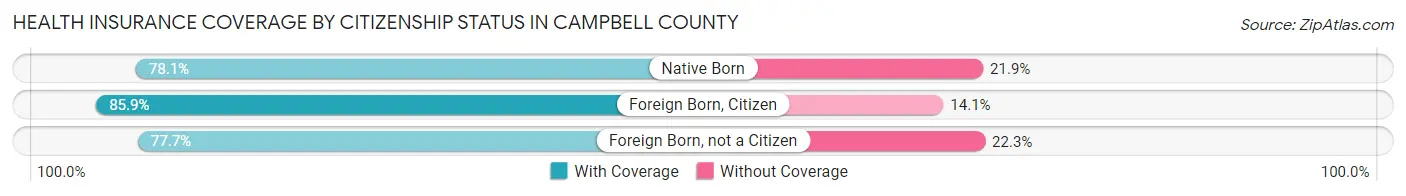
| Citizenship Status | With Coverage | Without Coverage |
| Native Born | 3,154 (78.1%) | 884 (21.9%) |
| Foreign Born, Citizen | 7,883 (85.9%) | 1,292 (14.1%) |
| Foreign Born, not a Citizen | 3,060 (77.7%) | 877 (22.3%) |
Health Insurance Coverage by Household Income in Campbell County
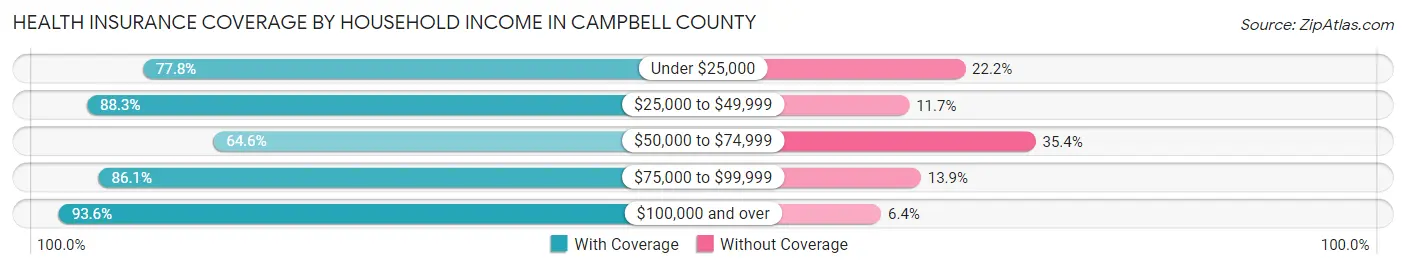
| Household Income | With Coverage | Without Coverage |
| Under $25,000 | 3,015 (77.8%) | 859 (22.2%) |
| $25,000 to $49,999 | 3,646 (88.3%) | 483 (11.7%) |
| $50,000 to $74,999 | 4,542 (64.6%) | 2,485 (35.4%) |
| $75,000 to $99,999 | 6,283 (86.1%) | 1,012 (13.9%) |
| $100,000 and over | 22,252 (93.6%) | 1,526 (6.4%) |
Public vs Private Health Insurance Coverage by Age in Campbell County
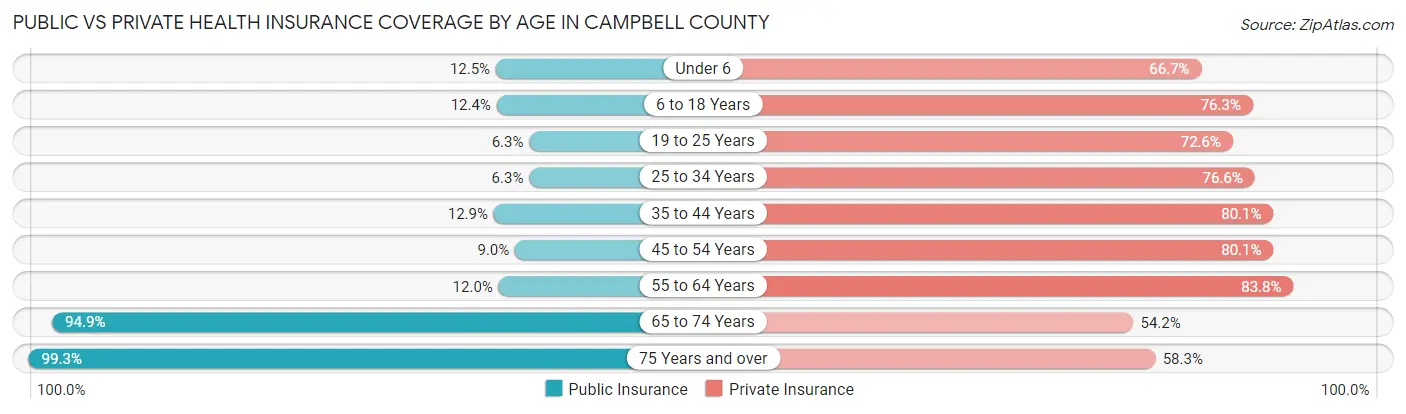
| Age Bracket | Public Insurance | Private Insurance |
| Under 6 | 505 (12.5%) | 2,695 (66.7%) |
| 6 to 18 Years | 1,135 (12.4%) | 6,998 (76.3%) |
| 19 to 25 Years | 249 (6.3%) | 2,857 (72.6%) |
| 25 to 34 Years | 355 (6.3%) | 4,299 (76.6%) |
| 35 to 44 Years | 845 (12.9%) | 5,240 (80.1%) |
| 45 to 54 Years | 484 (8.9%) | 4,329 (80.1%) |
| 55 to 64 Years | 751 (12.0%) | 5,240 (83.8%) |
| 65 to 74 Years | 3,612 (94.9%) | 2,062 (54.2%) |
| 75 Years and over | 1,453 (99.3%) | 853 (58.3%) |
| Total | 9,389 (20.3%) | 34,573 (74.8%) |
Disability Status by Sex by Age in Campbell County
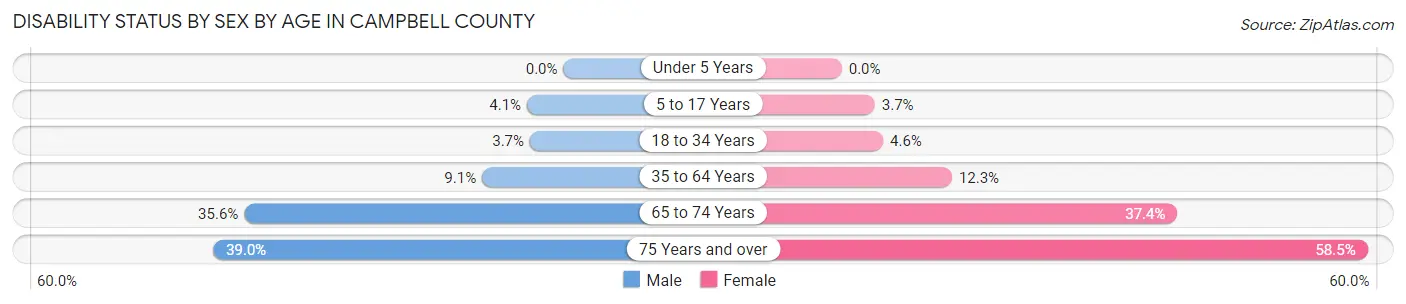
| Age Bracket | Male | Female |
| Under 5 Years | 0 (0.0%) | 0 (0.0%) |
| 5 to 17 Years | 190 (4.1%) | 170 (3.7%) |
| 18 to 34 Years | 200 (3.7%) | 223 (4.6%) |
| 35 to 64 Years | 855 (9.1%) | 1,075 (12.3%) |
| 65 to 74 Years | 694 (35.5%) | 693 (37.4%) |
| 75 Years and over | 256 (39.0%) | 473 (58.5%) |
Disability Class by Sex by Age in Campbell County
Disability Class: Hearing Difficulty
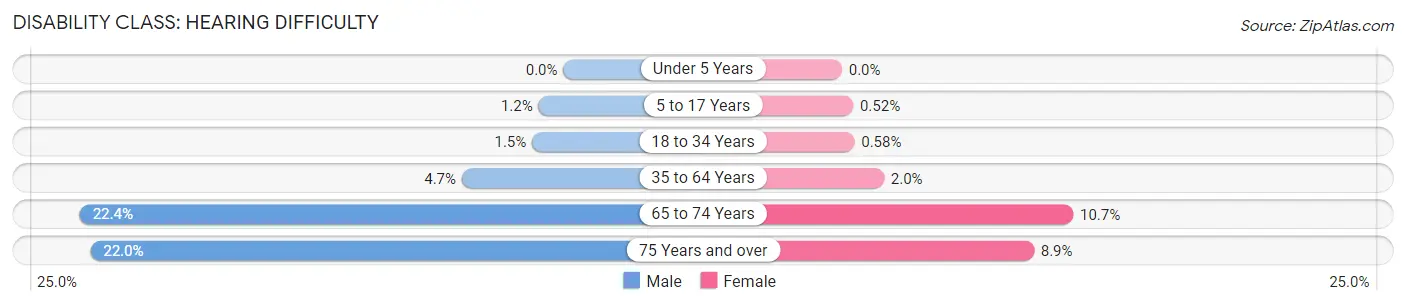
| Age Bracket | Male | Female |
| Under 5 Years | 0 (0.0%) | 0 (0.0%) |
| 5 to 17 Years | 54 (1.1%) | 24 (0.5%) |
| 18 to 34 Years | 78 (1.5%) | 28 (0.6%) |
| 35 to 64 Years | 445 (4.7%) | 171 (1.9%) |
| 65 to 74 Years | 438 (22.4%) | 199 (10.7%) |
| 75 Years and over | 144 (22.0%) | 72 (8.9%) |
Disability Class: Vision Difficulty
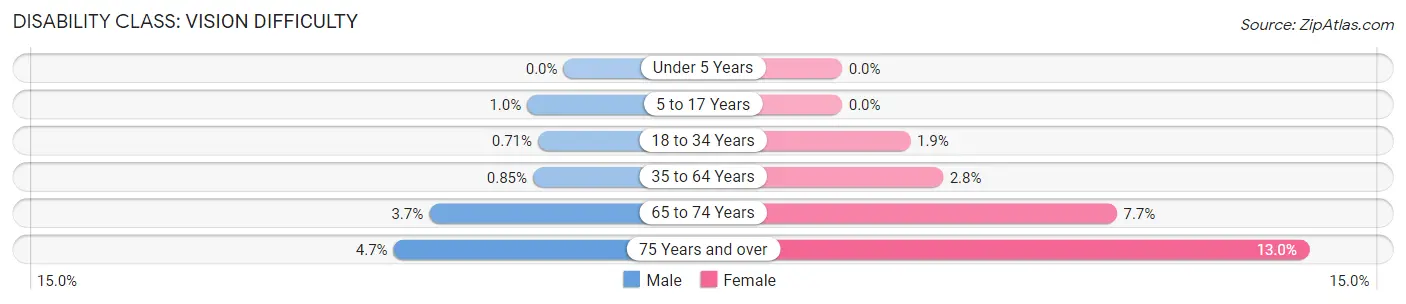
| Age Bracket | Male | Female |
| Under 5 Years | 0 (0.0%) | 0 (0.0%) |
| 5 to 17 Years | 47 (1.0%) | 0 (0.0%) |
| 18 to 34 Years | 38 (0.7%) | 92 (1.9%) |
| 35 to 64 Years | 80 (0.9%) | 246 (2.8%) |
| 65 to 74 Years | 73 (3.7%) | 142 (7.6%) |
| 75 Years and over | 31 (4.7%) | 105 (13.0%) |
Disability Class: Cognitive Difficulty
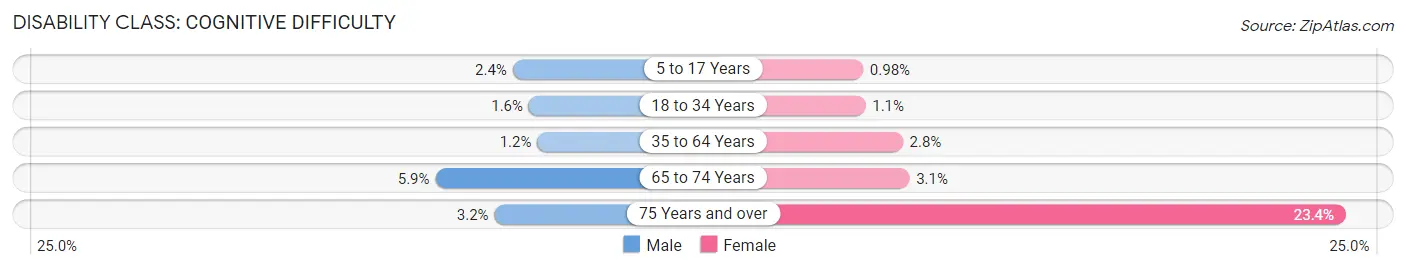
| Age Bracket | Male | Female |
| 5 to 17 Years | 110 (2.4%) | 45 (1.0%) |
| 18 to 34 Years | 86 (1.6%) | 53 (1.1%) |
| 35 to 64 Years | 114 (1.2%) | 247 (2.8%) |
| 65 to 74 Years | 116 (5.9%) | 58 (3.1%) |
| 75 Years and over | 21 (3.2%) | 189 (23.4%) |
Disability Class: Ambulatory Difficulty
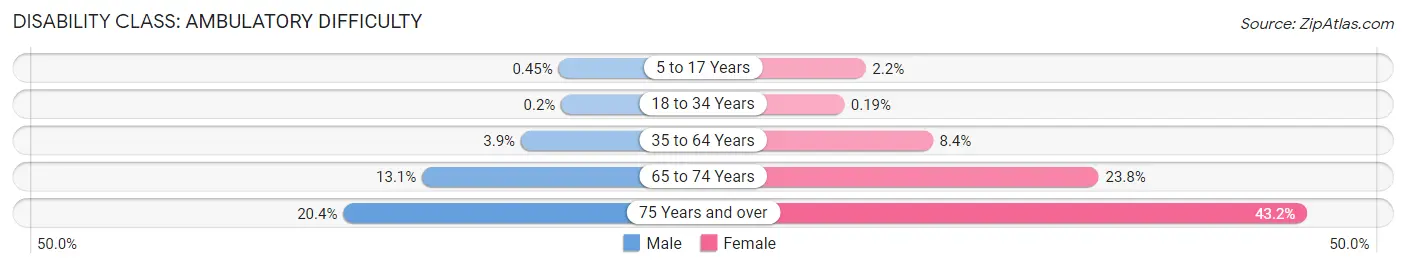
| Age Bracket | Male | Female |
| 5 to 17 Years | 21 (0.4%) | 101 (2.2%) |
| 18 to 34 Years | 11 (0.2%) | 9 (0.2%) |
| 35 to 64 Years | 372 (3.9%) | 738 (8.4%) |
| 65 to 74 Years | 256 (13.1%) | 442 (23.8%) |
| 75 Years and over | 134 (20.4%) | 349 (43.2%) |
Disability Class: Self-Care Difficulty
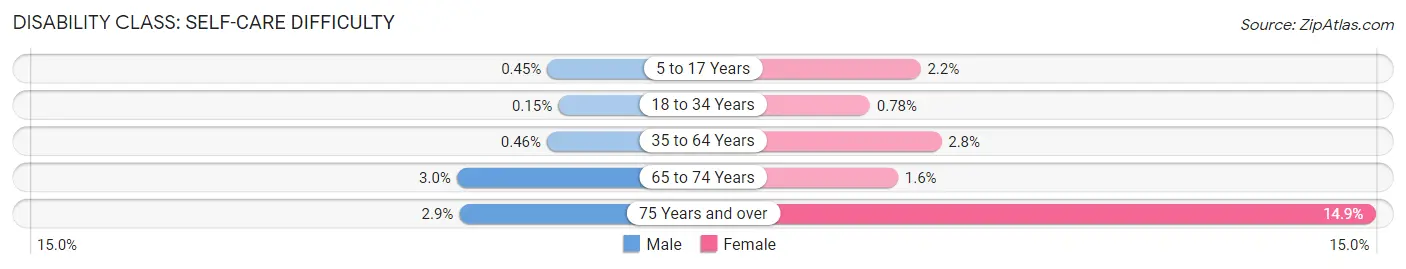
| Age Bracket | Male | Female |
| 5 to 17 Years | 21 (0.4%) | 101 (2.2%) |
| 18 to 34 Years | 8 (0.2%) | 38 (0.8%) |
| 35 to 64 Years | 43 (0.5%) | 243 (2.8%) |
| 65 to 74 Years | 58 (3.0%) | 29 (1.6%) |
| 75 Years and over | 19 (2.9%) | 120 (14.8%) |
Technology Access in Campbell County
Computing Device Access in Campbell County
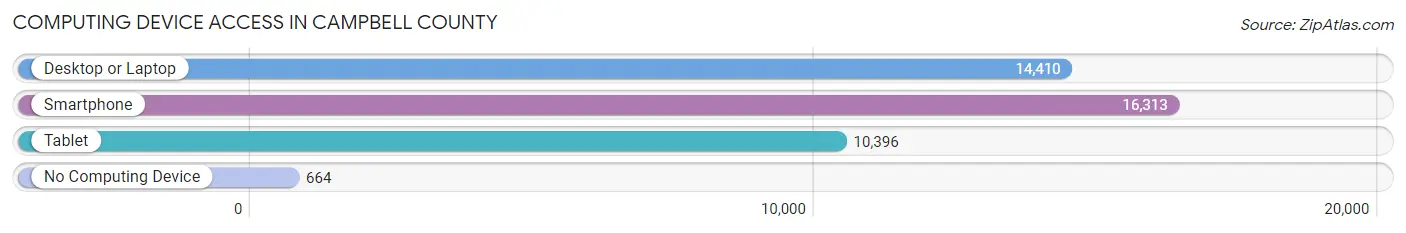
| Device Type | # Households | % Households |
| Desktop or Laptop | 14,410 | 82.3% |
| Smartphone | 16,313 | 93.2% |
| Tablet | 10,396 | 59.4% |
| No Computing Device | 664 | 3.8% |
| Total | 17,509 | 100.0% |
Internet Access in Campbell County
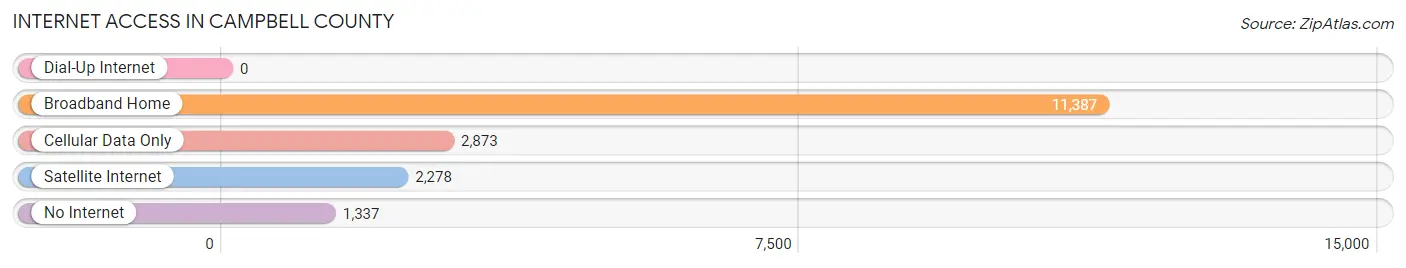
| Internet Type | # Households | % Households |
| Dial-Up Internet | 0 | 0.0% |
| Broadband Home | 11,387 | 65.0% |
| Cellular Data Only | 2,873 | 16.4% |
| Satellite Internet | 2,278 | 13.0% |
| No Internet | 1,337 | 7.6% |
| Total | 17,509 | 100.0% |
Campbell County Summary
Campbell County, Wyoming is located in the northeastern corner of the state and is bordered by Montana to the north and South Dakota to the east. It is the fourth largest county in Wyoming, covering an area of 2,521 square miles. The county seat is Gillette, which is also the largest city in the county.
History
Campbell County was established in 1911 from parts of Crook and Sheridan counties. It was named after John A. Campbell, the first governor of Wyoming. The county was originally populated by Native American tribes, including the Arapaho, Cheyenne, and Sioux.
The first settlers in the area were ranchers, who began arriving in the late 1800s. The first town in the county was Gillette, which was founded in 1891. The town was named after Edward Gillette, a rancher who had settled in the area.
The county experienced a population boom in the early 1900s, as coal mining became a major industry in the area. The coal industry attracted many immigrants from Europe, and the population of the county grew rapidly.
Geography
Campbell County is located in the northeastern corner of Wyoming. It is bordered by Montana to the north and South Dakota to the east. The county covers an area of 2,521 square miles and is the fourth largest county in Wyoming.
The county is mostly flat, with rolling hills in the east and south. The terrain is mostly grassland, with some areas of sagebrush and juniper. The county is home to several rivers, including the Powder River, Little Powder River, and Tongue River.
The county has a semi-arid climate, with hot summers and cold winters. The average annual precipitation is 13.5 inches.
Economy
The economy of Campbell County is largely based on energy production. Coal mining is the largest industry in the county, and it is the largest coal-producing county in Wyoming. Oil and natural gas production are also important industries in the county.
Agriculture is also an important part of the economy. The county is home to several large cattle ranches, and wheat, corn, and hay are also grown in the area.
Demographics
As of the 2010 census, the population of Campbell County was 46,133. The population is mostly white (90.2%), with small percentages of Native American (2.2%), African American (1.2%), and Asian (1.1%) residents.
The median household income in the county is $60,945, and the median home value is $179,400. The unemployment rate is 4.2%.
Conclusion
Campbell County, Wyoming is located in the northeastern corner of the state and is bordered by Montana to the north and South Dakota to the east. It is the fourth largest county in Wyoming, covering an area of 2,521 square miles. The county is mostly flat, with rolling hills in the east and south. The economy of Campbell County is largely based on energy production, with coal mining being the largest industry. The population of the county is mostly white, with small percentages of Native American, African American, and Asian residents. The median household income in the county is $60,945, and the median home value is $179,400.
Common Questions
What is the Total Population of Campbell County?
Total Population of Campbell County is 46,857.
What is the Total Male Population of Campbell County?
Total Male Population of Campbell County is 24,226.
What is the Total Female Population of Campbell County?
Total Female Population of Campbell County is 22,631.
What is the Ratio of Males per 100 Females in Campbell County?
There are 107.05 Males per 100 Females in Campbell County.
What is the Ratio of Females per 100 Males in Campbell County?
There are 93.42 Females per 100 Males in Campbell County.
What is the Median Population Age in Campbell County?
Median Population Age in Campbell County is 35.5 Years.
What is the Average Family Size in Campbell County
Average Family Size in Campbell County is 3.1 People.
What is the Average Household Size in Campbell County
Average Household Size in Campbell County is 2.6 People.
What is Per Capita Income in Campbell County?
Per Capita income in Campbell County is $39,781.
What is the Median Family Income in Campbell County?
Median Family Income in Campbell County is $101,763.
What is the Median Household income in Campbell County?
Median Household Income in Campbell County is $93,315.
What is Income or Wage Gap in Campbell County?
Income or Wage Gap in Campbell County is 47.1%.
Women in Campbell County earn 52.9 cents for every dollar earned by a man.
What is Family Income Deficit in Campbell County?
Family Income Deficit in Campbell County is $9,858.
Families that are below poverty line in Campbell County earn $9,858 less on average than the poverty threshold level.
What is Inequality or Gini Index in Campbell County?
Inequality or Gini Index in Campbell County is 0.39.
How Large is the Labor Force in Campbell County?
There are 25,245 People in the Labor Forcein in Campbell County.
What is the Percentage of People in the Labor Force in Campbell County?
70.9% of People are in the Labor Force in Campbell County.
What is the Unemployment Rate in Campbell County?
Unemployment Rate in Campbell County is 3.0%.