Albany County, WY
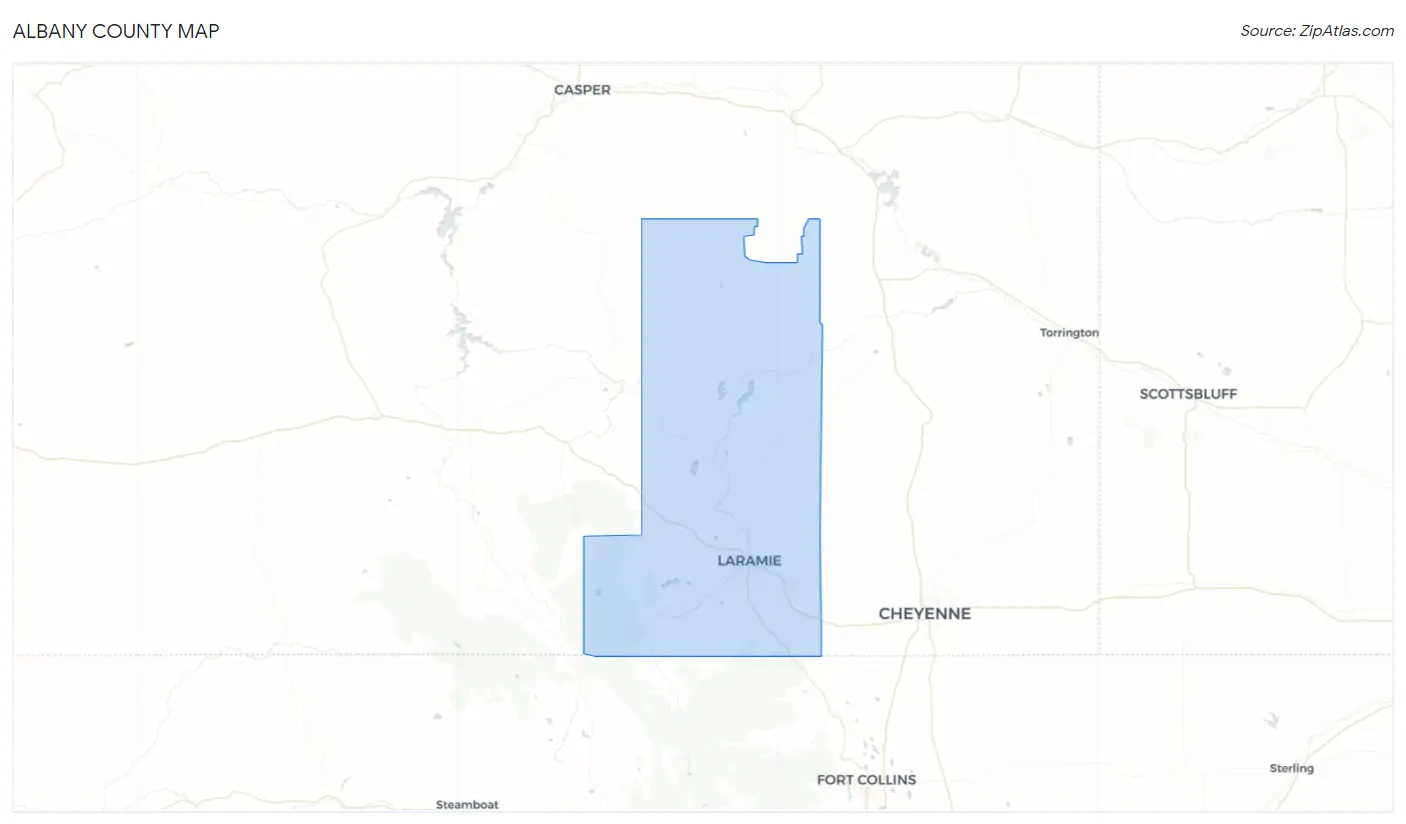
Albany County Map
Albany County Overview
37,525
TOTAL POPULATION
19,594
MALE POPULATION
17,931
FEMALE POPULATION
109.27
MALES / 100 FEMALES
91.51
FEMALES / 100 MALES
28.3
MEDIAN AGE
2.7
AVG FAMILY SIZE
2.1
AVG HOUSEHOLD SIZE
$34,969
PER CAPITA INCOME
$92,023
AVG FAMILY INCOME
$55,887
AVG HOUSEHOLD INCOME
35.7%
WAGE / INCOME GAP [ % ]
64.3¢/ $1
WAGE / INCOME GAP [ $ ]
$7,666
FAMILY INCOME DEFICIT
0.48
INEQUALITY / GINI INDEX
22,101
LABOR FORCE [ PEOPLE ]
68.4%
PERCENT IN LABOR FORCE
4.4%
UNEMPLOYMENT RATE
Albany County Area Codes
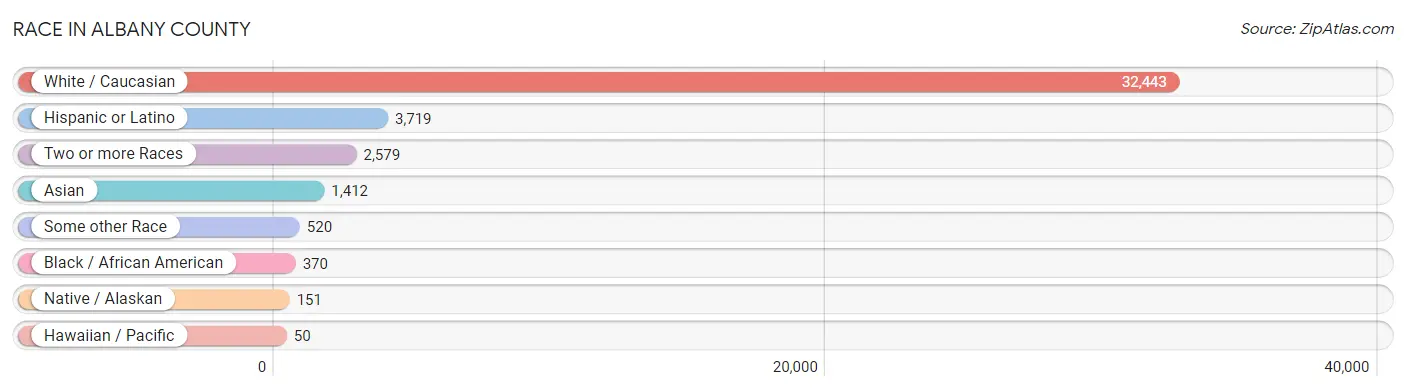
Race in Albany County
The most populous races in Albany County are White / Caucasian (32,443 | 86.5%), Hispanic or Latino (3,719 | 9.9%), and Two or more Races (2,579 | 6.9%).
| Race | # Population | % Population |
| Asian | 1,412 | 3.8% |
| Black / African American | 370 | 1.0% |
| Hawaiian / Pacific | 50 | 0.1% |
| Hispanic or Latino | 3,719 | 9.9% |
| Native / Alaskan | 151 | 0.4% |
| White / Caucasian | 32,443 | 86.5% |
| Two or more Races | 2,579 | 6.9% |
| Some other Race | 520 | 1.4% |
| Total | 37,525 | 100.0% |
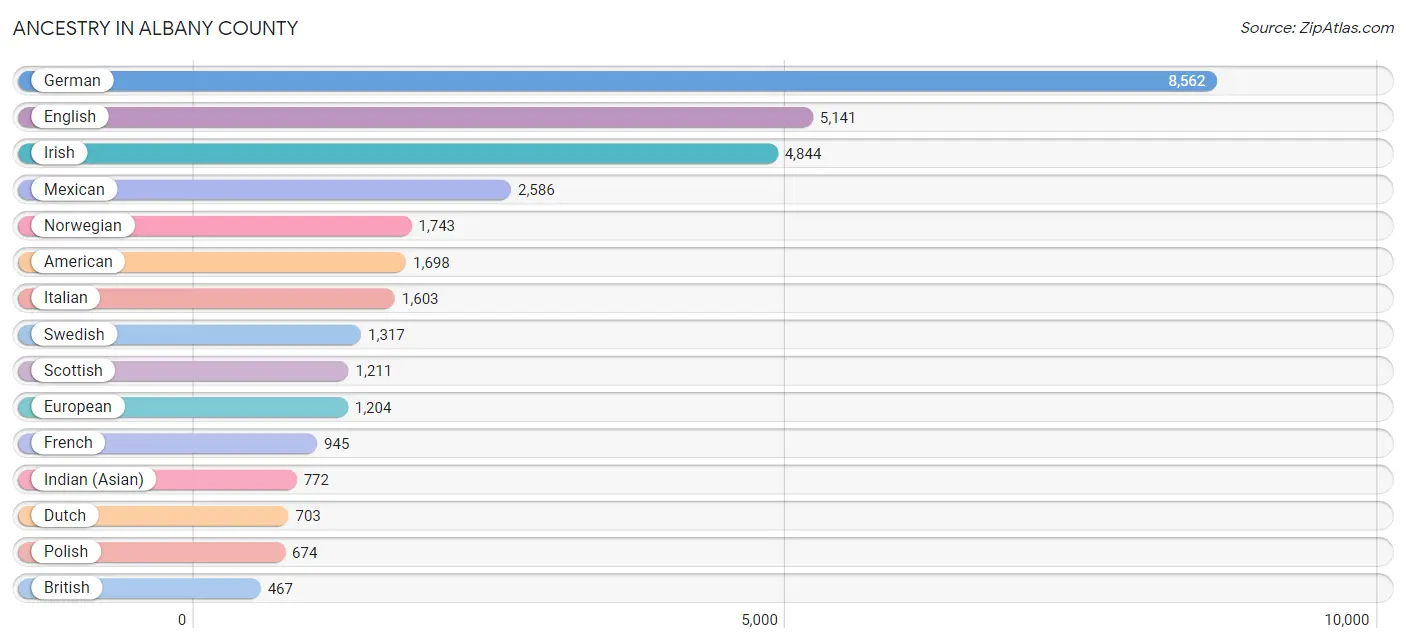
Ancestry in Albany County
The most populous ancestries reported in Albany County are German (8,562 | 22.8%), English (5,141 | 13.7%), Irish (4,844 | 12.9%), Mexican (2,586 | 6.9%), and Norwegian (1,743 | 4.6%), together accounting for 61.0% of all Albany County residents.
| Ancestry | # Population | % Population |
| African | 2 | 0.0% |
| American | 1,698 | 4.5% |
| Apache | 13 | 0.0% |
| Arab | 181 | 0.5% |
| Arapaho | 41 | 0.1% |
| Armenian | 40 | 0.1% |
| Austrian | 120 | 0.3% |
| Basque | 43 | 0.1% |
| Belgian | 37 | 0.1% |
| Bhutanese | 116 | 0.3% |
| Blackfeet | 57 | 0.2% |
| British | 467 | 1.2% |
| Burmese | 90 | 0.2% |
| Cajun | 47 | 0.1% |
| Canadian | 136 | 0.4% |
| Central American | 34 | 0.1% |
| Cherokee | 125 | 0.3% |
| Cheyenne | 5 | 0.0% |
| Chickasaw | 5 | 0.0% |
| Chippewa | 6 | 0.0% |
| Choctaw | 84 | 0.2% |
| Colombian | 14 | 0.0% |
| Creek | 58 | 0.2% |
| Croatian | 93 | 0.3% |
| Crow | 38 | 0.1% |
| Cuban | 7 | 0.0% |
| Czech | 274 | 0.7% |
| Czechoslovakian | 27 | 0.1% |
| Danish | 226 | 0.6% |
| Dutch | 703 | 1.9% |
| Dutch West Indian | 5 | 0.0% |
| Eastern European | 114 | 0.3% |
| Ecuadorian | 5 | 0.0% |
| Egyptian | 34 | 0.1% |
| English | 5,141 | 13.7% |
| European | 1,204 | 3.2% |
| Finnish | 80 | 0.2% |
| French | 945 | 2.5% |
| French Canadian | 225 | 0.6% |
| German | 8,562 | 22.8% |
| Ghanaian | 17 | 0.1% |
| Greek | 134 | 0.4% |
| Guamanian / Chamorro | 39 | 0.1% |
| Guatemalan | 2 | 0.0% |
| Honduran | 5 | 0.0% |
| Hungarian | 190 | 0.5% |
| Icelander | 15 | 0.0% |
| Indian (Asian) | 772 | 2.1% |
| Iranian | 25 | 0.1% |
| Irish | 4,844 | 12.9% |
| Iroquois | 4 | 0.0% |
| Israeli | 10 | 0.0% |
| Italian | 1,603 | 4.3% |
| Jamaican | 4 | 0.0% |
| Japanese | 7 | 0.0% |
| Korean | 81 | 0.2% |
| Latvian | 40 | 0.1% |
| Lebanese | 12 | 0.0% |
| Lithuanian | 31 | 0.1% |
| Luxembourger | 11 | 0.0% |
| Macedonian | 3 | 0.0% |
| Mexican | 2,586 | 6.9% |
| Mexican American Indian | 6 | 0.0% |
| Mongolian | 30 | 0.1% |
| Moroccan | 12 | 0.0% |
| Native Hawaiian | 16 | 0.0% |
| Navajo | 15 | 0.0% |
| New Zealander | 14 | 0.0% |
| Nigerian | 10 | 0.0% |
| Northern European | 130 | 0.4% |
| Norwegian | 1,743 | 4.6% |
| Pakistani | 127 | 0.3% |
| Panamanian | 27 | 0.1% |
| Pennsylvania German | 8 | 0.0% |
| Peruvian | 22 | 0.1% |
| Polish | 674 | 1.8% |
| Portuguese | 153 | 0.4% |
| Puerto Rican | 232 | 0.6% |
| Romanian | 34 | 0.1% |
| Russian | 306 | 0.8% |
| Samoan | 27 | 0.1% |
| Scandinavian | 342 | 0.9% |
| Scotch-Irish | 434 | 1.2% |
| Scottish | 1,211 | 3.2% |
| Serbian | 96 | 0.3% |
| Shoshone | 40 | 0.1% |
| Sioux | 83 | 0.2% |
| Slavic | 26 | 0.1% |
| Slovak | 64 | 0.2% |
| Slovene | 29 | 0.1% |
| South American | 108 | 0.3% |
| Spaniard | 251 | 0.7% |
| Spanish | 247 | 0.7% |
| Spanish American | 136 | 0.4% |
| Sri Lankan | 35 | 0.1% |
| Subsaharan African | 32 | 0.1% |
| Sudanese | 3 | 0.0% |
| Swedish | 1,317 | 3.5% |
| Swiss | 232 | 0.6% |
| Thai | 413 | 1.1% |
| Trinidadian and Tobagonian | 2 | 0.0% |
| Turkish | 13 | 0.0% |
| Ukrainian | 447 | 1.2% |
| Venezuelan | 67 | 0.2% |
| Vietnamese | 40 | 0.1% |
| Welsh | 254 | 0.7% |
| West Indian | 2 | 0.0% |
| Yaqui | 18 | 0.1% |
| Yugoslavian | 60 | 0.2% | View All 109 Rows |
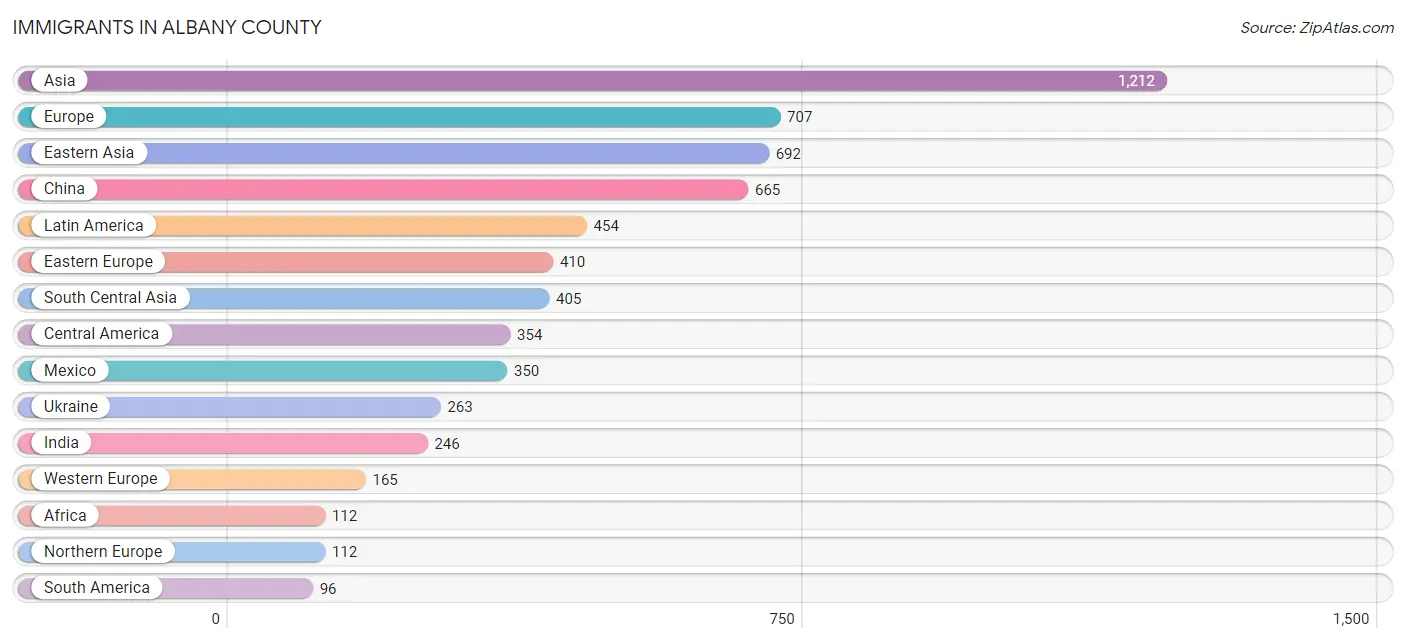
Immigrants in Albany County
The most numerous immigrant groups reported in Albany County came from Asia (1,212 | 3.2%), Europe (707 | 1.9%), Eastern Asia (692 | 1.8%), China (665 | 1.8%), and Latin America (454 | 1.2%), together accounting for 9.9% of all Albany County residents.
| Immigration Origin | # Population | % Population |
| Africa | 112 | 0.3% |
| Argentina | 10 | 0.0% |
| Asia | 1,212 | 3.2% |
| Bangladesh | 45 | 0.1% |
| Canada | 88 | 0.2% |
| Caribbean | 4 | 0.0% |
| Central America | 354 | 0.9% |
| China | 665 | 1.8% |
| Colombia | 9 | 0.0% |
| Denmark | 2 | 0.0% |
| Eastern Africa | 2 | 0.0% |
| Eastern Asia | 692 | 1.8% |
| Eastern Europe | 410 | 1.1% |
| Ecuador | 6 | 0.0% |
| Egypt | 36 | 0.1% |
| England | 72 | 0.2% |
| Ethiopia | 2 | 0.0% |
| Europe | 707 | 1.9% |
| France | 15 | 0.0% |
| Germany | 92 | 0.3% |
| Ghana | 39 | 0.1% |
| Honduras | 4 | 0.0% |
| Hong Kong | 6 | 0.0% |
| Hungary | 16 | 0.0% |
| India | 246 | 0.7% |
| Indonesia | 6 | 0.0% |
| Iran | 46 | 0.1% |
| Italy | 20 | 0.1% |
| Jamaica | 4 | 0.0% |
| Japan | 2 | 0.0% |
| Korea | 25 | 0.1% |
| Latin America | 454 | 1.2% |
| Mexico | 350 | 0.9% |
| Nepal | 65 | 0.2% |
| Nigeria | 8 | 0.0% |
| Northern Africa | 61 | 0.2% |
| Northern Europe | 112 | 0.3% |
| Pakistan | 3 | 0.0% |
| Peru | 16 | 0.0% |
| Philippines | 14 | 0.0% |
| Poland | 54 | 0.1% |
| Romania | 10 | 0.0% |
| Russia | 32 | 0.1% |
| Saudi Arabia | 25 | 0.1% |
| Serbia | 9 | 0.0% |
| South America | 96 | 0.3% |
| South Central Asia | 405 | 1.1% |
| South Eastern Asia | 76 | 0.2% |
| Southern Europe | 20 | 0.1% |
| Sudan | 5 | 0.0% |
| Sweden | 29 | 0.1% |
| Switzerland | 58 | 0.2% |
| Thailand | 44 | 0.1% |
| Turkey | 13 | 0.0% |
| Ukraine | 263 | 0.7% |
| Venezuela | 55 | 0.2% |
| Vietnam | 12 | 0.0% |
| Western Africa | 49 | 0.1% |
| Western Asia | 39 | 0.1% |
| Western Europe | 165 | 0.4% | View All 60 Rows |
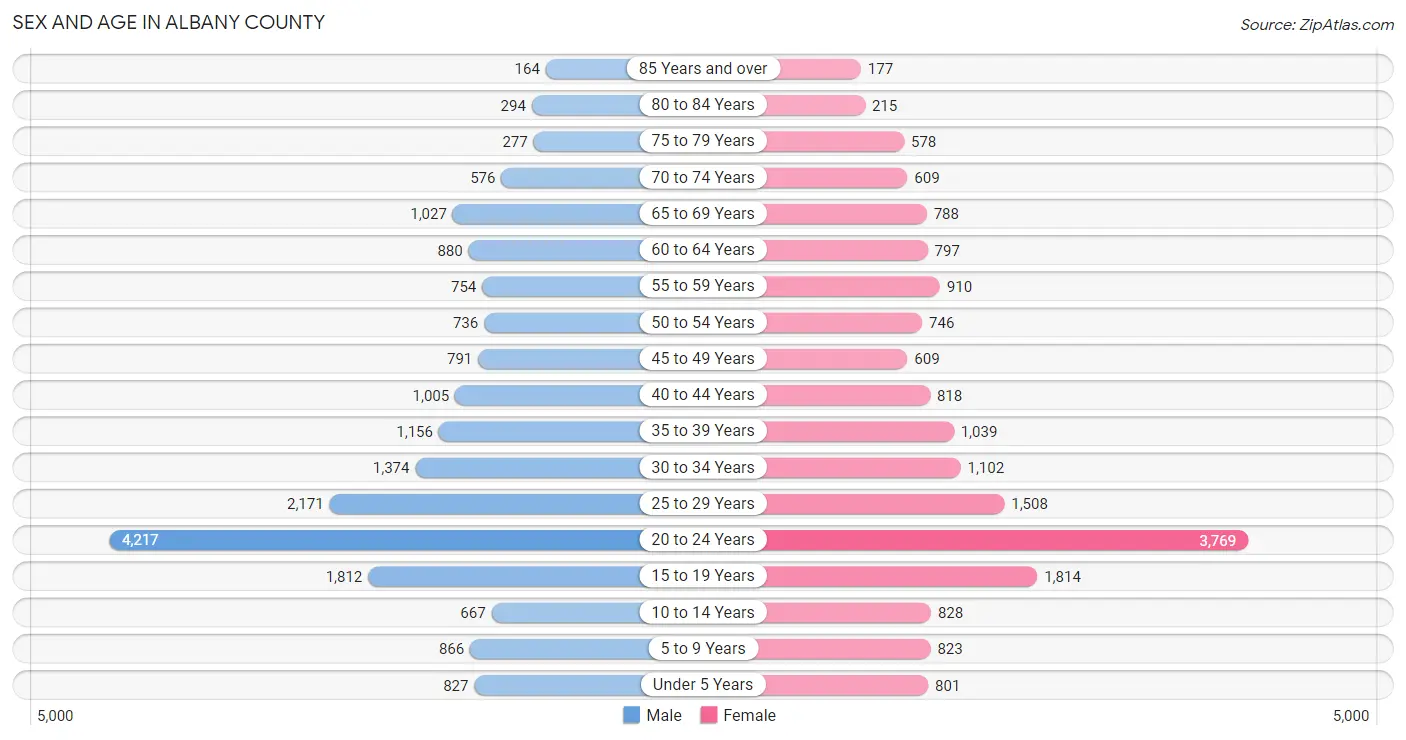
Sex and Age in Albany County
Sex and Age in Albany County
The most populous age groups in Albany County are 20 to 24 Years (4,217 | 21.5%) for men and 20 to 24 Years (3,769 | 21.0%) for women.
| Age Bracket | Male | Female |
| Under 5 Years | 827 (4.2%) | 801 (4.5%) |
| 5 to 9 Years | 866 (4.4%) | 823 (4.6%) |
| 10 to 14 Years | 667 (3.4%) | 828 (4.6%) |
| 15 to 19 Years | 1,812 (9.2%) | 1,814 (10.1%) |
| 20 to 24 Years | 4,217 (21.5%) | 3,769 (21.0%) |
| 25 to 29 Years | 2,171 (11.1%) | 1,508 (8.4%) |
| 30 to 34 Years | 1,374 (7.0%) | 1,102 (6.1%) |
| 35 to 39 Years | 1,156 (5.9%) | 1,039 (5.8%) |
| 40 to 44 Years | 1,005 (5.1%) | 818 (4.6%) |
| 45 to 49 Years | 791 (4.0%) | 609 (3.4%) |
| 50 to 54 Years | 736 (3.8%) | 746 (4.2%) |
| 55 to 59 Years | 754 (3.8%) | 910 (5.1%) |
| 60 to 64 Years | 880 (4.5%) | 797 (4.4%) |
| 65 to 69 Years | 1,027 (5.2%) | 788 (4.4%) |
| 70 to 74 Years | 576 (2.9%) | 609 (3.4%) |
| 75 to 79 Years | 277 (1.4%) | 578 (3.2%) |
| 80 to 84 Years | 294 (1.5%) | 215 (1.2%) |
| 85 Years and over | 164 (0.8%) | 177 (1.0%) |
| Total | 19,594 (100.0%) | 17,931 (100.0%) |
Families and Households in Albany County
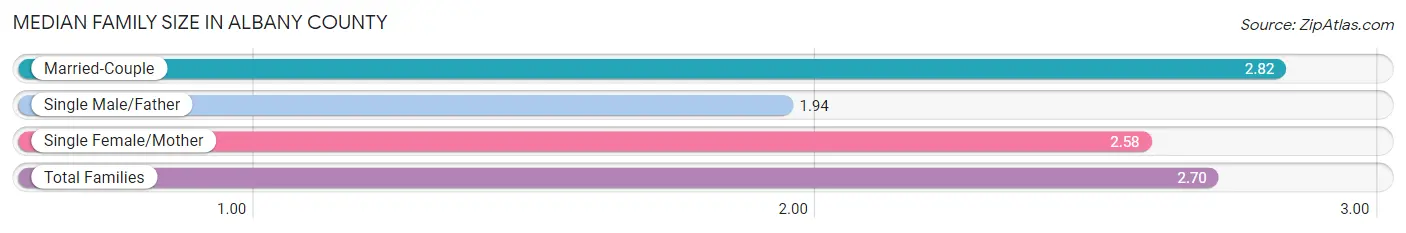
Median Family Size in Albany County
The median family size in Albany County is 2.70 persons per family, with married-couple families (6,358 | 78.4%) accounting for the largest median family size of 2.82 persons per family. On the other hand, single male/father families (778 | 9.6%) represent the smallest median family size with 1.94 persons per family.
| Family Type | # Families | Family Size |
| Married-Couple | 6,358 (78.4%) | 2.82 |
| Single Male/Father | 778 (9.6%) | 1.94 |
| Single Female/Mother | 978 (12.0%) | 2.58 |
| Total Families | 8,114 (100.0%) | 2.70 |
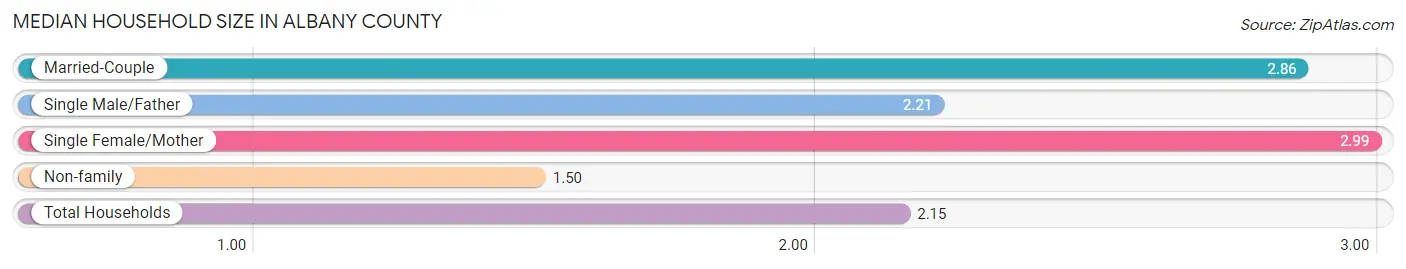
Median Household Size in Albany County
The median household size in Albany County is 2.15 persons per household, with single female/mother households (978 | 6.0%) accounting for the largest median household size of 2.99 persons per household. non-family households (8,176 | 50.2%) represent the smallest median household size with 1.50 persons per household.
| Household Type | # Households | Household Size |
| Married-Couple | 6,358 (39.0%) | 2.86 |
| Single Male/Father | 778 (4.8%) | 2.21 |
| Single Female/Mother | 978 (6.0%) | 2.99 |
| Non-family | 8,176 (50.2%) | 1.50 |
| Total Households | 16,290 (100.0%) | 2.15 |
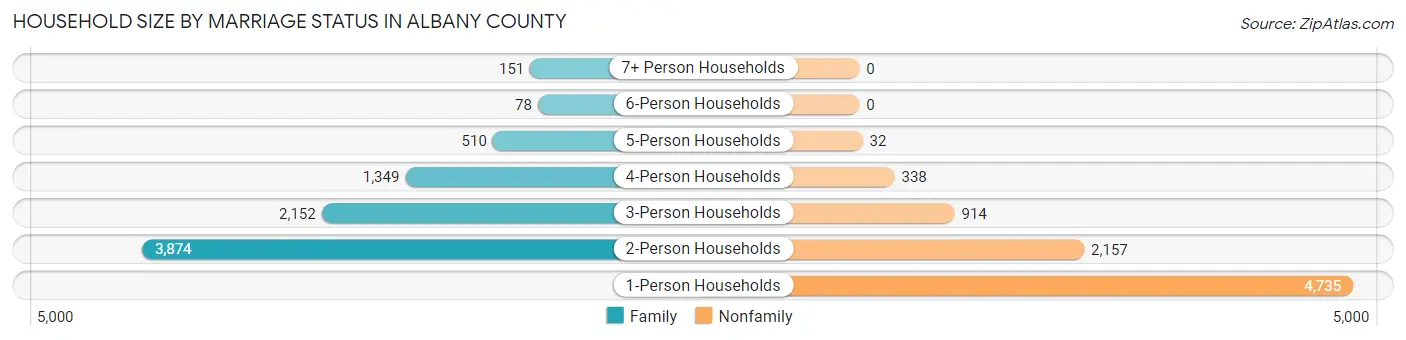
Household Size by Marriage Status in Albany County
Out of a total of 16,290 households in Albany County, 8,114 (49.8%) are family households, while 8,176 (50.2%) are nonfamily households. The most numerous type of family households are 2-person households, comprising 3,874, and the most common type of nonfamily households are 1-person households, comprising 4,735.
| Household Size | Family Households | Nonfamily Households |
| 1-Person Households | - | 4,735 (29.1%) |
| 2-Person Households | 3,874 (23.8%) | 2,157 (13.2%) |
| 3-Person Households | 2,152 (13.2%) | 914 (5.6%) |
| 4-Person Households | 1,349 (8.3%) | 338 (2.1%) |
| 5-Person Households | 510 (3.1%) | 32 (0.2%) |
| 6-Person Households | 78 (0.5%) | 0 (0.0%) |
| 7+ Person Households | 151 (0.9%) | 0 (0.0%) |
| Total | 8,114 (49.8%) | 8,176 (50.2%) |
Female Fertility in Albany County
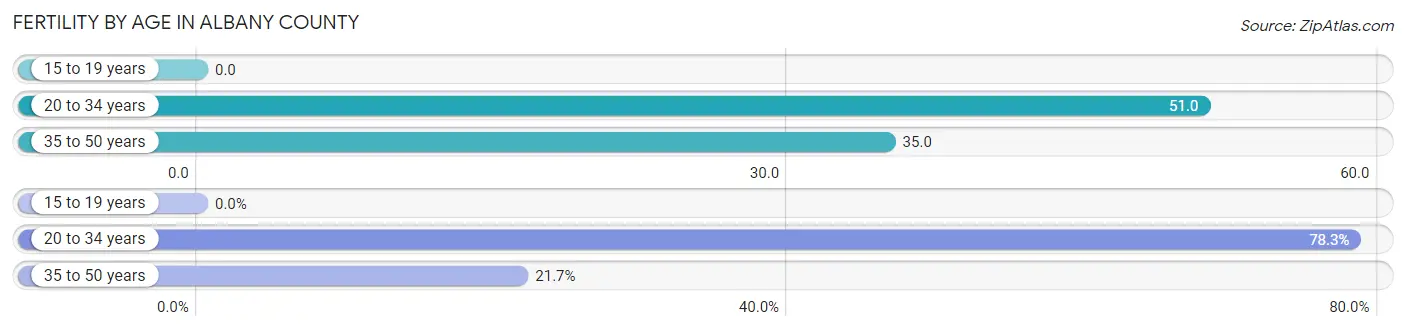
Fertility by Age in Albany County
Average fertility rate in Albany County is 38.0 births per 1,000 women. Women in the age bracket of 20 to 34 years have the highest fertility rate with 51.0 births per 1,000 women. Women in the age bracket of 20 to 34 years acount for 78.3% of all women with births.
| Age Bracket | Women with Births | Births / 1,000 Women |
| 15 to 19 years | 0 (0.0%) | 0.0 |
| 20 to 34 years | 324 (78.3%) | 51.0 |
| 35 to 50 years | 90 (21.7%) | 35.0 |
| Total | 414 (100.0%) | 38.0 |
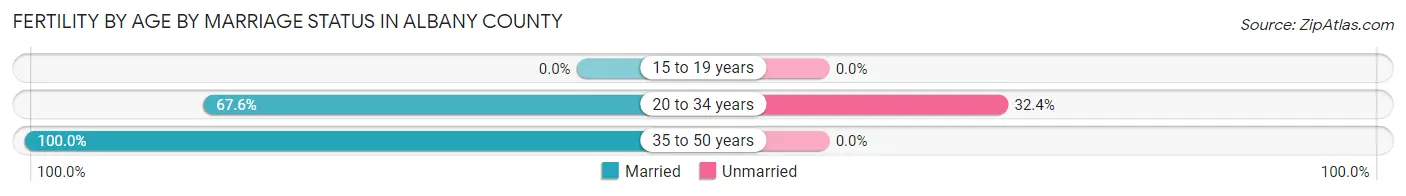
Fertility by Age by Marriage Status in Albany County
74.6% of women with births (414) in Albany County are married. The highest percentage of unmarried women with births falls into 20 to 34 years age bracket with 32.4% of them unmarried at the time of birth, while the lowest percentage of unmarried women with births belong to 35 to 50 years age bracket with 0.0% of them unmarried.
| Age Bracket | Married | Unmarried |
| 15 to 19 years | 0 (0.0%) | 0 (0.0%) |
| 20 to 34 years | 219 (67.6%) | 105 (32.4%) |
| 35 to 50 years | 90 (100.0%) | 0 (0.0%) |
| Total | 309 (74.6%) | 105 (25.4%) |
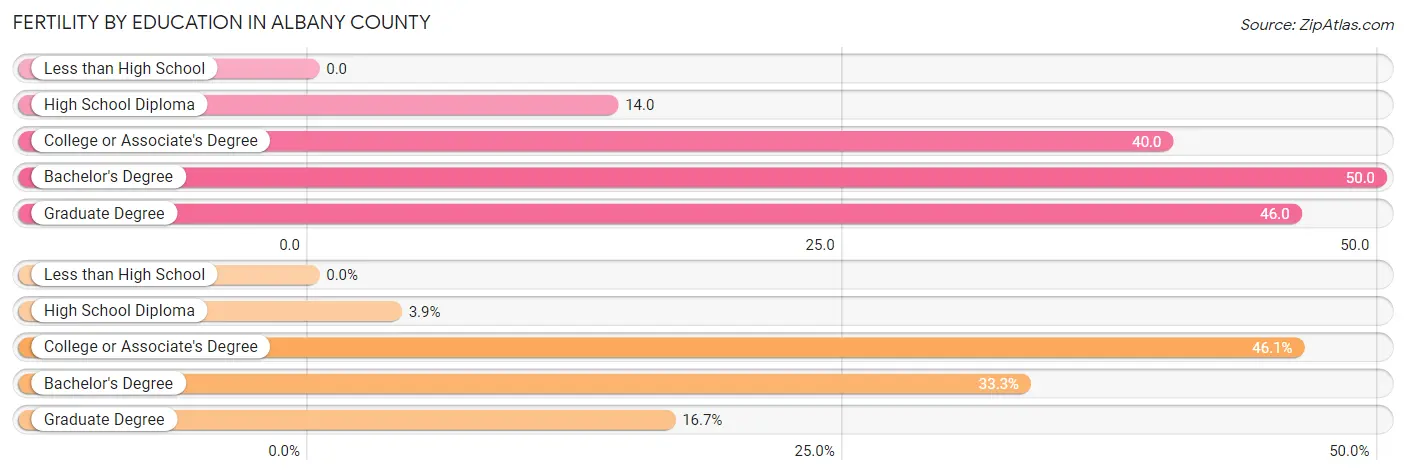
Fertility by Education in Albany County
| Educational Attainment | Women with Births | Births / 1,000 Women |
| Less than High School | 0 (0.0%) | 0.0 |
| High School Diploma | 16 (3.9%) | 14.0 |
| College or Associate's Degree | 191 (46.1%) | 40.0 |
| Bachelor's Degree | 138 (33.3%) | 50.0 |
| Graduate Degree | 69 (16.7%) | 46.0 |
| Total | 414 (100.0%) | 38.0 |
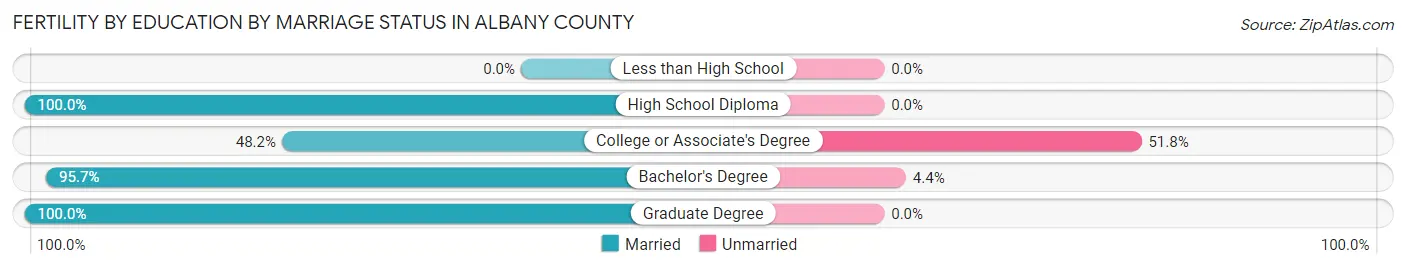
Fertility by Education by Marriage Status in Albany County
25.4% of women with births in Albany County are unmarried. Women with the educational attainment of high school diploma are most likely to be married with 100.0% of them married at childbirth, while women with the educational attainment of college or associate's degree are least likely to be married with 51.8% of them unmarried at childbirth.
| Educational Attainment | Married | Unmarried |
| Less than High School | 0 (0.0%) | 0 (0.0%) |
| High School Diploma | 16 (100.0%) | 0 (0.0%) |
| College or Associate's Degree | 92 (48.2%) | 99 (51.8%) |
| Bachelor's Degree | 132 (95.7%) | 6 (4.3%) |
| Graduate Degree | 69 (100.0%) | 0 (0.0%) |
| Total | 309 (74.6%) | 105 (25.4%) |
Income in Albany County
Income Overview in Albany County
Per Capita Income in Albany County is $34,969, while median incomes of families and households are $92,023 and $55,887 respectively.
| Characteristic | Number | Measure |
| Per Capita Income | 37,525 | $34,969 |
| Median Family Income | 8,114 | $92,023 |
| Mean Family Income | 8,114 | $110,799 |
| Median Household Income | 16,290 | $55,887 |
| Mean Household Income | 16,290 | $80,218 |
| Income Deficit | 8,114 | $7,666 |
| Wage / Income Gap (%) | 37,525 | 35.69% |
| Wage / Income Gap ($) | 37,525 | 64.31¢ per $1 |
| Gini / Inequality Index | 37,525 | 0.48 |
Earnings by Sex in Albany County
Average Earnings in Albany County are $24,688, $30,837 for men and $19,831 for women, a difference of 35.7%.
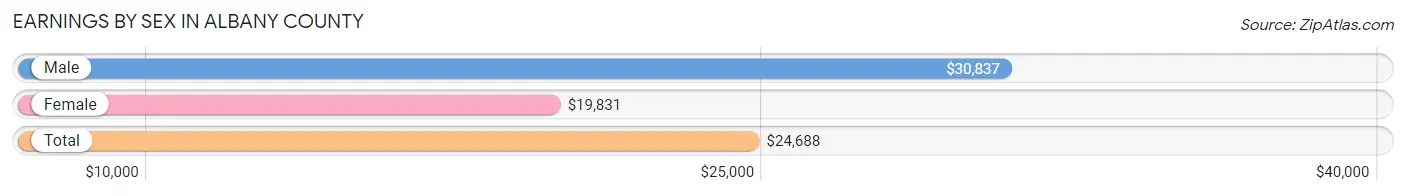
| Sex | Number | Average Earnings |
| Male | 13,992 (55.2%) | $30,837 |
| Female | 11,340 (44.8%) | $19,831 |
| Total | 25,332 (100.0%) | $24,688 |
Earnings by Sex by Income Bracket in Albany County
The most common earnings brackets in Albany County are $100,000+ for men (1,584 | 11.3%) and $2,500 to $4,999 for women (1,245 | 11.0%).
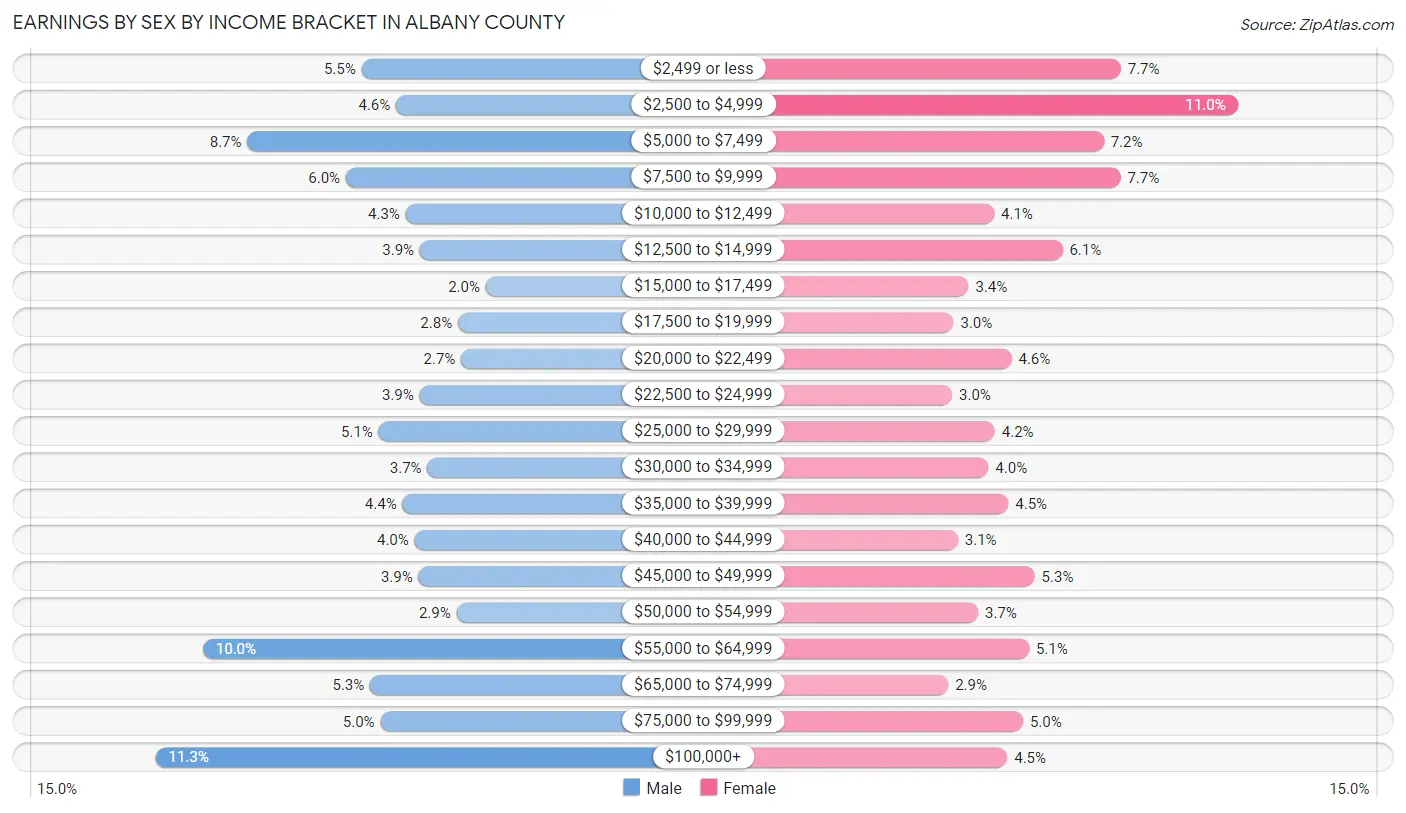
| Income | Male | Female |
| $2,499 or less | 774 (5.5%) | 873 (7.7%) |
| $2,500 to $4,999 | 638 (4.6%) | 1,245 (11.0%) |
| $5,000 to $7,499 | 1,223 (8.7%) | 819 (7.2%) |
| $7,500 to $9,999 | 835 (6.0%) | 872 (7.7%) |
| $10,000 to $12,499 | 600 (4.3%) | 469 (4.1%) |
| $12,500 to $14,999 | 544 (3.9%) | 687 (6.1%) |
| $15,000 to $17,499 | 286 (2.0%) | 388 (3.4%) |
| $17,500 to $19,999 | 395 (2.8%) | 340 (3.0%) |
| $20,000 to $22,499 | 382 (2.7%) | 525 (4.6%) |
| $22,500 to $24,999 | 545 (3.9%) | 336 (3.0%) |
| $25,000 to $29,999 | 706 (5.1%) | 472 (4.2%) |
| $30,000 to $34,999 | 515 (3.7%) | 451 (4.0%) |
| $35,000 to $39,999 | 613 (4.4%) | 515 (4.5%) |
| $40,000 to $44,999 | 565 (4.0%) | 354 (3.1%) |
| $45,000 to $49,999 | 550 (3.9%) | 599 (5.3%) |
| $50,000 to $54,999 | 400 (2.9%) | 419 (3.7%) |
| $55,000 to $64,999 | 1,398 (10.0%) | 581 (5.1%) |
| $65,000 to $74,999 | 740 (5.3%) | 323 (2.9%) |
| $75,000 to $99,999 | 699 (5.0%) | 561 (5.0%) |
| $100,000+ | 1,584 (11.3%) | 511 (4.5%) |
| Total | 13,992 (100.0%) | 11,340 (100.0%) |
Earnings by Sex by Educational Attainment in Albany County
Average earnings in Albany County are $52,890 for men and $38,229 for women, a difference of 27.7%. Men with an educational attainment of graduate degree enjoy the highest average annual earnings of $61,311, while those with less than high school education earn the least with $35,821. Women with an educational attainment of graduate degree earn the most with the average annual earnings of $52,329, while those with high school diploma education have the smallest earnings of $17,146.

| Educational Attainment | Male Income | Female Income |
| Less than High School | $35,821 | $0 |
| High School Diploma | $53,483 | $17,146 |
| College or Associate's Degree | $46,727 | $32,452 |
| Bachelor's Degree | $48,393 | $39,091 |
| Graduate Degree | $61,311 | $52,329 |
| Total | $52,890 | $38,229 |
Family Income in Albany County
Family Income Brackets in Albany County
According to the Albany County family income data, there are 2,199 families falling into the $100,000 to $149,999 income range, which is the most common income bracket and makes up 27.1% of all families. Conversely, the $10,000 to $14,999 income bracket is the least frequent group with only 162 families (2.0%) belonging to this category.
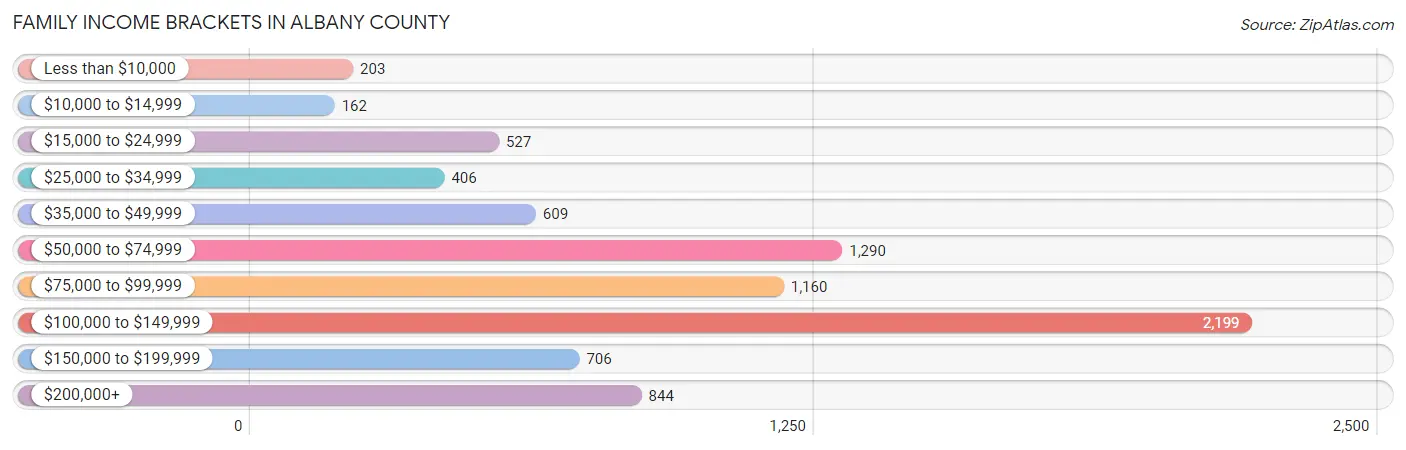
| Income Bracket | # Families | % Families |
| Less than $10,000 | 203 | 2.5% |
| $10,000 to $14,999 | 162 | 2.0% |
| $15,000 to $24,999 | 527 | 6.5% |
| $25,000 to $34,999 | 406 | 5.0% |
| $35,000 to $49,999 | 609 | 7.5% |
| $50,000 to $74,999 | 1,290 | 15.9% |
| $75,000 to $99,999 | 1,160 | 14.3% |
| $100,000 to $149,999 | 2,199 | 27.1% |
| $150,000 to $199,999 | 706 | 8.7% |
| $200,000+ | 844 | 10.4% |
Family Income by Famaliy Size in Albany County
4-person families (1,205 | 14.8%) account for the highest median family income in Albany County with $120,061 per family, while 2-person families (4,271 | 52.6%) have the highest median income of $38,824 per family member.
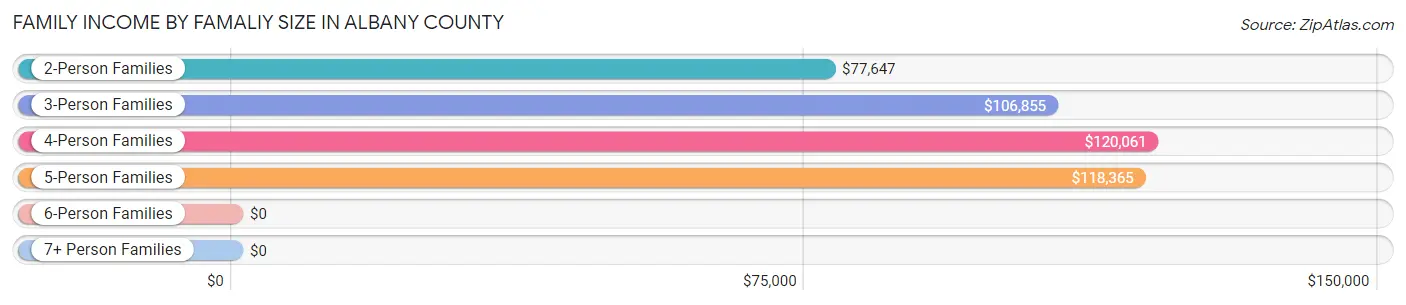
| Income Bracket | # Families | Median Income |
| 2-Person Families | 4,271 (52.6%) | $77,647 |
| 3-Person Families | 1,976 (24.3%) | $106,855 |
| 4-Person Families | 1,205 (14.8%) | $120,061 |
| 5-Person Families | 473 (5.8%) | $118,365 |
| 6-Person Families | 60 (0.7%) | $0 |
| 7+ Person Families | 129 (1.6%) | $0 |
| Total | 8,114 (100.0%) | $92,023 |
Family Income by Number of Earners in Albany County
The median family income in Albany County is $92,023, with families comprising 3+ earners (663) having the highest median family income of $119,672, while families with 1 earner (2,258) have the lowest median family income of $63,822, accounting for 8.2% and 27.8% of families, respectively.
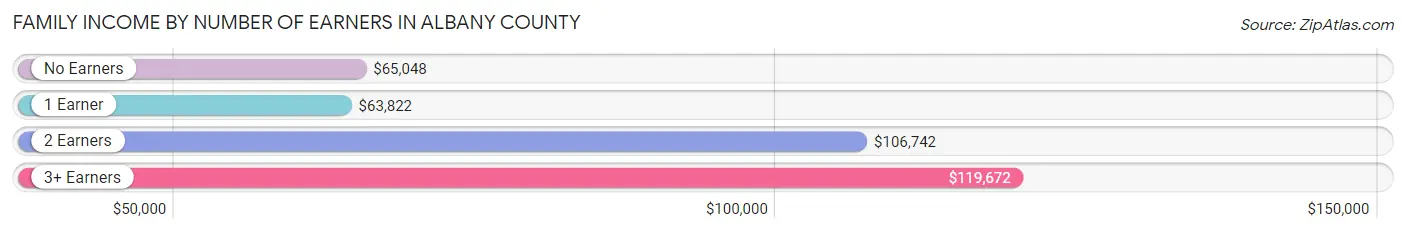
| Number of Earners | # Families | Median Income |
| No Earners | 859 (10.6%) | $65,048 |
| 1 Earner | 2,258 (27.8%) | $63,822 |
| 2 Earners | 4,334 (53.4%) | $106,742 |
| 3+ Earners | 663 (8.2%) | $119,672 |
| Total | 8,114 (100.0%) | $92,023 |
Household Income in Albany County
Household Income Brackets in Albany County
With 2,688 households falling in the category, the $100,000 to $149,999 income range is the most frequent in Albany County, accounting for 16.5% of all households. In contrast, only 782 households (4.8%) fall into the $10,000 to $14,999 income bracket, making it the least populous group.
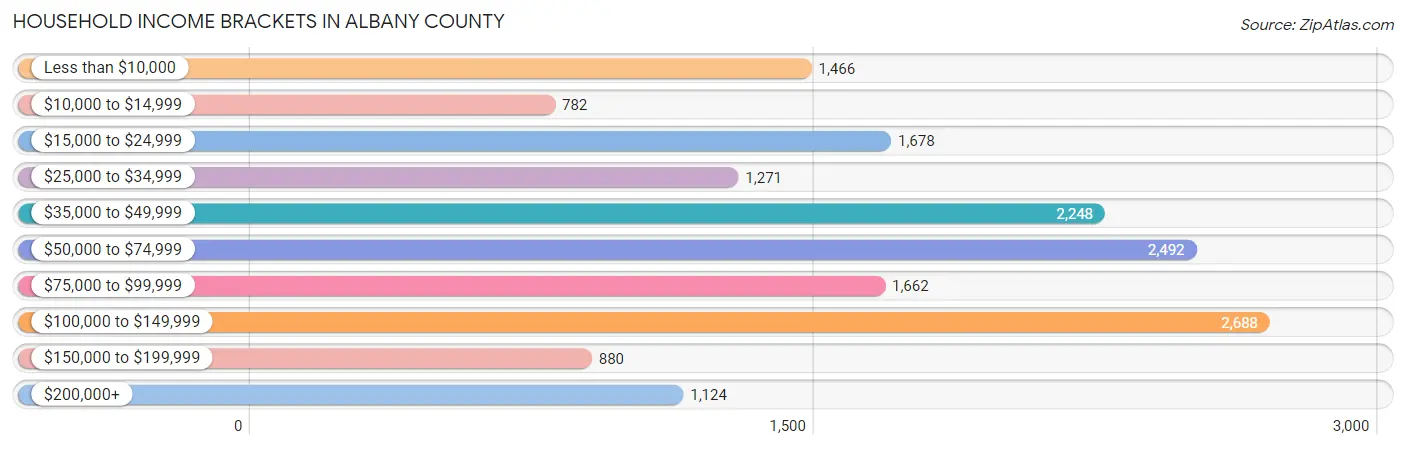
| Income Bracket | # Households | % Households |
| Less than $10,000 | 1,466 | 9.0% |
| $10,000 to $14,999 | 782 | 4.8% |
| $15,000 to $24,999 | 1,678 | 10.3% |
| $25,000 to $34,999 | 1,271 | 7.8% |
| $35,000 to $49,999 | 2,248 | 13.8% |
| $50,000 to $74,999 | 2,492 | 15.3% |
| $75,000 to $99,999 | 1,662 | 10.2% |
| $100,000 to $149,999 | 2,688 | 16.5% |
| $150,000 to $199,999 | 880 | 5.4% |
| $200,000+ | 1,124 | 6.9% |
Household Income by Householder Age in Albany County
The median household income in Albany County is $55,887, with the highest median household income of $90,938 found in the 45 to 64 years age bracket for the primary householder. A total of 3,603 households (22.1%) fall into this category. Meanwhile, the 15 to 24 years age bracket for the primary householder has the lowest median household income of $19,996, with 4,033 households (24.8%) in this group.
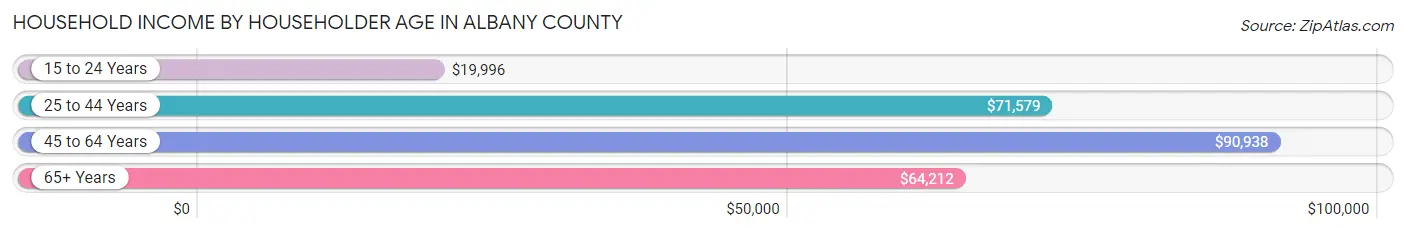
| Income Bracket | # Households | Median Income |
| 15 to 24 Years | 4,033 (24.8%) | $19,996 |
| 25 to 44 Years | 5,654 (34.7%) | $71,579 |
| 45 to 64 Years | 3,603 (22.1%) | $90,938 |
| 65+ Years | 3,000 (18.4%) | $64,212 |
| Total | 16,290 (100.0%) | $55,887 |
Poverty in Albany County
Income Below Poverty by Sex and Age in Albany County
With 21.3% poverty level for males and 25.0% for females among the residents of Albany County, 18 to 24 year old males and 18 to 24 year old females are the most vulnerable to poverty, with 2,272 males (50.7%) and 2,679 females (66.9%) in their respective age groups living below the poverty level.
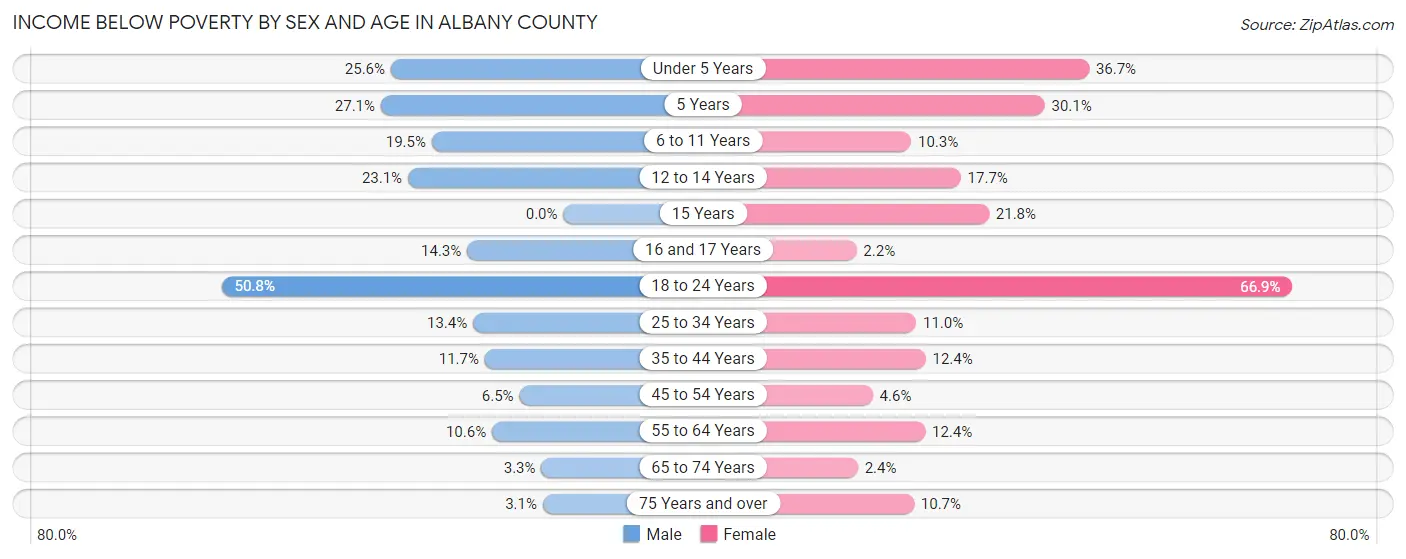
| Age Bracket | Male | Female |
| Under 5 Years | 199 (25.6%) | 294 (36.7%) |
| 5 Years | 29 (27.1%) | 28 (30.1%) |
| 6 to 11 Years | 194 (19.5%) | 107 (10.3%) |
| 12 to 14 Years | 93 (23.1%) | 72 (17.6%) |
| 15 Years | 0 (0.0%) | 57 (21.8%) |
| 16 and 17 Years | 48 (14.3%) | 5 (2.2%) |
| 18 to 24 Years | 2,272 (50.7%) | 2,679 (66.9%) |
| 25 to 34 Years | 469 (13.4%) | 285 (11.0%) |
| 35 to 44 Years | 249 (11.7%) | 230 (12.4%) |
| 45 to 54 Years | 99 (6.5%) | 62 (4.6%) |
| 55 to 64 Years | 171 (10.6%) | 211 (12.4%) |
| 65 to 74 Years | 52 (3.3%) | 33 (2.4%) |
| 75 Years and over | 22 (3.0%) | 100 (10.7%) |
| Total | 3,897 (21.3%) | 4,163 (25.0%) |
Income Above Poverty by Sex and Age in Albany County
According to the poverty statistics in Albany County, males aged 15 years and females aged 16 and 17 years are the age groups that are most secure financially, with 100.0% of males and 97.8% of females in these age groups living above the poverty line.
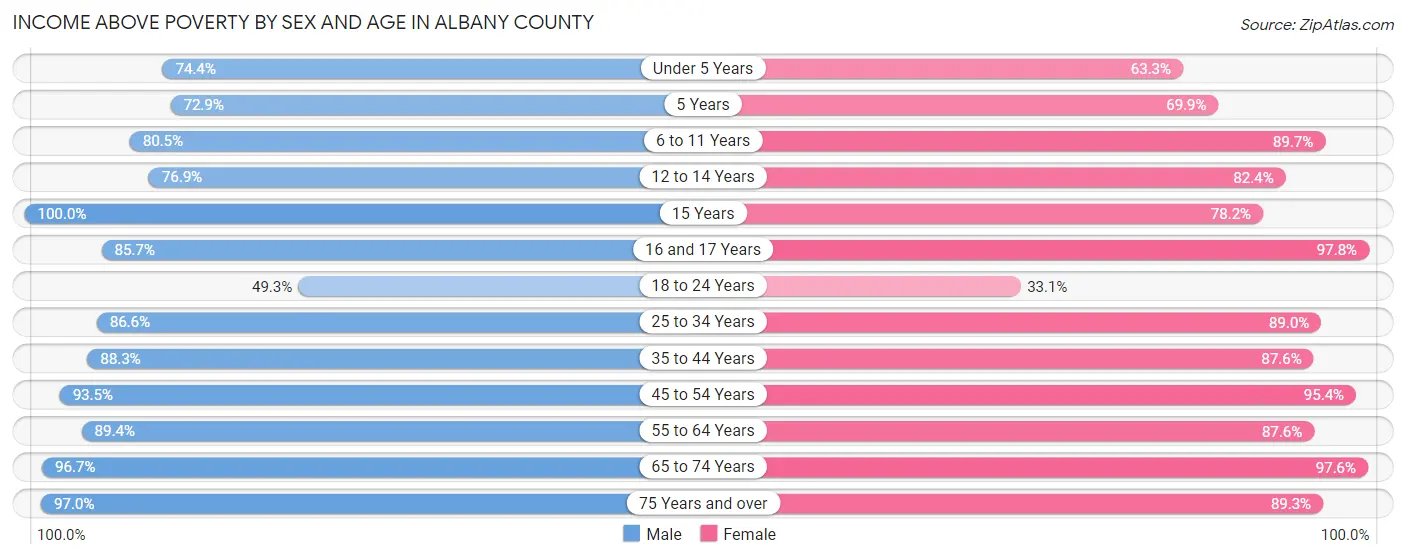
| Age Bracket | Male | Female |
| Under 5 Years | 578 (74.4%) | 507 (63.3%) |
| 5 Years | 78 (72.9%) | 65 (69.9%) |
| 6 to 11 Years | 799 (80.5%) | 933 (89.7%) |
| 12 to 14 Years | 310 (76.9%) | 336 (82.4%) |
| 15 Years | 136 (100.0%) | 204 (78.2%) |
| 16 and 17 Years | 288 (85.7%) | 225 (97.8%) |
| 18 to 24 Years | 2,205 (49.2%) | 1,326 (33.1%) |
| 25 to 34 Years | 3,028 (86.6%) | 2,300 (89.0%) |
| 35 to 44 Years | 1,887 (88.3%) | 1,619 (87.6%) |
| 45 to 54 Years | 1,420 (93.5%) | 1,293 (95.4%) |
| 55 to 64 Years | 1,442 (89.4%) | 1,496 (87.6%) |
| 65 to 74 Years | 1,542 (96.7%) | 1,363 (97.6%) |
| 75 Years and over | 700 (97.0%) | 835 (89.3%) |
| Total | 14,413 (78.7%) | 12,502 (75.0%) |
Income Below Poverty Among Married-Couple Families in Albany County
The poverty statistics for married-couple families in Albany County show that 5.0% or 318 of the total 6,358 families live below the poverty line. Families with 5 or more children have the highest poverty rate of 88.5%, comprising of 54 families. On the other hand, families with no children have the lowest poverty rate of 3.1%, which includes 118 families.
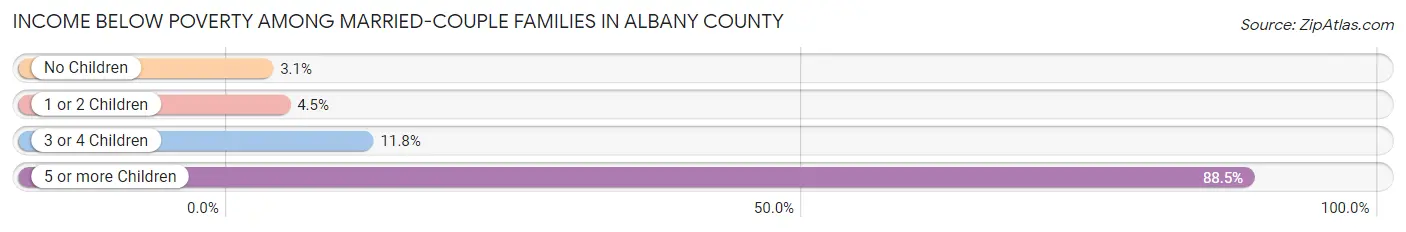
| Children | Above Poverty | Below Poverty |
| No Children | 3,735 (96.9%) | 118 (3.1%) |
| 1 or 2 Children | 1,872 (95.5%) | 89 (4.5%) |
| 3 or 4 Children | 426 (88.2%) | 57 (11.8%) |
| 5 or more Children | 7 (11.5%) | 54 (88.5%) |
| Total | 6,040 (95.0%) | 318 (5.0%) |
Income Below Poverty Among Single-Parent Households in Albany County
According to the poverty data in Albany County, 17.3% or 135 single-father households and 25.3% or 247 single-mother households are living below the poverty line. Among single-father households, those with 1 or 2 children have the highest poverty rate, with 56 households (23.6%) experiencing poverty. Likewise, among single-mother households, those with 3 or 4 children have the highest poverty rate, with 49 households (69.0%) falling below the poverty line.
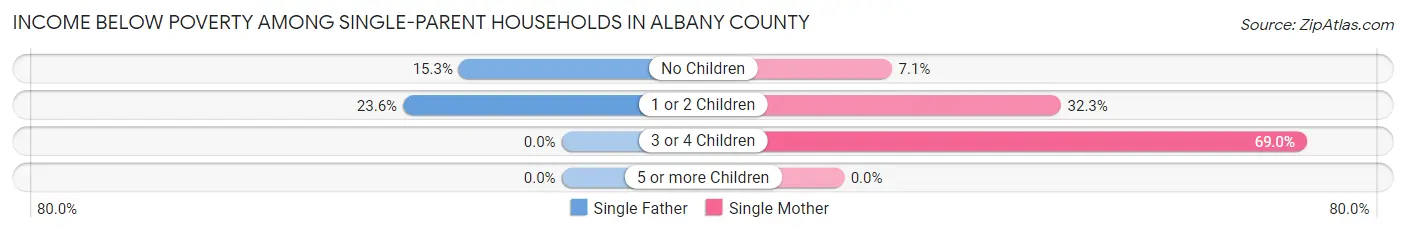
| Children | Single Father | Single Mother |
| No Children | 79 (15.3%) | 27 (7.1%) |
| 1 or 2 Children | 56 (23.6%) | 171 (32.3%) |
| 3 or 4 Children | 0 (0.0%) | 49 (69.0%) |
| 5 or more Children | 0 (0.0%) | 0 (0.0%) |
| Total | 135 (17.3%) | 247 (25.3%) |
Income Below Poverty Among Married-Couple vs Single-Parent Households in Albany County
The poverty data for Albany County shows that 318 of the married-couple family households (5.0%) and 382 of the single-parent households (21.7%) are living below the poverty level. Within the married-couple family households, those with 5 or more children have the highest poverty rate, with 54 households (88.5%) falling below the poverty line. Among the single-parent households, those with 3 or 4 children have the highest poverty rate, with 49 household (51.0%) living below poverty.
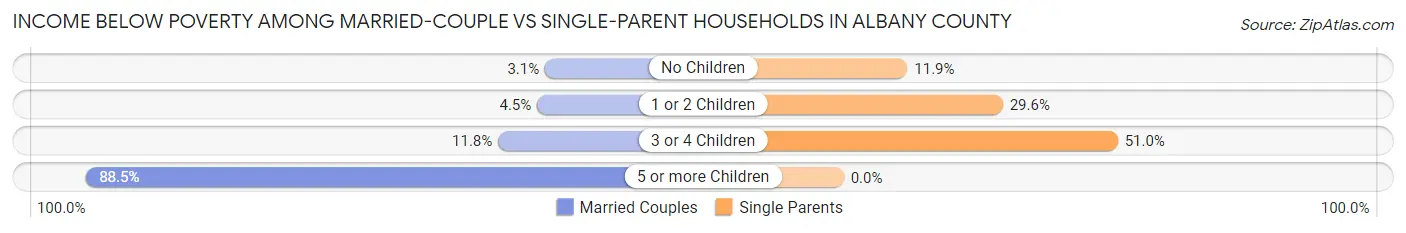
| Children | Married-Couple Families | Single-Parent Households |
| No Children | 118 (3.1%) | 106 (11.9%) |
| 1 or 2 Children | 89 (4.5%) | 227 (29.6%) |
| 3 or 4 Children | 57 (11.8%) | 49 (51.0%) |
| 5 or more Children | 54 (88.5%) | 0 (0.0%) |
| Total | 318 (5.0%) | 382 (21.7%) |
Employment Characteristics in Albany County
Employment by Class of Employer in Albany County
Among the 20,511 employed individuals in Albany County, private company employees (10,503 | 51.2%), state government employees (4,200 | 20.5%), and not-for-profit organizations (2,214 | 10.8%) make up the most common classes of employment.
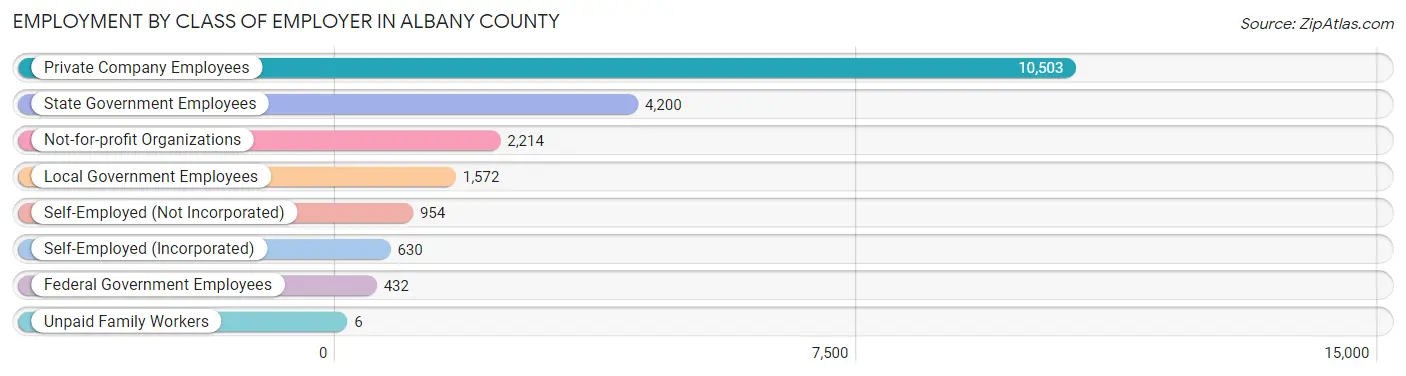
| Employer Class | # Employees | % Employees |
| Private Company Employees | 10,503 | 51.2% |
| Self-Employed (Incorporated) | 630 | 3.1% |
| Self-Employed (Not Incorporated) | 954 | 4.6% |
| Not-for-profit Organizations | 2,214 | 10.8% |
| Local Government Employees | 1,572 | 7.7% |
| State Government Employees | 4,200 | 20.5% |
| Federal Government Employees | 432 | 2.1% |
| Unpaid Family Workers | 6 | 0.0% |
| Total | 20,511 | 100.0% |
Employment Status by Age in Albany County
According to the labor force statistics for Albany County, out of the total population over 16 years of age (32,312), 68.4% or 22,101 individuals are in the labor force, with 4.4% or 972 of them unemployed. The age group with the highest labor force participation rate is 30 to 34 years, with 91.2% or 2,258 individuals in the labor force. Within the labor force, the 16 to 19 years age range has the highest percentage of unemployed individuals, with 17.9% or 268 of them being unemployed.
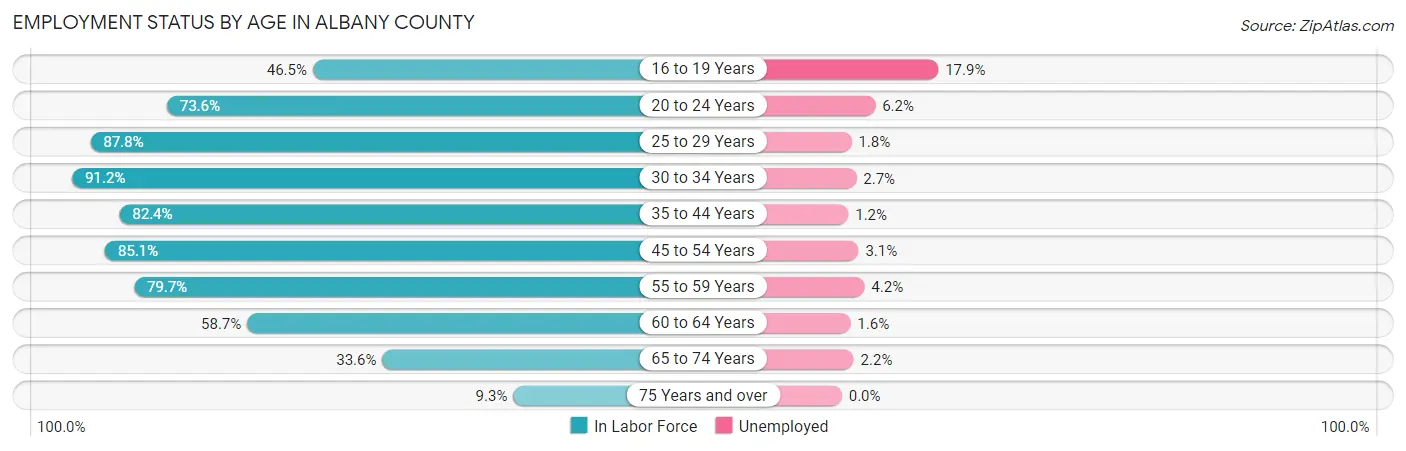
| Age Bracket | In Labor Force | Unemployed |
| 16 to 19 Years | 1,500 (46.5%) | 268 (17.9%) |
| 20 to 24 Years | 5,878 (73.6%) | 364 (6.2%) |
| 25 to 29 Years | 3,230 (87.8%) | 58 (1.8%) |
| 30 to 34 Years | 2,258 (91.2%) | 61 (2.7%) |
| 35 to 44 Years | 3,311 (82.4%) | 40 (1.2%) |
| 45 to 54 Years | 2,453 (85.1%) | 76 (3.1%) |
| 55 to 59 Years | 1,326 (79.7%) | 56 (4.2%) |
| 60 to 64 Years | 984 (58.7%) | 16 (1.6%) |
| 65 to 74 Years | 1,008 (33.6%) | 22 (2.2%) |
| 75 Years and over | 159 (9.3%) | 0 (0.0%) |
| Total | 22,101 (68.4%) | 972 (4.4%) |
Employment Status by Educational Attainment in Albany County
According to labor force statistics for Albany County, 82.7% of individuals (13,559) out of the total population between 25 and 64 years of age (16,396) are in the labor force, with 2.3% or 312 of them being unemployed. The group with the highest labor force participation rate are those with the educational attainment of bachelor's degree or higher, with 87.5% or 8,110 individuals in the labor force. Within the labor force, individuals with less than high school education have the highest percentage of unemployment, with 12.1% or 47 of them being unemployed.
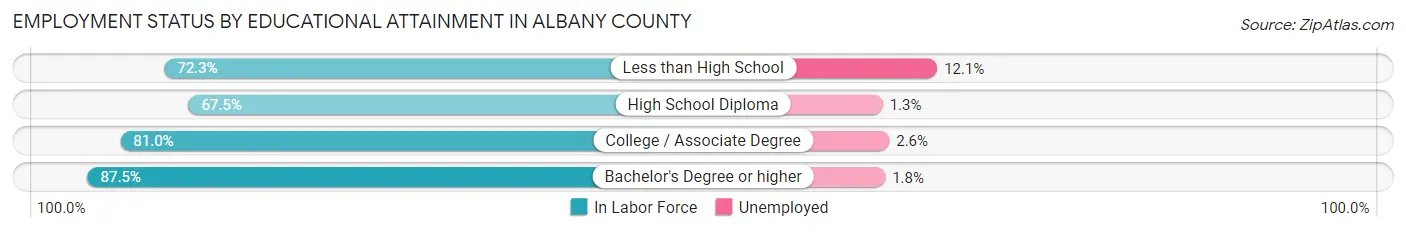
| Educational Attainment | In Labor Force | Unemployed |
| Less than High School | 387 (72.3%) | 65 (12.1%) |
| High School Diploma | 1,368 (67.5%) | 26 (1.3%) |
| College / Associate Degree | 3,698 (81.0%) | 119 (2.6%) |
| Bachelor's Degree or higher | 8,110 (87.5%) | 167 (1.8%) |
| Total | 13,559 (82.7%) | 377 (2.3%) |
Employment Occupations by Sex in Albany County
Management, Business, Science and Arts Occupations
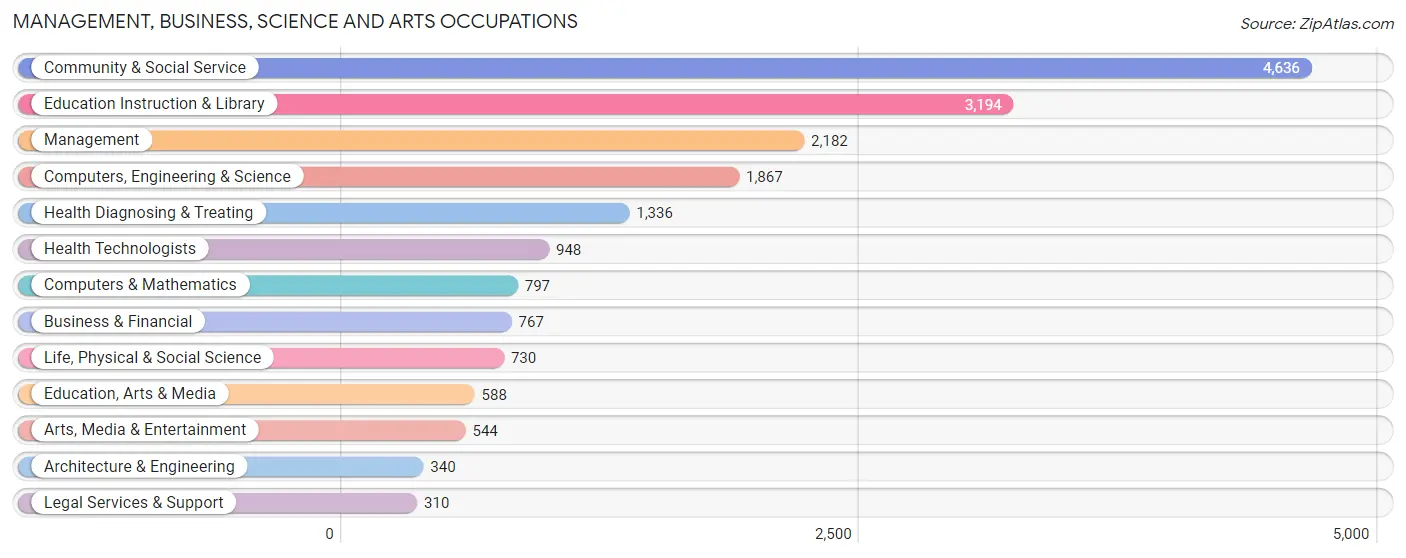
The most common Management, Business, Science and Arts occupations in Albany County are Community & Social Service (4,636 | 22.0%), Education Instruction & Library (3,194 | 15.1%), Management (2,182 | 10.3%), Computers, Engineering & Science (1,867 | 8.8%), and Health Diagnosing & Treating (1,336 | 6.3%).
Management, Business, Science and Arts Occupations by Sex
Within the Management, Business, Science and Arts occupations in Albany County, the most male-oriented occupations are Architecture & Engineering (81.5%), Computers & Mathematics (74.3%), and Computers, Engineering & Science (67.9%), while the most female-oriented occupations are Health Technologists (70.5%), Health Diagnosing & Treating (67.8%), and Business & Financial (61.3%).

| Occupation | Male | Female |
| Management | 1,225 (56.1%) | 957 (43.9%) |
| Business & Financial | 297 (38.7%) | 470 (61.3%) |
| Computers, Engineering & Science | 1,267 (67.9%) | 600 (32.1%) |
| Computers & Mathematics | 592 (74.3%) | 205 (25.7%) |
| Architecture & Engineering | 277 (81.5%) | 63 (18.5%) |
| Life, Physical & Social Science | 398 (54.5%) | 332 (45.5%) |
| Community & Social Service | 2,380 (51.3%) | 2,256 (48.7%) |
| Education, Arts & Media | 361 (61.4%) | 227 (38.6%) |
| Legal Services & Support | 135 (43.5%) | 175 (56.5%) |
| Education Instruction & Library | 1,619 (50.7%) | 1,575 (49.3%) |
| Arts, Media & Entertainment | 265 (48.7%) | 279 (51.3%) |
| Health Diagnosing & Treating | 430 (32.2%) | 906 (67.8%) |
| Health Technologists | 280 (29.5%) | 668 (70.5%) |
| Total (Category) | 5,599 (51.9%) | 5,189 (48.1%) |
| Total (Overall) | 11,636 (55.2%) | 9,460 (44.8%) |
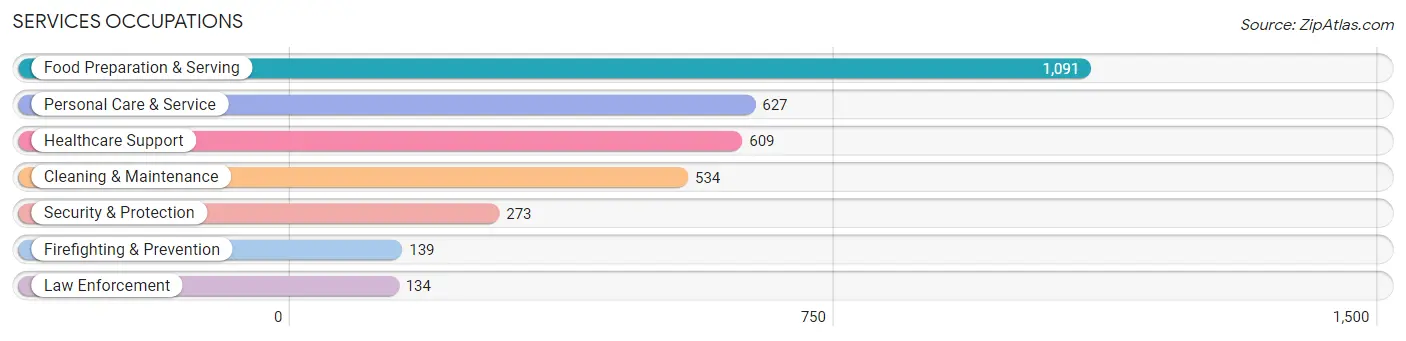
Services Occupations
The most common Services occupations in Albany County are Food Preparation & Serving (1,091 | 5.2%), Personal Care & Service (627 | 3.0%), Healthcare Support (609 | 2.9%), Cleaning & Maintenance (534 | 2.5%), and Security & Protection (273 | 1.3%).
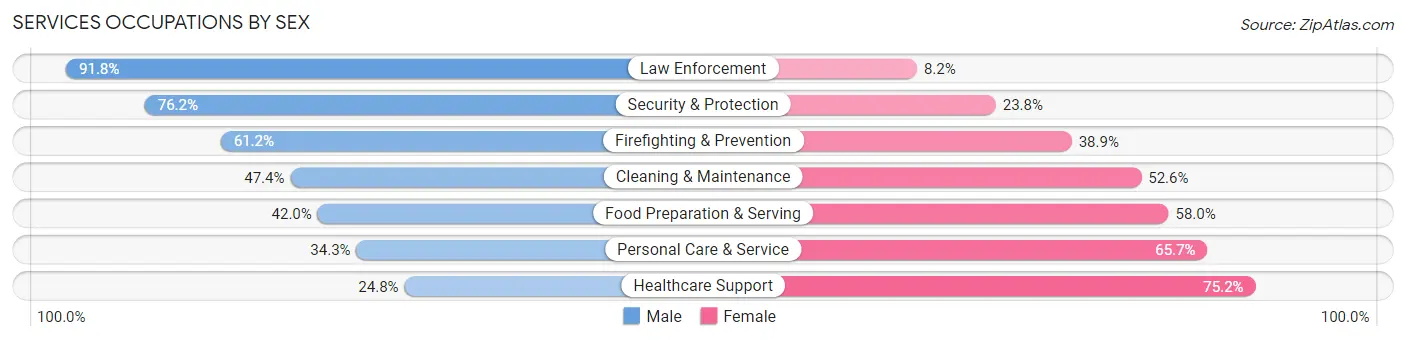
Services Occupations by Sex
Within the Services occupations in Albany County, the most male-oriented occupations are Law Enforcement (91.8%), Security & Protection (76.2%), and Firefighting & Prevention (61.2%), while the most female-oriented occupations are Healthcare Support (75.2%), Personal Care & Service (65.7%), and Food Preparation & Serving (58.0%).
| Occupation | Male | Female |
| Healthcare Support | 151 (24.8%) | 458 (75.2%) |
| Security & Protection | 208 (76.2%) | 65 (23.8%) |
| Firefighting & Prevention | 85 (61.2%) | 54 (38.9%) |
| Law Enforcement | 123 (91.8%) | 11 (8.2%) |
| Food Preparation & Serving | 458 (42.0%) | 633 (58.0%) |
| Cleaning & Maintenance | 253 (47.4%) | 281 (52.6%) |
| Personal Care & Service | 215 (34.3%) | 412 (65.7%) |
| Total (Category) | 1,285 (41.0%) | 1,849 (59.0%) |
| Total (Overall) | 11,636 (55.2%) | 9,460 (44.8%) |
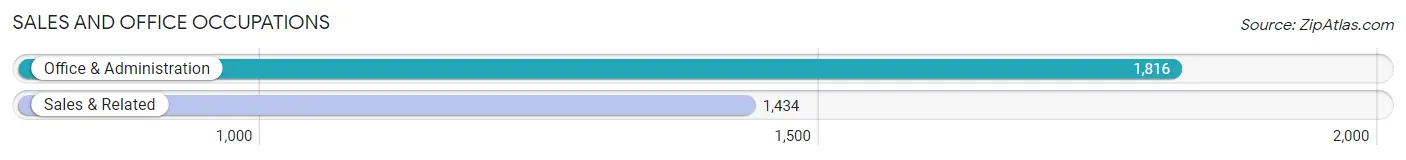
Sales and Office Occupations
The most common Sales and Office occupations in Albany County are Office & Administration (1,816 | 8.6%), and Sales & Related (1,434 | 6.8%).
Sales and Office Occupations by Sex
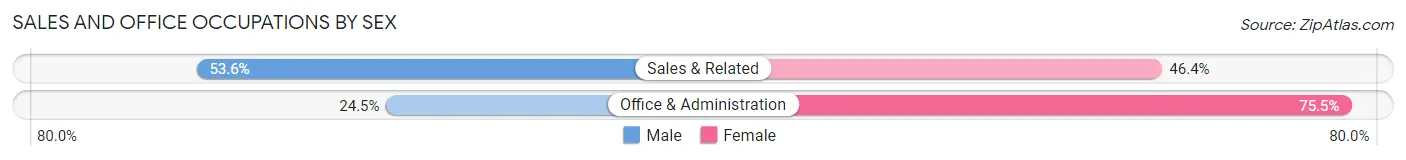
| Occupation | Male | Female |
| Sales & Related | 768 (53.6%) | 666 (46.4%) |
| Office & Administration | 445 (24.5%) | 1,371 (75.5%) |
| Total (Category) | 1,213 (37.3%) | 2,037 (62.7%) |
| Total (Overall) | 11,636 (55.2%) | 9,460 (44.8%) |
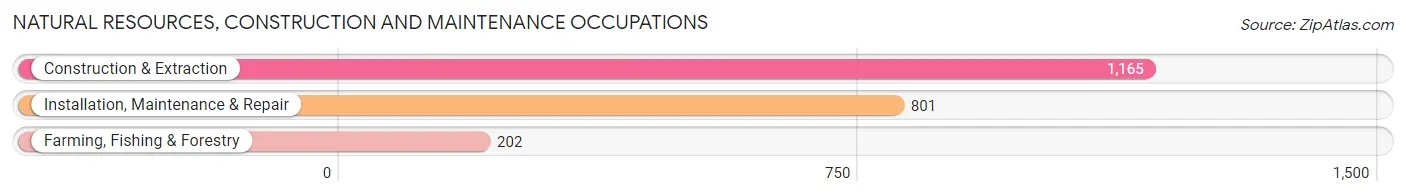
Natural Resources, Construction and Maintenance Occupations
The most common Natural Resources, Construction and Maintenance occupations in Albany County are Construction & Extraction (1,165 | 5.5%), Installation, Maintenance & Repair (801 | 3.8%), and Farming, Fishing & Forestry (202 | 1.0%).
Natural Resources, Construction and Maintenance Occupations by Sex
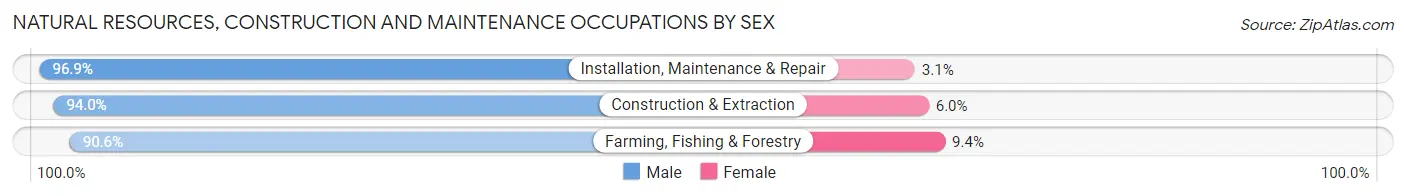
| Occupation | Male | Female |
| Farming, Fishing & Forestry | 183 (90.6%) | 19 (9.4%) |
| Construction & Extraction | 1,095 (94.0%) | 70 (6.0%) |
| Installation, Maintenance & Repair | 776 (96.9%) | 25 (3.1%) |
| Total (Category) | 2,054 (94.7%) | 114 (5.3%) |
| Total (Overall) | 11,636 (55.2%) | 9,460 (44.8%) |
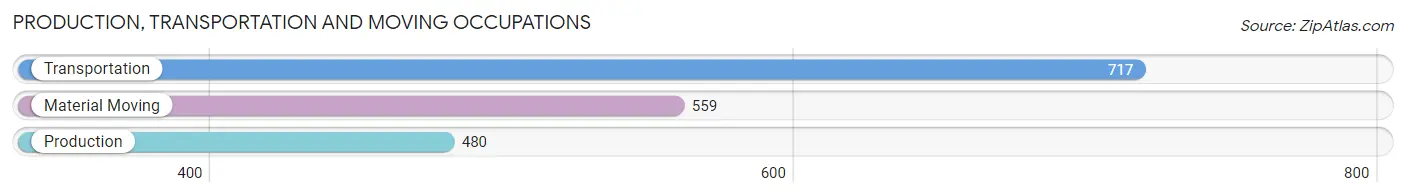
Production, Transportation and Moving Occupations
The most common Production, Transportation and Moving occupations in Albany County are Transportation (717 | 3.4%), Material Moving (559 | 2.6%), and Production (480 | 2.3%).
Production, Transportation and Moving Occupations by Sex
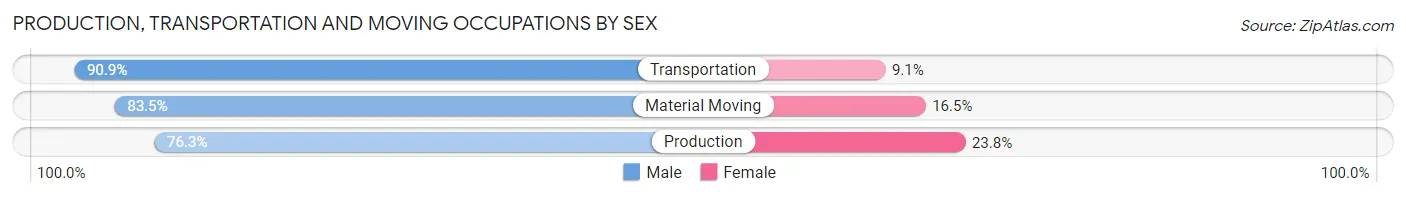
| Occupation | Male | Female |
| Production | 366 (76.2%) | 114 (23.7%) |
| Transportation | 652 (90.9%) | 65 (9.1%) |
| Material Moving | 467 (83.5%) | 92 (16.5%) |
| Total (Category) | 1,485 (84.6%) | 271 (15.4%) |
| Total (Overall) | 11,636 (55.2%) | 9,460 (44.8%) |
Employment Industries by Sex in Albany County
Employment Industries in Albany County
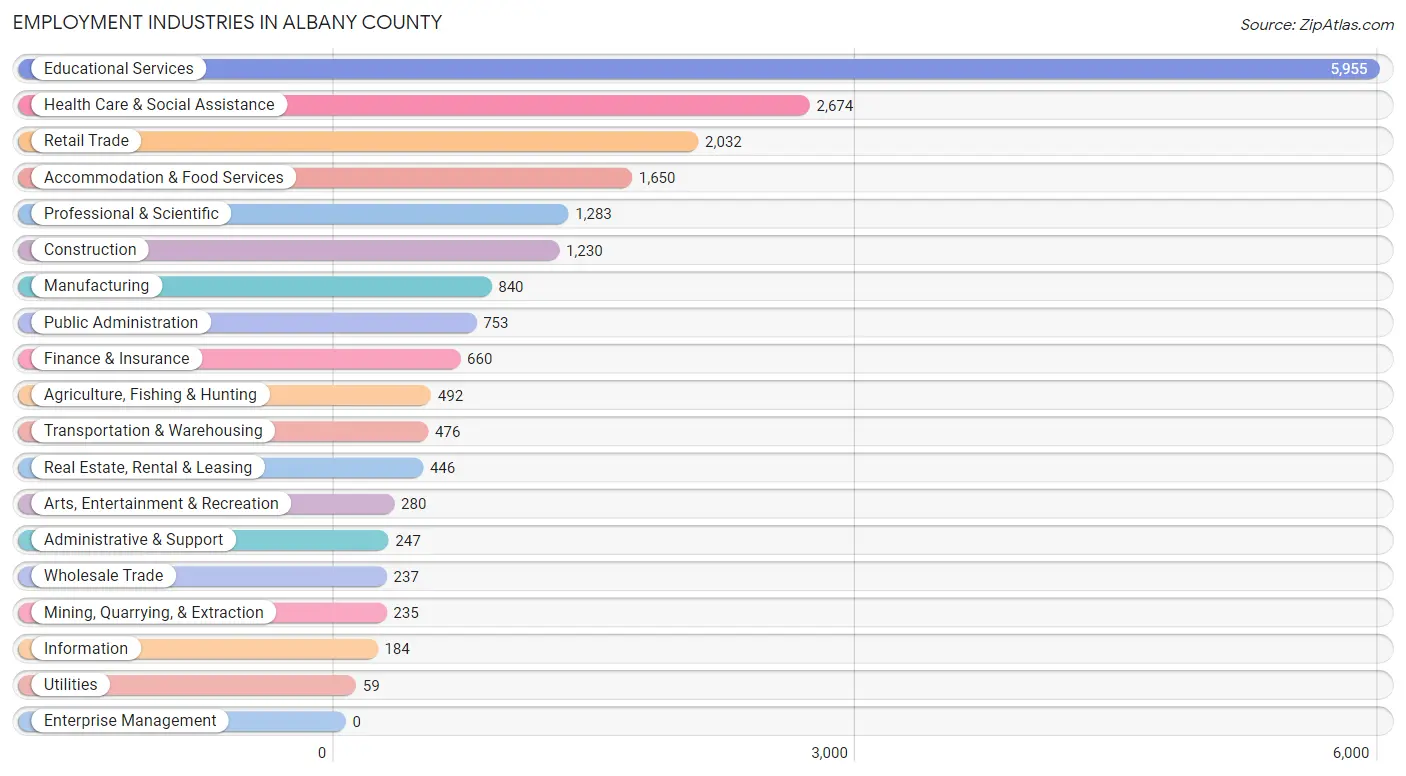
The major employment industries in Albany County include Educational Services (5,955 | 28.2%), Health Care & Social Assistance (2,674 | 12.7%), Retail Trade (2,032 | 9.6%), Accommodation & Food Services (1,650 | 7.8%), and Professional & Scientific (1,283 | 6.1%).
Employment Industries by Sex in Albany County
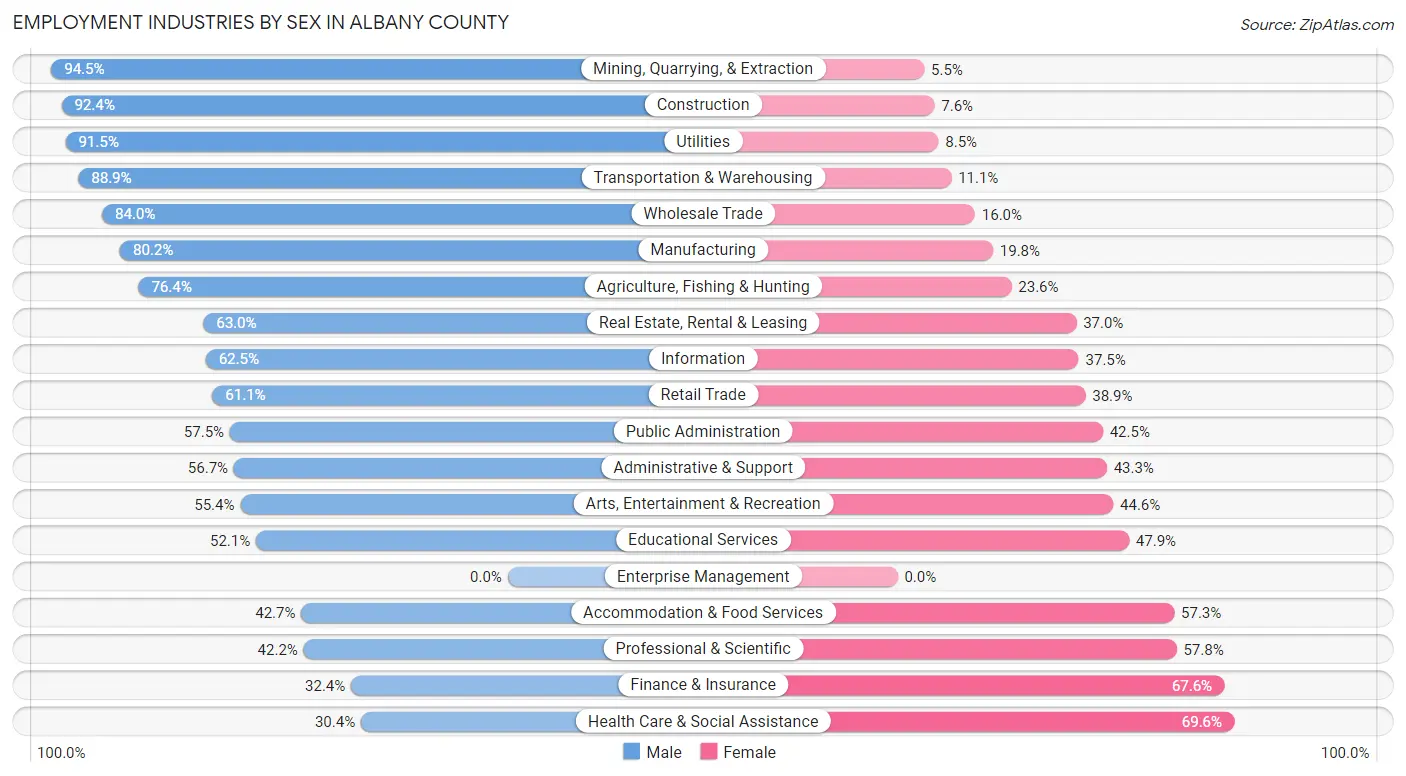
The Albany County industries that see more men than women are Mining, Quarrying, & Extraction (94.5%), Construction (92.4%), and Utilities (91.5%), whereas the industries that tend to have a higher number of women are Health Care & Social Assistance (69.6%), Finance & Insurance (67.6%), and Professional & Scientific (57.8%).
| Industry | Male | Female |
| Agriculture, Fishing & Hunting | 376 (76.4%) | 116 (23.6%) |
| Mining, Quarrying, & Extraction | 222 (94.5%) | 13 (5.5%) |
| Construction | 1,136 (92.4%) | 94 (7.6%) |
| Manufacturing | 674 (80.2%) | 166 (19.8%) |
| Wholesale Trade | 199 (84.0%) | 38 (16.0%) |
| Retail Trade | 1,242 (61.1%) | 790 (38.9%) |
| Transportation & Warehousing | 423 (88.9%) | 53 (11.1%) |
| Utilities | 54 (91.5%) | 5 (8.5%) |
| Information | 115 (62.5%) | 69 (37.5%) |
| Finance & Insurance | 214 (32.4%) | 446 (67.6%) |
| Real Estate, Rental & Leasing | 281 (63.0%) | 165 (37.0%) |
| Professional & Scientific | 542 (42.2%) | 741 (57.8%) |
| Enterprise Management | 0 (0.0%) | 0 (0.0%) |
| Administrative & Support | 140 (56.7%) | 107 (43.3%) |
| Educational Services | 3,102 (52.1%) | 2,853 (47.9%) |
| Health Care & Social Assistance | 812 (30.4%) | 1,862 (69.6%) |
| Arts, Entertainment & Recreation | 155 (55.4%) | 125 (44.6%) |
| Accommodation & Food Services | 705 (42.7%) | 945 (57.3%) |
| Public Administration | 433 (57.5%) | 320 (42.5%) |
| Total | 11,636 (55.2%) | 9,460 (44.8%) |
Education in Albany County
School Enrollment in Albany County
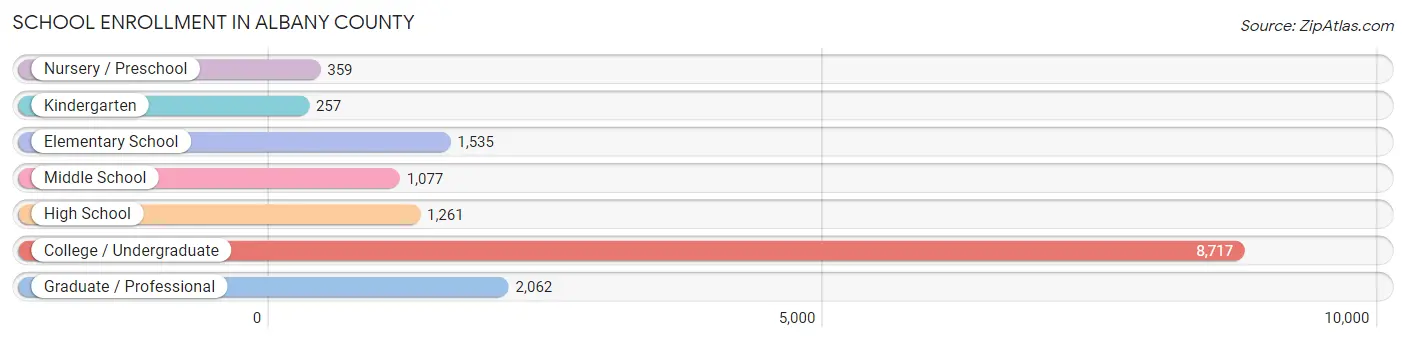
The most common levels of schooling among the 15,268 students in Albany County are college / undergraduate (8,717 | 57.1%), graduate / professional (2,062 | 13.5%), and elementary school (1,535 | 10.1%).
| School Level | # Students | % Students |
| Nursery / Preschool | 359 | 2.4% |
| Kindergarten | 257 | 1.7% |
| Elementary School | 1,535 | 10.1% |
| Middle School | 1,077 | 7.0% |
| High School | 1,261 | 8.3% |
| College / Undergraduate | 8,717 | 57.1% |
| Graduate / Professional | 2,062 | 13.5% |
| Total | 15,268 | 100.0% |
School Enrollment by Age by Funding Source in Albany County
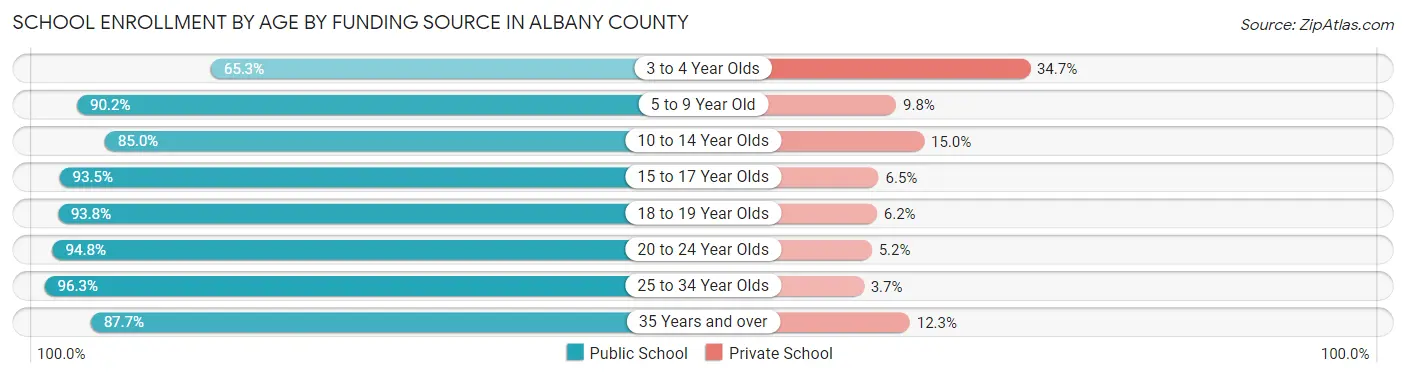
Out of a total of 15,268 students who are enrolled in schools in Albany County, 1,130 (7.4%) attend a private institution, while the remaining 14,138 (92.6%) are enrolled in public schools. The age group of 3 to 4 year olds has the highest likelihood of being enrolled in private schools, with 93 (34.7% in the age bracket) enrolled. Conversely, the age group of 25 to 34 year olds has the lowest likelihood of being enrolled in a private school, with 1,651 (96.3% in the age bracket) attending a public institution.
| Age Bracket | Public School | Private School |
| 3 to 4 Year Olds | 175 (65.3%) | 93 (34.7%) |
| 5 to 9 Year Old | 1,413 (90.2%) | 153 (9.8%) |
| 10 to 14 Year Olds | 1,233 (85.0%) | 217 (15.0%) |
| 15 to 17 Year Olds | 933 (93.5%) | 65 (6.5%) |
| 18 to 19 Year Olds | 2,413 (93.8%) | 159 (6.2%) |
| 20 to 24 Year Olds | 5,964 (94.8%) | 329 (5.2%) |
| 25 to 34 Year Olds | 1,651 (96.3%) | 64 (3.7%) |
| 35 Years and over | 356 (87.7%) | 50 (12.3%) |
| Total | 14,138 (92.6%) | 1,130 (7.4%) |
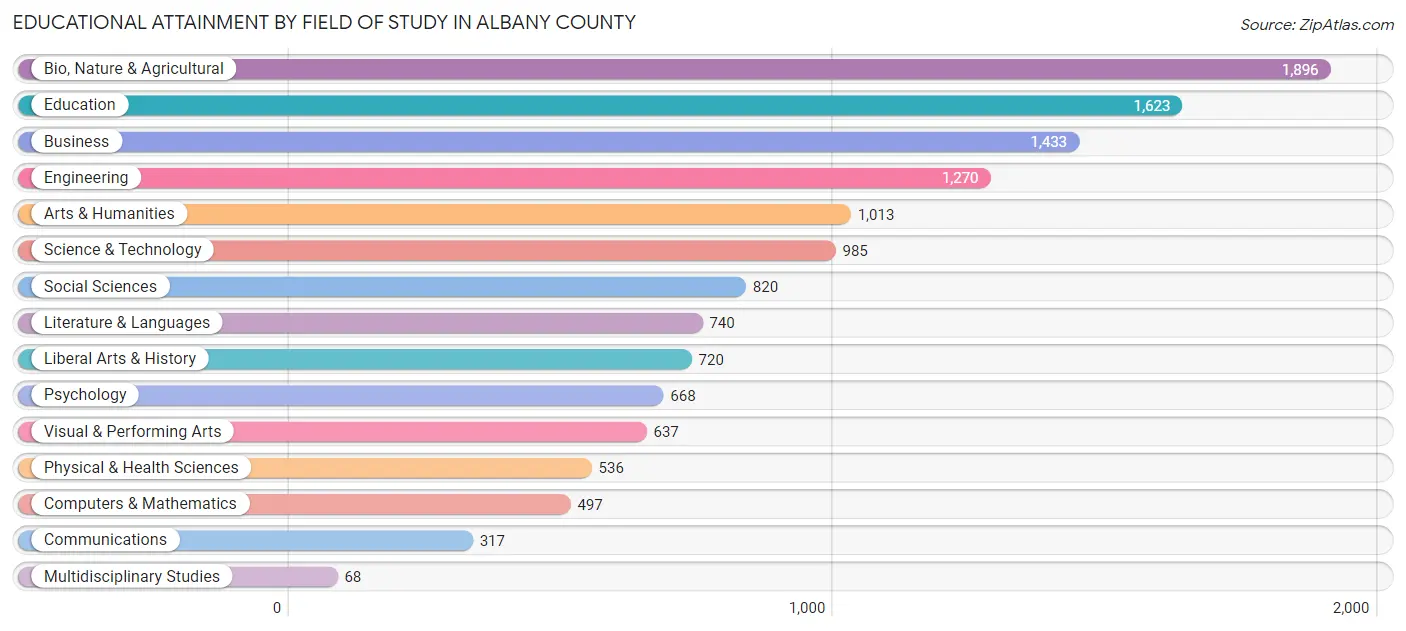
Educational Attainment by Field of Study in Albany County
Bio, nature & agricultural (1,896 | 14.3%), education (1,623 | 12.3%), business (1,433 | 10.8%), engineering (1,270 | 9.6%), and arts & humanities (1,013 | 7.7%) are the most common fields of study among 13,223 individuals in Albany County who have obtained a bachelor's degree or higher.
| Field of Study | # Graduates | % Graduates |
| Computers & Mathematics | 497 | 3.8% |
| Bio, Nature & Agricultural | 1,896 | 14.3% |
| Physical & Health Sciences | 536 | 4.1% |
| Psychology | 668 | 5.1% |
| Social Sciences | 820 | 6.2% |
| Engineering | 1,270 | 9.6% |
| Multidisciplinary Studies | 68 | 0.5% |
| Science & Technology | 985 | 7.4% |
| Business | 1,433 | 10.8% |
| Education | 1,623 | 12.3% |
| Literature & Languages | 740 | 5.6% |
| Liberal Arts & History | 720 | 5.4% |
| Visual & Performing Arts | 637 | 4.8% |
| Communications | 317 | 2.4% |
| Arts & Humanities | 1,013 | 7.7% |
| Total | 13,223 | 100.0% |
Transportation & Commute in Albany County
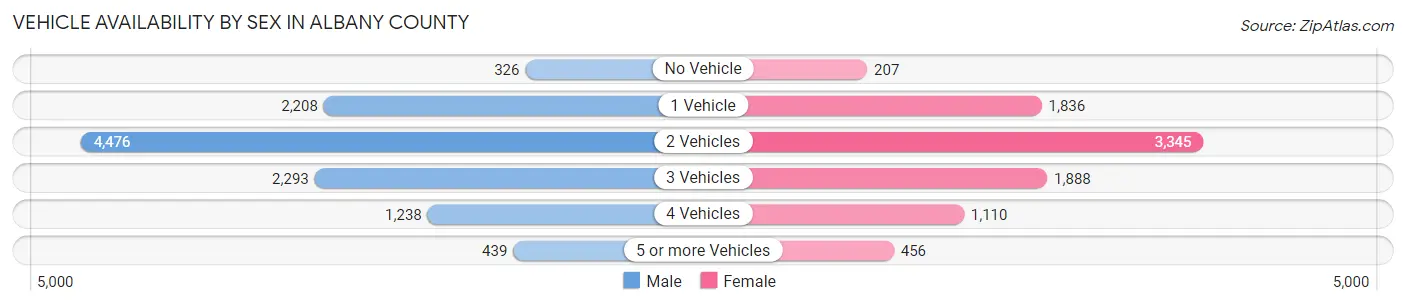
Vehicle Availability by Sex in Albany County
The most prevalent vehicle ownership categories in Albany County are males with 2 vehicles (4,476, accounting for 40.8%) and females with 2 vehicles (3,345, making up 50.6%).
| Vehicles Available | Male | Female |
| No Vehicle | 326 (3.0%) | 207 (2.3%) |
| 1 Vehicle | 2,208 (20.1%) | 1,836 (20.8%) |
| 2 Vehicles | 4,476 (40.8%) | 3,345 (37.8%) |
| 3 Vehicles | 2,293 (20.9%) | 1,888 (21.3%) |
| 4 Vehicles | 1,238 (11.3%) | 1,110 (12.6%) |
| 5 or more Vehicles | 439 (4.0%) | 456 (5.2%) |
| Total | 10,980 (100.0%) | 8,842 (100.0%) |
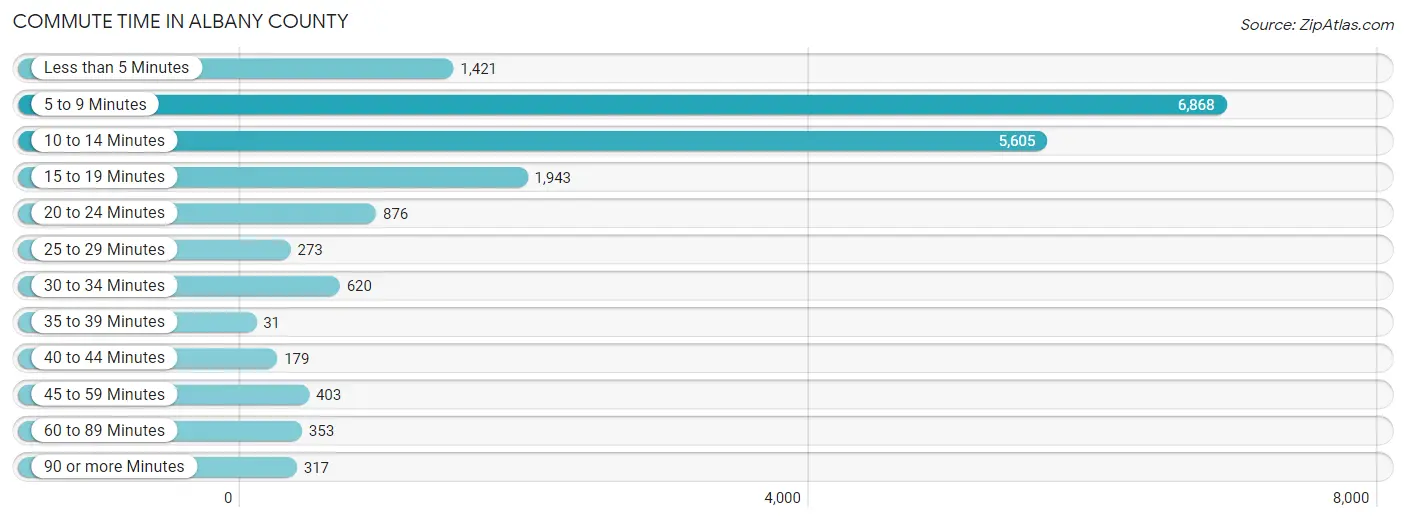
Commute Time in Albany County
The most frequently occuring commute durations in Albany County are 5 to 9 minutes (6,868 commuters, 36.4%), 10 to 14 minutes (5,605 commuters, 29.7%), and 15 to 19 minutes (1,943 commuters, 10.3%).
| Commute Time | # Commuters | % Commuters |
| Less than 5 Minutes | 1,421 | 7.5% |
| 5 to 9 Minutes | 6,868 | 36.4% |
| 10 to 14 Minutes | 5,605 | 29.7% |
| 15 to 19 Minutes | 1,943 | 10.3% |
| 20 to 24 Minutes | 876 | 4.6% |
| 25 to 29 Minutes | 273 | 1.5% |
| 30 to 34 Minutes | 620 | 3.3% |
| 35 to 39 Minutes | 31 | 0.2% |
| 40 to 44 Minutes | 179 | 0.9% |
| 45 to 59 Minutes | 403 | 2.1% |
| 60 to 89 Minutes | 353 | 1.9% |
| 90 or more Minutes | 317 | 1.7% |
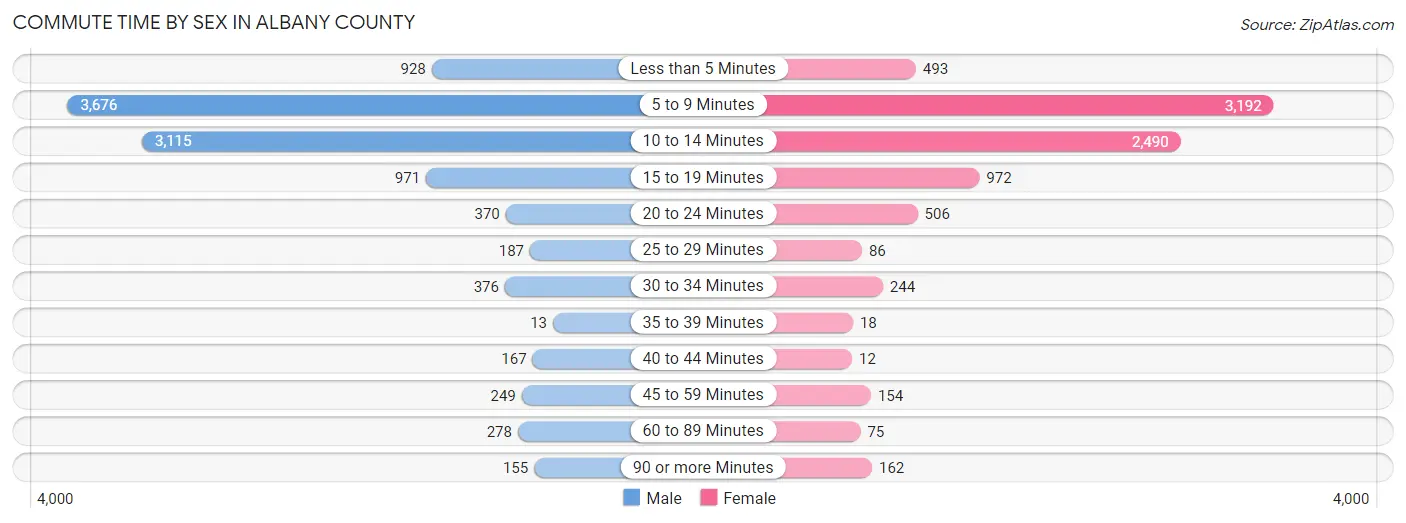
Commute Time by Sex in Albany County
The most common commute times in Albany County are 5 to 9 minutes (3,676 commuters, 35.1%) for males and 5 to 9 minutes (3,192 commuters, 38.0%) for females.
| Commute Time | Male | Female |
| Less than 5 Minutes | 928 (8.8%) | 493 (5.9%) |
| 5 to 9 Minutes | 3,676 (35.1%) | 3,192 (38.0%) |
| 10 to 14 Minutes | 3,115 (29.7%) | 2,490 (29.6%) |
| 15 to 19 Minutes | 971 (9.3%) | 972 (11.6%) |
| 20 to 24 Minutes | 370 (3.5%) | 506 (6.0%) |
| 25 to 29 Minutes | 187 (1.8%) | 86 (1.0%) |
| 30 to 34 Minutes | 376 (3.6%) | 244 (2.9%) |
| 35 to 39 Minutes | 13 (0.1%) | 18 (0.2%) |
| 40 to 44 Minutes | 167 (1.6%) | 12 (0.1%) |
| 45 to 59 Minutes | 249 (2.4%) | 154 (1.8%) |
| 60 to 89 Minutes | 278 (2.6%) | 75 (0.9%) |
| 90 or more Minutes | 155 (1.5%) | 162 (1.9%) |
Time of Departure to Work by Sex in Albany County
The most frequent times of departure to work in Albany County are 7:30 AM to 7:59 AM (1,920, 18.3%) for males and 7:30 AM to 7:59 AM (1,789, 21.3%) for females.
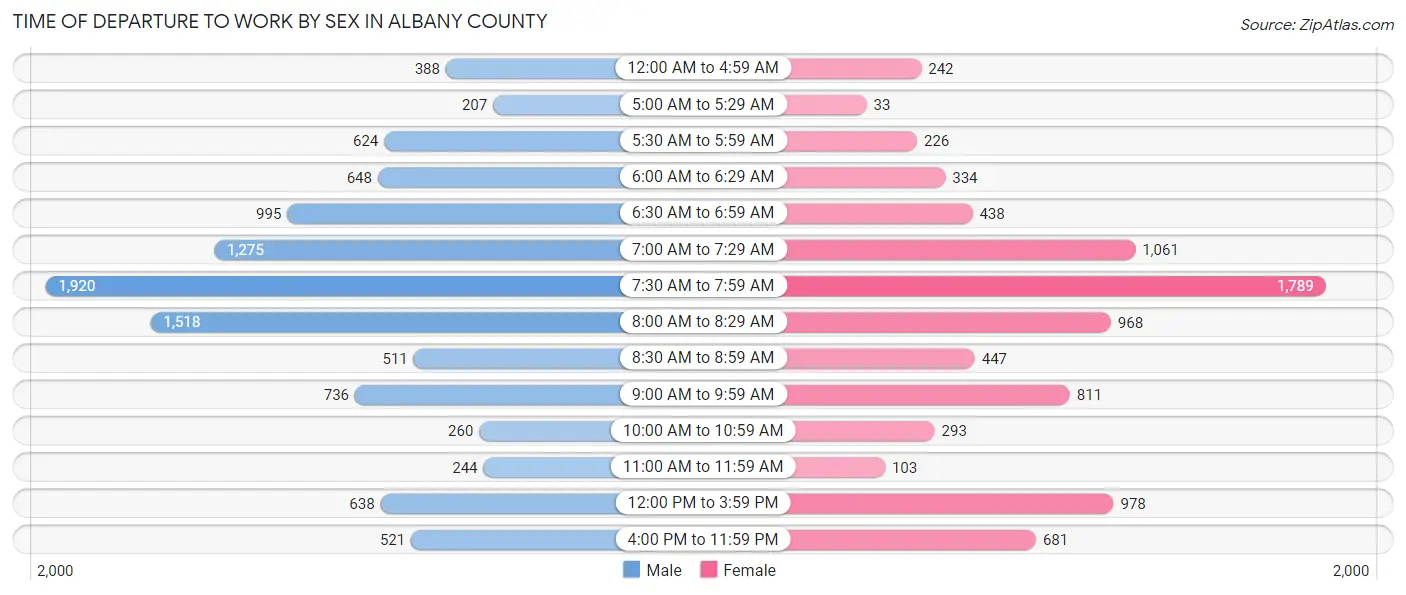
| Time of Departure | Male | Female |
| 12:00 AM to 4:59 AM | 388 (3.7%) | 242 (2.9%) |
| 5:00 AM to 5:29 AM | 207 (2.0%) | 33 (0.4%) |
| 5:30 AM to 5:59 AM | 624 (5.9%) | 226 (2.7%) |
| 6:00 AM to 6:29 AM | 648 (6.2%) | 334 (4.0%) |
| 6:30 AM to 6:59 AM | 995 (9.5%) | 438 (5.2%) |
| 7:00 AM to 7:29 AM | 1,275 (12.2%) | 1,061 (12.6%) |
| 7:30 AM to 7:59 AM | 1,920 (18.3%) | 1,789 (21.3%) |
| 8:00 AM to 8:29 AM | 1,518 (14.5%) | 968 (11.5%) |
| 8:30 AM to 8:59 AM | 511 (4.9%) | 447 (5.3%) |
| 9:00 AM to 9:59 AM | 736 (7.0%) | 811 (9.7%) |
| 10:00 AM to 10:59 AM | 260 (2.5%) | 293 (3.5%) |
| 11:00 AM to 11:59 AM | 244 (2.3%) | 103 (1.2%) |
| 12:00 PM to 3:59 PM | 638 (6.1%) | 978 (11.6%) |
| 4:00 PM to 11:59 PM | 521 (5.0%) | 681 (8.1%) |
| Total | 10,485 (100.0%) | 8,404 (100.0%) |
Housing Occupancy in Albany County
Occupancy by Ownership in Albany County
Of the total 16,290 dwellings in Albany County, owner-occupied units account for 8,235 (50.5%), while renter-occupied units make up 8,055 (49.4%).
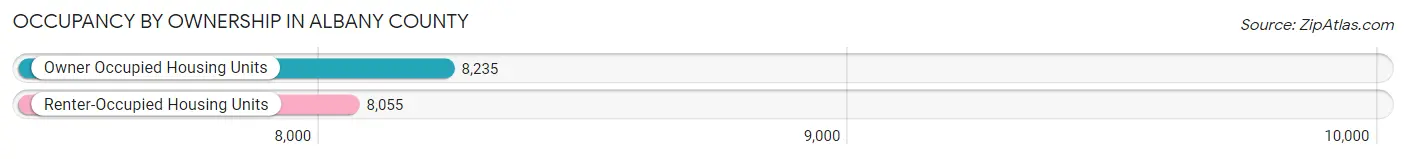
| Occupancy | # Housing Units | % Housing Units |
| Owner Occupied Housing Units | 8,235 | 50.5% |
| Renter-Occupied Housing Units | 8,055 | 49.4% |
| Total Occupied Housing Units | 16,290 | 100.0% |
Occupancy by Household Size in Albany County
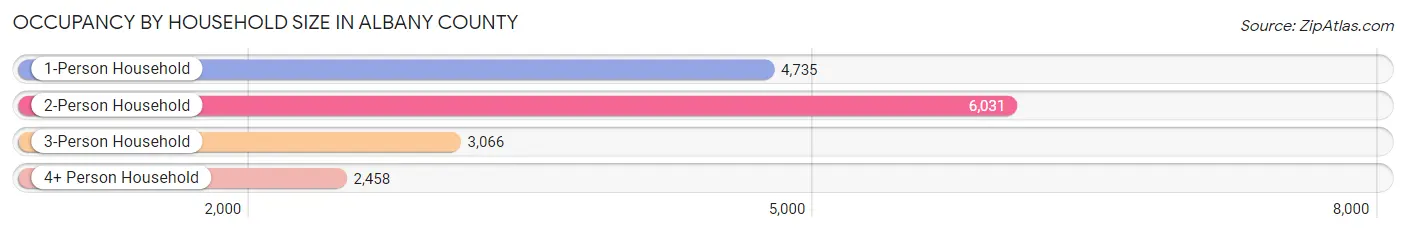
| Household Size | # Housing Units | % Housing Units |
| 1-Person Household | 4,735 | 29.1% |
| 2-Person Household | 6,031 | 37.0% |
| 3-Person Household | 3,066 | 18.8% |
| 4+ Person Household | 2,458 | 15.1% |
| Total Housing Units | 16,290 | 100.0% |
Occupancy by Ownership by Household Size in Albany County
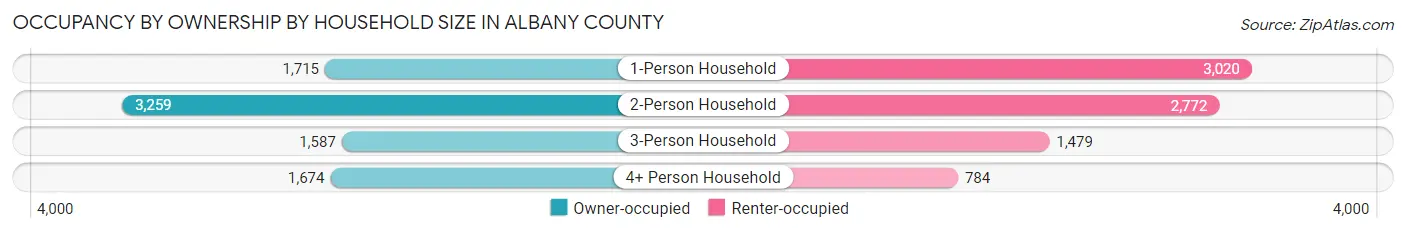
| Household Size | Owner-occupied | Renter-occupied |
| 1-Person Household | 1,715 (36.2%) | 3,020 (63.8%) |
| 2-Person Household | 3,259 (54.0%) | 2,772 (46.0%) |
| 3-Person Household | 1,587 (51.8%) | 1,479 (48.2%) |
| 4+ Person Household | 1,674 (68.1%) | 784 (31.9%) |
| Total Housing Units | 8,235 (50.5%) | 8,055 (49.4%) |
Occupancy by Educational Attainment in Albany County
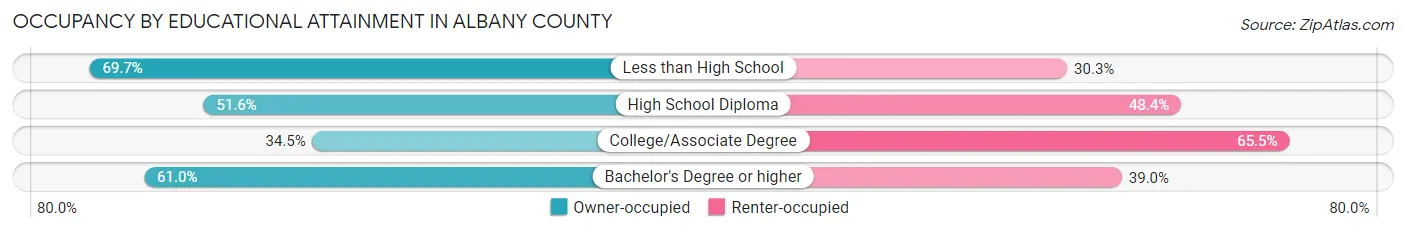
| Household Size | Owner-occupied | Renter-occupied |
| Less than High School | 168 (69.7%) | 73 (30.3%) |
| High School Diploma | 1,058 (51.6%) | 991 (48.4%) |
| College/Associate Degree | 1,994 (34.5%) | 3,789 (65.5%) |
| Bachelor's Degree or higher | 5,015 (61.0%) | 3,202 (39.0%) |
Occupancy by Age of Householder in Albany County
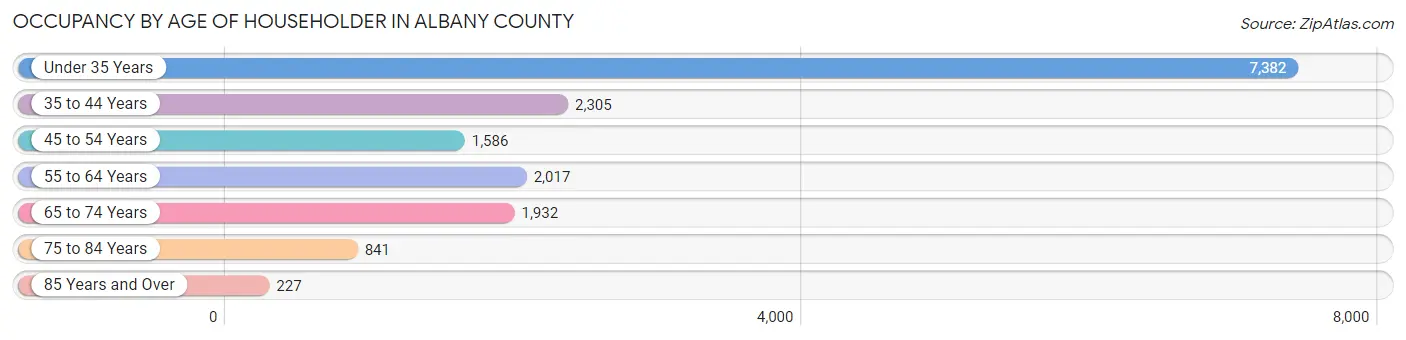
| Age Bracket | # Households | % Households |
| Under 35 Years | 7,382 | 45.3% |
| 35 to 44 Years | 2,305 | 14.1% |
| 45 to 54 Years | 1,586 | 9.7% |
| 55 to 64 Years | 2,017 | 12.4% |
| 65 to 74 Years | 1,932 | 11.9% |
| 75 to 84 Years | 841 | 5.2% |
| 85 Years and Over | 227 | 1.4% |
| Total | 16,290 | 100.0% |
Housing Finances in Albany County
Median Income by Occupancy in Albany County
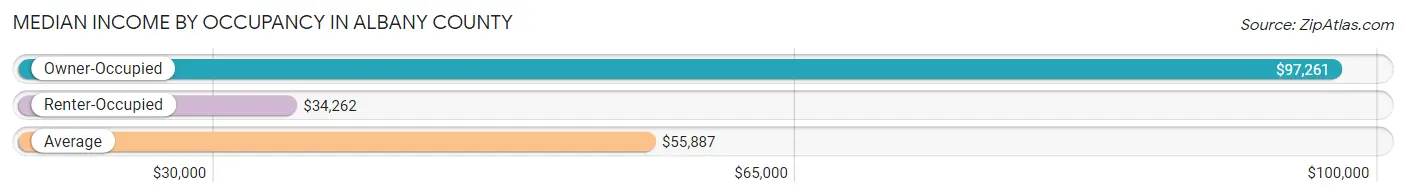
| Occupancy Type | # Households | Median Income |
| Owner-Occupied | 8,235 (50.5%) | $97,261 |
| Renter-Occupied | 8,055 (49.4%) | $34,262 |
| Average | 16,290 (100.0%) | $55,887 |
Occupancy by Householder Income Bracket in Albany County
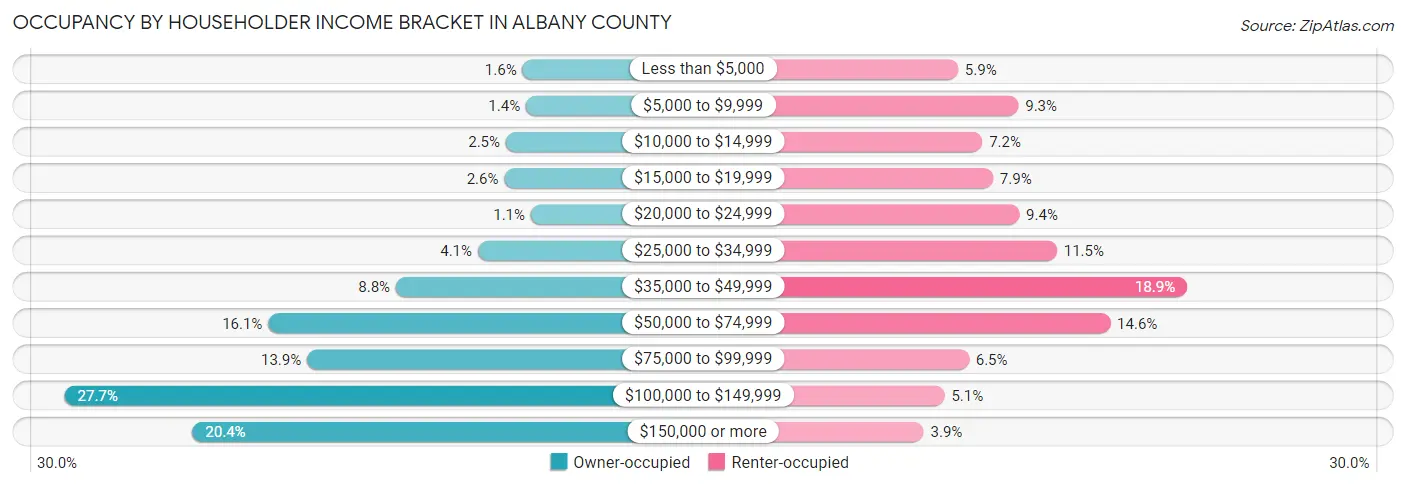
| Income Bracket | Owner-occupied | Renter-occupied |
| Less than $5,000 | 128 (1.5%) | 471 (5.9%) |
| $5,000 to $9,999 | 111 (1.3%) | 749 (9.3%) |
| $10,000 to $14,999 | 206 (2.5%) | 583 (7.2%) |
| $15,000 to $19,999 | 213 (2.6%) | 632 (7.9%) |
| $20,000 to $24,999 | 88 (1.1%) | 753 (9.3%) |
| $25,000 to $34,999 | 338 (4.1%) | 926 (11.5%) |
| $35,000 to $49,999 | 723 (8.8%) | 1,526 (18.9%) |
| $50,000 to $74,999 | 1,324 (16.1%) | 1,172 (14.5%) |
| $75,000 to $99,999 | 1,141 (13.9%) | 521 (6.5%) |
| $100,000 to $149,999 | 2,282 (27.7%) | 409 (5.1%) |
| $150,000 or more | 1,681 (20.4%) | 313 (3.9%) |
| Total | 8,235 (100.0%) | 8,055 (100.0%) |
Monthly Housing Cost Tiers in Albany County
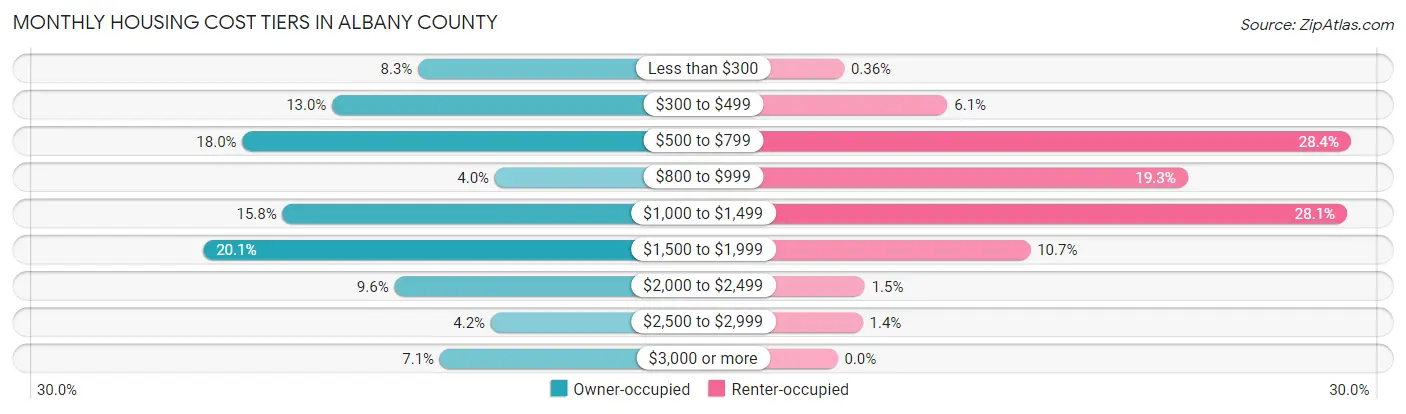
| Monthly Cost | Owner-occupied | Renter-occupied |
| Less than $300 | 680 (8.3%) | 29 (0.4%) |
| $300 to $499 | 1,071 (13.0%) | 489 (6.1%) |
| $500 to $799 | 1,480 (18.0%) | 2,284 (28.4%) |
| $800 to $999 | 331 (4.0%) | 1,558 (19.3%) |
| $1,000 to $1,499 | 1,297 (15.8%) | 2,267 (28.1%) |
| $1,500 to $1,999 | 1,658 (20.1%) | 858 (10.6%) |
| $2,000 to $2,499 | 788 (9.6%) | 122 (1.5%) |
| $2,500 to $2,999 | 349 (4.2%) | 112 (1.4%) |
| $3,000 or more | 581 (7.1%) | 0 (0.0%) |
| Total | 8,235 (100.0%) | 8,055 (100.0%) |
Physical Housing Characteristics in Albany County
Housing Structures in Albany County
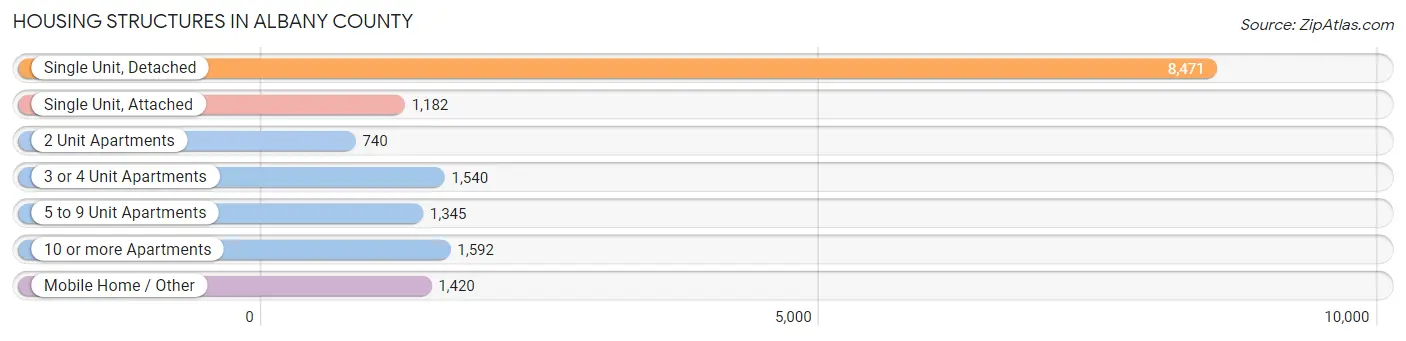
| Structure Type | # Housing Units | % Housing Units |
| Single Unit, Detached | 8,471 | 52.0% |
| Single Unit, Attached | 1,182 | 7.3% |
| 2 Unit Apartments | 740 | 4.5% |
| 3 or 4 Unit Apartments | 1,540 | 9.5% |
| 5 to 9 Unit Apartments | 1,345 | 8.3% |
| 10 or more Apartments | 1,592 | 9.8% |
| Mobile Home / Other | 1,420 | 8.7% |
| Total | 16,290 | 100.0% |
Housing Structures by Occupancy in Albany County
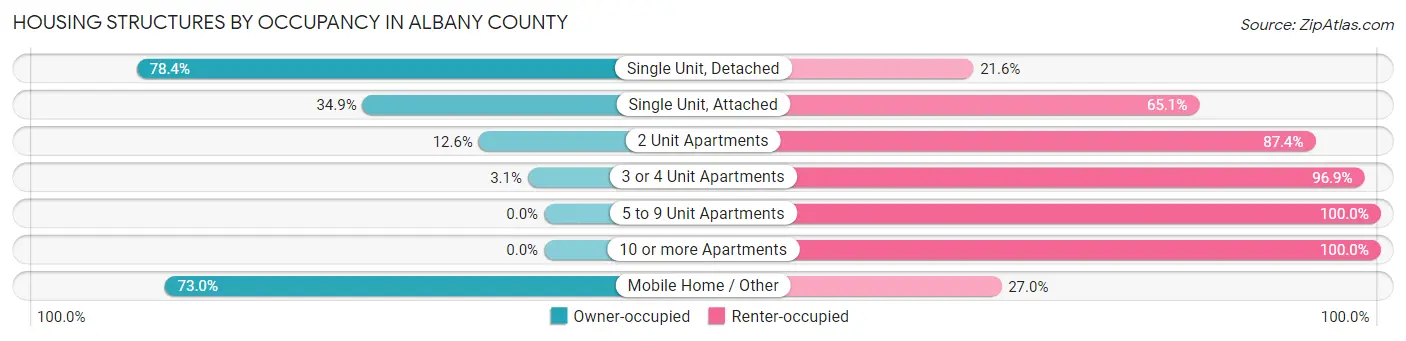
| Structure Type | Owner-occupied | Renter-occupied |
| Single Unit, Detached | 6,644 (78.4%) | 1,827 (21.6%) |
| Single Unit, Attached | 413 (34.9%) | 769 (65.1%) |
| 2 Unit Apartments | 93 (12.6%) | 647 (87.4%) |
| 3 or 4 Unit Apartments | 48 (3.1%) | 1,492 (96.9%) |
| 5 to 9 Unit Apartments | 0 (0.0%) | 1,345 (100.0%) |
| 10 or more Apartments | 0 (0.0%) | 1,592 (100.0%) |
| Mobile Home / Other | 1,037 (73.0%) | 383 (27.0%) |
| Total | 8,235 (50.5%) | 8,055 (49.4%) |
Housing Structures by Number of Rooms in Albany County
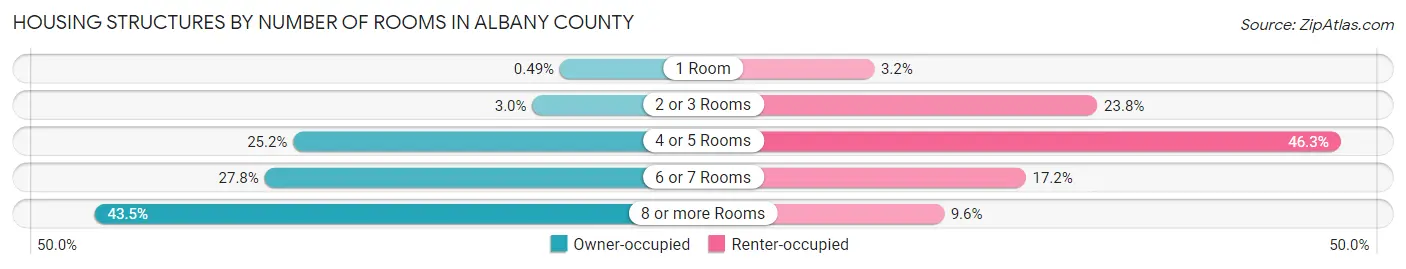
| Number of Rooms | Owner-occupied | Renter-occupied |
| 1 Room | 40 (0.5%) | 254 (3.2%) |
| 2 or 3 Rooms | 250 (3.0%) | 1,916 (23.8%) |
| 4 or 5 Rooms | 2,072 (25.2%) | 3,729 (46.3%) |
| 6 or 7 Rooms | 2,289 (27.8%) | 1,383 (17.2%) |
| 8 or more Rooms | 3,584 (43.5%) | 773 (9.6%) |
| Total | 8,235 (100.0%) | 8,055 (100.0%) |
Housing Structure by Heating Type in Albany County

| Heating Type | Owner-occupied | Renter-occupied |
| Utility Gas | 5,861 (71.2%) | 3,868 (48.0%) |
| Bottled, Tank, or LP Gas | 563 (6.8%) | 308 (3.8%) |
| Electricity | 1,110 (13.5%) | 3,632 (45.1%) |
| Fuel Oil or Kerosene | 37 (0.4%) | 0 (0.0%) |
| Coal or Coke | 0 (0.0%) | 0 (0.0%) |
| All other Fuels | 624 (7.6%) | 172 (2.1%) |
| No Fuel Used | 40 (0.5%) | 75 (0.9%) |
| Total | 8,235 (100.0%) | 8,055 (100.0%) |
Household Vehicle Usage in Albany County
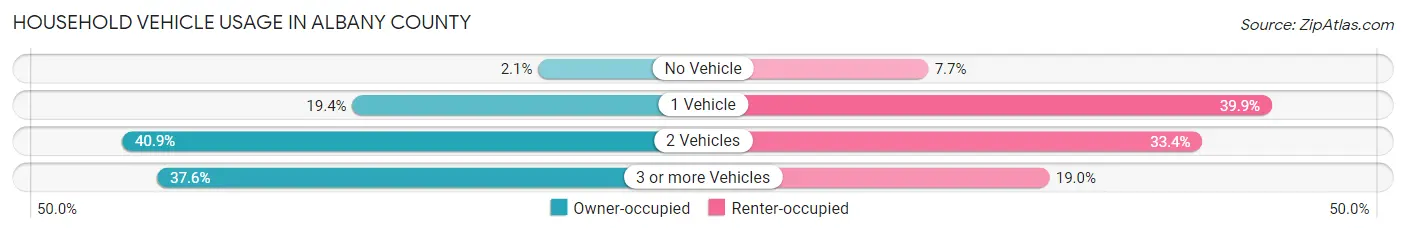
| Vehicles per Household | Owner-occupied | Renter-occupied |
| No Vehicle | 169 (2.1%) | 623 (7.7%) |
| 1 Vehicle | 1,598 (19.4%) | 3,211 (39.9%) |
| 2 Vehicles | 3,369 (40.9%) | 2,688 (33.4%) |
| 3 or more Vehicles | 3,099 (37.6%) | 1,533 (19.0%) |
| Total | 8,235 (100.0%) | 8,055 (100.0%) |
Real Estate & Mortgages in Albany County
Real Estate and Mortgage Overview in Albany County
| Characteristic | Without Mortgage | With Mortgage |
| Housing Units | 3,342 | 4,893 |
| Median Property Value | $253,400 | $315,300 |
| Median Household Income | $66,940 | $1,156 |
| Monthly Housing Costs | $490 | $576 |
| Real Estate Taxes | $1,456 | $107 |
Property Value by Mortgage Status in Albany County
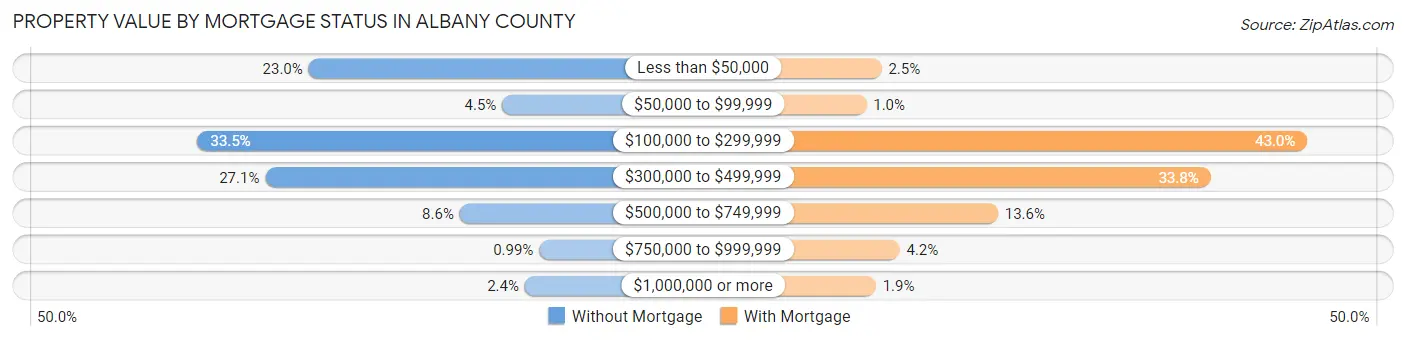
| Property Value | Without Mortgage | With Mortgage |
| Less than $50,000 | 767 (23.0%) | 121 (2.5%) |
| $50,000 to $99,999 | 151 (4.5%) | 50 (1.0%) |
| $100,000 to $299,999 | 1,121 (33.5%) | 2,105 (43.0%) |
| $300,000 to $499,999 | 905 (27.1%) | 1,655 (33.8%) |
| $500,000 to $749,999 | 286 (8.6%) | 663 (13.6%) |
| $750,000 to $999,999 | 33 (1.0%) | 205 (4.2%) |
| $1,000,000 or more | 79 (2.4%) | 94 (1.9%) |
| Total | 3,342 (100.0%) | 4,893 (100.0%) |
Household Income by Mortgage Status in Albany County
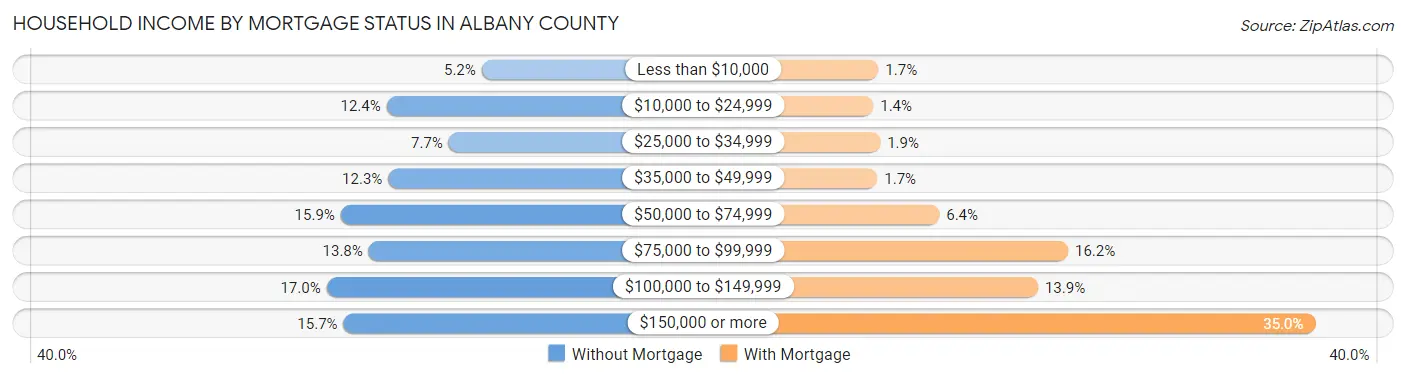
| Household Income | Without Mortgage | With Mortgage |
| Less than $10,000 | 173 (5.2%) | 85 (1.7%) |
| $10,000 to $24,999 | 415 (12.4%) | 66 (1.3%) |
| $25,000 to $34,999 | 257 (7.7%) | 92 (1.9%) |
| $35,000 to $49,999 | 411 (12.3%) | 81 (1.7%) |
| $50,000 to $74,999 | 532 (15.9%) | 312 (6.4%) |
| $75,000 to $99,999 | 461 (13.8%) | 792 (16.2%) |
| $100,000 to $149,999 | 568 (17.0%) | 680 (13.9%) |
| $150,000 or more | 525 (15.7%) | 1,714 (35.0%) |
| Total | 3,342 (100.0%) | 4,893 (100.0%) |
Property Value to Household Income Ratio in Albany County
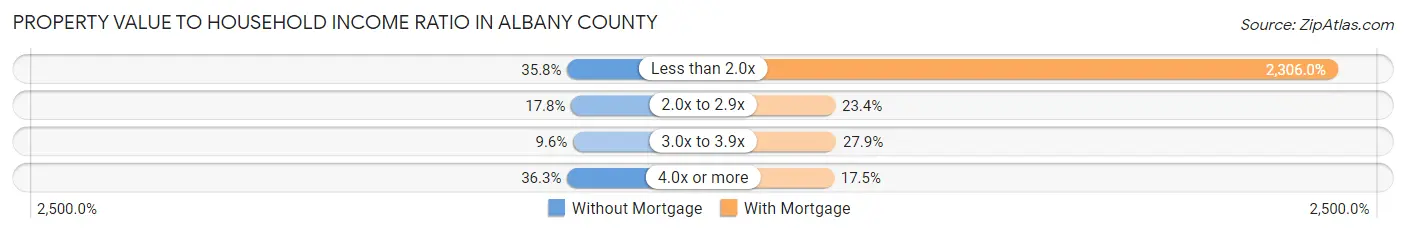
| Value-to-Income Ratio | Without Mortgage | With Mortgage |
| Less than 2.0x | 1,197 (35.8%) | 112,832 (2,306.0%) |
| 2.0x to 2.9x | 594 (17.8%) | 1,143 (23.4%) |
| 3.0x to 3.9x | 322 (9.6%) | 1,365 (27.9%) |
| 4.0x or more | 1,214 (36.3%) | 858 (17.5%) |
| Total | 3,342 (100.0%) | 4,893 (100.0%) |
Real Estate Taxes by Mortgage Status in Albany County
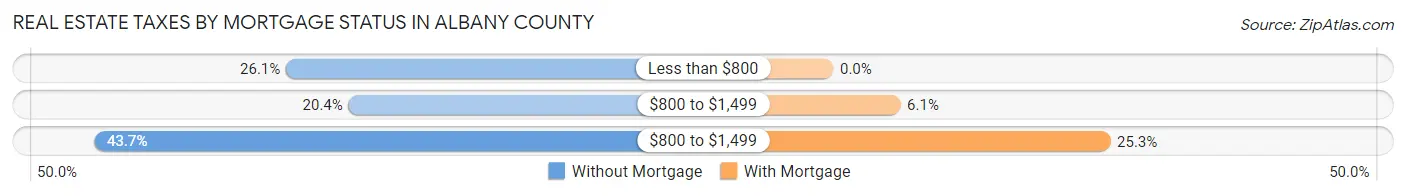
| Property Taxes | Without Mortgage | With Mortgage |
| Less than $800 | 873 (26.1%) | 0 (0.0%) |
| $800 to $1,499 | 682 (20.4%) | 300 (6.1%) |
| $800 to $1,499 | 1,459 (43.7%) | 1,238 (25.3%) |
| Total | 3,342 (100.0%) | 4,893 (100.0%) |
Health & Disability in Albany County
Health Insurance Coverage by Age in Albany County
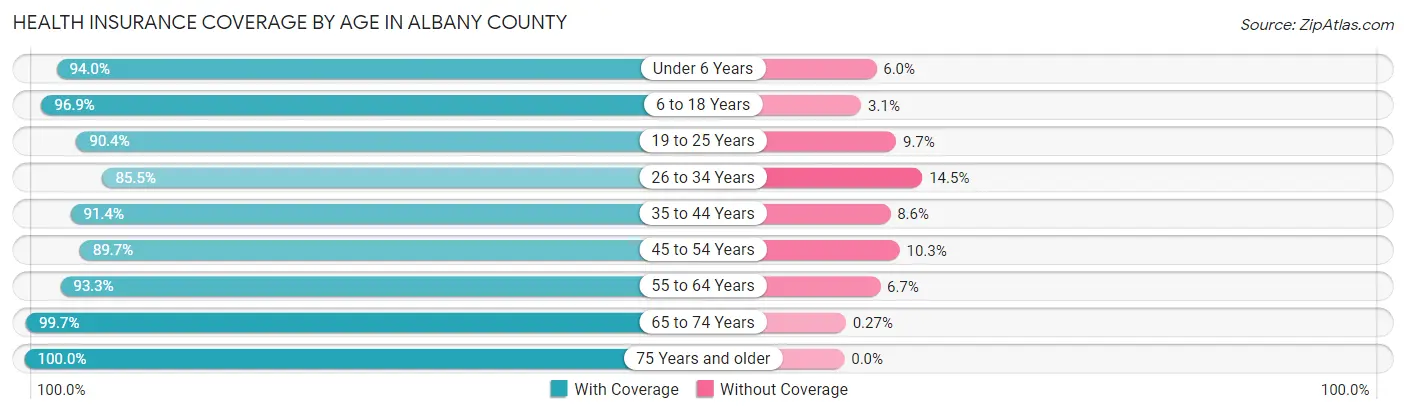
| Age Bracket | With Coverage | Without Coverage |
| Under 6 Years | 1,735 (94.0%) | 110 (6.0%) |
| 6 to 18 Years | 4,783 (96.9%) | 155 (3.1%) |
| 19 to 25 Years | 9,335 (90.3%) | 997 (9.7%) |
| 26 to 34 Years | 4,587 (85.5%) | 780 (14.5%) |
| 35 to 44 Years | 3,658 (91.4%) | 343 (8.6%) |
| 45 to 54 Years | 2,578 (89.7%) | 296 (10.3%) |
| 55 to 64 Years | 3,099 (93.3%) | 221 (6.7%) |
| 65 to 74 Years | 2,982 (99.7%) | 8 (0.3%) |
| 75 Years and older | 1,657 (100.0%) | 0 (0.0%) |
| Total | 34,414 (92.2%) | 2,910 (7.8%) |
Health Insurance Coverage by Citizenship Status in Albany County
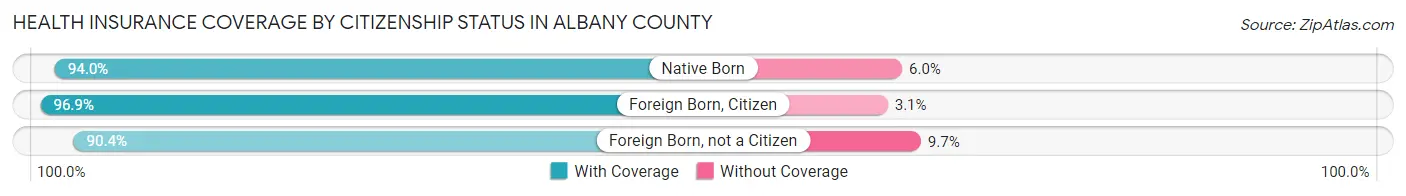
| Citizenship Status | With Coverage | Without Coverage |
| Native Born | 1,735 (94.0%) | 110 (6.0%) |
| Foreign Born, Citizen | 4,783 (96.9%) | 155 (3.1%) |
| Foreign Born, not a Citizen | 9,335 (90.3%) | 997 (9.7%) |
Health Insurance Coverage by Household Income in Albany County

| Household Income | With Coverage | Without Coverage |
| Under $25,000 | 5,550 (87.4%) | 800 (12.6%) |
| $25,000 to $49,999 | 5,857 (89.8%) | 667 (10.2%) |
| $50,000 to $74,999 | 4,819 (87.9%) | 662 (12.1%) |
| $75,000 to $99,999 | 3,760 (95.5%) | 179 (4.5%) |
| $100,000 and over | 12,264 (96.1%) | 492 (3.9%) |
Public vs Private Health Insurance Coverage by Age in Albany County

| Age Bracket | Public Insurance | Private Insurance |
| Under 6 | 606 (32.9%) | 1,144 (62.0%) |
| 6 to 18 Years | 667 (13.5%) | 4,278 (86.6%) |
| 19 to 25 Years | 395 (3.8%) | 9,132 (88.4%) |
| 25 to 34 Years | 572 (10.7%) | 4,200 (78.3%) |
| 35 to 44 Years | 343 (8.6%) | 3,402 (85.0%) |
| 45 to 54 Years | 247 (8.6%) | 2,458 (85.5%) |
| 55 to 64 Years | 512 (15.4%) | 2,776 (83.6%) |
| 65 to 74 Years | 2,848 (95.3%) | 1,918 (64.1%) |
| 75 Years and over | 1,643 (99.2%) | 1,001 (60.4%) |
| Total | 7,833 (21.0%) | 30,309 (81.2%) |
Disability Status by Sex by Age in Albany County
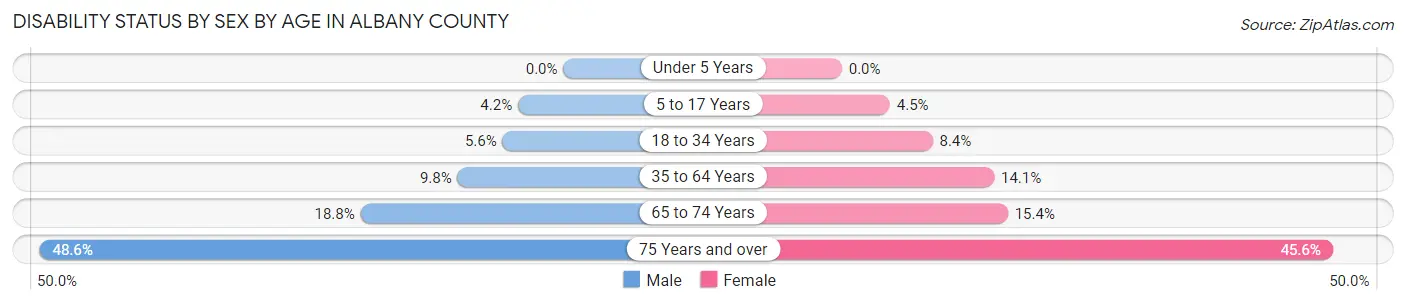
| Age Bracket | Male | Female |
| Under 5 Years | 0 (0.0%) | 0 (0.0%) |
| 5 to 17 Years | 84 (4.2%) | 96 (4.5%) |
| 18 to 34 Years | 510 (5.6%) | 646 (8.4%) |
| 35 to 64 Years | 518 (9.8%) | 695 (14.1%) |
| 65 to 74 Years | 300 (18.8%) | 215 (15.4%) |
| 75 Years and over | 351 (48.6%) | 426 (45.6%) |
Disability Class by Sex by Age in Albany County
Disability Class: Hearing Difficulty
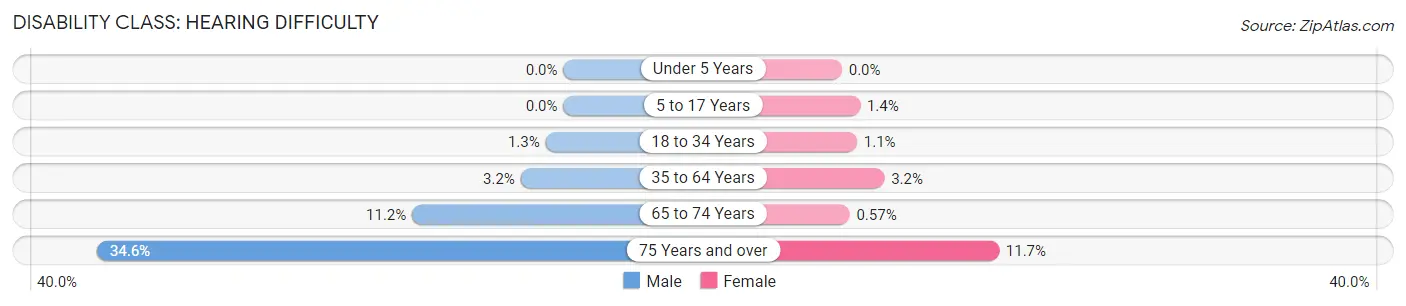
| Age Bracket | Male | Female |
| Under 5 Years | 0 (0.0%) | 0 (0.0%) |
| 5 to 17 Years | 0 (0.0%) | 29 (1.3%) |
| 18 to 34 Years | 119 (1.3%) | 86 (1.1%) |
| 35 to 64 Years | 167 (3.2%) | 155 (3.2%) |
| 65 to 74 Years | 179 (11.2%) | 8 (0.6%) |
| 75 Years and over | 250 (34.6%) | 109 (11.7%) |
Disability Class: Vision Difficulty
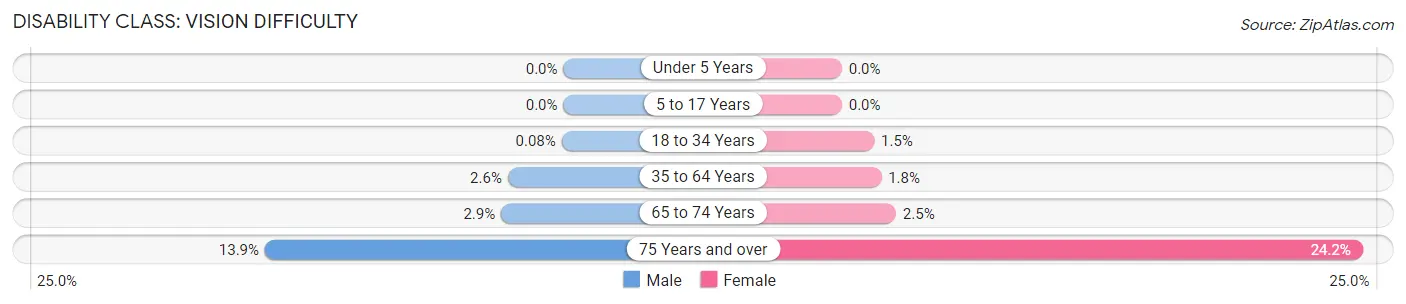
| Age Bracket | Male | Female |
| Under 5 Years | 0 (0.0%) | 0 (0.0%) |
| 5 to 17 Years | 0 (0.0%) | 0 (0.0%) |
| 18 to 34 Years | 7 (0.1%) | 115 (1.5%) |
| 35 to 64 Years | 136 (2.6%) | 90 (1.8%) |
| 65 to 74 Years | 46 (2.9%) | 35 (2.5%) |
| 75 Years and over | 100 (13.9%) | 226 (24.2%) |
Disability Class: Cognitive Difficulty
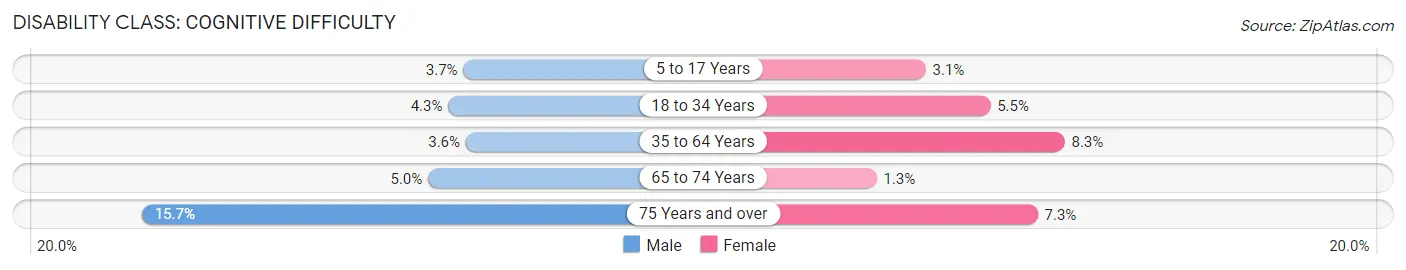
| Age Bracket | Male | Female |
| 5 to 17 Years | 74 (3.7%) | 67 (3.1%) |
| 18 to 34 Years | 386 (4.3%) | 423 (5.5%) |
| 35 to 64 Years | 191 (3.6%) | 407 (8.3%) |
| 65 to 74 Years | 80 (5.0%) | 18 (1.3%) |
| 75 Years and over | 113 (15.7%) | 68 (7.3%) |
Disability Class: Ambulatory Difficulty
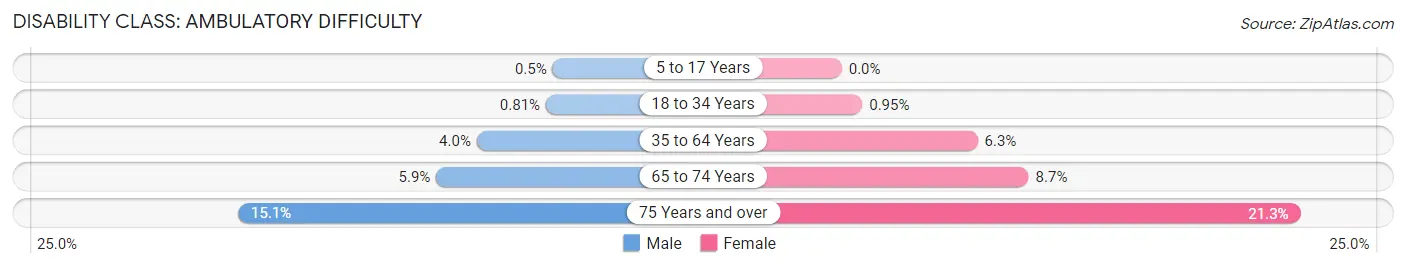
| Age Bracket | Male | Female |
| 5 to 17 Years | 10 (0.5%) | 0 (0.0%) |
| 18 to 34 Years | 73 (0.8%) | 73 (0.9%) |
| 35 to 64 Years | 212 (4.0%) | 310 (6.3%) |
| 65 to 74 Years | 94 (5.9%) | 121 (8.7%) |
| 75 Years and over | 109 (15.1%) | 199 (21.3%) |
Disability Class: Self-Care Difficulty
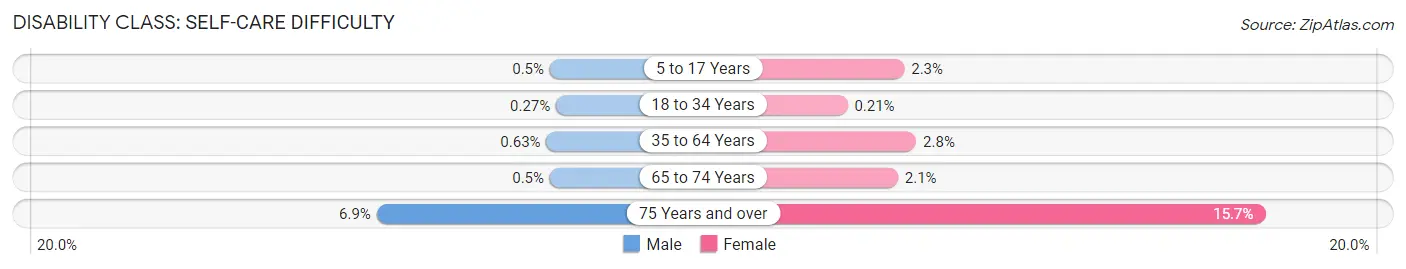
| Age Bracket | Male | Female |
| 5 to 17 Years | 10 (0.5%) | 50 (2.3%) |
| 18 to 34 Years | 24 (0.3%) | 16 (0.2%) |
| 35 to 64 Years | 33 (0.6%) | 136 (2.8%) |
| 65 to 74 Years | 8 (0.5%) | 29 (2.1%) |
| 75 Years and over | 50 (6.9%) | 147 (15.7%) |
Technology Access in Albany County
Computing Device Access in Albany County
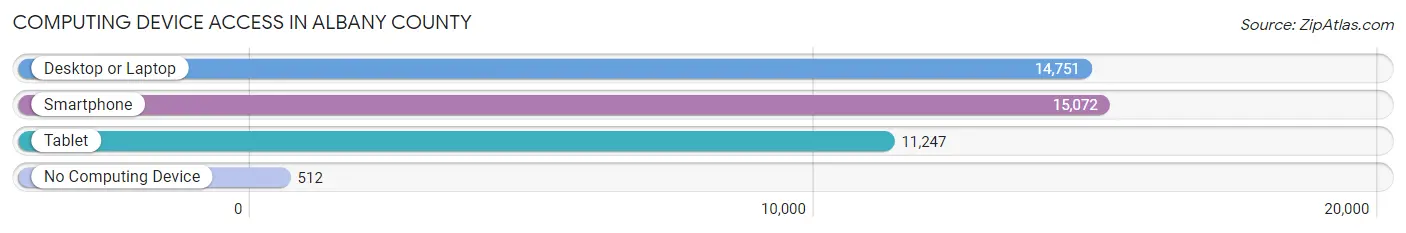
| Device Type | # Households | % Households |
| Desktop or Laptop | 14,751 | 90.5% |
| Smartphone | 15,072 | 92.5% |
| Tablet | 11,247 | 69.0% |
| No Computing Device | 512 | 3.1% |
| Total | 16,290 | 100.0% |
Internet Access in Albany County
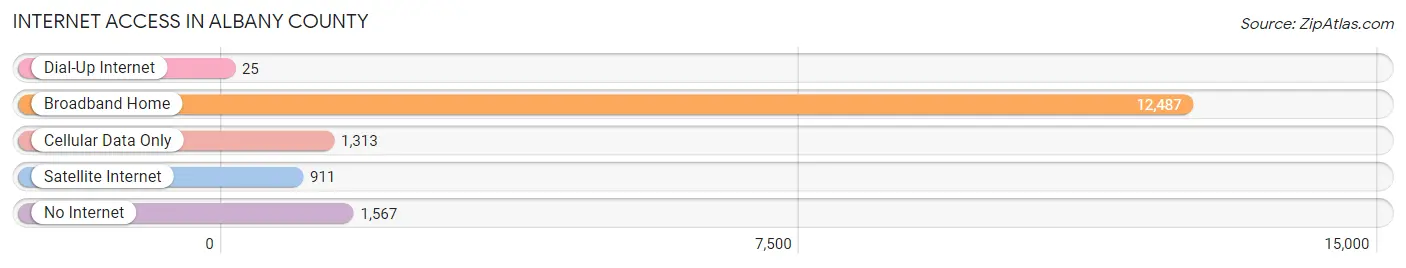
| Internet Type | # Households | % Households |
| Dial-Up Internet | 25 | 0.2% |
| Broadband Home | 12,487 | 76.6% |
| Cellular Data Only | 1,313 | 8.1% |
| Satellite Internet | 911 | 5.6% |
| No Internet | 1,567 | 9.6% |
| Total | 16,290 | 100.0% |
Albany County Summary
Albany County, Wyoming is located in the southeastern corner of the state and is bordered by Laramie County to the north, Carbon County to the east, and Converse County to the south. The county seat is Laramie, the home of the University of Wyoming. Albany County is the fifth largest county in Wyoming, covering an area of 2,521 square miles.
Geography
Albany County is located in the southeastern corner of Wyoming and is bordered by Laramie County to the north, Carbon County to the east, and Converse County to the south. The county is located in the Laramie Range of the Rocky Mountains and is home to the Medicine Bow National Forest. The county is also home to the Snowy Range, which is a popular destination for skiing and snowmobiling. The county is also home to the Laramie River, which is a popular destination for fishing and rafting.
The county is divided into two distinct regions: the Laramie Plains and the Snowy Range. The Laramie Plains are located in the northern part of the county and are characterized by rolling hills and grasslands. The Snowy Range is located in the southern part of the county and is characterized by rugged mountains and forests.
Economy
Albany County is home to a diverse economy. The county is home to a variety of industries, including agriculture, manufacturing, energy, and tourism. Agriculture is the largest industry in the county, with the majority of the land being used for cattle and sheep ranching. Manufacturing is also an important part of the economy, with the county being home to several factories that produce a variety of products, including furniture, clothing, and electronics.
Energy is also an important part of the economy, with the county being home to several oil and gas fields. Tourism is also an important part of the economy, with the county being home to several popular tourist destinations, including the Snowy Range, Medicine Bow National Forest, and the Laramie River.
Demographics
As of the 2010 census, Albany County had a population of 36,299. The population is spread out with a median age of 36.7 years. The racial makeup of the county is 91.2% White, 2.3% Native American, 1.2% Asian, 0.7% Black or African American, 0.2% Pacific Islander, and 4.5% from two or more races. The population is also spread out with a gender ratio of 49.7% male and 50.3% female.
The median household income in the county is $50,945 and the median family income is $62,917. The per capita income in the county is $25,945. The poverty rate in the county is 11.2%.
Conclusion
Albany County, Wyoming is located in the southeastern corner of the state and is bordered by Laramie County to the north, Carbon County to the east, and Converse County to the south. The county is home to a diverse economy, with agriculture, manufacturing, energy, and tourism being the main industries. The county is also home to a population of 36,299, with a median age of 36.7 years. The median household income in the county is $50,945 and the median family income is $62,917. The poverty rate in the county is 11.2%.
Common Questions
What is the Total Population of Albany County?
Total Population of Albany County is 37,525.
What is the Total Male Population of Albany County?
Total Male Population of Albany County is 19,594.
What is the Total Female Population of Albany County?
Total Female Population of Albany County is 17,931.
What is the Ratio of Males per 100 Females in Albany County?
There are 109.27 Males per 100 Females in Albany County.
What is the Ratio of Females per 100 Males in Albany County?
There are 91.51 Females per 100 Males in Albany County.
What is the Median Population Age in Albany County?
Median Population Age in Albany County is 28.3 Years.
What is the Average Family Size in Albany County
Average Family Size in Albany County is 2.7 People.
What is the Average Household Size in Albany County
Average Household Size in Albany County is 2.1 People.
What is Per Capita Income in Albany County?
Per Capita income in Albany County is $34,969.
What is the Median Family Income in Albany County?
Median Family Income in Albany County is $92,023.
What is the Median Household income in Albany County?
Median Household Income in Albany County is $55,887.
What is Income or Wage Gap in Albany County?
Income or Wage Gap in Albany County is 35.7%.
Women in Albany County earn 64.3 cents for every dollar earned by a man.
What is Family Income Deficit in Albany County?
Family Income Deficit in Albany County is $7,666.
Families that are below poverty line in Albany County earn $7,666 less on average than the poverty threshold level.
What is Inequality or Gini Index in Albany County?
Inequality or Gini Index in Albany County is 0.48.
How Large is the Labor Force in Albany County?
There are 22,101 People in the Labor Forcein in Albany County.
What is the Percentage of People in the Labor Force in Albany County?
68.4% of People are in the Labor Force in Albany County.
What is the Unemployment Rate in Albany County?
Unemployment Rate in Albany County is 4.4%.