Zip Codes with the Highest Percentage of Population Employed in Accommodation & Food Services in Huntington, WV
RELATED REPORTS & OPTIONS
Accommodation & Food Services
Huntington
Compare Zip Codes
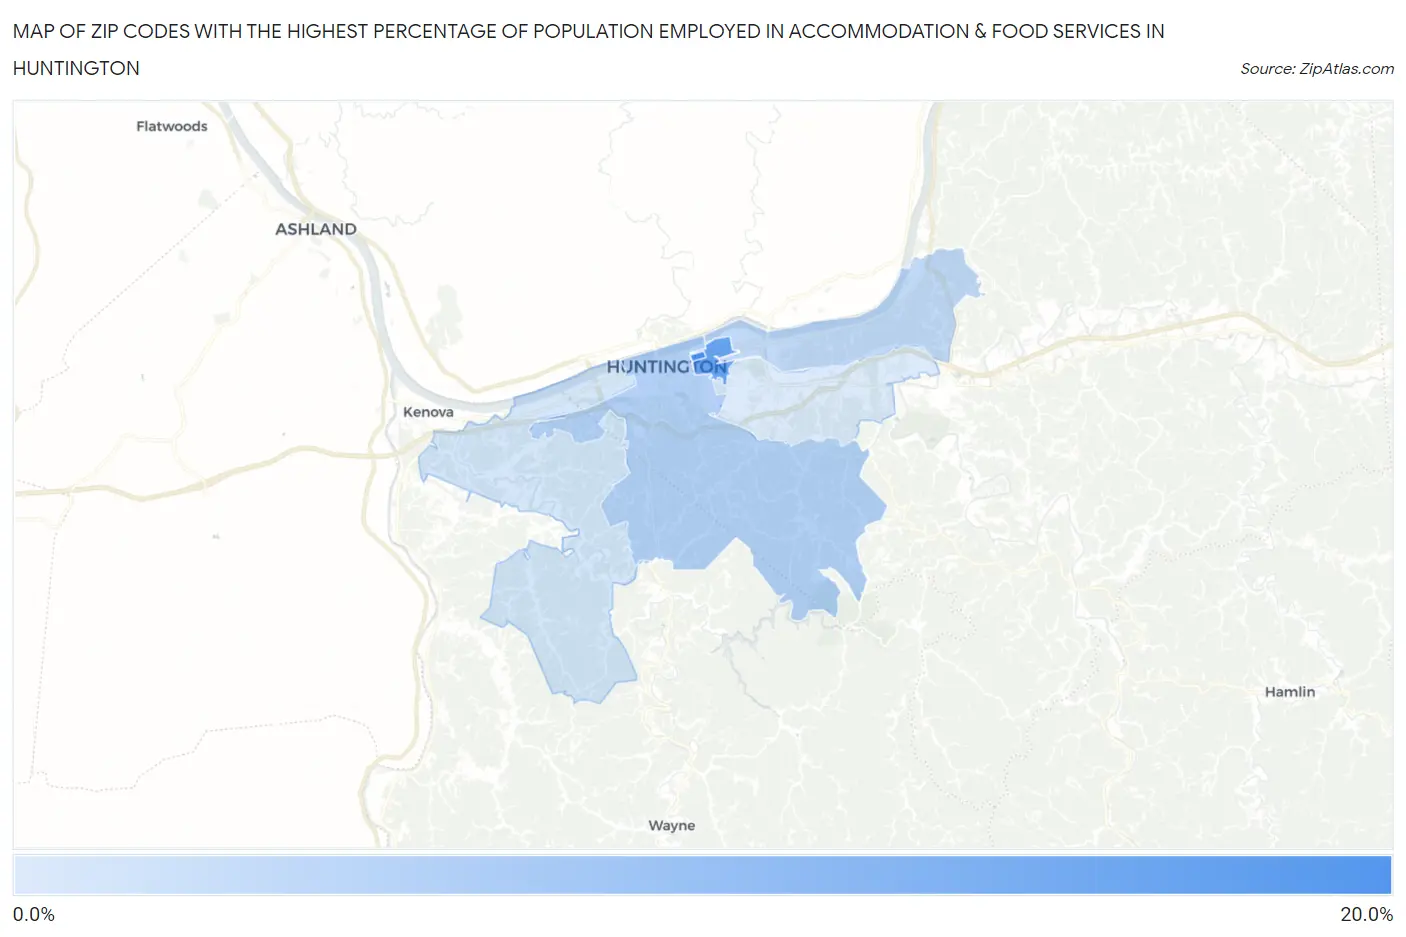
Map of Zip Codes with the Highest Percentage of Population Employed in Accommodation & Food Services in Huntington
0.0%
20.0%
Zip Codes with the Highest Percentage of Population Employed in Accommodation & Food Services in Huntington, WV
| Zip Code | % Employed | vs State | vs National | |
| 1. | 25755 | 19.9% | 7.1%(+12.8)#47 | 6.9%(+13.0)#845 |
| 2. | 25703 | 17.1% | 7.1%(+10.1)#65 | 6.9%(+10.3)#1,238 |
| 3. | 25701 | 10.8% | 7.1%(+3.71)#113 | 6.9%(+3.91)#3,725 |
| 4. | 25702 | 9.8% | 7.1%(+2.72)#135 | 6.9%(+2.91)#4,807 |
| 5. | 25704 | 8.2% | 7.1%(+1.10)#160 | 6.9%(+1.30)#7,470 |
| 6. | 25705 | 7.6% | 7.1%(+0.484)#182 | 6.9%(+0.681)#8,825 |
1
Common Questions
What are the Top 5 Zip Codes with the Highest Percentage of Population Employed in Accommodation & Food Services in Huntington, WV?
Top 5 Zip Codes with the Highest Percentage of Population Employed in Accommodation & Food Services in Huntington, WV are:
What zip code has the Highest Percentage of Population Employed in Accommodation & Food Services in Huntington, WV?
25755 has the Highest Percentage of Population Employed in Accommodation & Food Services in Huntington, WV with 19.9%.
What is the Percentage of Population Employed in Accommodation & Food Services in Huntington, WV?
Percentage of Population Employed in Accommodation & Food Services in Huntington is 12.0%.
What is the Percentage of Population Employed in Accommodation & Food Services in West Virginia?
Percentage of Population Employed in Accommodation & Food Services in West Virginia is 7.1%.
What is the Percentage of Population Employed in Accommodation & Food Services in the United States?
Percentage of Population Employed in Accommodation & Food Services in the United States is 6.9%.