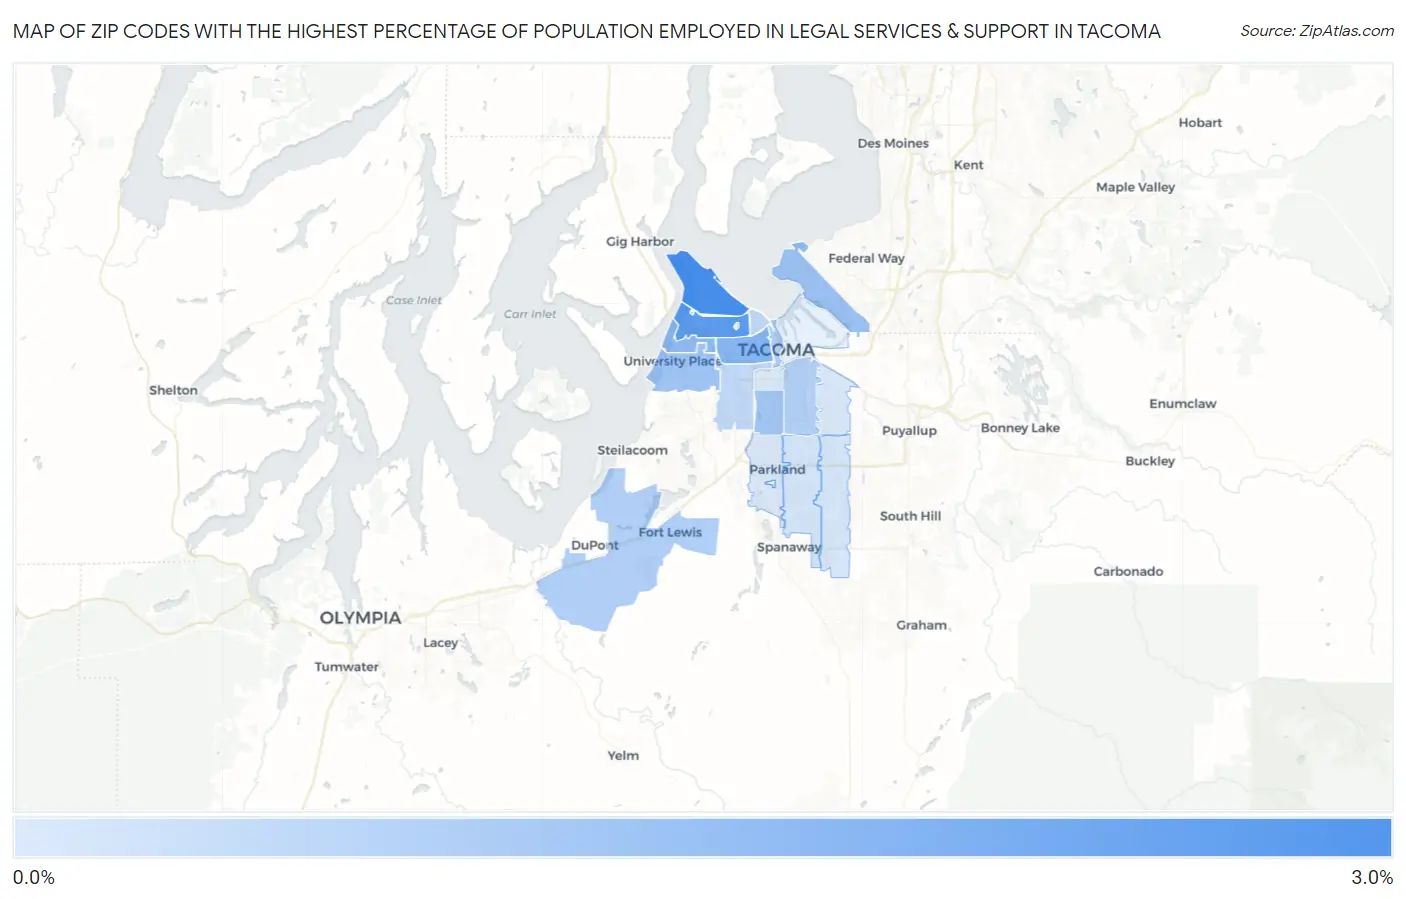
Zip Codes with the Highest Percentage of Population Employed in Legal Services & Support in Tacoma, WA
RELATED REPORTS & OPTIONS
Legal Services & Support
Tacoma
Compare Zip Codes
Map of Zip Codes with the Highest Percentage of Population Employed in Legal Services & Support in Tacoma
0.0%
3.0%
Zip Codes with the Highest Percentage of Population Employed in Legal Services & Support in Tacoma, WA
| Zip Code | % Employed | vs State | vs National | |
| 1. | 98407 | 2.9% | 1.1%(+1.83)#34 | 1.2%(+1.72)#1,966 |
| 2. | 98406 | 2.6% | 1.1%(+1.48)#41 | 1.2%(+1.37)#2,432 |
| 3. | 98405 | 1.7% | 1.1%(+0.645)#87 | 1.2%(+0.536)#4,254 |
| 4. | 98465 | 1.5% | 1.1%(+0.462)#102 | 1.2%(+0.353)#4,898 |
| 5. | 98422 | 1.4% | 1.1%(+0.304)#112 | 1.2%(+0.194)#5,574 |
| 6. | 98466 | 1.2% | 1.1%(+0.162)#125 | 1.2%(+0.053)#6,286 |
| 7. | 98408 | 1.2% | 1.1%(+0.118)#133 | 1.2%(+0.009)#6,543 |
| 8. | 98402 | 0.95% | 1.1%(-0.121)#173 | 1.2%(-0.230)#8,179 |
| 9. | 98433 | 0.93% | 1.1%(-0.142)#181 | 1.2%(-0.251)#8,334 |
| 10. | 98404 | 0.89% | 1.1%(-0.183)#193 | 1.2%(-0.293)#8,683 |
| 11. | 98403 | 0.67% | 1.1%(-0.405)#250 | 1.2%(-0.515)#10,741 |
| 12. | 98409 | 0.65% | 1.1%(-0.423)#255 | 1.2%(-0.533)#10,931 |
| 13. | 98445 | 0.30% | 1.1%(-0.772)#324 | 1.2%(-0.881)#14,999 |
| 14. | 98446 | 0.26% | 1.1%(-0.816)#329 | 1.2%(-0.925)#15,531 |
| 15. | 98444 | 0.18% | 1.1%(-0.890)#345 | 1.2%(-0.999)#16,355 |
| 16. | 98443 | 0.18% | 1.1%(-0.895)#347 | 1.2%(-1.00)#16,410 |
| 17. | 98418 | 0.14% | 1.1%(-0.934)#352 | 1.2%(-1.04)#16,780 |
1
Common Questions
What are the Top 10 Zip Codes with the Highest Percentage of Population Employed in Legal Services & Support in Tacoma, WA?
Top 10 Zip Codes with the Highest Percentage of Population Employed in Legal Services & Support in Tacoma, WA are:
What zip code has the Highest Percentage of Population Employed in Legal Services & Support in Tacoma, WA?
98407 has the Highest Percentage of Population Employed in Legal Services & Support in Tacoma, WA with 2.9%.
What is the Percentage of Population Employed in Legal Services & Support in Tacoma, WA?
Percentage of Population Employed in Legal Services & Support in Tacoma is 1.3%.
What is the Percentage of Population Employed in Legal Services & Support in Washington?
Percentage of Population Employed in Legal Services & Support in Washington is 1.1%.
What is the Percentage of Population Employed in Legal Services & Support in the United States?
Percentage of Population Employed in Legal Services & Support in the United States is 1.2%.