Zip Codes with the Highest Percentage of Population Employed in Agriculture, Fishing & Hunting in Sammamish, WA
RELATED REPORTS & OPTIONS
Agriculture, Fishing & Hunting
Sammamish
Compare Zip Codes
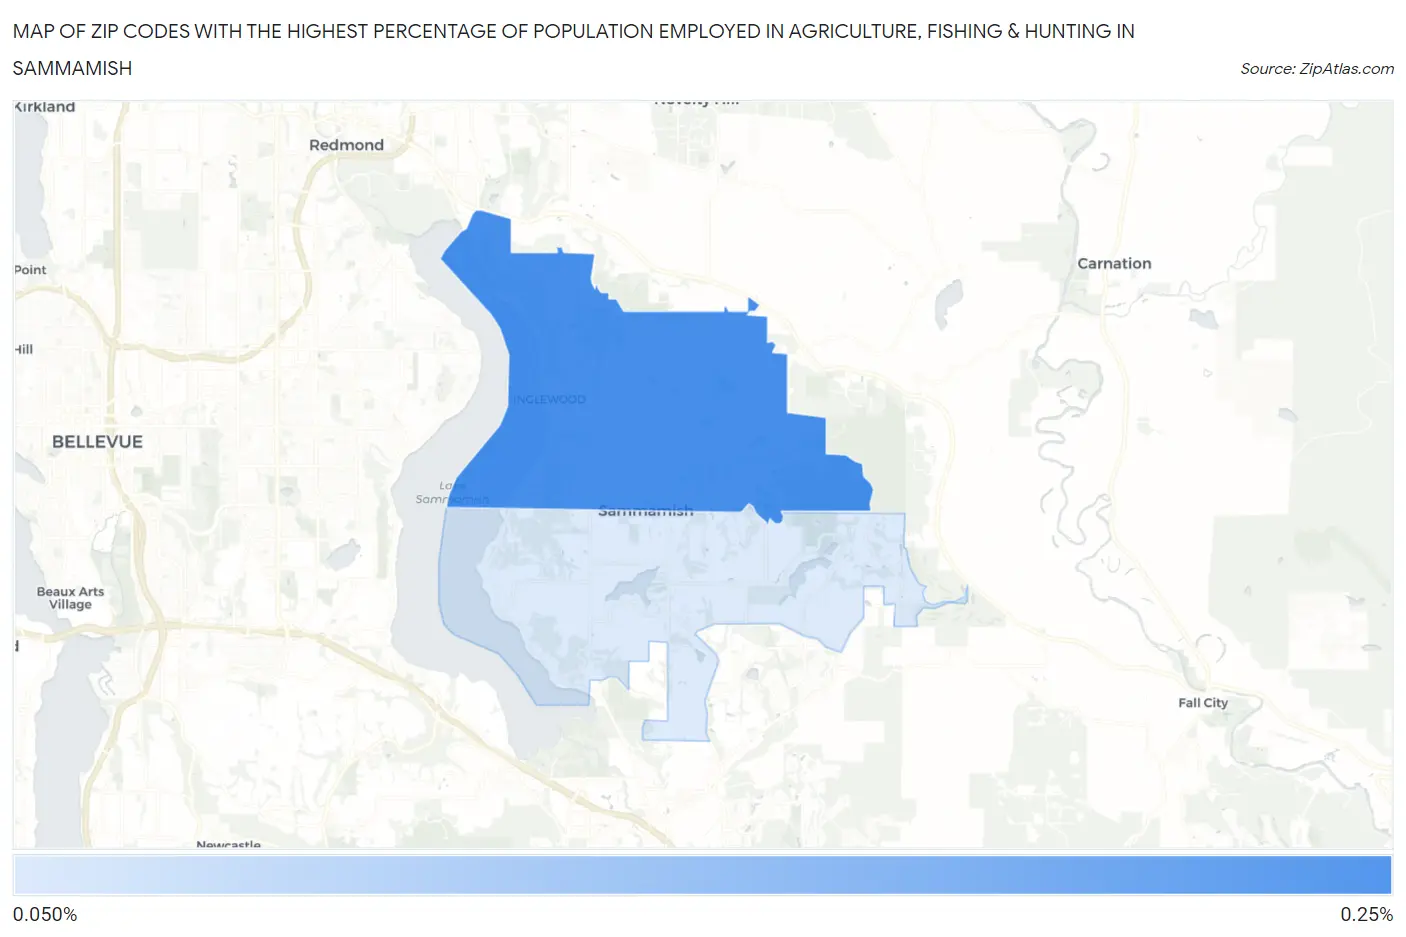
Map of Zip Codes with the Highest Percentage of Population Employed in Agriculture, Fishing & Hunting in Sammamish
0.0%
0.25%
Zip Codes with the Highest Percentage of Population Employed in Agriculture, Fishing & Hunting in Sammamish, WA
| Zip Code | % Employed | vs State | vs National | |
| 1. | 98074 | 0.24% | 2.4%(-2.15)#464 | 1.2%(-0.958)#21,861 |
| 2. | 98075 | 0.086% | 2.4%(-2.30)#500 | 1.2%(-1.11)#23,871 |
1
Common Questions
What are the Top Zip Codes with the Highest Percentage of Population Employed in Agriculture, Fishing & Hunting in Sammamish, WA?
Top Zip Codes with the Highest Percentage of Population Employed in Agriculture, Fishing & Hunting in Sammamish, WA are:
What zip code has the Highest Percentage of Population Employed in Agriculture, Fishing & Hunting in Sammamish, WA?
98074 has the Highest Percentage of Population Employed in Agriculture, Fishing & Hunting in Sammamish, WA with 0.24%.
What is the Percentage of Population Employed in Agriculture, Fishing & Hunting in Sammamish, WA?
Percentage of Population Employed in Agriculture, Fishing & Hunting in Sammamish is 0.19%.
What is the Percentage of Population Employed in Agriculture, Fishing & Hunting in Washington?
Percentage of Population Employed in Agriculture, Fishing & Hunting in Washington is 2.4%.
What is the Percentage of Population Employed in Agriculture, Fishing & Hunting in the United States?
Percentage of Population Employed in Agriculture, Fishing & Hunting in the United States is 1.2%.