Zip Codes with the Highest Percentage of Population Employed in Agriculture, Fishing & Hunting in Tyler, TX
RELATED REPORTS & OPTIONS
Agriculture, Fishing & Hunting
Tyler
Compare Zip Codes
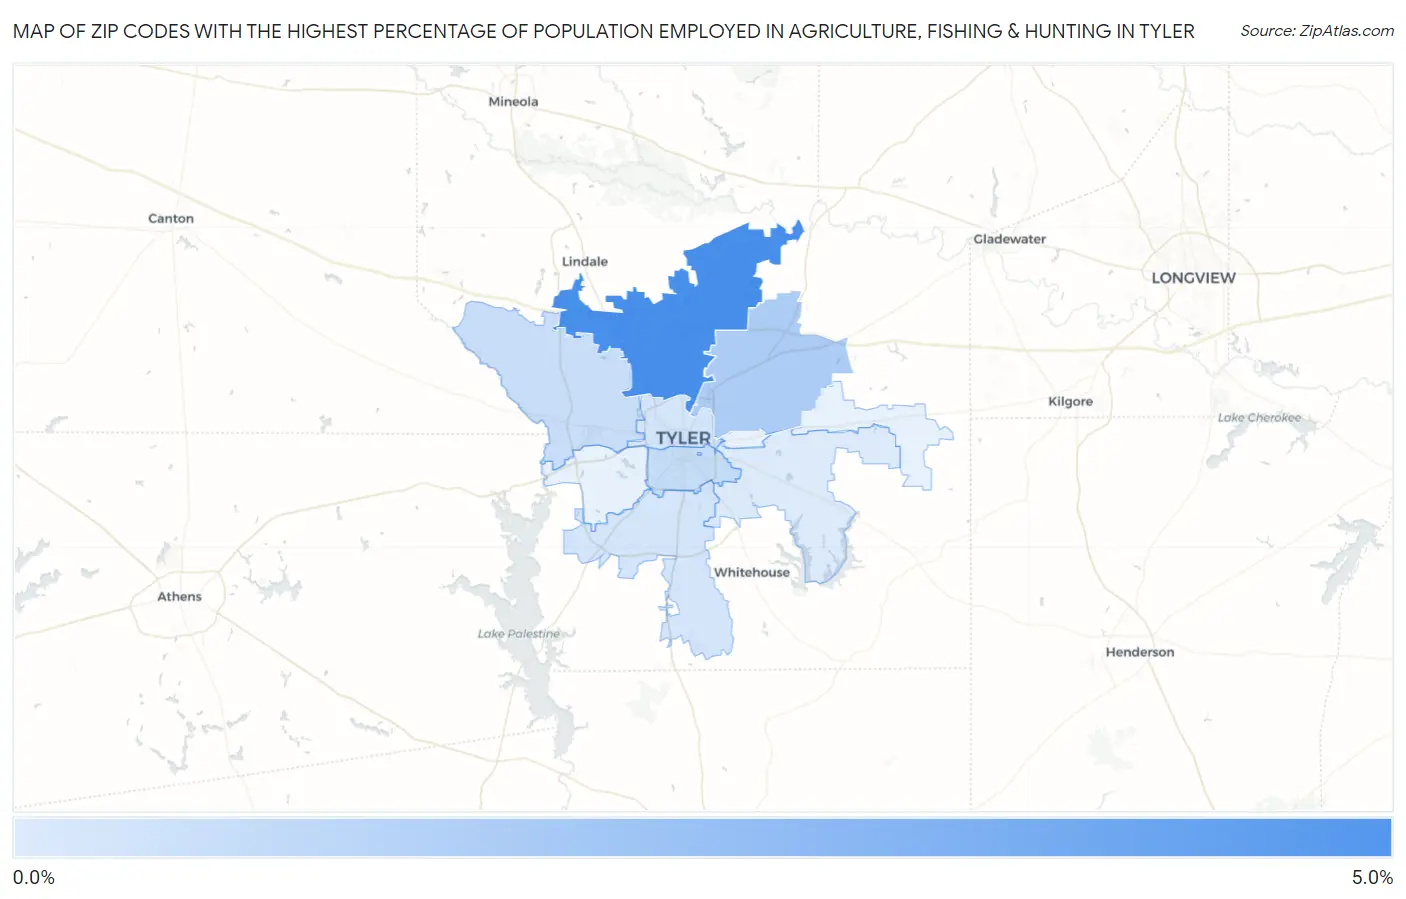
Map of Zip Codes with the Highest Percentage of Population Employed in Agriculture, Fishing & Hunting in Tyler
0.0%
5.0%
Zip Codes with the Highest Percentage of Population Employed in Agriculture, Fishing & Hunting in Tyler, TX
| Zip Code | % Employed | vs State | vs National | |
| 1. | 75706 | 4.4% | 0.75%(+3.64)#452 | 1.2%(+3.19)#8,524 |
| 2. | 75708 | 1.5% | 0.75%(+0.707)#768 | 1.2%(+0.259)#14,450 |
| 3. | 75701 | 0.72% | 0.75%(-0.036)#944 | 1.2%(-0.484)#17,757 |
| 4. | 75704 | 0.68% | 0.75%(-0.071)#952 | 1.2%(-0.519)#17,951 |
| 5. | 75702 | 0.36% | 0.75%(-0.394)#1,125 | 1.2%(-0.842)#20,574 |
| 6. | 75703 | 0.33% | 0.75%(-0.425)#1,138 | 1.2%(-0.873)#20,882 |
| 7. | 75707 | 0.069% | 0.75%(-0.682)#1,404 | 1.2%(-1.13)#24,110 |
1
Common Questions
What are the Top 5 Zip Codes with the Highest Percentage of Population Employed in Agriculture, Fishing & Hunting in Tyler, TX?
Top 5 Zip Codes with the Highest Percentage of Population Employed in Agriculture, Fishing & Hunting in Tyler, TX are:
What zip code has the Highest Percentage of Population Employed in Agriculture, Fishing & Hunting in Tyler, TX?
75706 has the Highest Percentage of Population Employed in Agriculture, Fishing & Hunting in Tyler, TX with 4.4%.
What is the Percentage of Population Employed in Agriculture, Fishing & Hunting in Tyler, TX?
Percentage of Population Employed in Agriculture, Fishing & Hunting in Tyler is 0.45%.
What is the Percentage of Population Employed in Agriculture, Fishing & Hunting in Texas?
Percentage of Population Employed in Agriculture, Fishing & Hunting in Texas is 0.75%.
What is the Percentage of Population Employed in Agriculture, Fishing & Hunting in the United States?
Percentage of Population Employed in Agriculture, Fishing & Hunting in the United States is 1.2%.