Zip Codes with the Lowest Per Capita Income in Athens, TX
On this page
RELATED REPORTS & OPTIONS
Lowest Per Capita Income
Population
Highest PopulationHighest Population DensityLowest Population DensityMale / Female RatioFemale / Male RatioOldest PopulationOldest Population | MaleOldest Population | FemaleYoungest PopulationYoungest Population | MaleYoungest Population | Female
Families and Households
Largest Family SizeLargest Household SizeMost Single FathersMost Single MothersFewest Single FathersFewest Single MothersSmallest Family SizeSmallest Household Size
Female Fertility
Highest Birth Rate | All WomenHighest Birth Rate | Below PovertyHighest Birth Rate | Public IncomeHighest Birth Rate | In Labor ForceLowest Birth Rate | All WomenLowest Birth Rate | Below PovertyLowest Birth Rate | Public IncomeLowest Birth Rate | In Labor Force
Race (Community Size)
Race (Percentage)
Ancestry (Community Size)
AfricanAmericanCanadianCreekCzechDanishDutchEnglishEuropeanFrenchGermanIndian (Asian)IrishMexicanPolishRomanianScandinavianScotch-IrishScottishSouth AmericanSubsaharan AfricanSwedishWelsh
Ancestry (Percentage)
AfricanAmericanCanadianCreekCzechDanishDutchEnglishEuropeanFrenchGermanIndian (Asian)IrishMexicanPolishRomanianScandinavianScotch-IrishScottishSouth AmericanSubsaharan AfricanSwedishWelsh
Immigrant Origin (Total)
Immigrant Origin (Percentage)
Income
Highest Per Capita IncomeHighest Earnings | MaleHighest Earnings | FemaleHighest Wage/Income Gap ($)Highest Wage/Income Gap (%)Highest Inequality / Gini IndexLowest Per Capita IncomeLowest Earnings | MaleLowest Earnings | FemaleLowest Wage/Income Gap ($)Lowest Wage/Income Gap (%)Lowest Inequality / Gini Index
Income (Families)
Highest Family IncomeLowest Family IncomeFamily Income | $0-10kFamily Income | $100k+Family Income | $200k+
Income (Households)
Highest Household IncomeLowest Household IncomeHousehold Income | $0-10kHousehold Income | $200k+Household Income | $100k+
Poverty
Highest PovertyHighest Poverty | MaleHighest Poverty | FemaleHighest Poverty | Female 18-24Highest Poverty | Child 0-16Highest Poverty | Boys 0-16Highest Poverty | Seniors 65+Highest Poverty | Seniors 75+ Lowest PovertyLowest Poverty | MaleLowest Poverty | FemaleLowest Poverty | Child 0-16Lowest Poverty | Boys 0-16Lowest Poverty | Seniors 65+Lowest Poverty | Seniors 75+
Poverty (Families)
Highest Family PovertyHighest Poverty | Married CoupleHighest Poverty | Single FemaleHighest Poverty | Single MotherLowest Family PovertyLowest Poverty | Married CoupleLowest Poverty | Single FemaleLowest Poverty | Single Mother
Unemployment
Employment Occupations
Architecture & EngineeringArts, Media & EntertainmentBusiness & FinancialCleaning & MaintenanceCommunity & Social Service Computer & MathematicsComputer, Engineering & ScienceConstruction & ExtractionEducation Instruction & LibraryEducation, Arts & MediaFirefighting & PreventionFood Preparation & ServingHealth Diagnosing & TreatingHealth TechnologistsHealthcare SupportInstallation, Maintenance & RepairLaw EnforcementLegal Services & SupportManagementMaterial MovingOffice & AdministrationPersonal Care and ServiceProductionSales & RelatedSecurity & ProtectionTransportation
Employment Industries
Accommodation & Food ServicesAdministrative & Support ServicesArts, Entertainment & RecreationConstructionEducational ServicesEnterprise ManagementFinance & InsuranceHealth Care & Social AssistanceInformation & TechnologyManufacturingProfessional & Scientific ServicesPublic AdministrationReal Estate, Rental & LeasingRetail TradeTransportation & WarehousingUtilitiesWholesale Trade
Employer Class
Private Company EmployeesSelf-Employed / IncorporatedSelf-Employed / Not IncorporatedNot-for-profit OrganizationsLocal Government EmployeesState Government EmployeesFederal Government Employees
Commute Time
Longest CommuteLongest Commute | MaleLongest Commute | FemaleShortest CommuteShortest Commute | MaleShortest Commute | Female
Commute Means
School Enrollment
In Private SchoolNursery / PreschoolKindergartenElementary SchoolMiddle SchoolHigh SchoolCollegeUniversity
Education by Degree Field
Computers and MathematicsBio, Nature & AgriculturalPhysical and Health SciencesPsychologySocial SciencesEngineeringScience and EngineeringBusinessEducationLiterature and LanguagesVisual and Performing ArtsCommunicationsArts and Humanities
Occupancy
Finances
Highest Median Housing CostsHighest Property PricesHighest Owner Housing CostsHighest Renter Housing CostsHighest Housing Costs / IncomeLowest Median Housing CostsLowest Property PricesLowest Owner Housing CostsLowest Renter Housing CostsLowest Housing Costs / Income
Physical Characteristics
Athens
States
AlabamaAlaskaArizonaArkansasCaliforniaColoradoConnecticutDelawareDistrict Of ColumbiaFloridaGeorgiaHawaiiIdahoIllinoisIndianaIowaKansasKentuckyLouisianaMaineMarylandMassachusettsMichiganMinnesotaMississippiMissouriMontanaNebraskaNevadaNew HampshireNew JerseyNew MexicoNew YorkNorth CarolinaNorth DakotaOhioOklahomaOregonPennsylvaniaPuerto RicoRhode IslandSouth CarolinaSouth DakotaTennesseeTexasUtahVermontVirginiaWashingtonWest VirginiaWisconsinWyoming
Texas Cities
AbileneAllenAlpineAmarilloArlingtonAthensAustinBaytownBeaumontBedfordBeevilleBig SpringBoerneBrownsvilleBryanCanyonCarrolltonCleburneClevelandCollege StationConroeCorpus ChristiCorsicanaCypressDallasDenisonDentonDuncanvilleEdinburgEl PasoEulessFlower MoundFort BlissFort WorthFriscoGalvestonGarlandGatesvilleGeorgetownGilmerGranburyGrand PrairieGreenvilleHarlingenHendersonHoustonHumbleHuntsvilleHurstIrvingKatyKellerKilleenKingwoodLancasterLaredoLeanderLewisvilleLongviewLubbockLufkinMabankMagnoliaMarshallMcallenMckinneyMesquiteMidlandMissionMissouri CityMontgomeryNacogdochesNew BraunfelsNorth Richland HillsOdessaOrangePalestineParisPasadenaPearlandPlanoPort ArthurRichardsonRichmondRockwallRound RockRowlettRuleSan AngeloSan AntonioSanta FeShermanSpringStephenvilleSugar LandTempleTennessee ColonyTerrellTexarkanaTexas CityTomballTylerVictoriaWacoWaxahachieWeatherfordWeslacoWichita FallsWillis
Compare Zip Codes
Comparison Subject
Compare StatesCompare CitiesCompare Zip Codes
Map of Zip Codes with the Lowest Per Capita Income in Athens
$30,000
$0
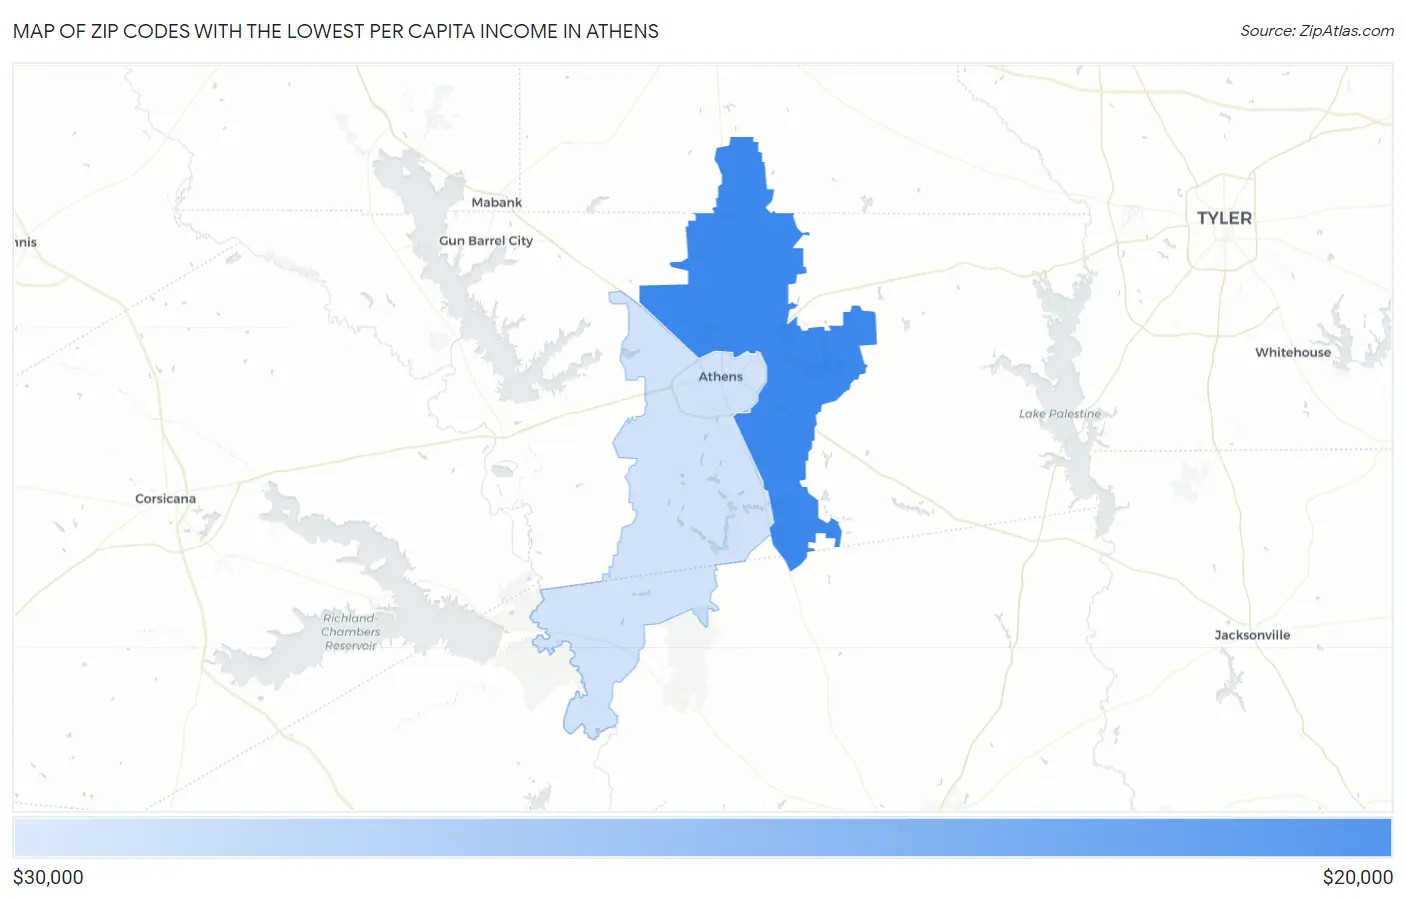
Zip Codes with the Lowest Per Capita Income in Athens, TX
| Zip Code | Per Capita Income | vs State | vs National | |
| 1. | 75752 | $28,481 | $37,514(-9.03k)#715 | $41,261(-12.8k)#9,718 |
| 2. | 75751 | $28,724 | $37,514(-8.79k)#730 | $41,261(-12.5k)#10,005 |
1
Common Questions
What are the Top Zip Codes with the Lowest Per Capita Income in Athens, TX?
Top Zip Codes with the Lowest Per Capita Income in Athens, TX are:
What zip code has the Lowest Per Capita Income in Athens, TX?
75752 has the Lowest Per Capita Income in Athens, TX with $28,481.
What is the Per Capita Income in Athens, TX?
Per Capita Income in Athens is $29,235.
What is the Per Capita Income in Texas?
Per Capita Income in Texas is $37,514.
What is the Per Capita Income in the United States?
Per Capita Income in the United States is $41,261.