Zip Codes with the Highest Percentage of Population Employed in Accommodation & Food Services in Fort Mill, SC
RELATED REPORTS & OPTIONS
Accommodation & Food Services
Fort Mill
Compare Zip Codes
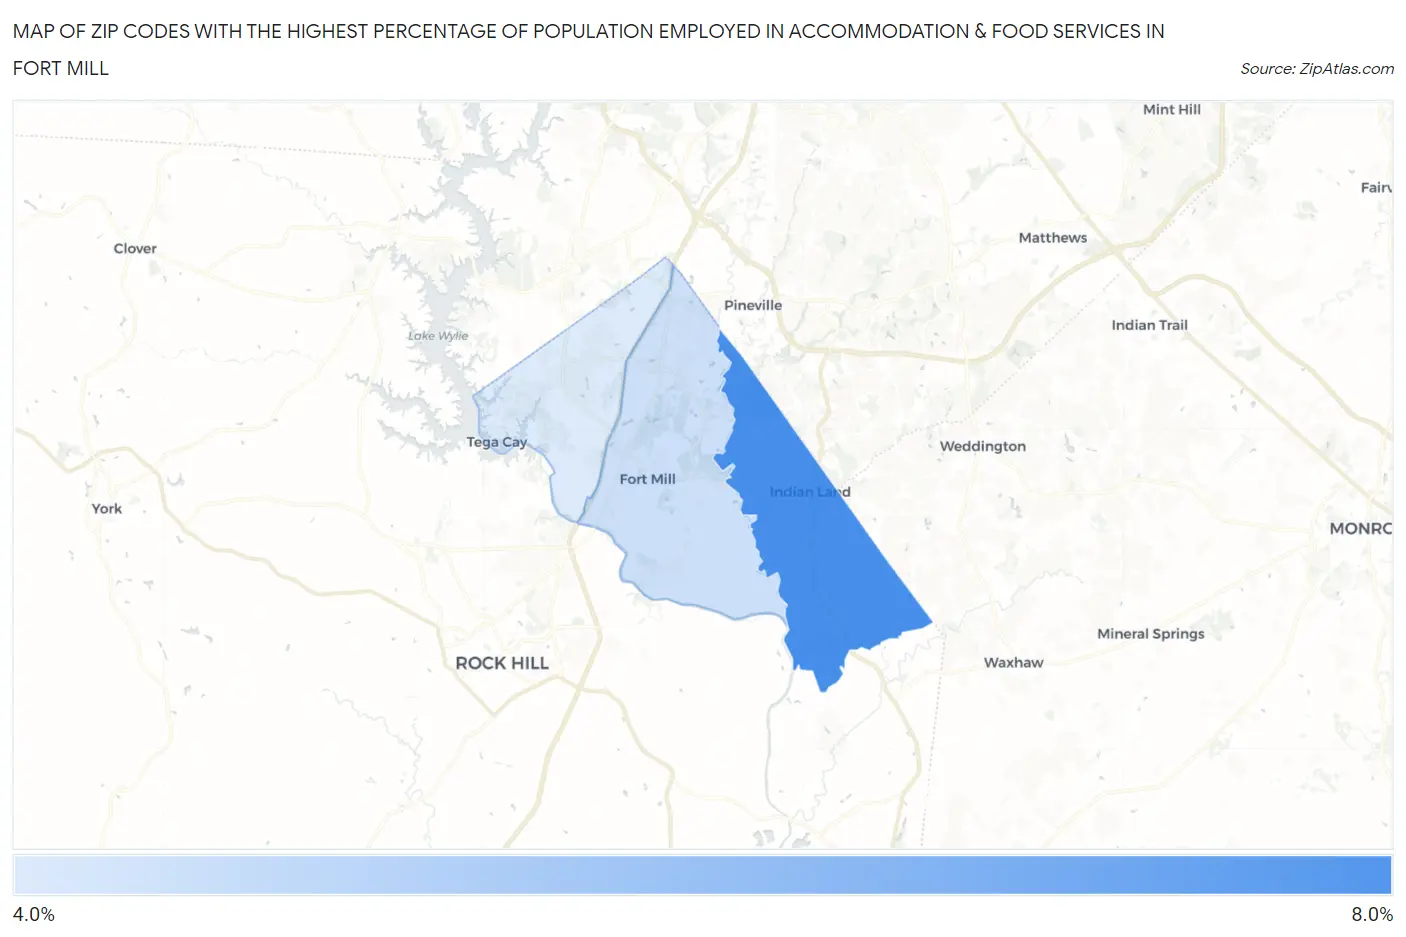
Map of Zip Codes with the Highest Percentage of Population Employed in Accommodation & Food Services in Fort Mill
0.0%
8.0%
Zip Codes with the Highest Percentage of Population Employed in Accommodation & Food Services in Fort Mill, SC
| Zip Code | % Employed | vs State | vs National | |
| 1. | 29707 | 7.0% | 8.0%(-1.00)#183 | 6.9%(+0.085)#10,422 |
| 2. | 29715 | 4.9% | 8.0%(-3.08)#276 | 6.9%(-1.99)#17,200 |
| 3. | 29708 | 4.6% | 8.0%(-3.34)#292 | 6.9%(-2.25)#18,040 |
1
Common Questions
What are the Top Zip Codes with the Highest Percentage of Population Employed in Accommodation & Food Services in Fort Mill, SC?
Top Zip Codes with the Highest Percentage of Population Employed in Accommodation & Food Services in Fort Mill, SC are:
What zip code has the Highest Percentage of Population Employed in Accommodation & Food Services in Fort Mill, SC?
29707 has the Highest Percentage of Population Employed in Accommodation & Food Services in Fort Mill, SC with 7.0%.
What is the Percentage of Population Employed in Accommodation & Food Services in Fort Mill, SC?
Percentage of Population Employed in Accommodation & Food Services in Fort Mill is 3.0%.
What is the Percentage of Population Employed in Accommodation & Food Services in South Carolina?
Percentage of Population Employed in Accommodation & Food Services in South Carolina is 8.0%.
What is the Percentage of Population Employed in Accommodation & Food Services in the United States?
Percentage of Population Employed in Accommodation & Food Services in the United States is 6.9%.