Zip Codes with the Highest Percentage of Households Without a Vehicle in Conway, SC
RELATED REPORTS & OPTIONS
Households without a Cars
Conway
Compare Zip Codes
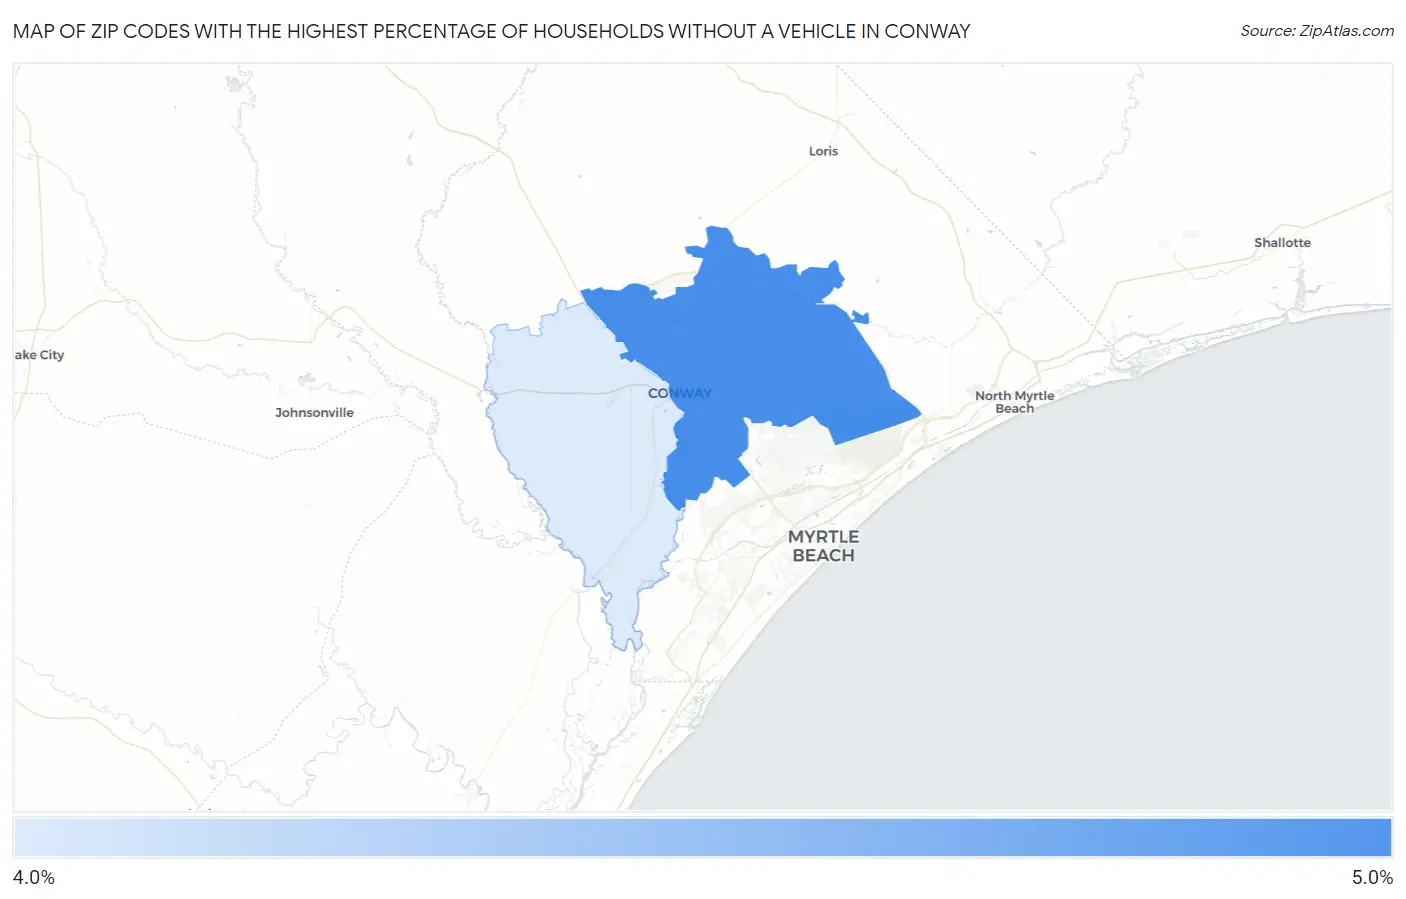
Map of Zip Codes with the Highest Percentage of Households Without a Vehicle in Conway
0.0%
5.0%
Zip Codes with the Highest Percentage of Households Without a Vehicle in Conway, SC
| Zip Code | Housholds Without a Car | vs State | vs National | |
| 1. | 29526 | 4.7% | 5.7%(-1.00)#216 | 8.3%(-3.60)#13,625 |
| 2. | 29527 | 4.5% | 5.7%(-1.20)#228 | 8.3%(-3.80)#14,198 |
1
Common Questions
What are the Top Zip Codes with the Highest Percentage of Households Without a Vehicle in Conway, SC?
Top Zip Codes with the Highest Percentage of Households Without a Vehicle in Conway, SC are:
What zip code has the Highest Percentage of Households Without a Vehicle in Conway, SC?
29526 has the Highest Percentage of Households Without a Vehicle in Conway, SC with 4.7%.
What is the Percentage of Households Without a Vehicle in Conway, SC?
Percentage of Households Without a Vehicle in Conway is 8.2%.
What is the Percentage of Households Without a Vehicle in South Carolina?
Percentage of Households Without a Vehicle in South Carolina is 5.7%.
What is the Percentage of Households Without a Vehicle in the United States?
Percentage of Households Without a Vehicle in the United States is 8.3%.