Weekapaug, RI
Weekapaug Map
Weekapaug Overview
522
TOTAL POPULATION
233
MALE POPULATION
289
FEMALE POPULATION
80.62
MALES / 100 FEMALES
124.03
FEMALES / 100 MALES
55.6
MEDIAN AGE
2.8
AVG FAMILY SIZE
2.4
AVG HOUSEHOLD SIZE
$77,232
PER CAPITA INCOME
$154,107
AVG FAMILY INCOME
$110,000
AVG HOUSEHOLD INCOME
0.51
INEQUALITY / GINI INDEX
263
LABOR FORCE [ PEOPLE ]
53.1%
PERCENT IN LABOR FORCE
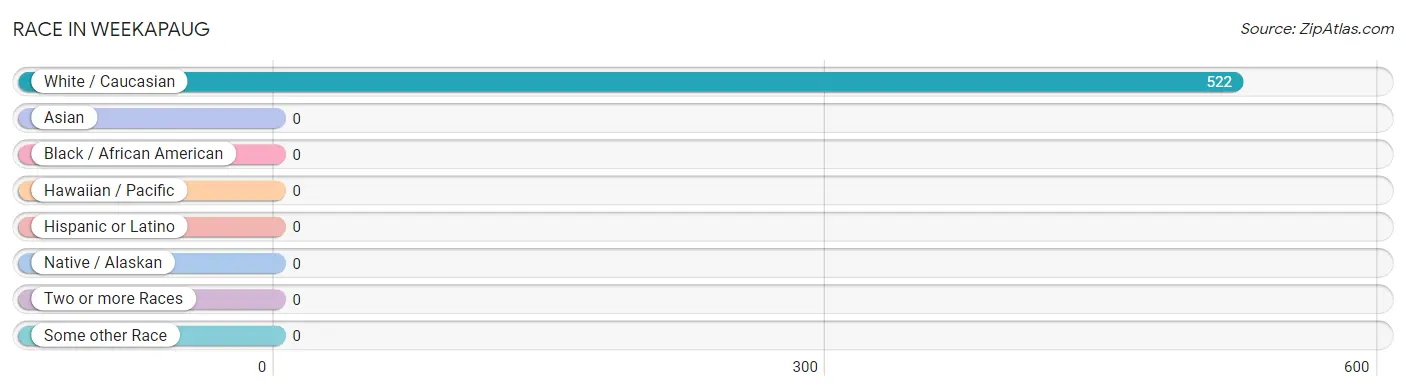
Race in Weekapaug
The most populous races in Weekapaug are , and White / Caucasian (522 | 100.0%).
| Race | # Population | % Population |
| Asian | 0 | 0.0% |
| Black / African American | 0 | 0.0% |
| Hawaiian / Pacific | 0 | 0.0% |
| Hispanic or Latino | 0 | 0.0% |
| Native / Alaskan | 0 | 0.0% |
| White / Caucasian | 522 | 100.0% |
| Two or more Races | 0 | 0.0% |
| Some other Race | 0 | 0.0% |
| Total | 522 | 100.0% |
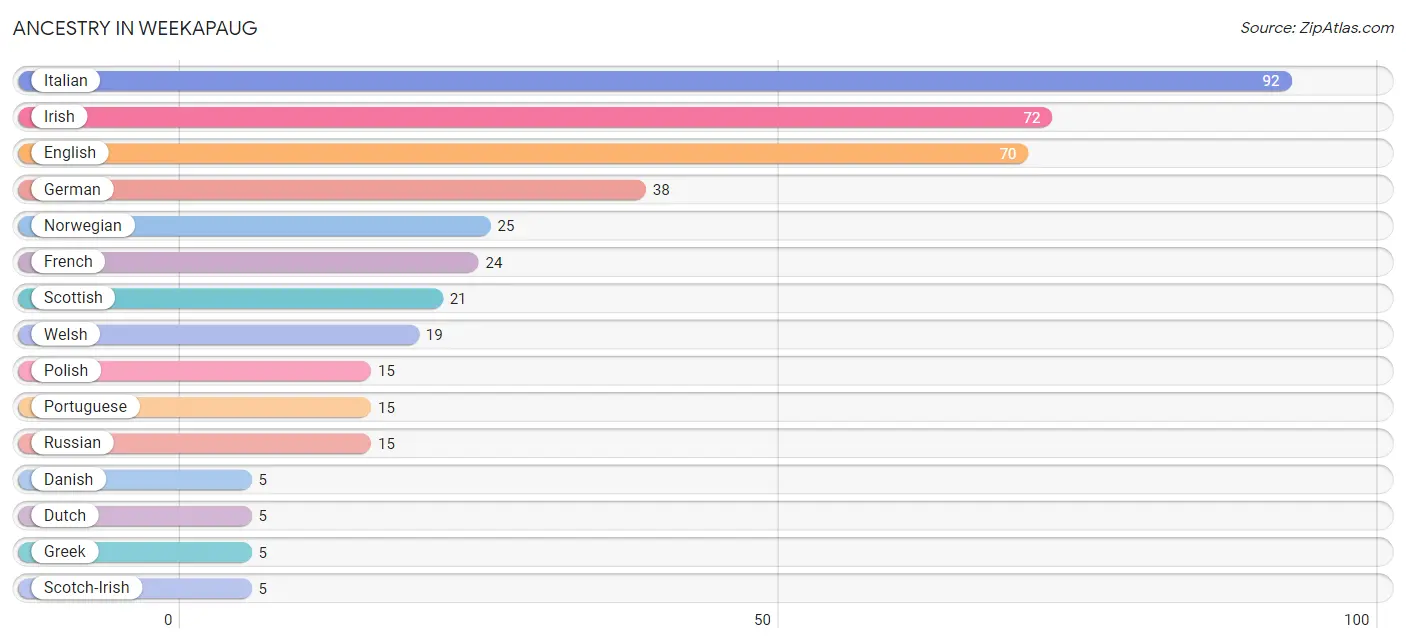
Ancestry in Weekapaug
The most populous ancestries reported in Weekapaug are Italian (92 | 17.6%), Irish (72 | 13.8%), English (70 | 13.4%), German (38 | 7.3%), and Norwegian (25 | 4.8%), together accounting for 56.9% of all Weekapaug residents.
| Ancestry | # Population | % Population |
| American | 4 | 0.8% |
| Danish | 5 | 1.0% |
| Dutch | 5 | 1.0% |
| English | 70 | 13.4% |
| French | 24 | 4.6% |
| German | 38 | 7.3% |
| Greek | 5 | 1.0% |
| Irish | 72 | 13.8% |
| Italian | 92 | 17.6% |
| Norwegian | 25 | 4.8% |
| Polish | 15 | 2.9% |
| Portuguese | 15 | 2.9% |
| Russian | 15 | 2.9% |
| Scotch-Irish | 5 | 1.0% |
| Scottish | 21 | 4.0% |
| Welsh | 19 | 3.6% | View All 16 Rows |
Immigrants in Weekapaug
The most numerous immigrant groups reported in Weekapaug came from , and Canada (6 | 1.1%), together accounting for 1.1% of all Weekapaug residents.

| Immigration Origin | # Population | % Population |
| Canada | 6 | 1.1% | View All 1 Rows |
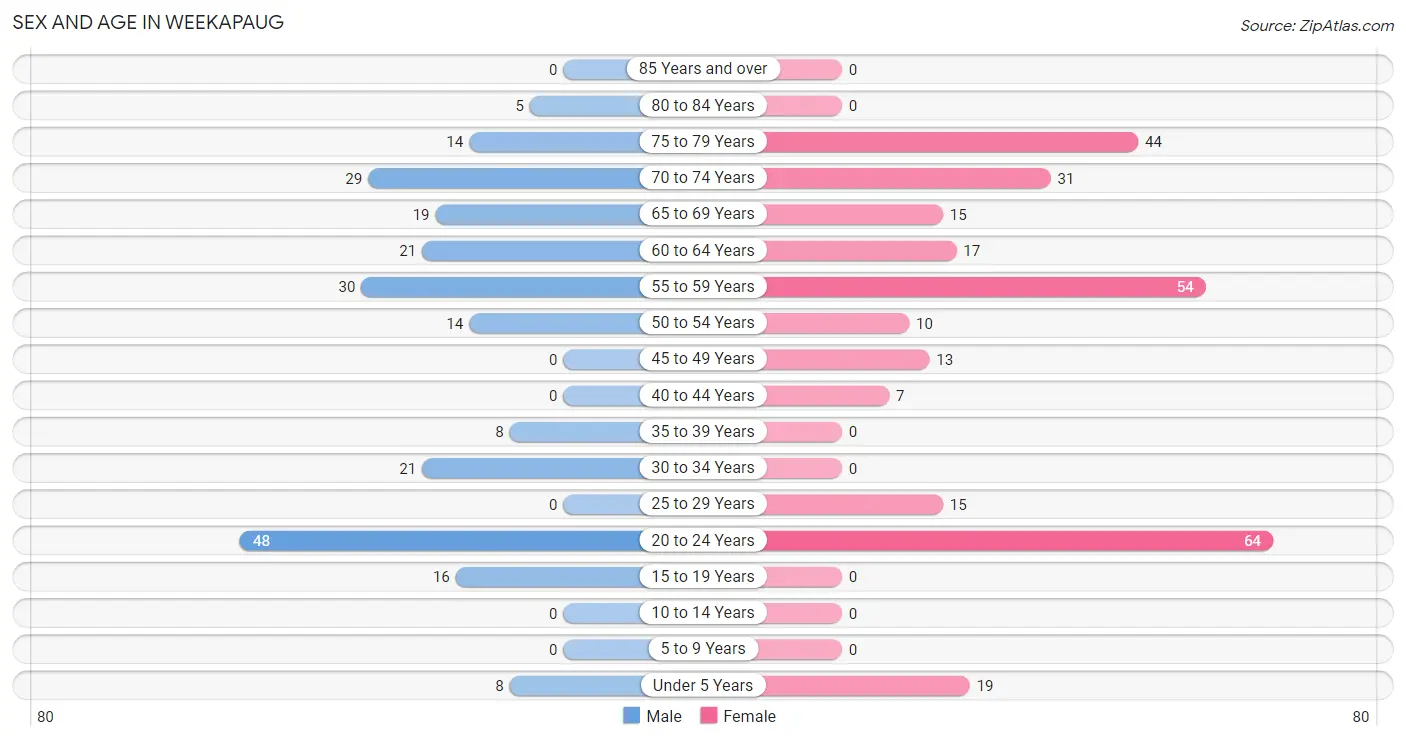
Sex and Age in Weekapaug
Sex and Age in Weekapaug
The most populous age groups in Weekapaug are 20 to 24 Years (48 | 20.6%) for men and 20 to 24 Years (64 | 22.2%) for women.
| Age Bracket | Male | Female |
| Under 5 Years | 8 (3.4%) | 19 (6.6%) |
| 5 to 9 Years | 0 (0.0%) | 0 (0.0%) |
| 10 to 14 Years | 0 (0.0%) | 0 (0.0%) |
| 15 to 19 Years | 16 (6.9%) | 0 (0.0%) |
| 20 to 24 Years | 48 (20.6%) | 64 (22.2%) |
| 25 to 29 Years | 0 (0.0%) | 15 (5.2%) |
| 30 to 34 Years | 21 (9.0%) | 0 (0.0%) |
| 35 to 39 Years | 8 (3.4%) | 0 (0.0%) |
| 40 to 44 Years | 0 (0.0%) | 7 (2.4%) |
| 45 to 49 Years | 0 (0.0%) | 13 (4.5%) |
| 50 to 54 Years | 14 (6.0%) | 10 (3.5%) |
| 55 to 59 Years | 30 (12.9%) | 54 (18.7%) |
| 60 to 64 Years | 21 (9.0%) | 17 (5.9%) |
| 65 to 69 Years | 19 (8.2%) | 15 (5.2%) |
| 70 to 74 Years | 29 (12.4%) | 31 (10.7%) |
| 75 to 79 Years | 14 (6.0%) | 44 (15.2%) |
| 80 to 84 Years | 5 (2.1%) | 0 (0.0%) |
| 85 Years and over | 0 (0.0%) | 0 (0.0%) |
| Total | 233 (100.0%) | 289 (100.0%) |
Families and Households in Weekapaug
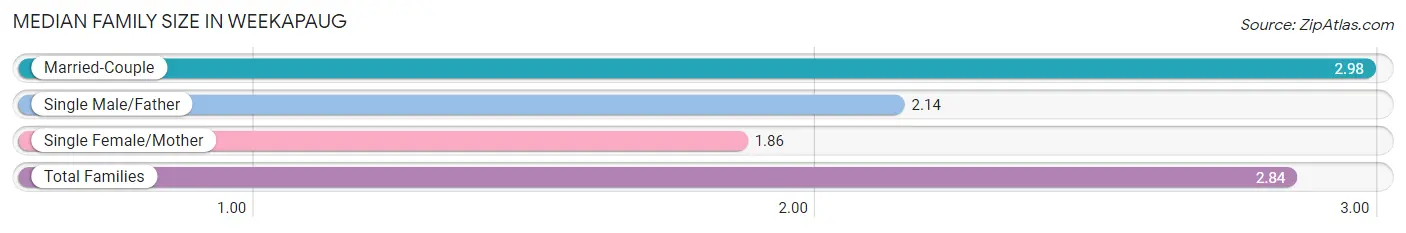
Median Family Size in Weekapaug
The median family size in Weekapaug is 2.84 persons per family, with married-couple families (124 | 85.5%) accounting for the largest median family size of 2.98 persons per family. On the other hand, single female/mother families (7 | 4.8%) represent the smallest median family size with 1.86 persons per family.
| Family Type | # Families | Family Size |
| Married-Couple | 124 (85.5%) | 2.98 |
| Single Male/Father | 14 (9.7%) | 2.14 |
| Single Female/Mother | 7 (4.8%) | 1.86 |
| Total Families | 145 (100.0%) | 2.84 |
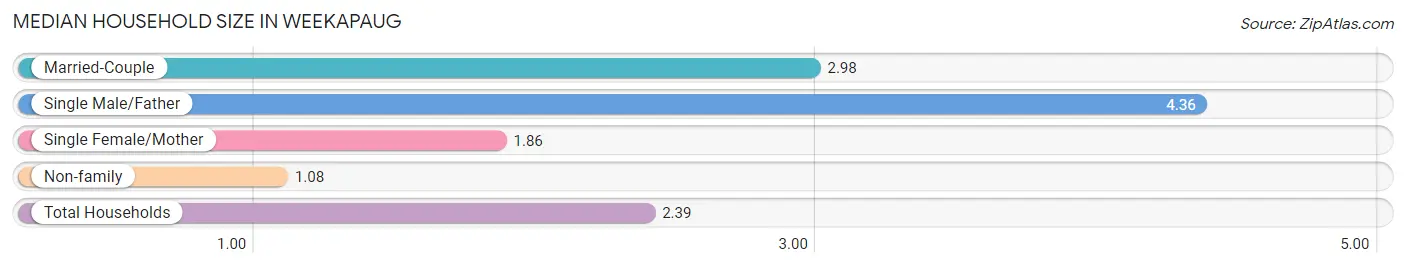
Median Household Size in Weekapaug
The median household size in Weekapaug is 2.39 persons per household, with single male/father households (14 | 6.4%) accounting for the largest median household size of 4.36 persons per household. non-family households (73 | 33.5%) represent the smallest median household size with 1.08 persons per household.
| Household Type | # Households | Household Size |
| Married-Couple | 124 (56.9%) | 2.98 |
| Single Male/Father | 14 (6.4%) | 4.36 |
| Single Female/Mother | 7 (3.2%) | 1.86 |
| Non-family | 73 (33.5%) | 1.08 |
| Total Households | 218 (100.0%) | 2.39 |
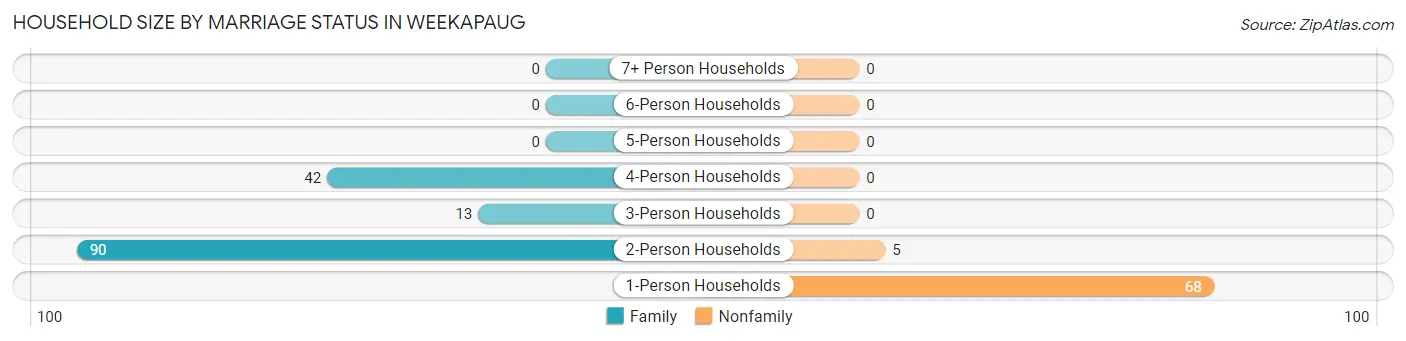
Household Size by Marriage Status in Weekapaug
Out of a total of 218 households in Weekapaug, 145 (66.5%) are family households, while 73 (33.5%) are nonfamily households. The most numerous type of family households are 2-person households, comprising 90, and the most common type of nonfamily households are 1-person households, comprising 68.
| Household Size | Family Households | Nonfamily Households |
| 1-Person Households | - | 68 (31.2%) |
| 2-Person Households | 90 (41.3%) | 5 (2.3%) |
| 3-Person Households | 13 (6.0%) | 0 (0.0%) |
| 4-Person Households | 42 (19.3%) | 0 (0.0%) |
| 5-Person Households | 0 (0.0%) | 0 (0.0%) |
| 6-Person Households | 0 (0.0%) | 0 (0.0%) |
| 7+ Person Households | 0 (0.0%) | 0 (0.0%) |
| Total | 145 (66.5%) | 73 (33.5%) |
Female Fertility in Weekapaug
Fertility by Age in Weekapaug
| Age Bracket | Women with Births | Births / 1,000 Women |
| 15 to 19 years | 0 (0.0%) | 0.0 |
| 20 to 34 years | 0 (0.0%) | 0.0 |
| 35 to 50 years | 0 (0.0%) | 0.0 |
| Total | 0 (0.0%) | 0.0 |
Fertility by Age by Marriage Status in Weekapaug
| Age Bracket | Married | Unmarried |
| 15 to 19 years | 0 (0.0%) | 0 (0.0%) |
| 20 to 34 years | 0 (0.0%) | 0 (0.0%) |
| 35 to 50 years | 0 (0.0%) | 0 (0.0%) |
| Total | 0 (0.0%) | 0 (0.0%) |
Fertility by Education in Weekapaug
| Educational Attainment | Women with Births | Births / 1,000 Women |
| Less than High School | 0 (0.0%) | 0.0 |
| High School Diploma | 0 (0.0%) | 0.0 |
| College or Associate's Degree | 0 (0.0%) | 0.0 |
| Bachelor's Degree | 0 (0.0%) | 0.0 |
| Graduate Degree | 0 (0.0%) | 0.0 |
| Total | 0 (0.0%) | 0.0 |
Fertility by Education by Marriage Status in Weekapaug
| Educational Attainment | Married | Unmarried |
| Less than High School | 0 (0.0%) | 0 (0.0%) |
| High School Diploma | 0 (0.0%) | 0 (0.0%) |
| College or Associate's Degree | 0 (0.0%) | 0 (0.0%) |
| Bachelor's Degree | 0 (0.0%) | 0 (0.0%) |
| Graduate Degree | 0 (0.0%) | 0 (0.0%) |
| Total | 0 (0.0%) | 0 (0.0%) |
Income in Weekapaug
Income Overview in Weekapaug
Per Capita Income in Weekapaug is $77,232, while median incomes of families and households are $154,107 and $110,000 respectively.
| Characteristic | Number | Measure |
| Per Capita Income | 522 | $77,232 |
| Median Family Income | 145 | $154,107 |
| Mean Family Income | 145 | $236,736 |
| Median Household Income | 218 | $110,000 |
| Mean Household Income | 218 | $181,271 |
| Income Deficit | 145 | $0 |
| Wage / Income Gap (%) | 522 | 0.00% |
| Wage / Income Gap ($) | 522 | 100.00¢ per $1 |
| Gini / Inequality Index | 522 | 0.51 |
Earnings by Sex in Weekapaug
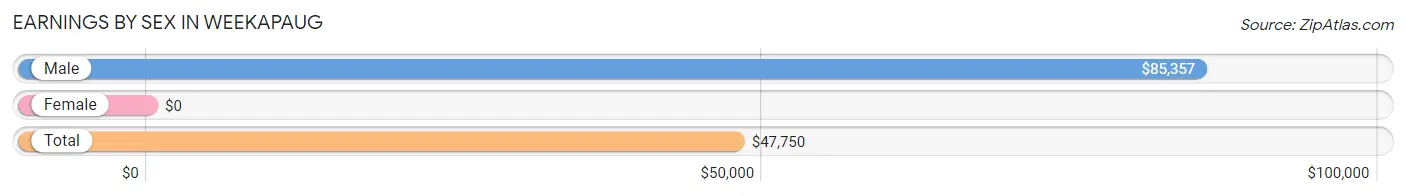
| Sex | Number | Average Earnings |
| Male | 156 (53.2%) | $85,357 |
| Female | 137 (46.8%) | $0 |
| Total | 293 (100.0%) | $47,750 |
Earnings by Sex by Income Bracket in Weekapaug
The most common earnings brackets in Weekapaug are $100,000+ for men (60 | 38.5%) and $5,000 to $7,499 for women (64 | 46.7%).
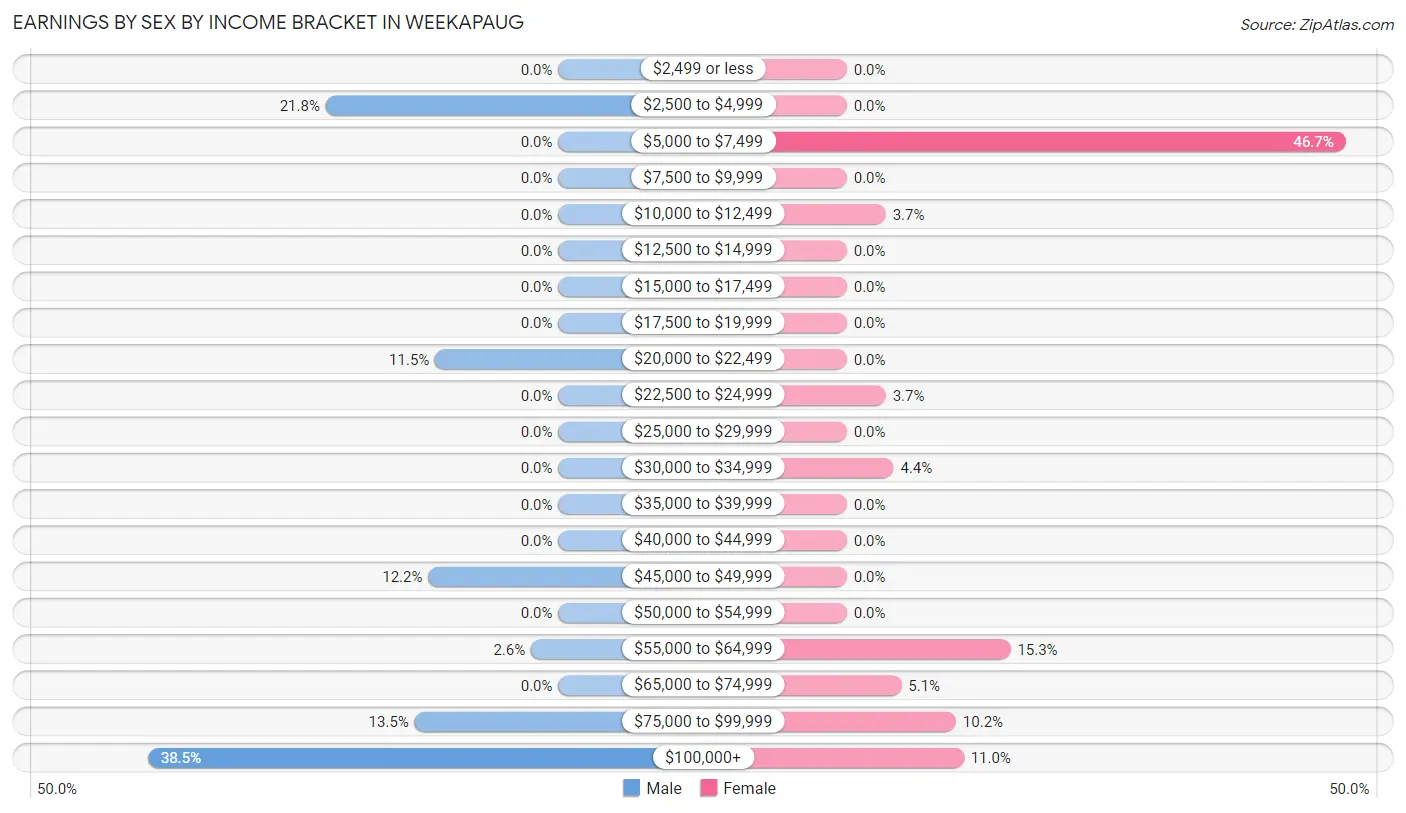
| Income | Male | Female |
| $2,499 or less | 0 (0.0%) | 0 (0.0%) |
| $2,500 to $4,999 | 34 (21.8%) | 0 (0.0%) |
| $5,000 to $7,499 | 0 (0.0%) | 64 (46.7%) |
| $7,500 to $9,999 | 0 (0.0%) | 0 (0.0%) |
| $10,000 to $12,499 | 0 (0.0%) | 5 (3.6%) |
| $12,500 to $14,999 | 0 (0.0%) | 0 (0.0%) |
| $15,000 to $17,499 | 0 (0.0%) | 0 (0.0%) |
| $17,500 to $19,999 | 0 (0.0%) | 0 (0.0%) |
| $20,000 to $22,499 | 18 (11.5%) | 0 (0.0%) |
| $22,500 to $24,999 | 0 (0.0%) | 5 (3.6%) |
| $25,000 to $29,999 | 0 (0.0%) | 0 (0.0%) |
| $30,000 to $34,999 | 0 (0.0%) | 6 (4.4%) |
| $35,000 to $39,999 | 0 (0.0%) | 0 (0.0%) |
| $40,000 to $44,999 | 0 (0.0%) | 0 (0.0%) |
| $45,000 to $49,999 | 19 (12.2%) | 0 (0.0%) |
| $50,000 to $54,999 | 0 (0.0%) | 0 (0.0%) |
| $55,000 to $64,999 | 4 (2.6%) | 21 (15.3%) |
| $65,000 to $74,999 | 0 (0.0%) | 7 (5.1%) |
| $75,000 to $99,999 | 21 (13.5%) | 14 (10.2%) |
| $100,000+ | 60 (38.5%) | 15 (11.0%) |
| Total | 156 (100.0%) | 137 (100.0%) |
Earnings by Sex by Educational Attainment in Weekapaug
Average earnings in Weekapaug are $126,154 for men and $57,440 for women, a difference of 54.5%. Men with an educational attainment of bachelor's degree enjoy the highest average annual earnings of $250,001, while those with bachelor's degree education earn the least with $250,001. Women with an educational attainment of bachelor's degree earn the most with the average annual earnings of $56,310, while those with bachelor's degree education have the smallest earnings of $56,310.
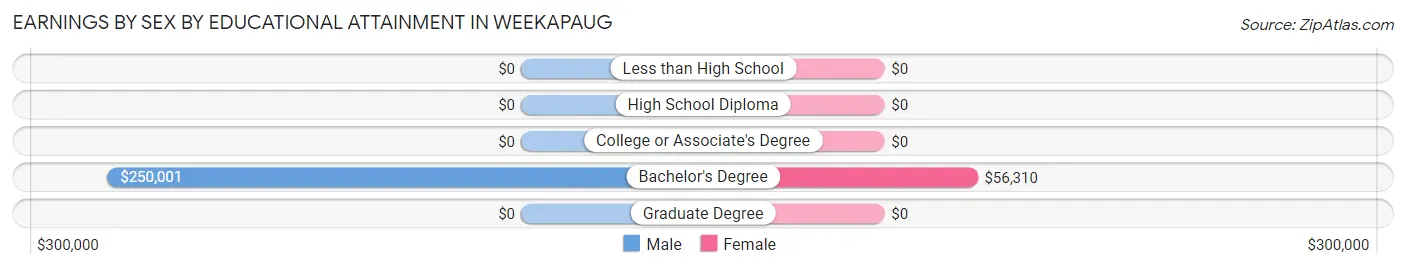
| Educational Attainment | Male Income | Female Income |
| Less than High School | - | - |
| High School Diploma | - | - |
| College or Associate's Degree | - | - |
| Bachelor's Degree | $250,001 | $56,310 |
| Graduate Degree | - | - |
| Total | $126,154 | $57,440 |
Family Income in Weekapaug
Family Income Brackets in Weekapaug
According to the Weekapaug family income data, there are 60 families falling into the $200,000+ income range, which is the most common income bracket and makes up 41.4% of all families.
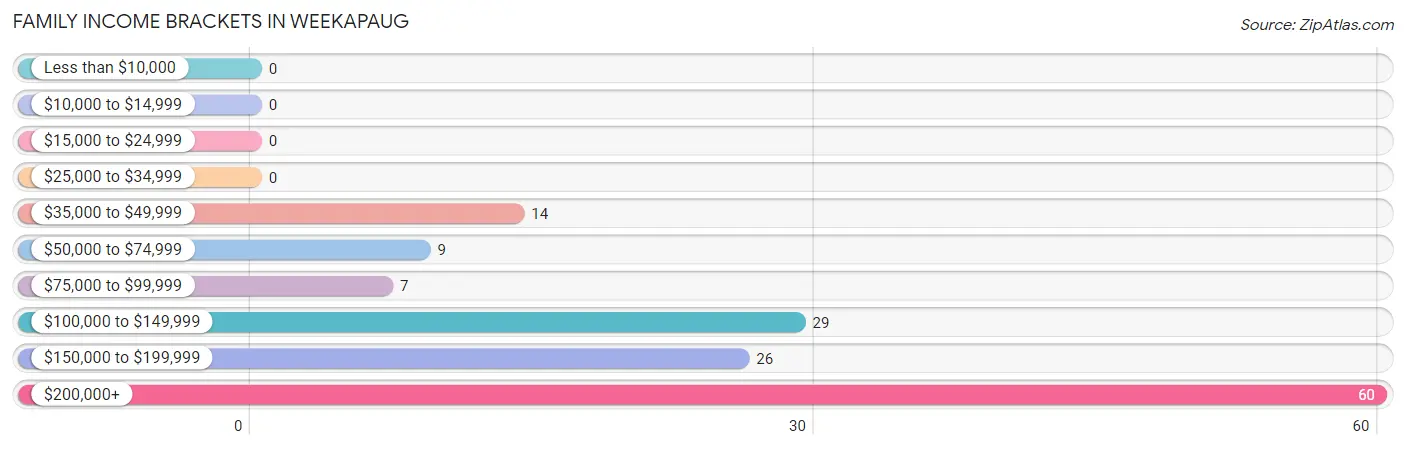
| Income Bracket | # Families | % Families |
| Less than $10,000 | 0 | 0.0% |
| $10,000 to $14,999 | 0 | 0.0% |
| $15,000 to $24,999 | 0 | 0.0% |
| $25,000 to $34,999 | 0 | 0.0% |
| $35,000 to $49,999 | 14 | 9.7% |
| $50,000 to $74,999 | 9 | 6.2% |
| $75,000 to $99,999 | 7 | 4.8% |
| $100,000 to $149,999 | 29 | 20.0% |
| $150,000 to $199,999 | 26 | 17.9% |
| $200,000+ | 60 | 41.4% |
Family Income by Famaliy Size in Weekapaug
2-person families (104 | 71.7%) account for the highest median family income in Weekapaug with $115,556 per family, while 2-person families (104 | 71.7%) have the highest median income of $57,778 per family member.
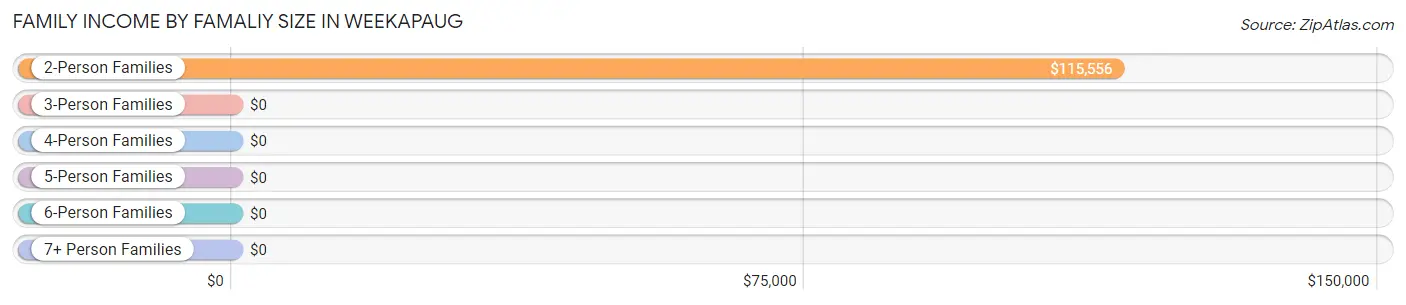
| Income Bracket | # Families | Median Income |
| 2-Person Families | 104 (71.7%) | $115,556 |
| 3-Person Families | 13 (9.0%) | $0 |
| 4-Person Families | 28 (19.3%) | $0 |
| 5-Person Families | 0 (0.0%) | $0 |
| 6-Person Families | 0 (0.0%) | $0 |
| 7+ Person Families | 0 (0.0%) | $0 |
| Total | 145 (100.0%) | $154,107 |
Family Income by Number of Earners in Weekapaug
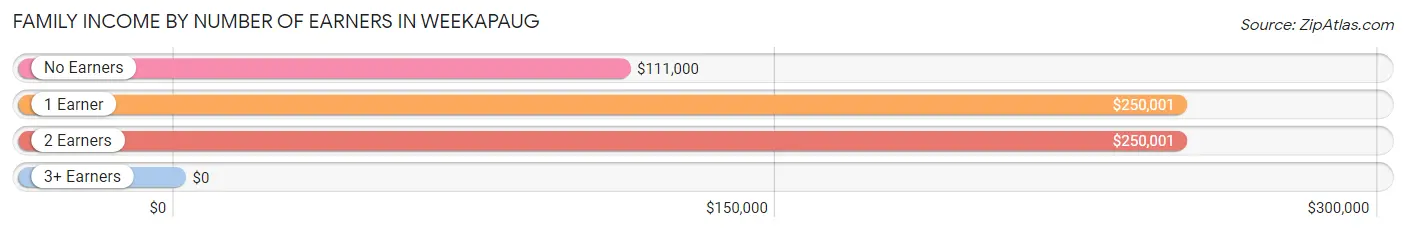
| Number of Earners | # Families | Median Income |
| No Earners | 34 (23.4%) | $111,000 |
| 1 Earner | 65 (44.8%) | $250,001 |
| 2 Earners | 25 (17.2%) | $250,001 |
| 3+ Earners | 21 (14.5%) | $0 |
| Total | 145 (100.0%) | $154,107 |
Household Income in Weekapaug
Household Income Brackets in Weekapaug
With 65 households falling in the category, the $200,000+ income range is the most frequent in Weekapaug, accounting for 29.8% of all households.
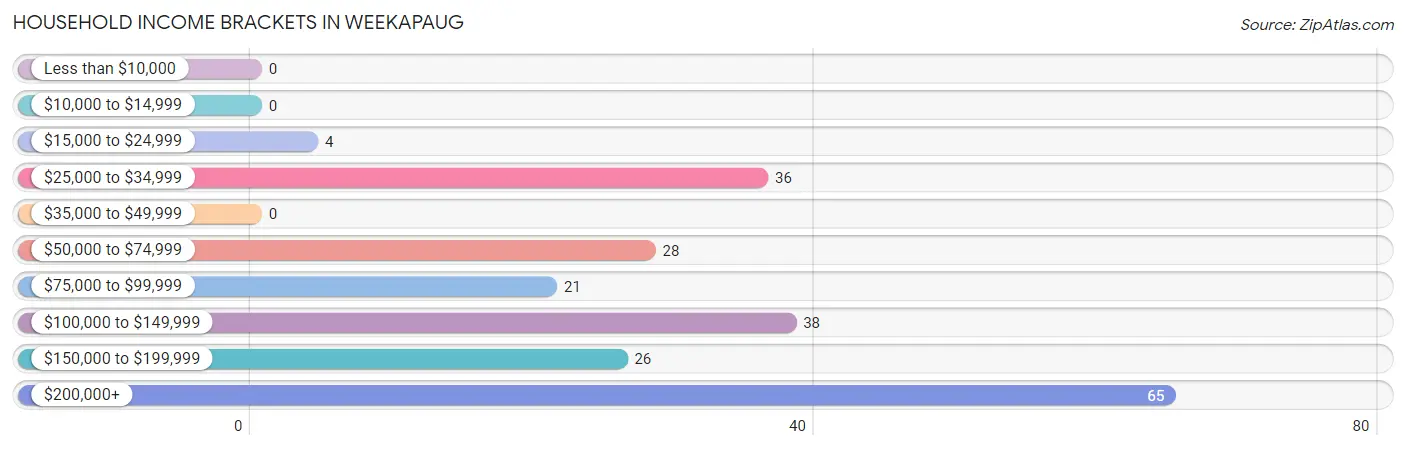
| Income Bracket | # Households | % Households |
| Less than $10,000 | 0 | 0.0% |
| $10,000 to $14,999 | 0 | 0.0% |
| $15,000 to $24,999 | 4 | 1.8% |
| $25,000 to $34,999 | 36 | 16.5% |
| $35,000 to $49,999 | 0 | 0.0% |
| $50,000 to $74,999 | 28 | 12.8% |
| $75,000 to $99,999 | 21 | 9.6% |
| $100,000 to $149,999 | 38 | 17.4% |
| $150,000 to $199,999 | 26 | 11.9% |
| $200,000+ | 65 | 29.8% |
Household Income by Householder Age in Weekapaug
The median household income in Weekapaug is $110,000, with the highest median household income of $227,143 found in the 25 to 44 years age bracket for the primary householder. A total of 28 households (12.8%) fall into this category.
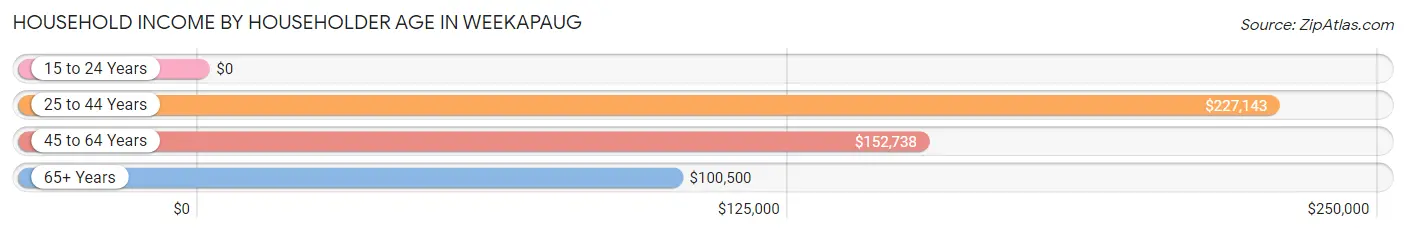
| Income Bracket | # Households | Median Income |
| 15 to 24 Years | 0 (0.0%) | $0 |
| 25 to 44 Years | 28 (12.8%) | $227,143 |
| 45 to 64 Years | 90 (41.3%) | $152,738 |
| 65+ Years | 100 (45.9%) | $100,500 |
| Total | 218 (100.0%) | $110,000 |
Poverty in Weekapaug
Income Below Poverty by Sex and Age in Weekapaug
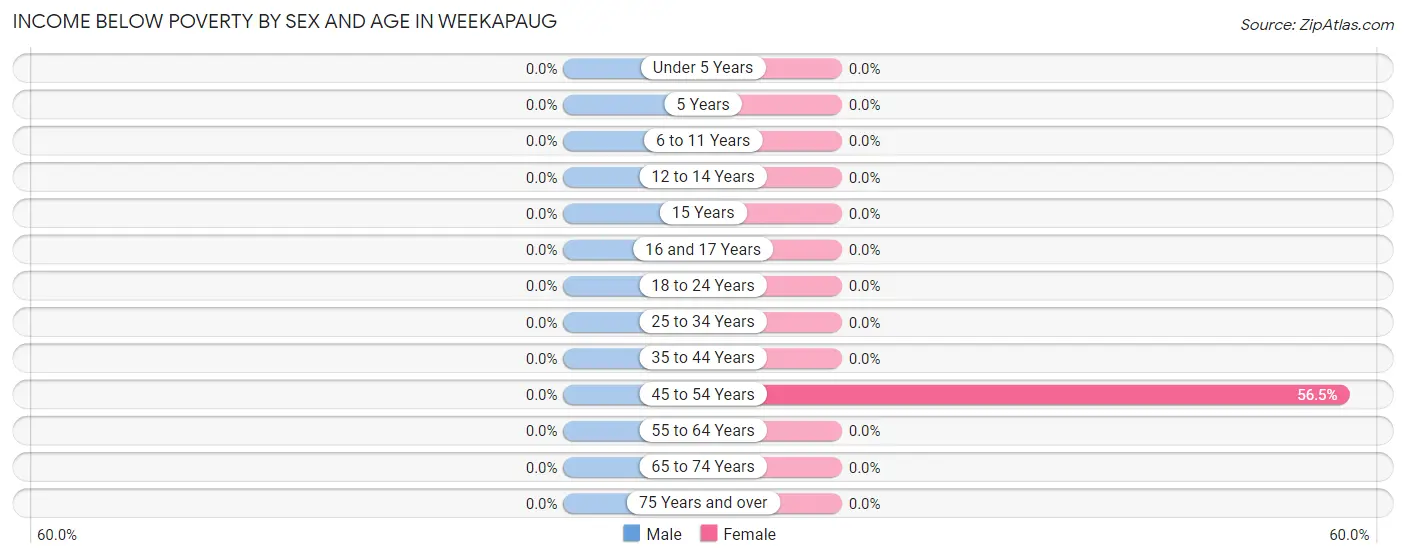
| Age Bracket | Male | Female |
| Under 5 Years | 0 (0.0%) | 0 (0.0%) |
| 5 Years | 0 (0.0%) | 0 (0.0%) |
| 6 to 11 Years | 0 (0.0%) | 0 (0.0%) |
| 12 to 14 Years | 0 (0.0%) | 0 (0.0%) |
| 15 Years | 0 (0.0%) | 0 (0.0%) |
| 16 and 17 Years | 0 (0.0%) | 0 (0.0%) |
| 18 to 24 Years | 0 (0.0%) | 0 (0.0%) |
| 25 to 34 Years | 0 (0.0%) | 0 (0.0%) |
| 35 to 44 Years | 0 (0.0%) | 0 (0.0%) |
| 45 to 54 Years | 0 (0.0%) | 13 (56.5%) |
| 55 to 64 Years | 0 (0.0%) | 0 (0.0%) |
| 65 to 74 Years | 0 (0.0%) | 0 (0.0%) |
| 75 Years and over | 0 (0.0%) | 0 (0.0%) |
| Total | 0 (0.0%) | 13 (4.5%) |
Income Above Poverty by Sex and Age in Weekapaug
According to the poverty statistics in Weekapaug, males aged under 5 years and females aged under 5 years are the age groups that are most secure financially, with 100.0% of males and 100.0% of females in these age groups living above the poverty line.
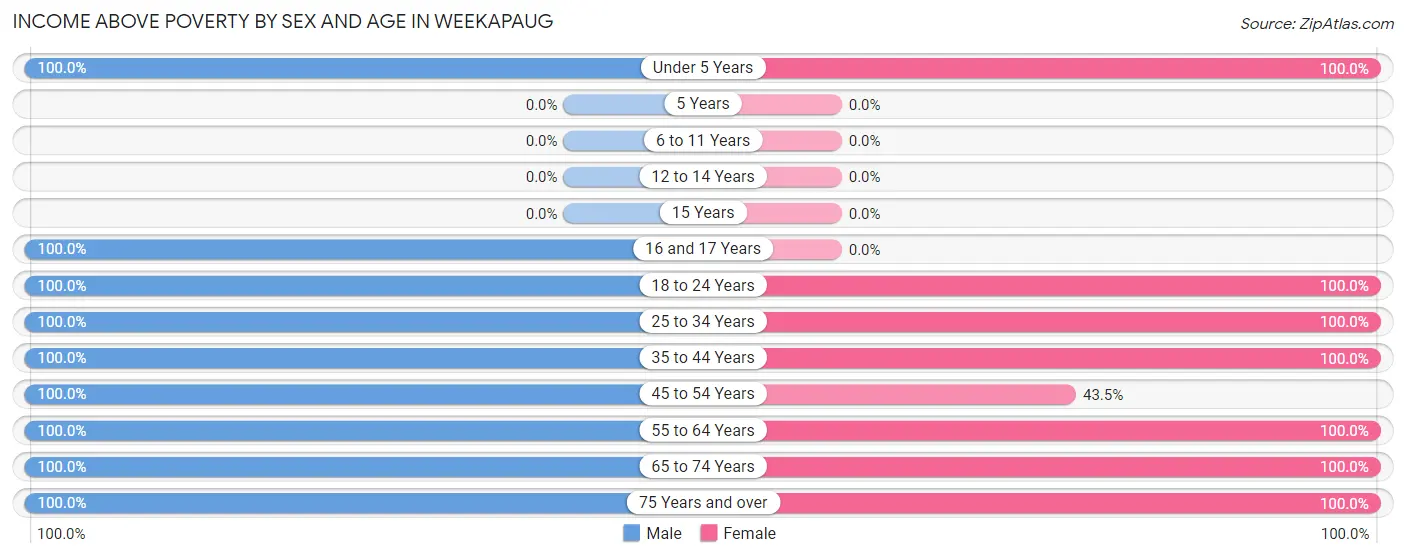
| Age Bracket | Male | Female |
| Under 5 Years | 8 (100.0%) | 19 (100.0%) |
| 5 Years | 0 (0.0%) | 0 (0.0%) |
| 6 to 11 Years | 0 (0.0%) | 0 (0.0%) |
| 12 to 14 Years | 0 (0.0%) | 0 (0.0%) |
| 15 Years | 0 (0.0%) | 0 (0.0%) |
| 16 and 17 Years | 16 (100.0%) | 0 (0.0%) |
| 18 to 24 Years | 48 (100.0%) | 64 (100.0%) |
| 25 to 34 Years | 21 (100.0%) | 15 (100.0%) |
| 35 to 44 Years | 8 (100.0%) | 7 (100.0%) |
| 45 to 54 Years | 14 (100.0%) | 10 (43.5%) |
| 55 to 64 Years | 51 (100.0%) | 71 (100.0%) |
| 65 to 74 Years | 48 (100.0%) | 46 (100.0%) |
| 75 Years and over | 19 (100.0%) | 44 (100.0%) |
| Total | 233 (100.0%) | 276 (95.5%) |
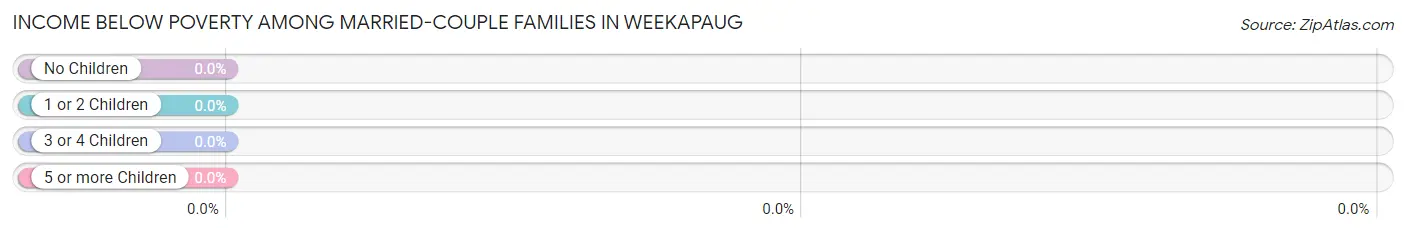
Income Below Poverty Among Married-Couple Families in Weekapaug
| Children | Above Poverty | Below Poverty |
| No Children | 104 (100.0%) | 0 (0.0%) |
| 1 or 2 Children | 20 (100.0%) | 0 (0.0%) |
| 3 or 4 Children | 0 (0.0%) | 0 (0.0%) |
| 5 or more Children | 0 (0.0%) | 0 (0.0%) |
| Total | 124 (100.0%) | 0 (0.0%) |
Income Below Poverty Among Single-Parent Households in Weekapaug
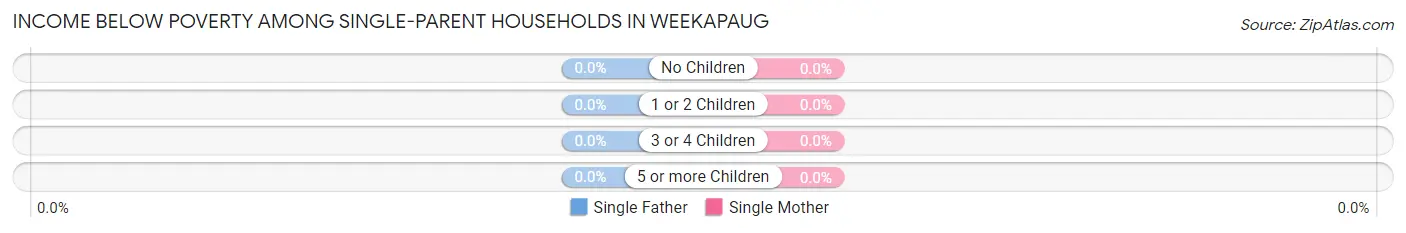
| Children | Single Father | Single Mother |
| No Children | 0 (0.0%) | 0 (0.0%) |
| 1 or 2 Children | 0 (0.0%) | 0 (0.0%) |
| 3 or 4 Children | 0 (0.0%) | 0 (0.0%) |
| 5 or more Children | 0 (0.0%) | 0 (0.0%) |
| Total | 0 (0.0%) | 0 (0.0%) |
Income Below Poverty Among Married-Couple vs Single-Parent Households in Weekapaug
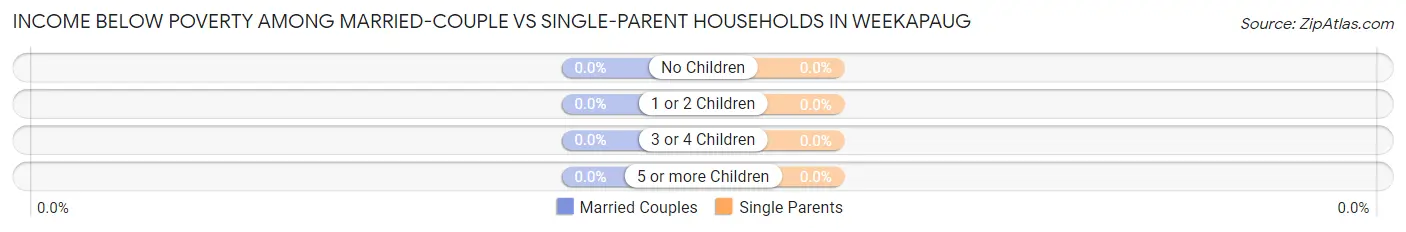
| Children | Married-Couple Families | Single-Parent Households |
| No Children | 0 (0.0%) | 0 (0.0%) |
| 1 or 2 Children | 0 (0.0%) | 0 (0.0%) |
| 3 or 4 Children | 0 (0.0%) | 0 (0.0%) |
| 5 or more Children | 0 (0.0%) | 0 (0.0%) |
| Total | 0 (0.0%) | 0 (0.0%) |
Employment Characteristics in Weekapaug
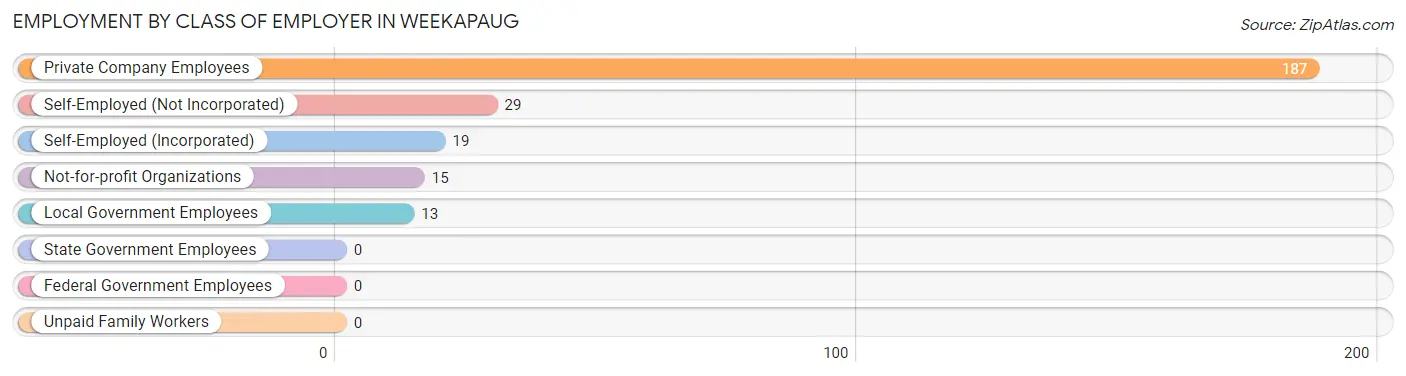
Employment by Class of Employer in Weekapaug
Among the 263 employed individuals in Weekapaug, private company employees (187 | 71.1%), self-employed (not incorporated) (29 | 11.0%), and self-employed (incorporated) (19 | 7.2%) make up the most common classes of employment.
| Employer Class | # Employees | % Employees |
| Private Company Employees | 187 | 71.1% |
| Self-Employed (Incorporated) | 19 | 7.2% |
| Self-Employed (Not Incorporated) | 29 | 11.0% |
| Not-for-profit Organizations | 15 | 5.7% |
| Local Government Employees | 13 | 4.9% |
| State Government Employees | 0 | 0.0% |
| Federal Government Employees | 0 | 0.0% |
| Unpaid Family Workers | 0 | 0.0% |
| Total | 263 | 100.0% |
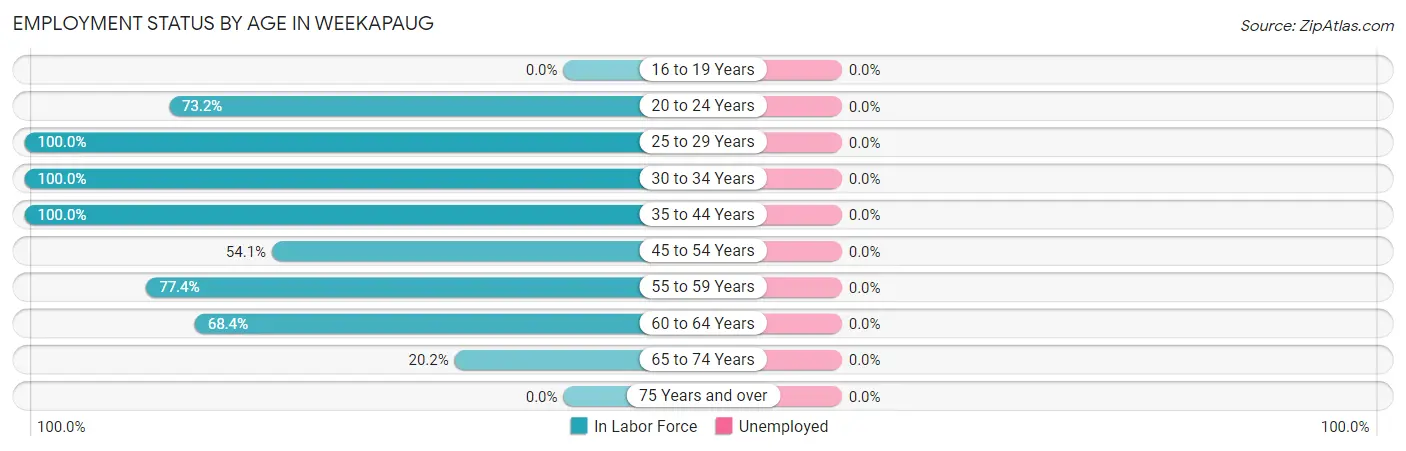
Employment Status by Age in Weekapaug
| Age Bracket | In Labor Force | Unemployed |
| 16 to 19 Years | 0 (0.0%) | 0 (0.0%) |
| 20 to 24 Years | 82 (73.2%) | 0 (0.0%) |
| 25 to 29 Years | 15 (100.0%) | 0 (0.0%) |
| 30 to 34 Years | 21 (100.0%) | 0 (0.0%) |
| 35 to 44 Years | 15 (100.0%) | 0 (0.0%) |
| 45 to 54 Years | 20 (54.1%) | 0 (0.0%) |
| 55 to 59 Years | 65 (77.4%) | 0 (0.0%) |
| 60 to 64 Years | 26 (68.4%) | 0 (0.0%) |
| 65 to 74 Years | 19 (20.2%) | 0 (0.0%) |
| 75 Years and over | 0 (0.0%) | 0 (0.0%) |
| Total | 263 (53.1%) | 0 (0.0%) |
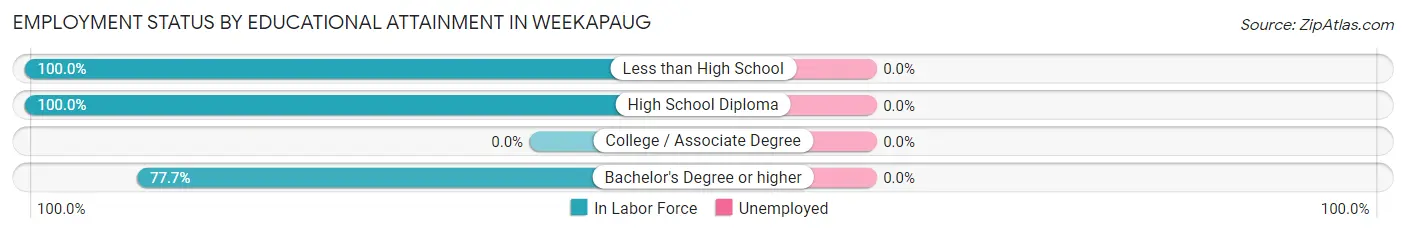
Employment Status by Educational Attainment in Weekapaug
| Educational Attainment | In Labor Force | Unemployed |
| Less than High School | 26 (100.0%) | 0 (0.0%) |
| High School Diploma | 14 (100.0%) | 0 (0.0%) |
| College / Associate Degree | 0 (0.0%) | 0 (0.0%) |
| Bachelor's Degree or higher | 122 (77.7%) | 0 (0.0%) |
| Total | 162 (77.1%) | 0 (0.0%) |
Employment Occupations by Sex in Weekapaug
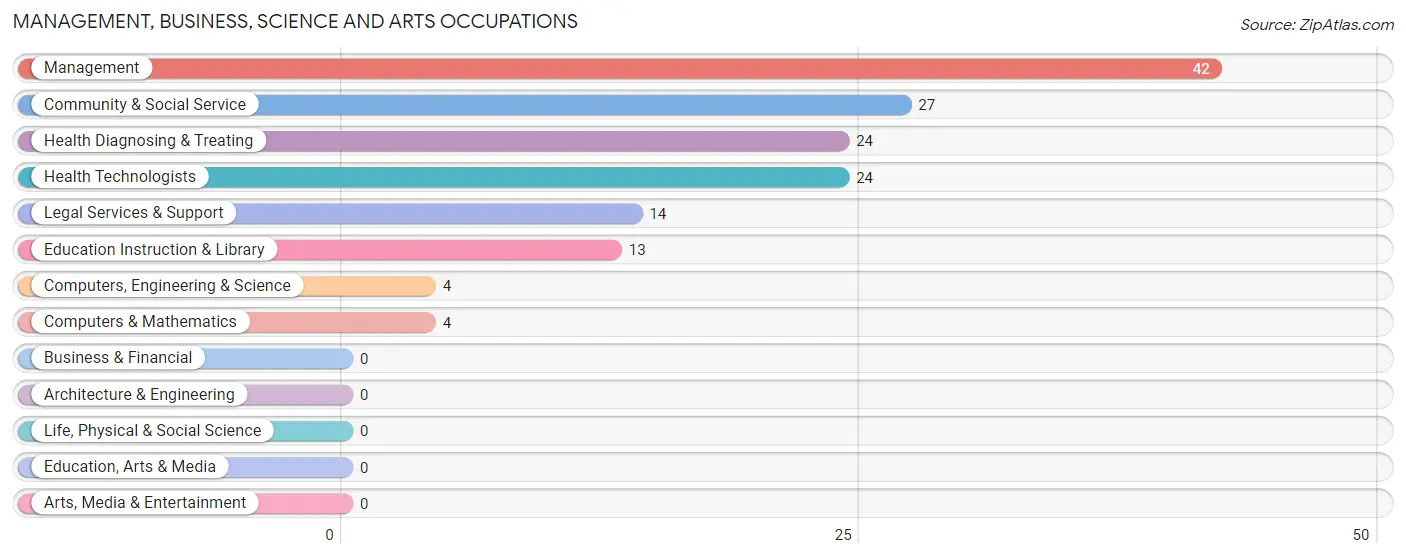
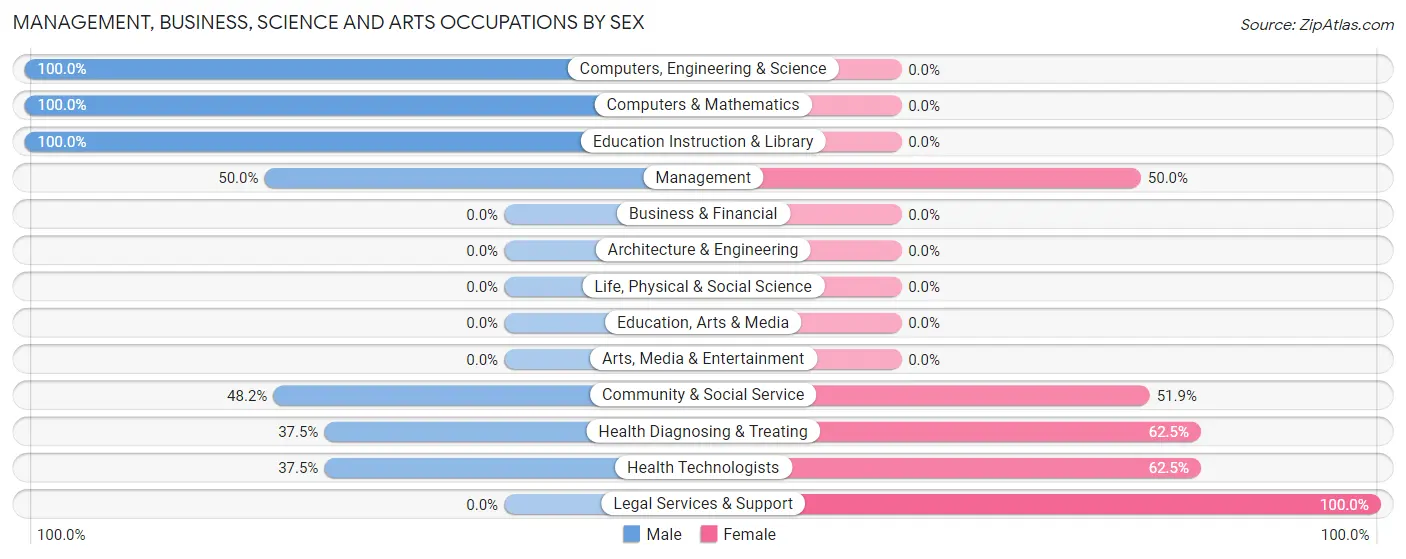
Management, Business, Science and Arts Occupations
The most common Management, Business, Science and Arts occupations in Weekapaug are Management (42 | 16.0%), Community & Social Service (27 | 10.3%), Health Diagnosing & Treating (24 | 9.1%), Health Technologists (24 | 9.1%), and Legal Services & Support (14 | 5.3%).
Management, Business, Science and Arts Occupations by Sex
Within the Management, Business, Science and Arts occupations in Weekapaug, the most male-oriented occupations are Computers, Engineering & Science (100.0%), Computers & Mathematics (100.0%), and Education Instruction & Library (100.0%), while the most female-oriented occupations are Legal Services & Support (100.0%), Health Diagnosing & Treating (62.5%), and Health Technologists (62.5%).
| Occupation | Male | Female |
| Management | 21 (50.0%) | 21 (50.0%) |
| Business & Financial | 0 (0.0%) | 0 (0.0%) |
| Computers, Engineering & Science | 4 (100.0%) | 0 (0.0%) |
| Computers & Mathematics | 4 (100.0%) | 0 (0.0%) |
| Architecture & Engineering | 0 (0.0%) | 0 (0.0%) |
| Life, Physical & Social Science | 0 (0.0%) | 0 (0.0%) |
| Community & Social Service | 13 (48.1%) | 14 (51.8%) |
| Education, Arts & Media | 0 (0.0%) | 0 (0.0%) |
| Legal Services & Support | 0 (0.0%) | 14 (100.0%) |
| Education Instruction & Library | 13 (100.0%) | 0 (0.0%) |
| Arts, Media & Entertainment | 0 (0.0%) | 0 (0.0%) |
| Health Diagnosing & Treating | 9 (37.5%) | 15 (62.5%) |
| Health Technologists | 9 (37.5%) | 15 (62.5%) |
| Total (Category) | 47 (48.4%) | 50 (51.5%) |
| Total (Overall) | 126 (47.9%) | 137 (52.1%) |
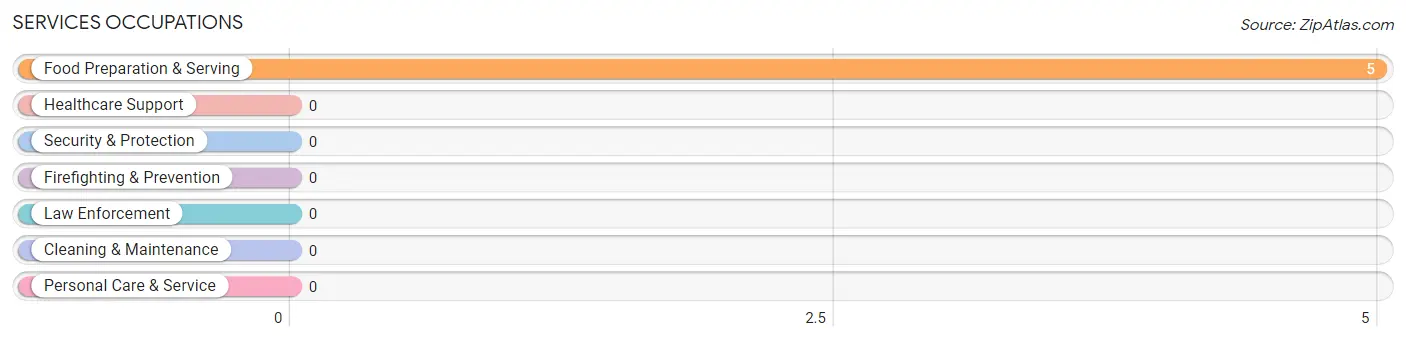
Services Occupations
The most common Services occupations in Weekapaug are , and Food Preparation & Serving (5 | 1.9%).
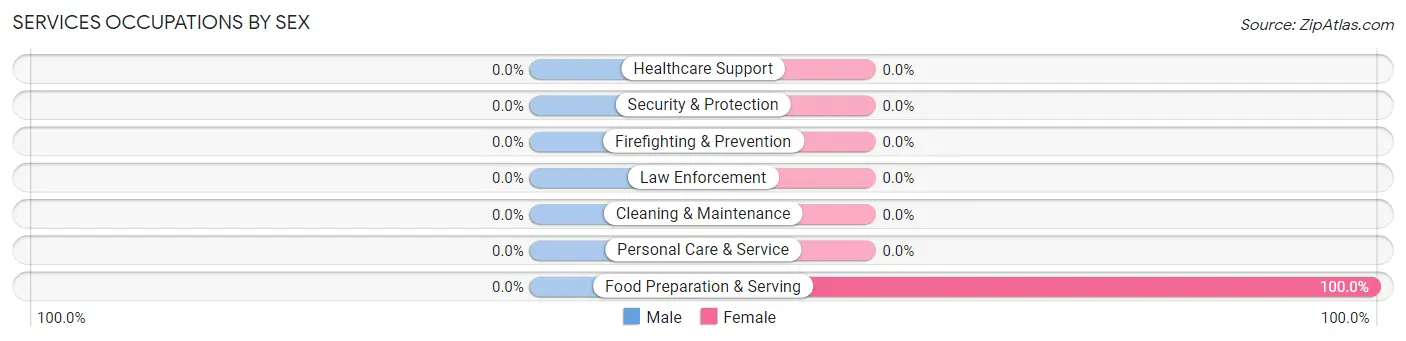
Services Occupations by Sex
| Occupation | Male | Female |
| Healthcare Support | 0 (0.0%) | 0 (0.0%) |
| Security & Protection | 0 (0.0%) | 0 (0.0%) |
| Firefighting & Prevention | 0 (0.0%) | 0 (0.0%) |
| Law Enforcement | 0 (0.0%) | 0 (0.0%) |
| Food Preparation & Serving | 0 (0.0%) | 5 (100.0%) |
| Cleaning & Maintenance | 0 (0.0%) | 0 (0.0%) |
| Personal Care & Service | 0 (0.0%) | 0 (0.0%) |
| Total (Category) | 0 (0.0%) | 5 (100.0%) |
| Total (Overall) | 126 (47.9%) | 137 (52.1%) |
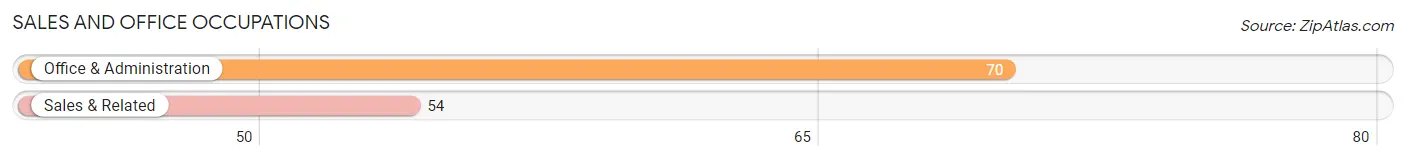
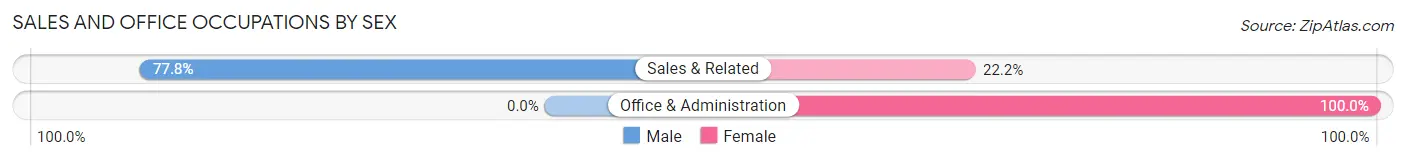
Sales and Office Occupations
The most common Sales and Office occupations in Weekapaug are Office & Administration (70 | 26.6%), and Sales & Related (54 | 20.5%).
Sales and Office Occupations by Sex
| Occupation | Male | Female |
| Sales & Related | 42 (77.8%) | 12 (22.2%) |
| Office & Administration | 0 (0.0%) | 70 (100.0%) |
| Total (Category) | 42 (33.9%) | 82 (66.1%) |
| Total (Overall) | 126 (47.9%) | 137 (52.1%) |
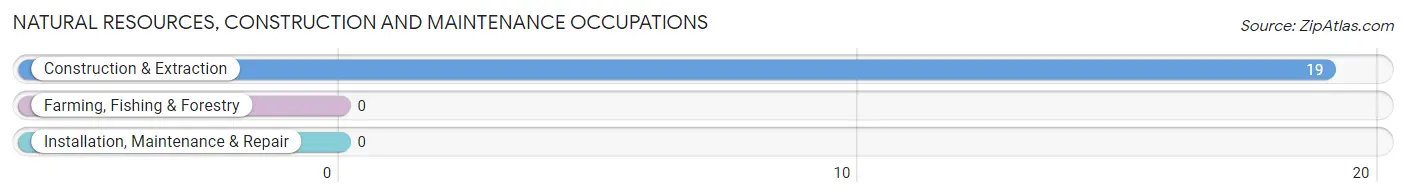
Natural Resources, Construction and Maintenance Occupations
The most common Natural Resources, Construction and Maintenance occupations in Weekapaug are , and Construction & Extraction (19 | 7.2%).
Natural Resources, Construction and Maintenance Occupations by Sex
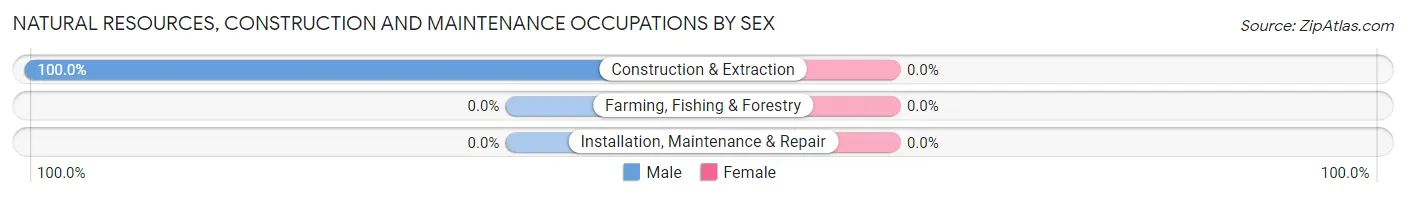
| Occupation | Male | Female |
| Farming, Fishing & Forestry | 0 (0.0%) | 0 (0.0%) |
| Construction & Extraction | 19 (100.0%) | 0 (0.0%) |
| Installation, Maintenance & Repair | 0 (0.0%) | 0 (0.0%) |
| Total (Category) | 19 (100.0%) | 0 (0.0%) |
| Total (Overall) | 126 (47.9%) | 137 (52.1%) |
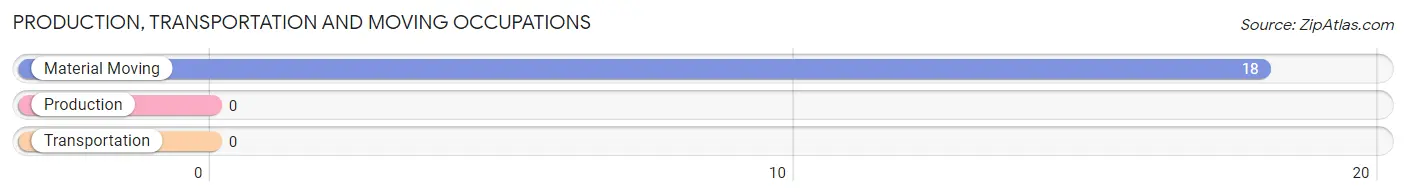
Production, Transportation and Moving Occupations
The most common Production, Transportation and Moving occupations in Weekapaug are , and Material Moving (18 | 6.8%).
Production, Transportation and Moving Occupations by Sex
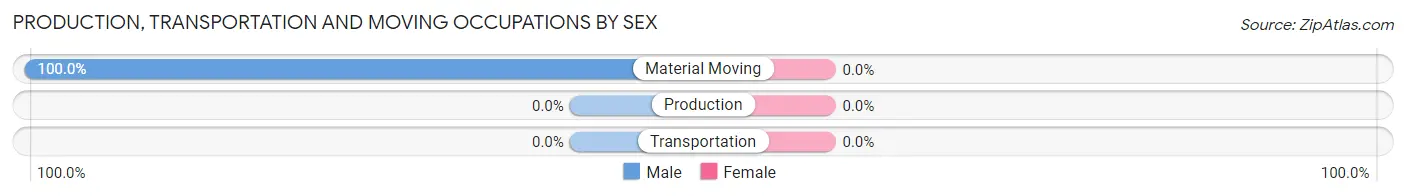
| Occupation | Male | Female |
| Production | 0 (0.0%) | 0 (0.0%) |
| Transportation | 0 (0.0%) | 0 (0.0%) |
| Material Moving | 18 (100.0%) | 0 (0.0%) |
| Total (Category) | 18 (100.0%) | 0 (0.0%) |
| Total (Overall) | 126 (47.9%) | 137 (52.1%) |
Employment Industries by Sex in Weekapaug
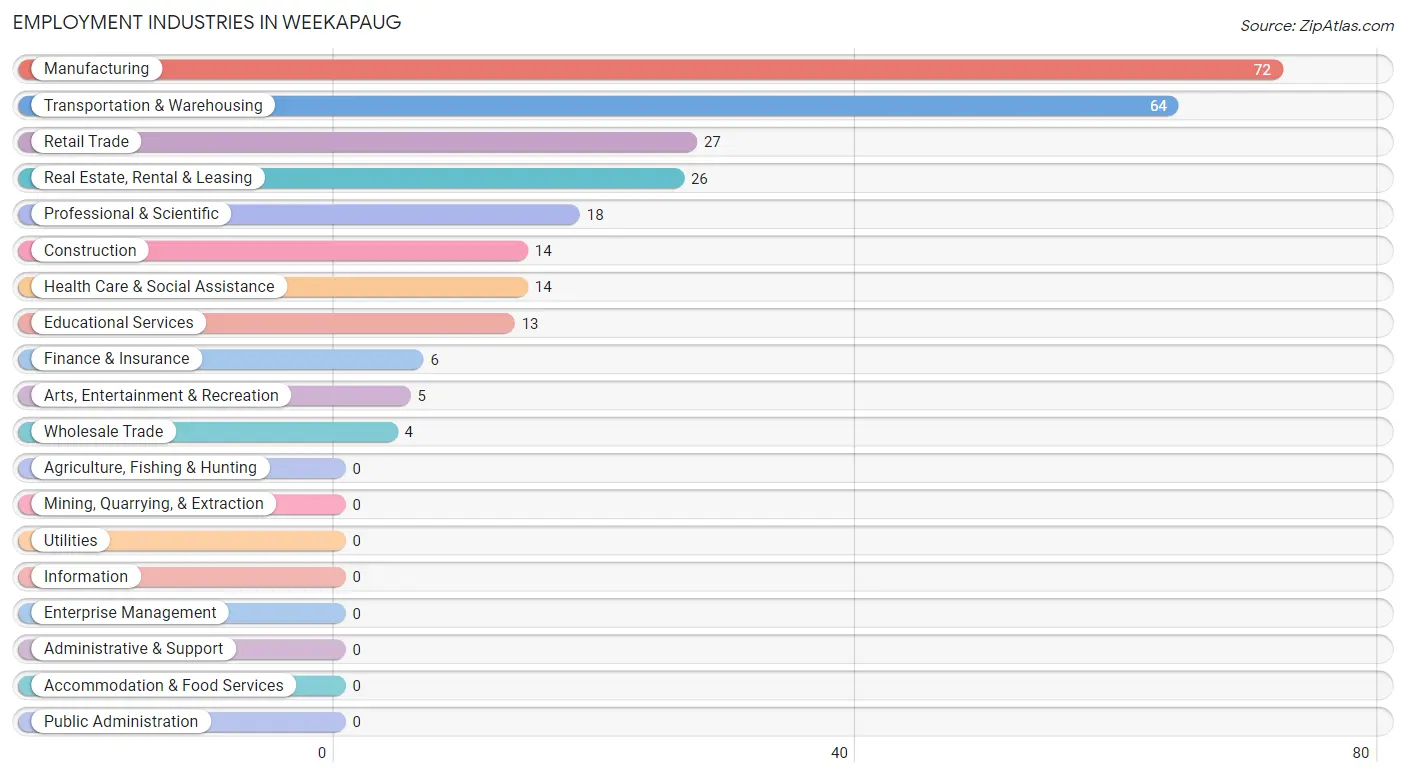
Employment Industries in Weekapaug
The major employment industries in Weekapaug include Manufacturing (72 | 27.4%), Transportation & Warehousing (64 | 24.3%), Retail Trade (27 | 10.3%), Real Estate, Rental & Leasing (26 | 9.9%), and Professional & Scientific (18 | 6.8%).
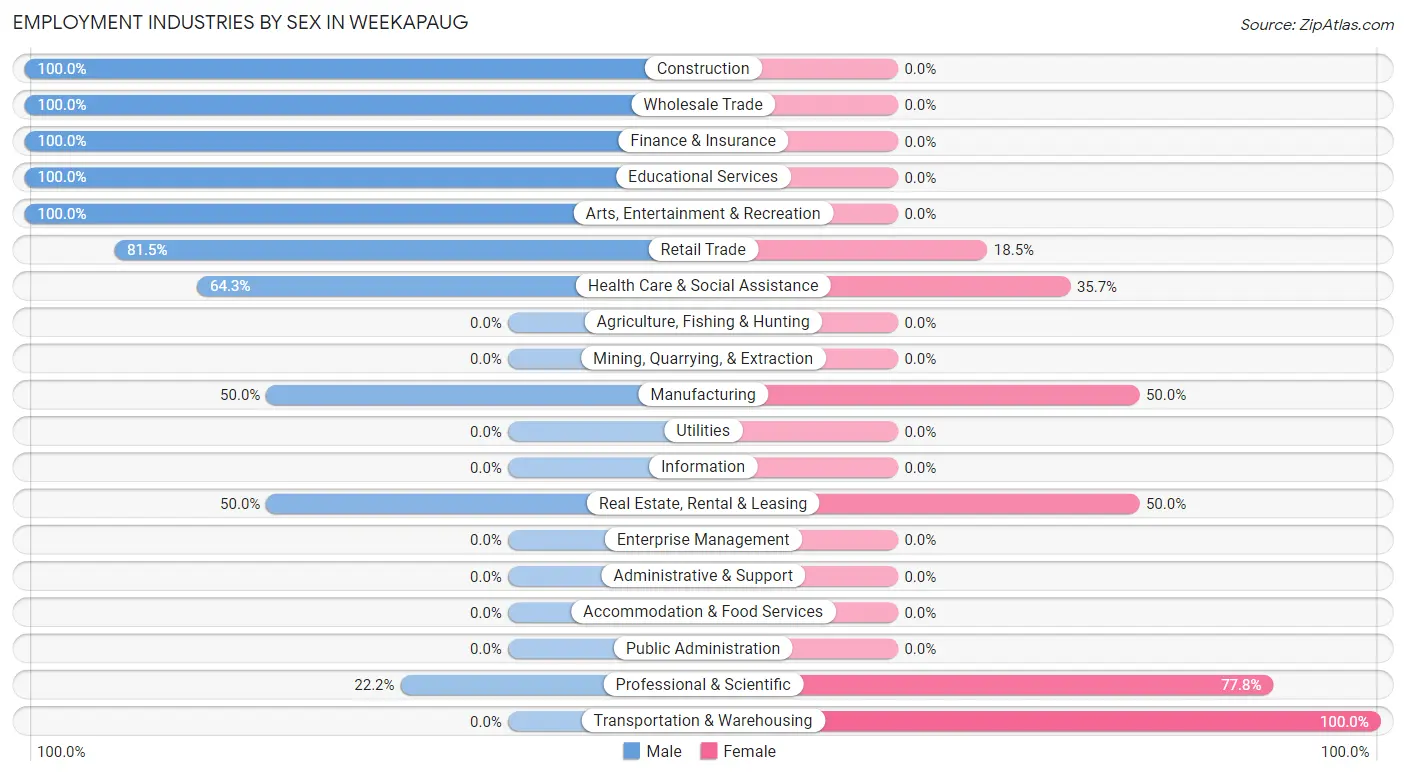
Employment Industries by Sex in Weekapaug
The Weekapaug industries that see more men than women are Construction (100.0%), Wholesale Trade (100.0%), and Finance & Insurance (100.0%), whereas the industries that tend to have a higher number of women are Transportation & Warehousing (100.0%), Professional & Scientific (77.8%), and Manufacturing (50.0%).
| Industry | Male | Female |
| Agriculture, Fishing & Hunting | 0 (0.0%) | 0 (0.0%) |
| Mining, Quarrying, & Extraction | 0 (0.0%) | 0 (0.0%) |
| Construction | 14 (100.0%) | 0 (0.0%) |
| Manufacturing | 36 (50.0%) | 36 (50.0%) |
| Wholesale Trade | 4 (100.0%) | 0 (0.0%) |
| Retail Trade | 22 (81.5%) | 5 (18.5%) |
| Transportation & Warehousing | 0 (0.0%) | 64 (100.0%) |
| Utilities | 0 (0.0%) | 0 (0.0%) |
| Information | 0 (0.0%) | 0 (0.0%) |
| Finance & Insurance | 6 (100.0%) | 0 (0.0%) |
| Real Estate, Rental & Leasing | 13 (50.0%) | 13 (50.0%) |
| Professional & Scientific | 4 (22.2%) | 14 (77.8%) |
| Enterprise Management | 0 (0.0%) | 0 (0.0%) |
| Administrative & Support | 0 (0.0%) | 0 (0.0%) |
| Educational Services | 13 (100.0%) | 0 (0.0%) |
| Health Care & Social Assistance | 9 (64.3%) | 5 (35.7%) |
| Arts, Entertainment & Recreation | 5 (100.0%) | 0 (0.0%) |
| Accommodation & Food Services | 0 (0.0%) | 0 (0.0%) |
| Public Administration | 0 (0.0%) | 0 (0.0%) |
| Total | 126 (47.9%) | 137 (52.1%) |
Education in Weekapaug
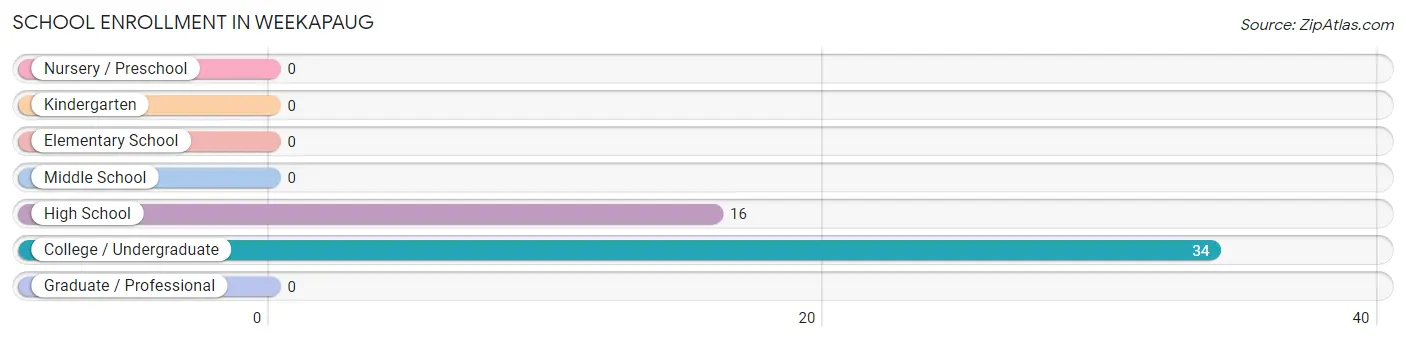
School Enrollment in Weekapaug
The most common levels of schooling among the 50 students in Weekapaug are college / undergraduate (34 | 68.0%), and high school (16 | 32.0%).
| School Level | # Students | % Students |
| Nursery / Preschool | 0 | 0.0% |
| Kindergarten | 0 | 0.0% |
| Elementary School | 0 | 0.0% |
| Middle School | 0 | 0.0% |
| High School | 16 | 32.0% |
| College / Undergraduate | 34 | 68.0% |
| Graduate / Professional | 0 | 0.0% |
| Total | 50 | 100.0% |
School Enrollment by Age by Funding Source in Weekapaug
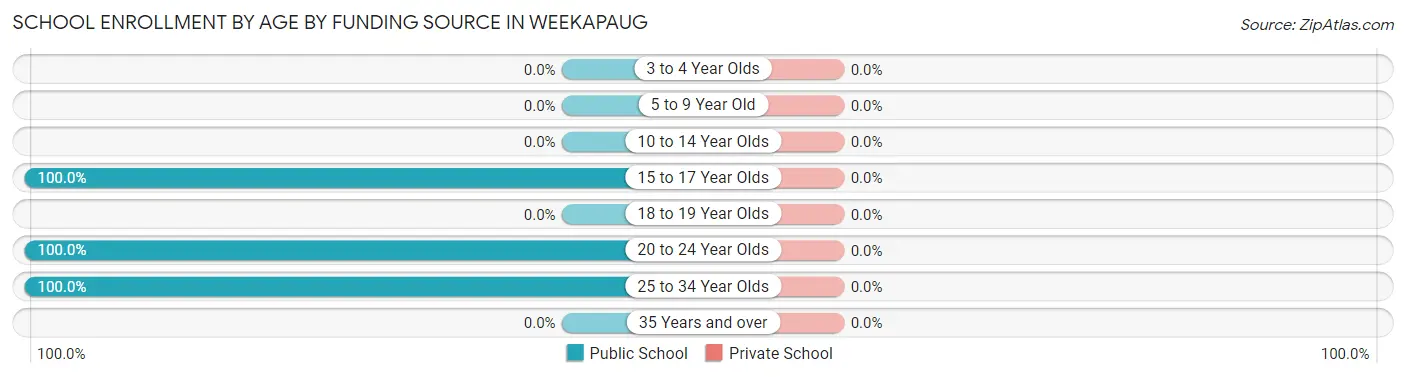
| Age Bracket | Public School | Private School |
| 3 to 4 Year Olds | 0 (0.0%) | 0 (0.0%) |
| 5 to 9 Year Old | 0 (0.0%) | 0 (0.0%) |
| 10 to 14 Year Olds | 0 (0.0%) | 0 (0.0%) |
| 15 to 17 Year Olds | 16 (100.0%) | 0 (0.0%) |
| 18 to 19 Year Olds | 0 (0.0%) | 0 (0.0%) |
| 20 to 24 Year Olds | 30 (100.0%) | 0 (0.0%) |
| 25 to 34 Year Olds | 4 (100.0%) | 0 (0.0%) |
| 35 Years and over | 0 (0.0%) | 0 (0.0%) |
| Total | 50 (100.0%) | 0 (0.0%) |
Educational Attainment by Field of Study in Weekapaug
Business (48 | 19.1%), education (29 | 11.5%), liberal arts & history (28 | 11.1%), visual & performing arts (25 | 9.9%), and bio, nature & agricultural (23 | 9.1%) are the most common fields of study among 252 individuals in Weekapaug who have obtained a bachelor's degree or higher.
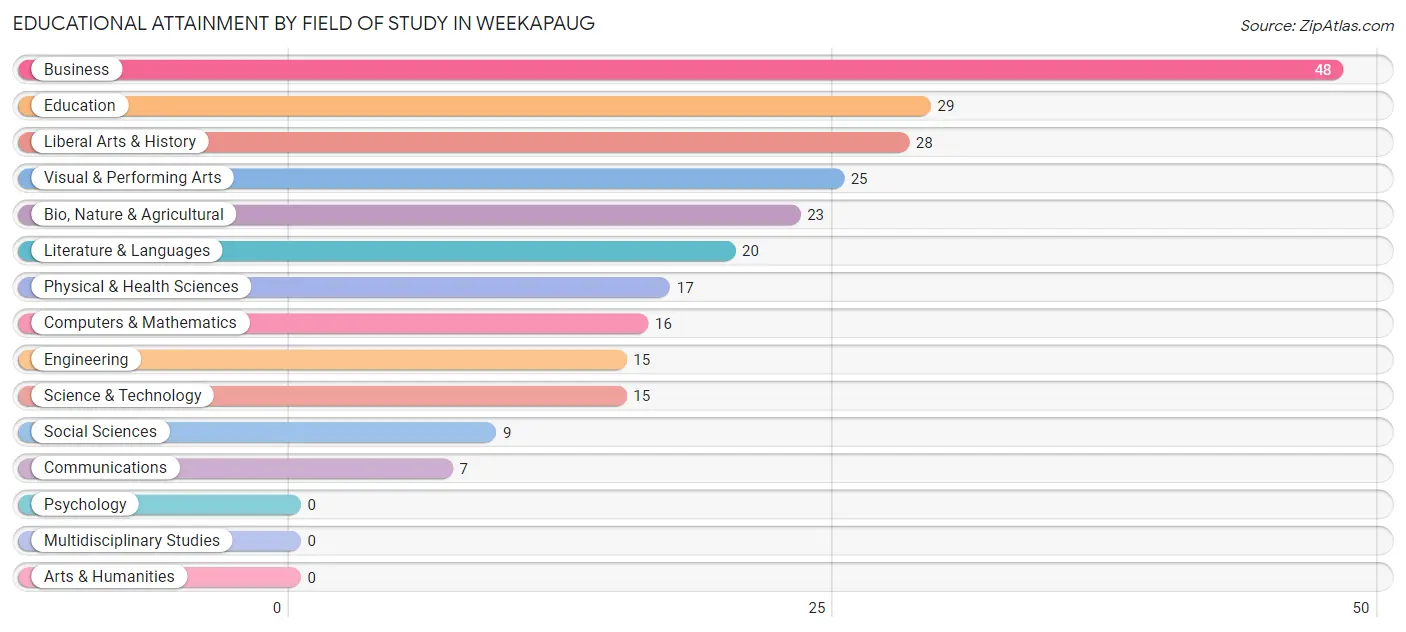
| Field of Study | # Graduates | % Graduates |
| Computers & Mathematics | 16 | 6.4% |
| Bio, Nature & Agricultural | 23 | 9.1% |
| Physical & Health Sciences | 17 | 6.8% |
| Psychology | 0 | 0.0% |
| Social Sciences | 9 | 3.6% |
| Engineering | 15 | 5.9% |
| Multidisciplinary Studies | 0 | 0.0% |
| Science & Technology | 15 | 5.9% |
| Business | 48 | 19.1% |
| Education | 29 | 11.5% |
| Literature & Languages | 20 | 7.9% |
| Liberal Arts & History | 28 | 11.1% |
| Visual & Performing Arts | 25 | 9.9% |
| Communications | 7 | 2.8% |
| Arts & Humanities | 0 | 0.0% |
| Total | 252 | 100.0% |
Transportation & Commute in Weekapaug
Vehicle Availability by Sex in Weekapaug
The most prevalent vehicle ownership categories in Weekapaug are males with 3 vehicles (50, accounting for 39.7%) and females with 3 vehicles (90, making up 36.5%).
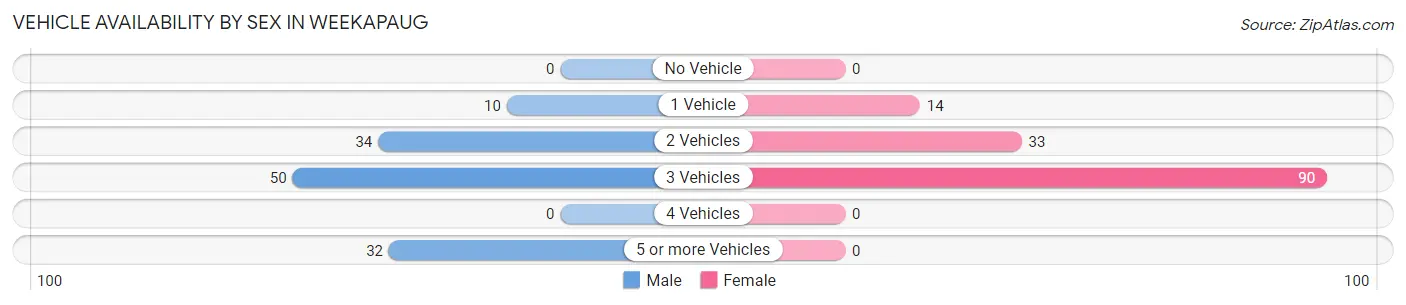
| Vehicles Available | Male | Female |
| No Vehicle | 0 (0.0%) | 0 (0.0%) |
| 1 Vehicle | 10 (7.9%) | 14 (10.2%) |
| 2 Vehicles | 34 (27.0%) | 33 (24.1%) |
| 3 Vehicles | 50 (39.7%) | 90 (65.7%) |
| 4 Vehicles | 0 (0.0%) | 0 (0.0%) |
| 5 or more Vehicles | 32 (25.4%) | 0 (0.0%) |
| Total | 126 (100.0%) | 137 (100.0%) |
Commute Time in Weekapaug
The most frequently occuring commute durations in Weekapaug are less than 5 minutes (68 commuters, 26.5%), 15 to 19 minutes (61 commuters, 23.7%), and 45 to 59 minutes (29 commuters, 11.3%).
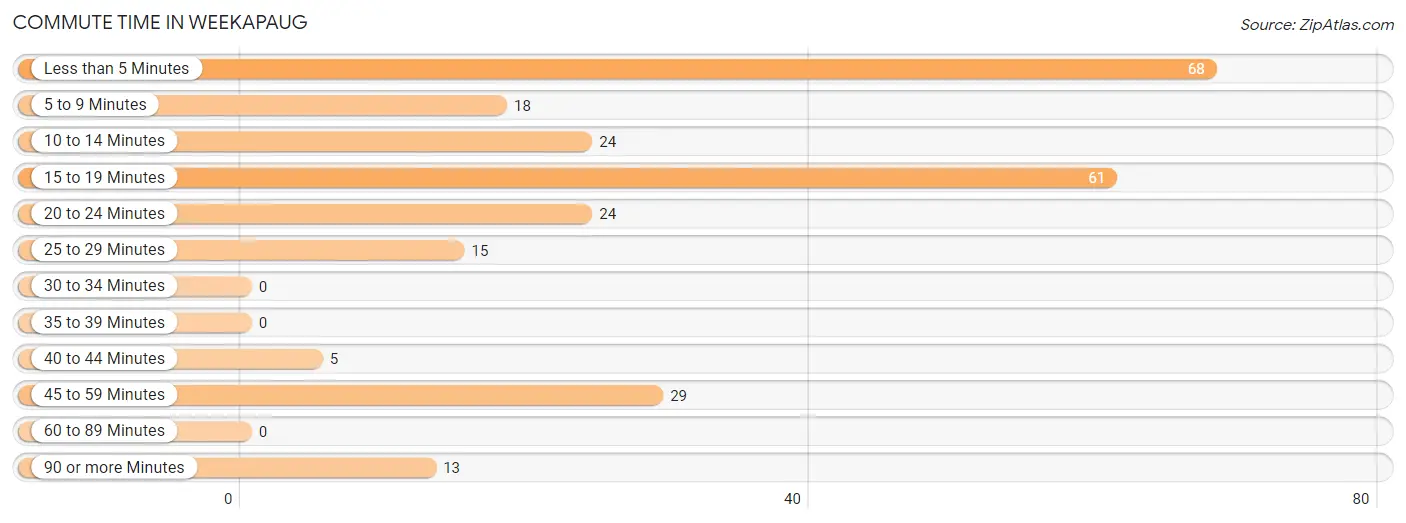
| Commute Time | # Commuters | % Commuters |
| Less than 5 Minutes | 68 | 26.5% |
| 5 to 9 Minutes | 18 | 7.0% |
| 10 to 14 Minutes | 24 | 9.3% |
| 15 to 19 Minutes | 61 | 23.7% |
| 20 to 24 Minutes | 24 | 9.3% |
| 25 to 29 Minutes | 15 | 5.8% |
| 30 to 34 Minutes | 0 | 0.0% |
| 35 to 39 Minutes | 0 | 0.0% |
| 40 to 44 Minutes | 5 | 1.9% |
| 45 to 59 Minutes | 29 | 11.3% |
| 60 to 89 Minutes | 0 | 0.0% |
| 90 or more Minutes | 13 | 5.1% |
Commute Time by Sex in Weekapaug
The most common commute times in Weekapaug are 15 to 19 minutes (35 commuters, 29.2%) for males and less than 5 minutes (64 commuters, 46.7%) for females.
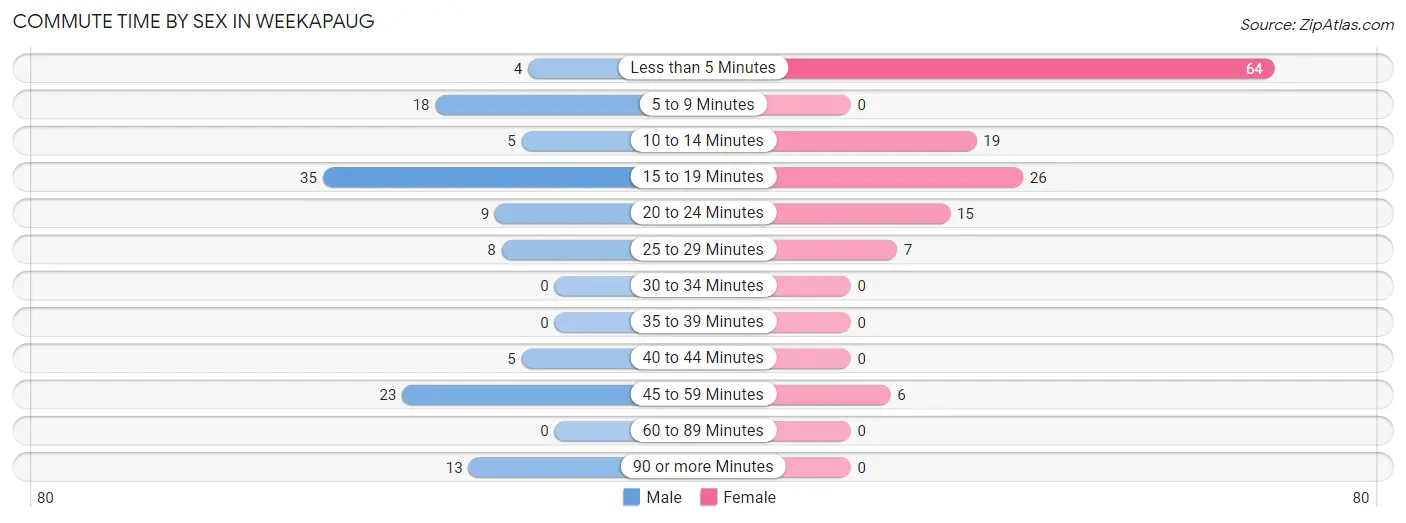
| Commute Time | Male | Female |
| Less than 5 Minutes | 4 (3.3%) | 64 (46.7%) |
| 5 to 9 Minutes | 18 (15.0%) | 0 (0.0%) |
| 10 to 14 Minutes | 5 (4.2%) | 19 (13.9%) |
| 15 to 19 Minutes | 35 (29.2%) | 26 (19.0%) |
| 20 to 24 Minutes | 9 (7.5%) | 15 (11.0%) |
| 25 to 29 Minutes | 8 (6.7%) | 7 (5.1%) |
| 30 to 34 Minutes | 0 (0.0%) | 0 (0.0%) |
| 35 to 39 Minutes | 0 (0.0%) | 0 (0.0%) |
| 40 to 44 Minutes | 5 (4.2%) | 0 (0.0%) |
| 45 to 59 Minutes | 23 (19.2%) | 6 (4.4%) |
| 60 to 89 Minutes | 0 (0.0%) | 0 (0.0%) |
| 90 or more Minutes | 13 (10.8%) | 0 (0.0%) |
Time of Departure to Work by Sex in Weekapaug
The most frequent times of departure to work in Weekapaug are 12:00 AM to 4:59 AM (31, 25.8%) for males and 8:00 AM to 8:29 AM (79, 57.7%) for females.
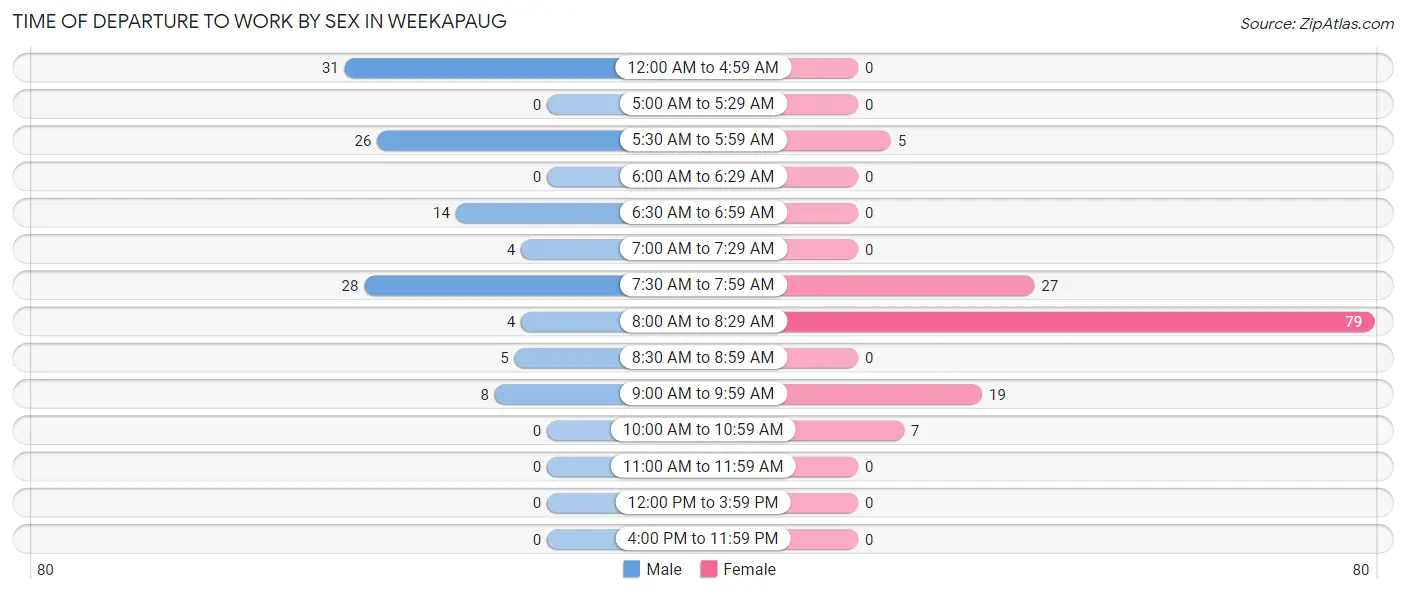
| Time of Departure | Male | Female |
| 12:00 AM to 4:59 AM | 31 (25.8%) | 0 (0.0%) |
| 5:00 AM to 5:29 AM | 0 (0.0%) | 0 (0.0%) |
| 5:30 AM to 5:59 AM | 26 (21.7%) | 5 (3.6%) |
| 6:00 AM to 6:29 AM | 0 (0.0%) | 0 (0.0%) |
| 6:30 AM to 6:59 AM | 14 (11.7%) | 0 (0.0%) |
| 7:00 AM to 7:29 AM | 4 (3.3%) | 0 (0.0%) |
| 7:30 AM to 7:59 AM | 28 (23.3%) | 27 (19.7%) |
| 8:00 AM to 8:29 AM | 4 (3.3%) | 79 (57.7%) |
| 8:30 AM to 8:59 AM | 5 (4.2%) | 0 (0.0%) |
| 9:00 AM to 9:59 AM | 8 (6.7%) | 19 (13.9%) |
| 10:00 AM to 10:59 AM | 0 (0.0%) | 7 (5.1%) |
| 11:00 AM to 11:59 AM | 0 (0.0%) | 0 (0.0%) |
| 12:00 PM to 3:59 PM | 0 (0.0%) | 0 (0.0%) |
| 4:00 PM to 11:59 PM | 0 (0.0%) | 0 (0.0%) |
| Total | 120 (100.0%) | 137 (100.0%) |
Housing Occupancy in Weekapaug
Occupancy by Ownership in Weekapaug
Of the total 218 dwellings in Weekapaug, owner-occupied units account for 218 (100.0%), while renter-occupied units make up 0 (0.0%).
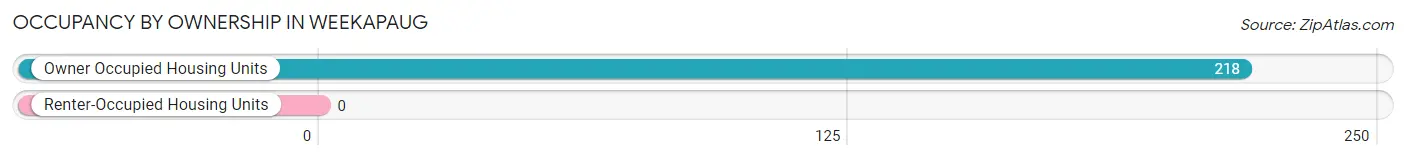
| Occupancy | # Housing Units | % Housing Units |
| Owner Occupied Housing Units | 218 | 100.0% |
| Renter-Occupied Housing Units | 0 | 0.0% |
| Total Occupied Housing Units | 218 | 100.0% |
Occupancy by Household Size in Weekapaug
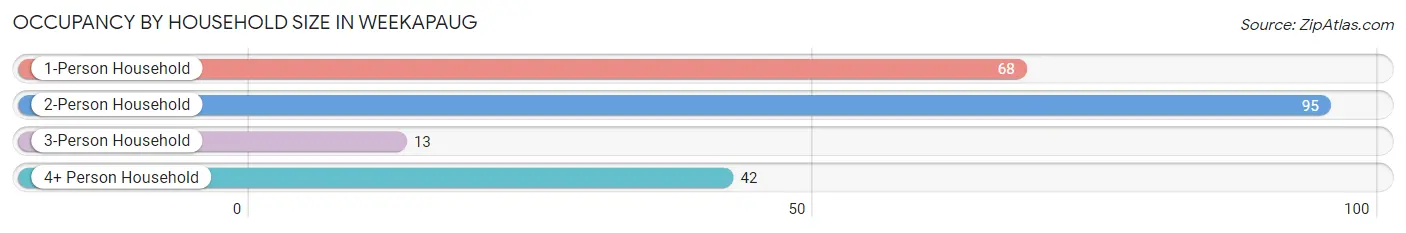
| Household Size | # Housing Units | % Housing Units |
| 1-Person Household | 68 | 31.2% |
| 2-Person Household | 95 | 43.6% |
| 3-Person Household | 13 | 6.0% |
| 4+ Person Household | 42 | 19.3% |
| Total Housing Units | 218 | 100.0% |
Occupancy by Ownership by Household Size in Weekapaug
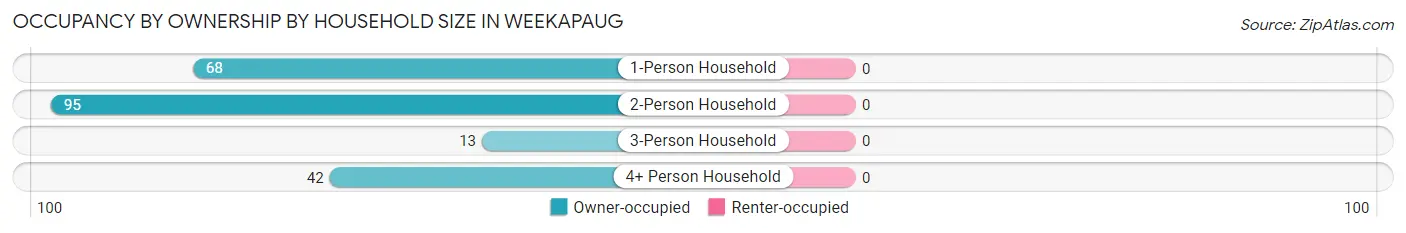
| Household Size | Owner-occupied | Renter-occupied |
| 1-Person Household | 68 (100.0%) | 0 (0.0%) |
| 2-Person Household | 95 (100.0%) | 0 (0.0%) |
| 3-Person Household | 13 (100.0%) | 0 (0.0%) |
| 4+ Person Household | 42 (100.0%) | 0 (0.0%) |
| Total Housing Units | 218 (100.0%) | 0 (0.0%) |
Occupancy by Educational Attainment in Weekapaug
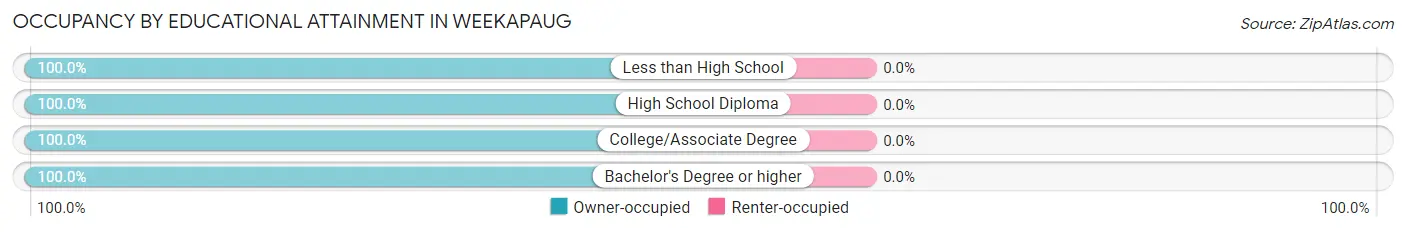
| Household Size | Owner-occupied | Renter-occupied |
| Less than High School | 5 (100.0%) | 0 (0.0%) |
| High School Diploma | 39 (100.0%) | 0 (0.0%) |
| College/Associate Degree | 10 (100.0%) | 0 (0.0%) |
| Bachelor's Degree or higher | 164 (100.0%) | 0 (0.0%) |
Occupancy by Age of Householder in Weekapaug
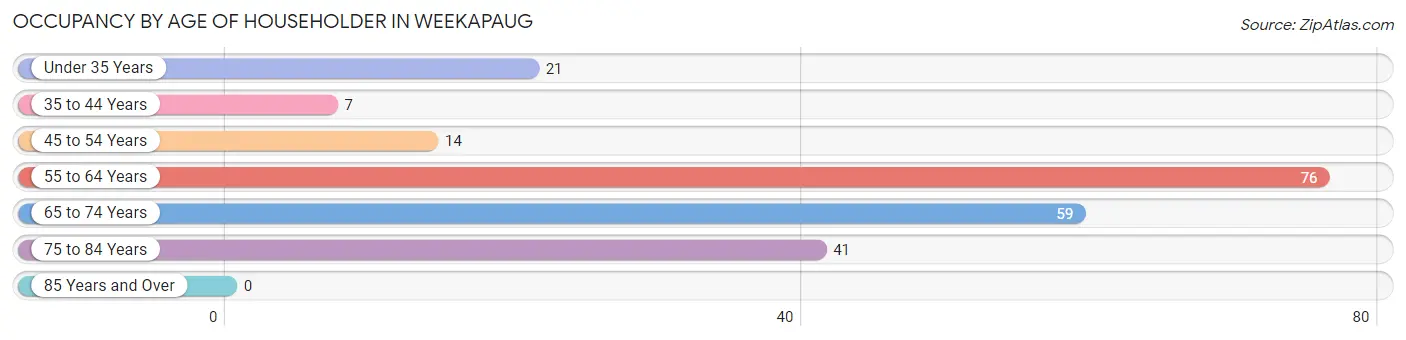
| Age Bracket | # Households | % Households |
| Under 35 Years | 21 | 9.6% |
| 35 to 44 Years | 7 | 3.2% |
| 45 to 54 Years | 14 | 6.4% |
| 55 to 64 Years | 76 | 34.9% |
| 65 to 74 Years | 59 | 27.1% |
| 75 to 84 Years | 41 | 18.8% |
| 85 Years and Over | 0 | 0.0% |
| Total | 218 | 100.0% |
Housing Finances in Weekapaug
Median Income by Occupancy in Weekapaug
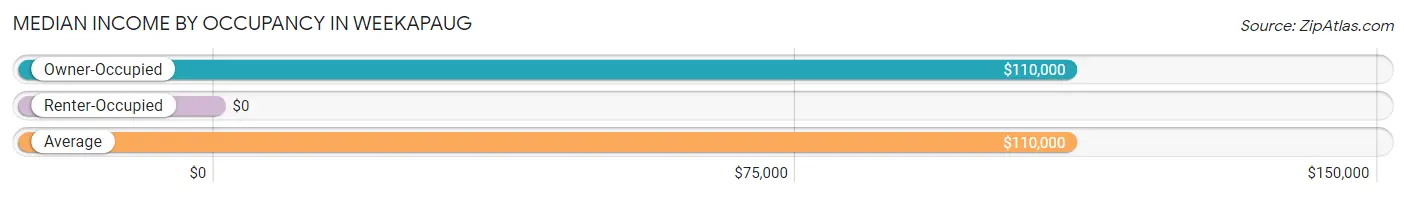
| Occupancy Type | # Households | Median Income |
| Owner-Occupied | 218 (100.0%) | $110,000 |
| Renter-Occupied | 0 (0.0%) | $0 |
| Average | 218 (100.0%) | $110,000 |
Occupancy by Householder Income Bracket in Weekapaug
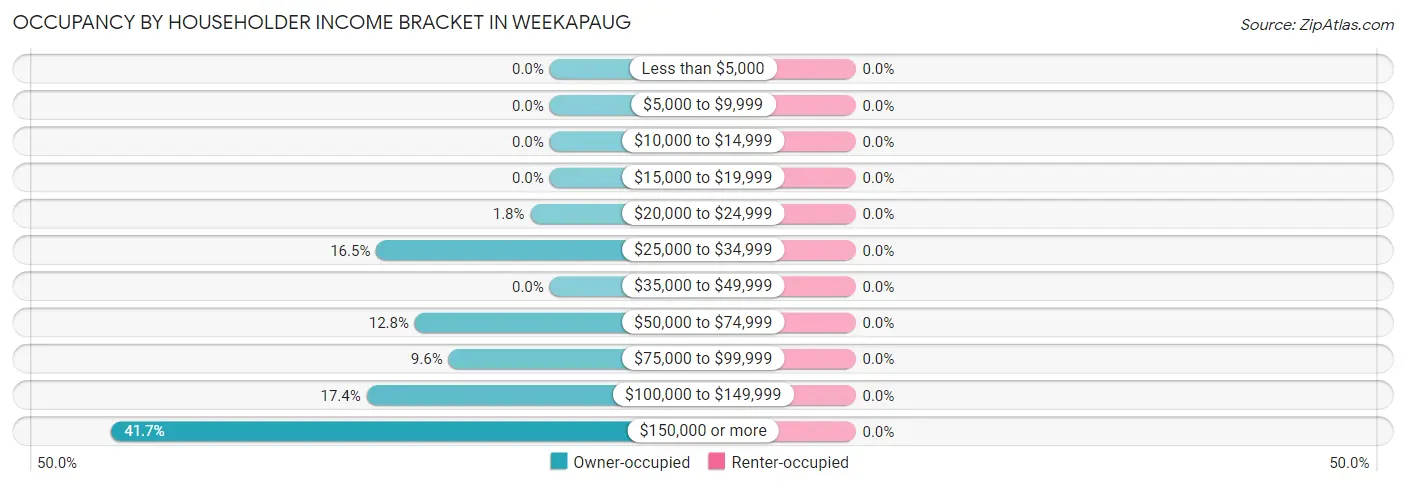
| Income Bracket | Owner-occupied | Renter-occupied |
| Less than $5,000 | 0 (0.0%) | 0 (0.0%) |
| $5,000 to $9,999 | 0 (0.0%) | 0 (0.0%) |
| $10,000 to $14,999 | 0 (0.0%) | 0 (0.0%) |
| $15,000 to $19,999 | 0 (0.0%) | 0 (0.0%) |
| $20,000 to $24,999 | 4 (1.8%) | 0 (0.0%) |
| $25,000 to $34,999 | 36 (16.5%) | 0 (0.0%) |
| $35,000 to $49,999 | 0 (0.0%) | 0 (0.0%) |
| $50,000 to $74,999 | 28 (12.8%) | 0 (0.0%) |
| $75,000 to $99,999 | 21 (9.6%) | 0 (0.0%) |
| $100,000 to $149,999 | 38 (17.4%) | 0 (0.0%) |
| $150,000 or more | 91 (41.7%) | 0 (0.0%) |
| Total | 218 (100.0%) | 0 (0.0%) |
Monthly Housing Cost Tiers in Weekapaug
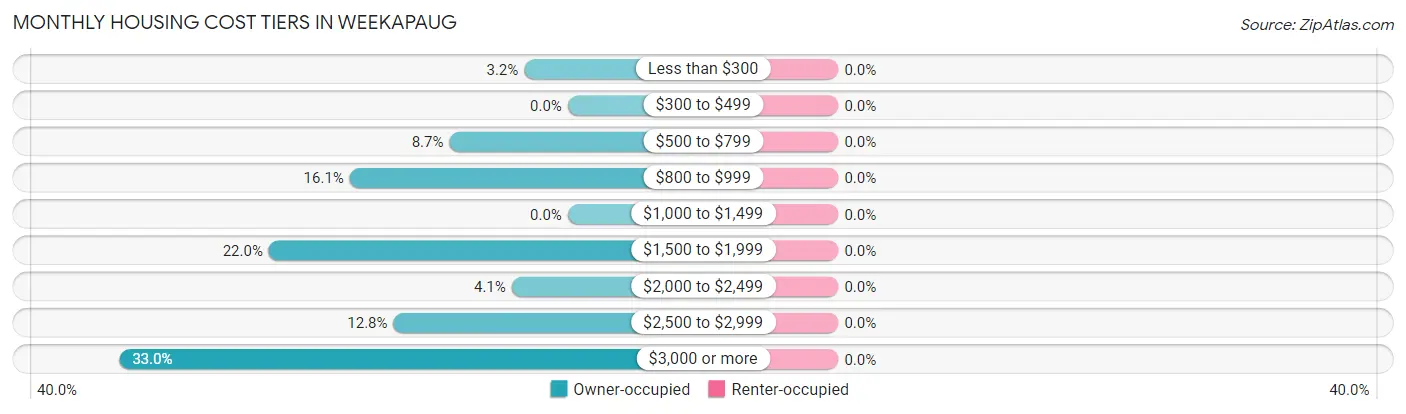
| Monthly Cost | Owner-occupied | Renter-occupied |
| Less than $300 | 7 (3.2%) | 0 (0.0%) |
| $300 to $499 | 0 (0.0%) | 0 (0.0%) |
| $500 to $799 | 19 (8.7%) | 0 (0.0%) |
| $800 to $999 | 35 (16.1%) | 0 (0.0%) |
| $1,000 to $1,499 | 0 (0.0%) | 0 (0.0%) |
| $1,500 to $1,999 | 48 (22.0%) | 0 (0.0%) |
| $2,000 to $2,499 | 9 (4.1%) | 0 (0.0%) |
| $2,500 to $2,999 | 28 (12.8%) | 0 (0.0%) |
| $3,000 or more | 72 (33.0%) | 0 (0.0%) |
| Total | 218 (100.0%) | 0 (0.0%) |
Physical Housing Characteristics in Weekapaug
Housing Structures in Weekapaug
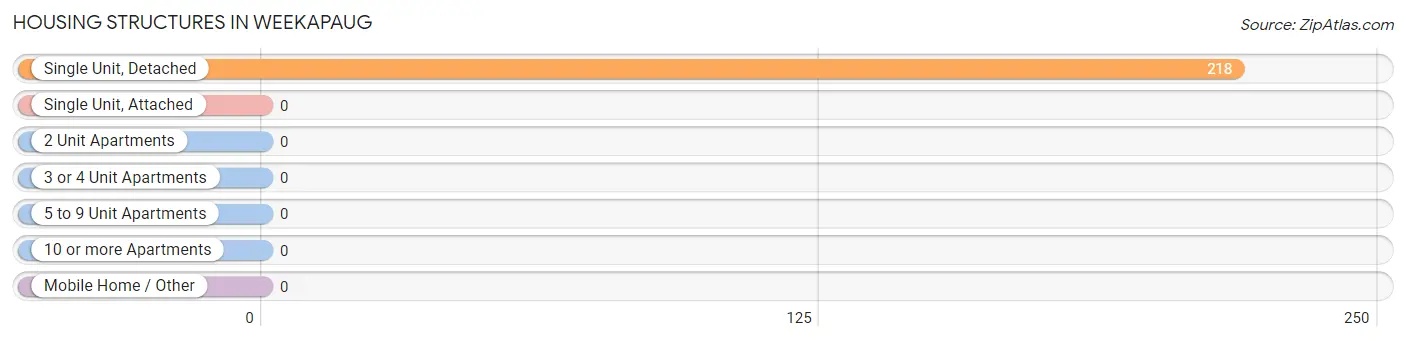
| Structure Type | # Housing Units | % Housing Units |
| Single Unit, Detached | 218 | 100.0% |
| Single Unit, Attached | 0 | 0.0% |
| 2 Unit Apartments | 0 | 0.0% |
| 3 or 4 Unit Apartments | 0 | 0.0% |
| 5 to 9 Unit Apartments | 0 | 0.0% |
| 10 or more Apartments | 0 | 0.0% |
| Mobile Home / Other | 0 | 0.0% |
| Total | 218 | 100.0% |
Housing Structures by Occupancy in Weekapaug
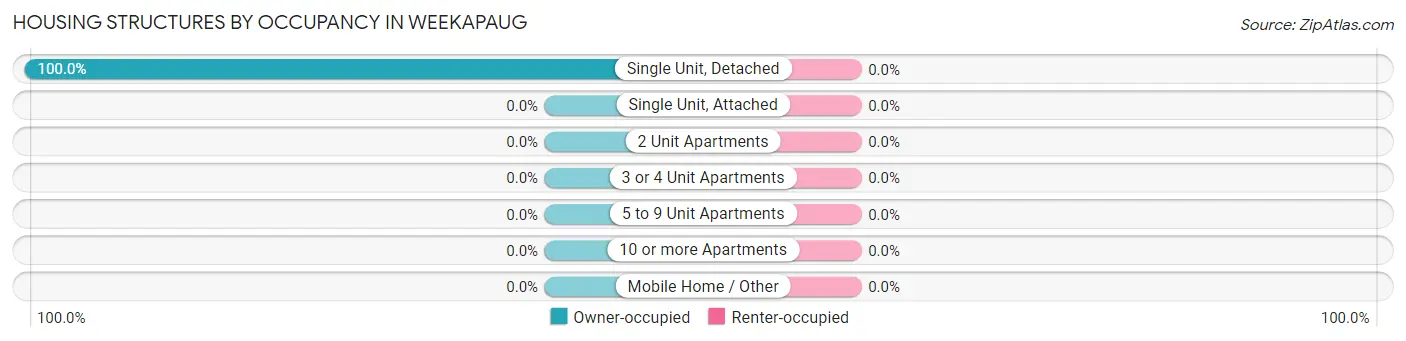
| Structure Type | Owner-occupied | Renter-occupied |
| Single Unit, Detached | 218 (100.0%) | 0 (0.0%) |
| Single Unit, Attached | 0 (0.0%) | 0 (0.0%) |
| 2 Unit Apartments | 0 (0.0%) | 0 (0.0%) |
| 3 or 4 Unit Apartments | 0 (0.0%) | 0 (0.0%) |
| 5 to 9 Unit Apartments | 0 (0.0%) | 0 (0.0%) |
| 10 or more Apartments | 0 (0.0%) | 0 (0.0%) |
| Mobile Home / Other | 0 (0.0%) | 0 (0.0%) |
| Total | 218 (100.0%) | 0 (0.0%) |
Housing Structures by Number of Rooms in Weekapaug
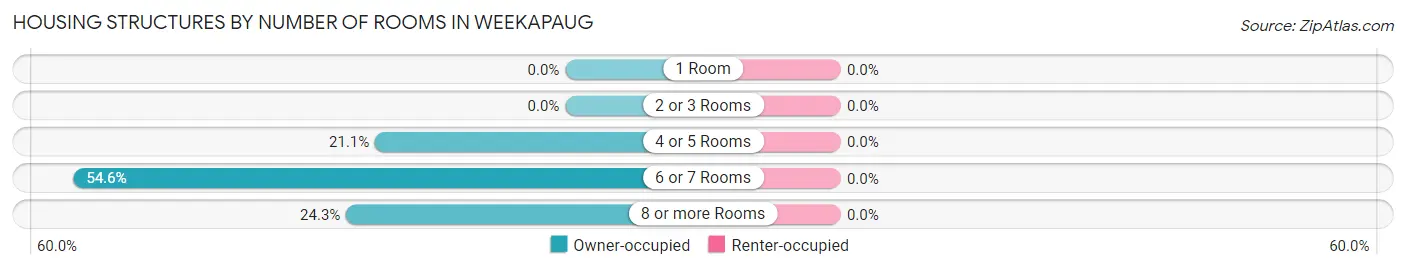
| Number of Rooms | Owner-occupied | Renter-occupied |
| 1 Room | 0 (0.0%) | 0 (0.0%) |
| 2 or 3 Rooms | 0 (0.0%) | 0 (0.0%) |
| 4 or 5 Rooms | 46 (21.1%) | 0 (0.0%) |
| 6 or 7 Rooms | 119 (54.6%) | 0 (0.0%) |
| 8 or more Rooms | 53 (24.3%) | 0 (0.0%) |
| Total | 218 (100.0%) | 0 (0.0%) |
Housing Structure by Heating Type in Weekapaug
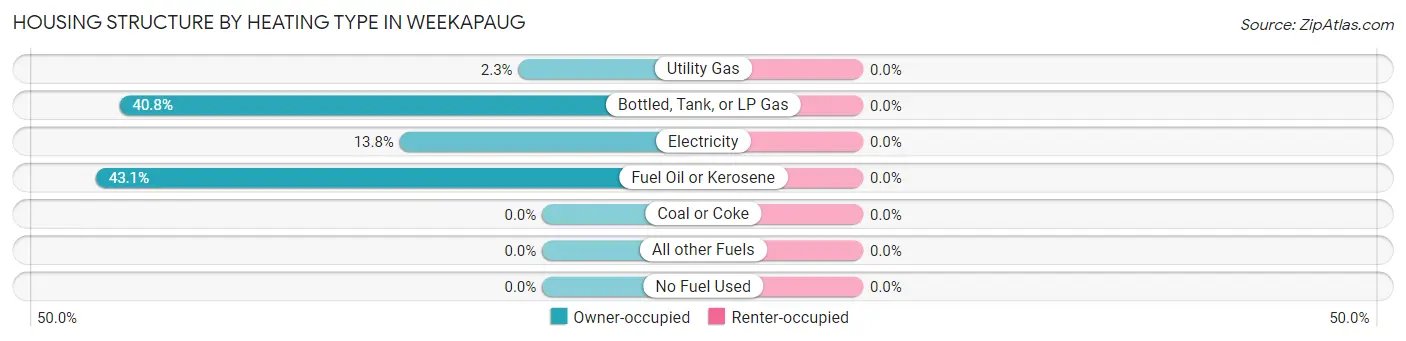
| Heating Type | Owner-occupied | Renter-occupied |
| Utility Gas | 5 (2.3%) | 0 (0.0%) |
| Bottled, Tank, or LP Gas | 89 (40.8%) | 0 (0.0%) |
| Electricity | 30 (13.8%) | 0 (0.0%) |
| Fuel Oil or Kerosene | 94 (43.1%) | 0 (0.0%) |
| Coal or Coke | 0 (0.0%) | 0 (0.0%) |
| All other Fuels | 0 (0.0%) | 0 (0.0%) |
| No Fuel Used | 0 (0.0%) | 0 (0.0%) |
| Total | 218 (100.0%) | 0 (0.0%) |
Household Vehicle Usage in Weekapaug
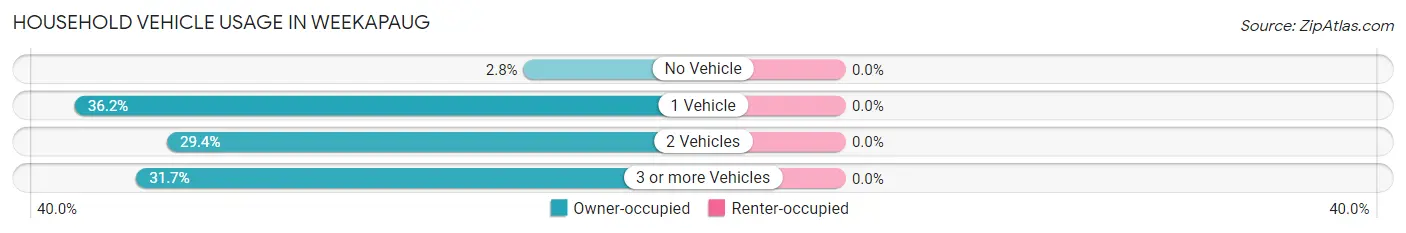
| Vehicles per Household | Owner-occupied | Renter-occupied |
| No Vehicle | 6 (2.8%) | 0 (0.0%) |
| 1 Vehicle | 79 (36.2%) | 0 (0.0%) |
| 2 Vehicles | 64 (29.4%) | 0 (0.0%) |
| 3 or more Vehicles | 69 (31.7%) | 0 (0.0%) |
| Total | 218 (100.0%) | 0 (0.0%) |
Real Estate & Mortgages in Weekapaug
Real Estate and Mortgage Overview in Weekapaug
| Characteristic | Without Mortgage | With Mortgage |
| Housing Units | 76 | 142 |
| Median Property Value | $560,600 | $750,000 |
| Median Household Income | - | - |
| Monthly Housing Costs | $912 | $72 |
| Real Estate Taxes | $4,500 | $0 |
Property Value by Mortgage Status in Weekapaug
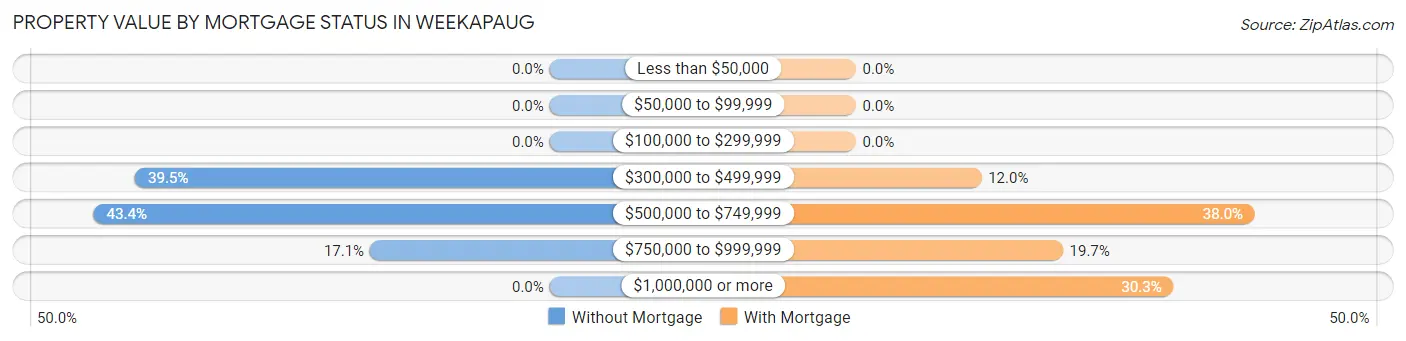
| Property Value | Without Mortgage | With Mortgage |
| Less than $50,000 | 0 (0.0%) | 0 (0.0%) |
| $50,000 to $99,999 | 0 (0.0%) | 0 (0.0%) |
| $100,000 to $299,999 | 0 (0.0%) | 0 (0.0%) |
| $300,000 to $499,999 | 30 (39.5%) | 17 (12.0%) |
| $500,000 to $749,999 | 33 (43.4%) | 54 (38.0%) |
| $750,000 to $999,999 | 13 (17.1%) | 28 (19.7%) |
| $1,000,000 or more | 0 (0.0%) | 43 (30.3%) |
| Total | 76 (100.0%) | 142 (100.0%) |
Household Income by Mortgage Status in Weekapaug
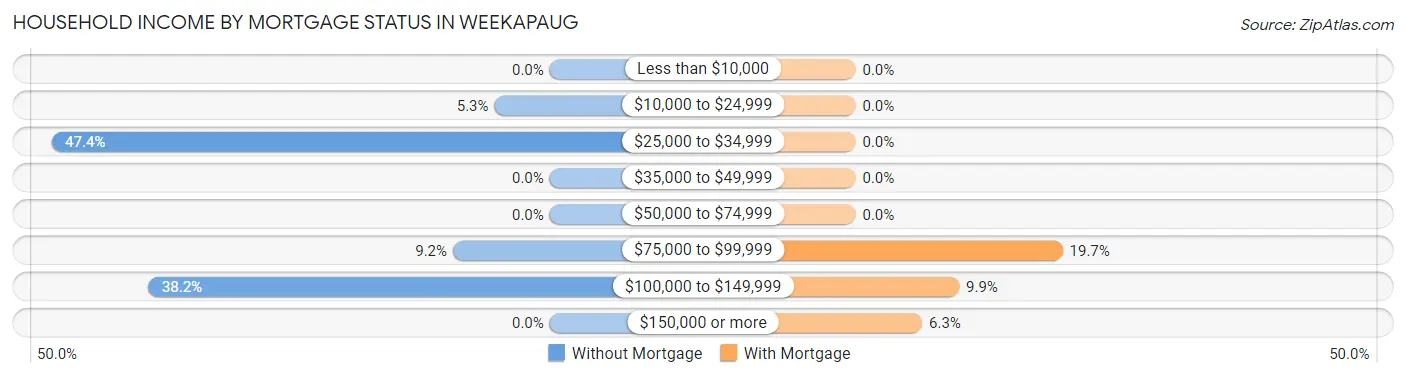
| Household Income | Without Mortgage | With Mortgage |
| Less than $10,000 | 0 (0.0%) | 0 (0.0%) |
| $10,000 to $24,999 | 4 (5.3%) | 0 (0.0%) |
| $25,000 to $34,999 | 36 (47.4%) | 0 (0.0%) |
| $35,000 to $49,999 | 0 (0.0%) | 0 (0.0%) |
| $50,000 to $74,999 | 0 (0.0%) | 0 (0.0%) |
| $75,000 to $99,999 | 7 (9.2%) | 28 (19.7%) |
| $100,000 to $149,999 | 29 (38.2%) | 14 (9.9%) |
| $150,000 or more | 0 (0.0%) | 9 (6.3%) |
| Total | 76 (100.0%) | 142 (100.0%) |
Property Value to Household Income Ratio in Weekapaug
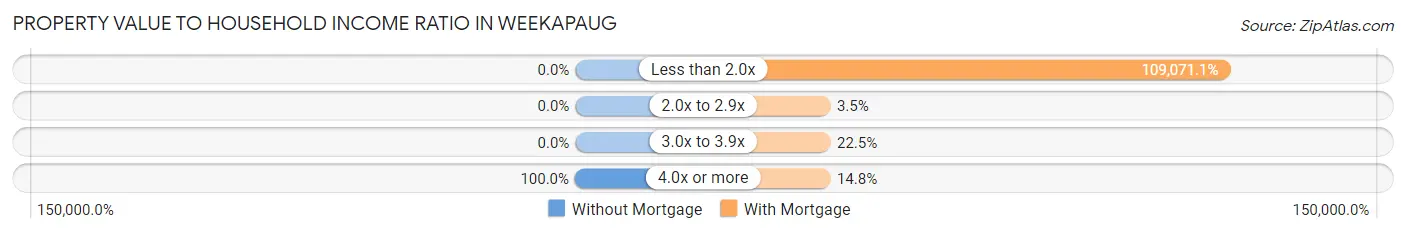
| Value-to-Income Ratio | Without Mortgage | With Mortgage |
| Less than 2.0x | 0 (0.0%) | 154,881 (109,071.1%) |
| 2.0x to 2.9x | 0 (0.0%) | 5 (3.5%) |
| 3.0x to 3.9x | 0 (0.0%) | 32 (22.5%) |
| 4.0x or more | 76 (100.0%) | 21 (14.8%) |
| Total | 76 (100.0%) | 142 (100.0%) |
Real Estate Taxes by Mortgage Status in Weekapaug
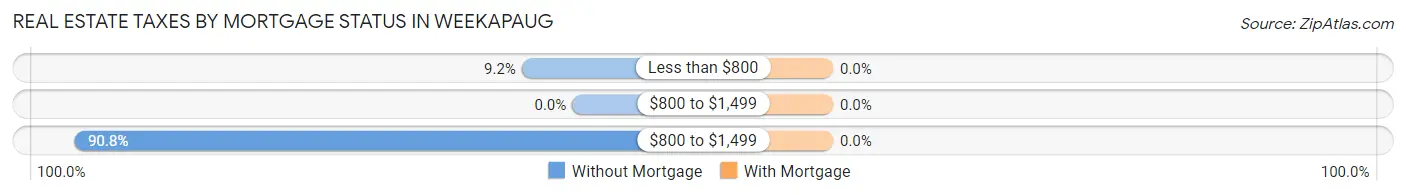
| Property Taxes | Without Mortgage | With Mortgage |
| Less than $800 | 7 (9.2%) | 0 (0.0%) |
| $800 to $1,499 | 0 (0.0%) | 0 (0.0%) |
| $800 to $1,499 | 69 (90.8%) | 0 (0.0%) |
| Total | 76 (100.0%) | 142 (100.0%) |
Health & Disability in Weekapaug
Health Insurance Coverage by Age in Weekapaug
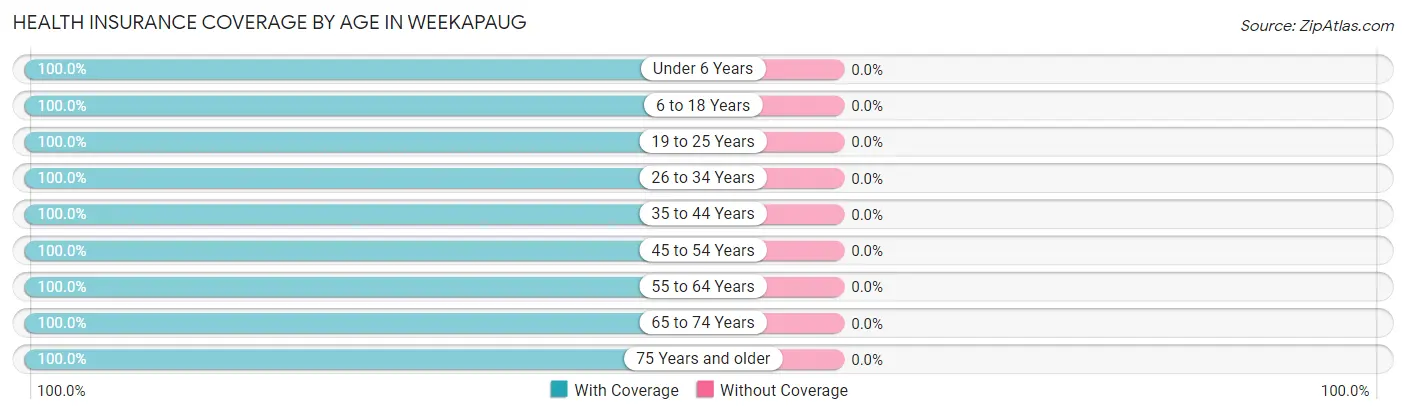
| Age Bracket | With Coverage | Without Coverage |
| Under 6 Years | 27 (100.0%) | 0 (0.0%) |
| 6 to 18 Years | 16 (100.0%) | 0 (0.0%) |
| 19 to 25 Years | 112 (100.0%) | 0 (0.0%) |
| 26 to 34 Years | 36 (100.0%) | 0 (0.0%) |
| 35 to 44 Years | 15 (100.0%) | 0 (0.0%) |
| 45 to 54 Years | 37 (100.0%) | 0 (0.0%) |
| 55 to 64 Years | 122 (100.0%) | 0 (0.0%) |
| 65 to 74 Years | 94 (100.0%) | 0 (0.0%) |
| 75 Years and older | 63 (100.0%) | 0 (0.0%) |
| Total | 522 (100.0%) | 0 (0.0%) |
Health Insurance Coverage by Citizenship Status in Weekapaug
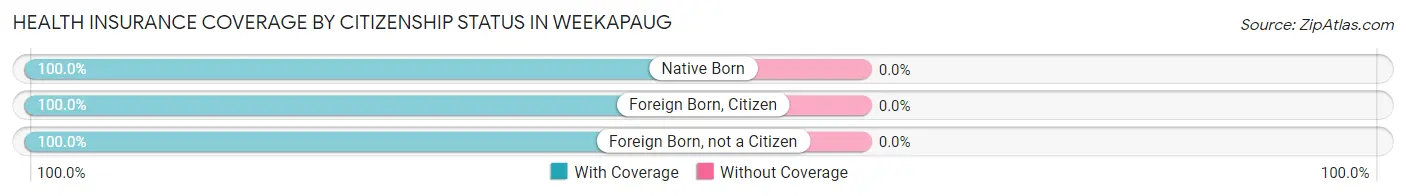
| Citizenship Status | With Coverage | Without Coverage |
| Native Born | 27 (100.0%) | 0 (0.0%) |
| Foreign Born, Citizen | 16 (100.0%) | 0 (0.0%) |
| Foreign Born, not a Citizen | 112 (100.0%) | 0 (0.0%) |
Health Insurance Coverage by Household Income in Weekapaug
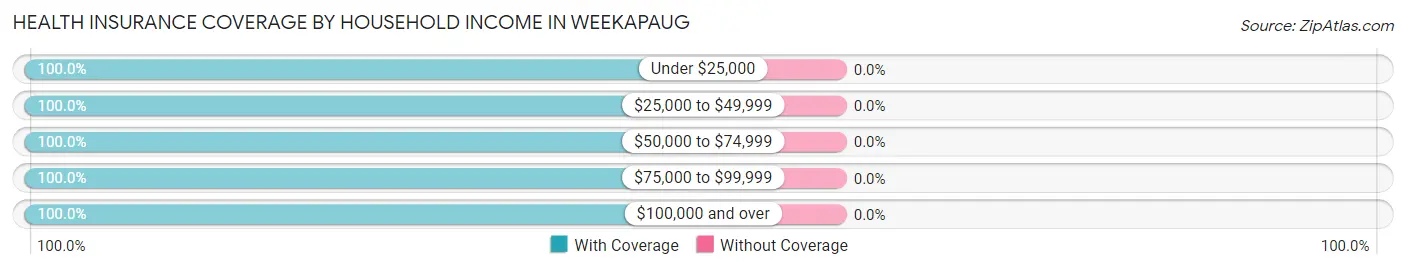
| Household Income | With Coverage | Without Coverage |
| Under $25,000 | 4 (100.0%) | 0 (0.0%) |
| $25,000 to $49,999 | 36 (100.0%) | 0 (0.0%) |
| $50,000 to $74,999 | 90 (100.0%) | 0 (0.0%) |
| $75,000 to $99,999 | 27 (100.0%) | 0 (0.0%) |
| $100,000 and over | 365 (100.0%) | 0 (0.0%) |
Public vs Private Health Insurance Coverage by Age in Weekapaug
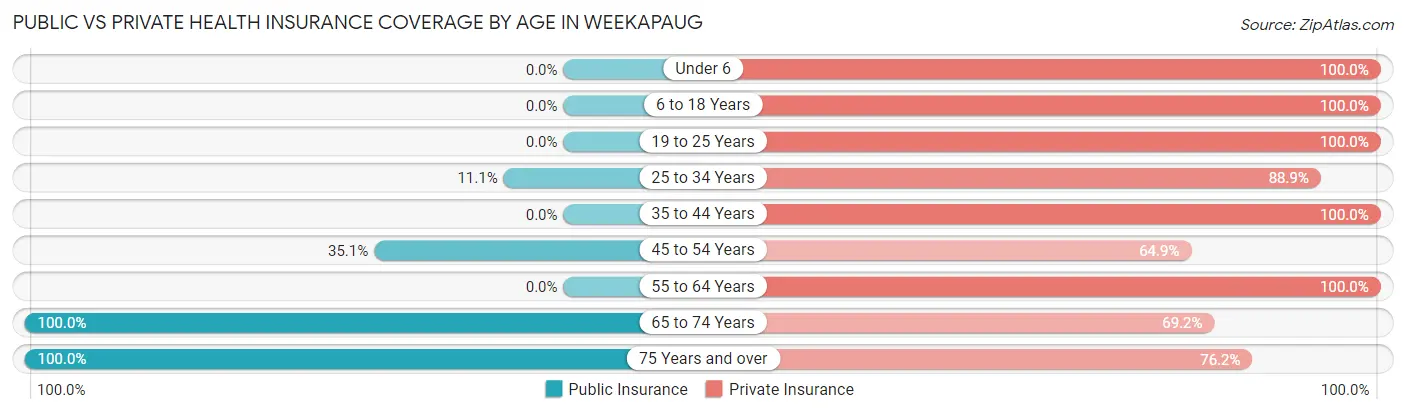
| Age Bracket | Public Insurance | Private Insurance |
| Under 6 | 0 (0.0%) | 27 (100.0%) |
| 6 to 18 Years | 0 (0.0%) | 16 (100.0%) |
| 19 to 25 Years | 0 (0.0%) | 112 (100.0%) |
| 25 to 34 Years | 4 (11.1%) | 32 (88.9%) |
| 35 to 44 Years | 0 (0.0%) | 15 (100.0%) |
| 45 to 54 Years | 13 (35.1%) | 24 (64.9%) |
| 55 to 64 Years | 0 (0.0%) | 122 (100.0%) |
| 65 to 74 Years | 94 (100.0%) | 65 (69.2%) |
| 75 Years and over | 63 (100.0%) | 48 (76.2%) |
| Total | 174 (33.3%) | 461 (88.3%) |
Disability Status by Sex by Age in Weekapaug
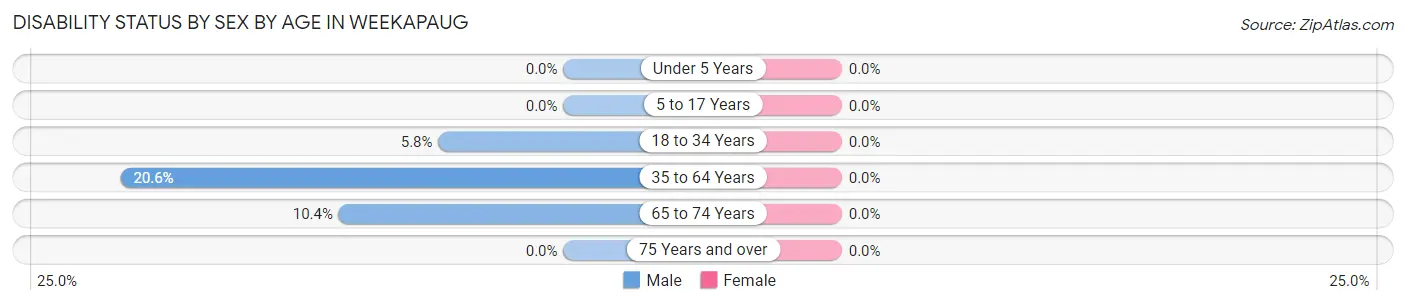
| Age Bracket | Male | Female |
| Under 5 Years | 0 (0.0%) | 0 (0.0%) |
| 5 to 17 Years | 0 (0.0%) | 0 (0.0%) |
| 18 to 34 Years | 4 (5.8%) | 0 (0.0%) |
| 35 to 64 Years | 15 (20.5%) | 0 (0.0%) |
| 65 to 74 Years | 5 (10.4%) | 0 (0.0%) |
| 75 Years and over | 0 (0.0%) | 0 (0.0%) |
Disability Class by Sex by Age in Weekapaug
Disability Class: Hearing Difficulty
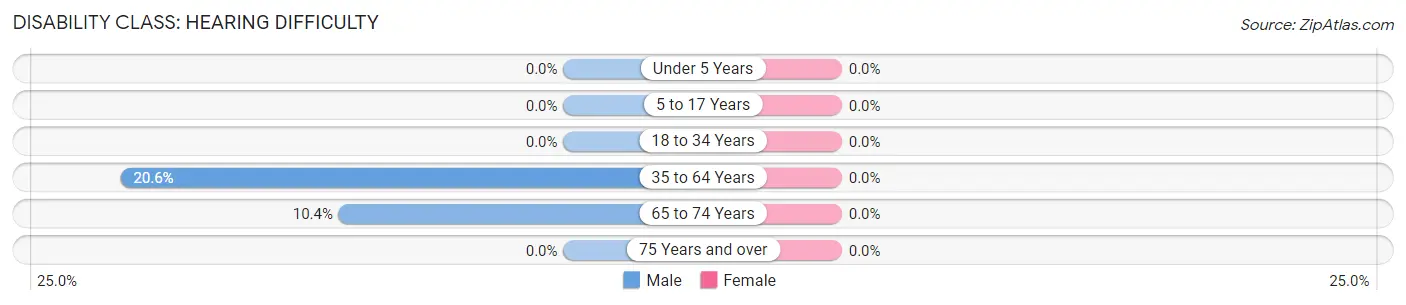
| Age Bracket | Male | Female |
| Under 5 Years | 0 (0.0%) | 0 (0.0%) |
| 5 to 17 Years | 0 (0.0%) | 0 (0.0%) |
| 18 to 34 Years | 0 (0.0%) | 0 (0.0%) |
| 35 to 64 Years | 15 (20.5%) | 0 (0.0%) |
| 65 to 74 Years | 5 (10.4%) | 0 (0.0%) |
| 75 Years and over | 0 (0.0%) | 0 (0.0%) |
Disability Class: Vision Difficulty
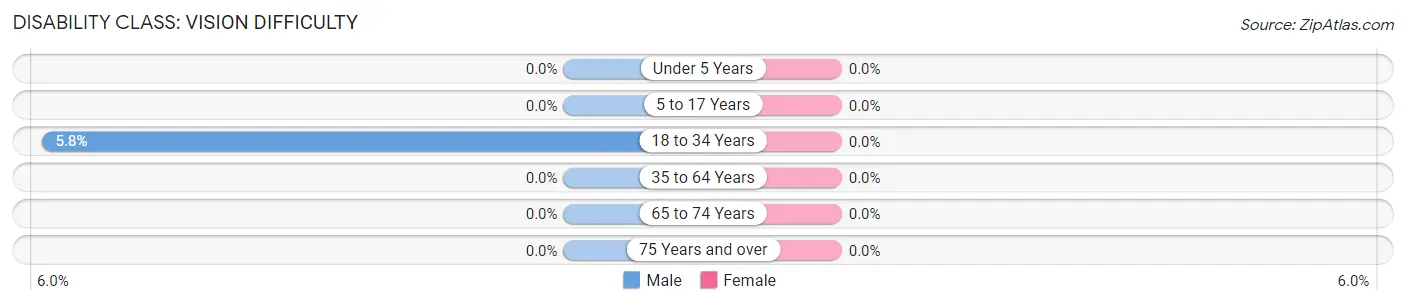
| Age Bracket | Male | Female |
| Under 5 Years | 0 (0.0%) | 0 (0.0%) |
| 5 to 17 Years | 0 (0.0%) | 0 (0.0%) |
| 18 to 34 Years | 4 (5.8%) | 0 (0.0%) |
| 35 to 64 Years | 0 (0.0%) | 0 (0.0%) |
| 65 to 74 Years | 0 (0.0%) | 0 (0.0%) |
| 75 Years and over | 0 (0.0%) | 0 (0.0%) |
Disability Class: Cognitive Difficulty
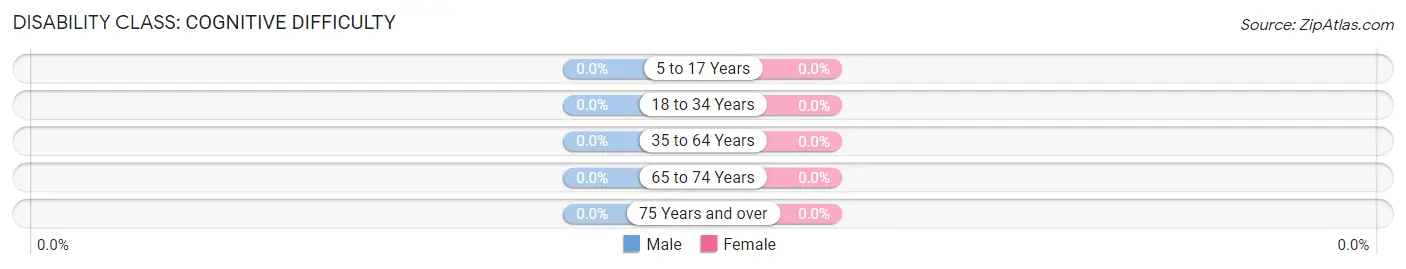
| Age Bracket | Male | Female |
| 5 to 17 Years | 0 (0.0%) | 0 (0.0%) |
| 18 to 34 Years | 0 (0.0%) | 0 (0.0%) |
| 35 to 64 Years | 0 (0.0%) | 0 (0.0%) |
| 65 to 74 Years | 0 (0.0%) | 0 (0.0%) |
| 75 Years and over | 0 (0.0%) | 0 (0.0%) |
Disability Class: Ambulatory Difficulty
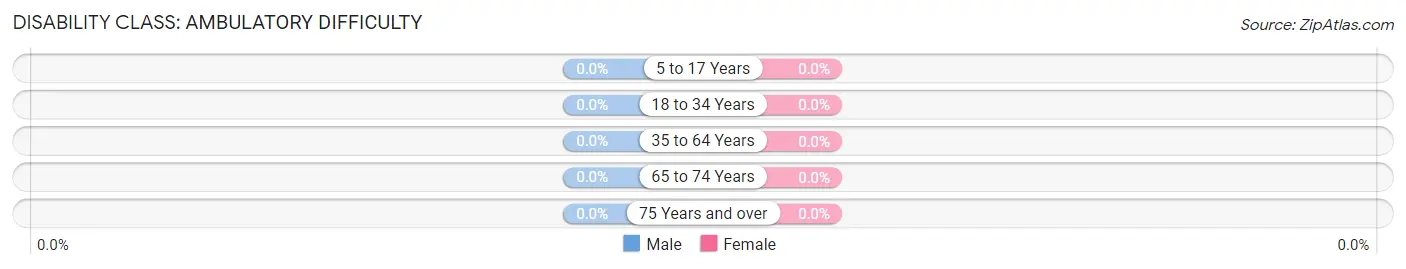
| Age Bracket | Male | Female |
| 5 to 17 Years | 0 (0.0%) | 0 (0.0%) |
| 18 to 34 Years | 0 (0.0%) | 0 (0.0%) |
| 35 to 64 Years | 0 (0.0%) | 0 (0.0%) |
| 65 to 74 Years | 0 (0.0%) | 0 (0.0%) |
| 75 Years and over | 0 (0.0%) | 0 (0.0%) |
Disability Class: Self-Care Difficulty
| Age Bracket | Male | Female |
| 5 to 17 Years | 0 (0.0%) | 0 (0.0%) |
| 18 to 34 Years | 0 (0.0%) | 0 (0.0%) |
| 35 to 64 Years | 0 (0.0%) | 0 (0.0%) |
| 65 to 74 Years | 0 (0.0%) | 0 (0.0%) |
| 75 Years and over | 0 (0.0%) | 0 (0.0%) |
Technology Access in Weekapaug
Computing Device Access in Weekapaug
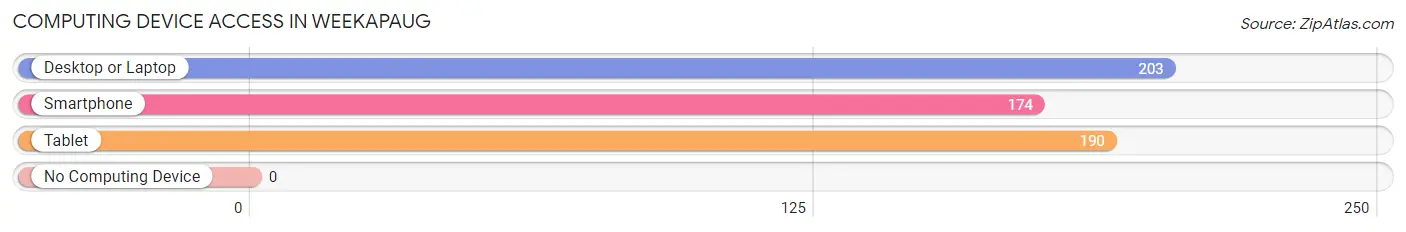
| Device Type | # Households | % Households |
| Desktop or Laptop | 203 | 93.1% |
| Smartphone | 174 | 79.8% |
| Tablet | 190 | 87.2% |
| No Computing Device | 0 | 0.0% |
| Total | 218 | 100.0% |
Internet Access in Weekapaug
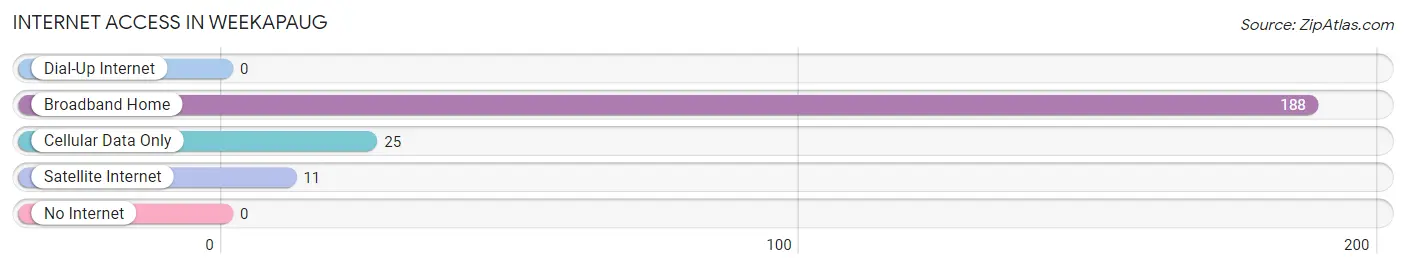
| Internet Type | # Households | % Households |
| Dial-Up Internet | 0 | 0.0% |
| Broadband Home | 188 | 86.2% |
| Cellular Data Only | 25 | 11.5% |
| Satellite Internet | 11 | 5.1% |
| No Internet | 0 | 0.0% |
| Total | 218 | 100.0% |
Weekapaug Summary
History
Weekapaug, Rhode Island is a small village located in the town of Westerly, Rhode Island. It is situated on the eastern shore of the Pawcatuck River, which forms the border between Rhode Island and Connecticut. The village was first settled in the early 1700s by the Weekapaug Indians, a tribe of the Narragansett Indians. The name Weekapaug is derived from the Narragansett word for “end of the pond”, referring to the pond that was located at the end of the river.
The village was originally a fishing and farming community, and the first settlers built a wharf and a grist mill. In the late 1700s, the village became a popular summer resort for wealthy families from New York and Boston. The village was also home to a number of shipbuilding yards, which built schooners and other vessels for the fishing and whaling industries.
In the late 1800s, the village began to decline as the fishing and whaling industries declined. The village was also affected by the Great Depression, and many of the residents moved away. However, the village was revitalized in the 1950s when the Weekapaug Inn was built. The inn was a popular destination for tourists, and it helped to bring new life to the village.
Geography
Weekapaug is located in the town of Westerly, Rhode Island. It is situated on the eastern shore of the Pawcatuck River, which forms the border between Rhode Island and Connecticut. The village is surrounded by salt marshes and tidal creeks, and it is bordered by the Atlantic Ocean to the south.
The village is located on a peninsula, and it is surrounded by the Weekapaug Pond, Quonochontaug Pond, and the Pawcatuck River. The village is also home to a number of small islands, including Weekapaug Island, Quonochontaug Island, and Little Gull Island.
Economy
Weekapaug is a small village with a population of just over 500 people. The village is primarily a tourist destination, and the main industry is tourism. The Weekapaug Inn is the main attraction in the village, and it is a popular destination for tourists from all over the world.
The village also has a number of small businesses, including restaurants, gift shops, and art galleries. The village is also home to a number of marinas, which provide services for boaters and fishermen.
Demographics
As of the 2010 census, the population of Weekapaug was 514 people. The racial makeup of the village was 97.3% White, 0.6% African American, 0.2% Native American, 0.4% Asian, 0.2% from other races, and 1.3% from two or more races. Hispanic or Latino of any race were 1.2% of the population.
The median income for a household in the village was $50,000, and the median income for a family was $60,000. The per capita income for the village was $25,000. About 8.3% of families and 10.2% of the population were below the poverty line, including 14.3% of those under age 18 and none of those age 65 or over.
Common Questions
What is the Total Population of Weekapaug?
Total Population of Weekapaug is 522.
What is the Total Male Population of Weekapaug?
Total Male Population of Weekapaug is 233.
What is the Total Female Population of Weekapaug?
Total Female Population of Weekapaug is 289.
What is the Ratio of Males per 100 Females in Weekapaug?
There are 80.62 Males per 100 Females in Weekapaug.
What is the Ratio of Females per 100 Males in Weekapaug?
There are 124.03 Females per 100 Males in Weekapaug.
What is the Median Population Age in Weekapaug?
Median Population Age in Weekapaug is 55.6 Years.
What is the Average Family Size in Weekapaug
Average Family Size in Weekapaug is 2.8 People.
What is the Average Household Size in Weekapaug
Average Household Size in Weekapaug is 2.4 People.
What is Per Capita Income in Weekapaug?
Per Capita income in Weekapaug is $77,232.
What is the Median Family Income in Weekapaug?
Median Family Income in Weekapaug is $154,107.
What is the Median Household income in Weekapaug?
Median Household Income in Weekapaug is $110,000.
What is Inequality or Gini Index in Weekapaug?
Inequality or Gini Index in Weekapaug is 0.51.
How Large is the Labor Force in Weekapaug?
There are 263 People in the Labor Forcein in Weekapaug.
What is the Percentage of People in the Labor Force in Weekapaug?
53.1% of People are in the Labor Force in Weekapaug.