Washington County, RI
Washington County Map
Washington County Overview
129,998
TOTAL POPULATION
63,412
MALE POPULATION
66,586
FEMALE POPULATION
95.23
MALES / 100 FEMALES
105.01
FEMALES / 100 MALES
44.9
MEDIAN AGE
2.9
AVG FAMILY SIZE
2.4
AVG HOUSEHOLD SIZE
$50,008
PER CAPITA INCOME
$122,848
AVG FAMILY INCOME
$99,510
AVG HOUSEHOLD INCOME
36.3%
WAGE / INCOME GAP [ % ]
63.7¢/ $1
WAGE / INCOME GAP [ $ ]
$10,958
FAMILY INCOME DEFICIT
0.43
INEQUALITY / GINI INDEX
71,064
LABOR FORCE [ PEOPLE ]
63.2%
PERCENT IN LABOR FORCE
5.9%
UNEMPLOYMENT RATE
Washington County Area Codes
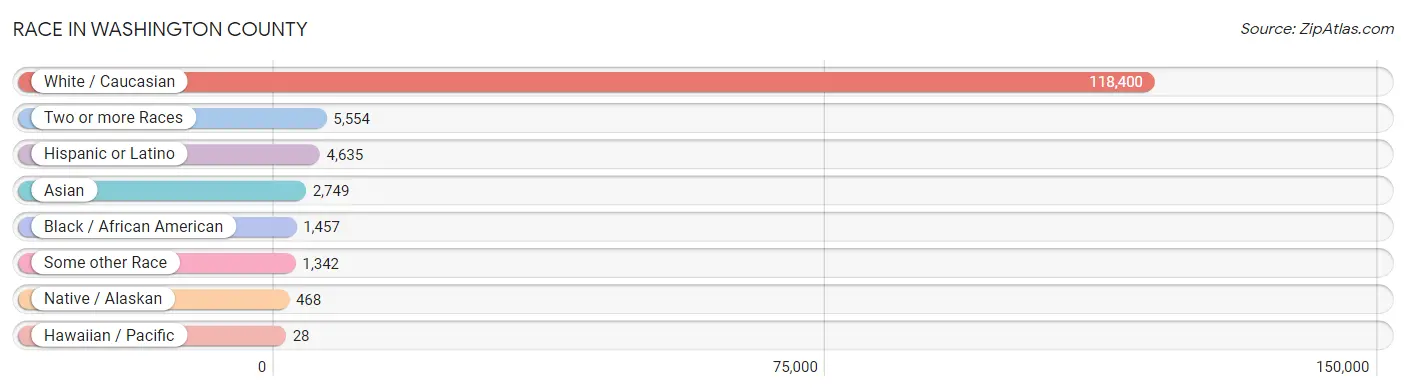
Race in Washington County
The most populous races in Washington County are White / Caucasian (118,400 | 91.1%), Two or more Races (5,554 | 4.3%), and Hispanic or Latino (4,635 | 3.6%).
| Race | # Population | % Population |
| Asian | 2,749 | 2.1% |
| Black / African American | 1,457 | 1.1% |
| Hawaiian / Pacific | 28 | 0.0% |
| Hispanic or Latino | 4,635 | 3.6% |
| Native / Alaskan | 468 | 0.4% |
| White / Caucasian | 118,400 | 91.1% |
| Two or more Races | 5,554 | 4.3% |
| Some other Race | 1,342 | 1.0% |
| Total | 129,998 | 100.0% |
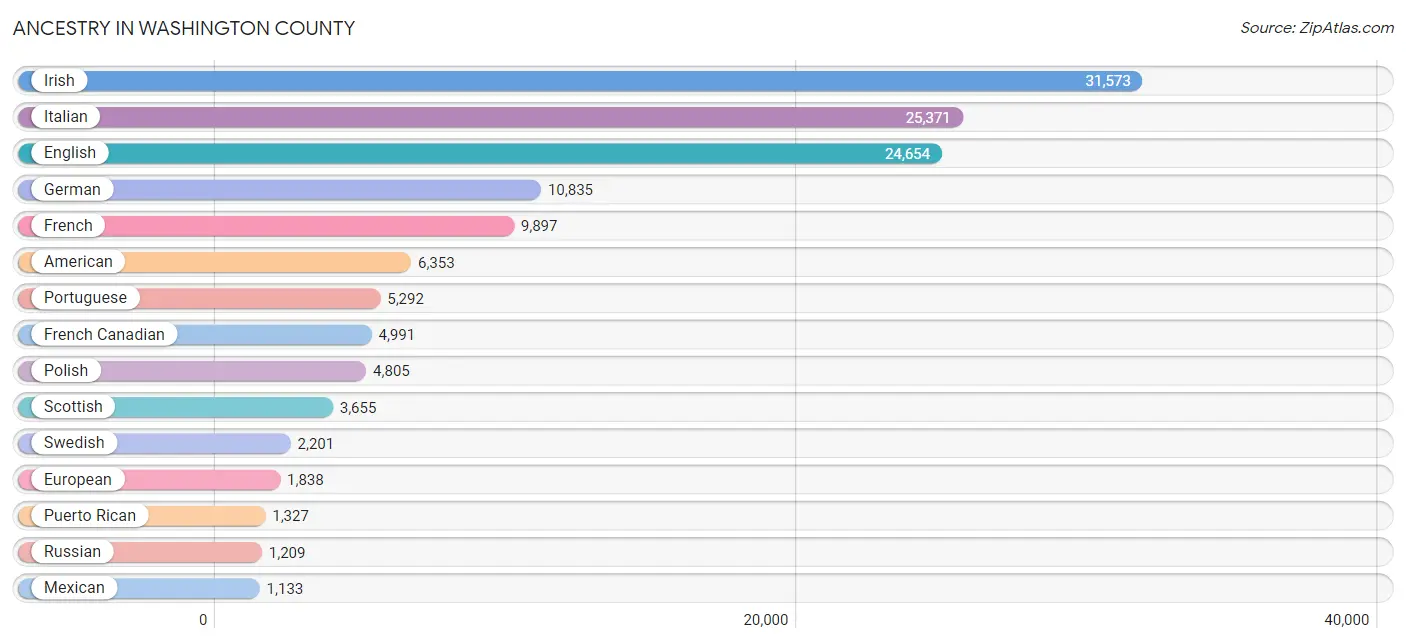
Ancestry in Washington County
The most populous ancestries reported in Washington County are Irish (31,573 | 24.3%), Italian (25,371 | 19.5%), English (24,654 | 19.0%), German (10,835 | 8.3%), and French (9,897 | 7.6%), together accounting for 78.7% of all Washington County residents.
| Ancestry | # Population | % Population |
| African | 167 | 0.1% |
| Albanian | 68 | 0.1% |
| American | 6,353 | 4.9% |
| Arab | 1,026 | 0.8% |
| Argentinean | 42 | 0.0% |
| Armenian | 426 | 0.3% |
| Australian | 9 | 0.0% |
| Austrian | 388 | 0.3% |
| Belgian | 78 | 0.1% |
| Belizean | 6 | 0.0% |
| Bhutanese | 427 | 0.3% |
| Blackfeet | 74 | 0.1% |
| Bolivian | 170 | 0.1% |
| Brazilian | 66 | 0.1% |
| British | 974 | 0.7% |
| British West Indian | 8 | 0.0% |
| Bulgarian | 11 | 0.0% |
| Burmese | 641 | 0.5% |
| Canadian | 409 | 0.3% |
| Cape Verdean | 545 | 0.4% |
| Celtic | 26 | 0.0% |
| Central American | 563 | 0.4% |
| Central American Indian | 43 | 0.0% |
| Cherokee | 237 | 0.2% |
| Cheyenne | 35 | 0.0% |
| Chilean | 8 | 0.0% |
| Chippewa | 25 | 0.0% |
| Choctaw | 29 | 0.0% |
| Colombian | 252 | 0.2% |
| Costa Rican | 84 | 0.1% |
| Creek | 16 | 0.0% |
| Croatian | 93 | 0.1% |
| Cuban | 246 | 0.2% |
| Czech | 698 | 0.5% |
| Czechoslovakian | 97 | 0.1% |
| Danish | 345 | 0.3% |
| Dominican | 297 | 0.2% |
| Dutch | 781 | 0.6% |
| Eastern European | 830 | 0.6% |
| Ecuadorian | 18 | 0.0% |
| Egyptian | 146 | 0.1% |
| English | 24,654 | 19.0% |
| European | 1,838 | 1.4% |
| Filipino | 67 | 0.1% |
| Finnish | 405 | 0.3% |
| French | 9,897 | 7.6% |
| French American Indian | 115 | 0.1% |
| French Canadian | 4,991 | 3.8% |
| German | 10,835 | 8.3% |
| Greek | 905 | 0.7% |
| Guamanian / Chamorro | 6 | 0.0% |
| Guatemalan | 162 | 0.1% |
| Haitian | 73 | 0.1% |
| Honduran | 32 | 0.0% |
| Hungarian | 580 | 0.4% |
| Icelander | 15 | 0.0% |
| Indian (Asian) | 1,068 | 0.8% |
| Iranian | 17 | 0.0% |
| Irish | 31,573 | 24.3% |
| Iroquois | 54 | 0.0% |
| Israeli | 70 | 0.1% |
| Italian | 25,371 | 19.5% |
| Jamaican | 62 | 0.1% |
| Japanese | 99 | 0.1% |
| Korean | 494 | 0.4% |
| Laotian | 93 | 0.1% |
| Latvian | 120 | 0.1% |
| Lebanese | 351 | 0.3% |
| Liberian | 34 | 0.0% |
| Lithuanian | 549 | 0.4% |
| Malaysian | 12 | 0.0% |
| Maltese | 7 | 0.0% |
| Mexican | 1,133 | 0.9% |
| Mongolian | 24 | 0.0% |
| Native Hawaiian | 22 | 0.0% |
| Nicaraguan | 45 | 0.0% |
| Nigerian | 34 | 0.0% |
| Northern European | 274 | 0.2% |
| Norwegian | 808 | 0.6% |
| Pakistani | 29 | 0.0% |
| Panamanian | 146 | 0.1% |
| Pennsylvania German | 27 | 0.0% |
| Polish | 4,805 | 3.7% |
| Portuguese | 5,292 | 4.1% |
| Puerto Rican | 1,327 | 1.0% |
| Romanian | 204 | 0.2% |
| Russian | 1,209 | 0.9% |
| Salvadoran | 94 | 0.1% |
| Samoan | 19 | 0.0% |
| Scandinavian | 276 | 0.2% |
| Scotch-Irish | 806 | 0.6% |
| Scottish | 3,655 | 2.8% |
| Senegalese | 17 | 0.0% |
| Serbian | 41 | 0.0% |
| Slovak | 163 | 0.1% |
| Slovene | 24 | 0.0% |
| South American | 535 | 0.4% |
| South American Indian | 28 | 0.0% |
| Spaniard | 163 | 0.1% |
| Spanish | 180 | 0.1% |
| Spanish American Indian | 18 | 0.0% |
| Sri Lankan | 69 | 0.1% |
| Subsaharan African | 810 | 0.6% |
| Swedish | 2,201 | 1.7% |
| Swiss | 321 | 0.3% |
| Syrian | 322 | 0.3% |
| Thai | 809 | 0.6% |
| Turkish | 72 | 0.1% |
| Ukrainian | 300 | 0.2% |
| Venezuelan | 45 | 0.0% |
| Welsh | 468 | 0.4% |
| West Indian | 8 | 0.0% |
| Yugoslavian | 21 | 0.0% |
| Zimbabwean | 8 | 0.0% | View All 114 Rows |
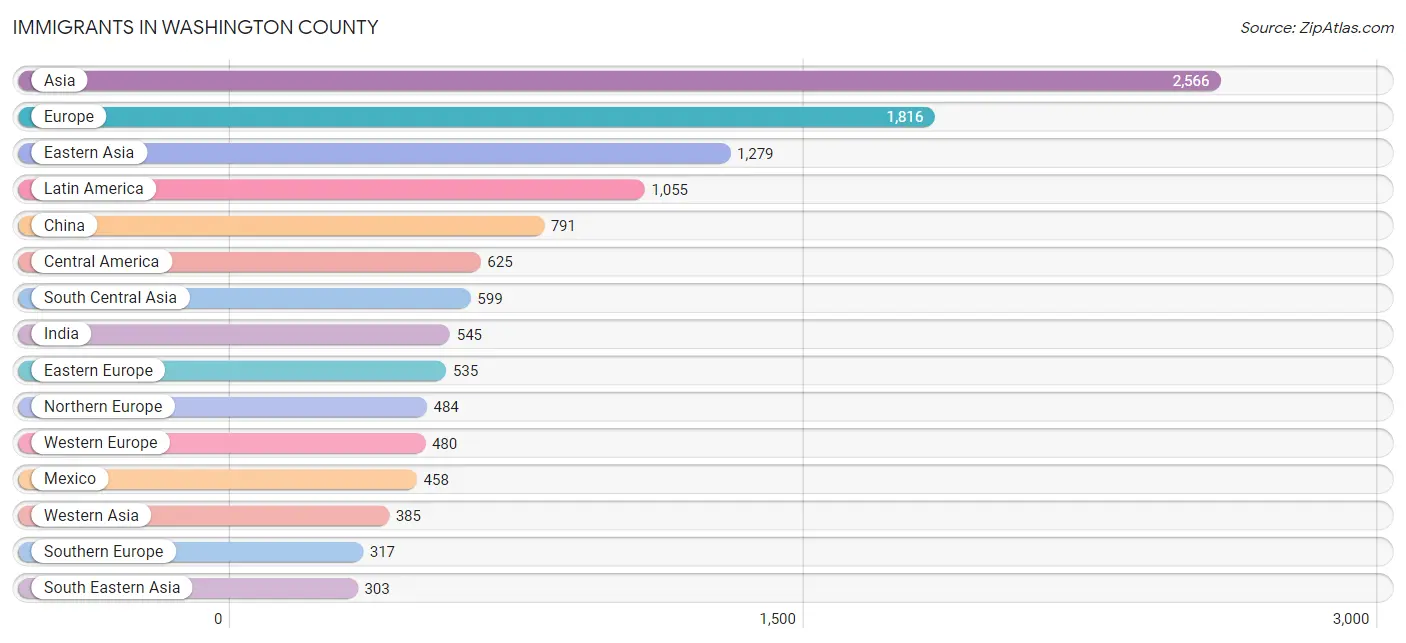
Immigrants in Washington County
The most numerous immigrant groups reported in Washington County came from Asia (2,566 | 2.0%), Europe (1,816 | 1.4%), Eastern Asia (1,279 | 1.0%), Latin America (1,055 | 0.8%), and China (791 | 0.6%), together accounting for 5.8% of all Washington County residents.
| Immigration Origin | # Population | % Population |
| Africa | 239 | 0.2% |
| Argentina | 42 | 0.0% |
| Armenia | 25 | 0.0% |
| Asia | 2,566 | 2.0% |
| Australia | 26 | 0.0% |
| Austria | 23 | 0.0% |
| Azores | 19 | 0.0% |
| Belgium | 17 | 0.0% |
| Bolivia | 28 | 0.0% |
| Bosnia and Herzegovina | 15 | 0.0% |
| Brazil | 50 | 0.0% |
| Cabo Verde | 97 | 0.1% |
| Cambodia | 6 | 0.0% |
| Canada | 246 | 0.2% |
| Caribbean | 212 | 0.2% |
| Central America | 625 | 0.5% |
| China | 791 | 0.6% |
| Colombia | 89 | 0.1% |
| Costa Rica | 11 | 0.0% |
| Croatia | 4 | 0.0% |
| Cuba | 41 | 0.0% |
| Czechoslovakia | 14 | 0.0% |
| Dominica | 56 | 0.0% |
| Dominican Republic | 115 | 0.1% |
| Eastern Africa | 30 | 0.0% |
| Eastern Asia | 1,279 | 1.0% |
| Eastern Europe | 535 | 0.4% |
| Egypt | 52 | 0.0% |
| El Salvador | 8 | 0.0% |
| England | 166 | 0.1% |
| Ethiopia | 13 | 0.0% |
| Europe | 1,816 | 1.4% |
| France | 143 | 0.1% |
| Germany | 141 | 0.1% |
| Greece | 17 | 0.0% |
| Guatemala | 67 | 0.1% |
| Honduras | 5 | 0.0% |
| Hong Kong | 43 | 0.0% |
| Hungary | 15 | 0.0% |
| India | 545 | 0.4% |
| Indonesia | 29 | 0.0% |
| Iran | 17 | 0.0% |
| Ireland | 62 | 0.1% |
| Italy | 199 | 0.2% |
| Japan | 246 | 0.2% |
| Kazakhstan | 6 | 0.0% |
| Korea | 242 | 0.2% |
| Latin America | 1,055 | 0.8% |
| Lebanon | 33 | 0.0% |
| Mexico | 458 | 0.4% |
| Moldova | 43 | 0.0% |
| Netherlands | 138 | 0.1% |
| Nicaragua | 33 | 0.0% |
| Nigeria | 31 | 0.0% |
| North Macedonia | 28 | 0.0% |
| Northern Africa | 52 | 0.0% |
| Northern Europe | 484 | 0.4% |
| Norway | 81 | 0.1% |
| Oceania | 36 | 0.0% |
| Pakistan | 19 | 0.0% |
| Panama | 43 | 0.0% |
| Philippines | 248 | 0.2% |
| Poland | 200 | 0.2% |
| Portugal | 101 | 0.1% |
| Romania | 83 | 0.1% |
| Russia | 66 | 0.1% |
| Scotland | 36 | 0.0% |
| Senegal | 17 | 0.0% |
| South Africa | 12 | 0.0% |
| South America | 218 | 0.2% |
| South Central Asia | 599 | 0.5% |
| South Eastern Asia | 303 | 0.2% |
| Southern Europe | 317 | 0.2% |
| Sri Lanka | 12 | 0.0% |
| Switzerland | 18 | 0.0% |
| Taiwan | 61 | 0.1% |
| Thailand | 20 | 0.0% |
| Turkey | 233 | 0.2% |
| Ukraine | 51 | 0.0% |
| Venezuela | 9 | 0.0% |
| Western Africa | 145 | 0.1% |
| Western Asia | 385 | 0.3% |
| Western Europe | 480 | 0.4% |
| Zimbabwe | 3 | 0.0% | View All 84 Rows |
Sex and Age in Washington County
Sex and Age in Washington County
The most populous age groups in Washington County are 20 to 24 Years (6,015 | 9.5%) for men and 20 to 24 Years (6,353 | 9.5%) for women.
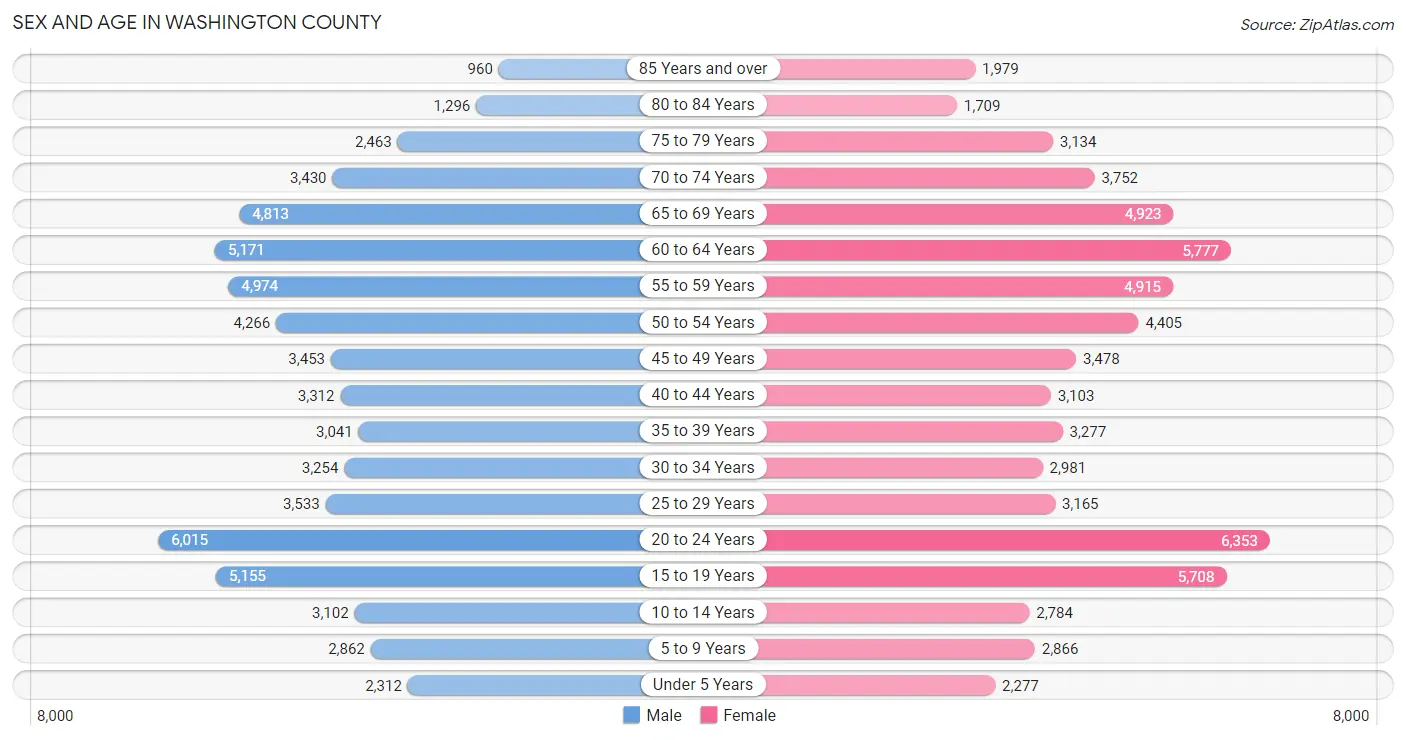
| Age Bracket | Male | Female |
| Under 5 Years | 2,312 (3.6%) | 2,277 (3.4%) |
| 5 to 9 Years | 2,862 (4.5%) | 2,866 (4.3%) |
| 10 to 14 Years | 3,102 (4.9%) | 2,784 (4.2%) |
| 15 to 19 Years | 5,155 (8.1%) | 5,708 (8.6%) |
| 20 to 24 Years | 6,015 (9.5%) | 6,353 (9.5%) |
| 25 to 29 Years | 3,533 (5.6%) | 3,165 (4.8%) |
| 30 to 34 Years | 3,254 (5.1%) | 2,981 (4.5%) |
| 35 to 39 Years | 3,041 (4.8%) | 3,277 (4.9%) |
| 40 to 44 Years | 3,312 (5.2%) | 3,103 (4.7%) |
| 45 to 49 Years | 3,453 (5.4%) | 3,478 (5.2%) |
| 50 to 54 Years | 4,266 (6.7%) | 4,405 (6.6%) |
| 55 to 59 Years | 4,974 (7.8%) | 4,915 (7.4%) |
| 60 to 64 Years | 5,171 (8.2%) | 5,777 (8.7%) |
| 65 to 69 Years | 4,813 (7.6%) | 4,923 (7.4%) |
| 70 to 74 Years | 3,430 (5.4%) | 3,752 (5.6%) |
| 75 to 79 Years | 2,463 (3.9%) | 3,134 (4.7%) |
| 80 to 84 Years | 1,296 (2.0%) | 1,709 (2.6%) |
| 85 Years and over | 960 (1.5%) | 1,979 (3.0%) |
| Total | 63,412 (100.0%) | 66,586 (100.0%) |
Families and Households in Washington County
Median Family Size in Washington County
The median family size in Washington County is 2.89 persons per family, with married-couple families (27,286 | 80.3%) accounting for the largest median family size of 2.92 persons per family. On the other hand, single male/father families (1,867 | 5.5%) represent the smallest median family size with 2.55 persons per family.
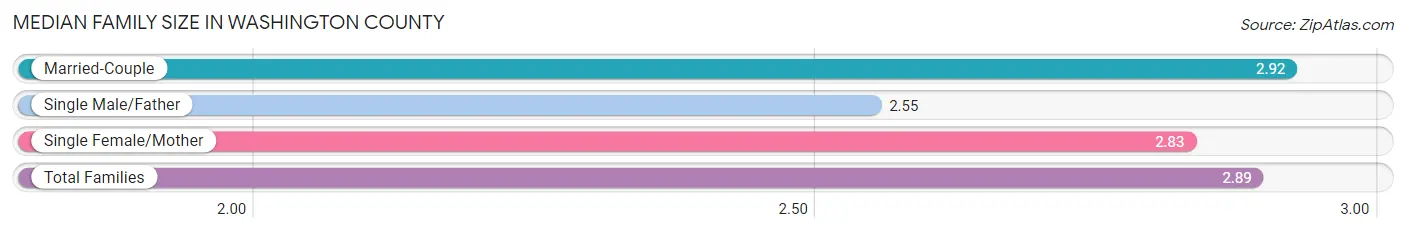
| Family Type | # Families | Family Size |
| Married-Couple | 27,286 (80.3%) | 2.92 |
| Single Male/Father | 1,867 (5.5%) | 2.55 |
| Single Female/Mother | 4,842 (14.2%) | 2.83 |
| Total Families | 33,995 (100.0%) | 2.89 |
Median Household Size in Washington County
The median household size in Washington County is 2.39 persons per household, with single female/mother households (4,842 | 9.4%) accounting for the largest median household size of 3.04 persons per household. non-family households (17,431 | 33.9%) represent the smallest median household size with 1.32 persons per household.
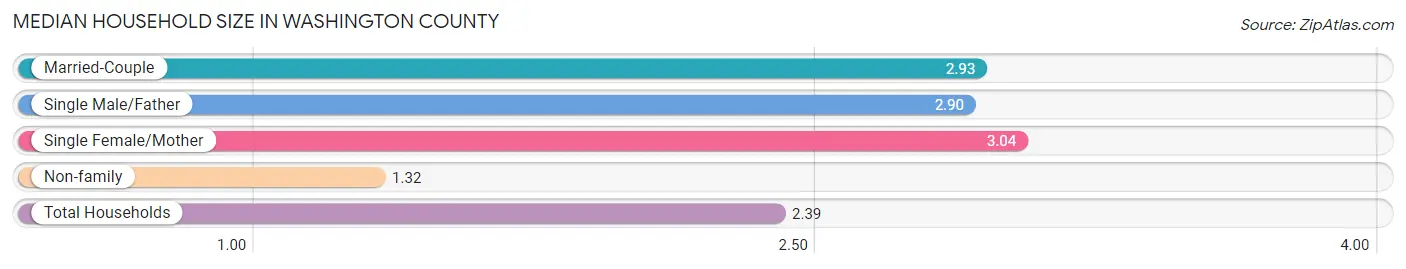
| Household Type | # Households | Household Size |
| Married-Couple | 27,286 (53.1%) | 2.93 |
| Single Male/Father | 1,867 (3.6%) | 2.90 |
| Single Female/Mother | 4,842 (9.4%) | 3.04 |
| Non-family | 17,431 (33.9%) | 1.32 |
| Total Households | 51,426 (100.0%) | 2.39 |
Household Size by Marriage Status in Washington County
Out of a total of 51,426 households in Washington County, 33,995 (66.1%) are family households, while 17,431 (33.9%) are nonfamily households. The most numerous type of family households are 2-person households, comprising 17,843, and the most common type of nonfamily households are 1-person households, comprising 13,313.
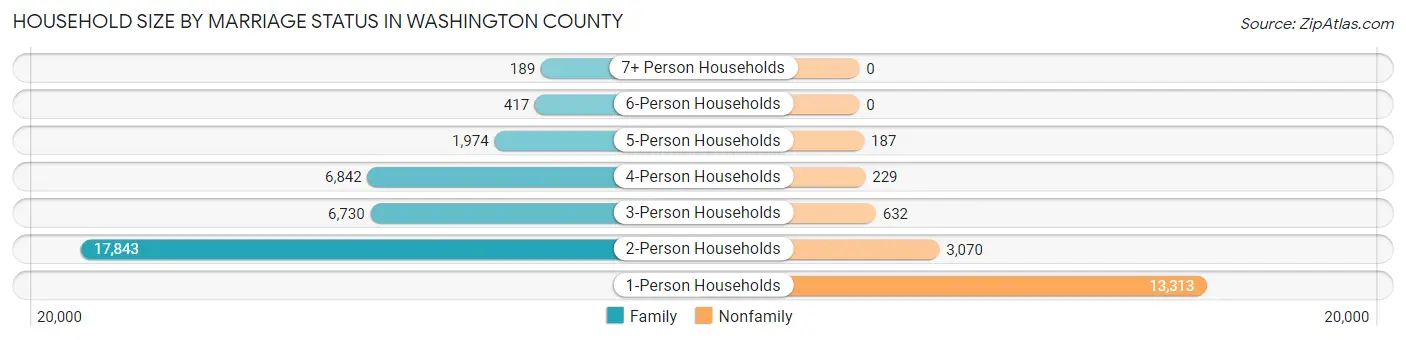
| Household Size | Family Households | Nonfamily Households |
| 1-Person Households | - | 13,313 (25.9%) |
| 2-Person Households | 17,843 (34.7%) | 3,070 (6.0%) |
| 3-Person Households | 6,730 (13.1%) | 632 (1.2%) |
| 4-Person Households | 6,842 (13.3%) | 229 (0.4%) |
| 5-Person Households | 1,974 (3.8%) | 187 (0.4%) |
| 6-Person Households | 417 (0.8%) | 0 (0.0%) |
| 7+ Person Households | 189 (0.4%) | 0 (0.0%) |
| Total | 33,995 (66.1%) | 17,431 (33.9%) |
Female Fertility in Washington County
Fertility by Age in Washington County
Average fertility rate in Washington County is 35.0 births per 1,000 women. Women in the age bracket of 20 to 34 years have the highest fertility rate with 64.0 births per 1,000 women. Women in the age bracket of 20 to 34 years acount for 78.3% of all women with births.
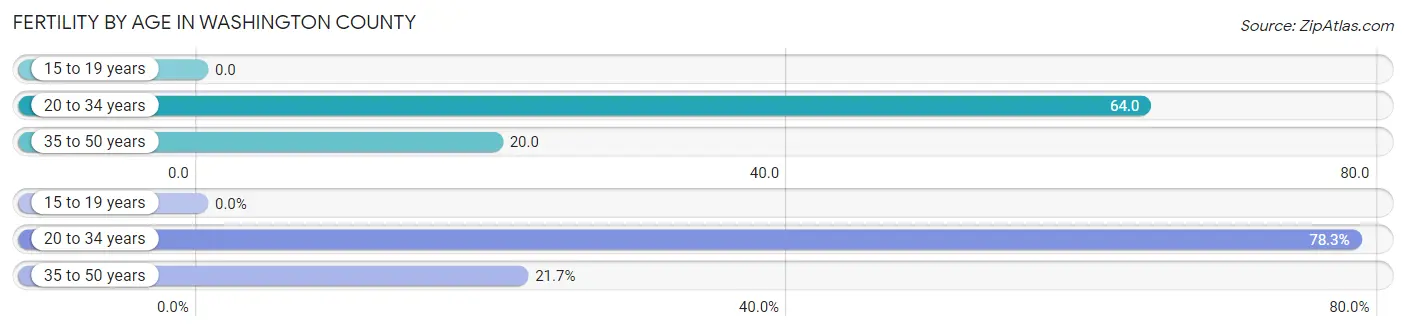
| Age Bracket | Women with Births | Births / 1,000 Women |
| 15 to 19 years | 0 (0.0%) | 0.0 |
| 20 to 34 years | 796 (78.3%) | 64.0 |
| 35 to 50 years | 221 (21.7%) | 20.0 |
| Total | 1,017 (100.0%) | 35.0 |
Fertility by Age by Marriage Status in Washington County
90.3% of women with births (1,017) in Washington County are married. The highest percentage of unmarried women with births falls into 35 to 50 years age bracket with 15.8% of them unmarried at the time of birth, while the lowest percentage of unmarried women with births belong to 20 to 34 years age bracket with 8.0% of them unmarried.
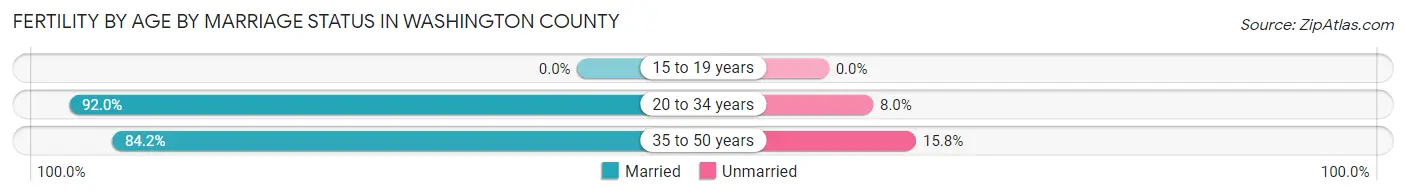
| Age Bracket | Married | Unmarried |
| 15 to 19 years | 0 (0.0%) | 0 (0.0%) |
| 20 to 34 years | 732 (92.0%) | 64 (8.0%) |
| 35 to 50 years | 186 (84.2%) | 35 (15.8%) |
| Total | 918 (90.3%) | 99 (9.7%) |
Fertility by Education in Washington County
Average fertility rate in Washington County is 35.0 births per 1,000 women. Women with the education attainment of less than high school have the highest fertility rate of 79.0 births per 1,000 women, while women with the education attainment of high school diploma have the lowest fertility at 11.0 births per 1,000 women. Women with the education attainment of bachelor's degree represent 31.2% of all women with births.
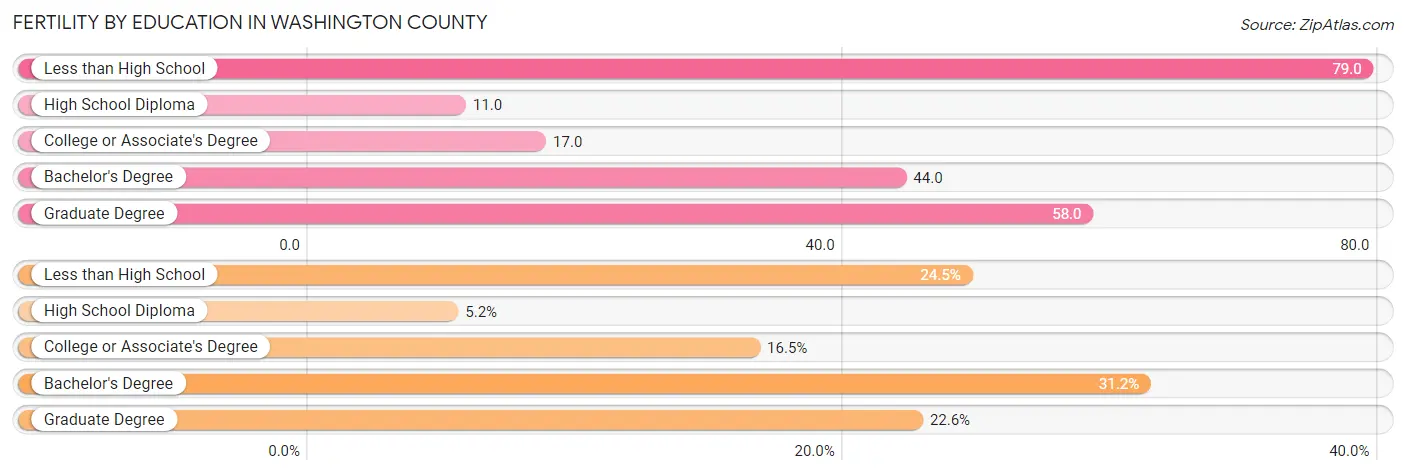
| Educational Attainment | Women with Births | Births / 1,000 Women |
| Less than High School | 249 (24.5%) | 79.0 |
| High School Diploma | 53 (5.2%) | 11.0 |
| College or Associate's Degree | 168 (16.5%) | 17.0 |
| Bachelor's Degree | 317 (31.2%) | 44.0 |
| Graduate Degree | 230 (22.6%) | 58.0 |
| Total | 1,017 (100.0%) | 35.0 |
Fertility by Education by Marriage Status in Washington County
9.7% of women with births in Washington County are unmarried. Women with the educational attainment of high school diploma are most likely to be married with 100.0% of them married at childbirth, while women with the educational attainment of college or associate's degree are least likely to be married with 17.9% of them unmarried at childbirth.
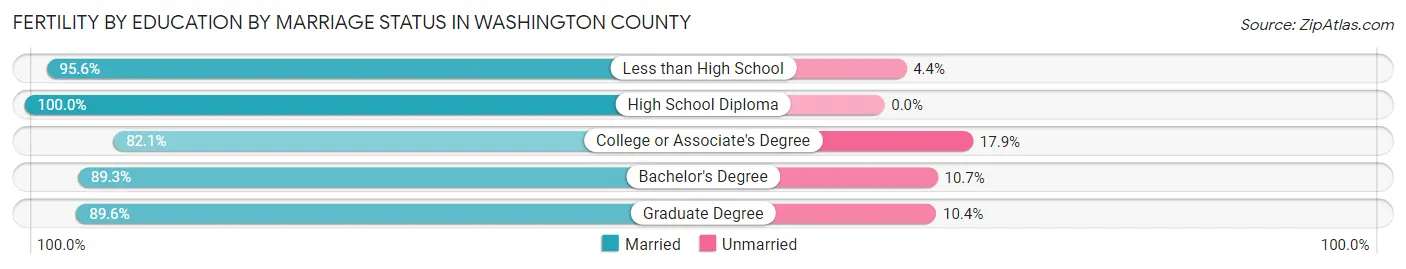
| Educational Attainment | Married | Unmarried |
| Less than High School | 238 (95.6%) | 11 (4.4%) |
| High School Diploma | 53 (100.0%) | 0 (0.0%) |
| College or Associate's Degree | 138 (82.1%) | 30 (17.9%) |
| Bachelor's Degree | 283 (89.3%) | 34 (10.7%) |
| Graduate Degree | 206 (89.6%) | 24 (10.4%) |
| Total | 918 (90.3%) | 99 (9.7%) |
Income in Washington County
Income Overview in Washington County
Per Capita Income in Washington County is $50,008, while median incomes of families and households are $122,848 and $99,510 respectively.
| Characteristic | Number | Measure |
| Per Capita Income | 129,998 | $50,008 |
| Median Family Income | 33,995 | $122,848 |
| Mean Family Income | 33,995 | $147,363 |
| Median Household Income | 51,426 | $99,510 |
| Mean Household Income | 51,426 | $123,968 |
| Income Deficit | 33,995 | $10,958 |
| Wage / Income Gap (%) | 129,998 | 36.33% |
| Wage / Income Gap ($) | 129,998 | 63.67¢ per $1 |
| Gini / Inequality Index | 129,998 | 0.43 |
Earnings by Sex in Washington County
Average Earnings in Washington County are $46,038, $58,004 for men and $36,932 for women, a difference of 36.3%.
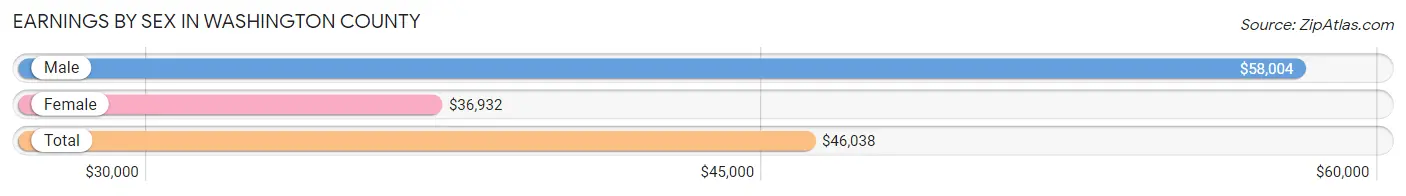
| Sex | Number | Average Earnings |
| Male | 39,794 (51.6%) | $58,004 |
| Female | 37,358 (48.4%) | $36,932 |
| Total | 77,152 (100.0%) | $46,038 |
Earnings by Sex by Income Bracket in Washington County
The most common earnings brackets in Washington County are $100,000+ for men (9,703 | 24.4%) and $75,000 to $99,999 for women (4,395 | 11.8%).
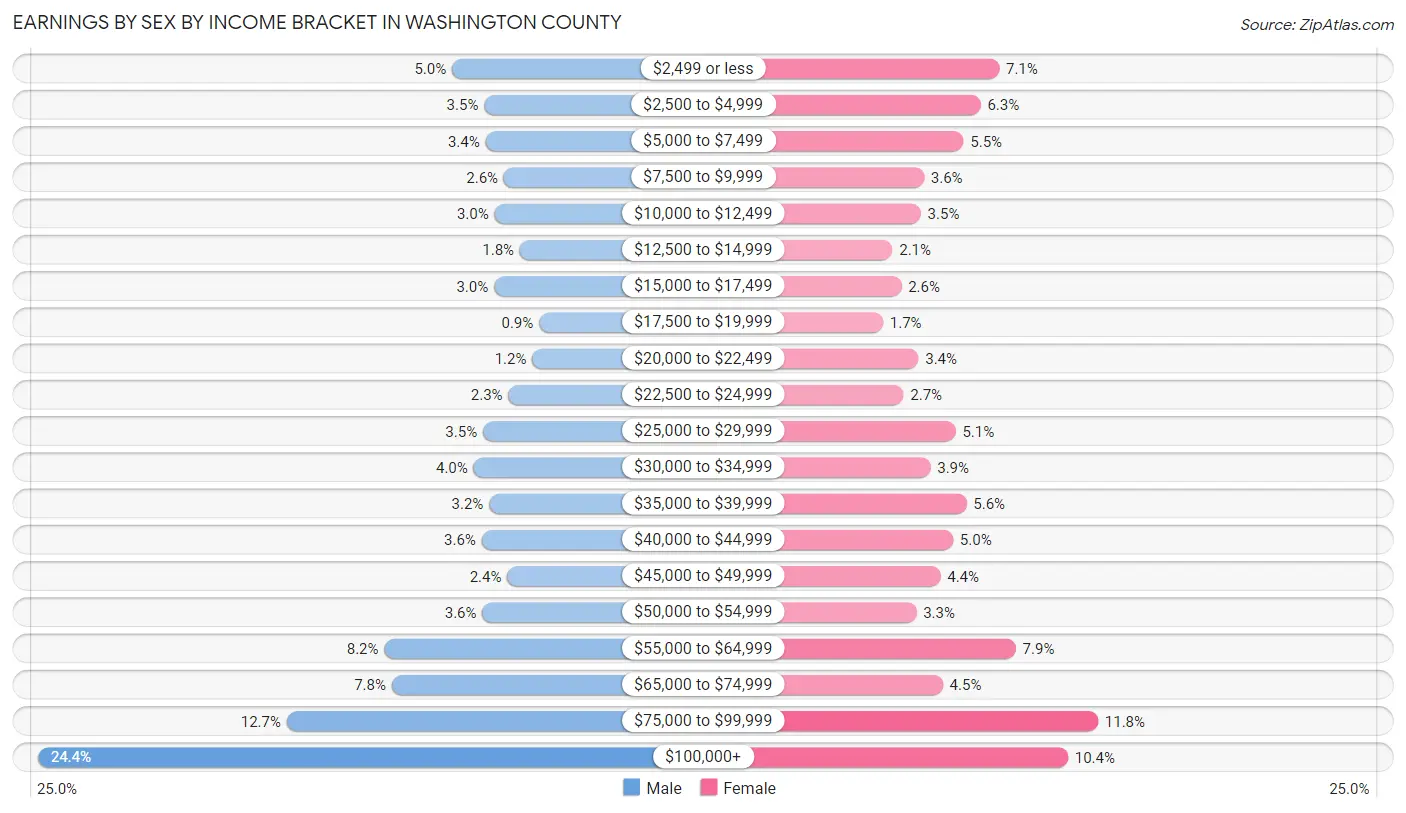
| Income | Male | Female |
| $2,499 or less | 1,982 (5.0%) | 2,663 (7.1%) |
| $2,500 to $4,999 | 1,380 (3.5%) | 2,338 (6.3%) |
| $5,000 to $7,499 | 1,356 (3.4%) | 2,041 (5.5%) |
| $7,500 to $9,999 | 1,016 (2.5%) | 1,347 (3.6%) |
| $10,000 to $12,499 | 1,188 (3.0%) | 1,294 (3.5%) |
| $12,500 to $14,999 | 715 (1.8%) | 795 (2.1%) |
| $15,000 to $17,499 | 1,196 (3.0%) | 952 (2.5%) |
| $17,500 to $19,999 | 360 (0.9%) | 631 (1.7%) |
| $20,000 to $22,499 | 484 (1.2%) | 1,251 (3.4%) |
| $22,500 to $24,999 | 932 (2.3%) | 990 (2.6%) |
| $25,000 to $29,999 | 1,404 (3.5%) | 1,902 (5.1%) |
| $30,000 to $34,999 | 1,581 (4.0%) | 1,461 (3.9%) |
| $35,000 to $39,999 | 1,290 (3.2%) | 2,092 (5.6%) |
| $40,000 to $44,999 | 1,429 (3.6%) | 1,856 (5.0%) |
| $45,000 to $49,999 | 951 (2.4%) | 1,637 (4.4%) |
| $50,000 to $54,999 | 1,418 (3.6%) | 1,215 (3.3%) |
| $55,000 to $64,999 | 3,244 (8.2%) | 2,954 (7.9%) |
| $65,000 to $74,999 | 3,104 (7.8%) | 1,677 (4.5%) |
| $75,000 to $99,999 | 5,061 (12.7%) | 4,395 (11.8%) |
| $100,000+ | 9,703 (24.4%) | 3,867 (10.3%) |
| Total | 39,794 (100.0%) | 37,358 (100.0%) |
Earnings by Sex by Educational Attainment in Washington County
Average earnings in Washington County are $70,035 for men and $47,490 for women, a difference of 32.2%. Men with an educational attainment of graduate degree enjoy the highest average annual earnings of $101,650, while those with less than high school education earn the least with $31,341. Women with an educational attainment of graduate degree earn the most with the average annual earnings of $77,118, while those with less than high school education have the smallest earnings of $25,683.
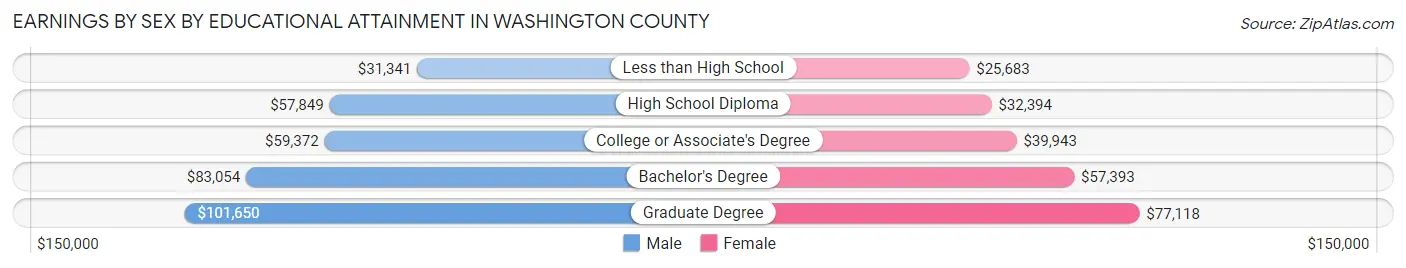
| Educational Attainment | Male Income | Female Income |
| Less than High School | $31,341 | $25,683 |
| High School Diploma | $57,849 | $32,394 |
| College or Associate's Degree | $59,372 | $39,943 |
| Bachelor's Degree | $83,054 | $57,393 |
| Graduate Degree | $101,650 | $77,118 |
| Total | $70,035 | $47,490 |
Family Income in Washington County
Family Income Brackets in Washington County
According to the Washington County family income data, there are 8,431 families falling into the $100,000 to $149,999 income range, which is the most common income bracket and makes up 24.8% of all families. Conversely, the $10,000 to $14,999 income bracket is the least frequent group with only 374 families (1.1%) belonging to this category.
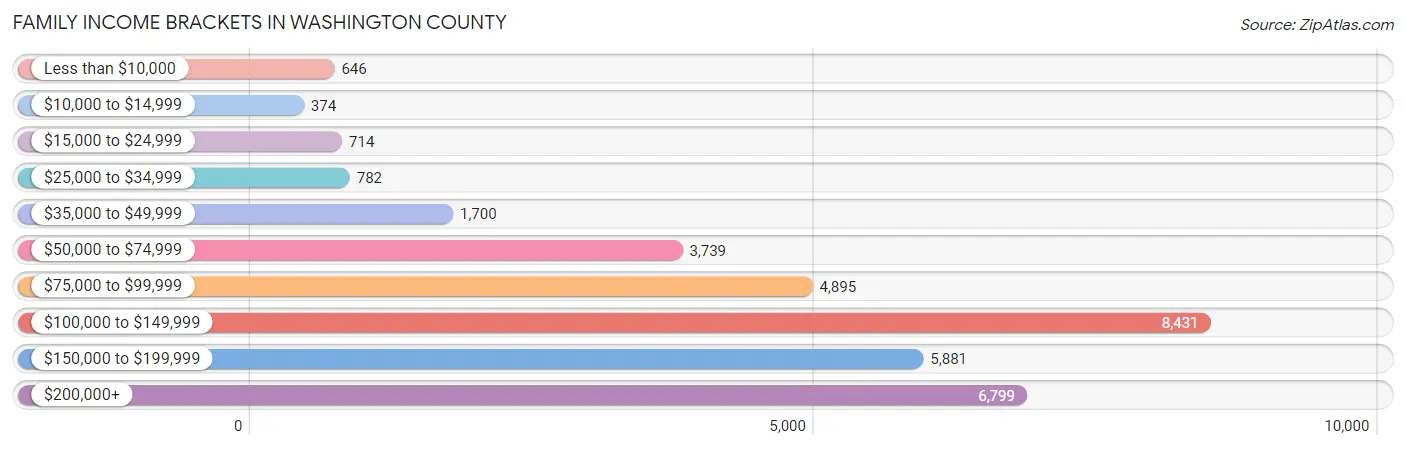
| Income Bracket | # Families | % Families |
| Less than $10,000 | 646 | 1.9% |
| $10,000 to $14,999 | 374 | 1.1% |
| $15,000 to $24,999 | 714 | 2.1% |
| $25,000 to $34,999 | 782 | 2.3% |
| $35,000 to $49,999 | 1,700 | 5.0% |
| $50,000 to $74,999 | 3,739 | 11.0% |
| $75,000 to $99,999 | 4,895 | 14.4% |
| $100,000 to $149,999 | 8,431 | 24.8% |
| $150,000 to $199,999 | 5,881 | 17.3% |
| $200,000+ | 6,799 | 20.0% |
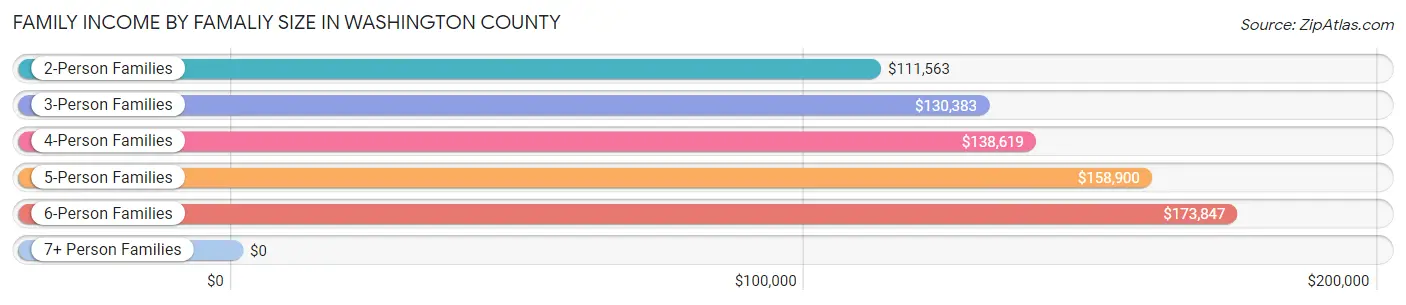
Family Income by Famaliy Size in Washington County
6-person families (383 | 1.1%) account for the highest median family income in Washington County with $173,847 per family, while 2-person families (18,762 | 55.2%) have the highest median income of $55,782 per family member.
| Income Bracket | # Families | Median Income |
| 2-Person Families | 18,762 (55.2%) | $111,563 |
| 3-Person Families | 6,537 (19.2%) | $130,383 |
| 4-Person Families | 6,348 (18.7%) | $138,619 |
| 5-Person Families | 1,776 (5.2%) | $158,900 |
| 6-Person Families | 383 (1.1%) | $173,847 |
| 7+ Person Families | 189 (0.6%) | $0 |
| Total | 33,995 (100.0%) | $122,848 |
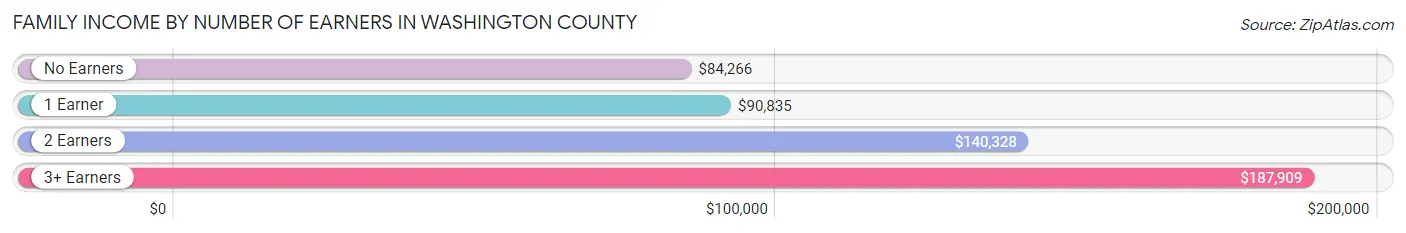
Family Income by Number of Earners in Washington County
The median family income in Washington County is $122,848, with families comprising 3+ earners (4,378) having the highest median family income of $187,909, while families with no earners (5,445) have the lowest median family income of $84,266, accounting for 12.9% and 16.0% of families, respectively.
| Number of Earners | # Families | Median Income |
| No Earners | 5,445 (16.0%) | $84,266 |
| 1 Earner | 9,523 (28.0%) | $90,835 |
| 2 Earners | 14,649 (43.1%) | $140,328 |
| 3+ Earners | 4,378 (12.9%) | $187,909 |
| Total | 33,995 (100.0%) | $122,848 |
Household Income in Washington County
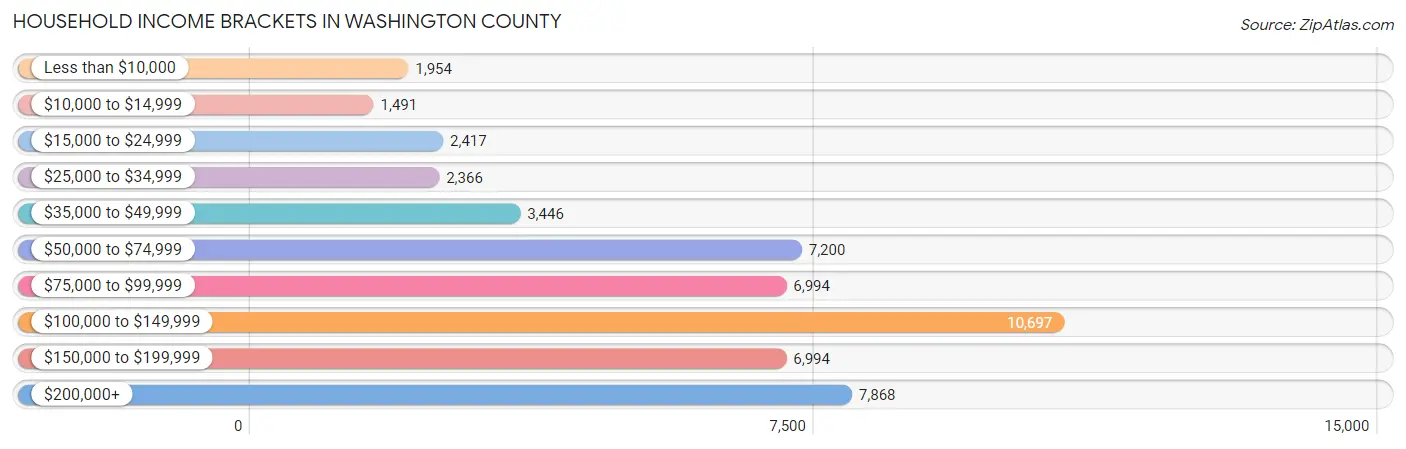
Household Income Brackets in Washington County
With 10,697 households falling in the category, the $100,000 to $149,999 income range is the most frequent in Washington County, accounting for 20.8% of all households. In contrast, only 1,491 households (2.9%) fall into the $10,000 to $14,999 income bracket, making it the least populous group.
| Income Bracket | # Households | % Households |
| Less than $10,000 | 1,954 | 3.8% |
| $10,000 to $14,999 | 1,491 | 2.9% |
| $15,000 to $24,999 | 2,417 | 4.7% |
| $25,000 to $34,999 | 2,366 | 4.6% |
| $35,000 to $49,999 | 3,446 | 6.7% |
| $50,000 to $74,999 | 7,200 | 14.0% |
| $75,000 to $99,999 | 6,994 | 13.6% |
| $100,000 to $149,999 | 10,697 | 20.8% |
| $150,000 to $199,999 | 6,994 | 13.6% |
| $200,000+ | 7,868 | 15.3% |
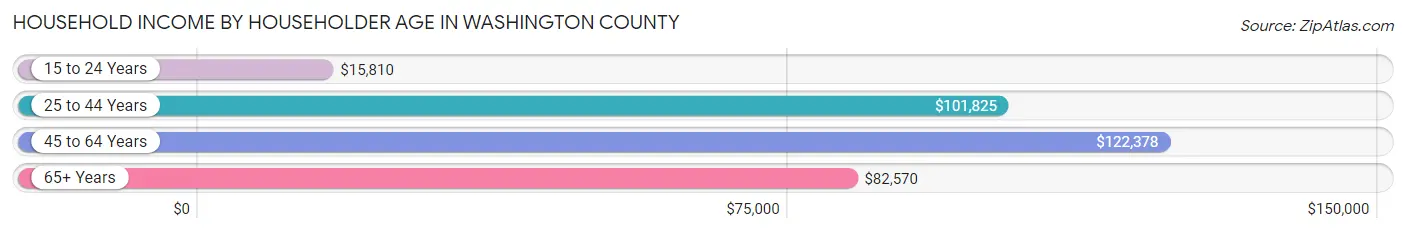
Household Income by Householder Age in Washington County
The median household income in Washington County is $99,510, with the highest median household income of $122,378 found in the 45 to 64 years age bracket for the primary householder. A total of 20,652 households (40.2%) fall into this category. Meanwhile, the 15 to 24 years age bracket for the primary householder has the lowest median household income of $15,810, with 1,891 households (3.7%) in this group.
| Income Bracket | # Households | Median Income |
| 15 to 24 Years | 1,891 (3.7%) | $15,810 |
| 25 to 44 Years | 11,818 (23.0%) | $101,825 |
| 45 to 64 Years | 20,652 (40.2%) | $122,378 |
| 65+ Years | 17,065 (33.2%) | $82,570 |
| Total | 51,426 (100.0%) | $99,510 |
Poverty in Washington County
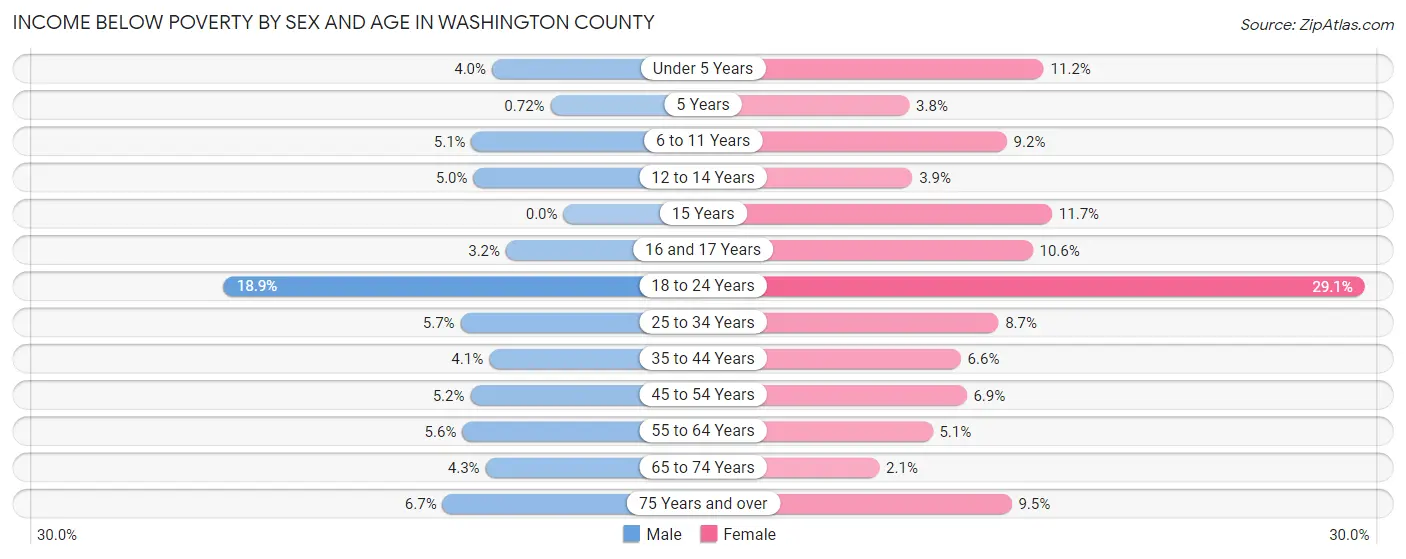
Income Below Poverty by Sex and Age in Washington County
With 6.6% poverty level for males and 9.1% for females among the residents of Washington County, 18 to 24 year old males and 18 to 24 year old females are the most vulnerable to poverty, with 1,307 males (18.9%) and 2,032 females (29.1%) in their respective age groups living below the poverty level.
| Age Bracket | Male | Female |
| Under 5 Years | 91 (4.0%) | 256 (11.2%) |
| 5 Years | 4 (0.7%) | 19 (3.7%) |
| 6 to 11 Years | 170 (5.1%) | 306 (9.2%) |
| 12 to 14 Years | 100 (5.0%) | 65 (3.9%) |
| 15 Years | 0 (0.0%) | 101 (11.7%) |
| 16 and 17 Years | 53 (3.2%) | 134 (10.6%) |
| 18 to 24 Years | 1,307 (18.9%) | 2,032 (29.1%) |
| 25 to 34 Years | 389 (5.7%) | 535 (8.7%) |
| 35 to 44 Years | 263 (4.1%) | 422 (6.6%) |
| 45 to 54 Years | 399 (5.2%) | 547 (6.9%) |
| 55 to 64 Years | 569 (5.6%) | 540 (5.1%) |
| 65 to 74 Years | 356 (4.3%) | 180 (2.1%) |
| 75 Years and over | 307 (6.7%) | 608 (9.5%) |
| Total | 4,008 (6.6%) | 5,745 (9.1%) |
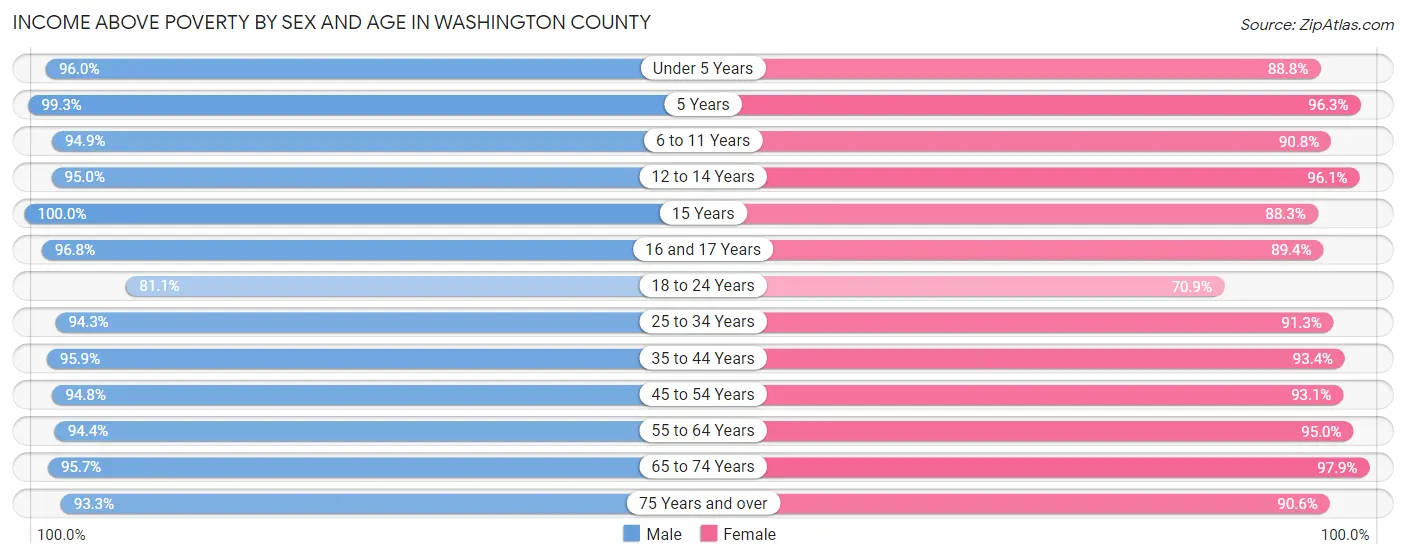
Income Above Poverty by Sex and Age in Washington County
According to the poverty statistics in Washington County, males aged 15 years and females aged 65 to 74 years are the age groups that are most secure financially, with 100.0% of males and 97.9% of females in these age groups living above the poverty line.
| Age Bracket | Male | Female |
| Under 5 Years | 2,198 (96.0%) | 2,021 (88.8%) |
| 5 Years | 555 (99.3%) | 487 (96.3%) |
| 6 to 11 Years | 3,151 (94.9%) | 3,026 (90.8%) |
| 12 to 14 Years | 1,896 (95.0%) | 1,593 (96.1%) |
| 15 Years | 489 (100.0%) | 762 (88.3%) |
| 16 and 17 Years | 1,603 (96.8%) | 1,128 (89.4%) |
| 18 to 24 Years | 5,607 (81.1%) | 4,949 (70.9%) |
| 25 to 34 Years | 6,398 (94.3%) | 5,608 (91.3%) |
| 35 to 44 Years | 6,090 (95.9%) | 5,951 (93.4%) |
| 45 to 54 Years | 7,306 (94.8%) | 7,336 (93.1%) |
| 55 to 64 Years | 9,543 (94.4%) | 10,152 (95.0%) |
| 65 to 74 Years | 7,842 (95.7%) | 8,467 (97.9%) |
| 75 Years and over | 4,253 (93.3%) | 5,827 (90.5%) |
| Total | 56,931 (93.4%) | 57,307 (90.9%) |
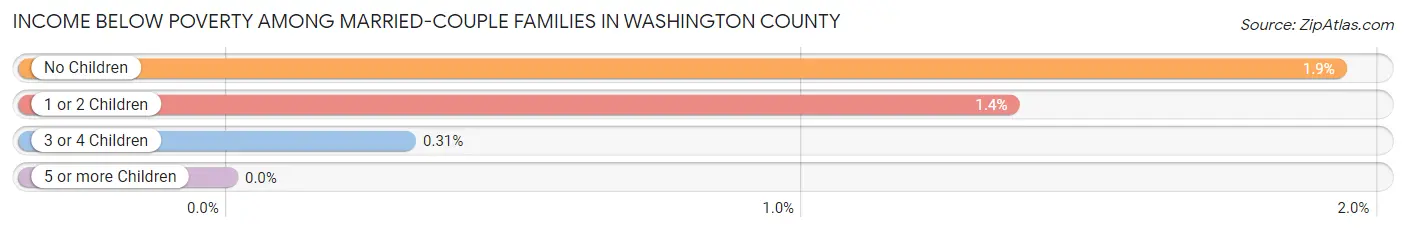
Income Below Poverty Among Married-Couple Families in Washington County
The poverty statistics for married-couple families in Washington County show that 1.7% or 464 of the total 27,286 families live below the poverty line. Families with no children have the highest poverty rate of 1.9%, comprising of 365 families. On the other hand, families with 5 or more children have the lowest poverty rate of 0.0%, which includes 0 families.
| Children | Above Poverty | Below Poverty |
| No Children | 18,564 (98.1%) | 365 (1.9%) |
| 1 or 2 Children | 6,895 (98.6%) | 95 (1.4%) |
| 3 or 4 Children | 1,277 (99.7%) | 4 (0.3%) |
| 5 or more Children | 86 (100.0%) | 0 (0.0%) |
| Total | 26,822 (98.3%) | 464 (1.7%) |
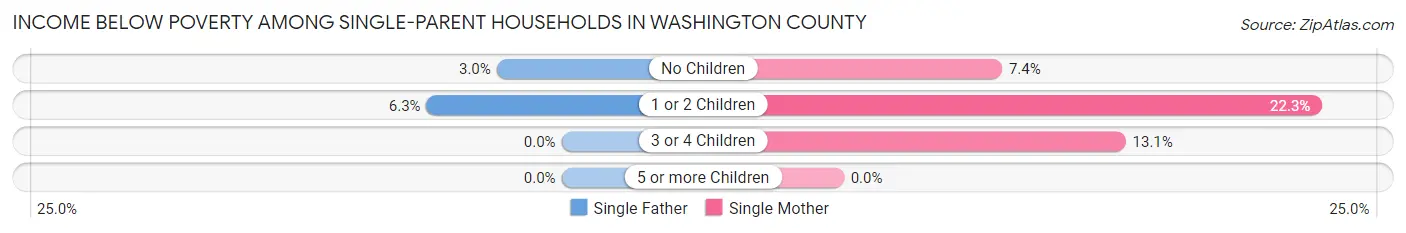
Income Below Poverty Among Single-Parent Households in Washington County
According to the poverty data in Washington County, 4.4% or 82 single-father households and 15.9% or 769 single-mother households are living below the poverty line. Among single-father households, those with 1 or 2 children have the highest poverty rate, with 53 households (6.3%) experiencing poverty. Likewise, among single-mother households, those with 1 or 2 children have the highest poverty rate, with 585 households (22.3%) falling below the poverty line.
| Children | Single Father | Single Mother |
| No Children | 29 (3.0%) | 137 (7.4%) |
| 1 or 2 Children | 53 (6.3%) | 585 (22.3%) |
| 3 or 4 Children | 0 (0.0%) | 47 (13.1%) |
| 5 or more Children | 0 (0.0%) | 0 (0.0%) |
| Total | 82 (4.4%) | 769 (15.9%) |
Income Below Poverty Among Married-Couple vs Single-Parent Households in Washington County
The poverty data for Washington County shows that 464 of the married-couple family households (1.7%) and 851 of the single-parent households (12.7%) are living below the poverty level. Within the married-couple family households, those with no children have the highest poverty rate, with 365 households (1.9%) falling below the poverty line. Among the single-parent households, those with 1 or 2 children have the highest poverty rate, with 638 household (18.4%) living below poverty.
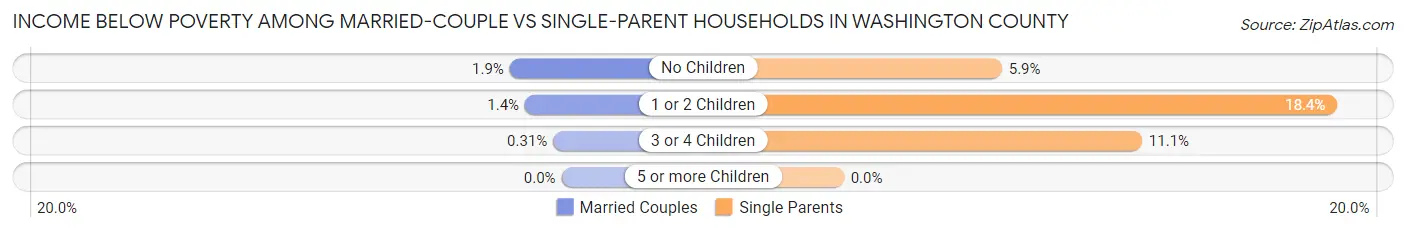
| Children | Married-Couple Families | Single-Parent Households |
| No Children | 365 (1.9%) | 166 (5.9%) |
| 1 or 2 Children | 95 (1.4%) | 638 (18.4%) |
| 3 or 4 Children | 4 (0.3%) | 47 (11.1%) |
| 5 or more Children | 0 (0.0%) | 0 (0.0%) |
| Total | 464 (1.7%) | 851 (12.7%) |
Employment Characteristics in Washington County
Employment by Class of Employer in Washington County
Among the 65,562 employed individuals in Washington County, private company employees (40,196 | 61.3%), not-for-profit organizations (6,633 | 10.1%), and local government employees (4,729 | 7.2%) make up the most common classes of employment.
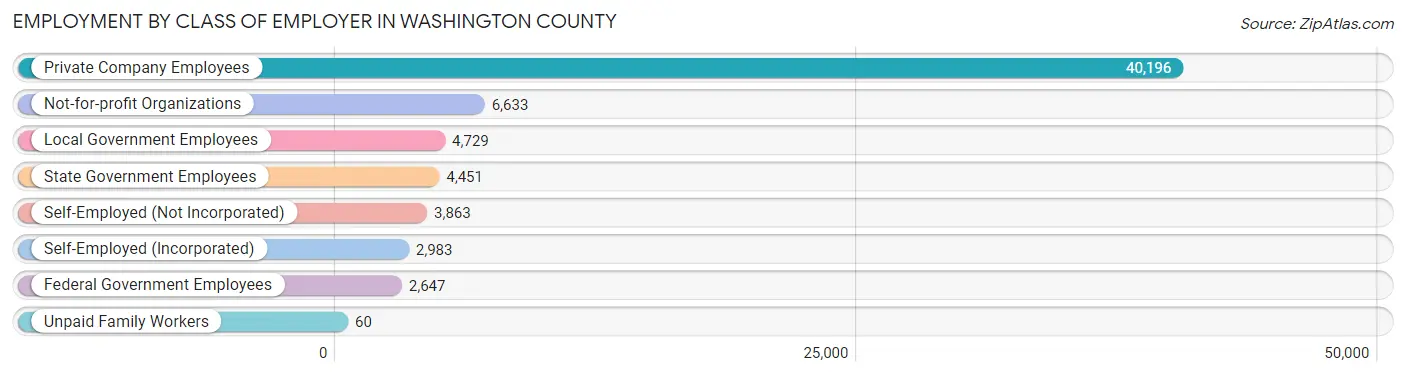
| Employer Class | # Employees | % Employees |
| Private Company Employees | 40,196 | 61.3% |
| Self-Employed (Incorporated) | 2,983 | 4.5% |
| Self-Employed (Not Incorporated) | 3,863 | 5.9% |
| Not-for-profit Organizations | 6,633 | 10.1% |
| Local Government Employees | 4,729 | 7.2% |
| State Government Employees | 4,451 | 6.8% |
| Federal Government Employees | 2,647 | 4.0% |
| Unpaid Family Workers | 60 | 0.1% |
| Total | 65,562 | 100.0% |
Employment Status by Age in Washington County
According to the labor force statistics for Washington County, out of the total population over 16 years of age (112,443), 63.2% or 71,064 individuals are in the labor force, with 5.9% or 4,193 of them unemployed. The age group with the highest labor force participation rate is 35 to 44 years, with 89.0% or 11,332 individuals in the labor force. Within the labor force, the 16 to 19 years age range has the highest percentage of unemployed individuals, with 12.9% or 455 of them being unemployed.
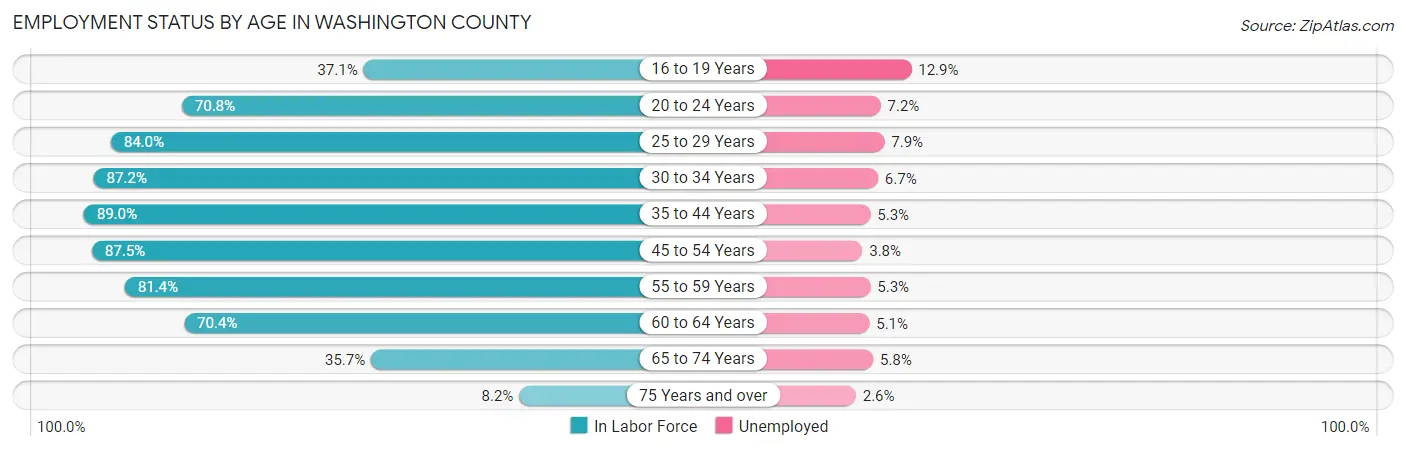
| Age Bracket | In Labor Force | Unemployed |
| 16 to 19 Years | 3,529 (37.1%) | 455 (12.9%) |
| 20 to 24 Years | 8,757 (70.8%) | 631 (7.2%) |
| 25 to 29 Years | 5,626 (84.0%) | 444 (7.9%) |
| 30 to 34 Years | 5,437 (87.2%) | 364 (6.7%) |
| 35 to 44 Years | 11,332 (89.0%) | 601 (5.3%) |
| 45 to 54 Years | 13,652 (87.5%) | 519 (3.8%) |
| 55 to 59 Years | 8,050 (81.4%) | 427 (5.3%) |
| 60 to 64 Years | 7,707 (70.4%) | 393 (5.1%) |
| 65 to 74 Years | 6,040 (35.7%) | 350 (5.8%) |
| 75 Years and over | 946 (8.2%) | 25 (2.6%) |
| Total | 71,064 (63.2%) | 4,193 (5.9%) |
Employment Status by Educational Attainment in Washington County
According to labor force statistics for Washington County, 83.4% of individuals (51,796) out of the total population between 25 and 64 years of age (62,105) are in the labor force, with 5.3% or 2,745 of them being unemployed. The group with the highest labor force participation rate are those with the educational attainment of bachelor's degree or higher, with 87.0% or 26,585 individuals in the labor force. Within the labor force, individuals with less than high school education have the highest percentage of unemployment, with 15.4% or 236 of them being unemployed.
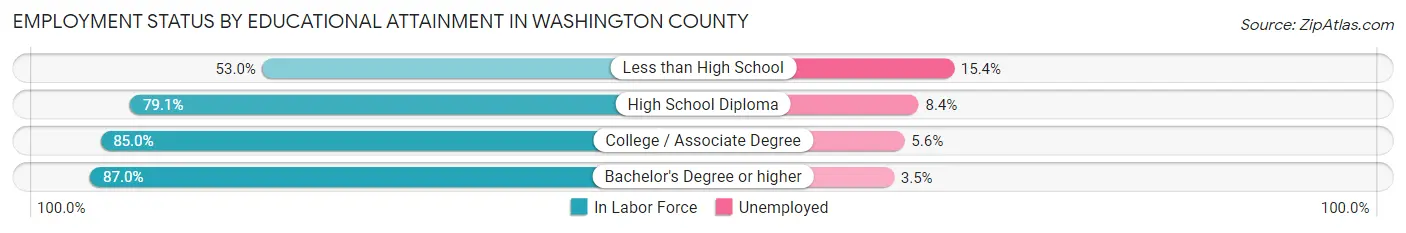
| Educational Attainment | In Labor Force | Unemployed |
| Less than High School | 1,530 (53.0%) | 444 (15.4%) |
| High School Diploma | 9,348 (79.1%) | 993 (8.4%) |
| College / Associate Degree | 14,317 (85.0%) | 943 (5.6%) |
| Bachelor's Degree or higher | 26,585 (87.0%) | 1,070 (3.5%) |
| Total | 51,796 (83.4%) | 3,292 (5.3%) |
Employment Occupations by Sex in Washington County
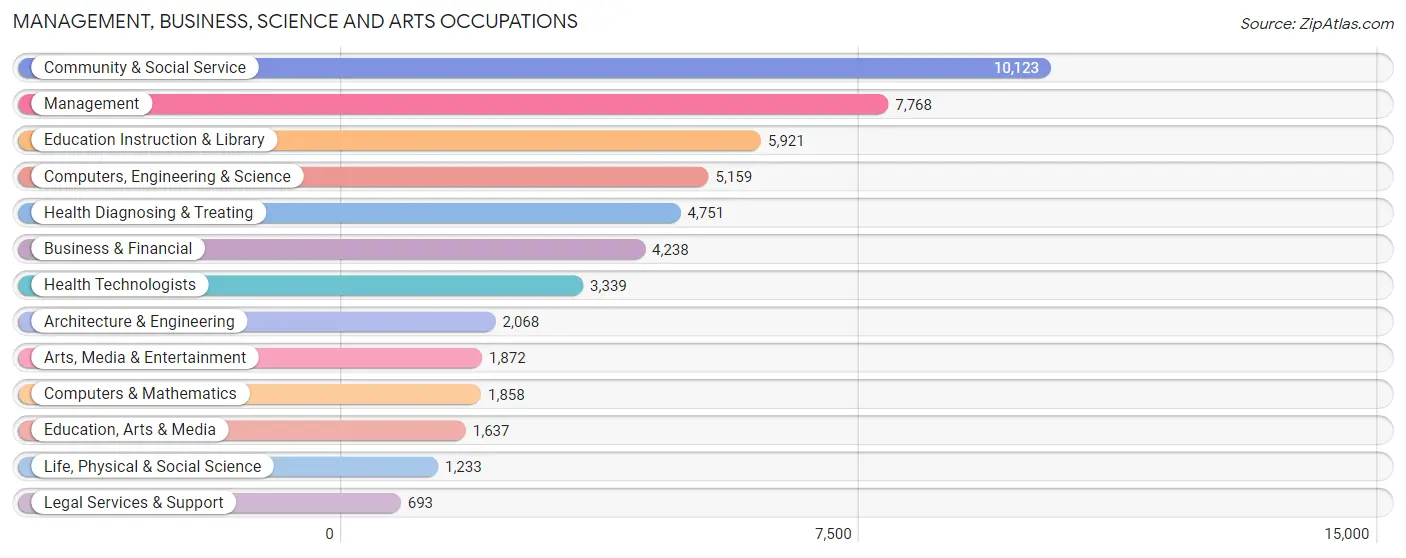
Management, Business, Science and Arts Occupations
The most common Management, Business, Science and Arts occupations in Washington County are Community & Social Service (10,123 | 15.3%), Management (7,768 | 11.7%), Education Instruction & Library (5,921 | 8.9%), Computers, Engineering & Science (5,159 | 7.8%), and Health Diagnosing & Treating (4,751 | 7.2%).
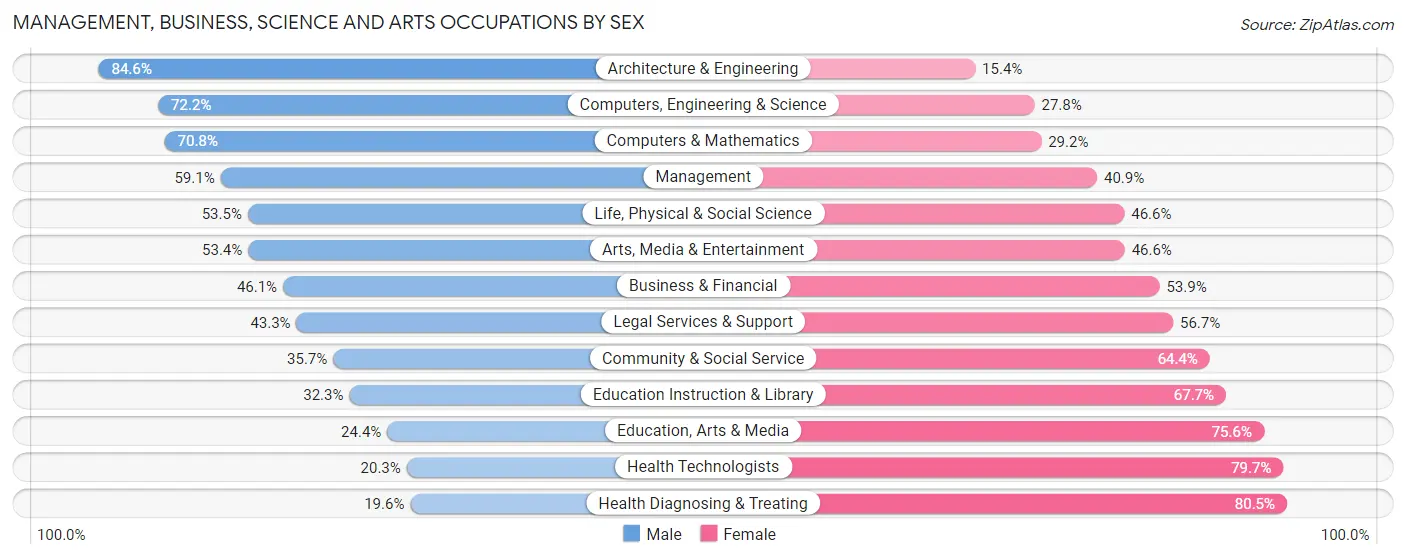
Management, Business, Science and Arts Occupations by Sex
Within the Management, Business, Science and Arts occupations in Washington County, the most male-oriented occupations are Architecture & Engineering (84.6%), Computers, Engineering & Science (72.2%), and Computers & Mathematics (70.8%), while the most female-oriented occupations are Health Diagnosing & Treating (80.4%), Health Technologists (79.7%), and Education, Arts & Media (75.6%).
| Occupation | Male | Female |
| Management | 4,594 (59.1%) | 3,174 (40.9%) |
| Business & Financial | 1,954 (46.1%) | 2,284 (53.9%) |
| Computers, Engineering & Science | 3,723 (72.2%) | 1,436 (27.8%) |
| Computers & Mathematics | 1,315 (70.8%) | 543 (29.2%) |
| Architecture & Engineering | 1,749 (84.6%) | 319 (15.4%) |
| Life, Physical & Social Science | 659 (53.4%) | 574 (46.6%) |
| Community & Social Service | 3,609 (35.6%) | 6,514 (64.3%) |
| Education, Arts & Media | 399 (24.4%) | 1,238 (75.6%) |
| Legal Services & Support | 300 (43.3%) | 393 (56.7%) |
| Education Instruction & Library | 1,911 (32.3%) | 4,010 (67.7%) |
| Arts, Media & Entertainment | 999 (53.4%) | 873 (46.6%) |
| Health Diagnosing & Treating | 929 (19.6%) | 3,822 (80.4%) |
| Health Technologists | 678 (20.3%) | 2,661 (79.7%) |
| Total (Category) | 14,809 (46.2%) | 17,230 (53.8%) |
| Total (Overall) | 34,335 (51.8%) | 31,883 (48.1%) |
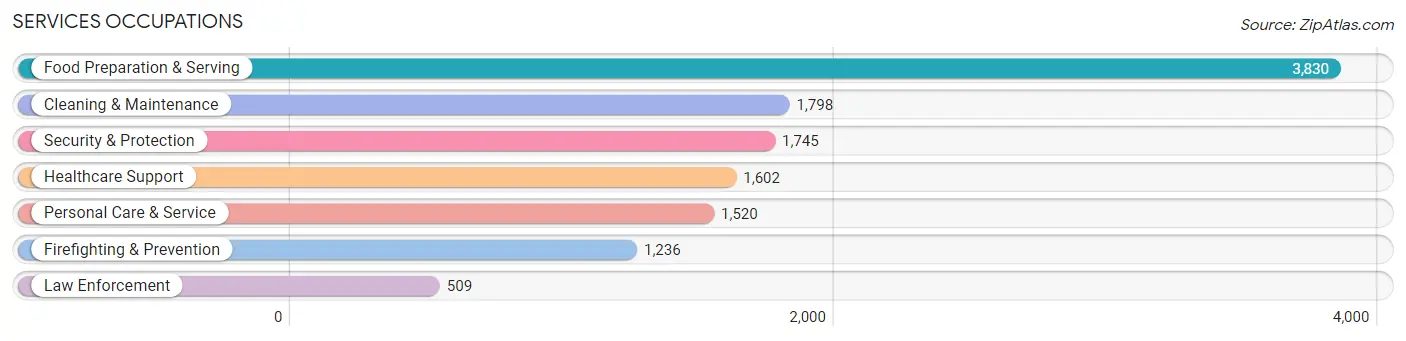
Services Occupations
The most common Services occupations in Washington County are Food Preparation & Serving (3,830 | 5.8%), Cleaning & Maintenance (1,798 | 2.7%), Security & Protection (1,745 | 2.6%), Healthcare Support (1,602 | 2.4%), and Personal Care & Service (1,520 | 2.3%).
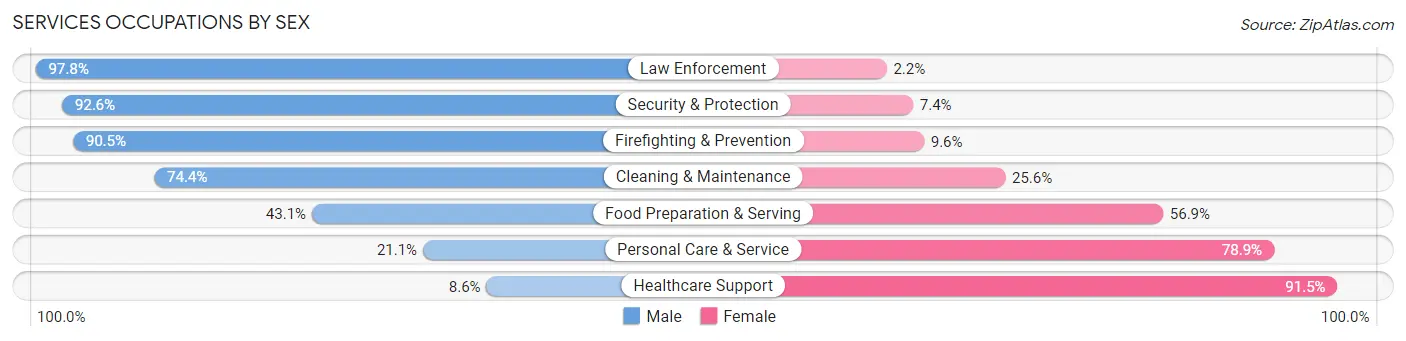
Services Occupations by Sex
Within the Services occupations in Washington County, the most male-oriented occupations are Law Enforcement (97.8%), Security & Protection (92.6%), and Firefighting & Prevention (90.4%), while the most female-oriented occupations are Healthcare Support (91.4%), Personal Care & Service (78.9%), and Food Preparation & Serving (56.9%).
| Occupation | Male | Female |
| Healthcare Support | 137 (8.6%) | 1,465 (91.4%) |
| Security & Protection | 1,616 (92.6%) | 129 (7.4%) |
| Firefighting & Prevention | 1,118 (90.4%) | 118 (9.6%) |
| Law Enforcement | 498 (97.8%) | 11 (2.2%) |
| Food Preparation & Serving | 1,651 (43.1%) | 2,179 (56.9%) |
| Cleaning & Maintenance | 1,337 (74.4%) | 461 (25.6%) |
| Personal Care & Service | 321 (21.1%) | 1,199 (78.9%) |
| Total (Category) | 5,062 (48.2%) | 5,433 (51.8%) |
| Total (Overall) | 34,335 (51.8%) | 31,883 (48.1%) |
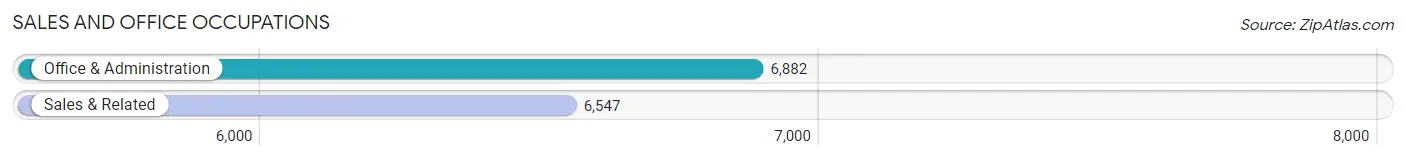
Sales and Office Occupations
The most common Sales and Office occupations in Washington County are Office & Administration (6,882 | 10.4%), and Sales & Related (6,547 | 9.9%).
Sales and Office Occupations by Sex
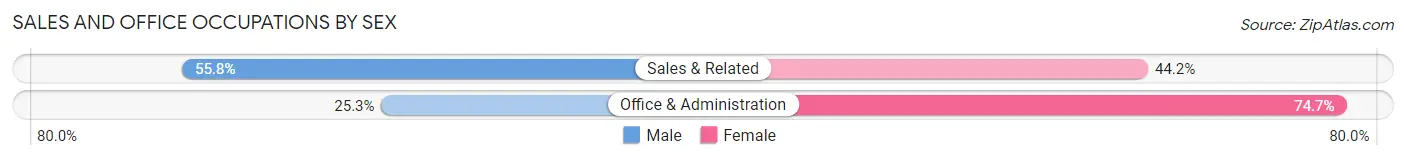
| Occupation | Male | Female |
| Sales & Related | 3,651 (55.8%) | 2,896 (44.2%) |
| Office & Administration | 1,739 (25.3%) | 5,143 (74.7%) |
| Total (Category) | 5,390 (40.1%) | 8,039 (59.9%) |
| Total (Overall) | 34,335 (51.8%) | 31,883 (48.1%) |
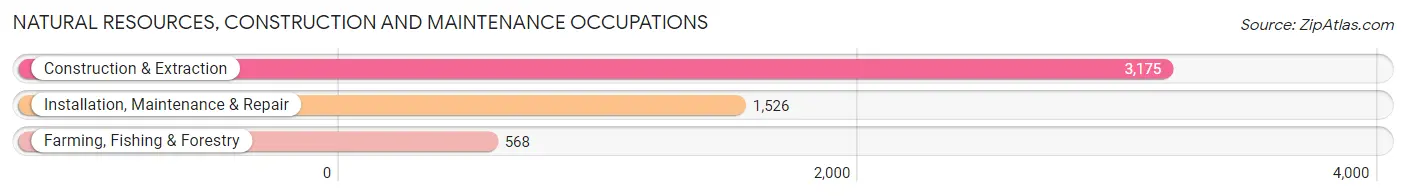
Natural Resources, Construction and Maintenance Occupations
The most common Natural Resources, Construction and Maintenance occupations in Washington County are Construction & Extraction (3,175 | 4.8%), Installation, Maintenance & Repair (1,526 | 2.3%), and Farming, Fishing & Forestry (568 | 0.9%).
Natural Resources, Construction and Maintenance Occupations by Sex
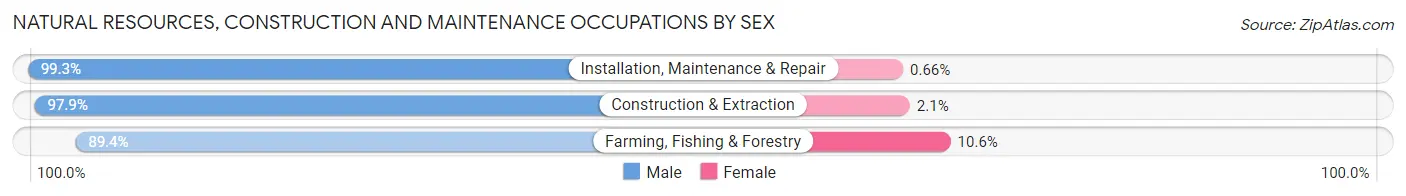
| Occupation | Male | Female |
| Farming, Fishing & Forestry | 508 (89.4%) | 60 (10.6%) |
| Construction & Extraction | 3,109 (97.9%) | 66 (2.1%) |
| Installation, Maintenance & Repair | 1,516 (99.3%) | 10 (0.7%) |
| Total (Category) | 5,133 (97.4%) | 136 (2.6%) |
| Total (Overall) | 34,335 (51.8%) | 31,883 (48.1%) |
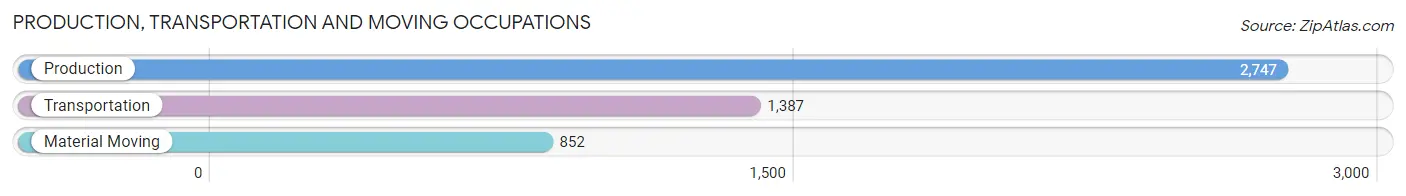
Production, Transportation and Moving Occupations
The most common Production, Transportation and Moving occupations in Washington County are Production (2,747 | 4.2%), Transportation (1,387 | 2.1%), and Material Moving (852 | 1.3%).
Production, Transportation and Moving Occupations by Sex
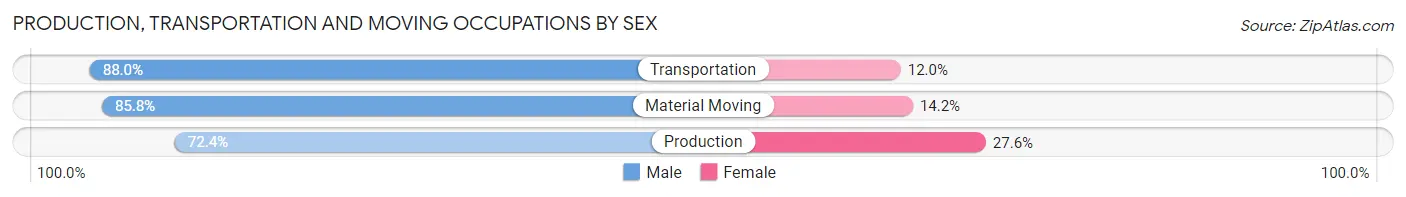
| Occupation | Male | Female |
| Production | 1,989 (72.4%) | 758 (27.6%) |
| Transportation | 1,221 (88.0%) | 166 (12.0%) |
| Material Moving | 731 (85.8%) | 121 (14.2%) |
| Total (Category) | 3,941 (79.0%) | 1,045 (21.0%) |
| Total (Overall) | 34,335 (51.8%) | 31,883 (48.1%) |
Employment Industries by Sex in Washington County
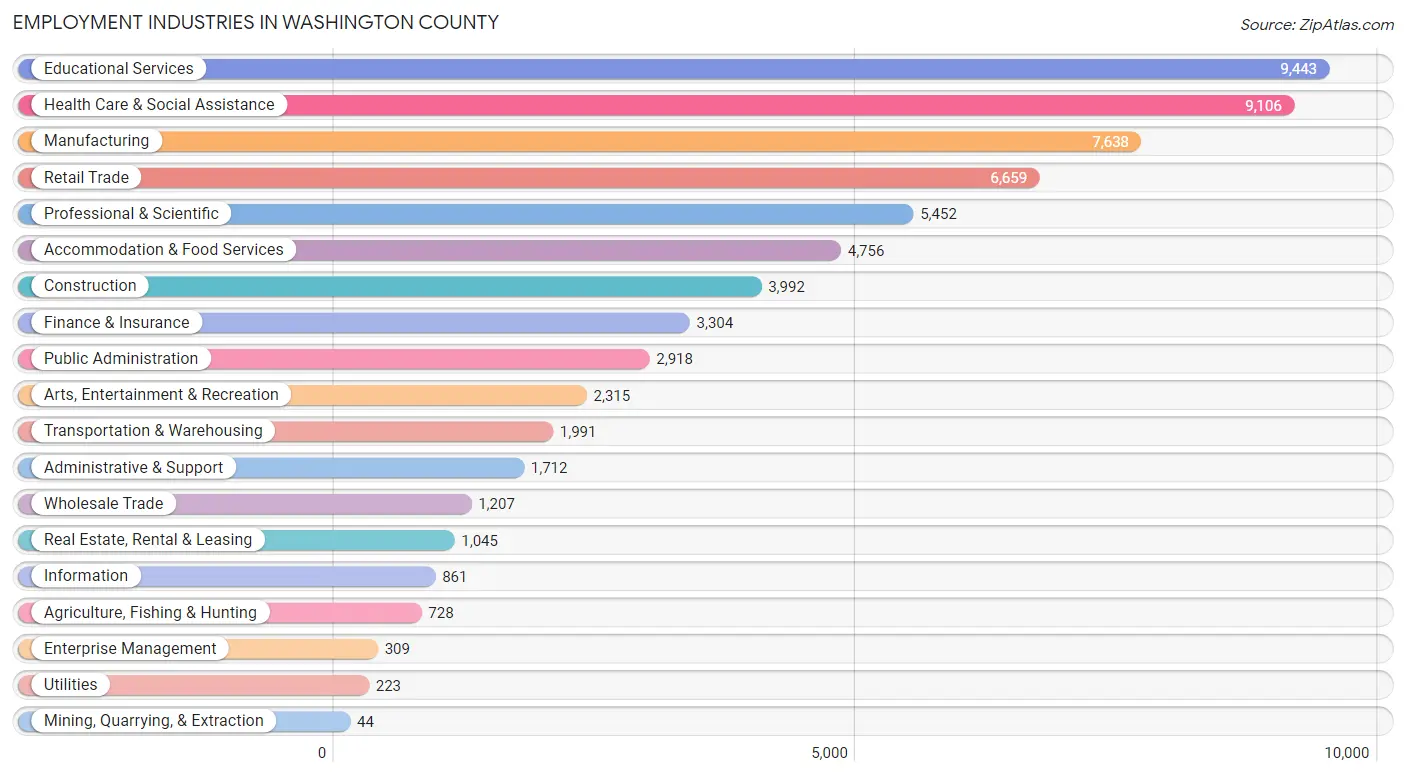
Employment Industries in Washington County
The major employment industries in Washington County include Educational Services (9,443 | 14.3%), Health Care & Social Assistance (9,106 | 13.8%), Manufacturing (7,638 | 11.5%), Retail Trade (6,659 | 10.1%), and Professional & Scientific (5,452 | 8.2%).
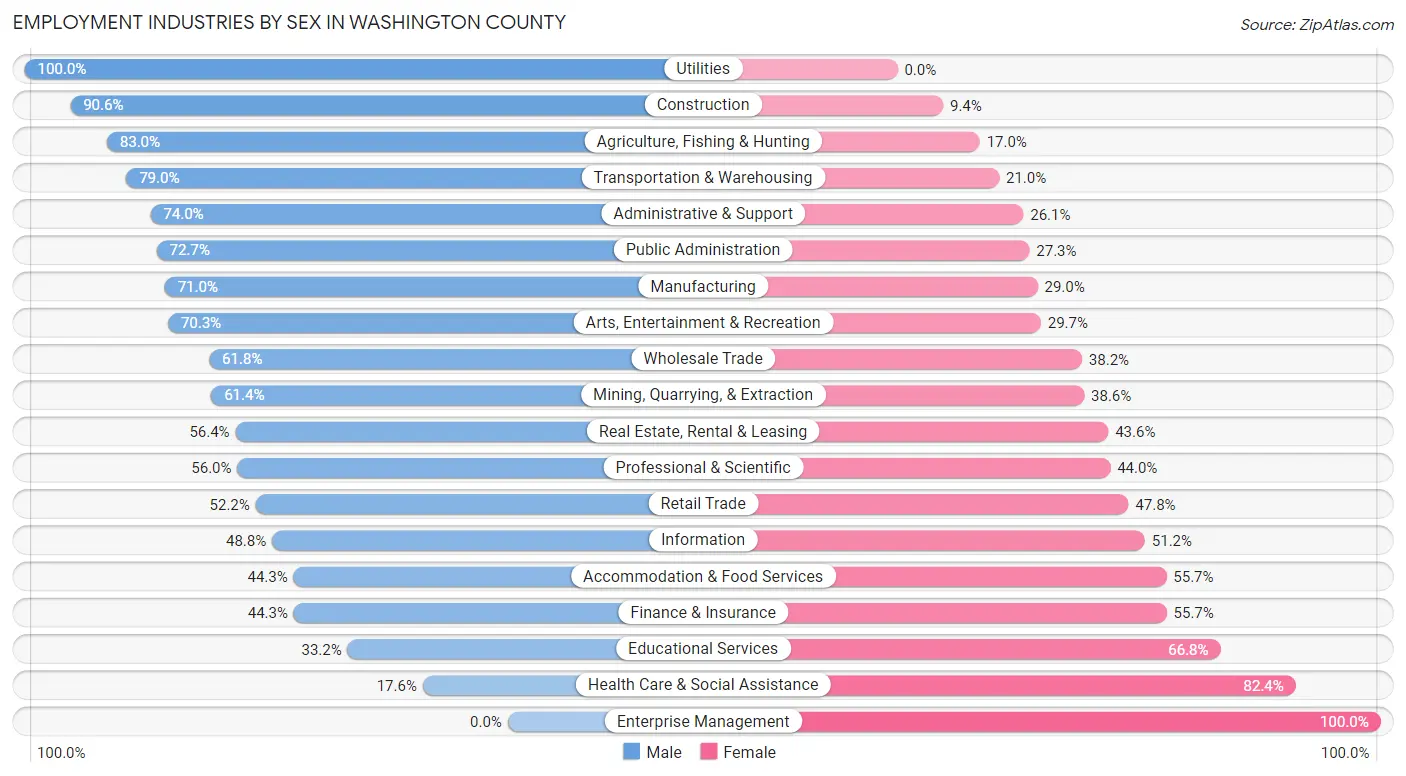
Employment Industries by Sex in Washington County
The Washington County industries that see more men than women are Utilities (100.0%), Construction (90.6%), and Agriculture, Fishing & Hunting (83.0%), whereas the industries that tend to have a higher number of women are Enterprise Management (100.0%), Health Care & Social Assistance (82.4%), and Educational Services (66.8%).
| Industry | Male | Female |
| Agriculture, Fishing & Hunting | 604 (83.0%) | 124 (17.0%) |
| Mining, Quarrying, & Extraction | 27 (61.4%) | 17 (38.6%) |
| Construction | 3,615 (90.6%) | 377 (9.4%) |
| Manufacturing | 5,422 (71.0%) | 2,216 (29.0%) |
| Wholesale Trade | 746 (61.8%) | 461 (38.2%) |
| Retail Trade | 3,475 (52.2%) | 3,184 (47.8%) |
| Transportation & Warehousing | 1,572 (79.0%) | 419 (21.0%) |
| Utilities | 223 (100.0%) | 0 (0.0%) |
| Information | 420 (48.8%) | 441 (51.2%) |
| Finance & Insurance | 1,463 (44.3%) | 1,841 (55.7%) |
| Real Estate, Rental & Leasing | 589 (56.4%) | 456 (43.6%) |
| Professional & Scientific | 3,051 (56.0%) | 2,401 (44.0%) |
| Enterprise Management | 0 (0.0%) | 309 (100.0%) |
| Administrative & Support | 1,266 (74.0%) | 446 (26.1%) |
| Educational Services | 3,131 (33.2%) | 6,312 (66.8%) |
| Health Care & Social Assistance | 1,602 (17.6%) | 7,504 (82.4%) |
| Arts, Entertainment & Recreation | 1,628 (70.3%) | 687 (29.7%) |
| Accommodation & Food Services | 2,109 (44.3%) | 2,647 (55.7%) |
| Public Administration | 2,121 (72.7%) | 797 (27.3%) |
| Total | 34,335 (51.8%) | 31,883 (48.1%) |
Education in Washington County
School Enrollment in Washington County
The most common levels of schooling among the 33,554 students in Washington County are college / undergraduate (13,293 | 39.6%), high school (5,763 | 17.2%), and elementary school (4,677 | 13.9%).
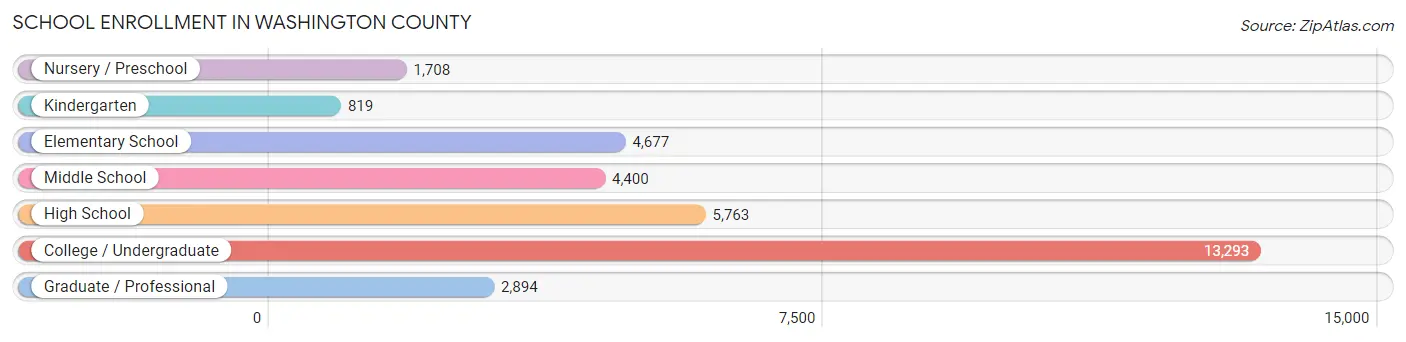
| School Level | # Students | % Students |
| Nursery / Preschool | 1,708 | 5.1% |
| Kindergarten | 819 | 2.4% |
| Elementary School | 4,677 | 13.9% |
| Middle School | 4,400 | 13.1% |
| High School | 5,763 | 17.2% |
| College / Undergraduate | 13,293 | 39.6% |
| Graduate / Professional | 2,894 | 8.6% |
| Total | 33,554 | 100.0% |
School Enrollment by Age by Funding Source in Washington County
Out of a total of 33,554 students who are enrolled in schools in Washington County, 4,899 (14.6%) attend a private institution, while the remaining 28,655 (85.4%) are enrolled in public schools. The age group of 3 to 4 year olds has the highest likelihood of being enrolled in private schools, with 645 (55.6% in the age bracket) enrolled. Conversely, the age group of 18 to 19 year olds has the lowest likelihood of being enrolled in a private school, with 5,495 (94.1% in the age bracket) attending a public institution.
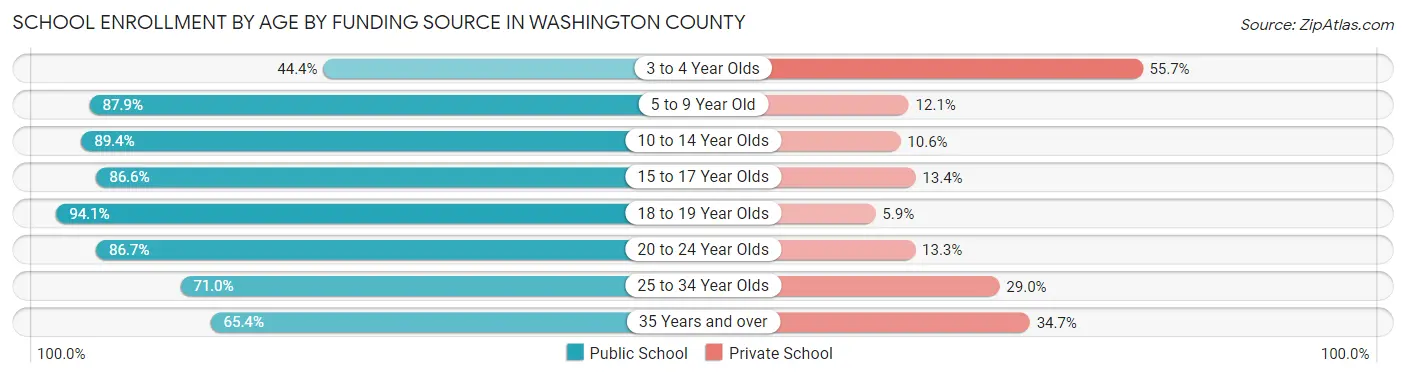
| Age Bracket | Public School | Private School |
| 3 to 4 Year Olds | 514 (44.4%) | 645 (55.6%) |
| 5 to 9 Year Old | 4,829 (87.9%) | 665 (12.1%) |
| 10 to 14 Year Olds | 5,092 (89.4%) | 602 (10.6%) |
| 15 to 17 Year Olds | 3,580 (86.6%) | 552 (13.4%) |
| 18 to 19 Year Olds | 5,495 (94.1%) | 345 (5.9%) |
| 20 to 24 Year Olds | 6,948 (86.7%) | 1,067 (13.3%) |
| 25 to 34 Year Olds | 1,243 (71.0%) | 508 (29.0%) |
| 35 Years and over | 960 (65.3%) | 509 (34.6%) |
| Total | 28,655 (85.4%) | 4,899 (14.6%) |
Educational Attainment by Field of Study in Washington County
Business (7,039 | 14.8%), education (5,973 | 12.6%), science & technology (4,878 | 10.2%), social sciences (4,269 | 9.0%), and engineering (3,688 | 7.7%) are the most common fields of study among 47,595 individuals in Washington County who have obtained a bachelor's degree or higher.
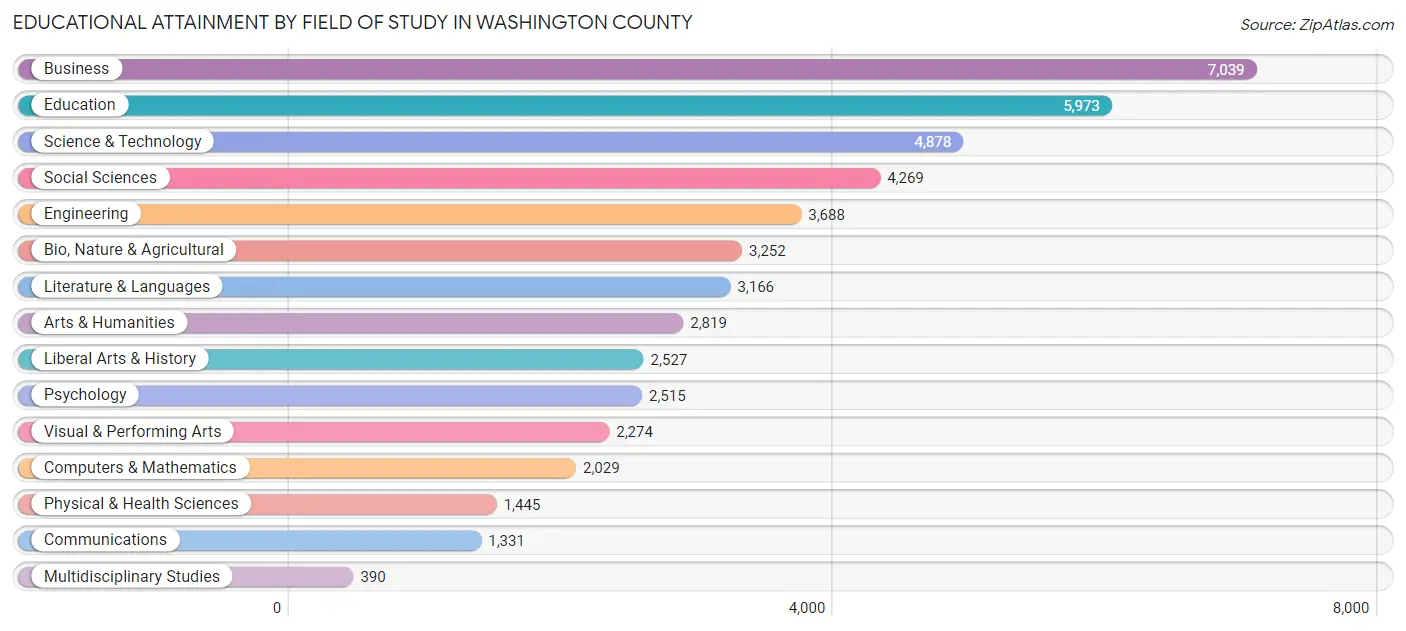
| Field of Study | # Graduates | % Graduates |
| Computers & Mathematics | 2,029 | 4.3% |
| Bio, Nature & Agricultural | 3,252 | 6.8% |
| Physical & Health Sciences | 1,445 | 3.0% |
| Psychology | 2,515 | 5.3% |
| Social Sciences | 4,269 | 9.0% |
| Engineering | 3,688 | 7.7% |
| Multidisciplinary Studies | 390 | 0.8% |
| Science & Technology | 4,878 | 10.2% |
| Business | 7,039 | 14.8% |
| Education | 5,973 | 12.6% |
| Literature & Languages | 3,166 | 6.7% |
| Liberal Arts & History | 2,527 | 5.3% |
| Visual & Performing Arts | 2,274 | 4.8% |
| Communications | 1,331 | 2.8% |
| Arts & Humanities | 2,819 | 5.9% |
| Total | 47,595 | 100.0% |
Transportation & Commute in Washington County
Vehicle Availability by Sex in Washington County
The most prevalent vehicle ownership categories in Washington County are males with 2 vehicles (14,447, accounting for 42.8%) and females with 2 vehicles (13,080, making up 47.8%).
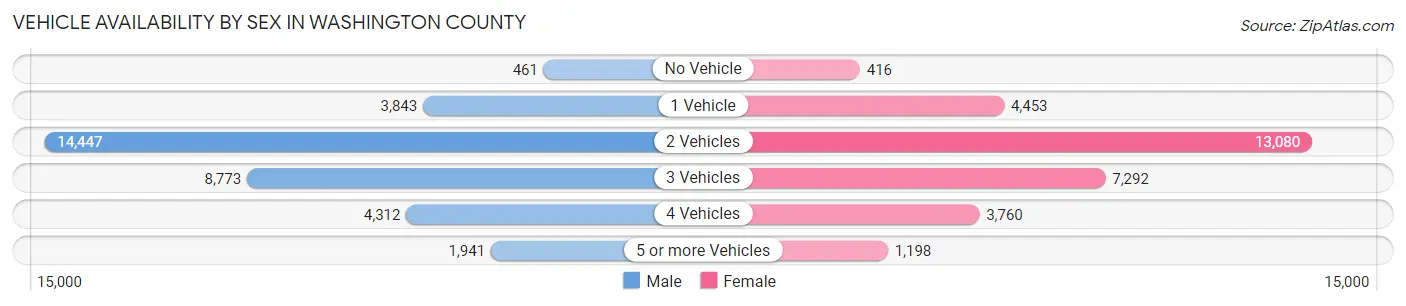
| Vehicles Available | Male | Female |
| No Vehicle | 461 (1.4%) | 416 (1.4%) |
| 1 Vehicle | 3,843 (11.4%) | 4,453 (14.7%) |
| 2 Vehicles | 14,447 (42.8%) | 13,080 (43.3%) |
| 3 Vehicles | 8,773 (26.0%) | 7,292 (24.1%) |
| 4 Vehicles | 4,312 (12.8%) | 3,760 (12.4%) |
| 5 or more Vehicles | 1,941 (5.8%) | 1,198 (4.0%) |
| Total | 33,777 (100.0%) | 30,199 (100.0%) |
Commute Time in Washington County
The most frequently occuring commute durations in Washington County are 20 to 24 minutes (8,830 commuters, 15.1%), 30 to 34 minutes (8,490 commuters, 14.6%), and 10 to 14 minutes (7,794 commuters, 13.4%).
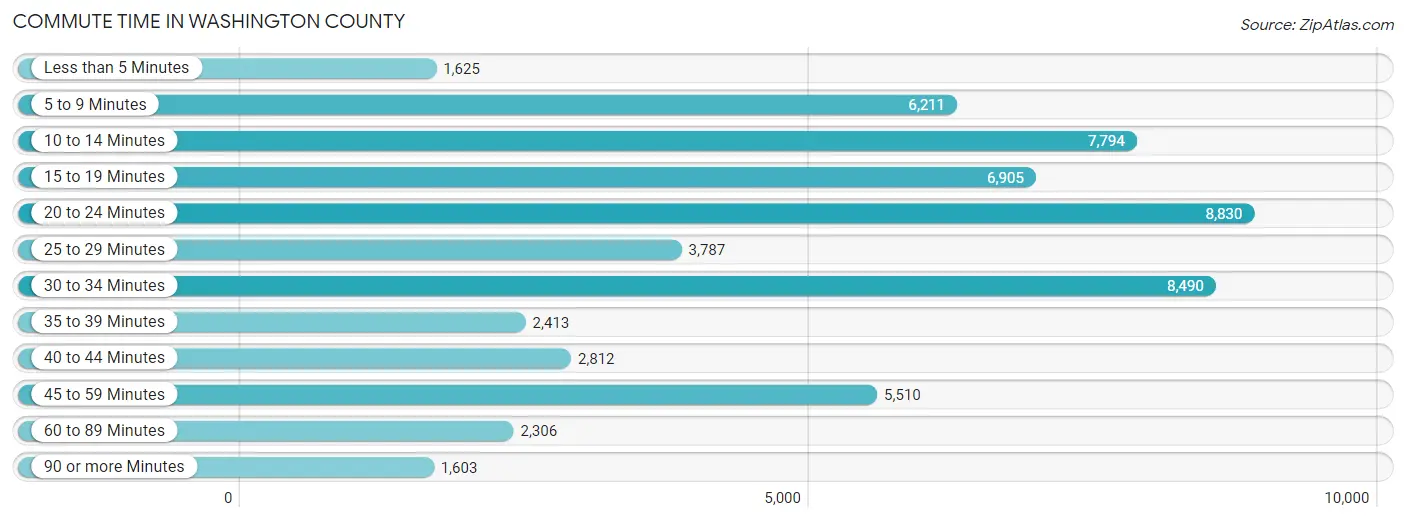
| Commute Time | # Commuters | % Commuters |
| Less than 5 Minutes | 1,625 | 2.8% |
| 5 to 9 Minutes | 6,211 | 10.7% |
| 10 to 14 Minutes | 7,794 | 13.4% |
| 15 to 19 Minutes | 6,905 | 11.8% |
| 20 to 24 Minutes | 8,830 | 15.1% |
| 25 to 29 Minutes | 3,787 | 6.5% |
| 30 to 34 Minutes | 8,490 | 14.6% |
| 35 to 39 Minutes | 2,413 | 4.1% |
| 40 to 44 Minutes | 2,812 | 4.8% |
| 45 to 59 Minutes | 5,510 | 9.5% |
| 60 to 89 Minutes | 2,306 | 4.0% |
| 90 or more Minutes | 1,603 | 2.8% |
Commute Time by Sex in Washington County
The most common commute times in Washington County are 20 to 24 minutes (4,623 commuters, 14.9%) for males and 10 to 14 minutes (4,213 commuters, 15.4%) for females.
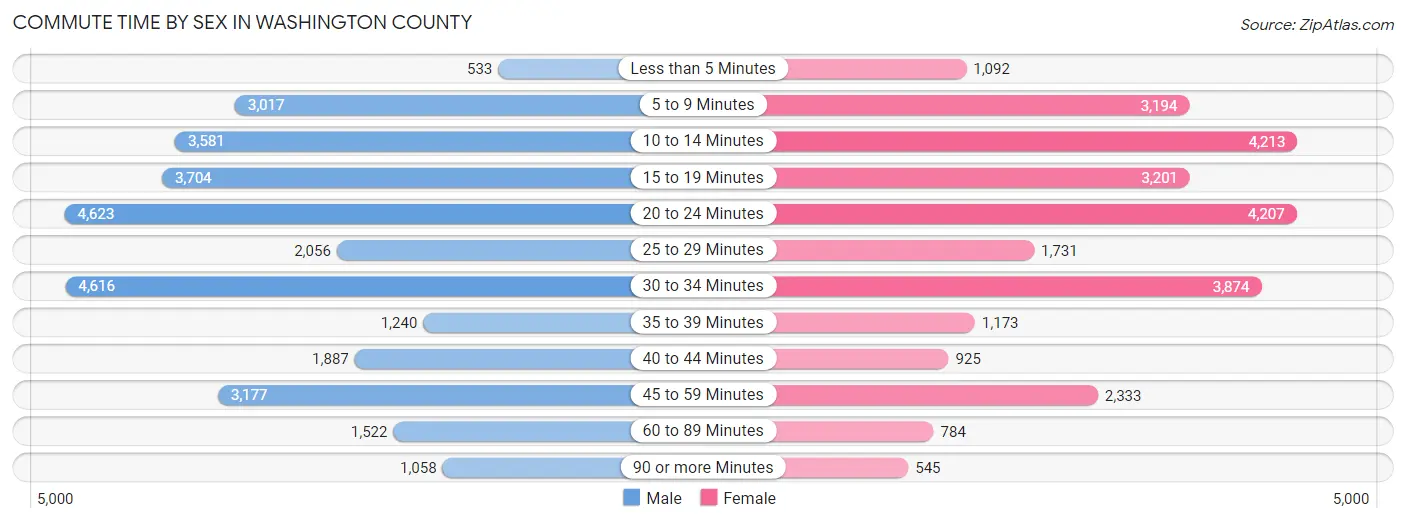
| Commute Time | Male | Female |
| Less than 5 Minutes | 533 (1.7%) | 1,092 (4.0%) |
| 5 to 9 Minutes | 3,017 (9.7%) | 3,194 (11.7%) |
| 10 to 14 Minutes | 3,581 (11.6%) | 4,213 (15.4%) |
| 15 to 19 Minutes | 3,704 (11.9%) | 3,201 (11.7%) |
| 20 to 24 Minutes | 4,623 (14.9%) | 4,207 (15.4%) |
| 25 to 29 Minutes | 2,056 (6.6%) | 1,731 (6.4%) |
| 30 to 34 Minutes | 4,616 (14.9%) | 3,874 (14.2%) |
| 35 to 39 Minutes | 1,240 (4.0%) | 1,173 (4.3%) |
| 40 to 44 Minutes | 1,887 (6.1%) | 925 (3.4%) |
| 45 to 59 Minutes | 3,177 (10.2%) | 2,333 (8.6%) |
| 60 to 89 Minutes | 1,522 (4.9%) | 784 (2.9%) |
| 90 or more Minutes | 1,058 (3.4%) | 545 (2.0%) |
Time of Departure to Work by Sex in Washington County
The most frequent times of departure to work in Washington County are 7:00 AM to 7:29 AM (5,370, 17.3%) for males and 8:00 AM to 8:29 AM (5,005, 18.3%) for females.
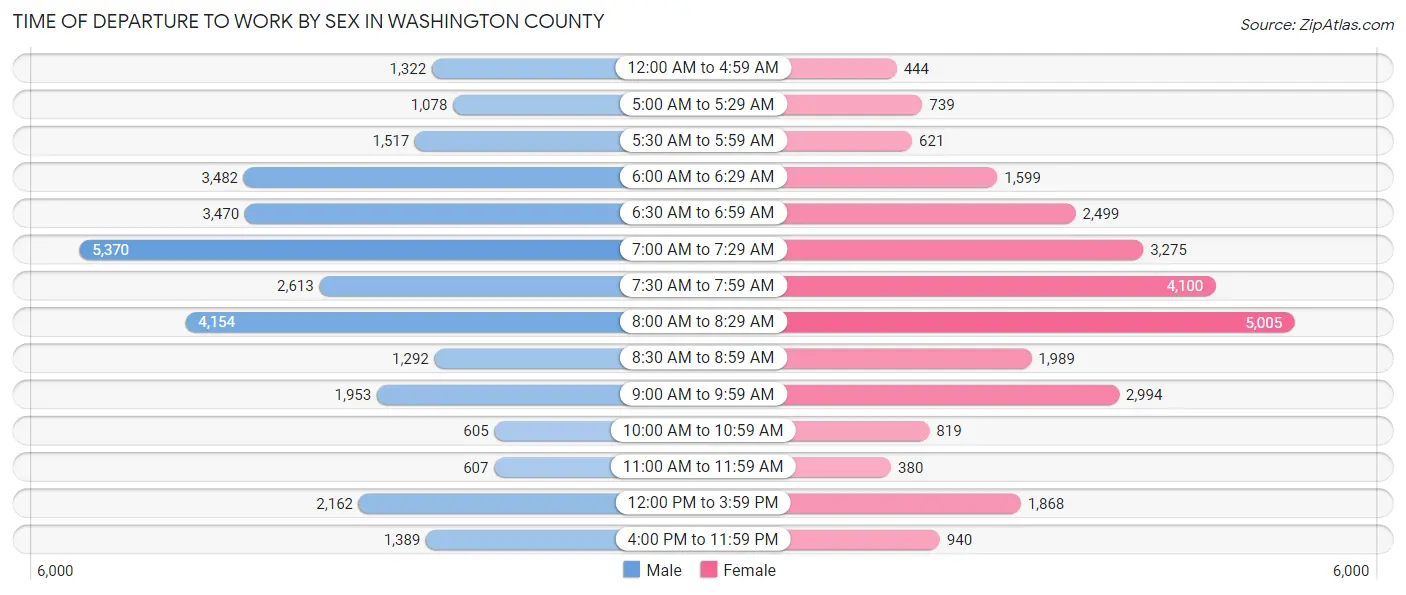
| Time of Departure | Male | Female |
| 12:00 AM to 4:59 AM | 1,322 (4.3%) | 444 (1.6%) |
| 5:00 AM to 5:29 AM | 1,078 (3.5%) | 739 (2.7%) |
| 5:30 AM to 5:59 AM | 1,517 (4.9%) | 621 (2.3%) |
| 6:00 AM to 6:29 AM | 3,482 (11.2%) | 1,599 (5.9%) |
| 6:30 AM to 6:59 AM | 3,470 (11.2%) | 2,499 (9.2%) |
| 7:00 AM to 7:29 AM | 5,370 (17.3%) | 3,275 (12.0%) |
| 7:30 AM to 7:59 AM | 2,613 (8.4%) | 4,100 (15.0%) |
| 8:00 AM to 8:29 AM | 4,154 (13.4%) | 5,005 (18.3%) |
| 8:30 AM to 8:59 AM | 1,292 (4.2%) | 1,989 (7.3%) |
| 9:00 AM to 9:59 AM | 1,953 (6.3%) | 2,994 (11.0%) |
| 10:00 AM to 10:59 AM | 605 (1.9%) | 819 (3.0%) |
| 11:00 AM to 11:59 AM | 607 (2.0%) | 380 (1.4%) |
| 12:00 PM to 3:59 PM | 2,162 (7.0%) | 1,868 (6.9%) |
| 4:00 PM to 11:59 PM | 1,389 (4.5%) | 940 (3.5%) |
| Total | 31,014 (100.0%) | 27,272 (100.0%) |
Housing Occupancy in Washington County
Occupancy by Ownership in Washington County
Of the total 51,426 dwellings in Washington County, owner-occupied units account for 39,487 (76.8%), while renter-occupied units make up 11,939 (23.2%).
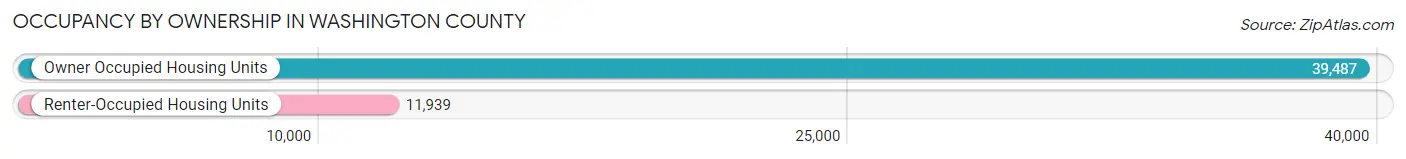
| Occupancy | # Housing Units | % Housing Units |
| Owner Occupied Housing Units | 39,487 | 76.8% |
| Renter-Occupied Housing Units | 11,939 | 23.2% |
| Total Occupied Housing Units | 51,426 | 100.0% |
Occupancy by Household Size in Washington County
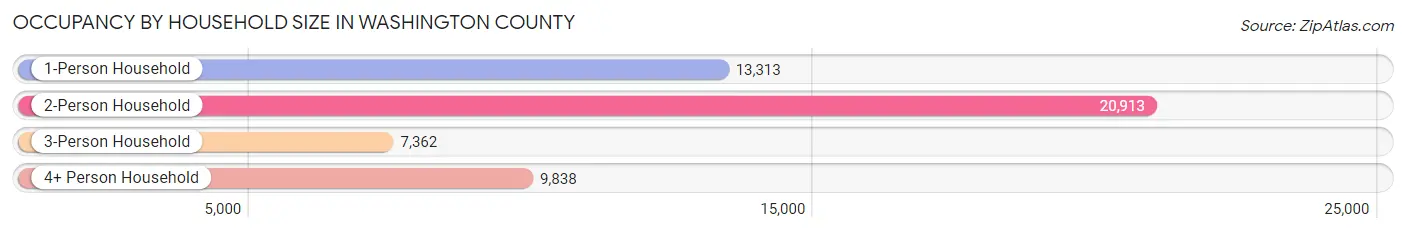
| Household Size | # Housing Units | % Housing Units |
| 1-Person Household | 13,313 | 25.9% |
| 2-Person Household | 20,913 | 40.7% |
| 3-Person Household | 7,362 | 14.3% |
| 4+ Person Household | 9,838 | 19.1% |
| Total Housing Units | 51,426 | 100.0% |
Occupancy by Ownership by Household Size in Washington County
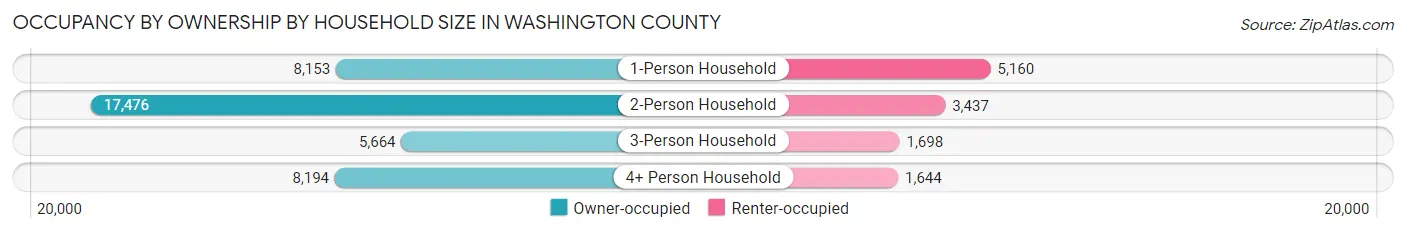
| Household Size | Owner-occupied | Renter-occupied |
| 1-Person Household | 8,153 (61.2%) | 5,160 (38.8%) |
| 2-Person Household | 17,476 (83.6%) | 3,437 (16.4%) |
| 3-Person Household | 5,664 (76.9%) | 1,698 (23.1%) |
| 4+ Person Household | 8,194 (83.3%) | 1,644 (16.7%) |
| Total Housing Units | 39,487 (76.8%) | 11,939 (23.2%) |
Occupancy by Educational Attainment in Washington County
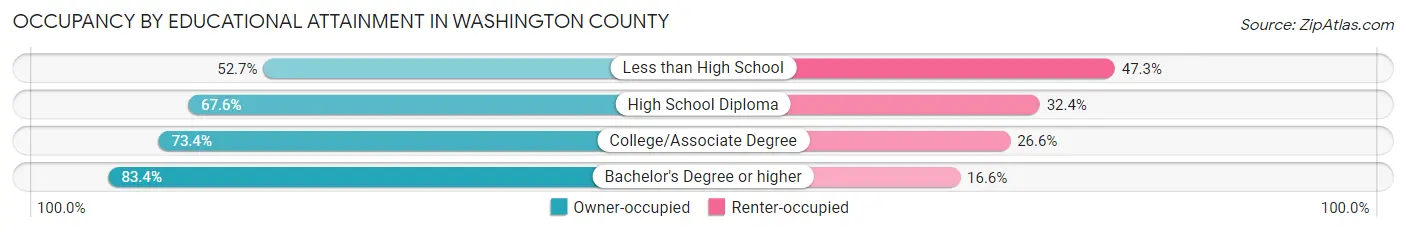
| Household Size | Owner-occupied | Renter-occupied |
| Less than High School | 983 (52.7%) | 883 (47.3%) |
| High School Diploma | 6,292 (67.6%) | 3,018 (32.4%) |
| College/Associate Degree | 9,918 (73.4%) | 3,589 (26.6%) |
| Bachelor's Degree or higher | 22,294 (83.4%) | 4,449 (16.6%) |
Occupancy by Age of Householder in Washington County
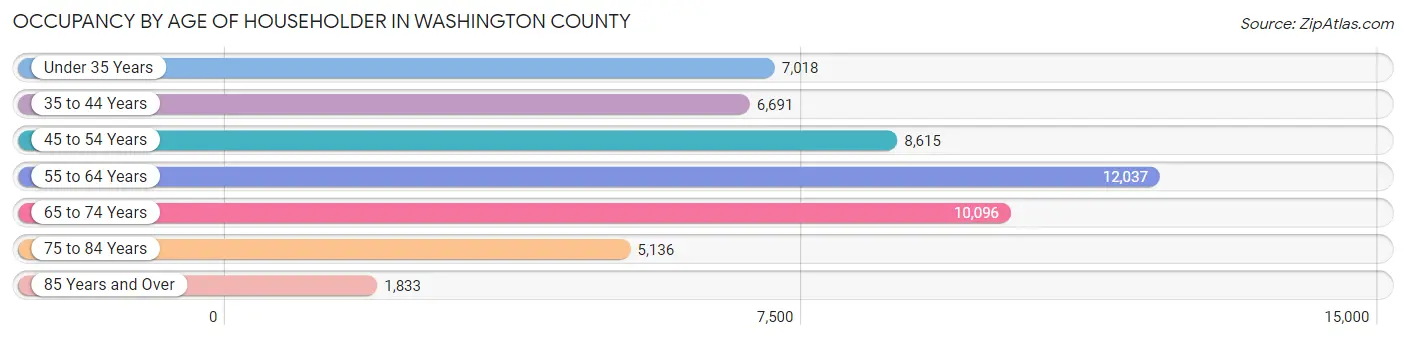
| Age Bracket | # Households | % Households |
| Under 35 Years | 7,018 | 13.7% |
| 35 to 44 Years | 6,691 | 13.0% |
| 45 to 54 Years | 8,615 | 16.8% |
| 55 to 64 Years | 12,037 | 23.4% |
| 65 to 74 Years | 10,096 | 19.6% |
| 75 to 84 Years | 5,136 | 10.0% |
| 85 Years and Over | 1,833 | 3.6% |
| Total | 51,426 | 100.0% |
Housing Finances in Washington County
Median Income by Occupancy in Washington County
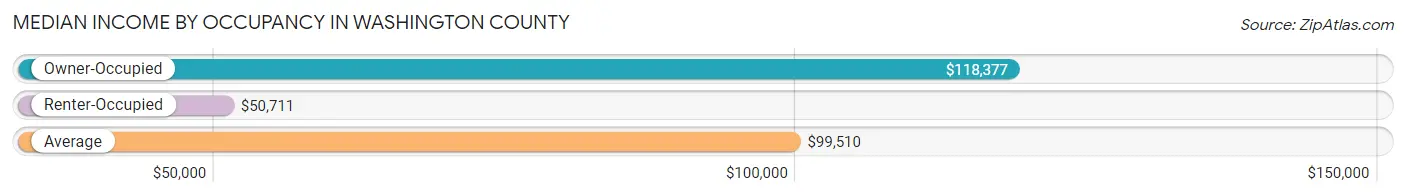
| Occupancy Type | # Households | Median Income |
| Owner-Occupied | 39,487 (76.8%) | $118,377 |
| Renter-Occupied | 11,939 (23.2%) | $50,711 |
| Average | 51,426 (100.0%) | $99,510 |
Occupancy by Householder Income Bracket in Washington County
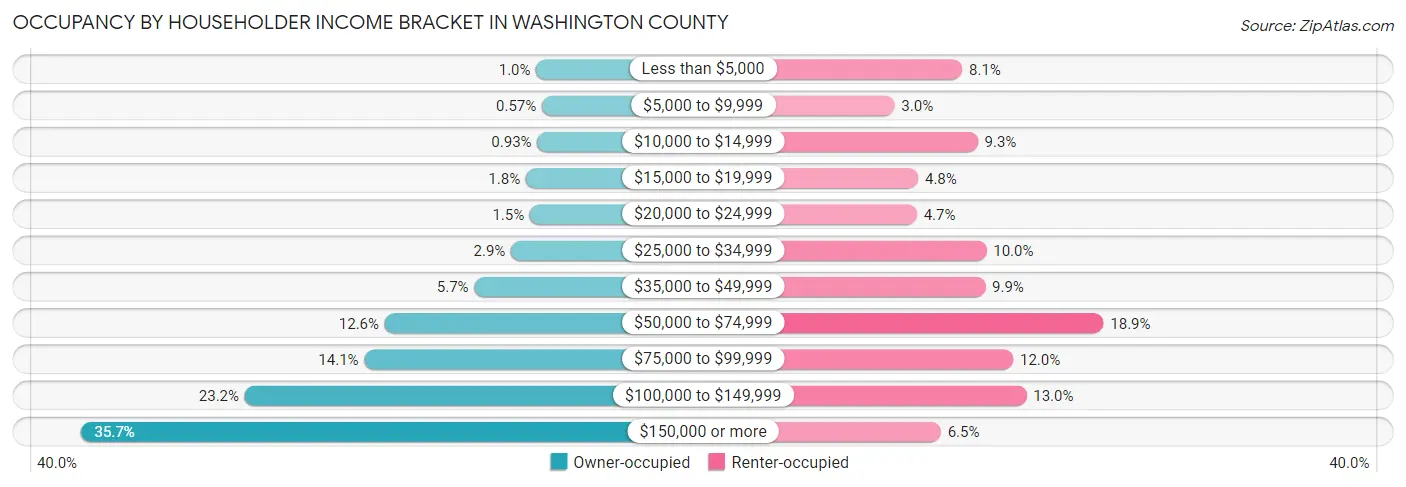
| Income Bracket | Owner-occupied | Renter-occupied |
| Less than $5,000 | 398 (1.0%) | 970 (8.1%) |
| $5,000 to $9,999 | 225 (0.6%) | 353 (3.0%) |
| $10,000 to $14,999 | 368 (0.9%) | 1,110 (9.3%) |
| $15,000 to $19,999 | 709 (1.8%) | 568 (4.8%) |
| $20,000 to $24,999 | 587 (1.5%) | 556 (4.7%) |
| $25,000 to $34,999 | 1,156 (2.9%) | 1,189 (10.0%) |
| $35,000 to $49,999 | 2,264 (5.7%) | 1,178 (9.9%) |
| $50,000 to $74,999 | 4,954 (12.6%) | 2,254 (18.9%) |
| $75,000 to $99,999 | 5,573 (14.1%) | 1,433 (12.0%) |
| $100,000 to $149,999 | 9,169 (23.2%) | 1,553 (13.0%) |
| $150,000 or more | 14,084 (35.7%) | 775 (6.5%) |
| Total | 39,487 (100.0%) | 11,939 (100.0%) |
Monthly Housing Cost Tiers in Washington County
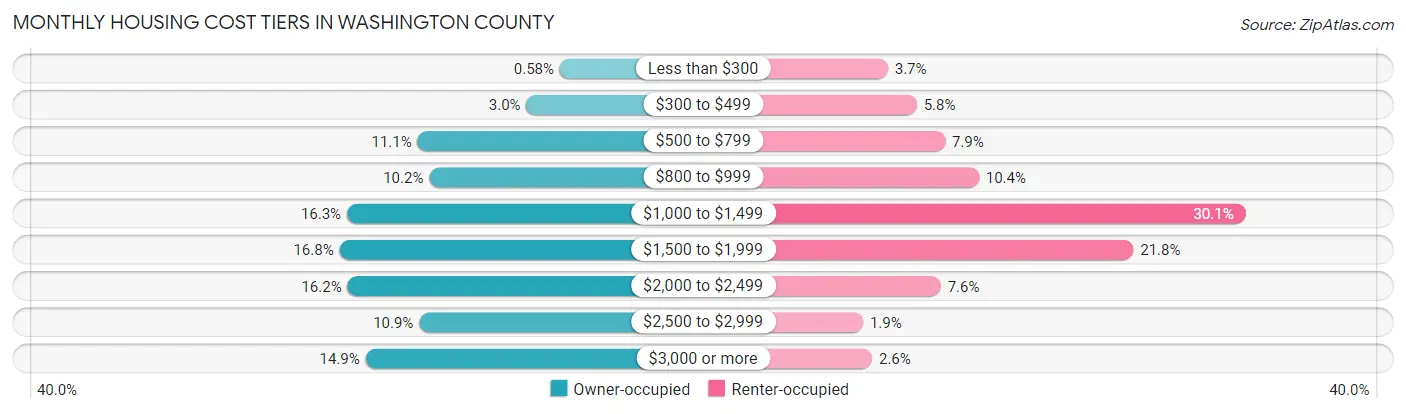
| Monthly Cost | Owner-occupied | Renter-occupied |
| Less than $300 | 230 (0.6%) | 443 (3.7%) |
| $300 to $499 | 1,200 (3.0%) | 697 (5.8%) |
| $500 to $799 | 4,366 (11.1%) | 945 (7.9%) |
| $800 to $999 | 4,028 (10.2%) | 1,243 (10.4%) |
| $1,000 to $1,499 | 6,420 (16.3%) | 3,588 (30.0%) |
| $1,500 to $1,999 | 6,639 (16.8%) | 2,601 (21.8%) |
| $2,000 to $2,499 | 6,404 (16.2%) | 909 (7.6%) |
| $2,500 to $2,999 | 4,319 (10.9%) | 225 (1.9%) |
| $3,000 or more | 5,881 (14.9%) | 304 (2.5%) |
| Total | 39,487 (100.0%) | 11,939 (100.0%) |
Physical Housing Characteristics in Washington County
Housing Structures in Washington County
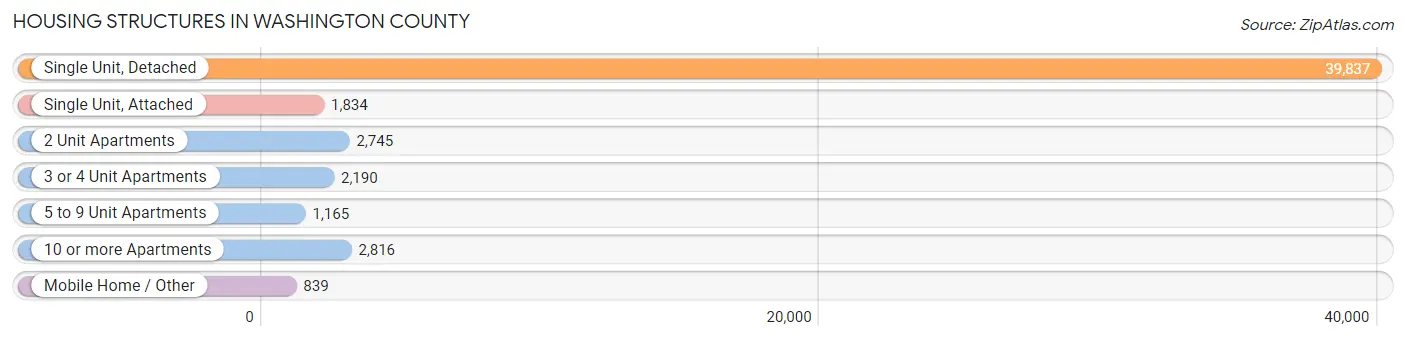
| Structure Type | # Housing Units | % Housing Units |
| Single Unit, Detached | 39,837 | 77.5% |
| Single Unit, Attached | 1,834 | 3.6% |
| 2 Unit Apartments | 2,745 | 5.3% |
| 3 or 4 Unit Apartments | 2,190 | 4.3% |
| 5 to 9 Unit Apartments | 1,165 | 2.3% |
| 10 or more Apartments | 2,816 | 5.5% |
| Mobile Home / Other | 839 | 1.6% |
| Total | 51,426 | 100.0% |
Housing Structures by Occupancy in Washington County
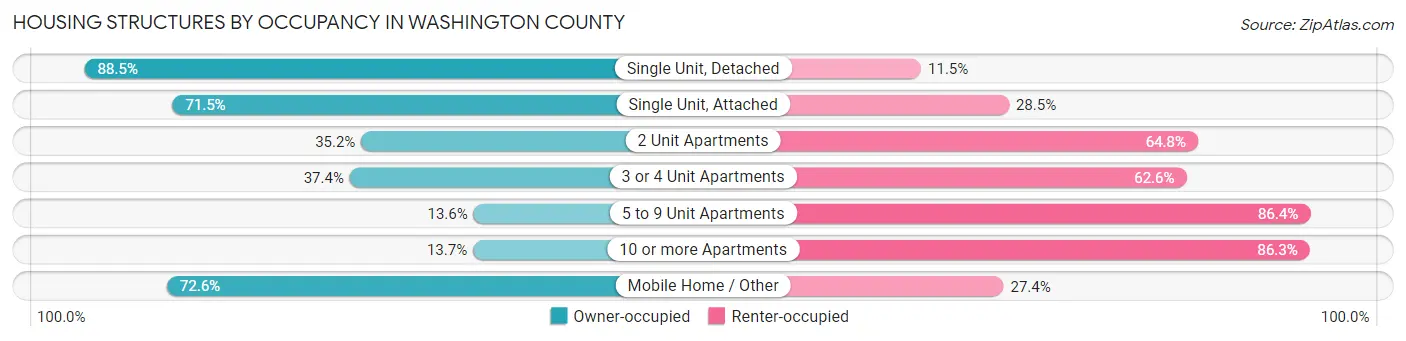
| Structure Type | Owner-occupied | Renter-occupied |
| Single Unit, Detached | 35,238 (88.5%) | 4,599 (11.5%) |
| Single Unit, Attached | 1,312 (71.5%) | 522 (28.5%) |
| 2 Unit Apartments | 966 (35.2%) | 1,779 (64.8%) |
| 3 or 4 Unit Apartments | 819 (37.4%) | 1,371 (62.6%) |
| 5 to 9 Unit Apartments | 158 (13.6%) | 1,007 (86.4%) |
| 10 or more Apartments | 385 (13.7%) | 2,431 (86.3%) |
| Mobile Home / Other | 609 (72.6%) | 230 (27.4%) |
| Total | 39,487 (76.8%) | 11,939 (23.2%) |
Housing Structures by Number of Rooms in Washington County
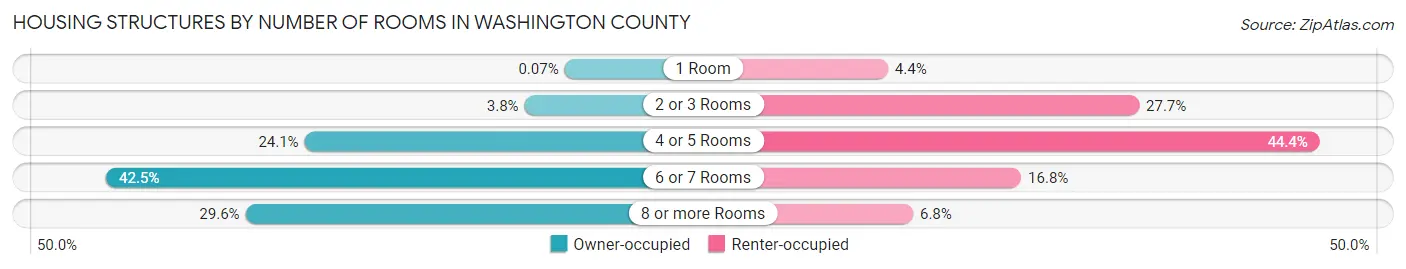
| Number of Rooms | Owner-occupied | Renter-occupied |
| 1 Room | 28 (0.1%) | 530 (4.4%) |
| 2 or 3 Rooms | 1,488 (3.8%) | 3,304 (27.7%) |
| 4 or 5 Rooms | 9,523 (24.1%) | 5,297 (44.4%) |
| 6 or 7 Rooms | 16,768 (42.5%) | 2,001 (16.8%) |
| 8 or more Rooms | 11,680 (29.6%) | 807 (6.8%) |
| Total | 39,487 (100.0%) | 11,939 (100.0%) |
Housing Structure by Heating Type in Washington County
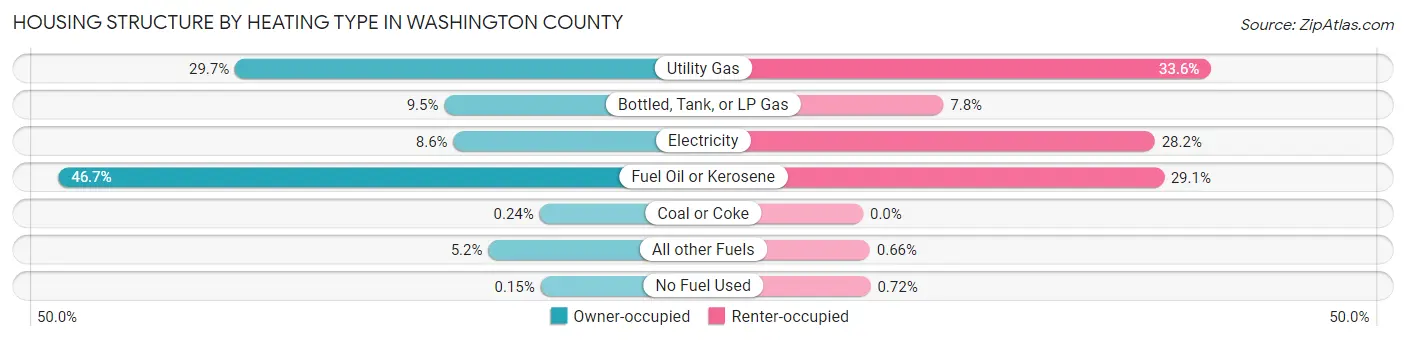
| Heating Type | Owner-occupied | Renter-occupied |
| Utility Gas | 11,714 (29.7%) | 4,015 (33.6%) |
| Bottled, Tank, or LP Gas | 3,731 (9.5%) | 927 (7.8%) |
| Electricity | 3,384 (8.6%) | 3,364 (28.2%) |
| Fuel Oil or Kerosene | 18,455 (46.7%) | 3,468 (29.0%) |
| Coal or Coke | 93 (0.2%) | 0 (0.0%) |
| All other Fuels | 2,052 (5.2%) | 79 (0.7%) |
| No Fuel Used | 58 (0.2%) | 86 (0.7%) |
| Total | 39,487 (100.0%) | 11,939 (100.0%) |
Household Vehicle Usage in Washington County
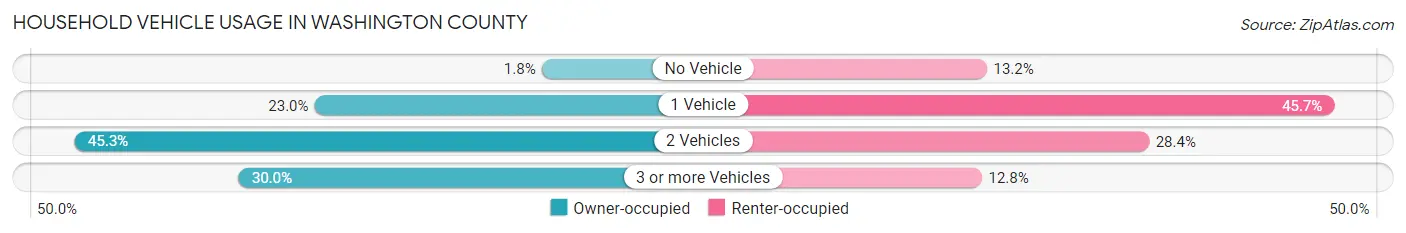
| Vehicles per Household | Owner-occupied | Renter-occupied |
| No Vehicle | 690 (1.8%) | 1,578 (13.2%) |
| 1 Vehicle | 9,063 (23.0%) | 5,453 (45.7%) |
| 2 Vehicles | 17,886 (45.3%) | 3,386 (28.4%) |
| 3 or more Vehicles | 11,848 (30.0%) | 1,522 (12.8%) |
| Total | 39,487 (100.0%) | 11,939 (100.0%) |
Real Estate & Mortgages in Washington County
Real Estate and Mortgage Overview in Washington County
| Characteristic | Without Mortgage | With Mortgage |
| Housing Units | 13,377 | 26,110 |
| Median Property Value | $454,600 | $428,700 |
| Median Household Income | $97,272 | $10,472 |
| Monthly Housing Costs | $875 | $5,794 |
| Real Estate Taxes | $4,958 | $134 |
Property Value by Mortgage Status in Washington County
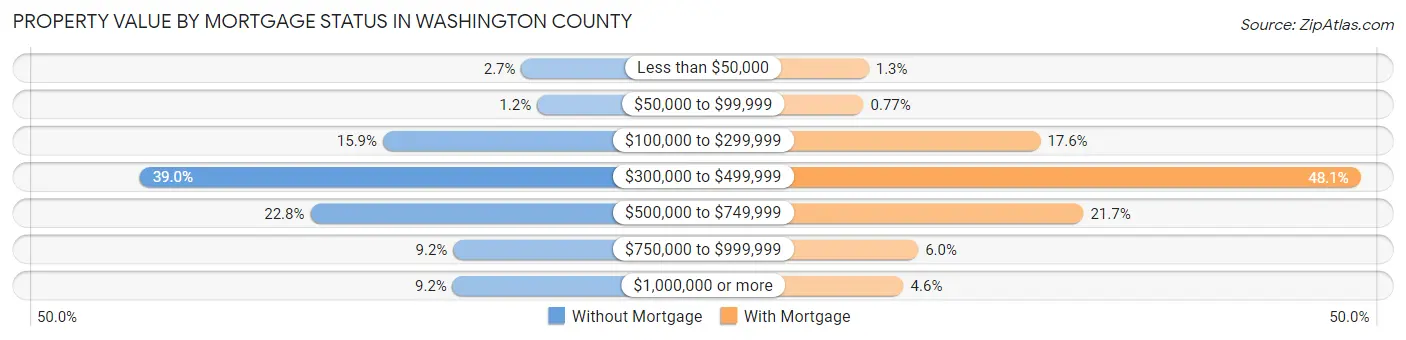
| Property Value | Without Mortgage | With Mortgage |
| Less than $50,000 | 360 (2.7%) | 328 (1.3%) |
| $50,000 to $99,999 | 160 (1.2%) | 201 (0.8%) |
| $100,000 to $299,999 | 2,124 (15.9%) | 4,597 (17.6%) |
| $300,000 to $499,999 | 5,221 (39.0%) | 12,560 (48.1%) |
| $500,000 to $749,999 | 3,049 (22.8%) | 5,668 (21.7%) |
| $750,000 to $999,999 | 1,228 (9.2%) | 1,560 (6.0%) |
| $1,000,000 or more | 1,235 (9.2%) | 1,196 (4.6%) |
| Total | 13,377 (100.0%) | 26,110 (100.0%) |
Household Income by Mortgage Status in Washington County
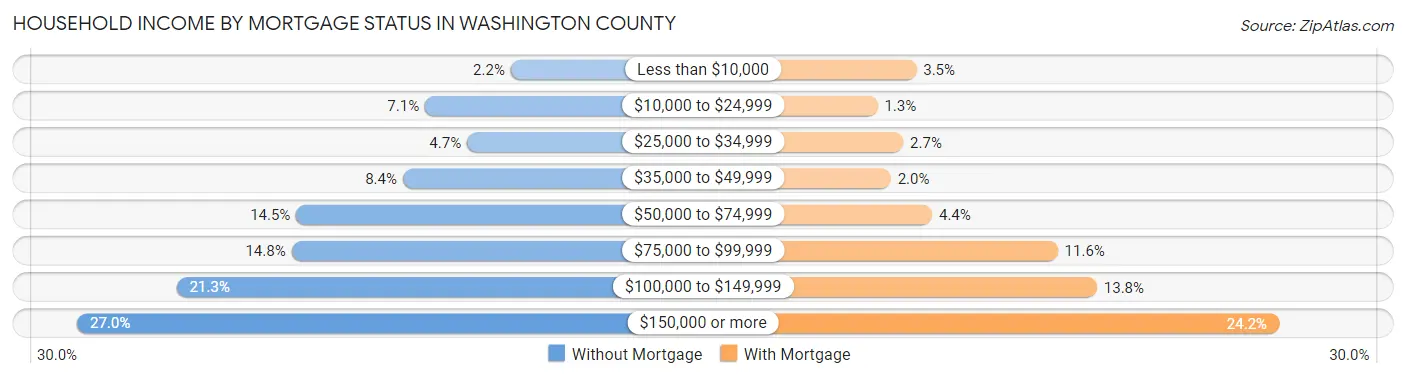
| Household Income | Without Mortgage | With Mortgage |
| Less than $10,000 | 297 (2.2%) | 906 (3.5%) |
| $10,000 to $24,999 | 953 (7.1%) | 326 (1.3%) |
| $25,000 to $34,999 | 631 (4.7%) | 711 (2.7%) |
| $35,000 to $49,999 | 1,122 (8.4%) | 525 (2.0%) |
| $50,000 to $74,999 | 1,937 (14.5%) | 1,142 (4.4%) |
| $75,000 to $99,999 | 1,973 (14.7%) | 3,017 (11.6%) |
| $100,000 to $149,999 | 2,852 (21.3%) | 3,600 (13.8%) |
| $150,000 or more | 3,612 (27.0%) | 6,317 (24.2%) |
| Total | 13,377 (100.0%) | 26,110 (100.0%) |
Property Value to Household Income Ratio in Washington County
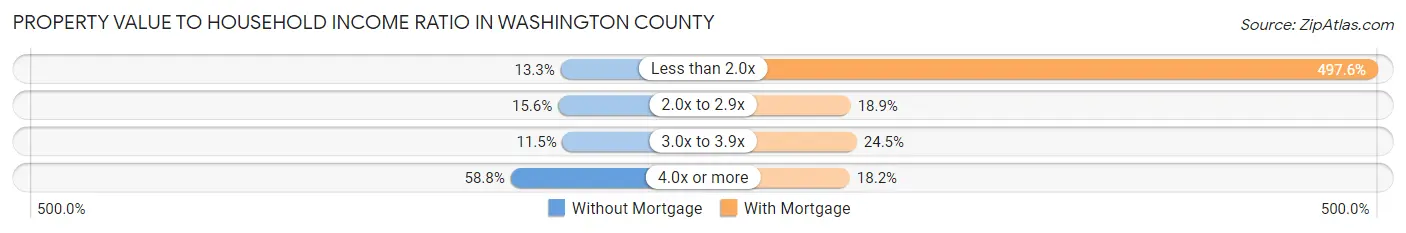
| Value-to-Income Ratio | Without Mortgage | With Mortgage |
| Less than 2.0x | 1,785 (13.3%) | 129,915 (497.6%) |
| 2.0x to 2.9x | 2,092 (15.6%) | 4,928 (18.9%) |
| 3.0x to 3.9x | 1,538 (11.5%) | 6,383 (24.4%) |
| 4.0x or more | 7,861 (58.8%) | 4,740 (18.1%) |
| Total | 13,377 (100.0%) | 26,110 (100.0%) |
Real Estate Taxes by Mortgage Status in Washington County
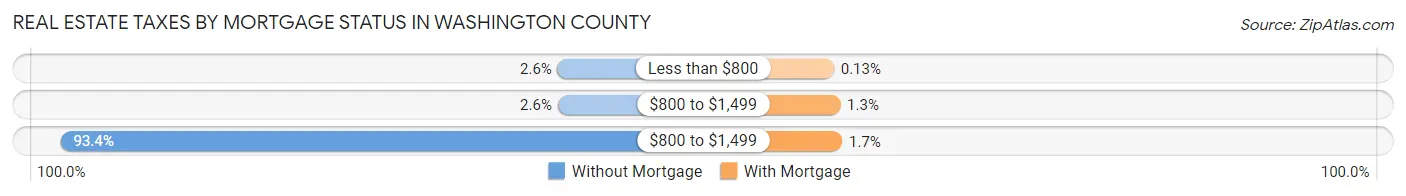
| Property Taxes | Without Mortgage | With Mortgage |
| Less than $800 | 352 (2.6%) | 35 (0.1%) |
| $800 to $1,499 | 350 (2.6%) | 340 (1.3%) |
| $800 to $1,499 | 12,499 (93.4%) | 432 (1.7%) |
| Total | 13,377 (100.0%) | 26,110 (100.0%) |
Health & Disability in Washington County
Health Insurance Coverage by Age in Washington County
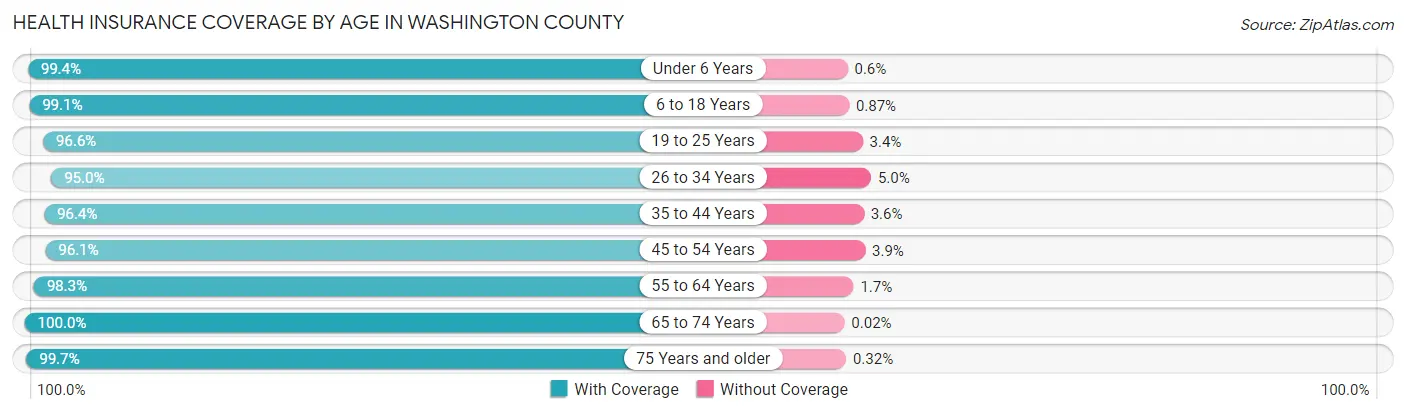
| Age Bracket | With Coverage | Without Coverage |
| Under 6 Years | 5,623 (99.4%) | 34 (0.6%) |
| 6 to 18 Years | 18,024 (99.1%) | 158 (0.9%) |
| 19 to 25 Years | 16,339 (96.6%) | 578 (3.4%) |
| 26 to 34 Years | 10,674 (95.0%) | 558 (5.0%) |
| 35 to 44 Years | 11,971 (96.4%) | 449 (3.6%) |
| 45 to 54 Years | 14,940 (96.1%) | 603 (3.9%) |
| 55 to 64 Years | 20,448 (98.3%) | 356 (1.7%) |
| 65 to 74 Years | 16,841 (100.0%) | 4 (0.0%) |
| 75 Years and older | 10,960 (99.7%) | 35 (0.3%) |
| Total | 125,820 (97.8%) | 2,775 (2.2%) |
Health Insurance Coverage by Citizenship Status in Washington County
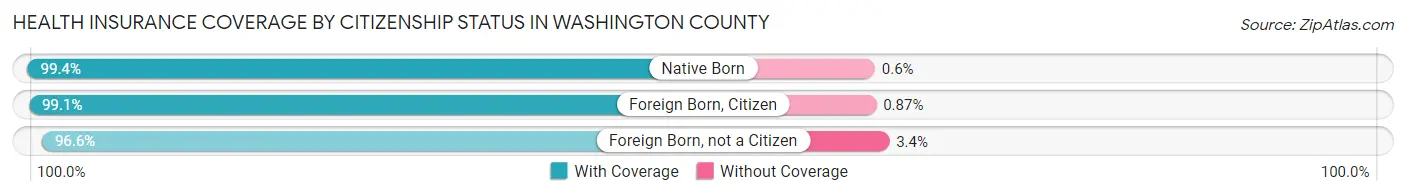
| Citizenship Status | With Coverage | Without Coverage |
| Native Born | 5,623 (99.4%) | 34 (0.6%) |
| Foreign Born, Citizen | 18,024 (99.1%) | 158 (0.9%) |
| Foreign Born, not a Citizen | 16,339 (96.6%) | 578 (3.4%) |
Health Insurance Coverage by Household Income in Washington County
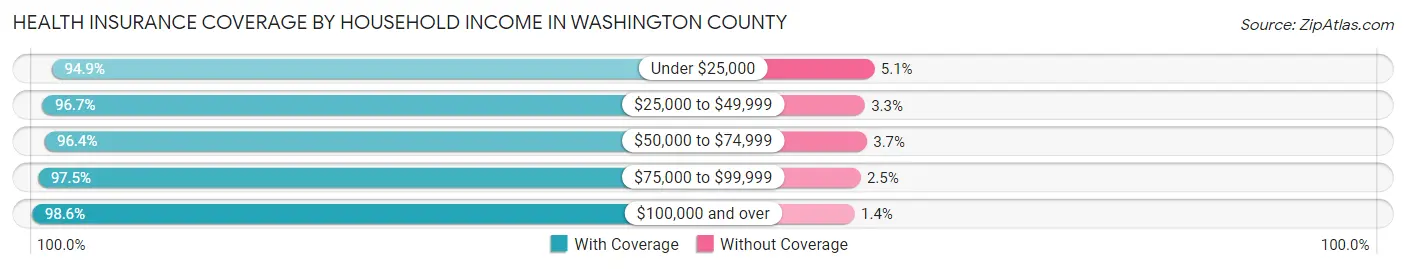
| Household Income | With Coverage | Without Coverage |
| Under $25,000 | 8,344 (94.9%) | 446 (5.1%) |
| $25,000 to $49,999 | 10,099 (96.7%) | 341 (3.3%) |
| $50,000 to $74,999 | 13,885 (96.4%) | 526 (3.6%) |
| $75,000 to $99,999 | 16,303 (97.5%) | 411 (2.5%) |
| $100,000 and over | 71,089 (98.6%) | 988 (1.4%) |
Public vs Private Health Insurance Coverage by Age in Washington County
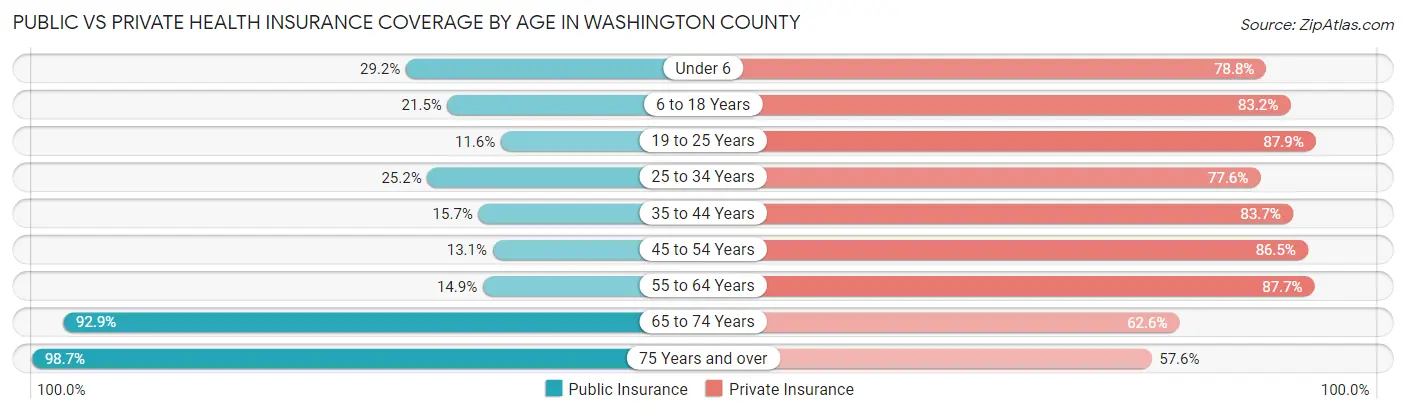
| Age Bracket | Public Insurance | Private Insurance |
| Under 6 | 1,651 (29.2%) | 4,456 (78.8%) |
| 6 to 18 Years | 3,903 (21.5%) | 15,126 (83.2%) |
| 19 to 25 Years | 1,956 (11.6%) | 14,875 (87.9%) |
| 25 to 34 Years | 2,833 (25.2%) | 8,720 (77.6%) |
| 35 to 44 Years | 1,952 (15.7%) | 10,393 (83.7%) |
| 45 to 54 Years | 2,034 (13.1%) | 13,440 (86.5%) |
| 55 to 64 Years | 3,103 (14.9%) | 18,249 (87.7%) |
| 65 to 74 Years | 15,645 (92.9%) | 10,550 (62.6%) |
| 75 Years and over | 10,850 (98.7%) | 6,336 (57.6%) |
| Total | 43,927 (34.2%) | 102,145 (79.4%) |
Disability Status by Sex by Age in Washington County
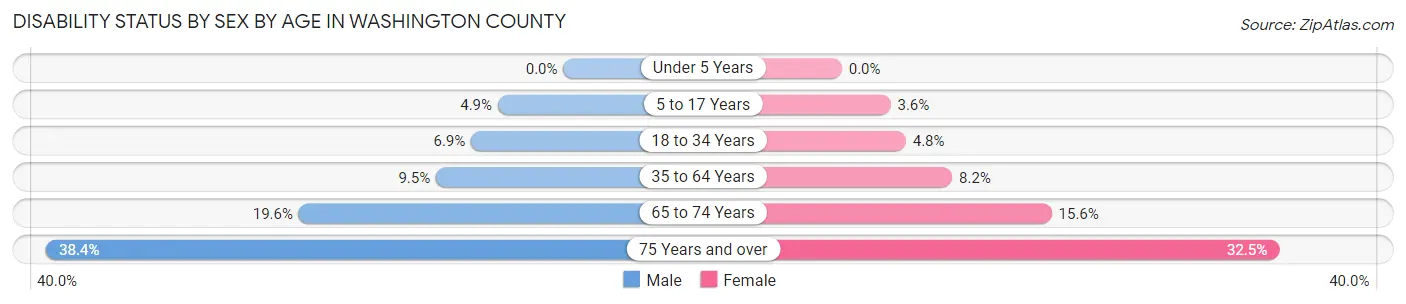
| Age Bracket | Male | Female |
| Under 5 Years | 0 (0.0%) | 0 (0.0%) |
| 5 to 17 Years | 394 (4.9%) | 283 (3.6%) |
| 18 to 34 Years | 1,067 (6.9%) | 756 (4.8%) |
| 35 to 64 Years | 2,257 (9.5%) | 2,038 (8.2%) |
| 65 to 74 Years | 1,610 (19.6%) | 1,347 (15.6%) |
| 75 Years and over | 1,751 (38.4%) | 2,089 (32.5%) |
Disability Class by Sex by Age in Washington County
Disability Class: Hearing Difficulty
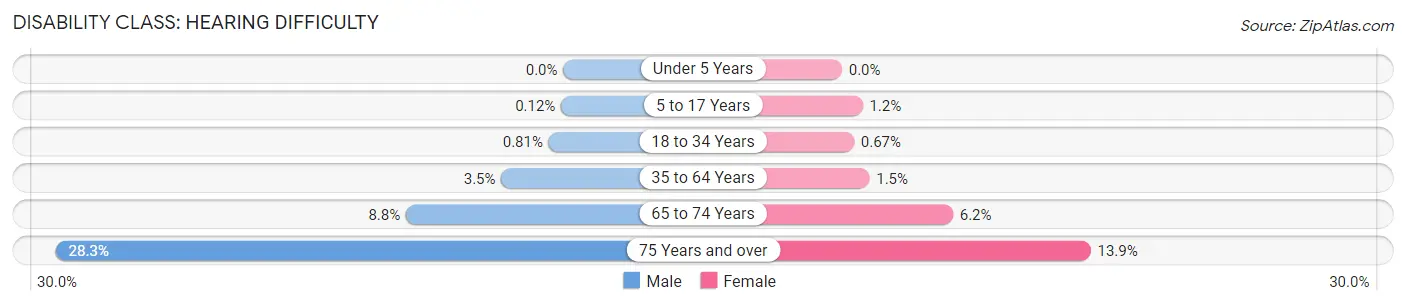
| Age Bracket | Male | Female |
| Under 5 Years | 0 (0.0%) | 0 (0.0%) |
| 5 to 17 Years | 10 (0.1%) | 90 (1.1%) |
| 18 to 34 Years | 126 (0.8%) | 106 (0.7%) |
| 35 to 64 Years | 823 (3.5%) | 381 (1.5%) |
| 65 to 74 Years | 718 (8.8%) | 534 (6.2%) |
| 75 Years and over | 1,289 (28.3%) | 891 (13.9%) |
Disability Class: Vision Difficulty
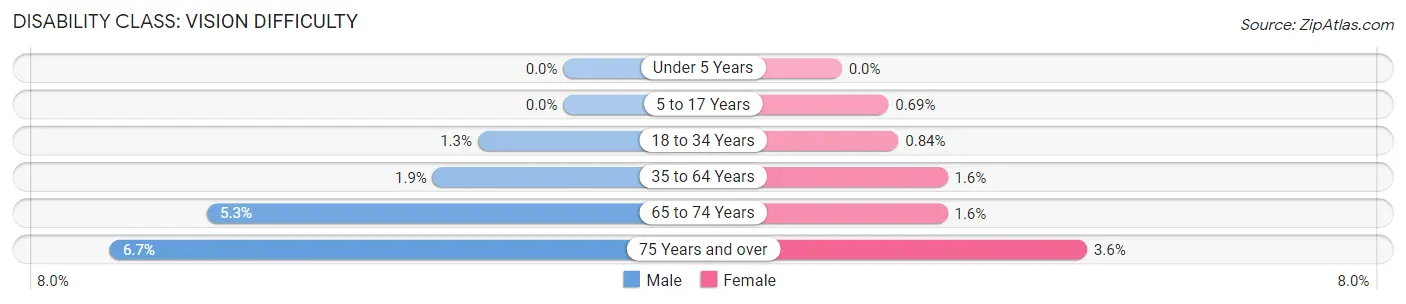
| Age Bracket | Male | Female |
| Under 5 Years | 0 (0.0%) | 0 (0.0%) |
| 5 to 17 Years | 0 (0.0%) | 54 (0.7%) |
| 18 to 34 Years | 197 (1.3%) | 134 (0.8%) |
| 35 to 64 Years | 464 (1.9%) | 391 (1.6%) |
| 65 to 74 Years | 434 (5.3%) | 136 (1.6%) |
| 75 Years and over | 307 (6.7%) | 234 (3.6%) |
Disability Class: Cognitive Difficulty
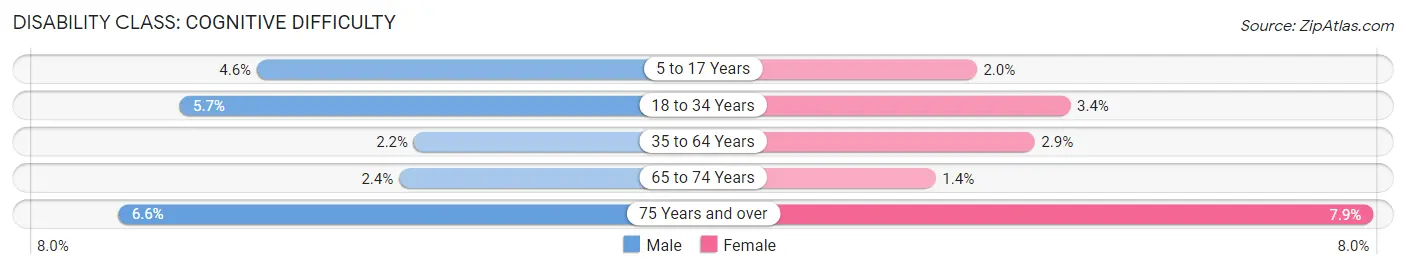
| Age Bracket | Male | Female |
| 5 to 17 Years | 369 (4.5%) | 156 (2.0%) |
| 18 to 34 Years | 885 (5.7%) | 540 (3.4%) |
| 35 to 64 Years | 530 (2.2%) | 713 (2.9%) |
| 65 to 74 Years | 200 (2.4%) | 120 (1.4%) |
| 75 Years and over | 301 (6.6%) | 508 (7.9%) |
Disability Class: Ambulatory Difficulty
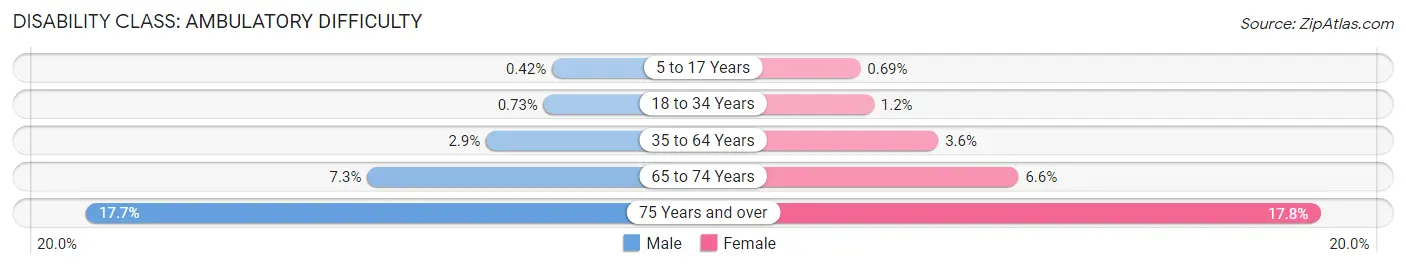
| Age Bracket | Male | Female |
| 5 to 17 Years | 34 (0.4%) | 54 (0.7%) |
| 18 to 34 Years | 113 (0.7%) | 190 (1.2%) |
| 35 to 64 Years | 686 (2.9%) | 890 (3.6%) |
| 65 to 74 Years | 597 (7.3%) | 567 (6.6%) |
| 75 Years and over | 808 (17.7%) | 1,142 (17.7%) |
Disability Class: Self-Care Difficulty
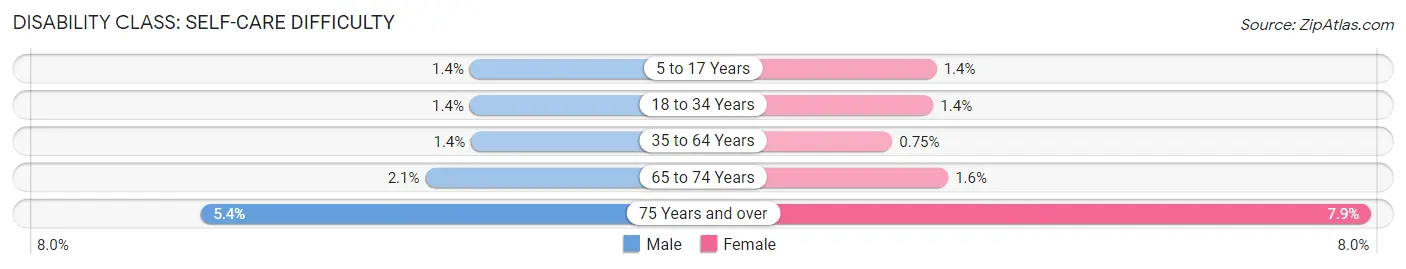
| Age Bracket | Male | Female |
| 5 to 17 Years | 113 (1.4%) | 110 (1.4%) |
| 18 to 34 Years | 217 (1.4%) | 217 (1.4%) |
| 35 to 64 Years | 328 (1.4%) | 186 (0.7%) |
| 65 to 74 Years | 168 (2.1%) | 137 (1.6%) |
| 75 Years and over | 246 (5.4%) | 506 (7.9%) |
Technology Access in Washington County
Computing Device Access in Washington County
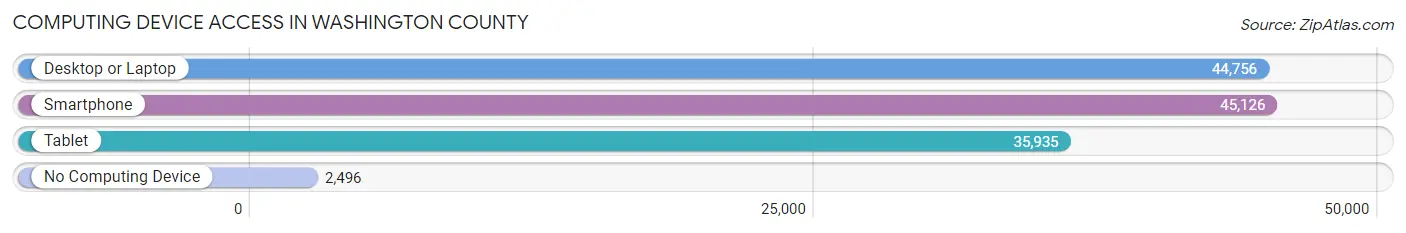
| Device Type | # Households | % Households |
| Desktop or Laptop | 44,756 | 87.0% |
| Smartphone | 45,126 | 87.7% |
| Tablet | 35,935 | 69.9% |
| No Computing Device | 2,496 | 4.9% |
| Total | 51,426 | 100.0% |
Internet Access in Washington County
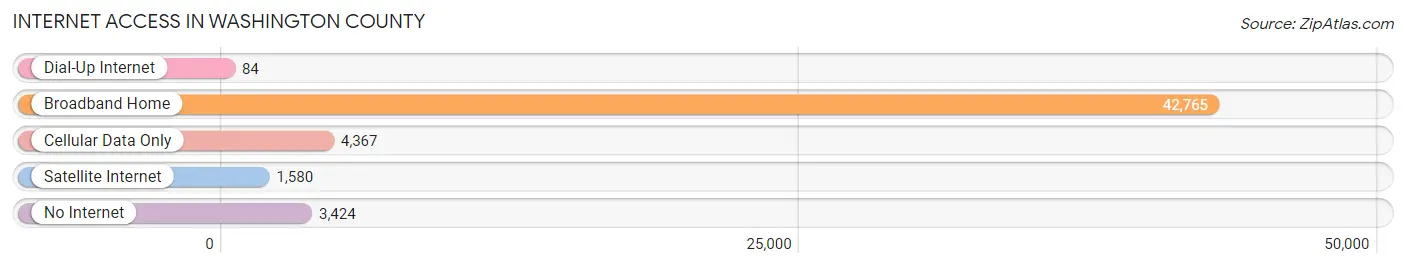
| Internet Type | # Households | % Households |
| Dial-Up Internet | 84 | 0.2% |
| Broadband Home | 42,765 | 83.2% |
| Cellular Data Only | 4,367 | 8.5% |
| Satellite Internet | 1,580 | 3.1% |
| No Internet | 3,424 | 6.7% |
| Total | 51,426 | 100.0% |
Washington County Summary
Washington County, Rhode Island is located in the southeastern corner of the state and is the smallest county in the state. It is bordered by the Atlantic Ocean to the south, Connecticut to the west, and Massachusetts to the north and east. The county seat is the town of Westerly, which is also the largest town in the county. The county is home to several small towns and villages, including Charlestown, Hopkinton, Narragansett, North Kingstown, Richmond, South Kingstown, and Westerly.
History
Washington County was established in 1729 as Kings County, one of the five original counties in the Colony of Rhode Island and Providence Plantations. The county was renamed Washington County in 1781 in honor of George Washington, the first President of the United States.
The county has a long and rich history. The area was first inhabited by the Narragansett Native American tribe, who lived in the area for centuries before the arrival of European settlers. The first European settlers arrived in the area in the 1630s, and the county was officially established in 1729.
During the American Revolution, the county was the site of several battles, including the Battle of Rhode Island in 1778. The county was also the site of the first naval battle of the American Revolution, the Battle of Quaker Hill in 1775.
Geography
Washington County is located in the southeastern corner of Rhode Island and is the smallest county in the state. It is bordered by the Atlantic Ocean to the south, Connecticut to the west, and Massachusetts to the north and east. The county has a total area of 180 square miles, of which 174 square miles is land and 6 square miles is water.
The county is home to several small towns and villages, including Charlestown, Hopkinton, Narragansett, North Kingstown, Richmond, South Kingstown, and Westerly. The county is also home to several state parks, including Burlingame State Park, Fishers Island State Park, and Ninigret Park.
Economy
Washington County has a diverse economy, with a mix of manufacturing, tourism, and service industries. The county is home to several large employers, including Electric Boat Corporation, which manufactures submarines for the U.S. Navy, and the University of Rhode Island, which is located in South Kingstown.
Tourism is also an important part of the county’s economy. The county is home to several popular beaches, including Misquamicut Beach in Westerly and Scarborough State Beach in Narragansett. The county is also home to several popular attractions, including the Mystic Aquarium and the Block Island Ferry.
Demographics
As of the 2010 census, the population of Washington County was 126,979. The population is made up of a diverse mix of ethnicities, including White (87.3%), Hispanic or Latino (7.2%), African American (2.2%), Asian (1.3%), and Native American (0.4%).
The median household income in the county is $63,945, and the median family income is $76,945. The per capita income in the county is $32,945. The unemployment rate in the county is 4.2%.
Conclusion
Washington County, Rhode Island is a small county located in the southeastern corner of the state. It is bordered by the Atlantic Ocean to the south, Connecticut to the west, and Massachusetts to the north and east. The county has a long and rich history, and is home to several small towns and villages. The county has a diverse economy, with a mix of manufacturing, tourism, and service industries. The population of the county is made up of a diverse mix of ethnicities, and the median household income is $63,945.
Common Questions
What is the Total Population of Washington County?
Total Population of Washington County is 129,998.
What is the Total Male Population of Washington County?
Total Male Population of Washington County is 63,412.
What is the Total Female Population of Washington County?
Total Female Population of Washington County is 66,586.
What is the Ratio of Males per 100 Females in Washington County?
There are 95.23 Males per 100 Females in Washington County.
What is the Ratio of Females per 100 Males in Washington County?
There are 105.01 Females per 100 Males in Washington County.
What is the Median Population Age in Washington County?
Median Population Age in Washington County is 44.9 Years.
What is the Average Family Size in Washington County
Average Family Size in Washington County is 2.9 People.
What is the Average Household Size in Washington County
Average Household Size in Washington County is 2.4 People.
What is Per Capita Income in Washington County?
Per Capita income in Washington County is $50,008.
What is the Median Family Income in Washington County?
Median Family Income in Washington County is $122,848.
What is the Median Household income in Washington County?
Median Household Income in Washington County is $99,510.
What is Income or Wage Gap in Washington County?
Income or Wage Gap in Washington County is 36.3%.
Women in Washington County earn 63.7 cents for every dollar earned by a man.
What is Family Income Deficit in Washington County?
Family Income Deficit in Washington County is $10,958.
Families that are below poverty line in Washington County earn $10,958 less on average than the poverty threshold level.
What is Inequality or Gini Index in Washington County?
Inequality or Gini Index in Washington County is 0.43.
How Large is the Labor Force in Washington County?
There are 71,064 People in the Labor Forcein in Washington County.
What is the Percentage of People in the Labor Force in Washington County?
63.2% of People are in the Labor Force in Washington County.
What is the Unemployment Rate in Washington County?
Unemployment Rate in Washington County is 5.9%.