Providence County, RI
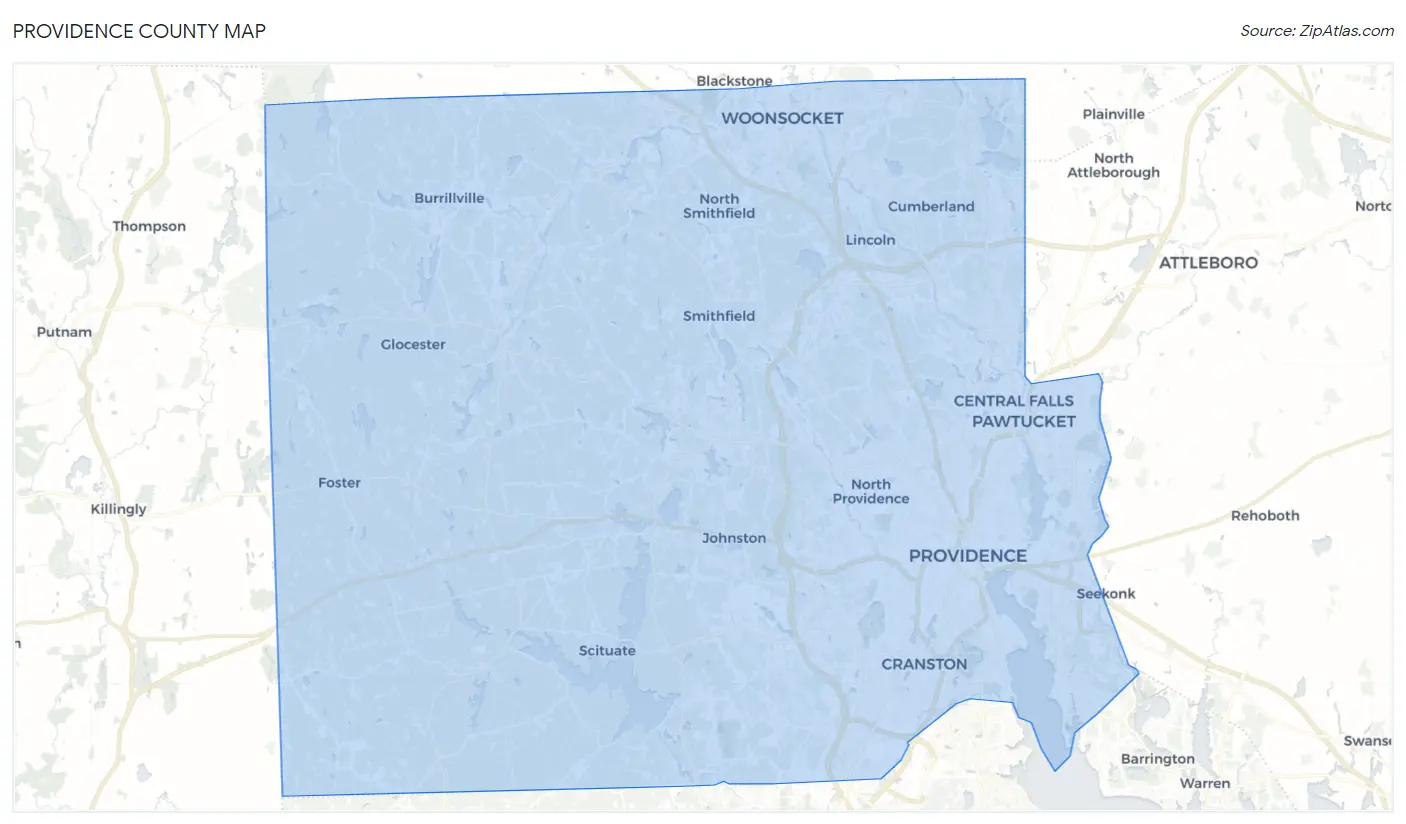
Providence County Map
Providence County Overview
657,984
TOTAL POPULATION
323,700
MALE POPULATION
334,284
FEMALE POPULATION
96.83
MALES / 100 FEMALES
103.27
FEMALES / 100 MALES
37.6
MEDIAN AGE
3.2
AVG FAMILY SIZE
2.5
AVG HOUSEHOLD SIZE
$38,191
PER CAPITA INCOME
$93,015
AVG FAMILY INCOME
$72,579
AVG HOUSEHOLD INCOME
22.5%
WAGE / INCOME GAP [ % ]
77.5¢/ $1
WAGE / INCOME GAP [ $ ]
$11,155
FAMILY INCOME DEFICIT
0.46
INEQUALITY / GINI INDEX
352,190
LABOR FORCE [ PEOPLE ]
65.1%
PERCENT IN LABOR FORCE
6.3%
UNEMPLOYMENT RATE
Providence County Area Codes
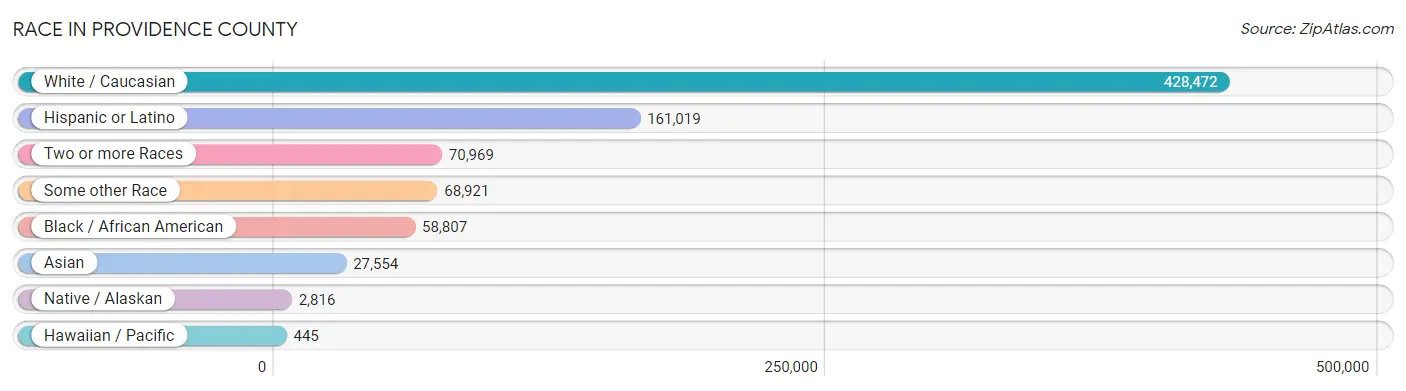
Race in Providence County
The most populous races in Providence County are White / Caucasian (428,472 | 65.1%), Hispanic or Latino (161,019 | 24.5%), and Two or more Races (70,969 | 10.8%).
| Race | # Population | % Population |
| Asian | 27,554 | 4.2% |
| Black / African American | 58,807 | 8.9% |
| Hawaiian / Pacific | 445 | 0.1% |
| Hispanic or Latino | 161,019 | 24.5% |
| Native / Alaskan | 2,816 | 0.4% |
| White / Caucasian | 428,472 | 65.1% |
| Two or more Races | 70,969 | 10.8% |
| Some other Race | 68,921 | 10.5% |
| Total | 657,984 | 100.0% |
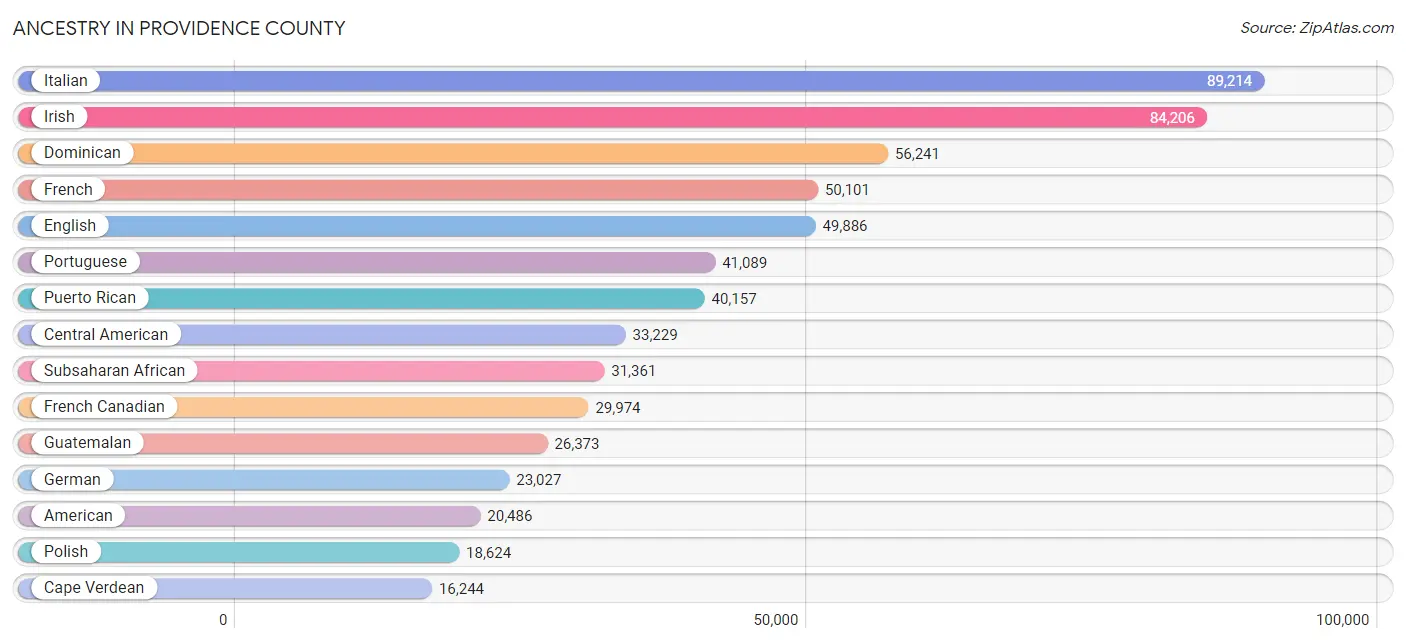
Ancestry in Providence County
The most populous ancestries reported in Providence County are Italian (89,214 | 13.6%), Irish (84,206 | 12.8%), Dominican (56,241 | 8.6%), French (50,101 | 7.6%), and English (49,886 | 7.6%), together accounting for 50.1% of all Providence County residents.
| Ancestry | # Population | % Population |
| Afghan | 4 | 0.0% |
| African | 5,559 | 0.8% |
| Albanian | 606 | 0.1% |
| Alsatian | 31 | 0.0% |
| American | 20,486 | 3.1% |
| Apache | 6 | 0.0% |
| Arab | 6,518 | 1.0% |
| Argentinean | 443 | 0.1% |
| Armenian | 3,327 | 0.5% |
| Assyrian / Chaldean / Syriac | 249 | 0.0% |
| Australian | 76 | 0.0% |
| Austrian | 717 | 0.1% |
| Bangladeshi | 744 | 0.1% |
| Barbadian | 247 | 0.0% |
| Basque | 33 | 0.0% |
| Belgian | 677 | 0.1% |
| Belizean | 60 | 0.0% |
| Bermudan | 23 | 0.0% |
| Bhutanese | 1,191 | 0.2% |
| Blackfeet | 286 | 0.0% |
| Bolivian | 1,435 | 0.2% |
| Brazilian | 1,496 | 0.2% |
| British | 1,850 | 0.3% |
| British West Indian | 199 | 0.0% |
| Bulgarian | 62 | 0.0% |
| Burmese | 1,702 | 0.3% |
| Cajun | 79 | 0.0% |
| Canadian | 2,034 | 0.3% |
| Cape Verdean | 16,244 | 2.5% |
| Celtic | 32 | 0.0% |
| Central American | 33,229 | 5.1% |
| Central American Indian | 2,492 | 0.4% |
| Cherokee | 625 | 0.1% |
| Chilean | 169 | 0.0% |
| Chippewa | 96 | 0.0% |
| Choctaw | 85 | 0.0% |
| Colombian | 10,408 | 1.6% |
| Costa Rican | 453 | 0.1% |
| Cree | 14 | 0.0% |
| Creek | 53 | 0.0% |
| Croatian | 157 | 0.0% |
| Crow | 23 | 0.0% |
| Cuban | 1,028 | 0.2% |
| Cypriot | 24 | 0.0% |
| Czech | 660 | 0.1% |
| Czechoslovakian | 174 | 0.0% |
| Danish | 521 | 0.1% |
| Dominican | 56,241 | 8.6% |
| Dutch | 1,654 | 0.3% |
| Eastern European | 1,523 | 0.2% |
| Ecuadorian | 1,514 | 0.2% |
| Egyptian | 858 | 0.1% |
| English | 49,886 | 7.6% |
| Estonian | 37 | 0.0% |
| Ethiopian | 41 | 0.0% |
| European | 3,732 | 0.6% |
| Filipino | 396 | 0.1% |
| Finnish | 305 | 0.1% |
| French | 50,101 | 7.6% |
| French American Indian | 87 | 0.0% |
| French Canadian | 29,974 | 4.6% |
| German | 23,027 | 3.5% |
| German Russian | 17 | 0.0% |
| Ghanaian | 127 | 0.0% |
| Greek | 3,920 | 0.6% |
| Guamanian / Chamorro | 43 | 0.0% |
| Guatemalan | 26,373 | 4.0% |
| Guyanese | 427 | 0.1% |
| Haitian | 4,287 | 0.6% |
| Honduran | 1,728 | 0.3% |
| Hungarian | 928 | 0.1% |
| Icelander | 54 | 0.0% |
| Indian (Asian) | 6,586 | 1.0% |
| Indonesian | 145 | 0.0% |
| Iranian | 121 | 0.0% |
| Iraqi | 118 | 0.0% |
| Irish | 84,206 | 12.8% |
| Iroquois | 267 | 0.0% |
| Israeli | 80 | 0.0% |
| Italian | 89,214 | 13.6% |
| Jamaican | 1,412 | 0.2% |
| Japanese | 6,188 | 0.9% |
| Jordanian | 158 | 0.0% |
| Kenyan | 90 | 0.0% |
| Korean | 3,615 | 0.5% |
| Laotian | 127 | 0.0% |
| Latvian | 99 | 0.0% |
| Lebanese | 2,396 | 0.4% |
| Liberian | 3,560 | 0.5% |
| Lithuanian | 1,604 | 0.2% |
| Luxembourger | 29 | 0.0% |
| Macedonian | 67 | 0.0% |
| Malaysian | 2,852 | 0.4% |
| Maltese | 36 | 0.0% |
| Menominee | 9 | 0.0% |
| Mexican | 7,875 | 1.2% |
| Mexican American Indian | 487 | 0.1% |
| Mongolian | 79 | 0.0% |
| Moroccan | 287 | 0.0% |
| Native Hawaiian | 321 | 0.1% |
| Navajo | 14 | 0.0% |
| New Zealander | 10 | 0.0% |
| Nicaraguan | 490 | 0.1% |
| Nigerian | 4,278 | 0.6% |
| Northern European | 247 | 0.0% |
| Norwegian | 1,914 | 0.3% |
| Okinawan | 44 | 0.0% |
| Pakistani | 482 | 0.1% |
| Palestinian | 216 | 0.0% |
| Panamanian | 463 | 0.1% |
| Pennsylvania German | 71 | 0.0% |
| Peruvian | 917 | 0.1% |
| Polish | 18,624 | 2.8% |
| Portuguese | 41,089 | 6.2% |
| Pueblo | 22 | 0.0% |
| Puerto Rican | 40,157 | 6.1% |
| Romanian | 588 | 0.1% |
| Russian | 5,015 | 0.8% |
| Salvadoran | 3,670 | 0.6% |
| Samoan | 170 | 0.0% |
| Scandinavian | 926 | 0.1% |
| Scotch-Irish | 1,784 | 0.3% |
| Scottish | 7,474 | 1.1% |
| Seminole | 206 | 0.0% |
| Senegalese | 411 | 0.1% |
| Serbian | 3 | 0.0% |
| Sierra Leonean | 154 | 0.0% |
| Sioux | 53 | 0.0% |
| Slavic | 73 | 0.0% |
| Slovak | 321 | 0.1% |
| Slovene | 16 | 0.0% |
| Somali | 15 | 0.0% |
| South African | 109 | 0.0% |
| South American | 15,970 | 2.4% |
| South American Indian | 230 | 0.0% |
| Soviet Union | 7 | 0.0% |
| Spaniard | 1,124 | 0.2% |
| Spanish | 822 | 0.1% |
| Spanish American Indian | 8 | 0.0% |
| Sri Lankan | 919 | 0.1% |
| Subsaharan African | 31,361 | 4.8% |
| Swedish | 6,342 | 1.0% |
| Swiss | 370 | 0.1% |
| Syrian | 1,619 | 0.3% |
| Thai | 6,999 | 1.1% |
| Trinidadian and Tobagonian | 424 | 0.1% |
| Turkish | 108 | 0.0% |
| Ukrainian | 1,691 | 0.3% |
| Uruguayan | 90 | 0.0% |
| Venezuelan | 937 | 0.1% |
| Vietnamese | 170 | 0.0% |
| Welsh | 1,550 | 0.2% |
| West Indian | 639 | 0.1% |
| Yugoslavian | 22 | 0.0% | View All 154 Rows |
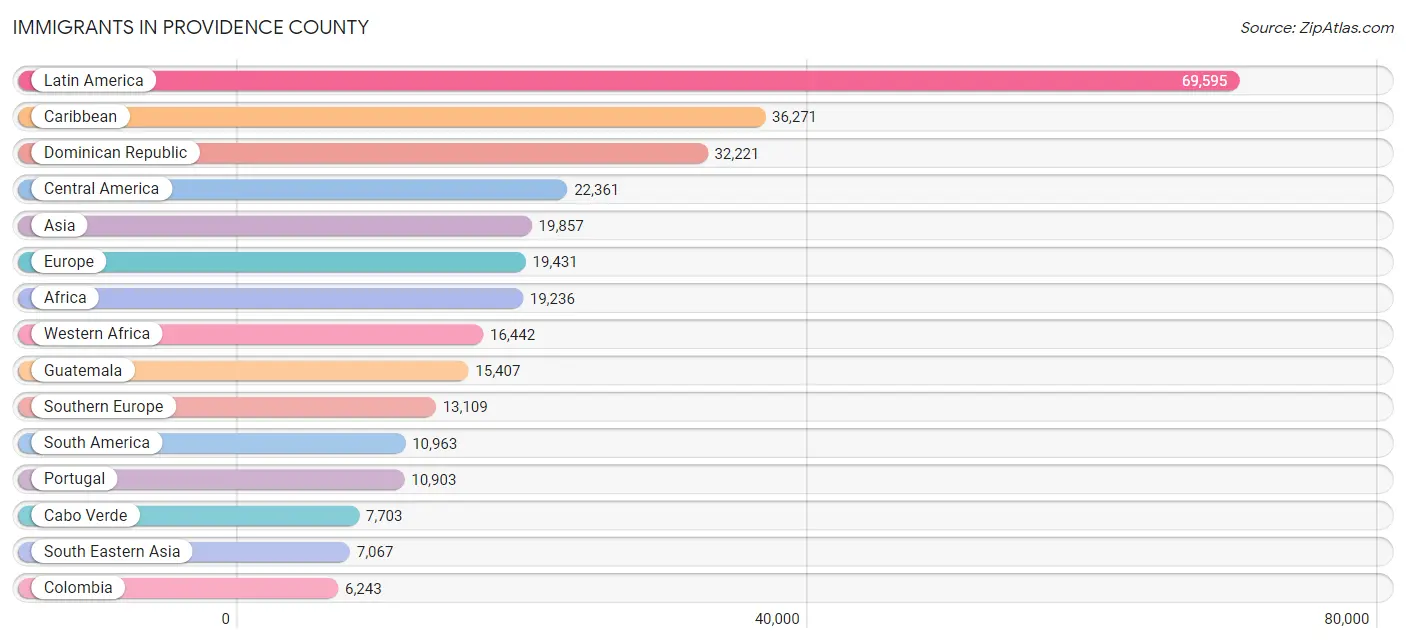
Immigrants in Providence County
The most numerous immigrant groups reported in Providence County came from Latin America (69,595 | 10.6%), Caribbean (36,271 | 5.5%), Dominican Republic (32,221 | 4.9%), Central America (22,361 | 3.4%), and Asia (19,857 | 3.0%), together accounting for 27.4% of all Providence County residents.
| Immigration Origin | # Population | % Population |
| Africa | 19,236 | 2.9% |
| Albania | 268 | 0.0% |
| Argentina | 115 | 0.0% |
| Armenia | 113 | 0.0% |
| Asia | 19,857 | 3.0% |
| Australia | 47 | 0.0% |
| Austria | 40 | 0.0% |
| Azores | 2,193 | 0.3% |
| Bangladesh | 41 | 0.0% |
| Barbados | 79 | 0.0% |
| Belarus | 249 | 0.0% |
| Belgium | 46 | 0.0% |
| Belize | 21 | 0.0% |
| Bolivia | 739 | 0.1% |
| Bosnia and Herzegovina | 25 | 0.0% |
| Brazil | 1,626 | 0.3% |
| Bulgaria | 39 | 0.0% |
| Cabo Verde | 7,703 | 1.2% |
| Cambodia | 1,734 | 0.3% |
| Cameroon | 9 | 0.0% |
| Canada | 1,266 | 0.2% |
| Caribbean | 36,271 | 5.5% |
| Central America | 22,361 | 3.4% |
| Chile | 89 | 0.0% |
| China | 4,007 | 0.6% |
| Colombia | 6,243 | 0.9% |
| Costa Rica | 58 | 0.0% |
| Croatia | 7 | 0.0% |
| Cuba | 198 | 0.0% |
| Czechoslovakia | 63 | 0.0% |
| Denmark | 89 | 0.0% |
| Dominica | 36 | 0.0% |
| Dominican Republic | 32,221 | 4.9% |
| Eastern Africa | 525 | 0.1% |
| Eastern Asia | 5,098 | 0.8% |
| Eastern Europe | 3,219 | 0.5% |
| Ecuador | 727 | 0.1% |
| Egypt | 385 | 0.1% |
| El Salvador | 2,496 | 0.4% |
| England | 410 | 0.1% |
| Eritrea | 39 | 0.0% |
| Europe | 19,431 | 2.9% |
| Fiji | 135 | 0.0% |
| France | 342 | 0.1% |
| Germany | 750 | 0.1% |
| Ghana | 332 | 0.1% |
| Greece | 388 | 0.1% |
| Guatemala | 15,407 | 2.3% |
| Guyana | 167 | 0.0% |
| Haiti | 2,606 | 0.4% |
| Honduras | 1,054 | 0.2% |
| Hong Kong | 546 | 0.1% |
| Hungary | 186 | 0.0% |
| India | 4,175 | 0.6% |
| Indonesia | 98 | 0.0% |
| Iran | 119 | 0.0% |
| Iraq | 332 | 0.1% |
| Ireland | 242 | 0.0% |
| Israel | 170 | 0.0% |
| Italy | 1,499 | 0.2% |
| Jamaica | 598 | 0.1% |
| Japan | 218 | 0.0% |
| Jordan | 82 | 0.0% |
| Kazakhstan | 66 | 0.0% |
| Kenya | 134 | 0.0% |
| Korea | 873 | 0.1% |
| Laos | 1,887 | 0.3% |
| Latin America | 69,595 | 10.6% |
| Latvia | 57 | 0.0% |
| Lebanon | 601 | 0.1% |
| Liberia | 3,859 | 0.6% |
| Lithuania | 71 | 0.0% |
| Malaysia | 113 | 0.0% |
| Mexico | 2,905 | 0.4% |
| Middle Africa | 310 | 0.1% |
| Moldova | 12 | 0.0% |
| Morocco | 228 | 0.0% |
| Nepal | 76 | 0.0% |
| Netherlands | 131 | 0.0% |
| Nicaragua | 159 | 0.0% |
| Nigeria | 2,879 | 0.4% |
| North Macedonia | 7 | 0.0% |
| Northern Africa | 686 | 0.1% |
| Northern Europe | 1,651 | 0.3% |
| Norway | 45 | 0.0% |
| Oceania | 201 | 0.0% |
| Pakistan | 354 | 0.1% |
| Panama | 261 | 0.0% |
| Peru | 440 | 0.1% |
| Philippines | 1,627 | 0.3% |
| Poland | 683 | 0.1% |
| Portugal | 10,903 | 1.7% |
| Romania | 146 | 0.0% |
| Russia | 766 | 0.1% |
| Saudi Arabia | 33 | 0.0% |
| Scotland | 149 | 0.0% |
| Senegal | 748 | 0.1% |
| Serbia | 3 | 0.0% |
| Sierra Leone | 172 | 0.0% |
| Singapore | 193 | 0.0% |
| South Africa | 37 | 0.0% |
| South America | 10,963 | 1.7% |
| South Central Asia | 4,997 | 0.8% |
| South Eastern Asia | 7,067 | 1.1% |
| Southern Europe | 13,109 | 2.0% |
| Spain | 319 | 0.1% |
| Sri Lanka | 19 | 0.0% |
| Sweden | 93 | 0.0% |
| Switzerland | 76 | 0.0% |
| Syria | 783 | 0.1% |
| Taiwan | 233 | 0.0% |
| Thailand | 752 | 0.1% |
| Trinidad and Tobago | 442 | 0.1% |
| Turkey | 107 | 0.0% |
| Ukraine | 523 | 0.1% |
| Uruguay | 44 | 0.0% |
| Uzbekistan | 147 | 0.0% |
| Venezuela | 699 | 0.1% |
| Vietnam | 546 | 0.1% |
| West Indies | 5 | 0.0% |
| Western Africa | 16,442 | 2.5% |
| Western Asia | 2,614 | 0.4% |
| Western Europe | 1,401 | 0.2% |
| Zaire | 44 | 0.0% |
| Zimbabwe | 9 | 0.0% | View All 125 Rows |
Sex and Age in Providence County
Sex and Age in Providence County
The most populous age groups in Providence County are 30 to 34 Years (25,863 | 8.0%) for men and 30 to 34 Years (24,631 | 7.4%) for women.
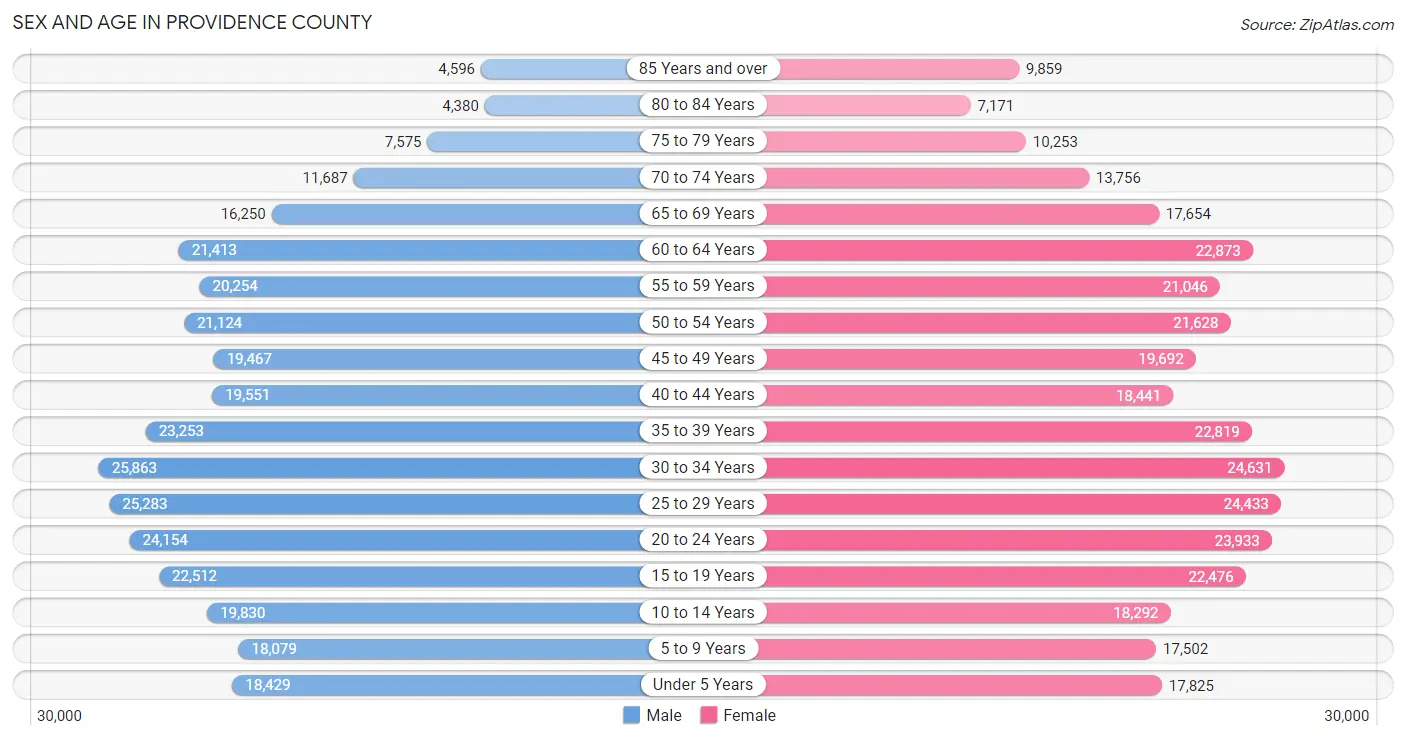
| Age Bracket | Male | Female |
| Under 5 Years | 18,429 (5.7%) | 17,825 (5.3%) |
| 5 to 9 Years | 18,079 (5.6%) | 17,502 (5.2%) |
| 10 to 14 Years | 19,830 (6.1%) | 18,292 (5.5%) |
| 15 to 19 Years | 22,512 (7.0%) | 22,476 (6.7%) |
| 20 to 24 Years | 24,154 (7.5%) | 23,933 (7.2%) |
| 25 to 29 Years | 25,283 (7.8%) | 24,433 (7.3%) |
| 30 to 34 Years | 25,863 (8.0%) | 24,631 (7.4%) |
| 35 to 39 Years | 23,253 (7.2%) | 22,819 (6.8%) |
| 40 to 44 Years | 19,551 (6.0%) | 18,441 (5.5%) |
| 45 to 49 Years | 19,467 (6.0%) | 19,692 (5.9%) |
| 50 to 54 Years | 21,124 (6.5%) | 21,628 (6.5%) |
| 55 to 59 Years | 20,254 (6.3%) | 21,046 (6.3%) |
| 60 to 64 Years | 21,413 (6.6%) | 22,873 (6.8%) |
| 65 to 69 Years | 16,250 (5.0%) | 17,654 (5.3%) |
| 70 to 74 Years | 11,687 (3.6%) | 13,756 (4.1%) |
| 75 to 79 Years | 7,575 (2.3%) | 10,253 (3.1%) |
| 80 to 84 Years | 4,380 (1.3%) | 7,171 (2.1%) |
| 85 Years and over | 4,596 (1.4%) | 9,859 (2.9%) |
| Total | 323,700 (100.0%) | 334,284 (100.0%) |
Families and Households in Providence County
Median Family Size in Providence County
The median family size in Providence County is 3.16 persons per family, with married-couple families (100,319 | 65.8%) accounting for the largest median family size of 3.24 persons per family. On the other hand, single male/father families (15,082 | 9.9%) represent the smallest median family size with 2.75 persons per family.
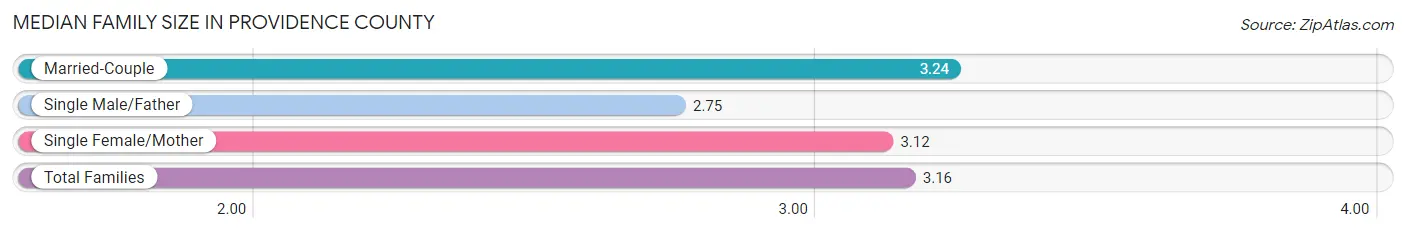
| Family Type | # Families | Family Size |
| Married-Couple | 100,319 (65.8%) | 3.24 |
| Single Male/Father | 15,082 (9.9%) | 2.75 |
| Single Female/Mother | 36,974 (24.3%) | 3.12 |
| Total Families | 152,375 (100.0%) | 3.16 |
Median Household Size in Providence County
The median household size in Providence County is 2.48 persons per household, with single female/mother households (36,974 | 14.6%) accounting for the largest median household size of 3.37 persons per household. non-family households (101,260 | 39.9%) represent the smallest median household size with 1.27 persons per household.
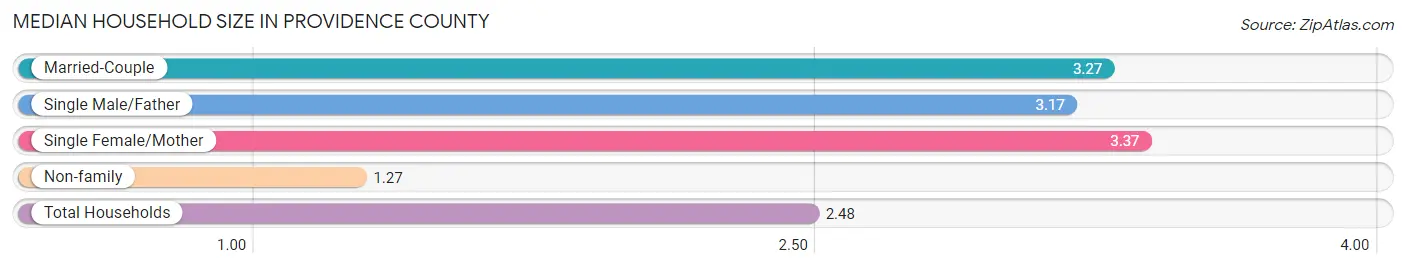
| Household Type | # Households | Household Size |
| Married-Couple | 100,319 (39.6%) | 3.27 |
| Single Male/Father | 15,082 (5.9%) | 3.17 |
| Single Female/Mother | 36,974 (14.6%) | 3.37 |
| Non-family | 101,260 (39.9%) | 1.27 |
| Total Households | 253,635 (100.0%) | 2.48 |
Household Size by Marriage Status in Providence County
Out of a total of 253,635 households in Providence County, 152,375 (60.1%) are family households, while 101,260 (39.9%) are nonfamily households. The most numerous type of family households are 2-person households, comprising 62,607, and the most common type of nonfamily households are 1-person households, comprising 80,044.
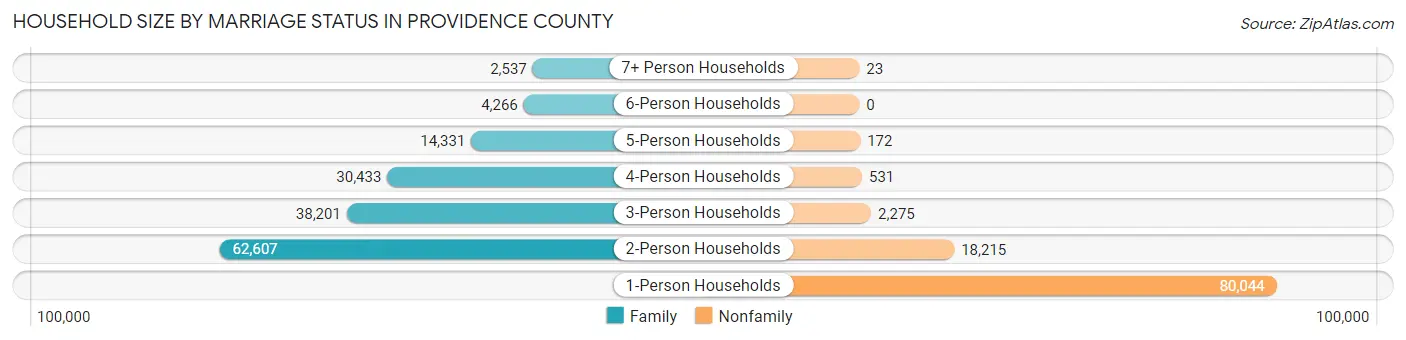
| Household Size | Family Households | Nonfamily Households |
| 1-Person Households | - | 80,044 (31.6%) |
| 2-Person Households | 62,607 (24.7%) | 18,215 (7.2%) |
| 3-Person Households | 38,201 (15.1%) | 2,275 (0.9%) |
| 4-Person Households | 30,433 (12.0%) | 531 (0.2%) |
| 5-Person Households | 14,331 (5.7%) | 172 (0.1%) |
| 6-Person Households | 4,266 (1.7%) | 0 (0.0%) |
| 7+ Person Households | 2,537 (1.0%) | 23 (0.0%) |
| Total | 152,375 (60.1%) | 101,260 (39.9%) |
Female Fertility in Providence County
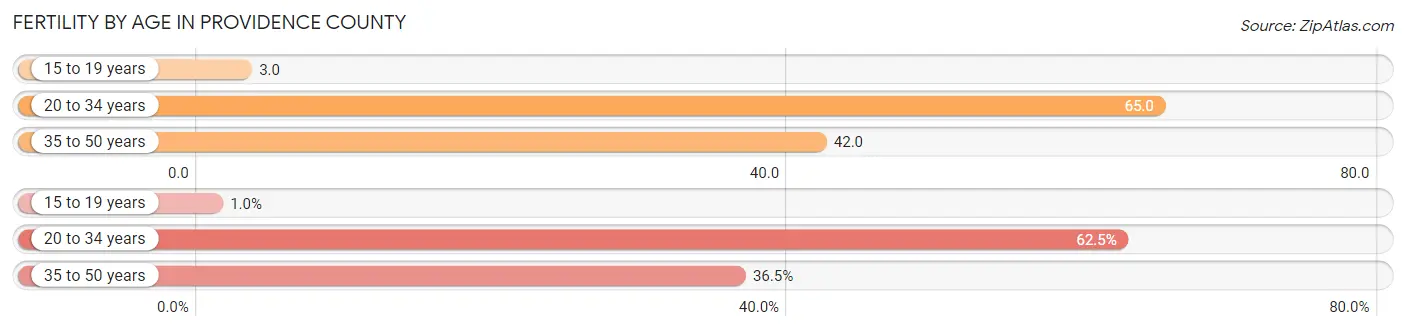
Fertility by Age in Providence County
Average fertility rate in Providence County is 47.0 births per 1,000 women. Women in the age bracket of 20 to 34 years have the highest fertility rate with 65.0 births per 1,000 women. Women in the age bracket of 20 to 34 years acount for 62.5% of all women with births.
| Age Bracket | Women with Births | Births / 1,000 Women |
| 15 to 19 years | 78 (1.0%) | 3.0 |
| 20 to 34 years | 4,745 (62.5%) | 65.0 |
| 35 to 50 years | 2,773 (36.5%) | 42.0 |
| Total | 7,596 (100.0%) | 47.0 |
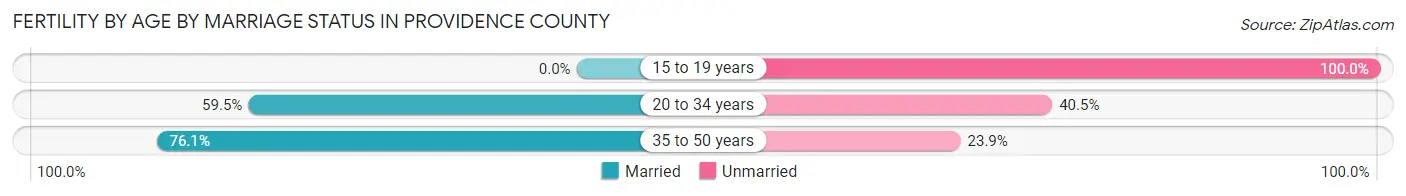
Fertility by Age by Marriage Status in Providence County
64.9% of women with births (7,596) in Providence County are married. The highest percentage of unmarried women with births falls into 15 to 19 years age bracket with 100.0% of them unmarried at the time of birth, while the lowest percentage of unmarried women with births belong to 35 to 50 years age bracket with 23.9% of them unmarried.
| Age Bracket | Married | Unmarried |
| 15 to 19 years | 0 (0.0%) | 78 (100.0%) |
| 20 to 34 years | 2,823 (59.5%) | 1,922 (40.5%) |
| 35 to 50 years | 2,110 (76.1%) | 663 (23.9%) |
| Total | 4,930 (64.9%) | 2,666 (35.1%) |
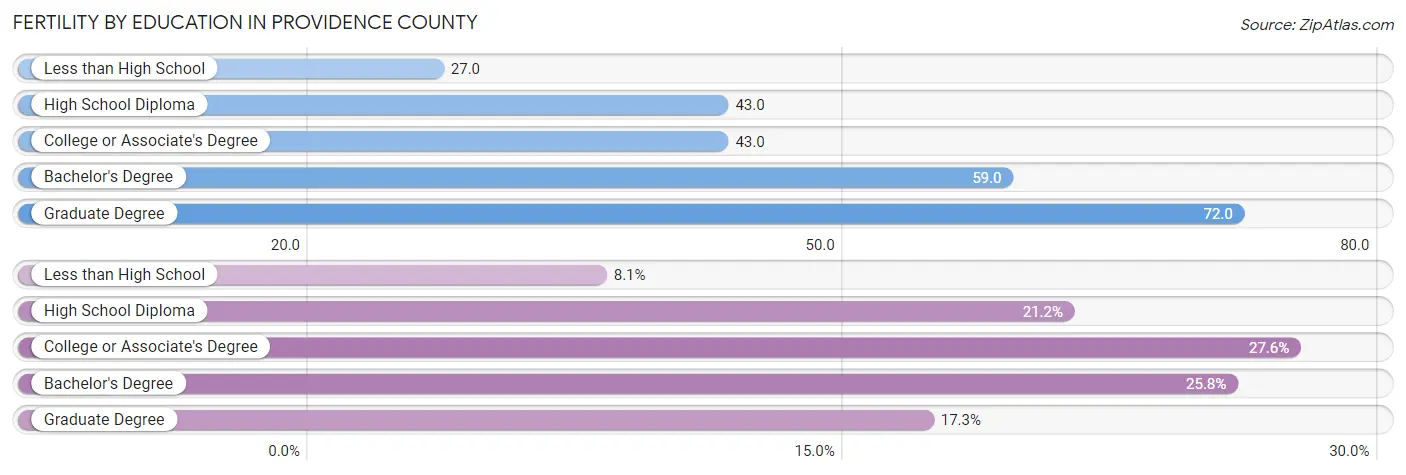
Fertility by Education in Providence County
Average fertility rate in Providence County is 47.0 births per 1,000 women. Women with the education attainment of graduate degree have the highest fertility rate of 72.0 births per 1,000 women, while women with the education attainment of less than high school have the lowest fertility at 27.0 births per 1,000 women. Women with the education attainment of college or associate's degree represent 27.6% of all women with births.
| Educational Attainment | Women with Births | Births / 1,000 Women |
| Less than High School | 614 (8.1%) | 27.0 |
| High School Diploma | 1,613 (21.2%) | 43.0 |
| College or Associate's Degree | 2,096 (27.6%) | 43.0 |
| Bachelor's Degree | 1,961 (25.8%) | 59.0 |
| Graduate Degree | 1,312 (17.3%) | 72.0 |
| Total | 7,596 (100.0%) | 47.0 |
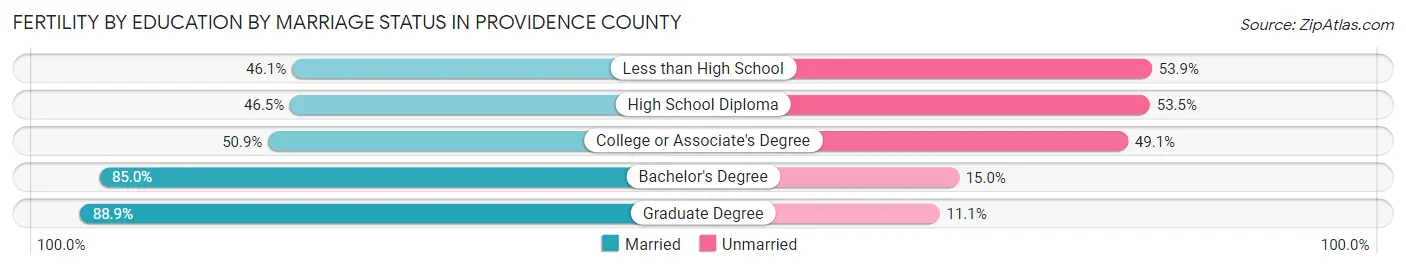
Fertility by Education by Marriage Status in Providence County
35.1% of women with births in Providence County are unmarried. Women with the educational attainment of graduate degree are most likely to be married with 88.9% of them married at childbirth, while women with the educational attainment of less than high school are least likely to be married with 53.9% of them unmarried at childbirth.
| Educational Attainment | Married | Unmarried |
| Less than High School | 283 (46.1%) | 331 (53.9%) |
| High School Diploma | 750 (46.5%) | 863 (53.5%) |
| College or Associate's Degree | 1,067 (50.9%) | 1,029 (49.1%) |
| Bachelor's Degree | 1,667 (85.0%) | 294 (15.0%) |
| Graduate Degree | 1,166 (88.9%) | 146 (11.1%) |
| Total | 4,930 (64.9%) | 2,666 (35.1%) |
Income in Providence County
Income Overview in Providence County
Per Capita Income in Providence County is $38,191, while median incomes of families and households are $93,015 and $72,579 respectively.
| Characteristic | Number | Measure |
| Per Capita Income | 657,984 | $38,191 |
| Median Family Income | 152,375 | $93,015 |
| Mean Family Income | 152,375 | $114,779 |
| Median Household Income | 253,635 | $72,579 |
| Mean Household Income | 253,635 | $95,328 |
| Income Deficit | 152,375 | $11,155 |
| Wage / Income Gap (%) | 657,984 | 22.48% |
| Wage / Income Gap ($) | 657,984 | 77.52¢ per $1 |
| Gini / Inequality Index | 657,984 | 0.46 |
Earnings by Sex in Providence County
Average Earnings in Providence County are $42,976, $48,745 for men and $37,785 for women, a difference of 22.5%.
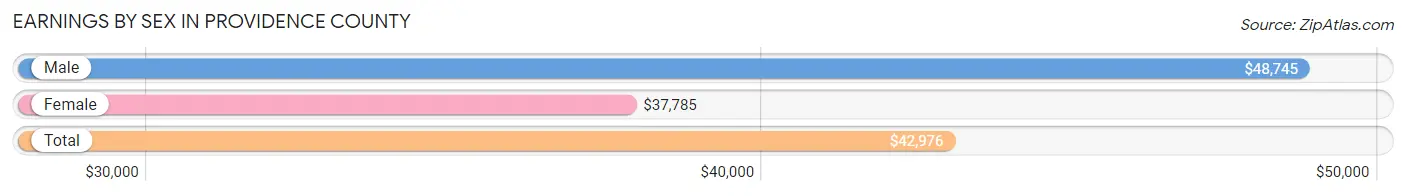
| Sex | Number | Average Earnings |
| Male | 186,438 (51.1%) | $48,745 |
| Female | 178,320 (48.9%) | $37,785 |
| Total | 364,758 (100.0%) | $42,976 |
Earnings by Sex by Income Bracket in Providence County
The most common earnings brackets in Providence County are $100,000+ for men (29,320 | 15.7%) and $75,000 to $99,999 for women (16,213 | 9.1%).
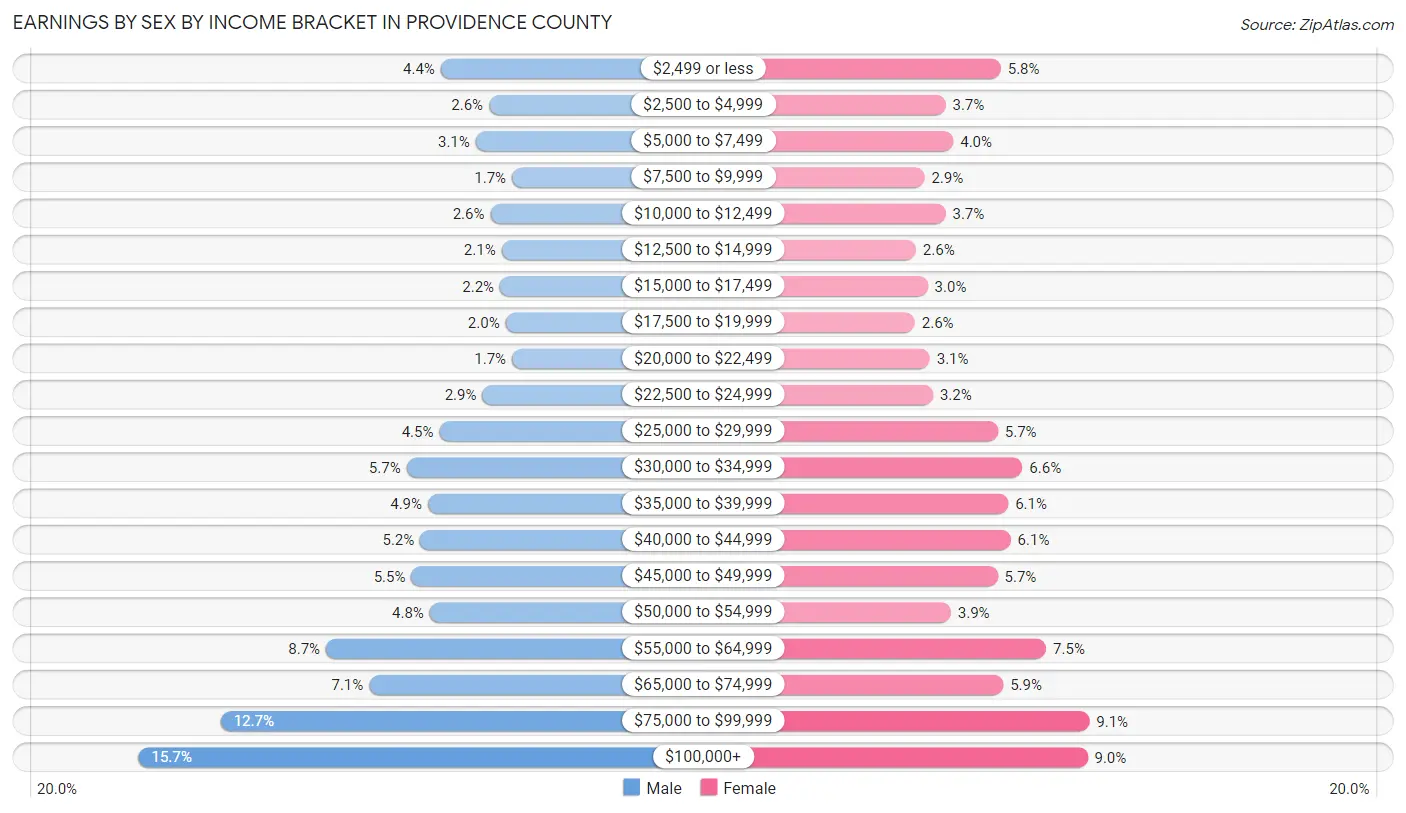
| Income | Male | Female |
| $2,499 or less | 8,213 (4.4%) | 10,292 (5.8%) |
| $2,500 to $4,999 | 4,844 (2.6%) | 6,590 (3.7%) |
| $5,000 to $7,499 | 5,776 (3.1%) | 7,118 (4.0%) |
| $7,500 to $9,999 | 3,251 (1.7%) | 5,183 (2.9%) |
| $10,000 to $12,499 | 4,745 (2.5%) | 6,604 (3.7%) |
| $12,500 to $14,999 | 3,974 (2.1%) | 4,611 (2.6%) |
| $15,000 to $17,499 | 4,084 (2.2%) | 5,409 (3.0%) |
| $17,500 to $19,999 | 3,693 (2.0%) | 4,544 (2.5%) |
| $20,000 to $22,499 | 3,253 (1.7%) | 5,544 (3.1%) |
| $22,500 to $24,999 | 5,314 (2.9%) | 5,756 (3.2%) |
| $25,000 to $29,999 | 8,309 (4.5%) | 10,092 (5.7%) |
| $30,000 to $34,999 | 10,601 (5.7%) | 11,731 (6.6%) |
| $35,000 to $39,999 | 9,116 (4.9%) | 10,795 (6.0%) |
| $40,000 to $44,999 | 9,655 (5.2%) | 10,945 (6.1%) |
| $45,000 to $49,999 | 10,272 (5.5%) | 10,077 (5.7%) |
| $50,000 to $54,999 | 8,986 (4.8%) | 6,963 (3.9%) |
| $55,000 to $64,999 | 16,230 (8.7%) | 13,314 (7.5%) |
| $65,000 to $74,999 | 13,222 (7.1%) | 10,446 (5.9%) |
| $75,000 to $99,999 | 23,580 (12.7%) | 16,213 (9.1%) |
| $100,000+ | 29,320 (15.7%) | 16,093 (9.0%) |
| Total | 186,438 (100.0%) | 178,320 (100.0%) |
Earnings by Sex by Educational Attainment in Providence County
Average earnings in Providence County are $55,990 for men and $43,960 for women, a difference of 21.5%. Men with an educational attainment of graduate degree enjoy the highest average annual earnings of $88,911, while those with less than high school education earn the least with $39,830. Women with an educational attainment of graduate degree earn the most with the average annual earnings of $76,609, while those with less than high school education have the smallest earnings of $28,510.
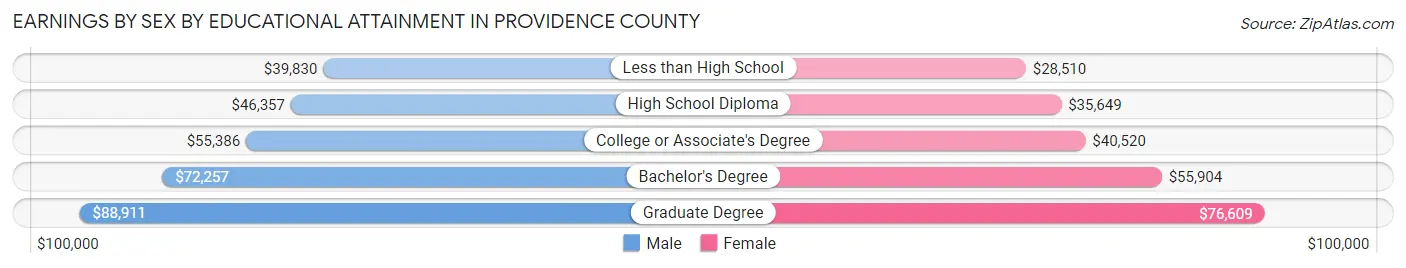
| Educational Attainment | Male Income | Female Income |
| Less than High School | $39,830 | $28,510 |
| High School Diploma | $46,357 | $35,649 |
| College or Associate's Degree | $55,386 | $40,520 |
| Bachelor's Degree | $72,257 | $55,904 |
| Graduate Degree | $88,911 | $76,609 |
| Total | $55,990 | $43,960 |
Family Income in Providence County
Family Income Brackets in Providence County
According to the Providence County family income data, there are 34,742 families falling into the $100,000 to $149,999 income range, which is the most common income bracket and makes up 22.8% of all families. Conversely, the $10,000 to $14,999 income bracket is the least frequent group with only 3,657 families (2.4%) belonging to this category.
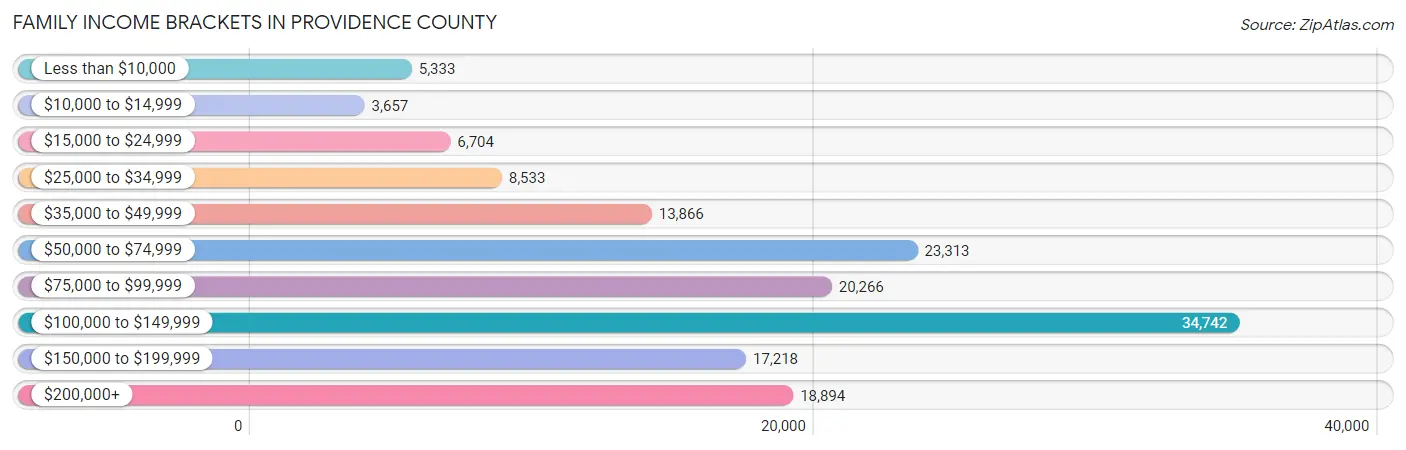
| Income Bracket | # Families | % Families |
| Less than $10,000 | 5,333 | 3.5% |
| $10,000 to $14,999 | 3,657 | 2.4% |
| $15,000 to $24,999 | 6,704 | 4.4% |
| $25,000 to $34,999 | 8,533 | 5.6% |
| $35,000 to $49,999 | 13,866 | 9.1% |
| $50,000 to $74,999 | 23,313 | 15.3% |
| $75,000 to $99,999 | 20,266 | 13.3% |
| $100,000 to $149,999 | 34,742 | 22.8% |
| $150,000 to $199,999 | 17,218 | 11.3% |
| $200,000+ | 18,894 | 12.4% |
Family Income by Famaliy Size in Providence County
7+ person families (1,730 | 1.1%) account for the highest median family income in Providence County with $127,000 per family, while 2-person families (69,032 | 45.3%) have the highest median income of $40,312 per family member.
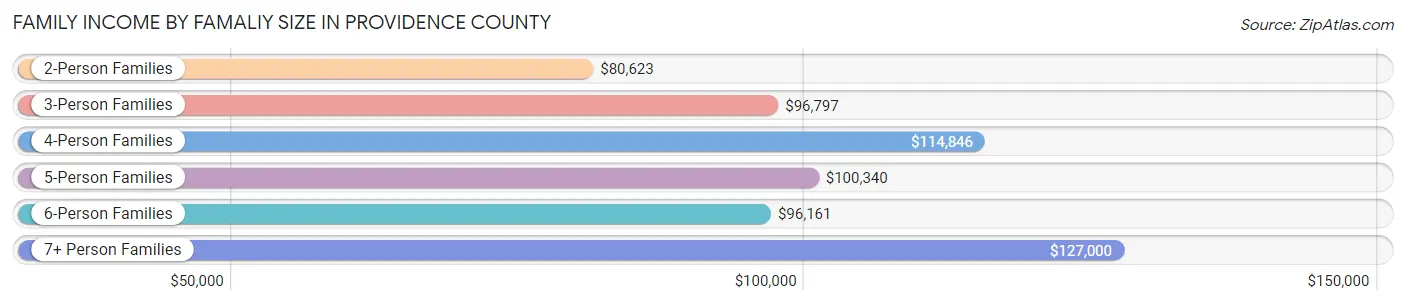
| Income Bracket | # Families | Median Income |
| 2-Person Families | 69,032 (45.3%) | $80,623 |
| 3-Person Families | 36,808 (24.2%) | $96,797 |
| 4-Person Families | 28,833 (18.9%) | $114,846 |
| 5-Person Families | 12,483 (8.2%) | $100,340 |
| 6-Person Families | 3,489 (2.3%) | $96,161 |
| 7+ Person Families | 1,730 (1.1%) | $127,000 |
| Total | 152,375 (100.0%) | $93,015 |
Family Income by Number of Earners in Providence County
The median family income in Providence County is $93,015, with families comprising 3+ earners (20,987) having the highest median family income of $148,289, while families with no earners (19,027) have the lowest median family income of $36,854, accounting for 13.8% and 12.5% of families, respectively.
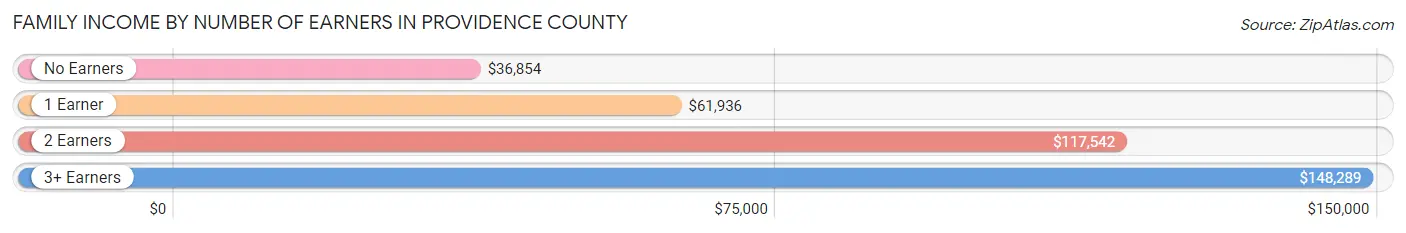
| Number of Earners | # Families | Median Income |
| No Earners | 19,027 (12.5%) | $36,854 |
| 1 Earner | 48,964 (32.1%) | $61,936 |
| 2 Earners | 63,397 (41.6%) | $117,542 |
| 3+ Earners | 20,987 (13.8%) | $148,289 |
| Total | 152,375 (100.0%) | $93,015 |
Household Income in Providence County
Household Income Brackets in Providence County
With 47,176 households falling in the category, the $100,000 to $149,999 income range is the most frequent in Providence County, accounting for 18.6% of all households. In contrast, only 13,443 households (5.3%) fall into the less than $10,000 income bracket, making it the least populous group.
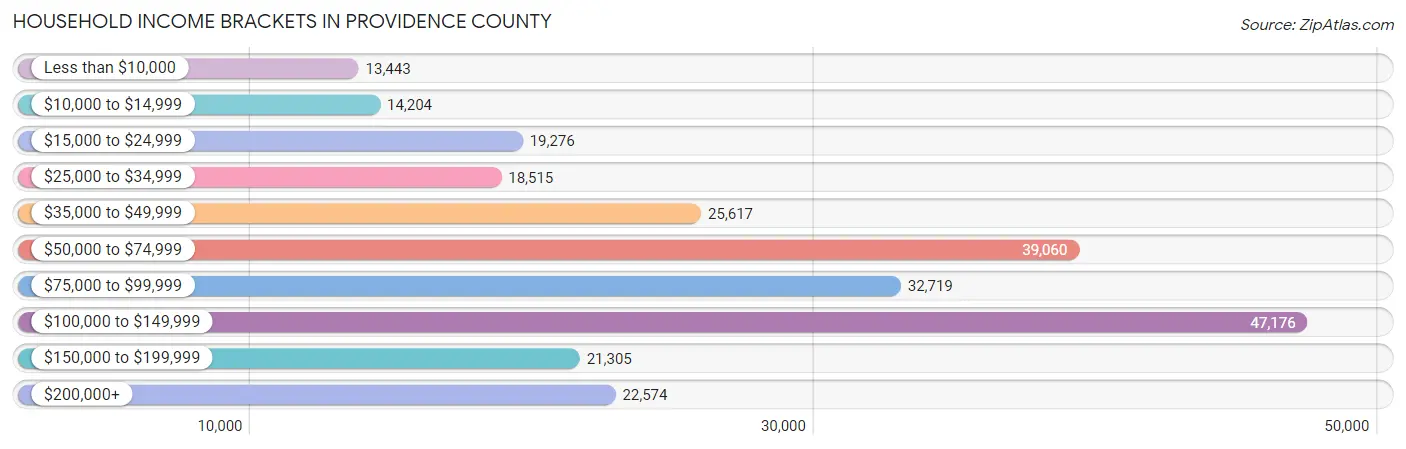
| Income Bracket | # Households | % Households |
| Less than $10,000 | 13,443 | 5.3% |
| $10,000 to $14,999 | 14,204 | 5.6% |
| $15,000 to $24,999 | 19,276 | 7.6% |
| $25,000 to $34,999 | 18,515 | 7.3% |
| $35,000 to $49,999 | 25,617 | 10.1% |
| $50,000 to $74,999 | 39,060 | 15.4% |
| $75,000 to $99,999 | 32,719 | 12.9% |
| $100,000 to $149,999 | 47,176 | 18.6% |
| $150,000 to $199,999 | 21,305 | 8.4% |
| $200,000+ | 22,574 | 8.9% |
Household Income by Householder Age in Providence County
The median household income in Providence County is $72,579, with the highest median household income of $88,454 found in the 45 to 64 years age bracket for the primary householder. A total of 96,521 households (38.1%) fall into this category. Meanwhile, the 15 to 24 years age bracket for the primary householder has the lowest median household income of $45,216, with 6,731 households (2.6%) in this group.
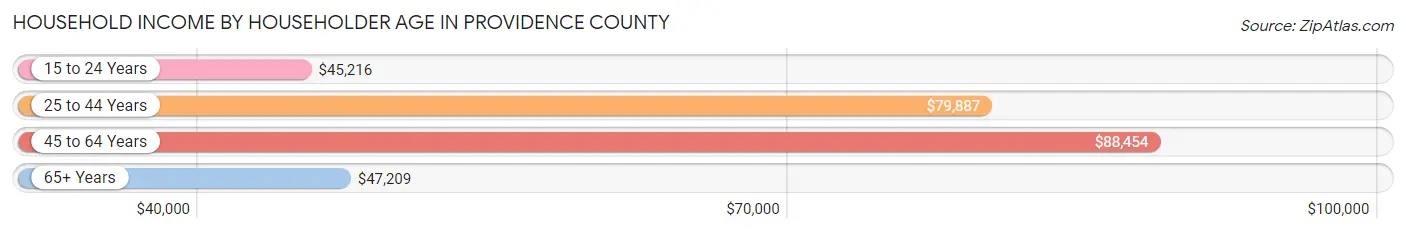
| Income Bracket | # Households | Median Income |
| 15 to 24 Years | 6,731 (2.6%) | $45,216 |
| 25 to 44 Years | 86,896 (34.3%) | $79,887 |
| 45 to 64 Years | 96,521 (38.1%) | $88,454 |
| 65+ Years | 63,487 (25.0%) | $47,209 |
| Total | 253,635 (100.0%) | $72,579 |
Poverty in Providence County
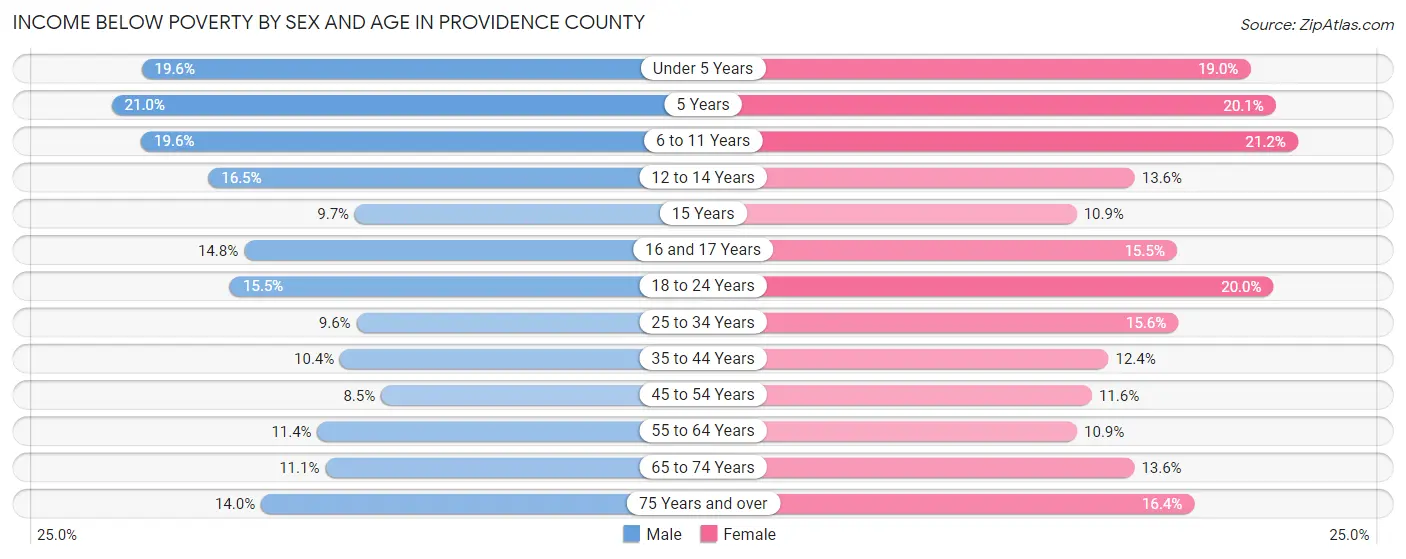
Income Below Poverty by Sex and Age in Providence County
With 12.5% poverty level for males and 14.7% for females among the residents of Providence County, 5 year old males and 6 to 11 year old females are the most vulnerable to poverty, with 695 males (21.0%) and 4,281 females (21.1%) in their respective age groups living below the poverty level.
| Age Bracket | Male | Female |
| Under 5 Years | 3,562 (19.6%) | 3,278 (19.0%) |
| 5 Years | 695 (21.0%) | 718 (20.1%) |
| 6 to 11 Years | 4,243 (19.6%) | 4,281 (21.1%) |
| 12 to 14 Years | 1,987 (16.5%) | 1,537 (13.6%) |
| 15 Years | 366 (9.7%) | 351 (10.9%) |
| 16 and 17 Years | 1,214 (14.8%) | 1,248 (15.5%) |
| 18 to 24 Years | 4,153 (15.5%) | 5,383 (20.0%) |
| 25 to 34 Years | 4,816 (9.6%) | 7,636 (15.6%) |
| 35 to 44 Years | 4,344 (10.4%) | 5,094 (12.4%) |
| 45 to 54 Years | 3,391 (8.5%) | 4,762 (11.6%) |
| 55 to 64 Years | 4,678 (11.4%) | 4,739 (10.9%) |
| 65 to 74 Years | 3,000 (11.1%) | 4,164 (13.6%) |
| 75 Years and over | 2,180 (14.0%) | 4,038 (16.4%) |
| Total | 38,629 (12.5%) | 47,229 (14.7%) |
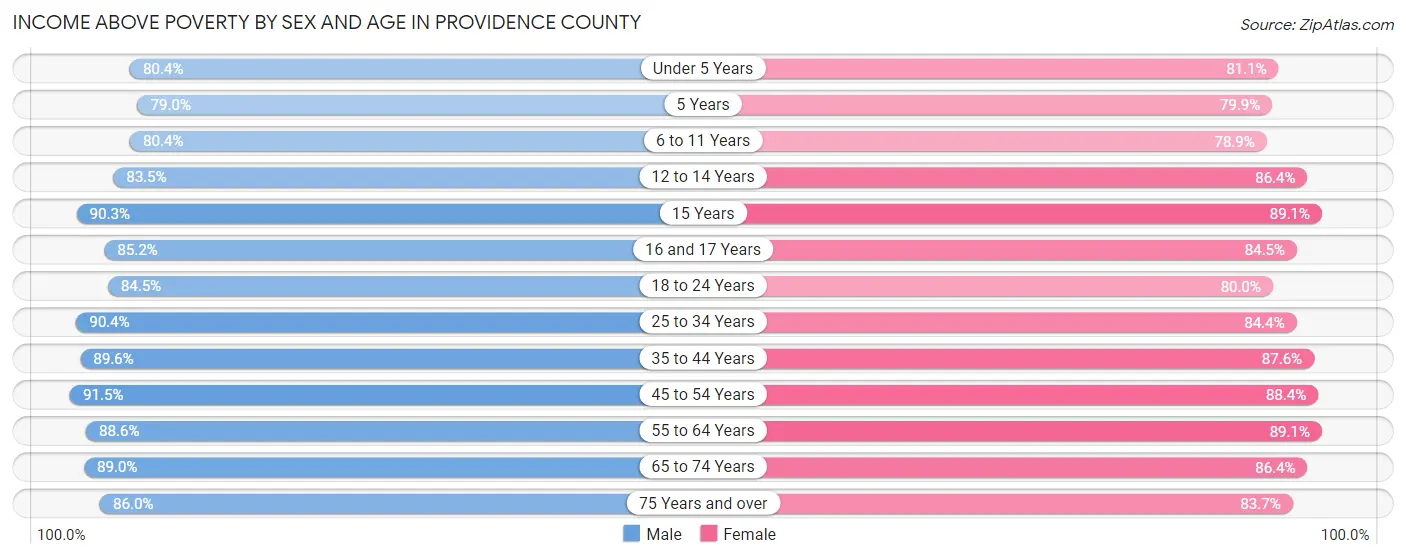
Income Above Poverty by Sex and Age in Providence County
According to the poverty statistics in Providence County, males aged 45 to 54 years and females aged 15 years are the age groups that are most secure financially, with 91.5% of males and 89.1% of females in these age groups living above the poverty line.
| Age Bracket | Male | Female |
| Under 5 Years | 14,637 (80.4%) | 14,019 (81.0%) |
| 5 Years | 2,621 (79.0%) | 2,849 (79.9%) |
| 6 to 11 Years | 17,412 (80.4%) | 15,958 (78.8%) |
| 12 to 14 Years | 10,078 (83.5%) | 9,764 (86.4%) |
| 15 Years | 3,419 (90.3%) | 2,868 (89.1%) |
| 16 and 17 Years | 6,978 (85.2%) | 6,783 (84.5%) |
| 18 to 24 Years | 22,693 (84.5%) | 21,505 (80.0%) |
| 25 to 34 Years | 45,328 (90.4%) | 41,313 (84.4%) |
| 35 to 44 Years | 37,587 (89.6%) | 36,053 (87.6%) |
| 45 to 54 Years | 36,679 (91.5%) | 36,262 (88.4%) |
| 55 to 64 Years | 36,307 (88.6%) | 38,655 (89.1%) |
| 65 to 74 Years | 24,146 (88.9%) | 26,502 (86.4%) |
| 75 Years and over | 13,357 (86.0%) | 20,658 (83.7%) |
| Total | 271,242 (87.5%) | 273,189 (85.3%) |
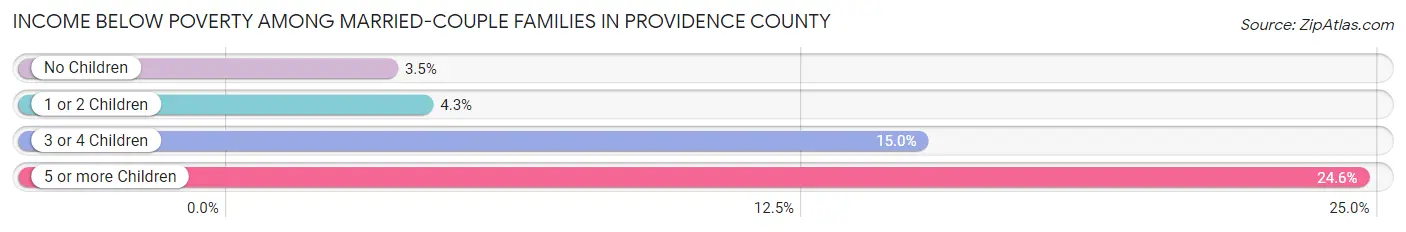
Income Below Poverty Among Married-Couple Families in Providence County
The poverty statistics for married-couple families in Providence County show that 4.5% or 4,487 of the total 100,319 families live below the poverty line. Families with 5 or more children have the highest poverty rate of 24.6%, comprising of 48 families. On the other hand, families with no children have the lowest poverty rate of 3.5%, which includes 2,051 families.
| Children | Above Poverty | Below Poverty |
| No Children | 56,929 (96.5%) | 2,051 (3.5%) |
| 1 or 2 Children | 33,705 (95.8%) | 1,495 (4.3%) |
| 3 or 4 Children | 5,051 (85.0%) | 893 (15.0%) |
| 5 or more Children | 147 (75.4%) | 48 (24.6%) |
| Total | 95,832 (95.5%) | 4,487 (4.5%) |
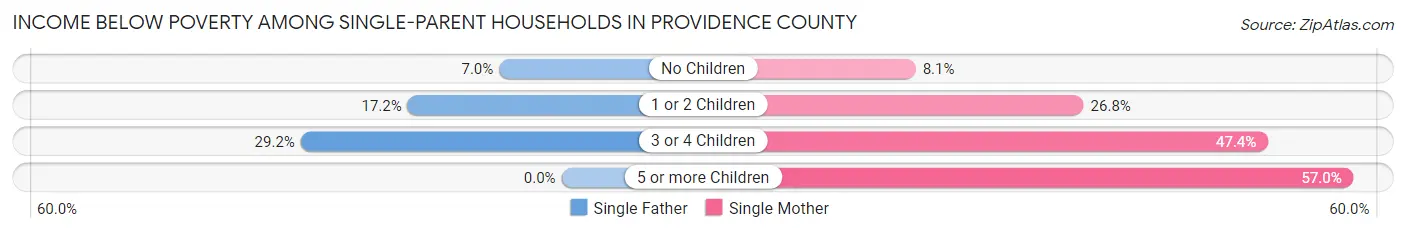
Income Below Poverty Among Single-Parent Households in Providence County
According to the poverty data in Providence County, 13.5% or 2,040 single-father households and 21.7% or 8,007 single-mother households are living below the poverty line. Among single-father households, those with 3 or 4 children have the highest poverty rate, with 372 households (29.1%) experiencing poverty. Likewise, among single-mother households, those with 5 or more children have the highest poverty rate, with 102 households (57.0%) falling below the poverty line.
| Children | Single Father | Single Mother |
| No Children | 482 (7.0%) | 1,179 (8.1%) |
| 1 or 2 Children | 1,186 (17.2%) | 4,919 (26.8%) |
| 3 or 4 Children | 372 (29.1%) | 1,807 (47.4%) |
| 5 or more Children | 0 (0.0%) | 102 (57.0%) |
| Total | 2,040 (13.5%) | 8,007 (21.7%) |
Income Below Poverty Among Married-Couple vs Single-Parent Households in Providence County
The poverty data for Providence County shows that 4,487 of the married-couple family households (4.5%) and 10,047 of the single-parent households (19.3%) are living below the poverty level. Within the married-couple family households, those with 5 or more children have the highest poverty rate, with 48 households (24.6%) falling below the poverty line. Among the single-parent households, those with 5 or more children have the highest poverty rate, with 102 household (57.0%) living below poverty.
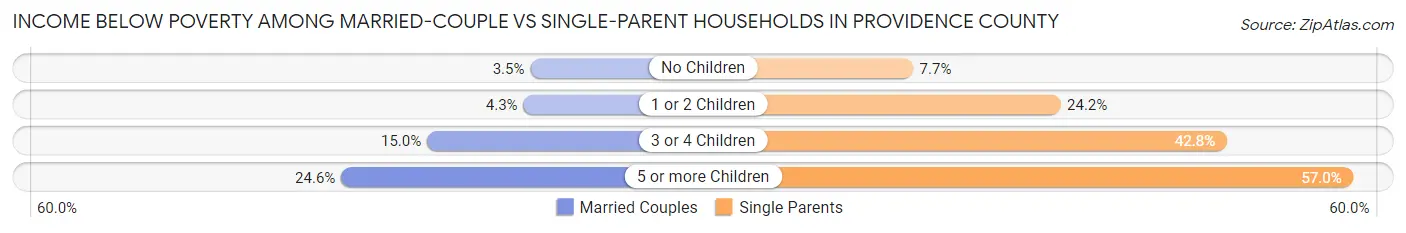
| Children | Married-Couple Families | Single-Parent Households |
| No Children | 2,051 (3.5%) | 1,661 (7.7%) |
| 1 or 2 Children | 1,495 (4.3%) | 6,105 (24.2%) |
| 3 or 4 Children | 893 (15.0%) | 2,179 (42.8%) |
| 5 or more Children | 48 (24.6%) | 102 (57.0%) |
| Total | 4,487 (4.5%) | 10,047 (19.3%) |
Employment Characteristics in Providence County
Employment by Class of Employer in Providence County
Among the 319,802 employed individuals in Providence County, private company employees (216,942 | 67.8%), not-for-profit organizations (40,179 | 12.6%), and local government employees (18,520 | 5.8%) make up the most common classes of employment.
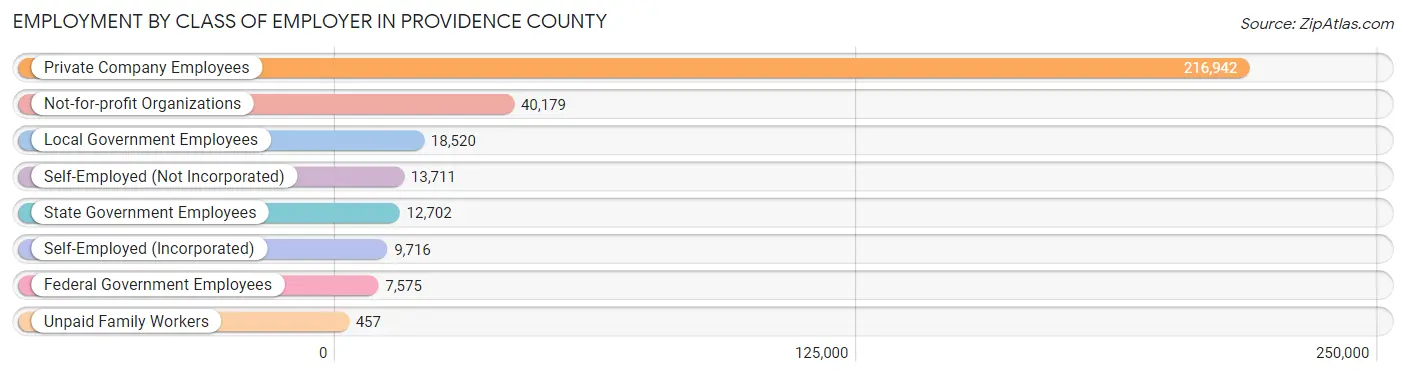
| Employer Class | # Employees | % Employees |
| Private Company Employees | 216,942 | 67.8% |
| Self-Employed (Incorporated) | 9,716 | 3.0% |
| Self-Employed (Not Incorporated) | 13,711 | 4.3% |
| Not-for-profit Organizations | 40,179 | 12.6% |
| Local Government Employees | 18,520 | 5.8% |
| State Government Employees | 12,702 | 4.0% |
| Federal Government Employees | 7,575 | 2.4% |
| Unpaid Family Workers | 457 | 0.1% |
| Total | 319,802 | 100.0% |
Employment Status by Age in Providence County
According to the labor force statistics for Providence County, out of the total population over 16 years of age (540,999), 65.1% or 352,190 individuals are in the labor force, with 6.3% or 22,188 of them unemployed. The age group with the highest labor force participation rate is 30 to 34 years, with 86.6% or 43,728 individuals in the labor force. Within the labor force, the 16 to 19 years age range has the highest percentage of unemployed individuals, with 15.5% or 2,524 of them being unemployed.
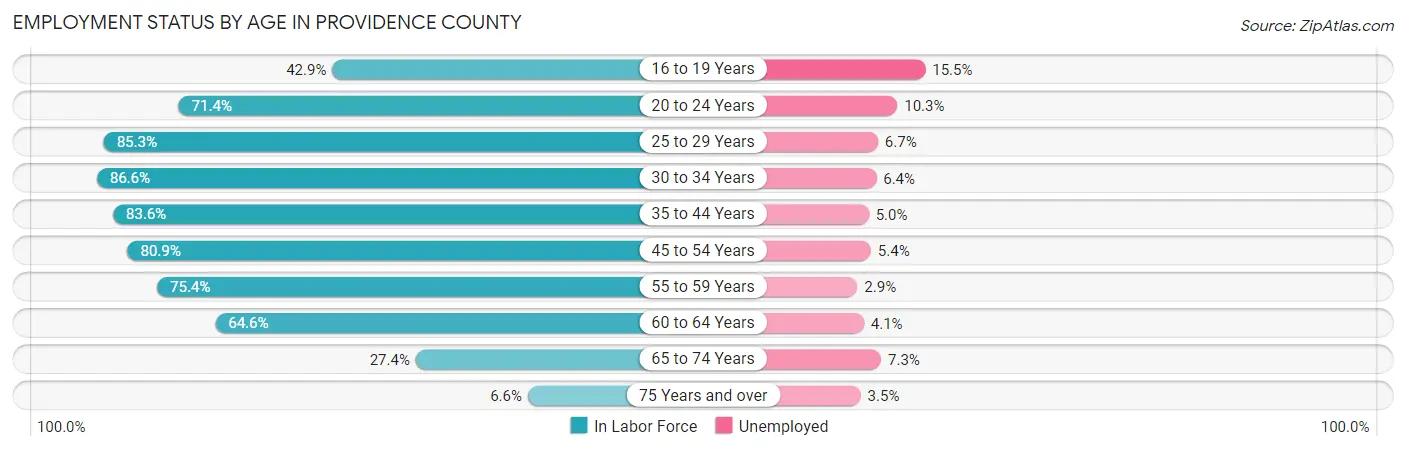
| Age Bracket | In Labor Force | Unemployed |
| 16 to 19 Years | 16,285 (42.9%) | 2,524 (15.5%) |
| 20 to 24 Years | 34,334 (71.4%) | 3,536 (10.3%) |
| 25 to 29 Years | 42,408 (85.3%) | 2,841 (6.7%) |
| 30 to 34 Years | 43,728 (86.6%) | 2,799 (6.4%) |
| 35 to 44 Years | 70,278 (83.6%) | 3,514 (5.0%) |
| 45 to 54 Years | 66,266 (80.9%) | 3,578 (5.4%) |
| 55 to 59 Years | 31,140 (75.4%) | 903 (2.9%) |
| 60 to 64 Years | 28,609 (64.6%) | 1,173 (4.1%) |
| 65 to 74 Years | 16,261 (27.4%) | 1,187 (7.3%) |
| 75 Years and over | 2,893 (6.6%) | 101 (3.5%) |
| Total | 352,190 (65.1%) | 22,188 (6.3%) |
Employment Status by Educational Attainment in Providence County
According to labor force statistics for Providence County, 80.3% of individuals (282,472) out of the total population between 25 and 64 years of age (351,771) are in the labor force, with 5.2% or 14,689 of them being unemployed. The group with the highest labor force participation rate are those with the educational attainment of bachelor's degree or higher, with 89.5% or 103,875 individuals in the labor force. Within the labor force, individuals with less than high school education have the highest percentage of unemployment, with 9.7% or 2,504 of them being unemployed.
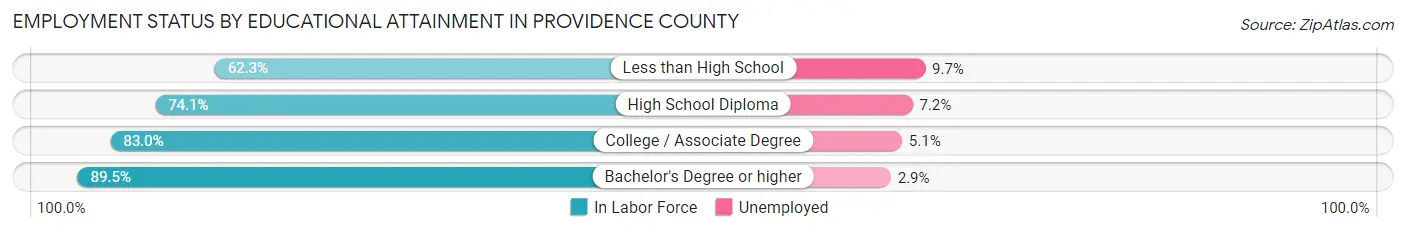
| Educational Attainment | In Labor Force | Unemployed |
| Less than High School | 25,818 (62.3%) | 4,020 (9.7%) |
| High School Diploma | 71,804 (74.1%) | 6,977 (7.2%) |
| College / Associate Degree | 80,814 (83.0%) | 4,966 (5.1%) |
| Bachelor's Degree or higher | 103,875 (89.5%) | 3,366 (2.9%) |
| Total | 282,472 (80.3%) | 18,292 (5.2%) |
Employment Occupations by Sex in Providence County
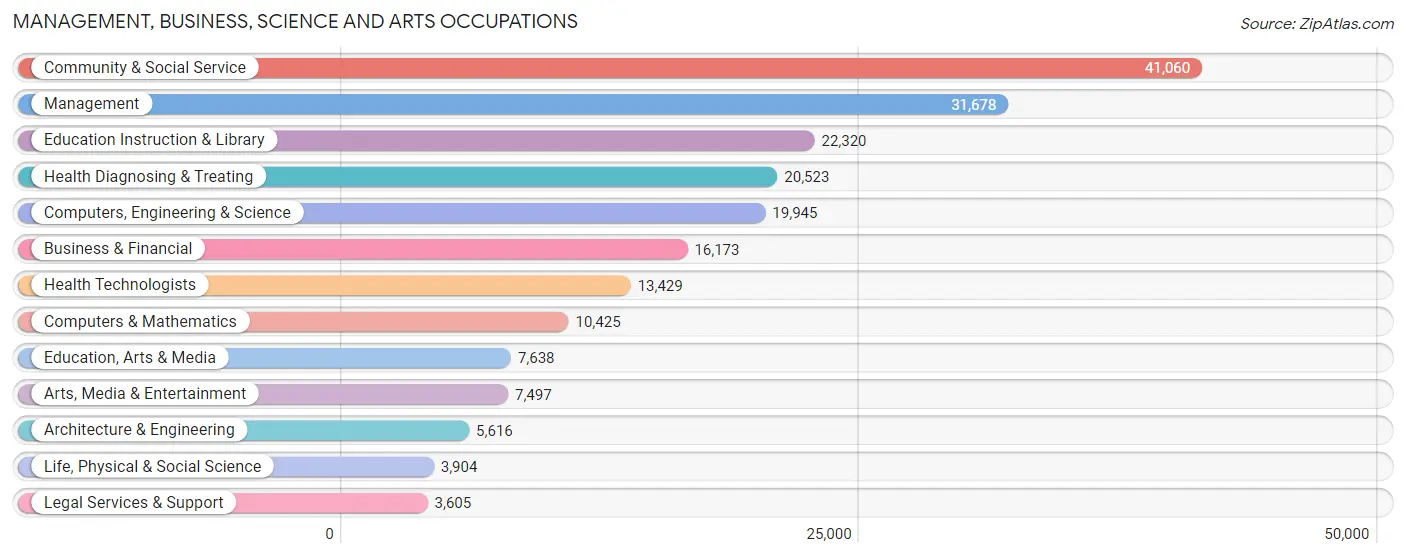
Management, Business, Science and Arts Occupations
The most common Management, Business, Science and Arts occupations in Providence County are Community & Social Service (41,060 | 12.5%), Management (31,678 | 9.6%), Education Instruction & Library (22,320 | 6.8%), Health Diagnosing & Treating (20,523 | 6.2%), and Computers, Engineering & Science (19,945 | 6.0%).
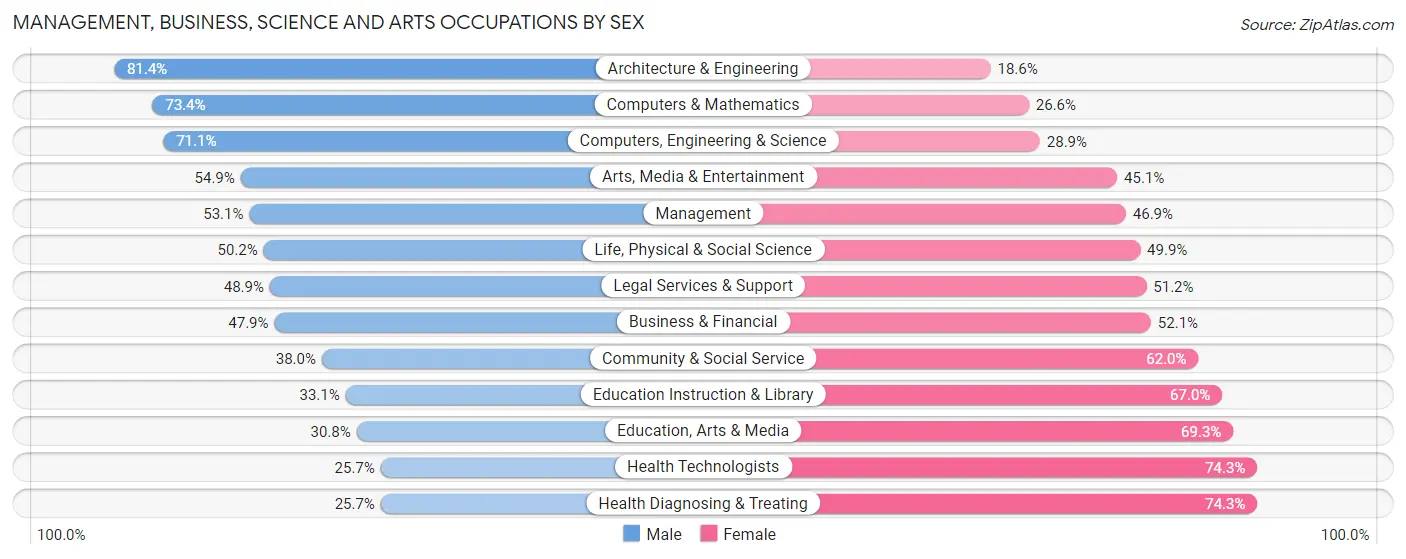
Management, Business, Science and Arts Occupations by Sex
Within the Management, Business, Science and Arts occupations in Providence County, the most male-oriented occupations are Architecture & Engineering (81.4%), Computers & Mathematics (73.4%), and Computers, Engineering & Science (71.1%), while the most female-oriented occupations are Health Diagnosing & Treating (74.3%), Health Technologists (74.3%), and Education, Arts & Media (69.3%).
| Occupation | Male | Female |
| Management | 16,829 (53.1%) | 14,849 (46.9%) |
| Business & Financial | 7,747 (47.9%) | 8,426 (52.1%) |
| Computers, Engineering & Science | 14,175 (71.1%) | 5,770 (28.9%) |
| Computers & Mathematics | 7,648 (73.4%) | 2,777 (26.6%) |
| Architecture & Engineering | 4,569 (81.4%) | 1,047 (18.6%) |
| Life, Physical & Social Science | 1,958 (50.1%) | 1,946 (49.8%) |
| Community & Social Service | 15,605 (38.0%) | 25,455 (62.0%) |
| Education, Arts & Media | 2,349 (30.7%) | 5,289 (69.3%) |
| Legal Services & Support | 1,761 (48.8%) | 1,844 (51.1%) |
| Education Instruction & Library | 7,376 (33.1%) | 14,944 (66.9%) |
| Arts, Media & Entertainment | 4,119 (54.9%) | 3,378 (45.1%) |
| Health Diagnosing & Treating | 5,279 (25.7%) | 15,244 (74.3%) |
| Health Technologists | 3,455 (25.7%) | 9,974 (74.3%) |
| Total (Category) | 59,635 (46.1%) | 69,744 (53.9%) |
| Total (Overall) | 168,473 (51.1%) | 161,063 (48.9%) |
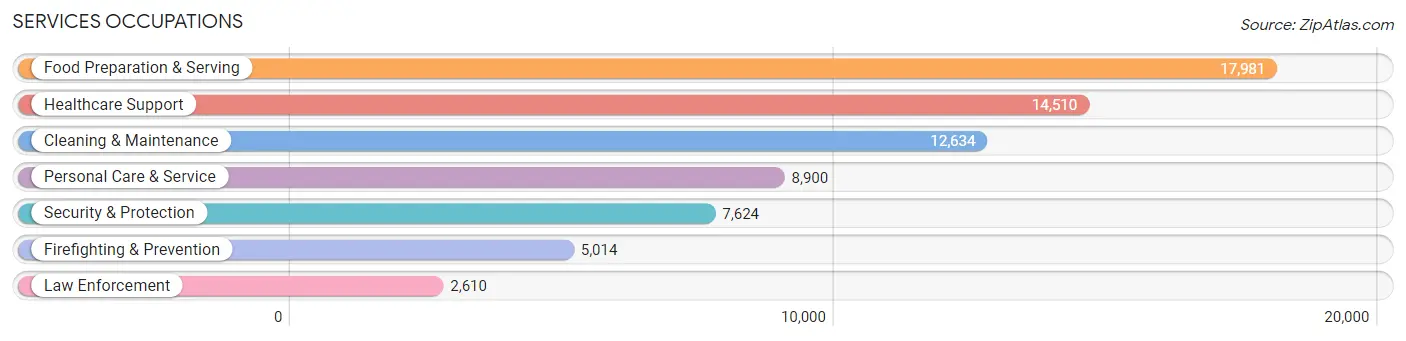
Services Occupations
The most common Services occupations in Providence County are Food Preparation & Serving (17,981 | 5.5%), Healthcare Support (14,510 | 4.4%), Cleaning & Maintenance (12,634 | 3.8%), Personal Care & Service (8,900 | 2.7%), and Security & Protection (7,624 | 2.3%).
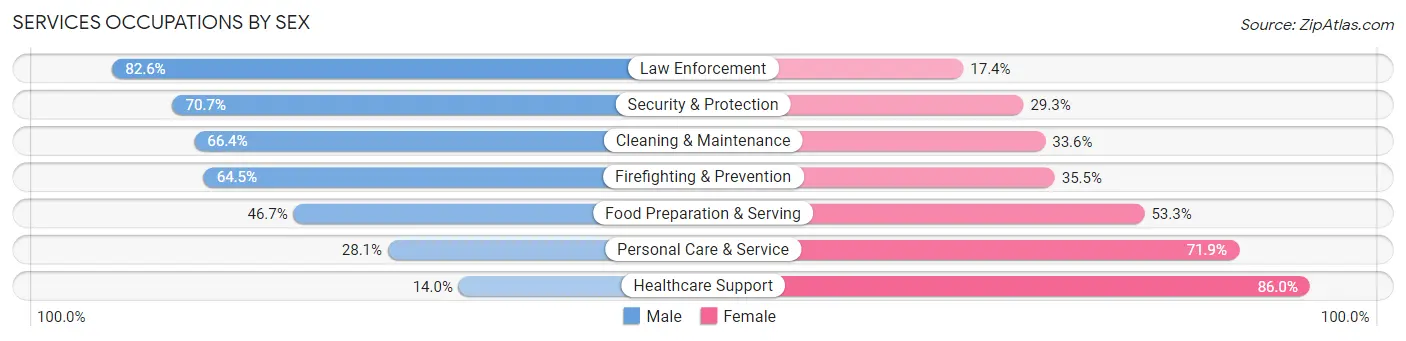
Services Occupations by Sex
Within the Services occupations in Providence County, the most male-oriented occupations are Law Enforcement (82.6%), Security & Protection (70.7%), and Cleaning & Maintenance (66.4%), while the most female-oriented occupations are Healthcare Support (86.0%), Personal Care & Service (71.9%), and Food Preparation & Serving (53.3%).
| Occupation | Male | Female |
| Healthcare Support | 2,036 (14.0%) | 12,474 (86.0%) |
| Security & Protection | 5,390 (70.7%) | 2,234 (29.3%) |
| Firefighting & Prevention | 3,234 (64.5%) | 1,780 (35.5%) |
| Law Enforcement | 2,156 (82.6%) | 454 (17.4%) |
| Food Preparation & Serving | 8,405 (46.7%) | 9,576 (53.3%) |
| Cleaning & Maintenance | 8,387 (66.4%) | 4,247 (33.6%) |
| Personal Care & Service | 2,498 (28.1%) | 6,402 (71.9%) |
| Total (Category) | 26,716 (43.3%) | 34,933 (56.7%) |
| Total (Overall) | 168,473 (51.1%) | 161,063 (48.9%) |
Sales and Office Occupations
The most common Sales and Office occupations in Providence County are Office & Administration (38,569 | 11.7%), and Sales & Related (30,085 | 9.1%).
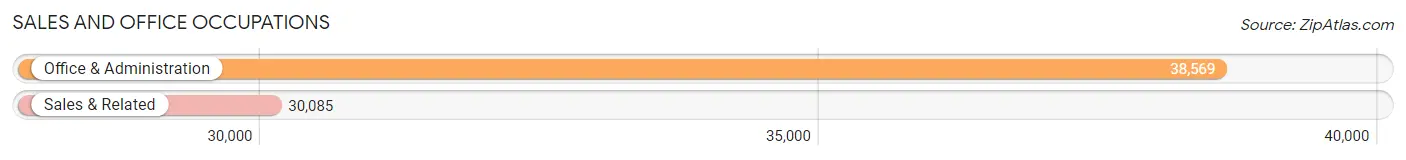
Sales and Office Occupations by Sex

| Occupation | Male | Female |
| Sales & Related | 14,899 (49.5%) | 15,186 (50.5%) |
| Office & Administration | 10,505 (27.2%) | 28,064 (72.8%) |
| Total (Category) | 25,404 (37.0%) | 43,250 (63.0%) |
| Total (Overall) | 168,473 (51.1%) | 161,063 (48.9%) |
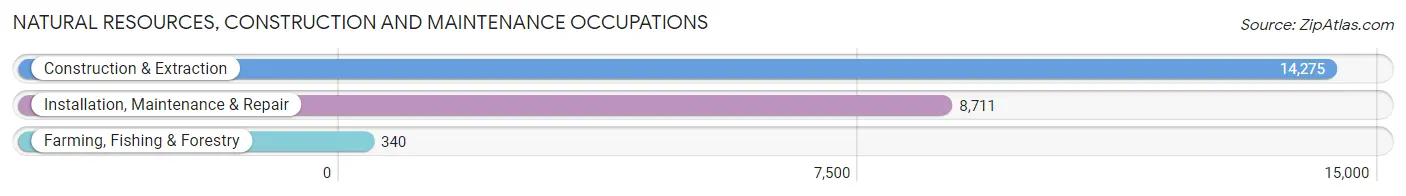
Natural Resources, Construction and Maintenance Occupations
The most common Natural Resources, Construction and Maintenance occupations in Providence County are Construction & Extraction (14,275 | 4.3%), Installation, Maintenance & Repair (8,711 | 2.6%), and Farming, Fishing & Forestry (340 | 0.1%).
Natural Resources, Construction and Maintenance Occupations by Sex
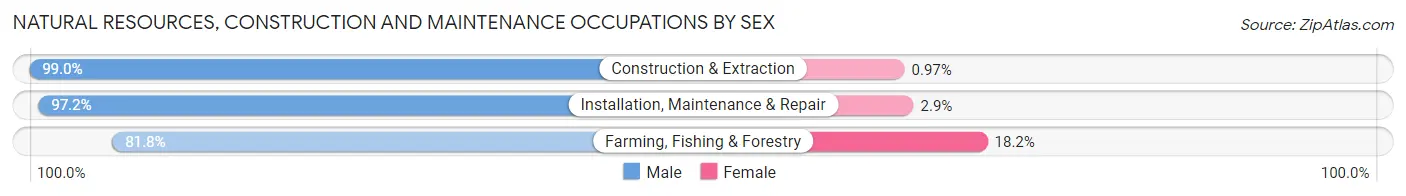
| Occupation | Male | Female |
| Farming, Fishing & Forestry | 278 (81.8%) | 62 (18.2%) |
| Construction & Extraction | 14,136 (99.0%) | 139 (1.0%) |
| Installation, Maintenance & Repair | 8,463 (97.2%) | 248 (2.9%) |
| Total (Category) | 22,877 (98.1%) | 449 (1.9%) |
| Total (Overall) | 168,473 (51.1%) | 161,063 (48.9%) |
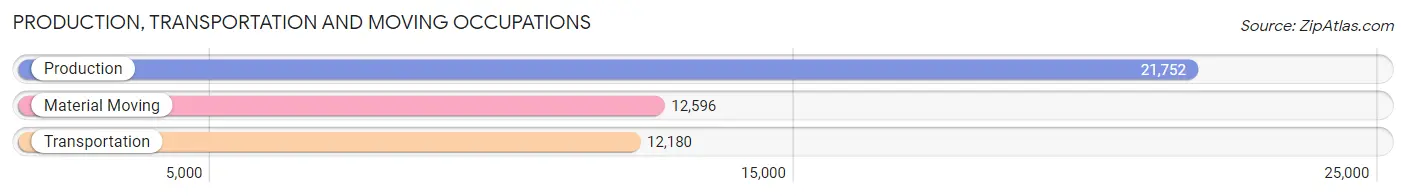
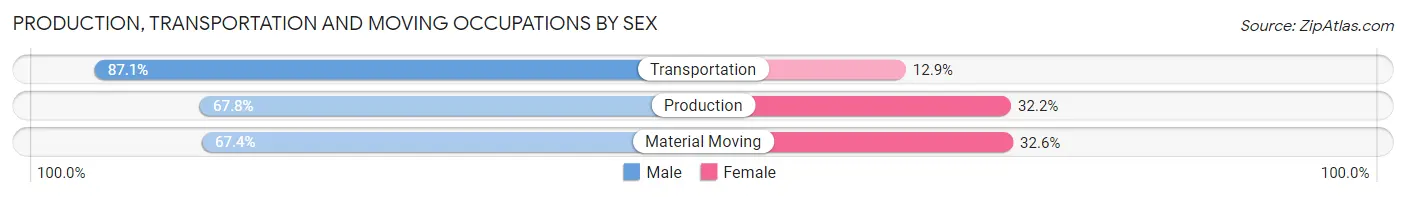
Production, Transportation and Moving Occupations
The most common Production, Transportation and Moving occupations in Providence County are Production (21,752 | 6.6%), Material Moving (12,596 | 3.8%), and Transportation (12,180 | 3.7%).
Production, Transportation and Moving Occupations by Sex
| Occupation | Male | Female |
| Production | 14,743 (67.8%) | 7,009 (32.2%) |
| Transportation | 10,607 (87.1%) | 1,573 (12.9%) |
| Material Moving | 8,491 (67.4%) | 4,105 (32.6%) |
| Total (Category) | 33,841 (72.7%) | 12,687 (27.3%) |
| Total (Overall) | 168,473 (51.1%) | 161,063 (48.9%) |
Employment Industries by Sex in Providence County
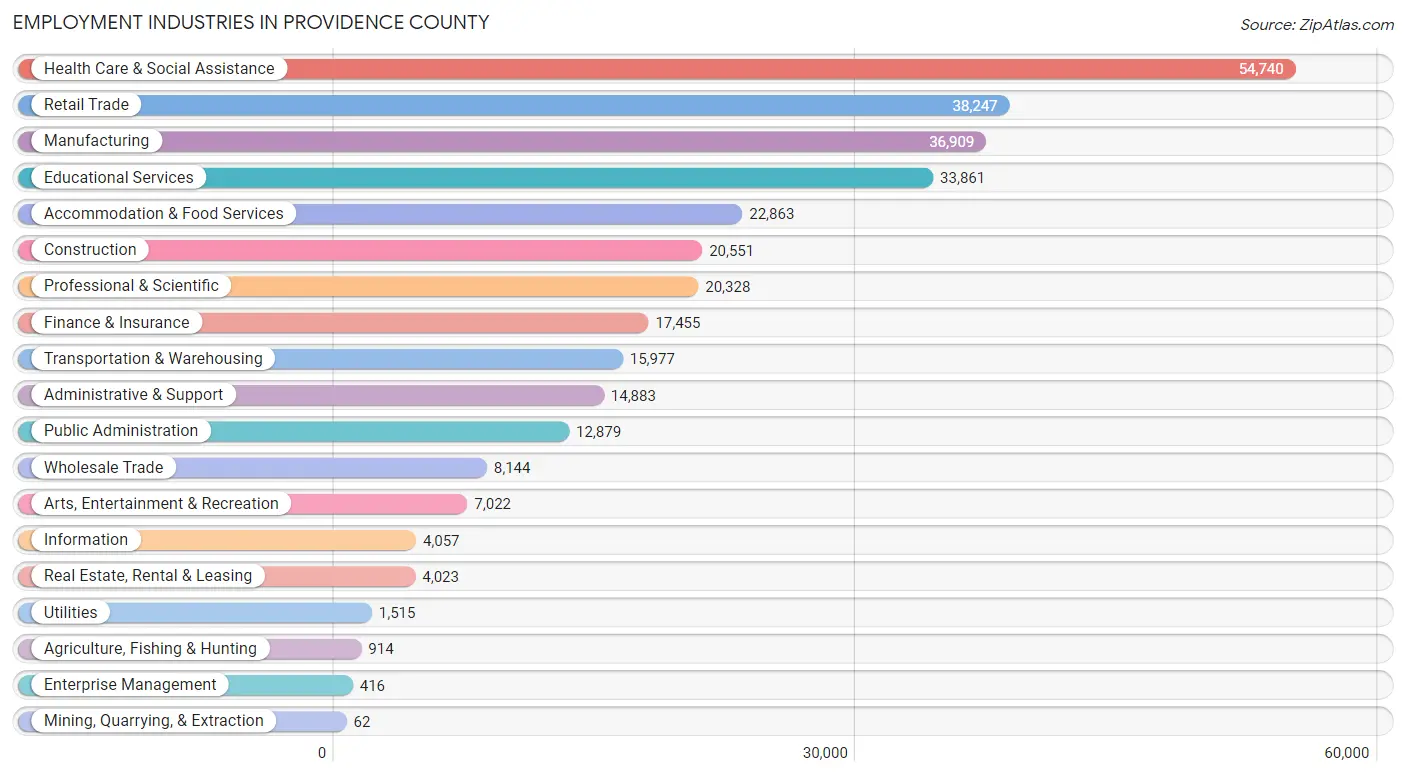
Employment Industries in Providence County
The major employment industries in Providence County include Health Care & Social Assistance (54,740 | 16.6%), Retail Trade (38,247 | 11.6%), Manufacturing (36,909 | 11.2%), Educational Services (33,861 | 10.3%), and Accommodation & Food Services (22,863 | 6.9%).
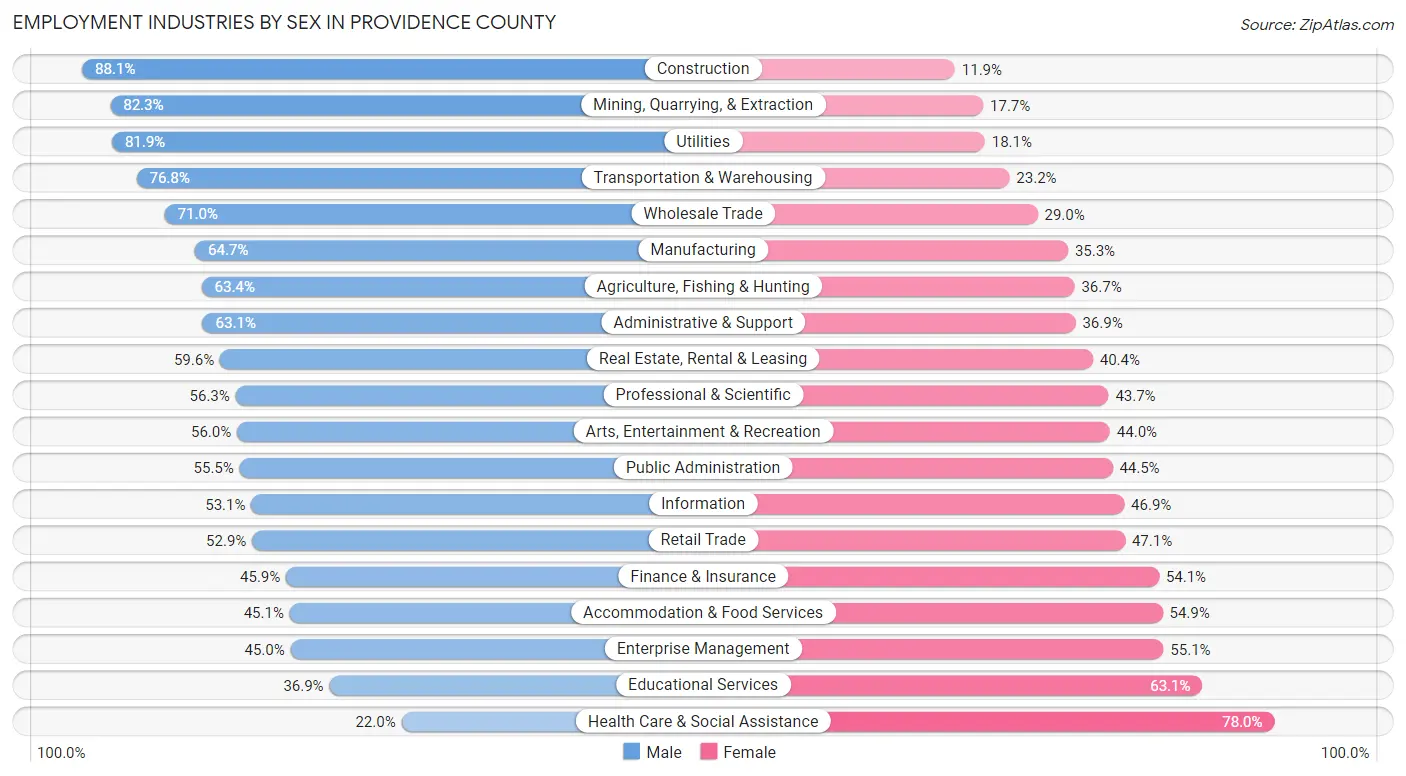
Employment Industries by Sex in Providence County
The Providence County industries that see more men than women are Construction (88.1%), Mining, Quarrying, & Extraction (82.3%), and Utilities (81.9%), whereas the industries that tend to have a higher number of women are Health Care & Social Assistance (78.0%), Educational Services (63.1%), and Enterprise Management (55.0%).
| Industry | Male | Female |
| Agriculture, Fishing & Hunting | 579 (63.3%) | 335 (36.6%) |
| Mining, Quarrying, & Extraction | 51 (82.3%) | 11 (17.7%) |
| Construction | 18,108 (88.1%) | 2,443 (11.9%) |
| Manufacturing | 23,880 (64.7%) | 13,029 (35.3%) |
| Wholesale Trade | 5,782 (71.0%) | 2,362 (29.0%) |
| Retail Trade | 20,234 (52.9%) | 18,013 (47.1%) |
| Transportation & Warehousing | 12,274 (76.8%) | 3,703 (23.2%) |
| Utilities | 1,241 (81.9%) | 274 (18.1%) |
| Information | 2,153 (53.1%) | 1,904 (46.9%) |
| Finance & Insurance | 8,007 (45.9%) | 9,448 (54.1%) |
| Real Estate, Rental & Leasing | 2,396 (59.6%) | 1,627 (40.4%) |
| Professional & Scientific | 11,449 (56.3%) | 8,879 (43.7%) |
| Enterprise Management | 187 (45.0%) | 229 (55.0%) |
| Administrative & Support | 9,397 (63.1%) | 5,486 (36.9%) |
| Educational Services | 12,495 (36.9%) | 21,366 (63.1%) |
| Health Care & Social Assistance | 12,035 (22.0%) | 42,705 (78.0%) |
| Arts, Entertainment & Recreation | 3,934 (56.0%) | 3,088 (44.0%) |
| Accommodation & Food Services | 10,315 (45.1%) | 12,548 (54.9%) |
| Public Administration | 7,146 (55.5%) | 5,733 (44.5%) |
| Total | 168,473 (51.1%) | 161,063 (48.9%) |
Education in Providence County
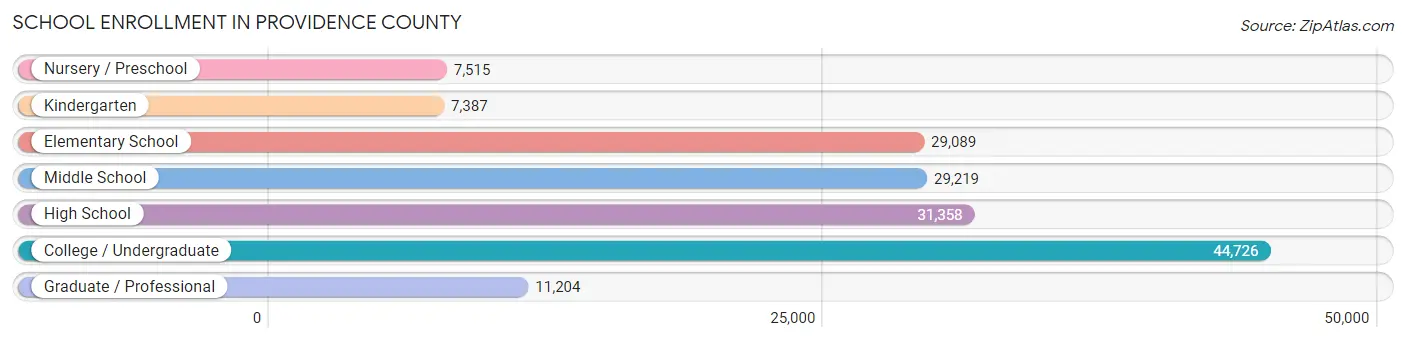
School Enrollment in Providence County
The most common levels of schooling among the 160,498 students in Providence County are college / undergraduate (44,726 | 27.9%), high school (31,358 | 19.5%), and middle school (29,219 | 18.2%).
| School Level | # Students | % Students |
| Nursery / Preschool | 7,515 | 4.7% |
| Kindergarten | 7,387 | 4.6% |
| Elementary School | 29,089 | 18.1% |
| Middle School | 29,219 | 18.2% |
| High School | 31,358 | 19.5% |
| College / Undergraduate | 44,726 | 27.9% |
| Graduate / Professional | 11,204 | 7.0% |
| Total | 160,498 | 100.0% |
School Enrollment by Age by Funding Source in Providence County
Out of a total of 160,498 students who are enrolled in schools in Providence County, 44,618 (27.8%) attend a private institution, while the remaining 115,880 (72.2%) are enrolled in public schools. The age group of 18 to 19 year olds has the highest likelihood of being enrolled in private schools, with 9,437 (53.0% in the age bracket) enrolled. Conversely, the age group of 15 to 17 year olds has the lowest likelihood of being enrolled in a private school, with 19,754 (87.5% in the age bracket) attending a public institution.
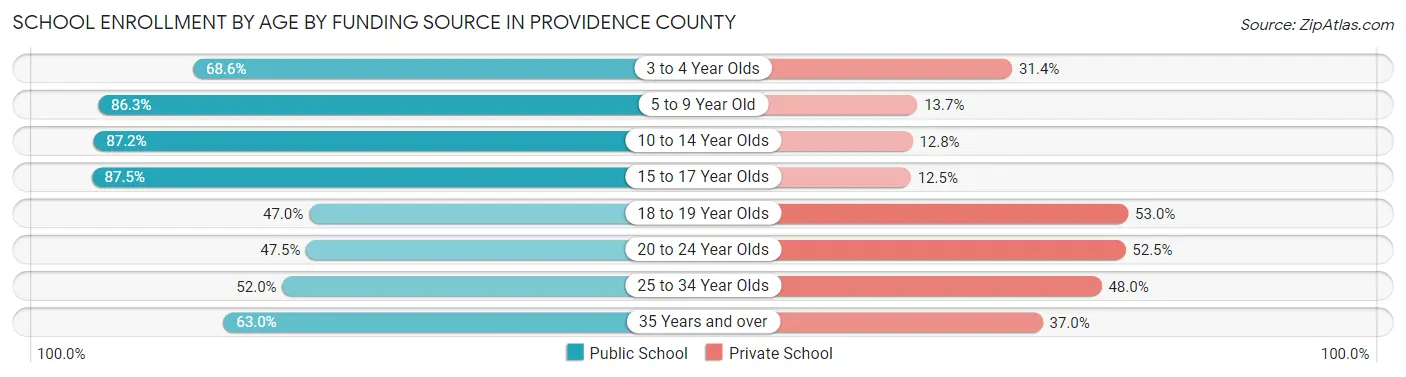
| Age Bracket | Public School | Private School |
| 3 to 4 Year Olds | 4,329 (68.6%) | 1,980 (31.4%) |
| 5 to 9 Year Old | 28,648 (86.3%) | 4,549 (13.7%) |
| 10 to 14 Year Olds | 32,259 (87.2%) | 4,739 (12.8%) |
| 15 to 17 Year Olds | 19,754 (87.5%) | 2,819 (12.5%) |
| 18 to 19 Year Olds | 8,372 (47.0%) | 9,437 (53.0%) |
| 20 to 24 Year Olds | 11,415 (47.5%) | 12,600 (52.5%) |
| 25 to 34 Year Olds | 6,044 (52.0%) | 5,584 (48.0%) |
| 35 Years and over | 5,017 (63.0%) | 2,952 (37.0%) |
| Total | 115,880 (72.2%) | 44,618 (27.8%) |
Educational Attainment by Field of Study in Providence County
Business (28,641 | 18.5%), education (15,658 | 10.1%), science & technology (14,747 | 9.5%), social sciences (11,701 | 7.5%), and psychology (10,925 | 7.0%) are the most common fields of study among 154,951 individuals in Providence County who have obtained a bachelor's degree or higher.
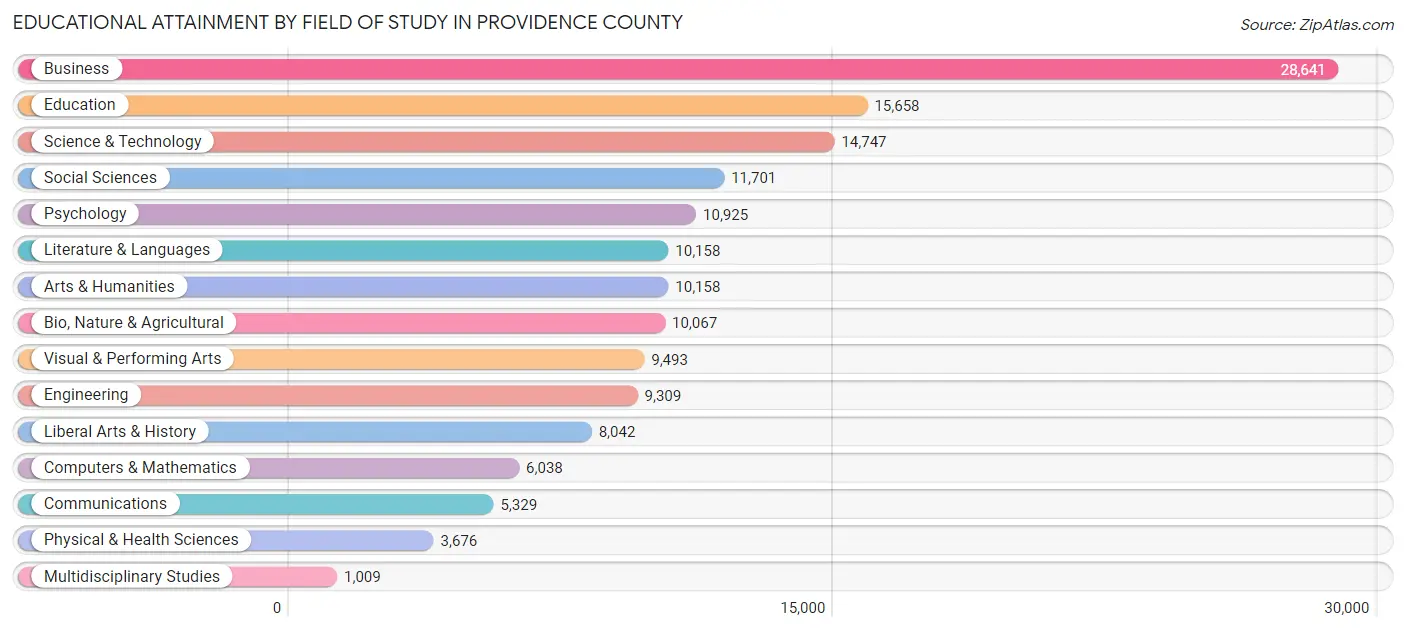
| Field of Study | # Graduates | % Graduates |
| Computers & Mathematics | 6,038 | 3.9% |
| Bio, Nature & Agricultural | 10,067 | 6.5% |
| Physical & Health Sciences | 3,676 | 2.4% |
| Psychology | 10,925 | 7.0% |
| Social Sciences | 11,701 | 7.5% |
| Engineering | 9,309 | 6.0% |
| Multidisciplinary Studies | 1,009 | 0.6% |
| Science & Technology | 14,747 | 9.5% |
| Business | 28,641 | 18.5% |
| Education | 15,658 | 10.1% |
| Literature & Languages | 10,158 | 6.6% |
| Liberal Arts & History | 8,042 | 5.2% |
| Visual & Performing Arts | 9,493 | 6.1% |
| Communications | 5,329 | 3.4% |
| Arts & Humanities | 10,158 | 6.6% |
| Total | 154,951 | 100.0% |
Transportation & Commute in Providence County
Vehicle Availability by Sex in Providence County
The most prevalent vehicle ownership categories in Providence County are males with 2 vehicles (70,744, accounting for 43.5%) and females with 2 vehicles (65,414, making up 46.6%).
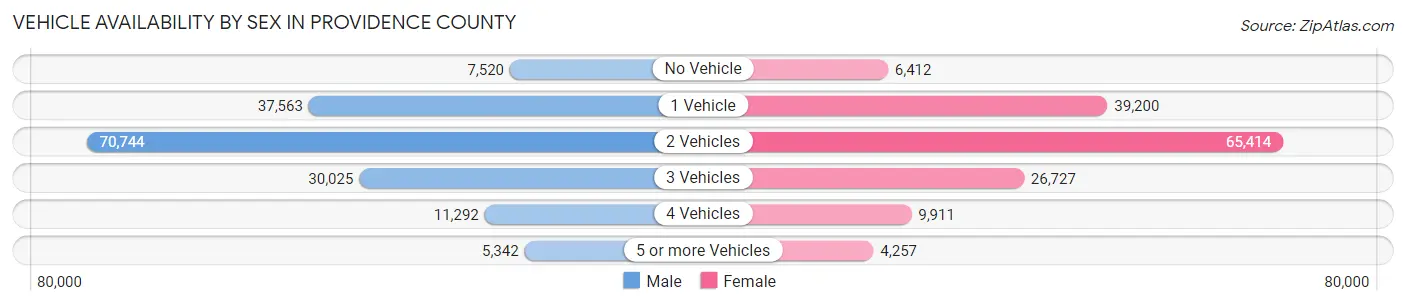
| Vehicles Available | Male | Female |
| No Vehicle | 7,520 (4.6%) | 6,412 (4.2%) |
| 1 Vehicle | 37,563 (23.1%) | 39,200 (25.8%) |
| 2 Vehicles | 70,744 (43.5%) | 65,414 (43.1%) |
| 3 Vehicles | 30,025 (18.5%) | 26,727 (17.6%) |
| 4 Vehicles | 11,292 (7.0%) | 9,911 (6.5%) |
| 5 or more Vehicles | 5,342 (3.3%) | 4,257 (2.8%) |
| Total | 162,486 (100.0%) | 151,921 (100.0%) |
Commute Time in Providence County
The most frequently occuring commute durations in Providence County are 15 to 19 minutes (51,815 commuters, 17.8%), 20 to 24 minutes (49,135 commuters, 16.9%), and 10 to 14 minutes (43,962 commuters, 15.1%).
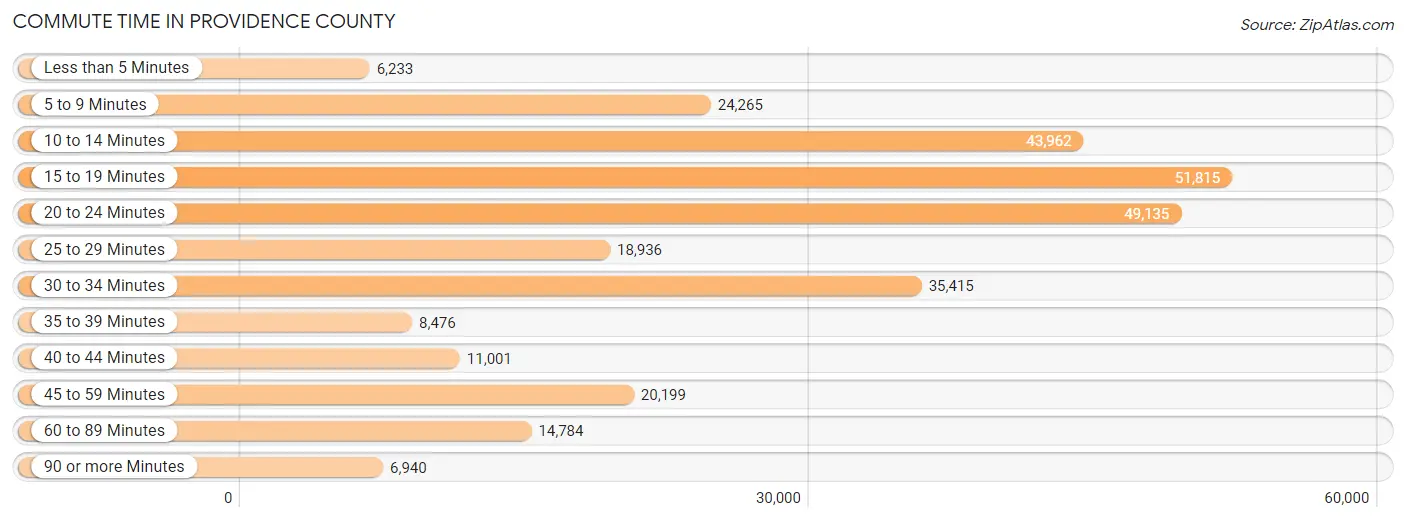
| Commute Time | # Commuters | % Commuters |
| Less than 5 Minutes | 6,233 | 2.1% |
| 5 to 9 Minutes | 24,265 | 8.3% |
| 10 to 14 Minutes | 43,962 | 15.1% |
| 15 to 19 Minutes | 51,815 | 17.8% |
| 20 to 24 Minutes | 49,135 | 16.9% |
| 25 to 29 Minutes | 18,936 | 6.5% |
| 30 to 34 Minutes | 35,415 | 12.2% |
| 35 to 39 Minutes | 8,476 | 2.9% |
| 40 to 44 Minutes | 11,001 | 3.8% |
| 45 to 59 Minutes | 20,199 | 6.9% |
| 60 to 89 Minutes | 14,784 | 5.1% |
| 90 or more Minutes | 6,940 | 2.4% |
Commute Time by Sex in Providence County
The most common commute times in Providence County are 20 to 24 minutes (23,715 commuters, 15.7%) for males and 15 to 19 minutes (28,515 commuters, 20.3%) for females.
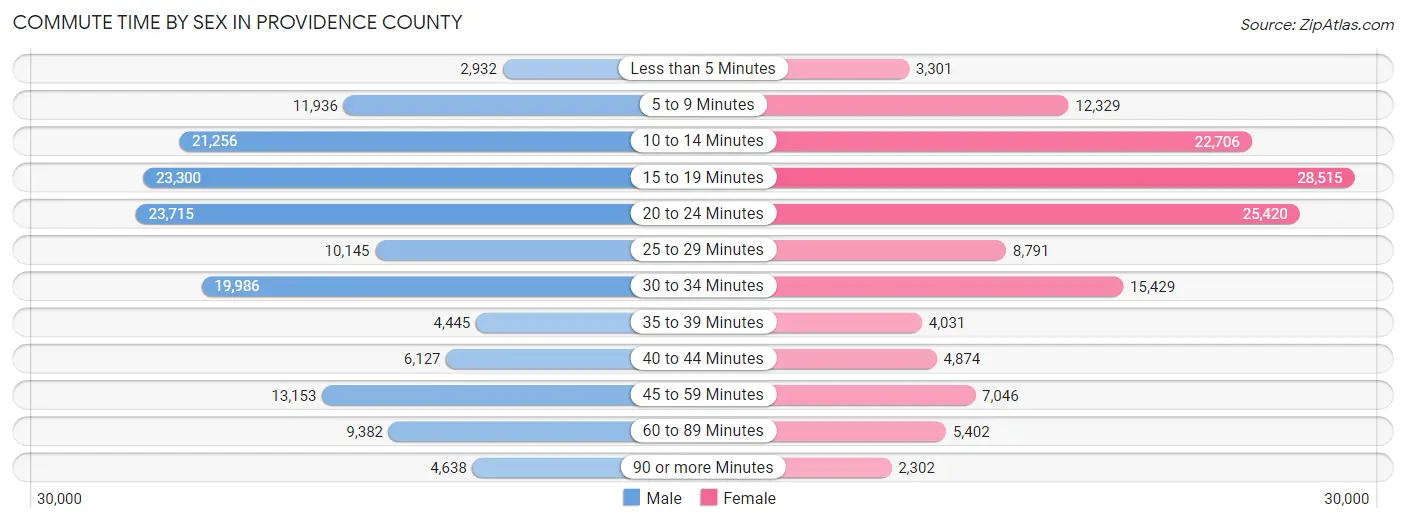
| Commute Time | Male | Female |
| Less than 5 Minutes | 2,932 (1.9%) | 3,301 (2.4%) |
| 5 to 9 Minutes | 11,936 (7.9%) | 12,329 (8.8%) |
| 10 to 14 Minutes | 21,256 (14.1%) | 22,706 (16.2%) |
| 15 to 19 Minutes | 23,300 (15.4%) | 28,515 (20.3%) |
| 20 to 24 Minutes | 23,715 (15.7%) | 25,420 (18.1%) |
| 25 to 29 Minutes | 10,145 (6.7%) | 8,791 (6.3%) |
| 30 to 34 Minutes | 19,986 (13.2%) | 15,429 (11.0%) |
| 35 to 39 Minutes | 4,445 (2.9%) | 4,031 (2.9%) |
| 40 to 44 Minutes | 6,127 (4.1%) | 4,874 (3.5%) |
| 45 to 59 Minutes | 13,153 (8.7%) | 7,046 (5.0%) |
| 60 to 89 Minutes | 9,382 (6.2%) | 5,402 (3.8%) |
| 90 or more Minutes | 4,638 (3.1%) | 2,302 (1.6%) |
Time of Departure to Work by Sex in Providence County
The most frequent times of departure to work in Providence County are 7:00 AM to 7:29 AM (22,108, 14.6%) for males and 8:00 AM to 8:29 AM (21,783, 15.5%) for females.
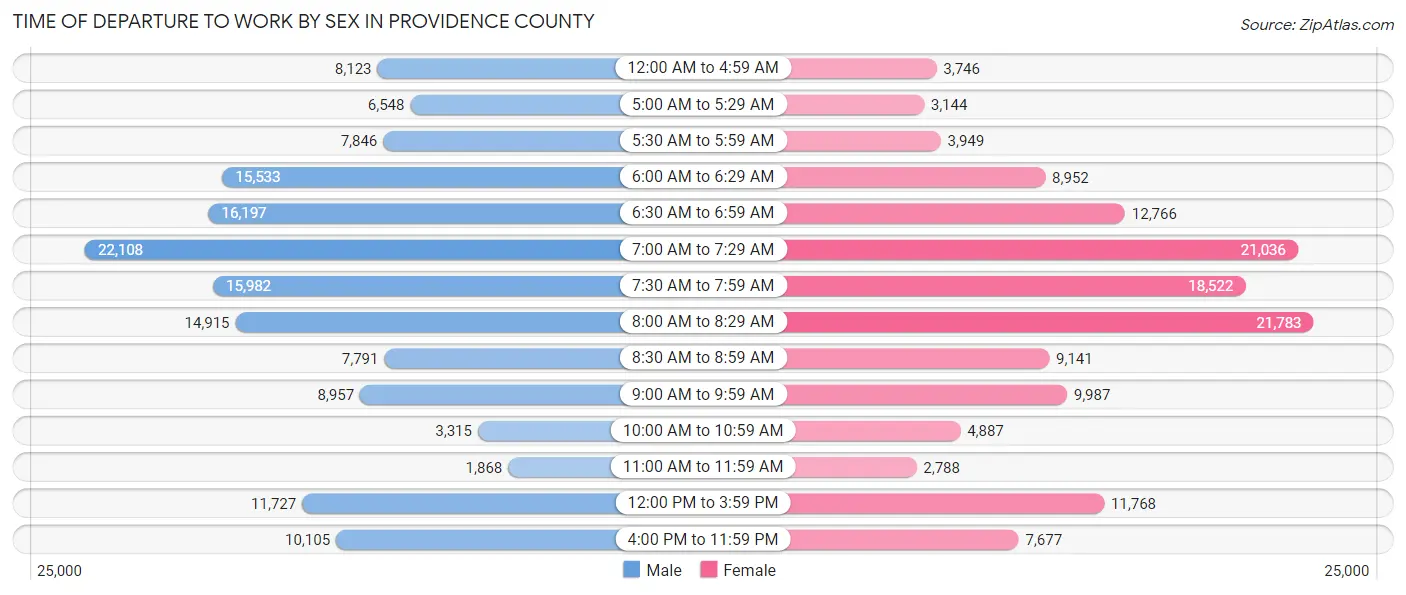
| Time of Departure | Male | Female |
| 12:00 AM to 4:59 AM | 8,123 (5.4%) | 3,746 (2.7%) |
| 5:00 AM to 5:29 AM | 6,548 (4.3%) | 3,144 (2.2%) |
| 5:30 AM to 5:59 AM | 7,846 (5.2%) | 3,949 (2.8%) |
| 6:00 AM to 6:29 AM | 15,533 (10.3%) | 8,952 (6.4%) |
| 6:30 AM to 6:59 AM | 16,197 (10.7%) | 12,766 (9.1%) |
| 7:00 AM to 7:29 AM | 22,108 (14.6%) | 21,036 (15.0%) |
| 7:30 AM to 7:59 AM | 15,982 (10.6%) | 18,522 (13.2%) |
| 8:00 AM to 8:29 AM | 14,915 (9.9%) | 21,783 (15.5%) |
| 8:30 AM to 8:59 AM | 7,791 (5.2%) | 9,141 (6.5%) |
| 9:00 AM to 9:59 AM | 8,957 (5.9%) | 9,987 (7.1%) |
| 10:00 AM to 10:59 AM | 3,315 (2.2%) | 4,887 (3.5%) |
| 11:00 AM to 11:59 AM | 1,868 (1.2%) | 2,788 (2.0%) |
| 12:00 PM to 3:59 PM | 11,727 (7.8%) | 11,768 (8.4%) |
| 4:00 PM to 11:59 PM | 10,105 (6.7%) | 7,677 (5.5%) |
| Total | 151,015 (100.0%) | 140,146 (100.0%) |
Housing Occupancy in Providence County
Occupancy by Ownership in Providence County
Of the total 253,635 dwellings in Providence County, owner-occupied units account for 141,473 (55.8%), while renter-occupied units make up 112,162 (44.2%).
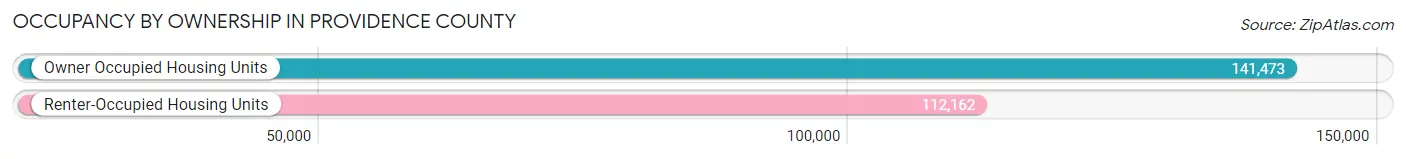
| Occupancy | # Housing Units | % Housing Units |
| Owner Occupied Housing Units | 141,473 | 55.8% |
| Renter-Occupied Housing Units | 112,162 | 44.2% |
| Total Occupied Housing Units | 253,635 | 100.0% |
Occupancy by Household Size in Providence County
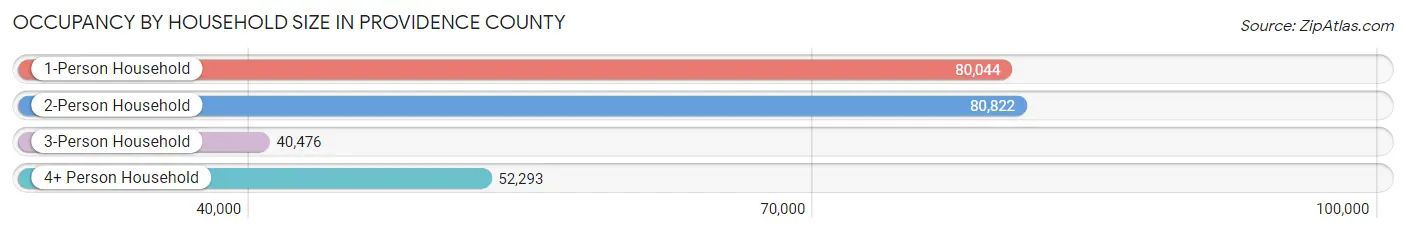
| Household Size | # Housing Units | % Housing Units |
| 1-Person Household | 80,044 | 31.6% |
| 2-Person Household | 80,822 | 31.9% |
| 3-Person Household | 40,476 | 16.0% |
| 4+ Person Household | 52,293 | 20.6% |
| Total Housing Units | 253,635 | 100.0% |
Occupancy by Ownership by Household Size in Providence County
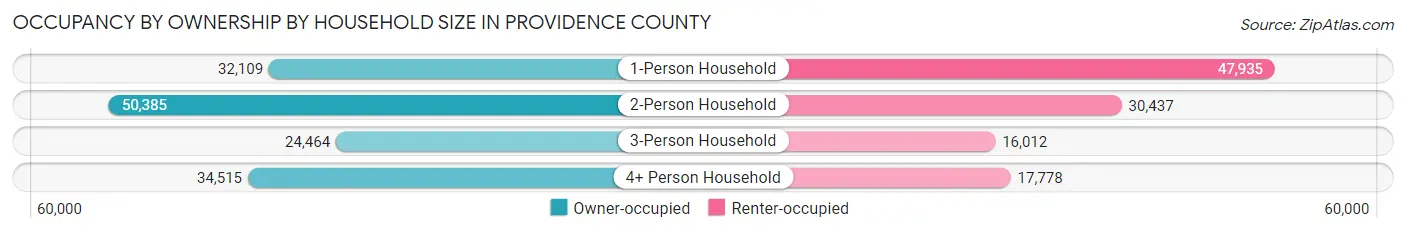
| Household Size | Owner-occupied | Renter-occupied |
| 1-Person Household | 32,109 (40.1%) | 47,935 (59.9%) |
| 2-Person Household | 50,385 (62.3%) | 30,437 (37.7%) |
| 3-Person Household | 24,464 (60.4%) | 16,012 (39.6%) |
| 4+ Person Household | 34,515 (66.0%) | 17,778 (34.0%) |
| Total Housing Units | 141,473 (55.8%) | 112,162 (44.2%) |
Occupancy by Educational Attainment in Providence County
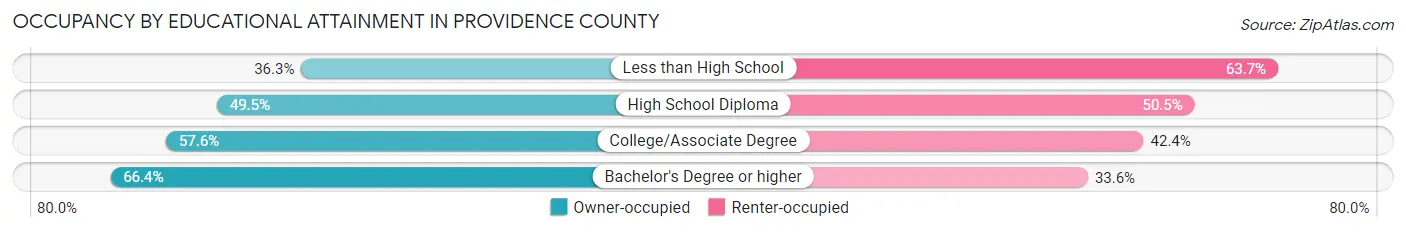
| Household Size | Owner-occupied | Renter-occupied |
| Less than High School | 11,349 (36.3%) | 19,931 (63.7%) |
| High School Diploma | 33,929 (49.5%) | 34,605 (50.5%) |
| College/Associate Degree | 38,861 (57.6%) | 28,627 (42.4%) |
| Bachelor's Degree or higher | 57,334 (66.4%) | 28,999 (33.6%) |
Occupancy by Age of Householder in Providence County
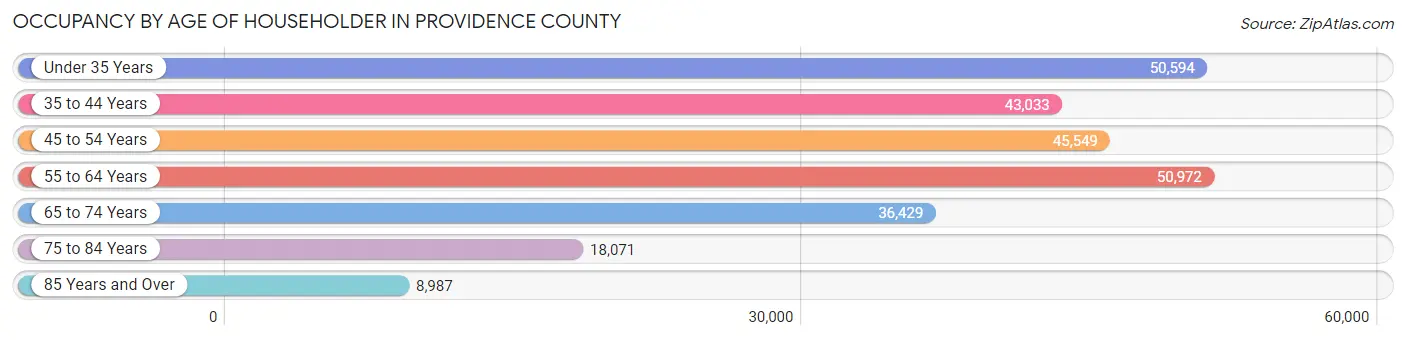
| Age Bracket | # Households | % Households |
| Under 35 Years | 50,594 | 20.0% |
| 35 to 44 Years | 43,033 | 17.0% |
| 45 to 54 Years | 45,549 | 18.0% |
| 55 to 64 Years | 50,972 | 20.1% |
| 65 to 74 Years | 36,429 | 14.4% |
| 75 to 84 Years | 18,071 | 7.1% |
| 85 Years and Over | 8,987 | 3.5% |
| Total | 253,635 | 100.0% |
Housing Finances in Providence County
Median Income by Occupancy in Providence County
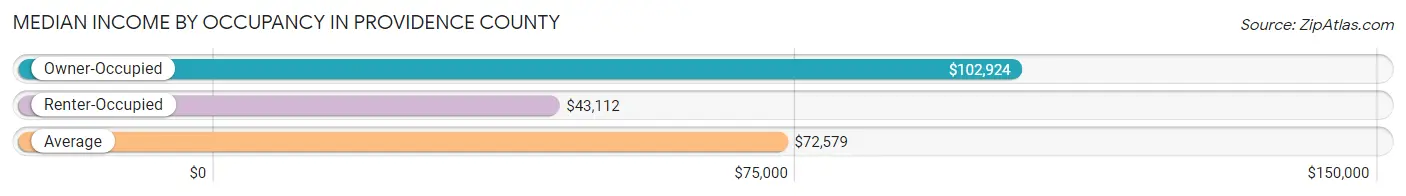
| Occupancy Type | # Households | Median Income |
| Owner-Occupied | 141,473 (55.8%) | $102,924 |
| Renter-Occupied | 112,162 (44.2%) | $43,112 |
| Average | 253,635 (100.0%) | $72,579 |
Occupancy by Householder Income Bracket in Providence County
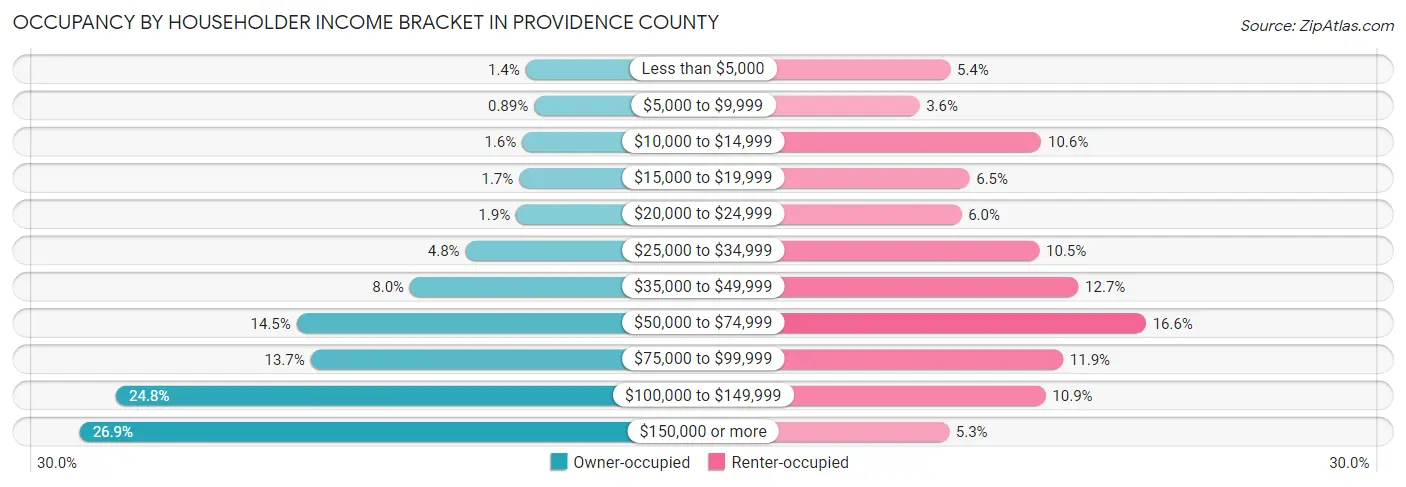
| Income Bracket | Owner-occupied | Renter-occupied |
| Less than $5,000 | 1,932 (1.4%) | 6,060 (5.4%) |
| $5,000 to $9,999 | 1,254 (0.9%) | 4,084 (3.6%) |
| $10,000 to $14,999 | 2,215 (1.6%) | 11,884 (10.6%) |
| $15,000 to $19,999 | 2,464 (1.7%) | 7,285 (6.5%) |
| $20,000 to $24,999 | 2,717 (1.9%) | 6,774 (6.0%) |
| $25,000 to $34,999 | 6,806 (4.8%) | 11,762 (10.5%) |
| $35,000 to $49,999 | 11,286 (8.0%) | 14,266 (12.7%) |
| $50,000 to $74,999 | 20,456 (14.5%) | 18,599 (16.6%) |
| $75,000 to $99,999 | 19,324 (13.7%) | 13,295 (11.8%) |
| $100,000 to $149,999 | 35,038 (24.8%) | 12,172 (10.8%) |
| $150,000 or more | 37,981 (26.9%) | 5,981 (5.3%) |
| Total | 141,473 (100.0%) | 112,162 (100.0%) |
Monthly Housing Cost Tiers in Providence County
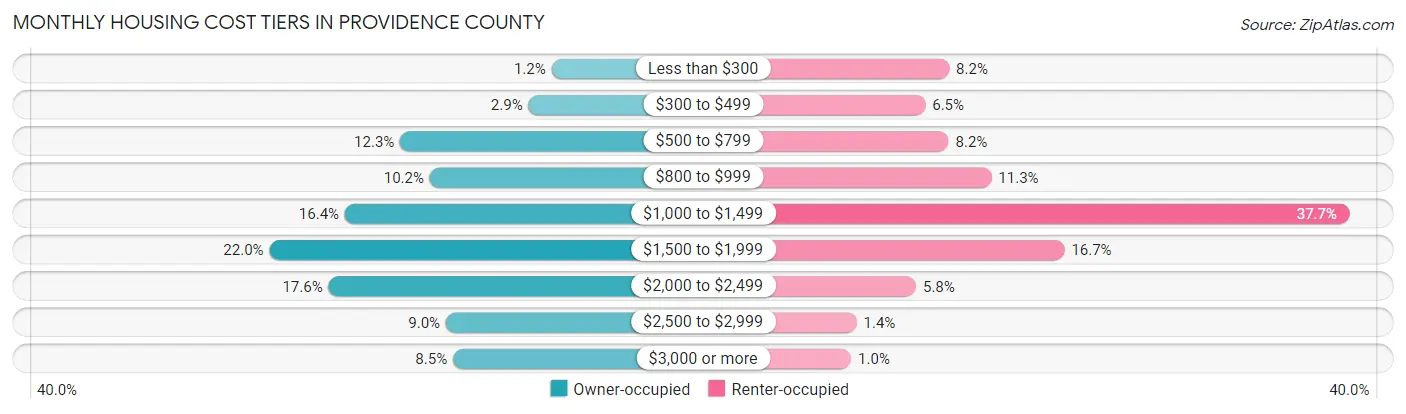
| Monthly Cost | Owner-occupied | Renter-occupied |
| Less than $300 | 1,686 (1.2%) | 9,230 (8.2%) |
| $300 to $499 | 4,088 (2.9%) | 7,253 (6.5%) |
| $500 to $799 | 17,451 (12.3%) | 9,190 (8.2%) |
| $800 to $999 | 14,373 (10.2%) | 12,714 (11.3%) |
| $1,000 to $1,499 | 23,220 (16.4%) | 42,236 (37.7%) |
| $1,500 to $1,999 | 31,086 (22.0%) | 18,749 (16.7%) |
| $2,000 to $2,499 | 24,926 (17.6%) | 6,490 (5.8%) |
| $2,500 to $2,999 | 12,687 (9.0%) | 1,583 (1.4%) |
| $3,000 or more | 11,956 (8.5%) | 1,131 (1.0%) |
| Total | 141,473 (100.0%) | 112,162 (100.0%) |
Physical Housing Characteristics in Providence County
Housing Structures in Providence County
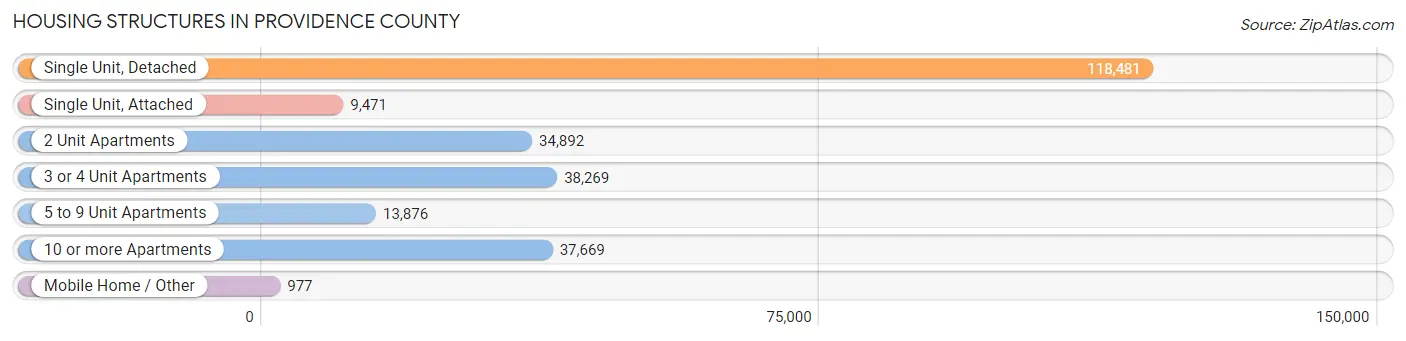
| Structure Type | # Housing Units | % Housing Units |
| Single Unit, Detached | 118,481 | 46.7% |
| Single Unit, Attached | 9,471 | 3.7% |
| 2 Unit Apartments | 34,892 | 13.8% |
| 3 or 4 Unit Apartments | 38,269 | 15.1% |
| 5 to 9 Unit Apartments | 13,876 | 5.5% |
| 10 or more Apartments | 37,669 | 14.8% |
| Mobile Home / Other | 977 | 0.4% |
| Total | 253,635 | 100.0% |
Housing Structures by Occupancy in Providence County
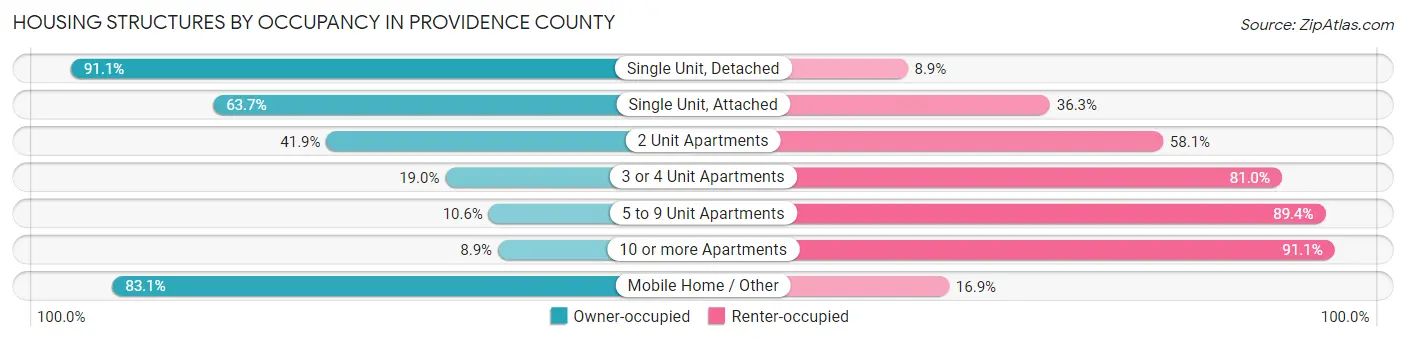
| Structure Type | Owner-occupied | Renter-occupied |
| Single Unit, Detached | 107,915 (91.1%) | 10,566 (8.9%) |
| Single Unit, Attached | 6,030 (63.7%) | 3,441 (36.3%) |
| 2 Unit Apartments | 14,621 (41.9%) | 20,271 (58.1%) |
| 3 or 4 Unit Apartments | 7,276 (19.0%) | 30,993 (81.0%) |
| 5 to 9 Unit Apartments | 1,476 (10.6%) | 12,400 (89.4%) |
| 10 or more Apartments | 3,343 (8.9%) | 34,326 (91.1%) |
| Mobile Home / Other | 812 (83.1%) | 165 (16.9%) |
| Total | 141,473 (55.8%) | 112,162 (44.2%) |
Housing Structures by Number of Rooms in Providence County
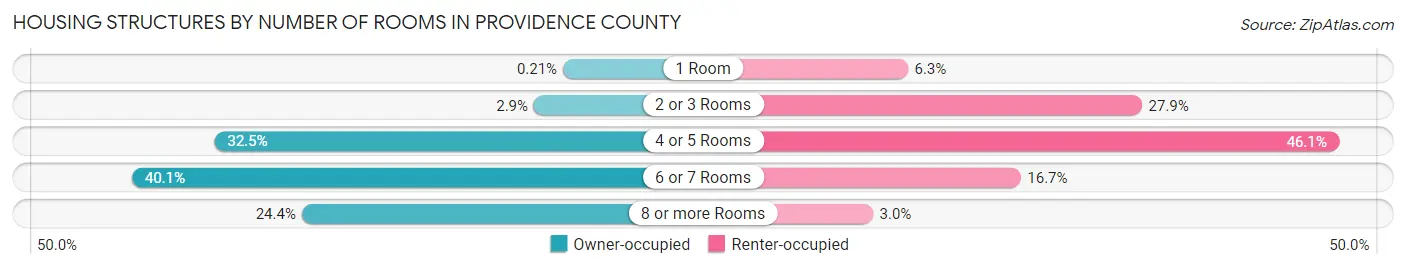
| Number of Rooms | Owner-occupied | Renter-occupied |
| 1 Room | 301 (0.2%) | 7,005 (6.2%) |
| 2 or 3 Rooms | 4,096 (2.9%) | 31,296 (27.9%) |
| 4 or 5 Rooms | 45,904 (32.5%) | 51,744 (46.1%) |
| 6 or 7 Rooms | 56,701 (40.1%) | 18,725 (16.7%) |
| 8 or more Rooms | 34,471 (24.4%) | 3,392 (3.0%) |
| Total | 141,473 (100.0%) | 112,162 (100.0%) |
Housing Structure by Heating Type in Providence County
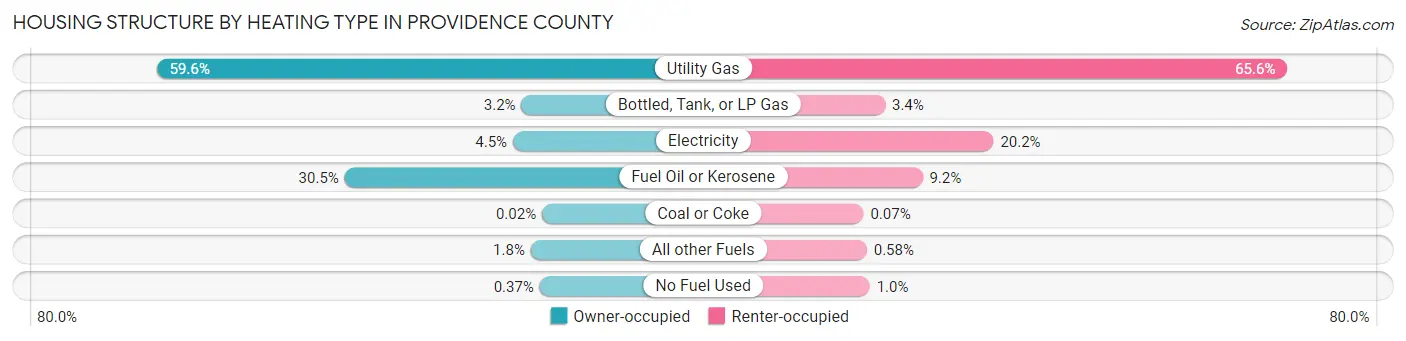
| Heating Type | Owner-occupied | Renter-occupied |
| Utility Gas | 84,332 (59.6%) | 73,541 (65.6%) |
| Bottled, Tank, or LP Gas | 4,529 (3.2%) | 3,816 (3.4%) |
| Electricity | 6,379 (4.5%) | 22,608 (20.2%) |
| Fuel Oil or Kerosene | 43,184 (30.5%) | 10,303 (9.2%) |
| Coal or Coke | 32 (0.0%) | 84 (0.1%) |
| All other Fuels | 2,490 (1.8%) | 653 (0.6%) |
| No Fuel Used | 527 (0.4%) | 1,157 (1.0%) |
| Total | 141,473 (100.0%) | 112,162 (100.0%) |
Household Vehicle Usage in Providence County
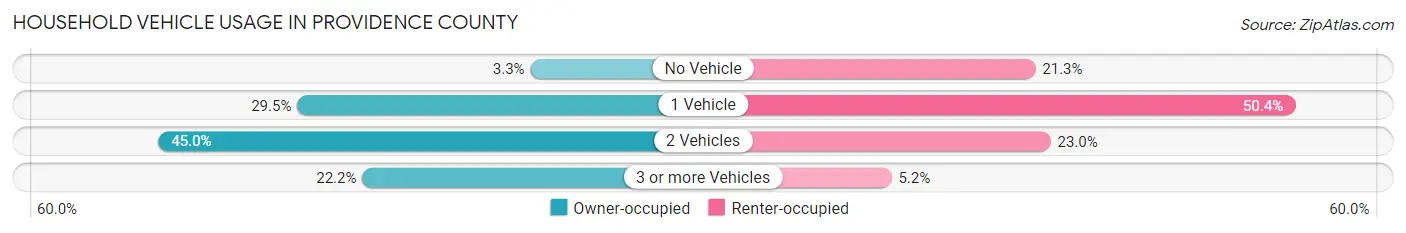
| Vehicles per Household | Owner-occupied | Renter-occupied |
| No Vehicle | 4,729 (3.3%) | 23,924 (21.3%) |
| 1 Vehicle | 41,675 (29.5%) | 56,560 (50.4%) |
| 2 Vehicles | 63,703 (45.0%) | 25,833 (23.0%) |
| 3 or more Vehicles | 31,366 (22.2%) | 5,845 (5.2%) |
| Total | 141,473 (100.0%) | 112,162 (100.0%) |
Real Estate & Mortgages in Providence County
Real Estate and Mortgage Overview in Providence County
| Characteristic | Without Mortgage | With Mortgage |
| Housing Units | 44,150 | 97,323 |
| Median Property Value | $302,000 | $314,000 |
| Median Household Income | $75,974 | $29,456 |
| Monthly Housing Costs | $814 | $11,692 |
| Real Estate Taxes | $4,451 | $1,526 |
Property Value by Mortgage Status in Providence County
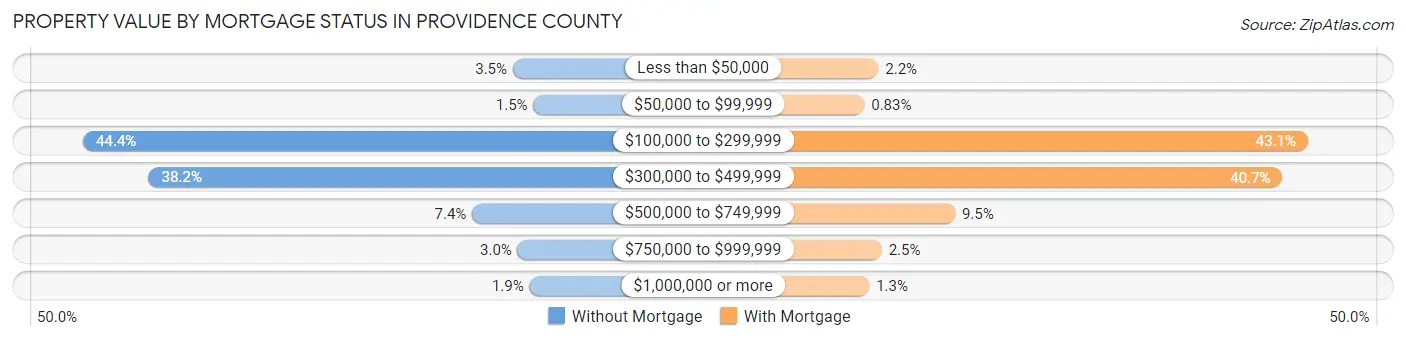
| Property Value | Without Mortgage | With Mortgage |
| Less than $50,000 | 1,547 (3.5%) | 2,116 (2.2%) |
| $50,000 to $99,999 | 682 (1.5%) | 812 (0.8%) |
| $100,000 to $299,999 | 19,619 (44.4%) | 41,928 (43.1%) |
| $300,000 to $499,999 | 16,863 (38.2%) | 39,562 (40.6%) |
| $500,000 to $749,999 | 3,256 (7.4%) | 9,218 (9.5%) |
| $750,000 to $999,999 | 1,340 (3.0%) | 2,422 (2.5%) |
| $1,000,000 or more | 843 (1.9%) | 1,265 (1.3%) |
| Total | 44,150 (100.0%) | 97,323 (100.0%) |
Household Income by Mortgage Status in Providence County
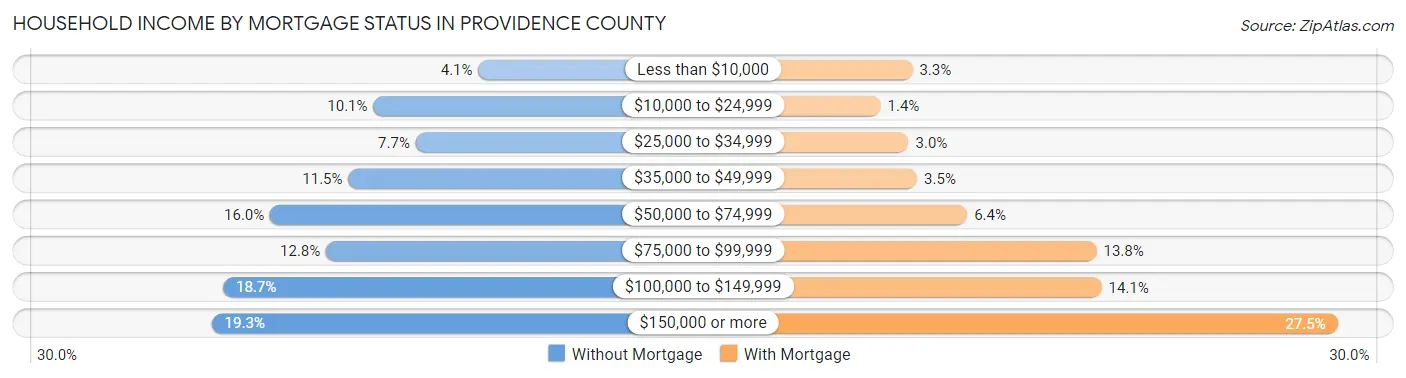
| Household Income | Without Mortgage | With Mortgage |
| Less than $10,000 | 1,795 (4.1%) | 3,164 (3.3%) |
| $10,000 to $24,999 | 4,448 (10.1%) | 1,391 (1.4%) |
| $25,000 to $34,999 | 3,378 (7.6%) | 2,948 (3.0%) |
| $35,000 to $49,999 | 5,079 (11.5%) | 3,428 (3.5%) |
| $50,000 to $74,999 | 7,050 (16.0%) | 6,207 (6.4%) |
| $75,000 to $99,999 | 5,636 (12.8%) | 13,406 (13.8%) |
| $100,000 to $149,999 | 8,239 (18.7%) | 13,688 (14.1%) |
| $150,000 or more | 8,525 (19.3%) | 26,799 (27.5%) |
| Total | 44,150 (100.0%) | 97,323 (100.0%) |
Property Value to Household Income Ratio in Providence County
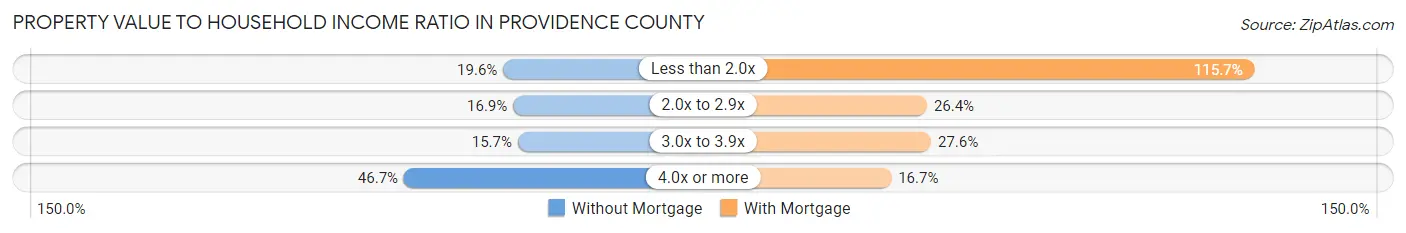
| Value-to-Income Ratio | Without Mortgage | With Mortgage |
| Less than 2.0x | 8,667 (19.6%) | 112,583 (115.7%) |
| 2.0x to 2.9x | 7,472 (16.9%) | 25,721 (26.4%) |
| 3.0x to 3.9x | 6,911 (15.7%) | 26,820 (27.6%) |
| 4.0x or more | 20,604 (46.7%) | 16,256 (16.7%) |
| Total | 44,150 (100.0%) | 97,323 (100.0%) |
Real Estate Taxes by Mortgage Status in Providence County

| Property Taxes | Without Mortgage | With Mortgage |
| Less than $800 | 1,551 (3.5%) | 242 (0.3%) |
| $800 to $1,499 | 1,270 (2.9%) | 2,207 (2.3%) |
| $800 to $1,499 | 39,832 (90.2%) | 3,416 (3.5%) |
| Total | 44,150 (100.0%) | 97,323 (100.0%) |
Health & Disability in Providence County
Health Insurance Coverage by Age in Providence County
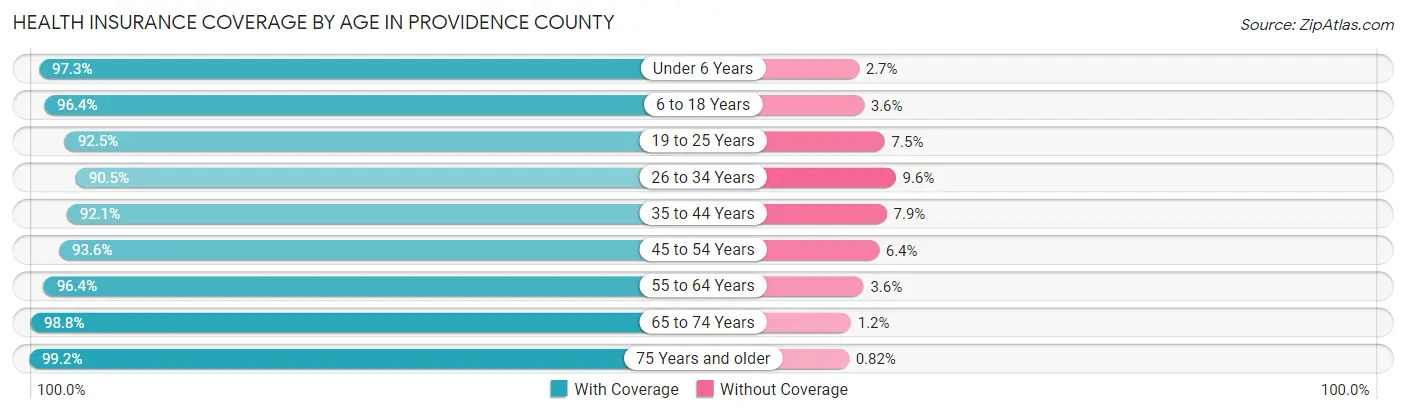
| Age Bracket | With Coverage | Without Coverage |
| Under 6 Years | 42,267 (97.3%) | 1,172 (2.7%) |
| 6 to 18 Years | 96,055 (96.4%) | 3,615 (3.6%) |
| 19 to 25 Years | 63,148 (92.5%) | 5,141 (7.5%) |
| 26 to 34 Years | 81,302 (90.4%) | 8,586 (9.6%) |
| 35 to 44 Years | 76,432 (92.1%) | 6,549 (7.9%) |
| 45 to 54 Years | 75,847 (93.6%) | 5,214 (6.4%) |
| 55 to 64 Years | 81,352 (96.4%) | 3,015 (3.6%) |
| 65 to 74 Years | 57,110 (98.8%) | 702 (1.2%) |
| 75 Years and older | 39,903 (99.2%) | 330 (0.8%) |
| Total | 613,416 (94.7%) | 34,324 (5.3%) |
Health Insurance Coverage by Citizenship Status in Providence County
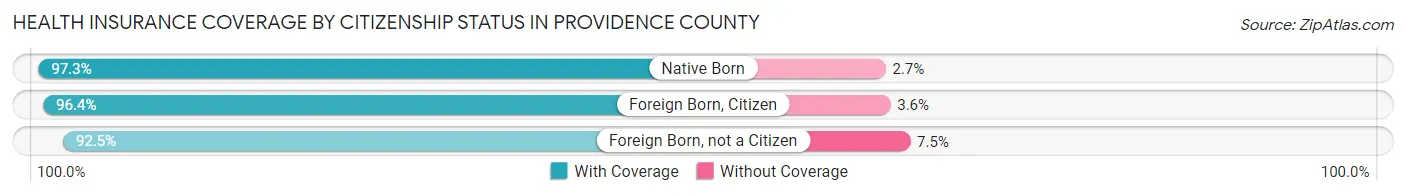
| Citizenship Status | With Coverage | Without Coverage |
| Native Born | 42,267 (97.3%) | 1,172 (2.7%) |
| Foreign Born, Citizen | 96,055 (96.4%) | 3,615 (3.6%) |
| Foreign Born, not a Citizen | 63,148 (92.5%) | 5,141 (7.5%) |
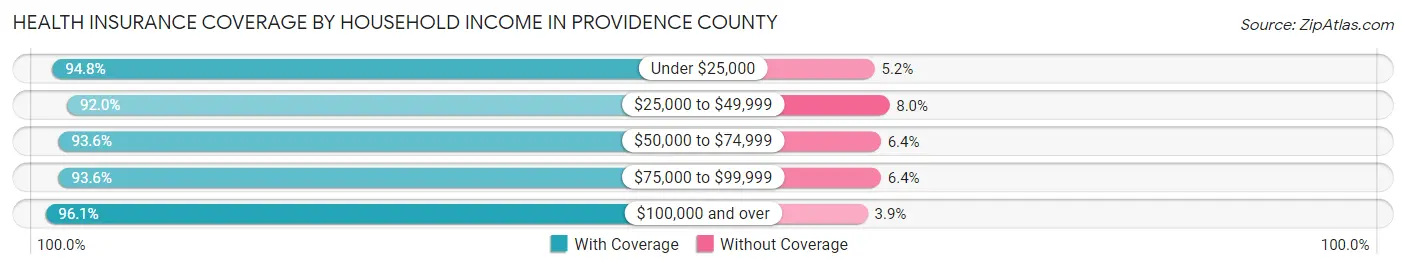
Health Insurance Coverage by Household Income in Providence County
| Household Income | With Coverage | Without Coverage |
| Under $25,000 | 71,479 (94.8%) | 3,922 (5.2%) |
| $25,000 to $49,999 | 83,817 (92.0%) | 7,250 (8.0%) |
| $50,000 to $74,999 | 89,795 (93.6%) | 6,102 (6.4%) |
| $75,000 to $99,999 | 80,044 (93.6%) | 5,451 (6.4%) |
| $100,000 and over | 269,951 (96.1%) | 10,936 (3.9%) |
Public vs Private Health Insurance Coverage by Age in Providence County
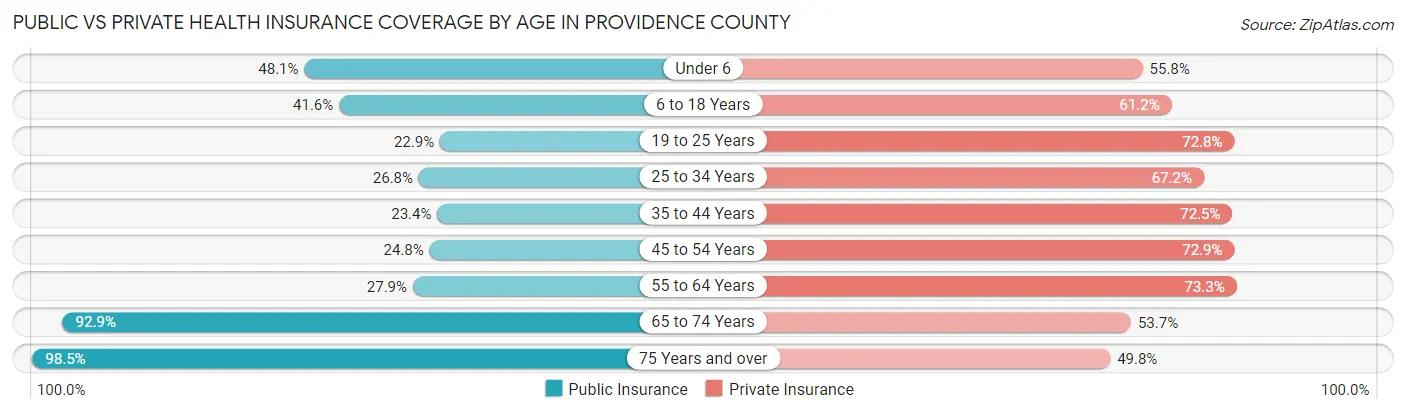
| Age Bracket | Public Insurance | Private Insurance |
| Under 6 | 20,879 (48.1%) | 24,256 (55.8%) |
| 6 to 18 Years | 41,485 (41.6%) | 60,994 (61.2%) |
| 19 to 25 Years | 15,639 (22.9%) | 49,739 (72.8%) |
| 25 to 34 Years | 24,106 (26.8%) | 60,399 (67.2%) |
| 35 to 44 Years | 19,418 (23.4%) | 60,156 (72.5%) |
| 45 to 54 Years | 20,126 (24.8%) | 59,063 (72.9%) |
| 55 to 64 Years | 23,566 (27.9%) | 61,795 (73.3%) |
| 65 to 74 Years | 53,728 (92.9%) | 31,033 (53.7%) |
| 75 Years and over | 39,646 (98.5%) | 20,044 (49.8%) |
| Total | 258,593 (39.9%) | 427,479 (66.0%) |
Disability Status by Sex by Age in Providence County
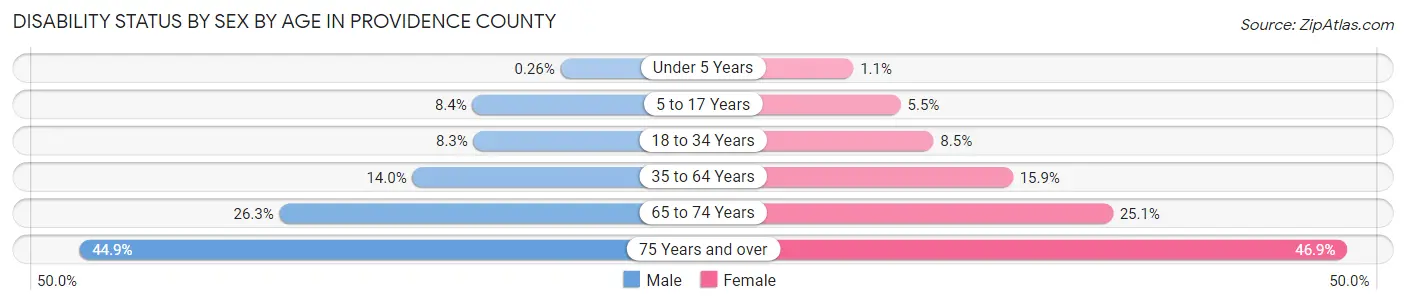
| Age Bracket | Male | Female |
| Under 5 Years | 48 (0.3%) | 189 (1.1%) |
| 5 to 17 Years | 4,204 (8.4%) | 2,573 (5.5%) |
| 18 to 34 Years | 7,011 (8.3%) | 7,129 (8.5%) |
| 35 to 64 Years | 17,201 (14.0%) | 19,920 (15.9%) |
| 65 to 74 Years | 7,150 (26.3%) | 7,710 (25.1%) |
| 75 Years and over | 6,980 (44.9%) | 11,585 (46.9%) |
Disability Class by Sex by Age in Providence County
Disability Class: Hearing Difficulty
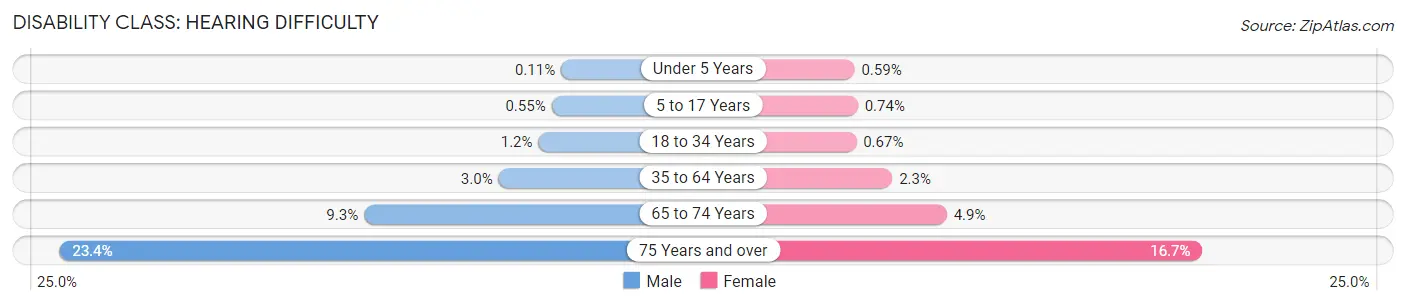
| Age Bracket | Male | Female |
| Under 5 Years | 20 (0.1%) | 105 (0.6%) |
| 5 to 17 Years | 275 (0.5%) | 348 (0.7%) |
| 18 to 34 Years | 973 (1.2%) | 560 (0.7%) |
| 35 to 64 Years | 3,703 (3.0%) | 2,934 (2.3%) |
| 65 to 74 Years | 2,512 (9.2%) | 1,492 (4.9%) |
| 75 Years and over | 3,634 (23.4%) | 4,132 (16.7%) |
Disability Class: Vision Difficulty
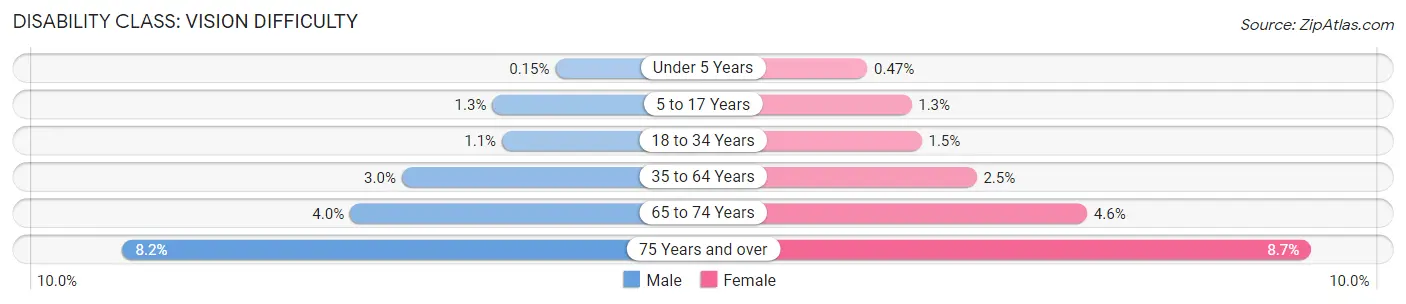
| Age Bracket | Male | Female |
| Under 5 Years | 28 (0.2%) | 84 (0.5%) |
| 5 to 17 Years | 661 (1.3%) | 608 (1.3%) |
| 18 to 34 Years | 962 (1.1%) | 1,239 (1.5%) |
| 35 to 64 Years | 3,680 (3.0%) | 3,141 (2.5%) |
| 65 to 74 Years | 1,076 (4.0%) | 1,395 (4.5%) |
| 75 Years and over | 1,271 (8.2%) | 2,151 (8.7%) |
Disability Class: Cognitive Difficulty
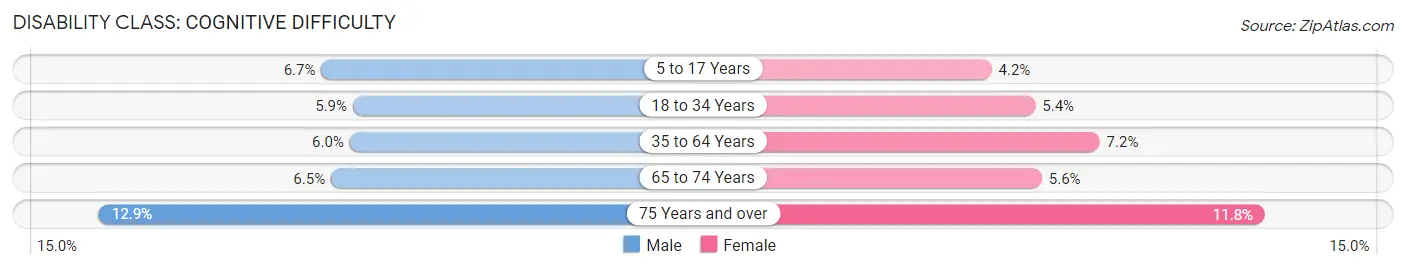
| Age Bracket | Male | Female |
| 5 to 17 Years | 3,362 (6.7%) | 1,966 (4.2%) |
| 18 to 34 Years | 4,929 (5.9%) | 4,521 (5.4%) |
| 35 to 64 Years | 7,305 (5.9%) | 9,015 (7.2%) |
| 65 to 74 Years | 1,757 (6.5%) | 1,708 (5.6%) |
| 75 Years and over | 2,009 (12.9%) | 2,909 (11.8%) |
Disability Class: Ambulatory Difficulty
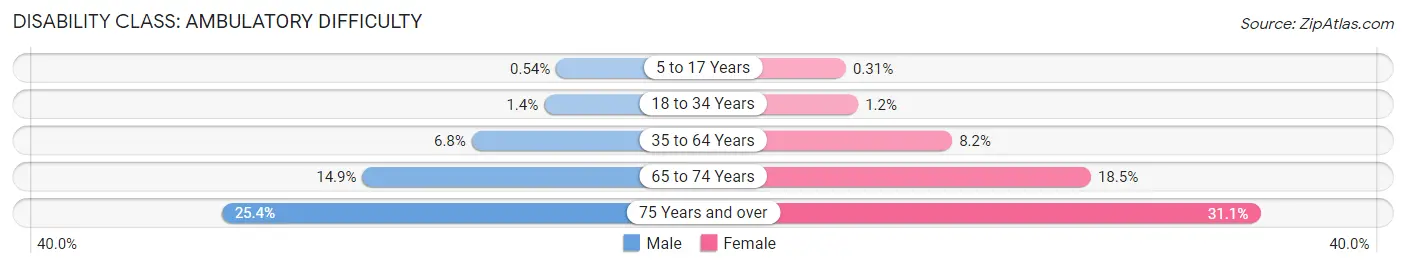
| Age Bracket | Male | Female |
| 5 to 17 Years | 267 (0.5%) | 144 (0.3%) |
| 18 to 34 Years | 1,200 (1.4%) | 1,026 (1.2%) |
| 35 to 64 Years | 8,368 (6.8%) | 10,297 (8.2%) |
| 65 to 74 Years | 4,052 (14.9%) | 5,674 (18.5%) |
| 75 Years and over | 3,940 (25.4%) | 7,667 (31.0%) |
Disability Class: Self-Care Difficulty
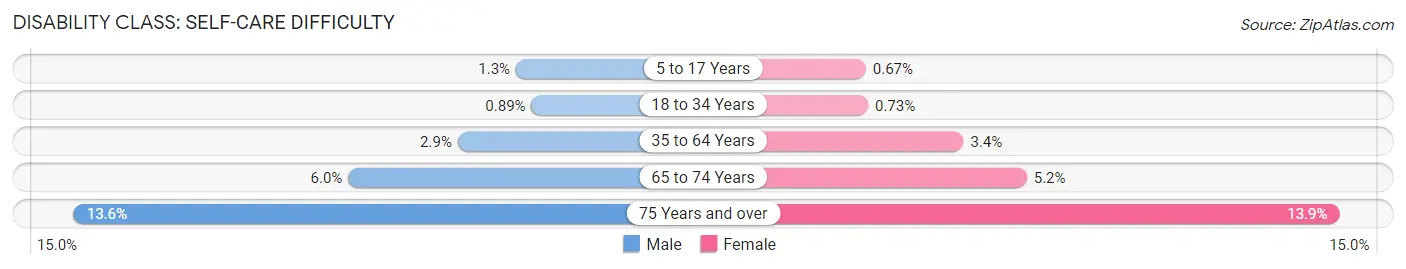
| Age Bracket | Male | Female |
| 5 to 17 Years | 657 (1.3%) | 316 (0.7%) |
| 18 to 34 Years | 747 (0.9%) | 616 (0.7%) |
| 35 to 64 Years | 3,608 (2.9%) | 4,258 (3.4%) |
| 65 to 74 Years | 1,625 (6.0%) | 1,580 (5.1%) |
| 75 Years and over | 2,117 (13.6%) | 3,420 (13.9%) |
Technology Access in Providence County
Computing Device Access in Providence County
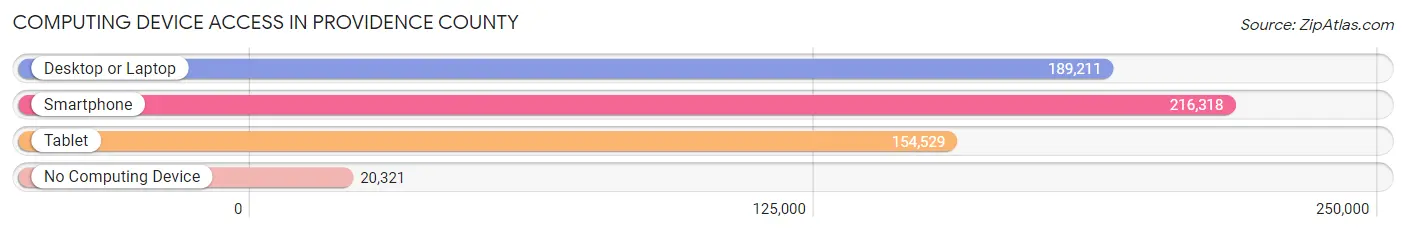
| Device Type | # Households | % Households |
| Desktop or Laptop | 189,211 | 74.6% |
| Smartphone | 216,318 | 85.3% |
| Tablet | 154,529 | 60.9% |
| No Computing Device | 20,321 | 8.0% |
| Total | 253,635 | 100.0% |
Internet Access in Providence County
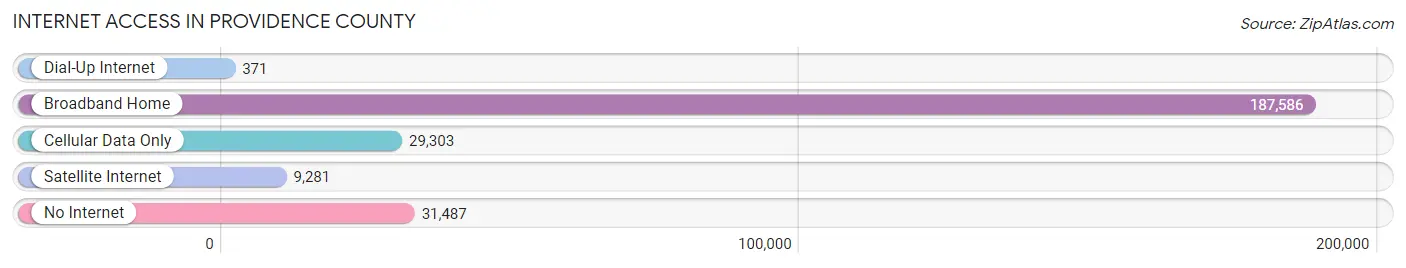
| Internet Type | # Households | % Households |
| Dial-Up Internet | 371 | 0.2% |
| Broadband Home | 187,586 | 74.0% |
| Cellular Data Only | 29,303 | 11.6% |
| Satellite Internet | 9,281 | 3.7% |
| No Internet | 31,487 | 12.4% |
| Total | 253,635 | 100.0% |
Providence County Summary
Providence County, Rhode Island is located in the northeastern corner of the state and is the most populous county in the state. It is bordered by the states of Massachusetts and Connecticut, and is home to the city of Providence, the state capital. The county covers an area of 534 square miles and has a population of 626,667 as of the 2020 census.
History
Providence County was established in 1703, when the Colony of Rhode Island and Providence Plantations was divided into three counties: Providence, Kent, and Bristol. The county was named after the city of Providence, which was founded in 1636 by Roger Williams. The city was named after the divine providence of God, which Williams believed had led him to the area.
The county has a long and rich history, and was the site of many important events in the American Revolution. In 1776, the Battle of Rhode Island was fought in the county, and in 1777, the Continental Army established its headquarters in Providence. The county was also the site of the first U.S. Mint, which was established in 1793.
Geography
Providence County is located in the northeastern corner of Rhode Island, and is bordered by the states of Massachusetts and Connecticut. The county is divided into two parts by the Blackstone River, which runs through the center of the county. The northern part of the county is mostly rural, while the southern part is more urbanized.
The county is home to several parks and recreational areas, including Lincoln Woods State Park, Colt State Park, and Roger Williams Park. The county also contains several rivers, including the Blackstone, Woonasquatucket, and Moshassuck.
Economy
Providence County is home to a diverse economy, with a variety of industries and businesses. The county is home to several major employers, including Brown University, Rhode Island Hospital, and the Providence Public Schools. The county is also home to several large corporations, such as Citizens Bank, Textron, and CVS Health.
The county is also home to a thriving tourism industry, with many attractions, such as the Rhode Island State House, the Roger Williams Park Zoo, and the Providence Performing Arts Center. The county is also home to several museums, such as the Rhode Island School of Design Museum and the RISD Museum.
Demographics
As of the 2020 census, Providence County had a population of 626,667. The population is racially diverse, with the largest racial group being White (63.3%), followed by Hispanic or Latino (17.2%), Black or African American (13.2%), and Asian (4.3%). The median household income in the county is $60,845, and the median age is 38.7 years.
Conclusion
Providence County, Rhode Island is a diverse and vibrant county located in the northeastern corner of the state. The county has a long and rich history, and is home to a variety of industries and businesses. The county is also home to several parks and recreational areas, as well as a thriving tourism industry. The population of the county is racially diverse, and the median household income is $60,845.
Common Questions
What is the Total Population of Providence County?
Total Population of Providence County is 657,984.
What is the Total Male Population of Providence County?
Total Male Population of Providence County is 323,700.
What is the Total Female Population of Providence County?
Total Female Population of Providence County is 334,284.
What is the Ratio of Males per 100 Females in Providence County?
There are 96.83 Males per 100 Females in Providence County.
What is the Ratio of Females per 100 Males in Providence County?
There are 103.27 Females per 100 Males in Providence County.
What is the Median Population Age in Providence County?
Median Population Age in Providence County is 37.6 Years.
What is the Average Family Size in Providence County
Average Family Size in Providence County is 3.2 People.
What is the Average Household Size in Providence County
Average Household Size in Providence County is 2.5 People.
What is Per Capita Income in Providence County?
Per Capita income in Providence County is $38,191.
What is the Median Family Income in Providence County?
Median Family Income in Providence County is $93,015.
What is the Median Household income in Providence County?
Median Household Income in Providence County is $72,579.
What is Income or Wage Gap in Providence County?
Income or Wage Gap in Providence County is 22.5%.
Women in Providence County earn 77.5 cents for every dollar earned by a man.
What is Family Income Deficit in Providence County?
Family Income Deficit in Providence County is $11,155.
Families that are below poverty line in Providence County earn $11,155 less on average than the poverty threshold level.
What is Inequality or Gini Index in Providence County?
Inequality or Gini Index in Providence County is 0.46.
How Large is the Labor Force in Providence County?
There are 352,190 People in the Labor Forcein in Providence County.
What is the Percentage of People in the Labor Force in Providence County?
65.1% of People are in the Labor Force in Providence County.
What is the Unemployment Rate in Providence County?
Unemployment Rate in Providence County is 6.3%.