Bradford, RI
Bradford Map
Bradford Overview
1,189
TOTAL POPULATION
724
MALE POPULATION
465
FEMALE POPULATION
155.70
MALES / 100 FEMALES
64.23
FEMALES / 100 MALES
41.8
MEDIAN AGE
2.6
AVG FAMILY SIZE
2.3
AVG HOUSEHOLD SIZE
$32,670
PER CAPITA INCOME
$93,319
AVG FAMILY INCOME
$72,383
AVG HOUSEHOLD INCOME
61.7%
WAGE / INCOME GAP [ % ]
38.3¢/ $1
WAGE / INCOME GAP [ $ ]
0.37
INEQUALITY / GINI INDEX
668
LABOR FORCE [ PEOPLE ]
65.4%
PERCENT IN LABOR FORCE
15.1%
UNEMPLOYMENT RATE
Bradford Zip Codes
Bradford Area Codes
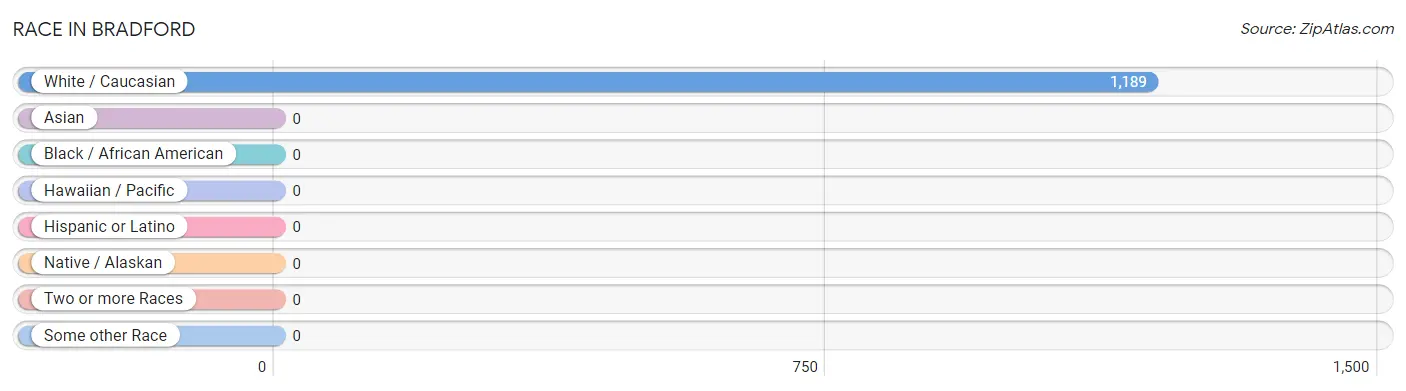
Race in Bradford
The most populous races in Bradford are , and White / Caucasian (1,189 | 100.0%).
| Race | # Population | % Population |
| Asian | 0 | 0.0% |
| Black / African American | 0 | 0.0% |
| Hawaiian / Pacific | 0 | 0.0% |
| Hispanic or Latino | 0 | 0.0% |
| Native / Alaskan | 0 | 0.0% |
| White / Caucasian | 1,189 | 100.0% |
| Two or more Races | 0 | 0.0% |
| Some other Race | 0 | 0.0% |
| Total | 1,189 | 100.0% |
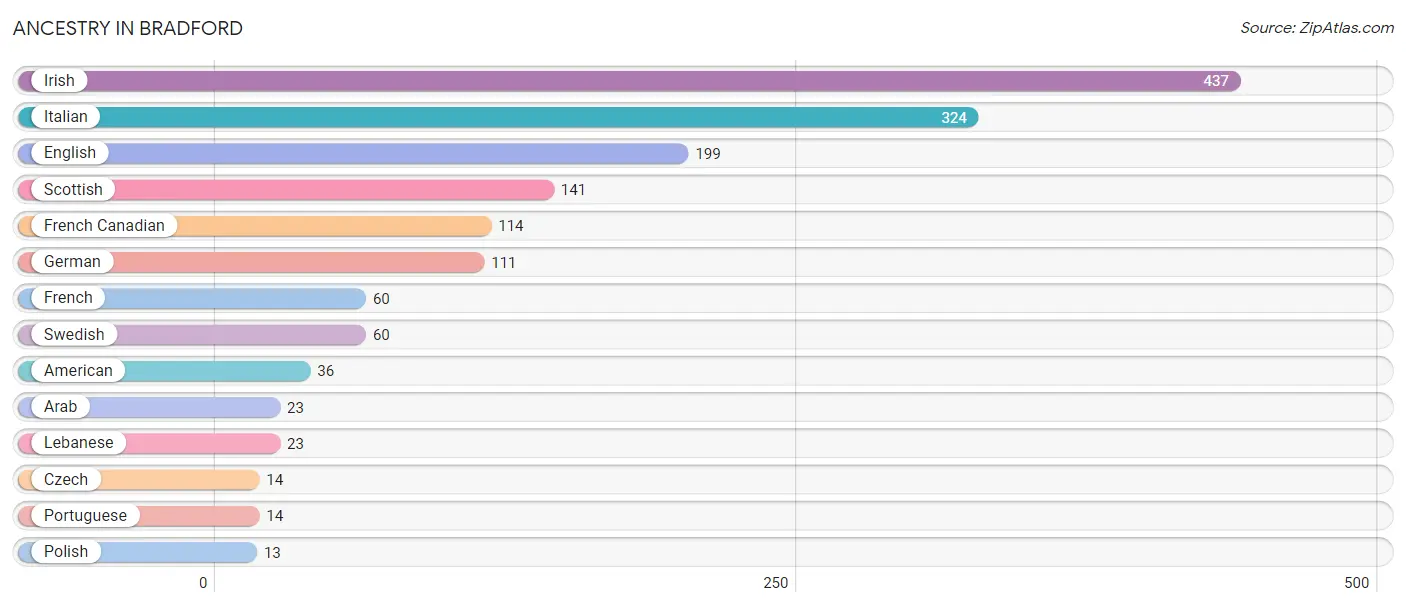
Ancestry in Bradford
The most populous ancestries reported in Bradford are Irish (437 | 36.7%), Italian (324 | 27.3%), English (199 | 16.7%), Scottish (141 | 11.9%), and French Canadian (114 | 9.6%), together accounting for 102.2% of all Bradford residents.
| Ancestry | # Population | % Population |
| American | 36 | 3.0% |
| Arab | 23 | 1.9% |
| Czech | 14 | 1.2% |
| English | 199 | 16.7% |
| French | 60 | 5.1% |
| French Canadian | 114 | 9.6% |
| German | 111 | 9.3% |
| Irish | 437 | 36.7% |
| Italian | 324 | 27.3% |
| Lebanese | 23 | 1.9% |
| Polish | 13 | 1.1% |
| Portuguese | 14 | 1.2% |
| Scottish | 141 | 11.9% |
| Swedish | 60 | 5.1% | View All 14 Rows |
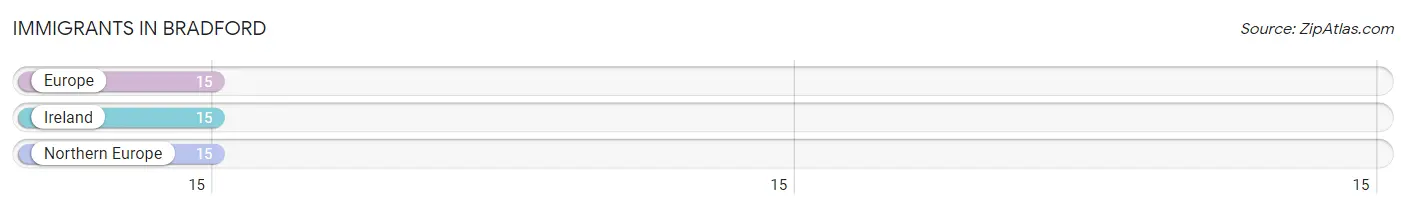
Immigrants in Bradford
The most numerous immigrant groups reported in Bradford came from Europe (15 | 1.3%), Ireland (15 | 1.3%), and Northern Europe (15 | 1.3%), together accounting for 3.8% of all Bradford residents.
| Immigration Origin | # Population | % Population |
| Europe | 15 | 1.3% |
| Ireland | 15 | 1.3% |
| Northern Europe | 15 | 1.3% | View All 3 Rows |
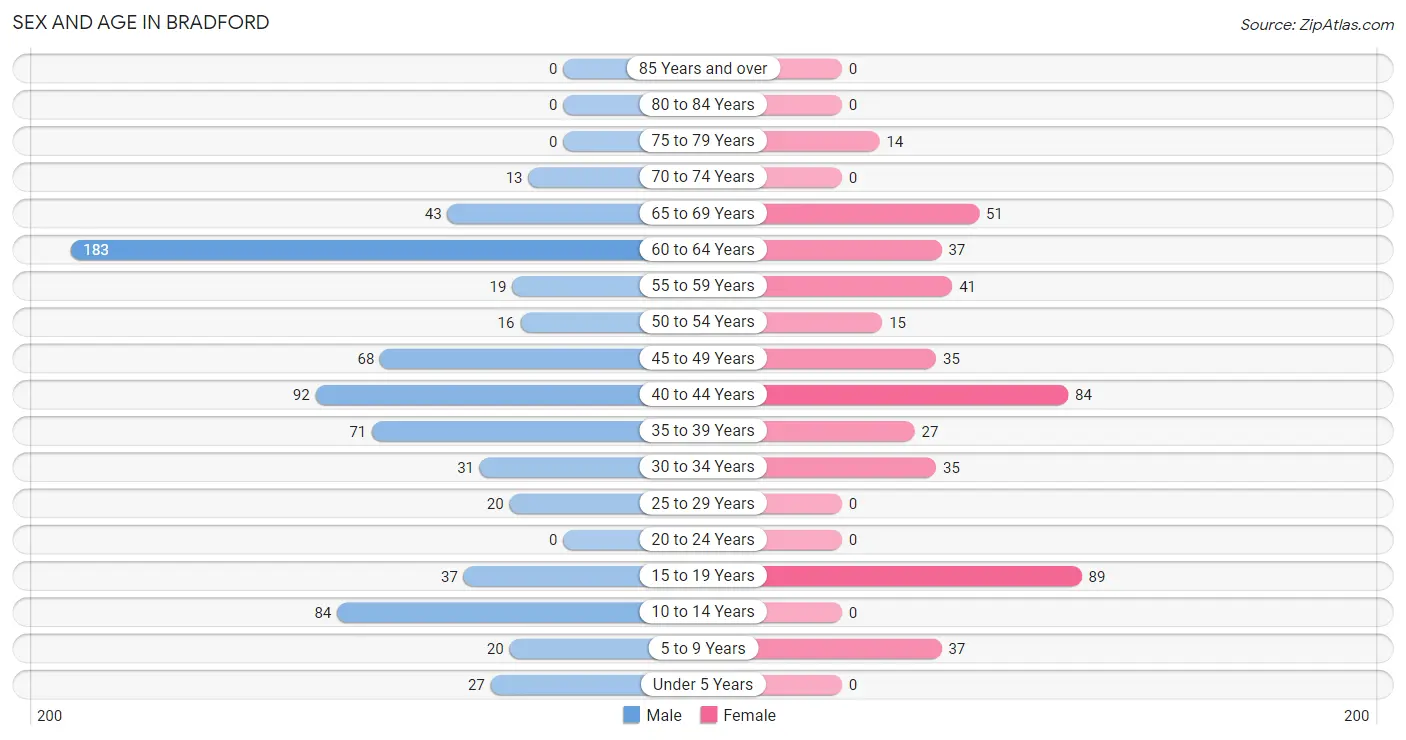
Sex and Age in Bradford
Sex and Age in Bradford
The most populous age groups in Bradford are 60 to 64 Years (183 | 25.3%) for men and 15 to 19 Years (89 | 19.1%) for women.
| Age Bracket | Male | Female |
| Under 5 Years | 27 (3.7%) | 0 (0.0%) |
| 5 to 9 Years | 20 (2.8%) | 37 (8.0%) |
| 10 to 14 Years | 84 (11.6%) | 0 (0.0%) |
| 15 to 19 Years | 37 (5.1%) | 89 (19.1%) |
| 20 to 24 Years | 0 (0.0%) | 0 (0.0%) |
| 25 to 29 Years | 20 (2.8%) | 0 (0.0%) |
| 30 to 34 Years | 31 (4.3%) | 35 (7.5%) |
| 35 to 39 Years | 71 (9.8%) | 27 (5.8%) |
| 40 to 44 Years | 92 (12.7%) | 84 (18.1%) |
| 45 to 49 Years | 68 (9.4%) | 35 (7.5%) |
| 50 to 54 Years | 16 (2.2%) | 15 (3.2%) |
| 55 to 59 Years | 19 (2.6%) | 41 (8.8%) |
| 60 to 64 Years | 183 (25.3%) | 37 (8.0%) |
| 65 to 69 Years | 43 (5.9%) | 51 (11.0%) |
| 70 to 74 Years | 13 (1.8%) | 0 (0.0%) |
| 75 to 79 Years | 0 (0.0%) | 14 (3.0%) |
| 80 to 84 Years | 0 (0.0%) | 0 (0.0%) |
| 85 Years and over | 0 (0.0%) | 0 (0.0%) |
| Total | 724 (100.0%) | 465 (100.0%) |
Families and Households in Bradford
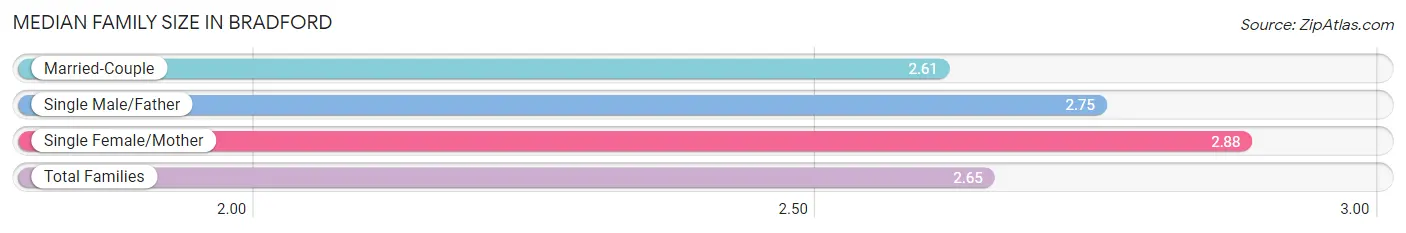
Median Family Size in Bradford
The median family size in Bradford is 2.65 persons per family, with single female/mother families (26 | 10.4%) accounting for the largest median family size of 2.88 persons per family. On the other hand, married-couple families (201 | 80.1%) represent the smallest median family size with 2.61 persons per family.
| Family Type | # Families | Family Size |
| Married-Couple | 201 (80.1%) | 2.61 |
| Single Male/Father | 24 (9.6%) | 2.75 |
| Single Female/Mother | 26 (10.4%) | 2.88 |
| Total Families | 251 (100.0%) | 2.65 |
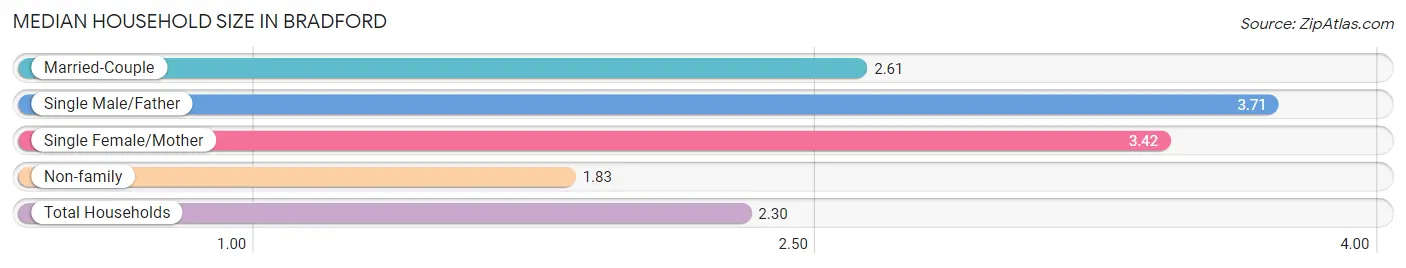
Median Household Size in Bradford
The median household size in Bradford is 2.30 persons per household, with single male/father households (24 | 4.6%) accounting for the largest median household size of 3.71 persons per household. non-family households (266 | 51.4%) represent the smallest median household size with 1.83 persons per household.
| Household Type | # Households | Household Size |
| Married-Couple | 201 (38.9%) | 2.61 |
| Single Male/Father | 24 (4.6%) | 3.71 |
| Single Female/Mother | 26 (5.0%) | 3.42 |
| Non-family | 266 (51.4%) | 1.83 |
| Total Households | 517 (100.0%) | 2.30 |
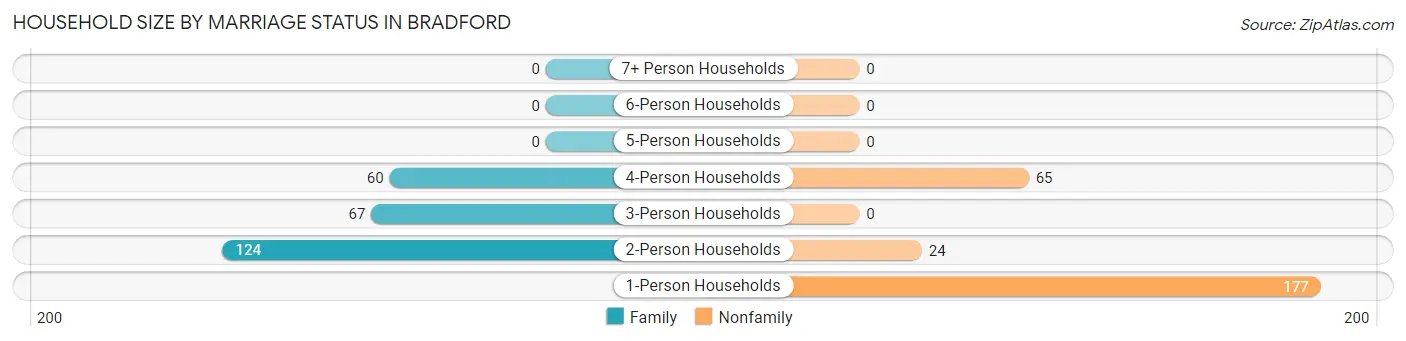
Household Size by Marriage Status in Bradford
Out of a total of 517 households in Bradford, 251 (48.5%) are family households, while 266 (51.4%) are nonfamily households. The most numerous type of family households are 2-person households, comprising 124, and the most common type of nonfamily households are 1-person households, comprising 177.
| Household Size | Family Households | Nonfamily Households |
| 1-Person Households | - | 177 (34.2%) |
| 2-Person Households | 124 (24.0%) | 24 (4.6%) |
| 3-Person Households | 67 (13.0%) | 0 (0.0%) |
| 4-Person Households | 60 (11.6%) | 65 (12.6%) |
| 5-Person Households | 0 (0.0%) | 0 (0.0%) |
| 6-Person Households | 0 (0.0%) | 0 (0.0%) |
| 7+ Person Households | 0 (0.0%) | 0 (0.0%) |
| Total | 251 (48.5%) | 266 (51.4%) |
Female Fertility in Bradford
Fertility by Age in Bradford
| Age Bracket | Women with Births | Births / 1,000 Women |
| 15 to 19 years | 0 (0.0%) | 0.0 |
| 20 to 34 years | 0 (0.0%) | 0.0 |
| 35 to 50 years | 0 (0.0%) | 0.0 |
| Total | 0 (0.0%) | 0.0 |
Fertility by Age by Marriage Status in Bradford
| Age Bracket | Married | Unmarried |
| 15 to 19 years | 0 (0.0%) | 0 (0.0%) |
| 20 to 34 years | 0 (0.0%) | 0 (0.0%) |
| 35 to 50 years | 0 (0.0%) | 0 (0.0%) |
| Total | 0 (0.0%) | 0 (0.0%) |
Fertility by Education in Bradford
| Educational Attainment | Women with Births | Births / 1,000 Women |
| Less than High School | 0 (0.0%) | 0.0 |
| High School Diploma | 0 (0.0%) | 0.0 |
| College or Associate's Degree | 0 (0.0%) | 0.0 |
| Bachelor's Degree | 0 (0.0%) | 0.0 |
| Graduate Degree | 0 (0.0%) | 0.0 |
| Total | 0 (0.0%) | 0.0 |
Fertility by Education by Marriage Status in Bradford
| Educational Attainment | Married | Unmarried |
| Less than High School | 0 (0.0%) | 0 (0.0%) |
| High School Diploma | 0 (0.0%) | 0 (0.0%) |
| College or Associate's Degree | 0 (0.0%) | 0 (0.0%) |
| Bachelor's Degree | 0 (0.0%) | 0 (0.0%) |
| Graduate Degree | 0 (0.0%) | 0 (0.0%) |
| Total | 0 (0.0%) | 0 (0.0%) |
Income in Bradford
Income Overview in Bradford
Per Capita Income in Bradford is $32,670, while median incomes of families and households are $93,319 and $72,383 respectively.
| Characteristic | Number | Measure |
| Per Capita Income | 1,189 | $32,670 |
| Median Family Income | 251 | $93,319 |
| Mean Family Income | 251 | $92,222 |
| Median Household Income | 517 | $72,383 |
| Mean Household Income | 517 | $73,828 |
| Income Deficit | 251 | $0 |
| Wage / Income Gap (%) | 1,189 | 61.66% |
| Wage / Income Gap ($) | 1,189 | 38.34¢ per $1 |
| Gini / Inequality Index | 1,189 | 0.37 |
Earnings by Sex in Bradford
Average Earnings in Bradford are $36,625, $57,788 for men and $22,155 for women, a difference of 61.7%.
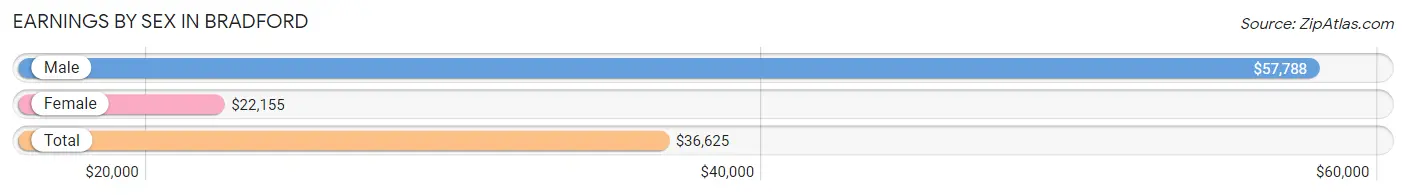
| Sex | Number | Average Earnings |
| Male | 431 (60.7%) | $57,788 |
| Female | 279 (39.3%) | $22,155 |
| Total | 710 (100.0%) | $36,625 |
Earnings by Sex by Income Bracket in Bradford
The most common earnings brackets in Bradford are $55,000 to $64,999 for men (100 | 23.2%) and $20,000 to $22,499 for women (105 | 37.6%).
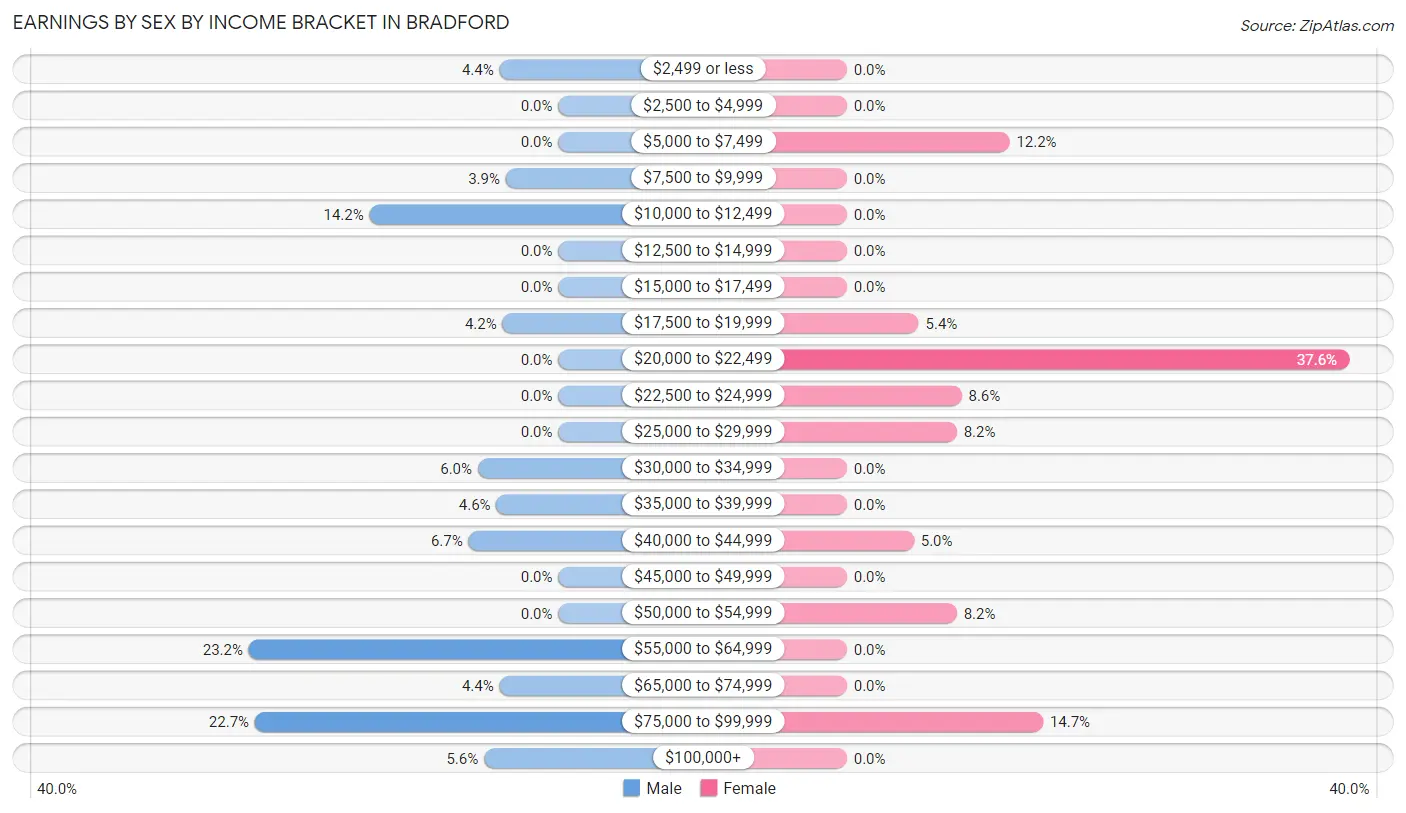
| Income | Male | Female |
| $2,499 or less | 19 (4.4%) | 0 (0.0%) |
| $2,500 to $4,999 | 0 (0.0%) | 0 (0.0%) |
| $5,000 to $7,499 | 0 (0.0%) | 34 (12.2%) |
| $7,500 to $9,999 | 17 (3.9%) | 0 (0.0%) |
| $10,000 to $12,499 | 61 (14.1%) | 0 (0.0%) |
| $12,500 to $14,999 | 0 (0.0%) | 0 (0.0%) |
| $15,000 to $17,499 | 0 (0.0%) | 0 (0.0%) |
| $17,500 to $19,999 | 18 (4.2%) | 15 (5.4%) |
| $20,000 to $22,499 | 0 (0.0%) | 105 (37.6%) |
| $22,500 to $24,999 | 0 (0.0%) | 24 (8.6%) |
| $25,000 to $29,999 | 0 (0.0%) | 23 (8.2%) |
| $30,000 to $34,999 | 26 (6.0%) | 0 (0.0%) |
| $35,000 to $39,999 | 20 (4.6%) | 0 (0.0%) |
| $40,000 to $44,999 | 29 (6.7%) | 14 (5.0%) |
| $45,000 to $49,999 | 0 (0.0%) | 0 (0.0%) |
| $50,000 to $54,999 | 0 (0.0%) | 23 (8.2%) |
| $55,000 to $64,999 | 100 (23.2%) | 0 (0.0%) |
| $65,000 to $74,999 | 19 (4.4%) | 0 (0.0%) |
| $75,000 to $99,999 | 98 (22.7%) | 41 (14.7%) |
| $100,000+ | 24 (5.6%) | 0 (0.0%) |
| Total | 431 (100.0%) | 279 (100.0%) |
Earnings by Sex by Educational Attainment in Bradford
Average earnings in Bradford are $58,500 for men and $22,155 for women, a difference of 62.1%. Men with an educational attainment of high school diploma enjoy the highest average annual earnings of $58,231, while those with high school diploma education earn the least with $58,231. Women with an educational attainment of college or associate's degree earn the most with the average annual earnings of $24,792, while those with high school diploma education have the smallest earnings of $20,701.
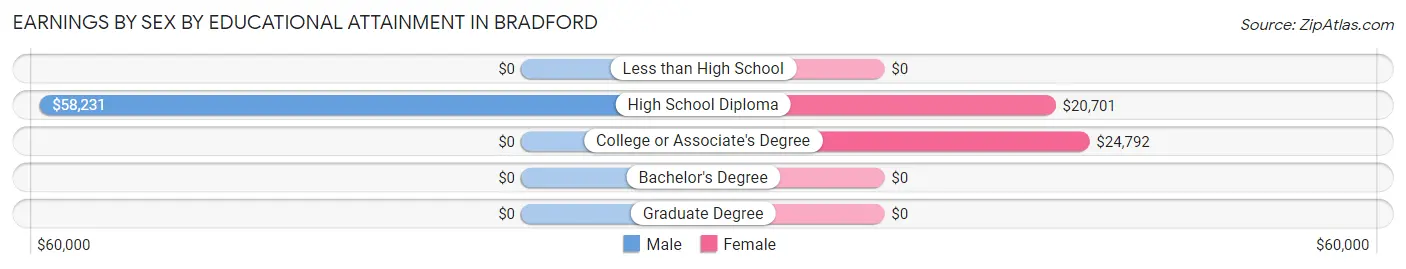
| Educational Attainment | Male Income | Female Income |
| Less than High School | - | - |
| High School Diploma | $58,231 | $20,701 |
| College or Associate's Degree | - | - |
| Bachelor's Degree | - | - |
| Graduate Degree | - | - |
| Total | $58,500 | $22,155 |
Family Income in Bradford
Family Income Brackets in Bradford
According to the Bradford family income data, there are 66 families falling into the $50,000 to $74,999 income range, which is the most common income bracket and makes up 26.3% of all families.
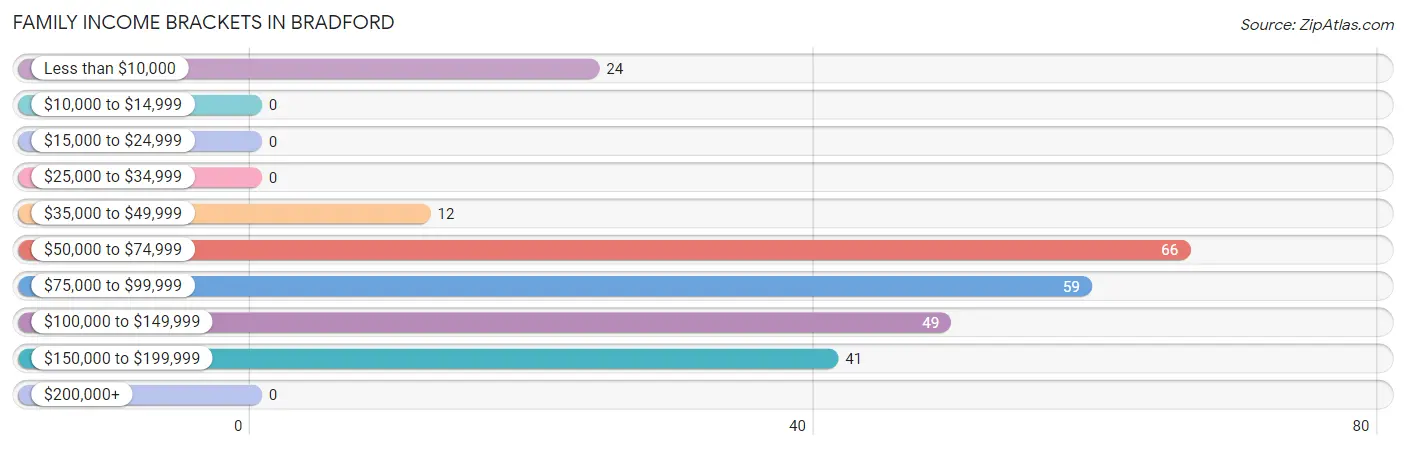
| Income Bracket | # Families | % Families |
| Less than $10,000 | 24 | 9.6% |
| $10,000 to $14,999 | 0 | 0.0% |
| $15,000 to $24,999 | 0 | 0.0% |
| $25,000 to $34,999 | 0 | 0.0% |
| $35,000 to $49,999 | 12 | 4.8% |
| $50,000 to $74,999 | 66 | 26.3% |
| $75,000 to $99,999 | 59 | 23.5% |
| $100,000 to $149,999 | 49 | 19.5% |
| $150,000 to $199,999 | 41 | 16.3% |
| $200,000+ | 0 | 0.0% |
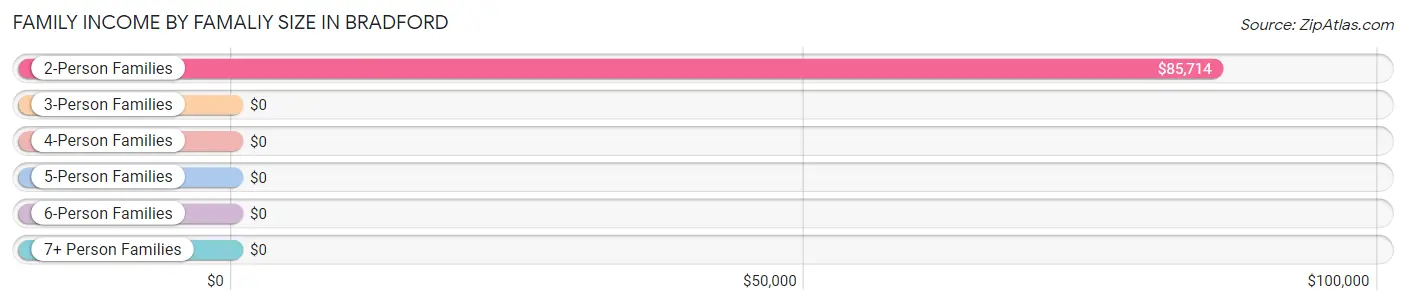
Family Income by Famaliy Size in Bradford
2-person families (136 | 54.2%) account for the highest median family income in Bradford with $85,714 per family, while 2-person families (136 | 54.2%) have the highest median income of $42,857 per family member.
| Income Bracket | # Families | Median Income |
| 2-Person Families | 136 (54.2%) | $85,714 |
| 3-Person Families | 79 (31.5%) | $0 |
| 4-Person Families | 36 (14.3%) | $0 |
| 5-Person Families | 0 (0.0%) | $0 |
| 6-Person Families | 0 (0.0%) | $0 |
| 7+ Person Families | 0 (0.0%) | $0 |
| Total | 251 (100.0%) | $93,319 |
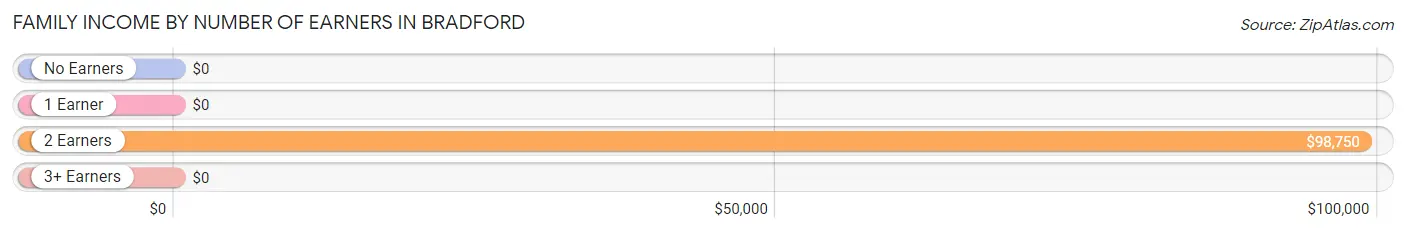
Family Income by Number of Earners in Bradford
| Number of Earners | # Families | Median Income |
| No Earners | 51 (20.3%) | $0 |
| 1 Earner | 18 (7.2%) | $0 |
| 2 Earners | 152 (60.6%) | $98,750 |
| 3+ Earners | 30 (11.9%) | $0 |
| Total | 251 (100.0%) | $93,319 |
Household Income in Bradford
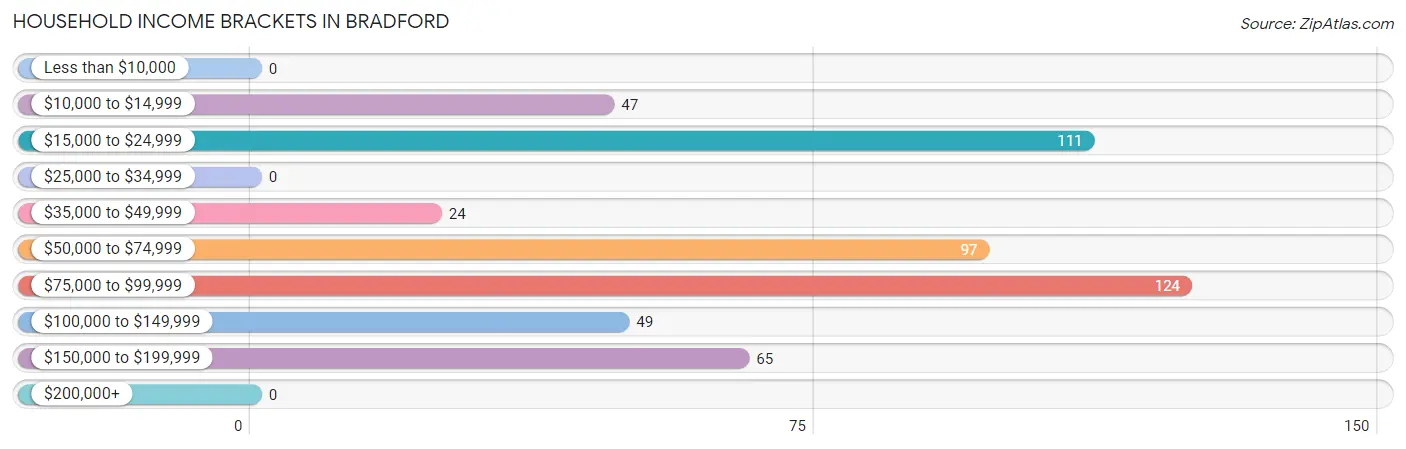
Household Income Brackets in Bradford
With 124 households falling in the category, the $75,000 to $99,999 income range is the most frequent in Bradford, accounting for 24.0% of all households.
| Income Bracket | # Households | % Households |
| Less than $10,000 | 0 | 0.0% |
| $10,000 to $14,999 | 47 | 9.1% |
| $15,000 to $24,999 | 111 | 21.5% |
| $25,000 to $34,999 | 0 | 0.0% |
| $35,000 to $49,999 | 24 | 4.6% |
| $50,000 to $74,999 | 97 | 18.8% |
| $75,000 to $99,999 | 124 | 24.0% |
| $100,000 to $149,999 | 49 | 9.5% |
| $150,000 to $199,999 | 65 | 12.6% |
| $200,000+ | 0 | 0.0% |
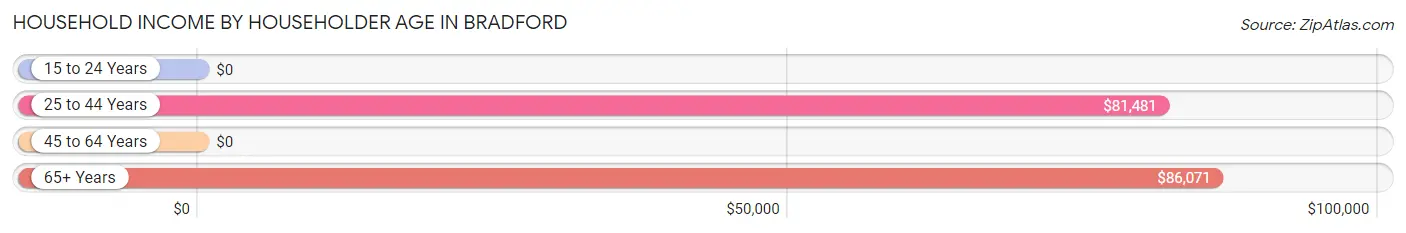
Household Income by Householder Age in Bradford
The median household income in Bradford is $72,383, with the highest median household income of $86,071 found in the 65+ years age bracket for the primary householder. A total of 74 households (14.3%) fall into this category.
| Income Bracket | # Households | Median Income |
| 15 to 24 Years | 0 (0.0%) | $0 |
| 25 to 44 Years | 195 (37.7%) | $81,481 |
| 45 to 64 Years | 248 (48.0%) | $0 |
| 65+ Years | 74 (14.3%) | $86,071 |
| Total | 517 (100.0%) | $72,383 |
Poverty in Bradford
Income Below Poverty by Sex and Age in Bradford
With 16.2% poverty level for males and 19.8% for females among the residents of Bradford, 12 to 14 year old males and 6 to 11 year old females are the most vulnerable to poverty, with 22 males (100.0%) and 20 females (100.0%) in their respective age groups living below the poverty level.
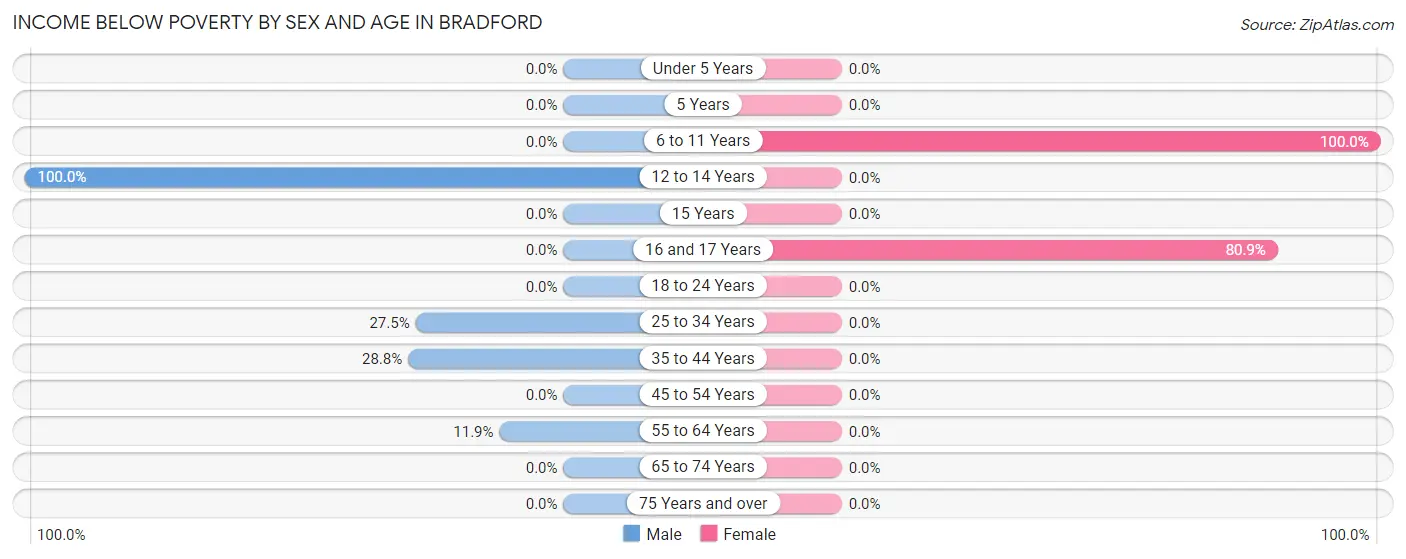
| Age Bracket | Male | Female |
| Under 5 Years | 0 (0.0%) | 0 (0.0%) |
| 5 Years | 0 (0.0%) | 0 (0.0%) |
| 6 to 11 Years | 0 (0.0%) | 20 (100.0%) |
| 12 to 14 Years | 22 (100.0%) | 0 (0.0%) |
| 15 Years | 0 (0.0%) | 0 (0.0%) |
| 16 and 17 Years | 0 (0.0%) | 72 (80.9%) |
| 18 to 24 Years | 0 (0.0%) | 0 (0.0%) |
| 25 to 34 Years | 14 (27.5%) | 0 (0.0%) |
| 35 to 44 Years | 47 (28.8%) | 0 (0.0%) |
| 45 to 54 Years | 0 (0.0%) | 0 (0.0%) |
| 55 to 64 Years | 24 (11.9%) | 0 (0.0%) |
| 65 to 74 Years | 0 (0.0%) | 0 (0.0%) |
| 75 Years and over | 0 (0.0%) | 0 (0.0%) |
| Total | 107 (16.2%) | 92 (19.8%) |
Income Above Poverty by Sex and Age in Bradford
According to the poverty statistics in Bradford, males aged under 5 years and females aged 5 years are the age groups that are most secure financially, with 100.0% of males and 100.0% of females in these age groups living above the poverty line.
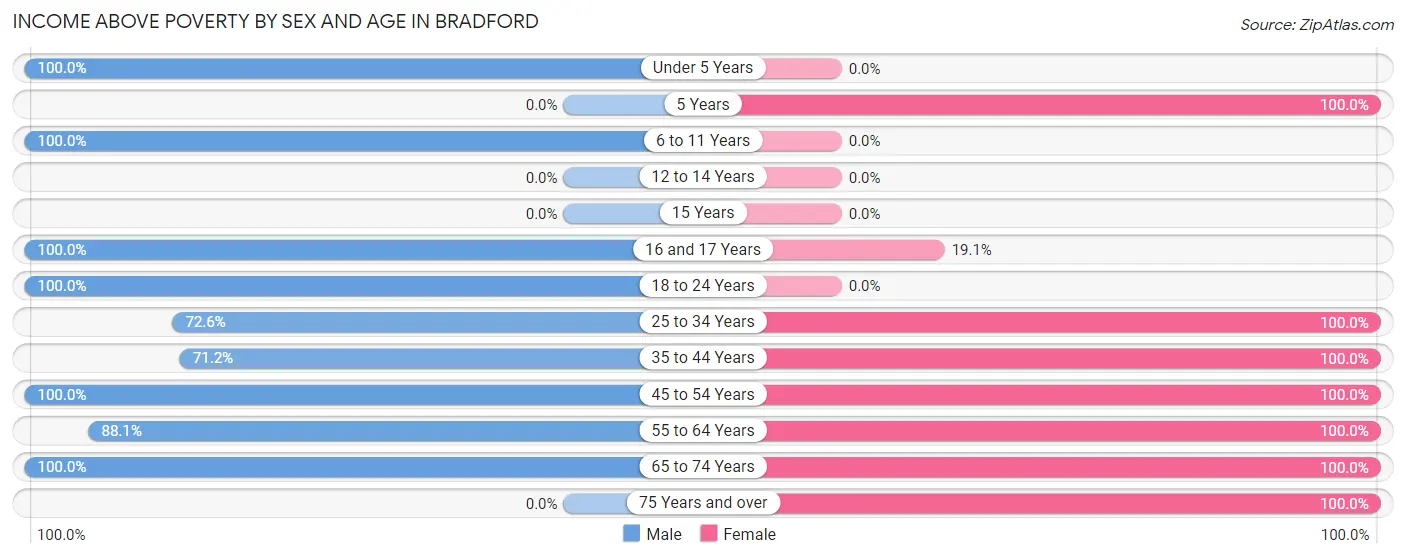
| Age Bracket | Male | Female |
| Under 5 Years | 27 (100.0%) | 0 (0.0%) |
| 5 Years | 0 (0.0%) | 17 (100.0%) |
| 6 to 11 Years | 20 (100.0%) | 0 (0.0%) |
| 12 to 14 Years | 0 (0.0%) | 0 (0.0%) |
| 15 Years | 0 (0.0%) | 0 (0.0%) |
| 16 and 17 Years | 19 (100.0%) | 17 (19.1%) |
| 18 to 24 Years | 18 (100.0%) | 0 (0.0%) |
| 25 to 34 Years | 37 (72.6%) | 35 (100.0%) |
| 35 to 44 Years | 116 (71.2%) | 111 (100.0%) |
| 45 to 54 Years | 84 (100.0%) | 50 (100.0%) |
| 55 to 64 Years | 178 (88.1%) | 78 (100.0%) |
| 65 to 74 Years | 56 (100.0%) | 51 (100.0%) |
| 75 Years and over | 0 (0.0%) | 14 (100.0%) |
| Total | 555 (83.8%) | 373 (80.2%) |
Income Below Poverty Among Married-Couple Families in Bradford
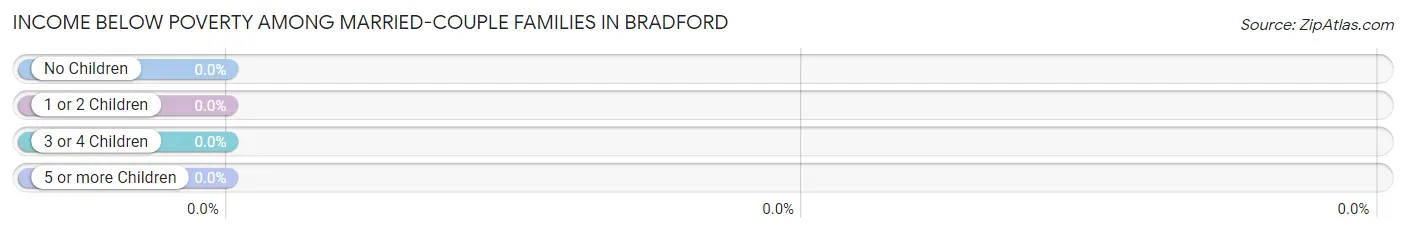
| Children | Above Poverty | Below Poverty |
| No Children | 138 (100.0%) | 0 (0.0%) |
| 1 or 2 Children | 63 (100.0%) | 0 (0.0%) |
| 3 or 4 Children | 0 (0.0%) | 0 (0.0%) |
| 5 or more Children | 0 (0.0%) | 0 (0.0%) |
| Total | 201 (100.0%) | 0 (0.0%) |
Income Below Poverty Among Single-Parent Households in Bradford
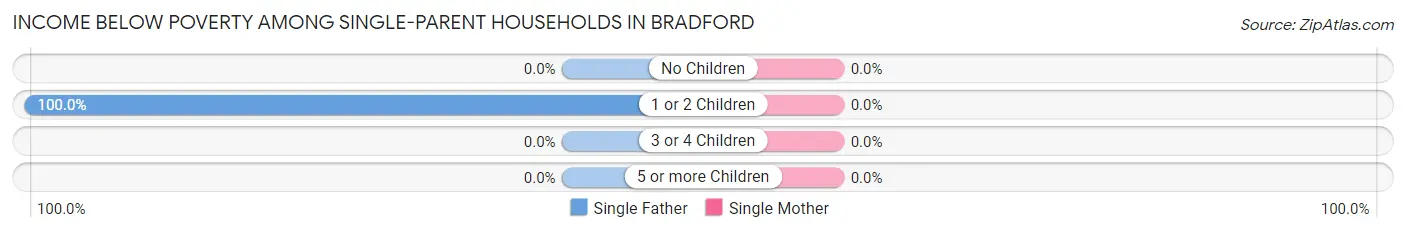
| Children | Single Father | Single Mother |
| No Children | 0 (0.0%) | 0 (0.0%) |
| 1 or 2 Children | 24 (100.0%) | 0 (0.0%) |
| 3 or 4 Children | 0 (0.0%) | 0 (0.0%) |
| 5 or more Children | 0 (0.0%) | 0 (0.0%) |
| Total | 24 (100.0%) | 0 (0.0%) |
Income Below Poverty Among Married-Couple vs Single-Parent Households in Bradford
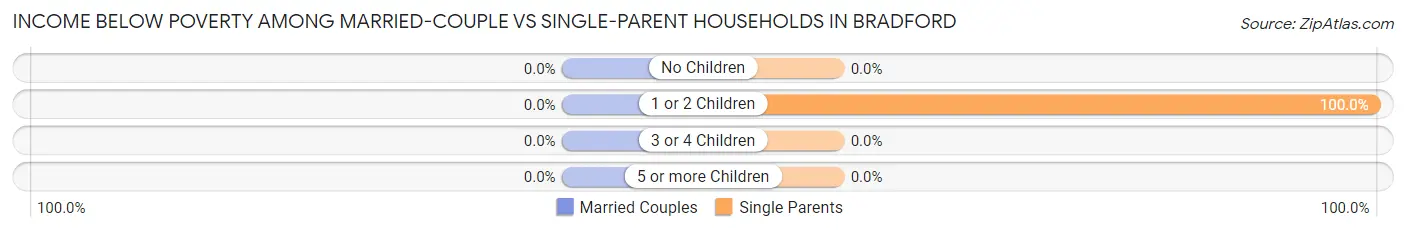
| Children | Married-Couple Families | Single-Parent Households |
| No Children | 0 (0.0%) | 0 (0.0%) |
| 1 or 2 Children | 0 (0.0%) | 24 (100.0%) |
| 3 or 4 Children | 0 (0.0%) | 0 (0.0%) |
| 5 or more Children | 0 (0.0%) | 0 (0.0%) |
| Total | 0 (0.0%) | 24 (48.0%) |
Employment Characteristics in Bradford
Employment by Class of Employer in Bradford
Among the 567 employed individuals in Bradford, private company employees (394 | 69.5%), local government employees (73 | 12.9%), and federal government employees (39 | 6.9%) make up the most common classes of employment.
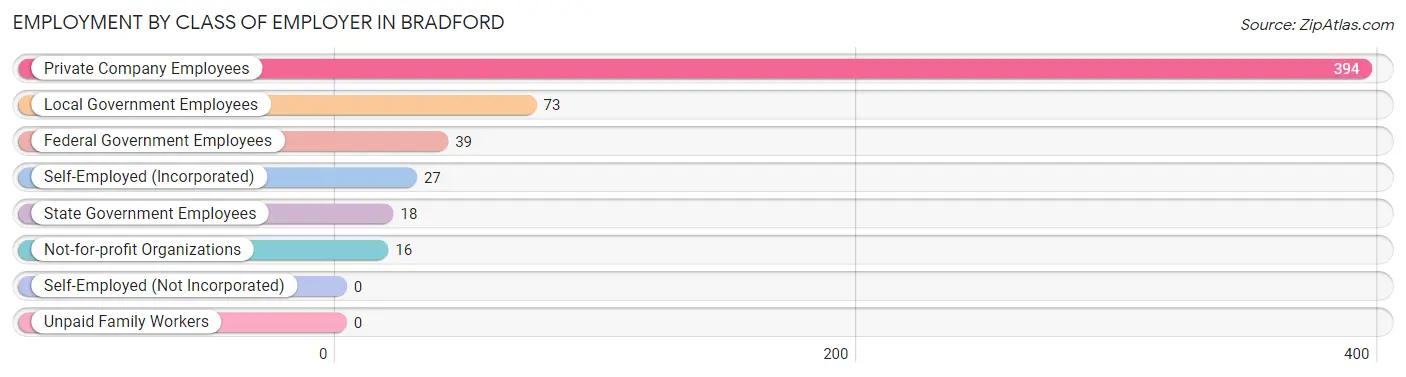
| Employer Class | # Employees | % Employees |
| Private Company Employees | 394 | 69.5% |
| Self-Employed (Incorporated) | 27 | 4.8% |
| Self-Employed (Not Incorporated) | 0 | 0.0% |
| Not-for-profit Organizations | 16 | 2.8% |
| Local Government Employees | 73 | 12.9% |
| State Government Employees | 18 | 3.2% |
| Federal Government Employees | 39 | 6.9% |
| Unpaid Family Workers | 0 | 0.0% |
| Total | 567 | 100.0% |
Employment Status by Age in Bradford
According to the labor force statistics for Bradford, out of the total population over 16 years of age (1,021), 65.4% or 668 individuals are in the labor force, with 15.1% or 101 of them unemployed. The age group with the highest labor force participation rate is 25 to 29 years, with 100.0% or 20 individuals in the labor force. Within the labor force, the 16 to 19 years age range has the highest percentage of unemployed individuals, with 100.0% or 18 of them being unemployed.
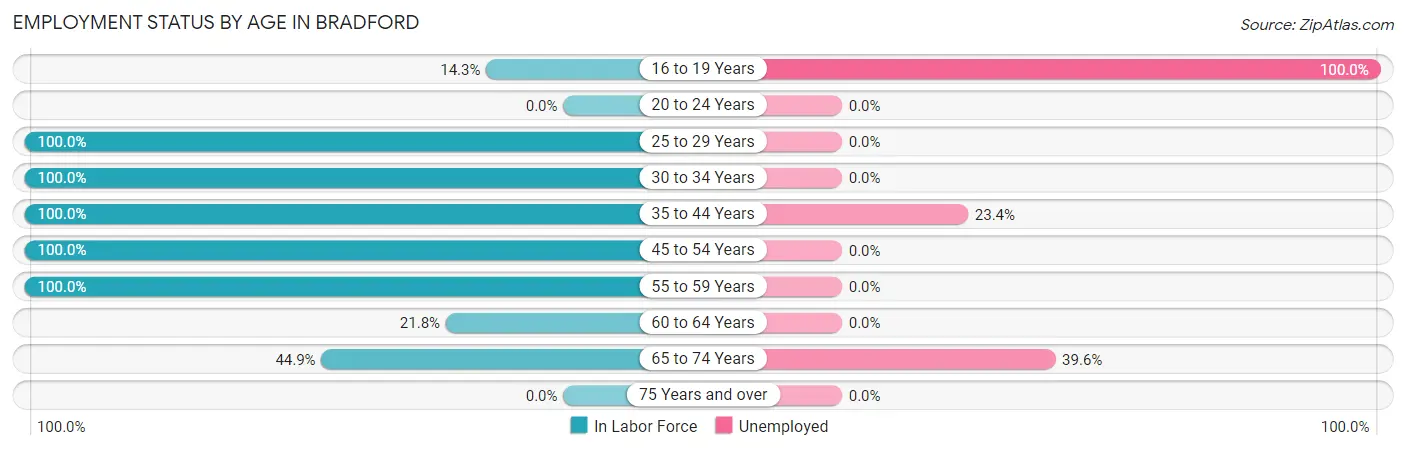
| Age Bracket | In Labor Force | Unemployed |
| 16 to 19 Years | 18 (14.3%) | 18 (100.0%) |
| 20 to 24 Years | 0 (0.0%) | 0 (0.0%) |
| 25 to 29 Years | 20 (100.0%) | 0 (0.0%) |
| 30 to 34 Years | 66 (100.0%) | 0 (0.0%) |
| 35 to 44 Years | 274 (100.0%) | 64 (23.4%) |
| 45 to 54 Years | 134 (100.0%) | 0 (0.0%) |
| 55 to 59 Years | 60 (100.0%) | 0 (0.0%) |
| 60 to 64 Years | 48 (21.8%) | 0 (0.0%) |
| 65 to 74 Years | 48 (44.9%) | 19 (39.6%) |
| 75 Years and over | 0 (0.0%) | 0 (0.0%) |
| Total | 668 (65.4%) | 101 (15.1%) |
Employment Status by Educational Attainment in Bradford
According to labor force statistics for Bradford, 77.8% of individuals (602) out of the total population between 25 and 64 years of age (774) are in the labor force, with 10.6% or 64 of them being unemployed. The group with the highest labor force participation rate are those with the educational attainment of less than high school, with 100.0% or 15 individuals in the labor force. Within the labor force, individuals with college / associate degree education have the highest percentage of unemployment, with 28.8% or 64 of them being unemployed.
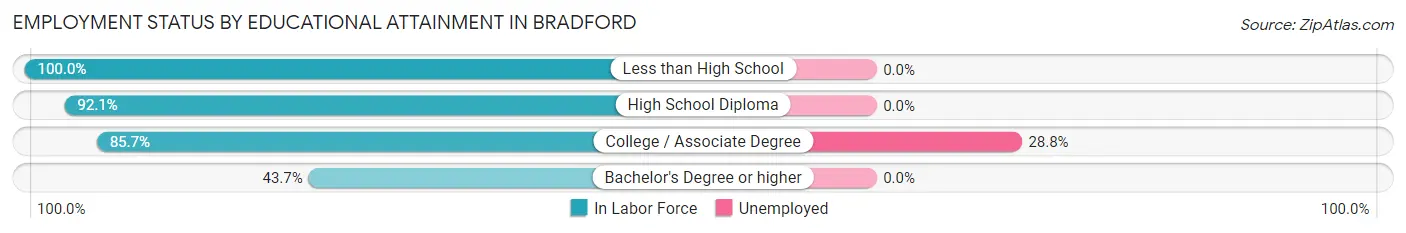
| Educational Attainment | In Labor Force | Unemployed |
| Less than High School | 15 (100.0%) | 0 (0.0%) |
| High School Diploma | 279 (92.1%) | 0 (0.0%) |
| College / Associate Degree | 222 (85.7%) | 75 (28.8%) |
| Bachelor's Degree or higher | 86 (43.7%) | 0 (0.0%) |
| Total | 602 (77.8%) | 82 (10.6%) |
Employment Occupations by Sex in Bradford
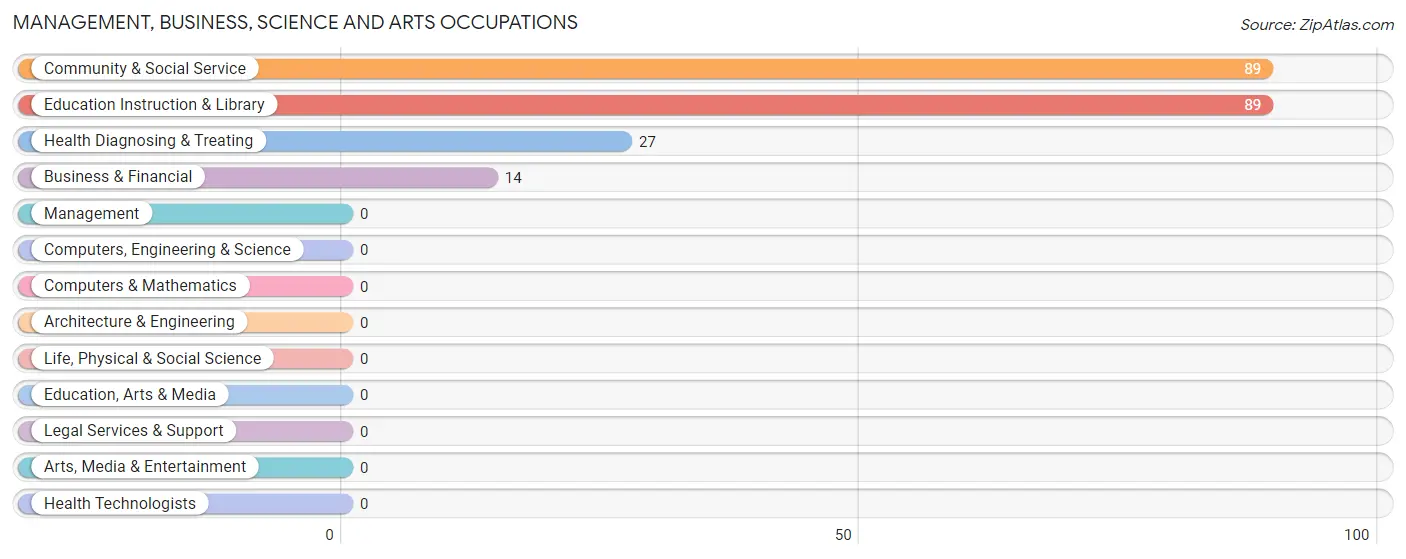
Management, Business, Science and Arts Occupations
The most common Management, Business, Science and Arts occupations in Bradford are Community & Social Service (89 | 15.7%), Education Instruction & Library (89 | 15.7%), Health Diagnosing & Treating (27 | 4.8%), and Business & Financial (14 | 2.5%).
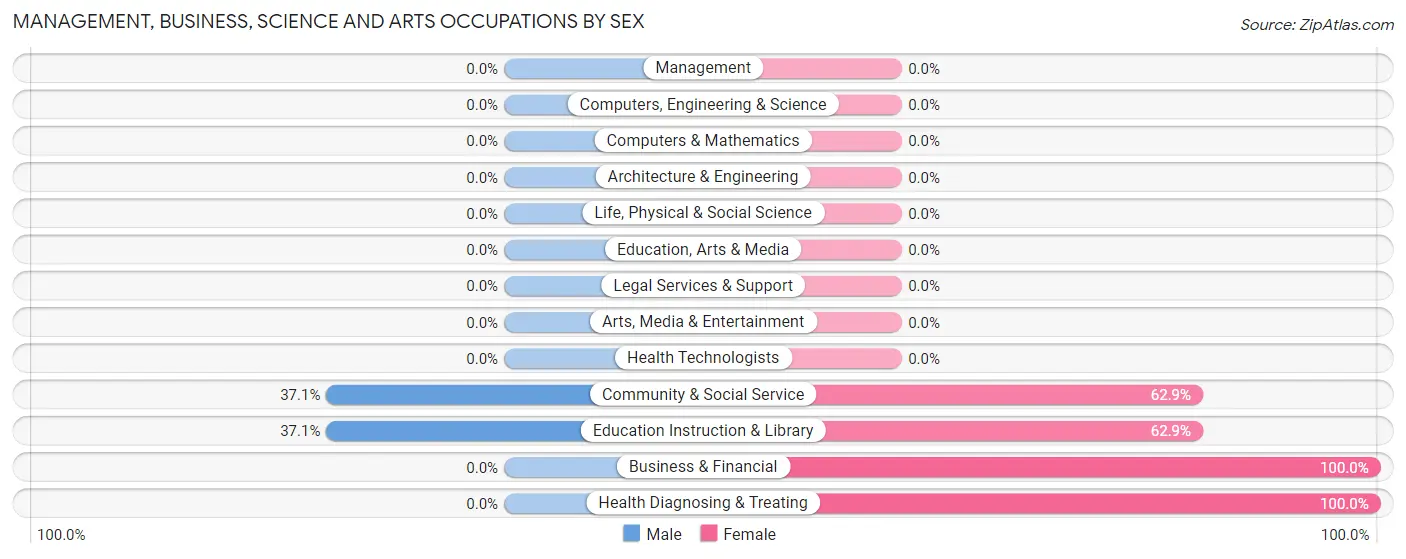
Management, Business, Science and Arts Occupations by Sex
Within the Management, Business, Science and Arts occupations in Bradford, the most male-oriented occupations are Community & Social Service (37.1%), and Education Instruction & Library (37.1%), while the most female-oriented occupations are Business & Financial (100.0%), Health Diagnosing & Treating (100.0%), and Community & Social Service (62.9%).
| Occupation | Male | Female |
| Management | 0 (0.0%) | 0 (0.0%) |
| Business & Financial | 0 (0.0%) | 14 (100.0%) |
| Computers, Engineering & Science | 0 (0.0%) | 0 (0.0%) |
| Computers & Mathematics | 0 (0.0%) | 0 (0.0%) |
| Architecture & Engineering | 0 (0.0%) | 0 (0.0%) |
| Life, Physical & Social Science | 0 (0.0%) | 0 (0.0%) |
| Community & Social Service | 33 (37.1%) | 56 (62.9%) |
| Education, Arts & Media | 0 (0.0%) | 0 (0.0%) |
| Legal Services & Support | 0 (0.0%) | 0 (0.0%) |
| Education Instruction & Library | 33 (37.1%) | 56 (62.9%) |
| Arts, Media & Entertainment | 0 (0.0%) | 0 (0.0%) |
| Health Diagnosing & Treating | 0 (0.0%) | 27 (100.0%) |
| Health Technologists | 0 (0.0%) | 0 (0.0%) |
| Total (Category) | 33 (25.4%) | 97 (74.6%) |
| Total (Overall) | 394 (69.5%) | 173 (30.5%) |
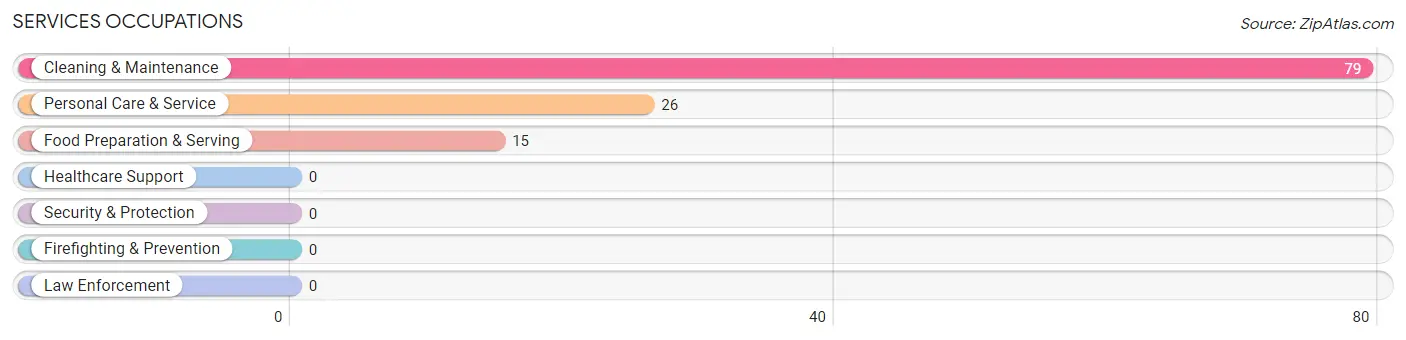
Services Occupations
The most common Services occupations in Bradford are Cleaning & Maintenance (79 | 13.9%), Personal Care & Service (26 | 4.6%), and Food Preparation & Serving (15 | 2.6%).
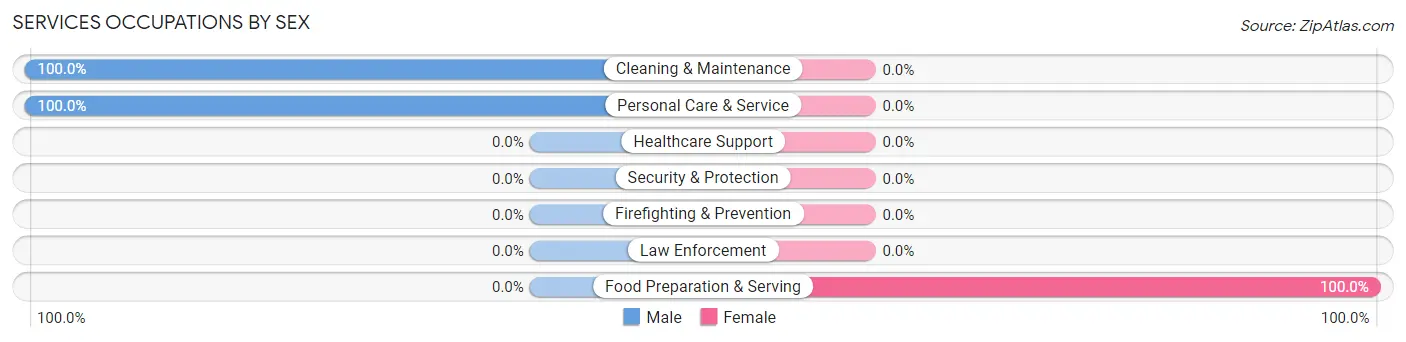
Services Occupations by Sex
| Occupation | Male | Female |
| Healthcare Support | 0 (0.0%) | 0 (0.0%) |
| Security & Protection | 0 (0.0%) | 0 (0.0%) |
| Firefighting & Prevention | 0 (0.0%) | 0 (0.0%) |
| Law Enforcement | 0 (0.0%) | 0 (0.0%) |
| Food Preparation & Serving | 0 (0.0%) | 15 (100.0%) |
| Cleaning & Maintenance | 79 (100.0%) | 0 (0.0%) |
| Personal Care & Service | 26 (100.0%) | 0 (0.0%) |
| Total (Category) | 105 (87.5%) | 15 (12.5%) |
| Total (Overall) | 394 (69.5%) | 173 (30.5%) |
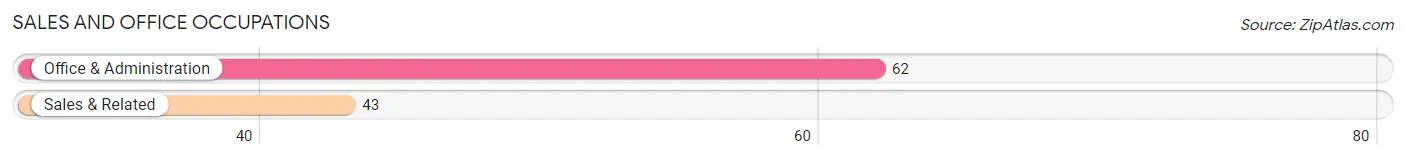
Sales and Office Occupations
The most common Sales and Office occupations in Bradford are Office & Administration (62 | 10.9%), and Sales & Related (43 | 7.6%).
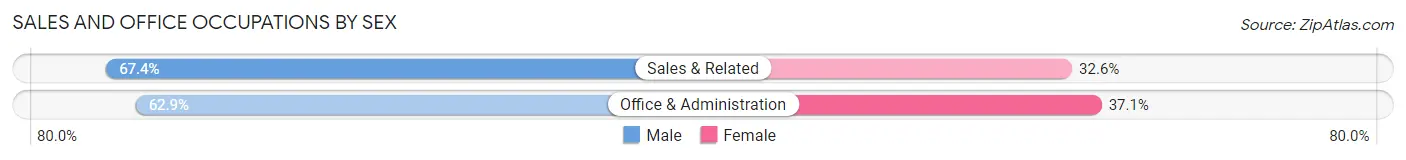
Sales and Office Occupations by Sex
| Occupation | Male | Female |
| Sales & Related | 29 (67.4%) | 14 (32.6%) |
| Office & Administration | 39 (62.9%) | 23 (37.1%) |
| Total (Category) | 68 (64.8%) | 37 (35.2%) |
| Total (Overall) | 394 (69.5%) | 173 (30.5%) |
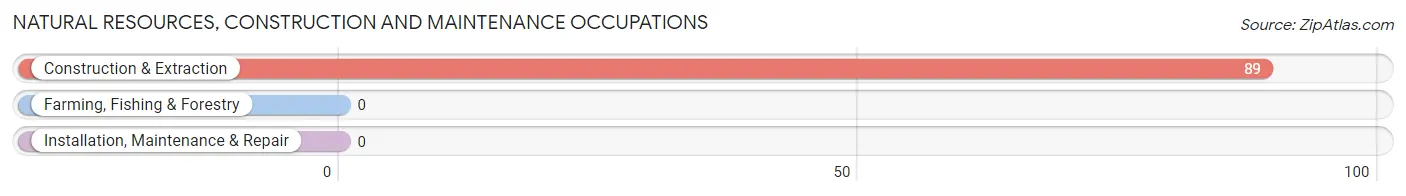
Natural Resources, Construction and Maintenance Occupations
The most common Natural Resources, Construction and Maintenance occupations in Bradford are , and Construction & Extraction (89 | 15.7%).
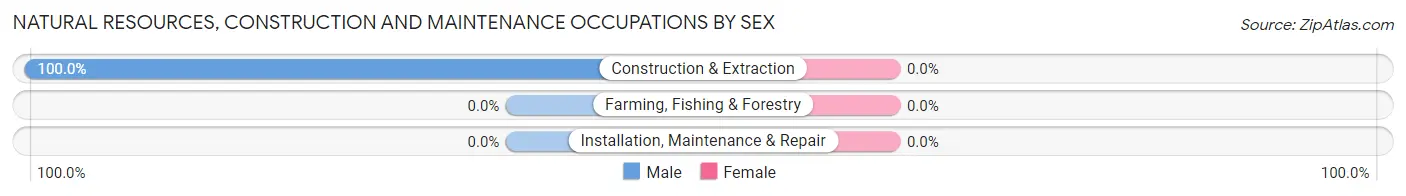
Natural Resources, Construction and Maintenance Occupations by Sex
| Occupation | Male | Female |
| Farming, Fishing & Forestry | 0 (0.0%) | 0 (0.0%) |
| Construction & Extraction | 89 (100.0%) | 0 (0.0%) |
| Installation, Maintenance & Repair | 0 (0.0%) | 0 (0.0%) |
| Total (Category) | 89 (100.0%) | 0 (0.0%) |
| Total (Overall) | 394 (69.5%) | 173 (30.5%) |
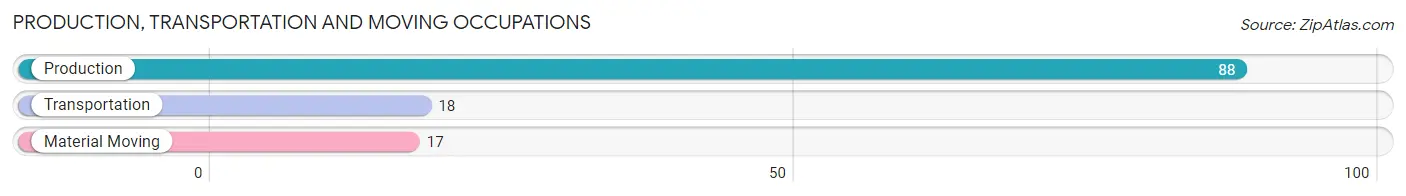
Production, Transportation and Moving Occupations
The most common Production, Transportation and Moving occupations in Bradford are Production (88 | 15.5%), Transportation (18 | 3.2%), and Material Moving (17 | 3.0%).
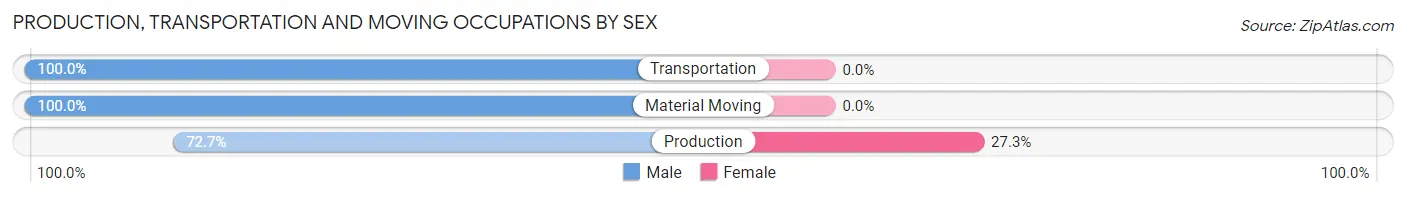
Production, Transportation and Moving Occupations by Sex
| Occupation | Male | Female |
| Production | 64 (72.7%) | 24 (27.3%) |
| Transportation | 18 (100.0%) | 0 (0.0%) |
| Material Moving | 17 (100.0%) | 0 (0.0%) |
| Total (Category) | 99 (80.5%) | 24 (19.5%) |
| Total (Overall) | 394 (69.5%) | 173 (30.5%) |
Employment Industries by Sex in Bradford
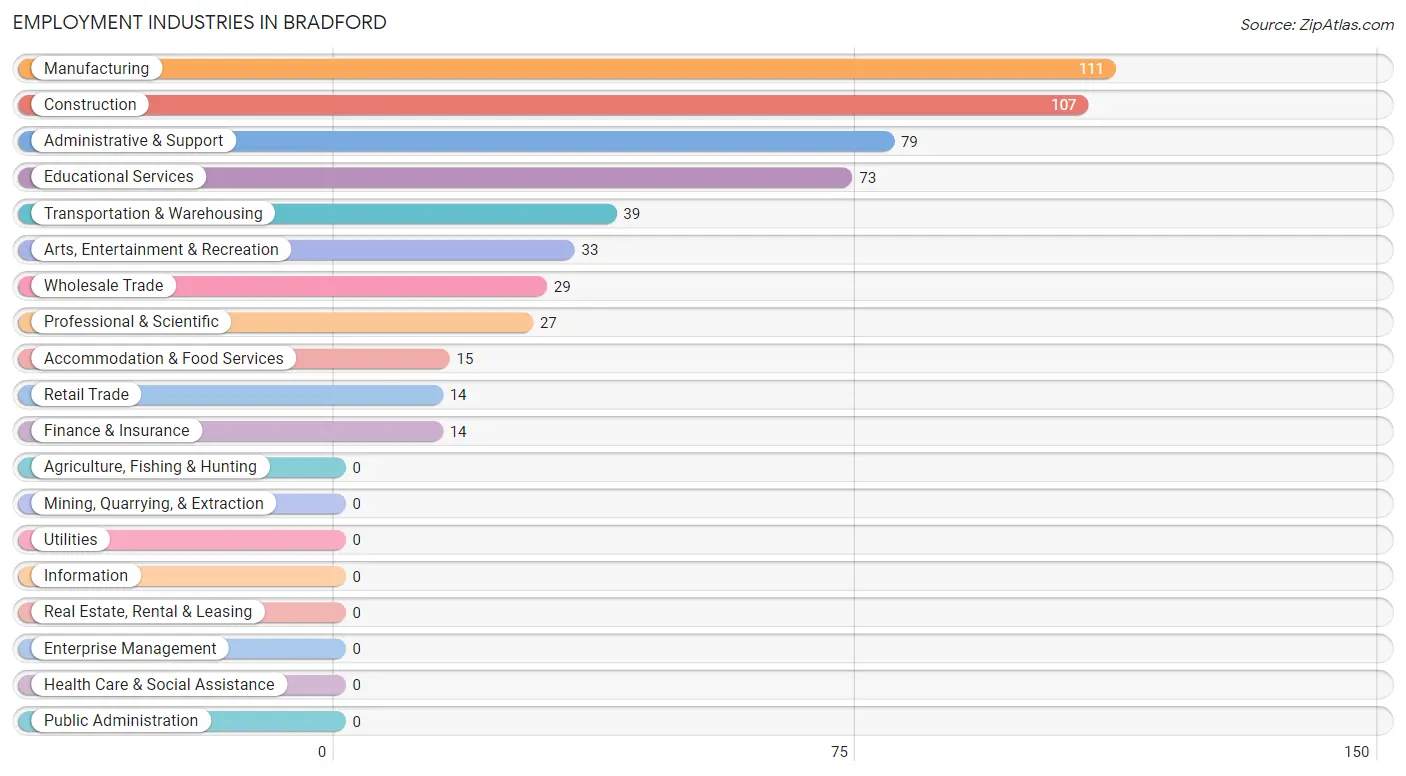
Employment Industries in Bradford
The major employment industries in Bradford include Manufacturing (111 | 19.6%), Construction (107 | 18.9%), Administrative & Support (79 | 13.9%), Educational Services (73 | 12.9%), and Transportation & Warehousing (39 | 6.9%).
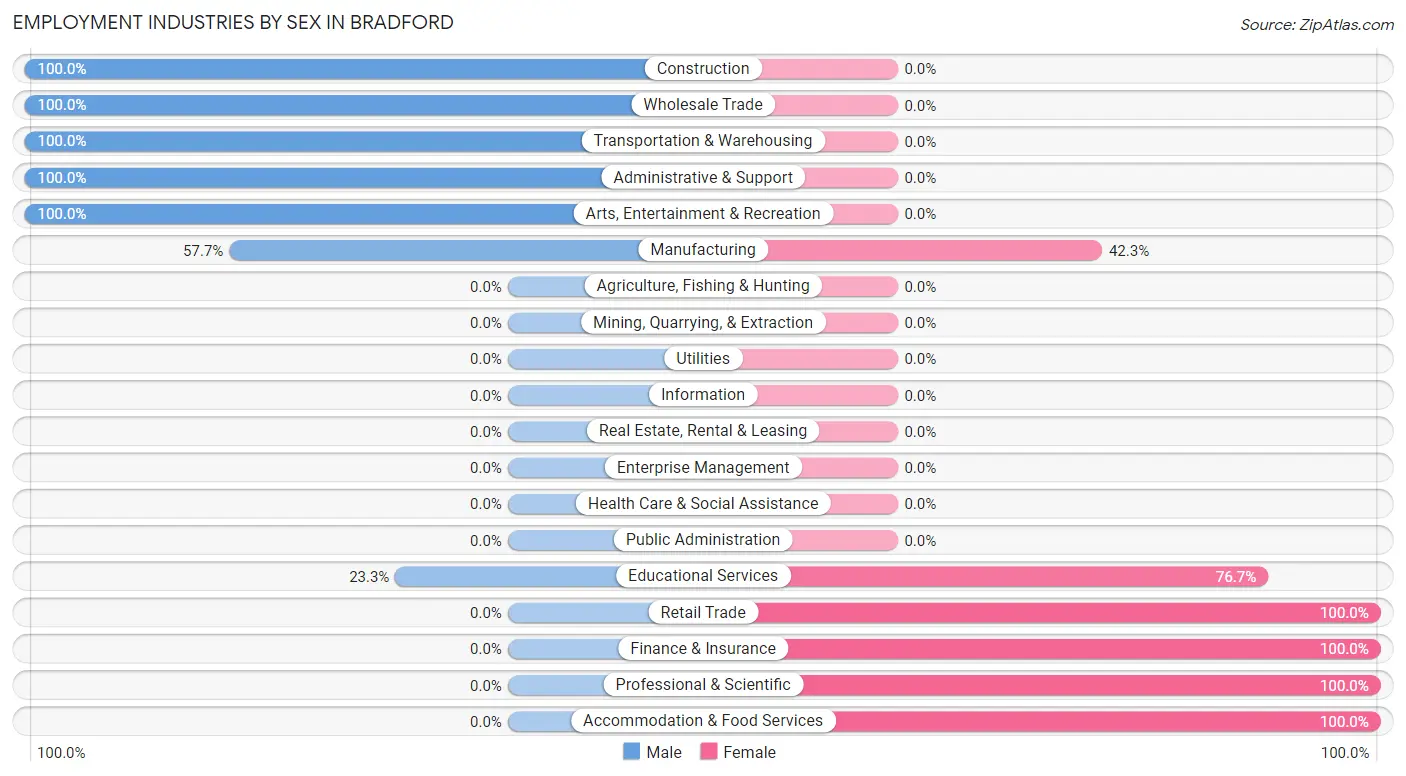
Employment Industries by Sex in Bradford
The Bradford industries that see more men than women are Construction (100.0%), Wholesale Trade (100.0%), and Transportation & Warehousing (100.0%), whereas the industries that tend to have a higher number of women are Retail Trade (100.0%), Finance & Insurance (100.0%), and Professional & Scientific (100.0%).
| Industry | Male | Female |
| Agriculture, Fishing & Hunting | 0 (0.0%) | 0 (0.0%) |
| Mining, Quarrying, & Extraction | 0 (0.0%) | 0 (0.0%) |
| Construction | 107 (100.0%) | 0 (0.0%) |
| Manufacturing | 64 (57.7%) | 47 (42.3%) |
| Wholesale Trade | 29 (100.0%) | 0 (0.0%) |
| Retail Trade | 0 (0.0%) | 14 (100.0%) |
| Transportation & Warehousing | 39 (100.0%) | 0 (0.0%) |
| Utilities | 0 (0.0%) | 0 (0.0%) |
| Information | 0 (0.0%) | 0 (0.0%) |
| Finance & Insurance | 0 (0.0%) | 14 (100.0%) |
| Real Estate, Rental & Leasing | 0 (0.0%) | 0 (0.0%) |
| Professional & Scientific | 0 (0.0%) | 27 (100.0%) |
| Enterprise Management | 0 (0.0%) | 0 (0.0%) |
| Administrative & Support | 79 (100.0%) | 0 (0.0%) |
| Educational Services | 17 (23.3%) | 56 (76.7%) |
| Health Care & Social Assistance | 0 (0.0%) | 0 (0.0%) |
| Arts, Entertainment & Recreation | 33 (100.0%) | 0 (0.0%) |
| Accommodation & Food Services | 0 (0.0%) | 15 (100.0%) |
| Public Administration | 0 (0.0%) | 0 (0.0%) |
| Total | 394 (69.5%) | 173 (30.5%) |
Education in Bradford
School Enrollment in Bradford
The most common levels of schooling among the 306 students in Bradford are high school (126 | 41.2%), middle school (84 | 27.5%), and elementary school (40 | 13.1%).
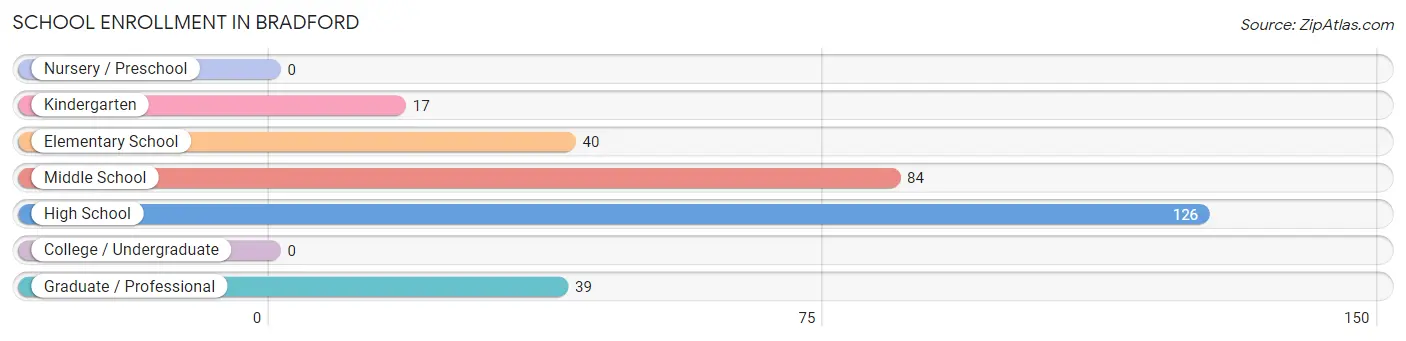
| School Level | # Students | % Students |
| Nursery / Preschool | 0 | 0.0% |
| Kindergarten | 17 | 5.6% |
| Elementary School | 40 | 13.1% |
| Middle School | 84 | 27.5% |
| High School | 126 | 41.2% |
| College / Undergraduate | 0 | 0.0% |
| Graduate / Professional | 39 | 12.8% |
| Total | 306 | 100.0% |
School Enrollment by Age by Funding Source in Bradford
Out of a total of 306 students who are enrolled in schools in Bradford, 18 (5.9%) attend a private institution, while the remaining 288 (94.1%) are enrolled in public schools. The age group of 18 to 19 year olds has the highest likelihood of being enrolled in private schools, with 18 (100.0% in the age bracket) enrolled. Conversely, the age group of 5 to 9 year old has the lowest likelihood of being enrolled in a private school, with 57 (100.0% in the age bracket) attending a public institution.
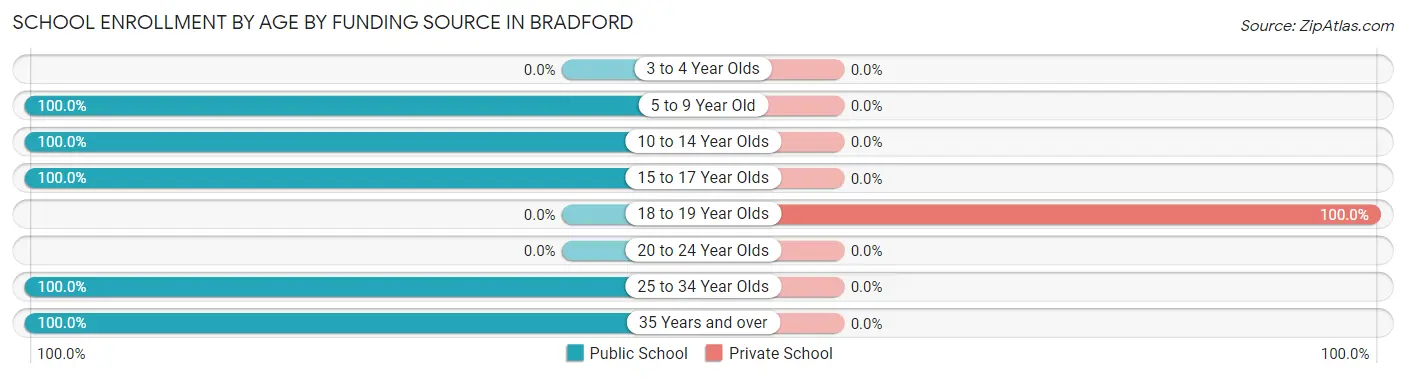
| Age Bracket | Public School | Private School |
| 3 to 4 Year Olds | 0 (0.0%) | 0 (0.0%) |
| 5 to 9 Year Old | 57 (100.0%) | 0 (0.0%) |
| 10 to 14 Year Olds | 84 (100.0%) | 0 (0.0%) |
| 15 to 17 Year Olds | 108 (100.0%) | 0 (0.0%) |
| 18 to 19 Year Olds | 0 (0.0%) | 18 (100.0%) |
| 20 to 24 Year Olds | 0 (0.0%) | 0 (0.0%) |
| 25 to 34 Year Olds | 12 (100.0%) | 0 (0.0%) |
| 35 Years and over | 27 (100.0%) | 0 (0.0%) |
| Total | 288 (94.1%) | 18 (5.9%) |
Educational Attainment by Field of Study in Bradford
Computers & mathematics (111 | 36.5%), education (88 | 28.9%), bio, nature & agricultural (43 | 14.1%), visual & performing arts (29 | 9.5%), and engineering (17 | 5.6%) are the most common fields of study among 304 individuals in Bradford who have obtained a bachelor's degree or higher.
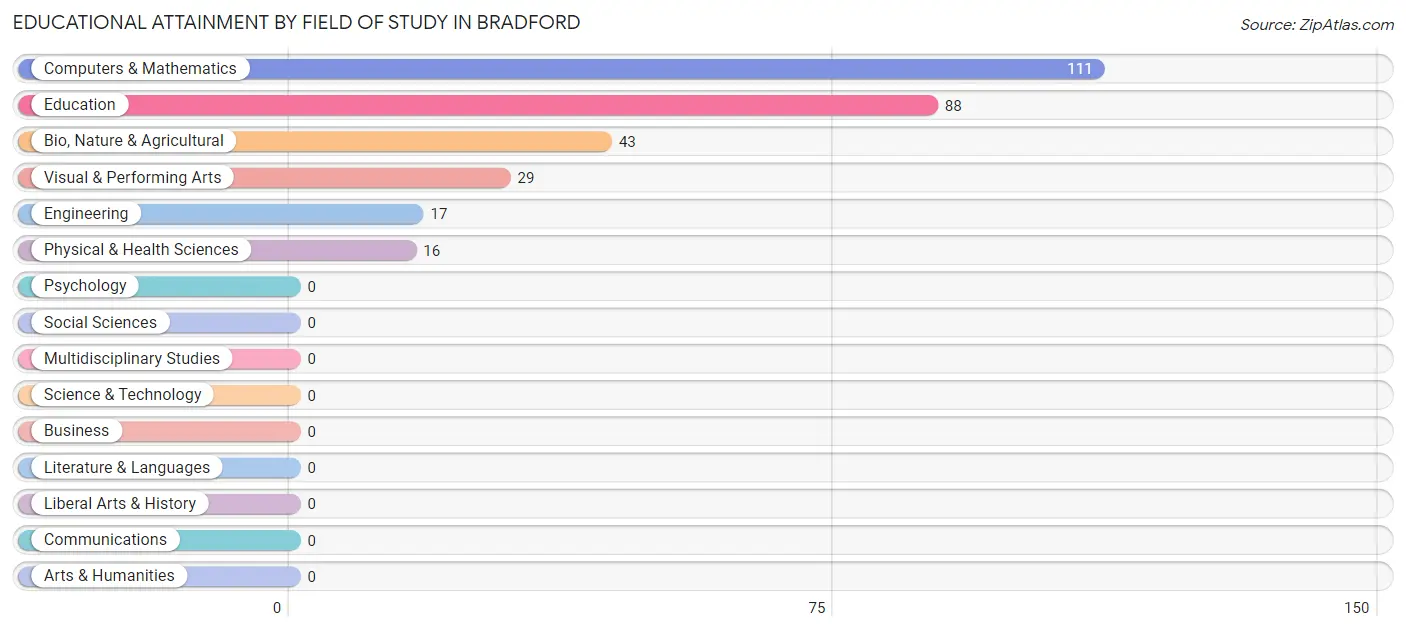
| Field of Study | # Graduates | % Graduates |
| Computers & Mathematics | 111 | 36.5% |
| Bio, Nature & Agricultural | 43 | 14.1% |
| Physical & Health Sciences | 16 | 5.3% |
| Psychology | 0 | 0.0% |
| Social Sciences | 0 | 0.0% |
| Engineering | 17 | 5.6% |
| Multidisciplinary Studies | 0 | 0.0% |
| Science & Technology | 0 | 0.0% |
| Business | 0 | 0.0% |
| Education | 88 | 28.9% |
| Literature & Languages | 0 | 0.0% |
| Liberal Arts & History | 0 | 0.0% |
| Visual & Performing Arts | 29 | 9.5% |
| Communications | 0 | 0.0% |
| Arts & Humanities | 0 | 0.0% |
| Total | 304 | 100.0% |
Transportation & Commute in Bradford
Vehicle Availability by Sex in Bradford
The most prevalent vehicle ownership categories in Bradford are males with 2 vehicles (234, accounting for 59.4%) and females with 2 vehicles (124, making up 135.3%).
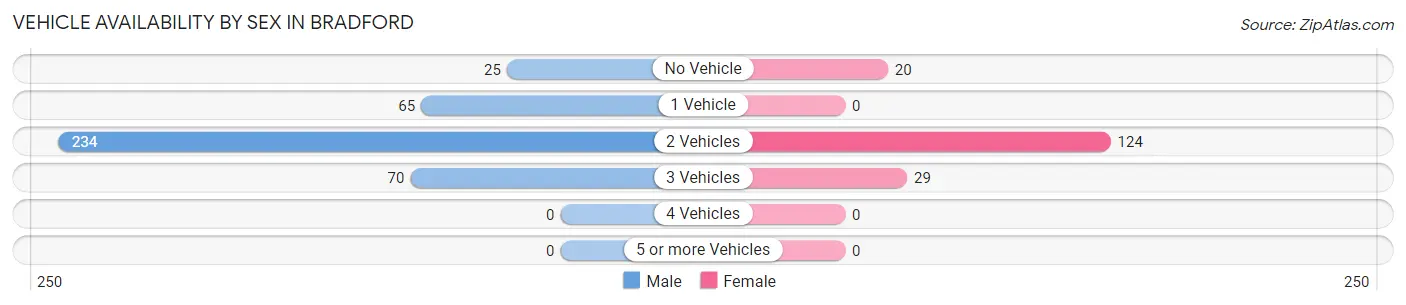
| Vehicles Available | Male | Female |
| No Vehicle | 25 (6.4%) | 20 (11.6%) |
| 1 Vehicle | 65 (16.5%) | 0 (0.0%) |
| 2 Vehicles | 234 (59.4%) | 124 (71.7%) |
| 3 Vehicles | 70 (17.8%) | 29 (16.8%) |
| 4 Vehicles | 0 (0.0%) | 0 (0.0%) |
| 5 or more Vehicles | 0 (0.0%) | 0 (0.0%) |
| Total | 394 (100.0%) | 173 (100.0%) |
Commute Time in Bradford
The most frequently occuring commute durations in Bradford are 45 to 59 minutes (127 commuters, 22.4%), 20 to 24 minutes (97 commuters, 17.1%), and 40 to 44 minutes (91 commuters, 16.1%).
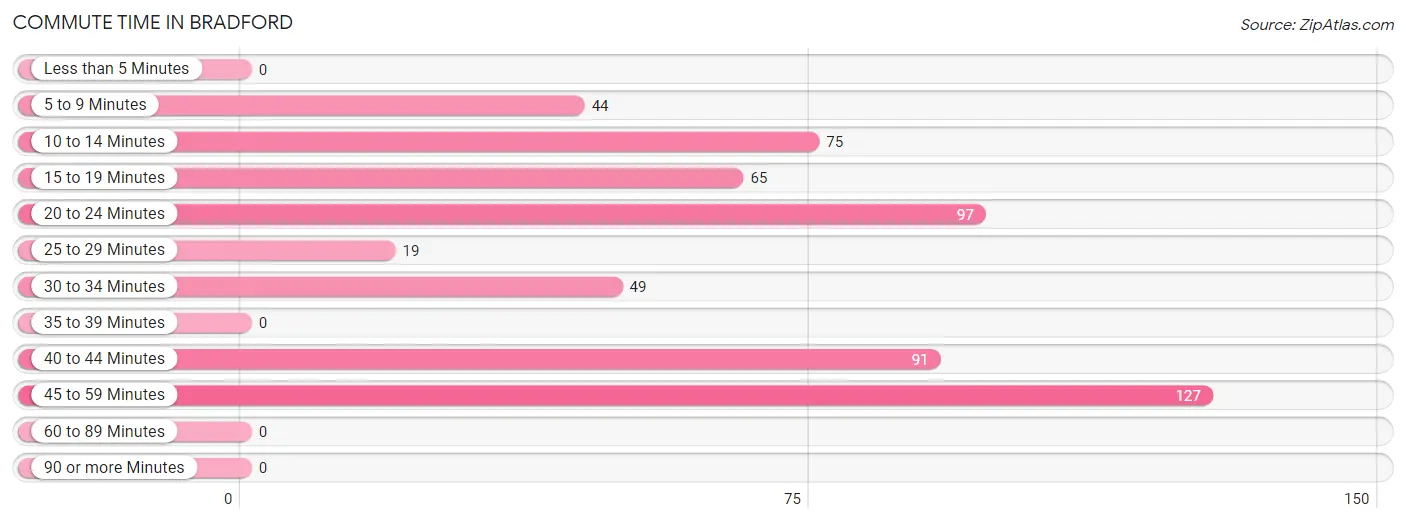
| Commute Time | # Commuters | % Commuters |
| Less than 5 Minutes | 0 | 0.0% |
| 5 to 9 Minutes | 44 | 7.8% |
| 10 to 14 Minutes | 75 | 13.2% |
| 15 to 19 Minutes | 65 | 11.5% |
| 20 to 24 Minutes | 97 | 17.1% |
| 25 to 29 Minutes | 19 | 3.4% |
| 30 to 34 Minutes | 49 | 8.6% |
| 35 to 39 Minutes | 0 | 0.0% |
| 40 to 44 Minutes | 91 | 16.1% |
| 45 to 59 Minutes | 127 | 22.4% |
| 60 to 89 Minutes | 0 | 0.0% |
| 90 or more Minutes | 0 | 0.0% |
Commute Time by Sex in Bradford
The most common commute times in Bradford are 45 to 59 minutes (127 commuters, 32.2%) for males and 15 to 19 minutes (65 commuters, 37.6%) for females.
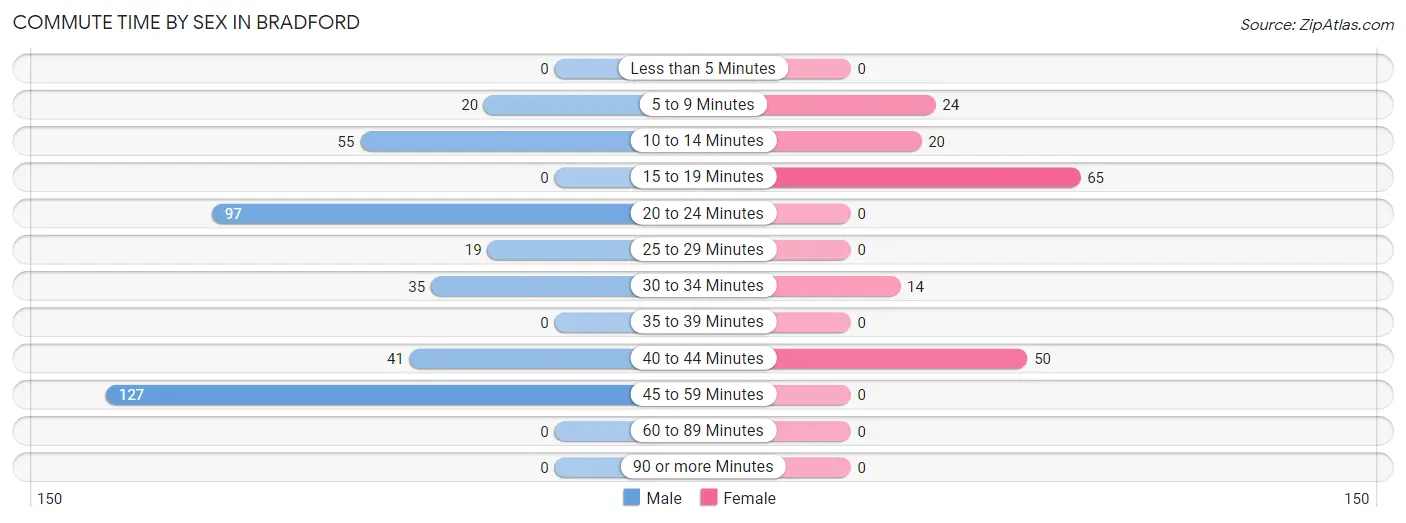
| Commute Time | Male | Female |
| Less than 5 Minutes | 0 (0.0%) | 0 (0.0%) |
| 5 to 9 Minutes | 20 (5.1%) | 24 (13.9%) |
| 10 to 14 Minutes | 55 (14.0%) | 20 (11.6%) |
| 15 to 19 Minutes | 0 (0.0%) | 65 (37.6%) |
| 20 to 24 Minutes | 97 (24.6%) | 0 (0.0%) |
| 25 to 29 Minutes | 19 (4.8%) | 0 (0.0%) |
| 30 to 34 Minutes | 35 (8.9%) | 14 (8.1%) |
| 35 to 39 Minutes | 0 (0.0%) | 0 (0.0%) |
| 40 to 44 Minutes | 41 (10.4%) | 50 (28.9%) |
| 45 to 59 Minutes | 127 (32.2%) | 0 (0.0%) |
| 60 to 89 Minutes | 0 (0.0%) | 0 (0.0%) |
| 90 or more Minutes | 0 (0.0%) | 0 (0.0%) |
Time of Departure to Work by Sex in Bradford
The most frequent times of departure to work in Bradford are 7:00 AM to 7:29 AM (100, 25.4%) for males and 7:00 AM to 7:29 AM (61, 35.3%) for females.
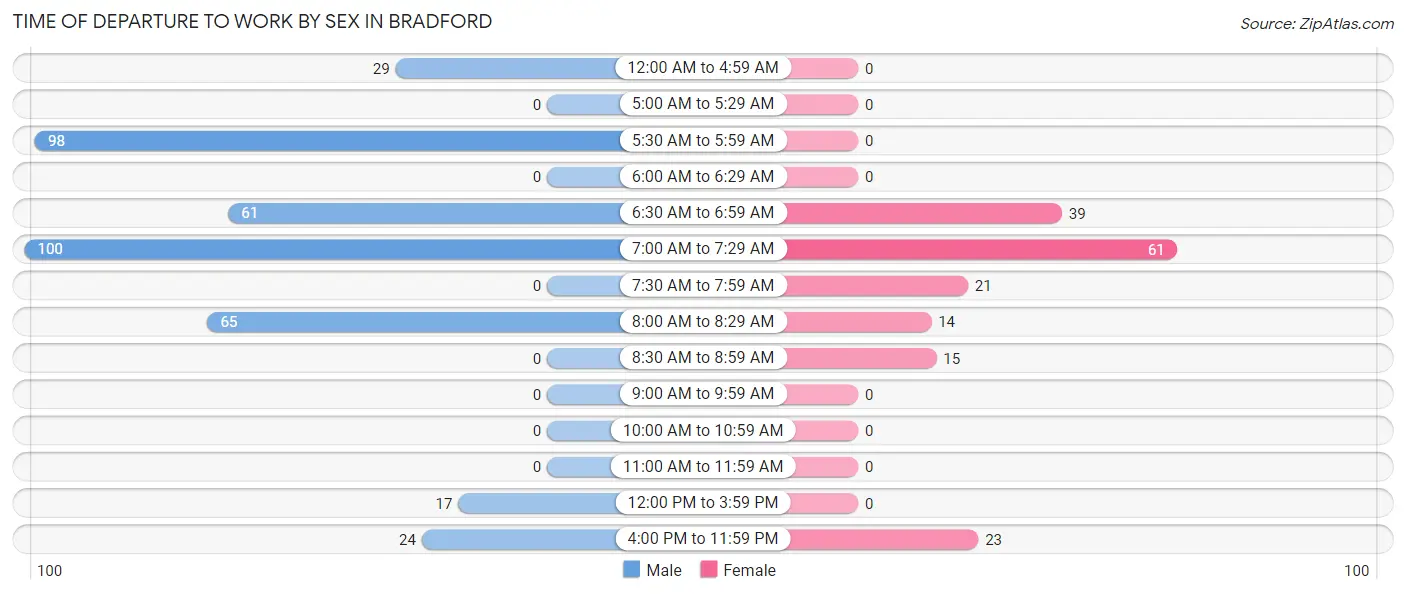
| Time of Departure | Male | Female |
| 12:00 AM to 4:59 AM | 29 (7.4%) | 0 (0.0%) |
| 5:00 AM to 5:29 AM | 0 (0.0%) | 0 (0.0%) |
| 5:30 AM to 5:59 AM | 98 (24.9%) | 0 (0.0%) |
| 6:00 AM to 6:29 AM | 0 (0.0%) | 0 (0.0%) |
| 6:30 AM to 6:59 AM | 61 (15.5%) | 39 (22.5%) |
| 7:00 AM to 7:29 AM | 100 (25.4%) | 61 (35.3%) |
| 7:30 AM to 7:59 AM | 0 (0.0%) | 21 (12.1%) |
| 8:00 AM to 8:29 AM | 65 (16.5%) | 14 (8.1%) |
| 8:30 AM to 8:59 AM | 0 (0.0%) | 15 (8.7%) |
| 9:00 AM to 9:59 AM | 0 (0.0%) | 0 (0.0%) |
| 10:00 AM to 10:59 AM | 0 (0.0%) | 0 (0.0%) |
| 11:00 AM to 11:59 AM | 0 (0.0%) | 0 (0.0%) |
| 12:00 PM to 3:59 PM | 17 (4.3%) | 0 (0.0%) |
| 4:00 PM to 11:59 PM | 24 (6.1%) | 23 (13.3%) |
| Total | 394 (100.0%) | 173 (100.0%) |
Housing Occupancy in Bradford
Occupancy by Ownership in Bradford
Of the total 517 dwellings in Bradford, owner-occupied units account for 329 (63.6%), while renter-occupied units make up 188 (36.4%).
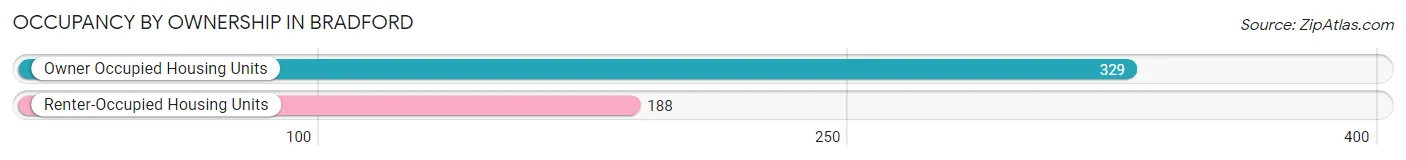
| Occupancy | # Housing Units | % Housing Units |
| Owner Occupied Housing Units | 329 | 63.6% |
| Renter-Occupied Housing Units | 188 | 36.4% |
| Total Occupied Housing Units | 517 | 100.0% |
Occupancy by Household Size in Bradford
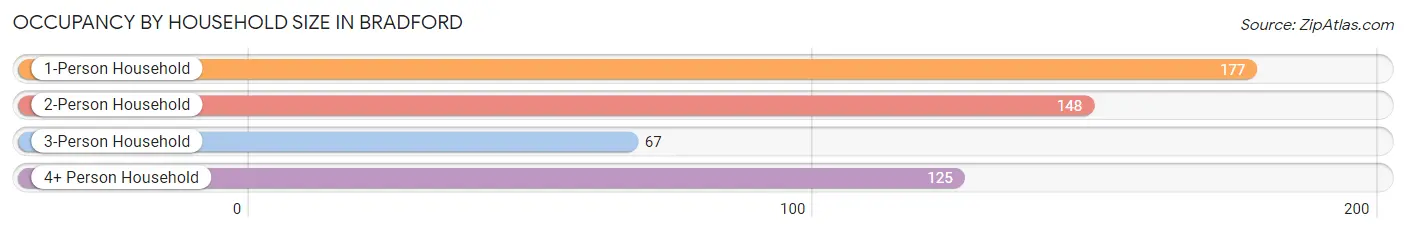
| Household Size | # Housing Units | % Housing Units |
| 1-Person Household | 177 | 34.2% |
| 2-Person Household | 148 | 28.6% |
| 3-Person Household | 67 | 13.0% |
| 4+ Person Household | 125 | 24.2% |
| Total Housing Units | 517 | 100.0% |
Occupancy by Ownership by Household Size in Bradford
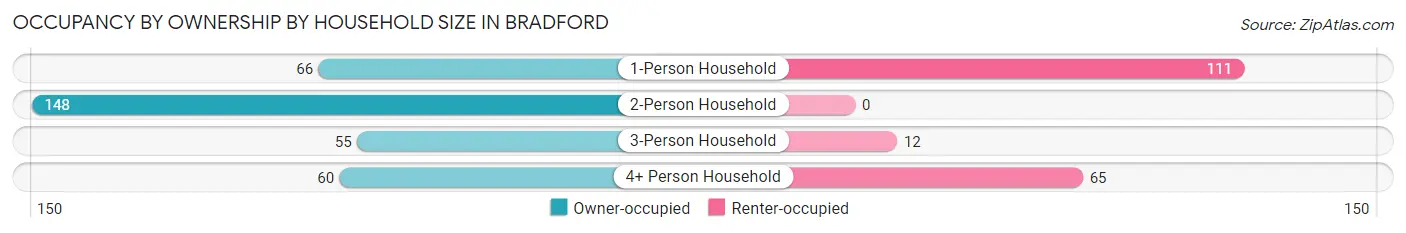
| Household Size | Owner-occupied | Renter-occupied |
| 1-Person Household | 66 (37.3%) | 111 (62.7%) |
| 2-Person Household | 148 (100.0%) | 0 (0.0%) |
| 3-Person Household | 55 (82.1%) | 12 (17.9%) |
| 4+ Person Household | 60 (48.0%) | 65 (52.0%) |
| Total Housing Units | 329 (63.6%) | 188 (36.4%) |
Occupancy by Educational Attainment in Bradford
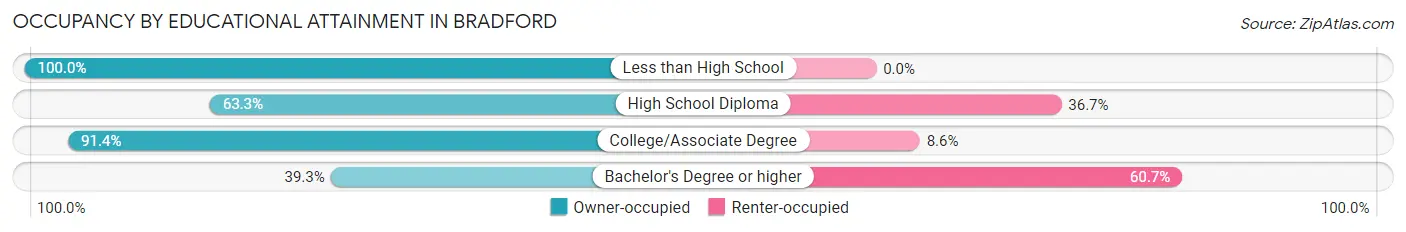
| Household Size | Owner-occupied | Renter-occupied |
| Less than High School | 18 (100.0%) | 0 (0.0%) |
| High School Diploma | 112 (63.3%) | 65 (36.7%) |
| College/Associate Degree | 127 (91.4%) | 12 (8.6%) |
| Bachelor's Degree or higher | 72 (39.3%) | 111 (60.7%) |
Occupancy by Age of Householder in Bradford
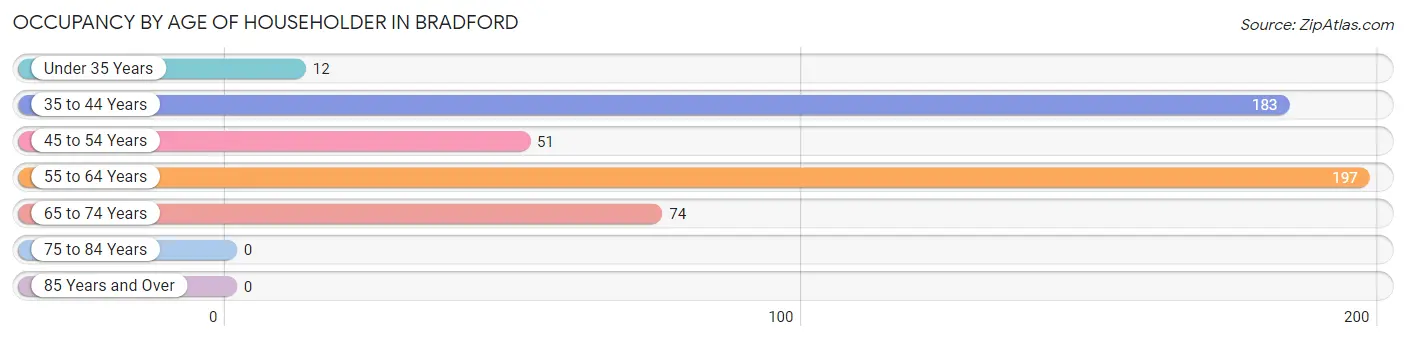
| Age Bracket | # Households | % Households |
| Under 35 Years | 12 | 2.3% |
| 35 to 44 Years | 183 | 35.4% |
| 45 to 54 Years | 51 | 9.9% |
| 55 to 64 Years | 197 | 38.1% |
| 65 to 74 Years | 74 | 14.3% |
| 75 to 84 Years | 0 | 0.0% |
| 85 Years and Over | 0 | 0.0% |
| Total | 517 | 100.0% |
Housing Finances in Bradford
Median Income by Occupancy in Bradford
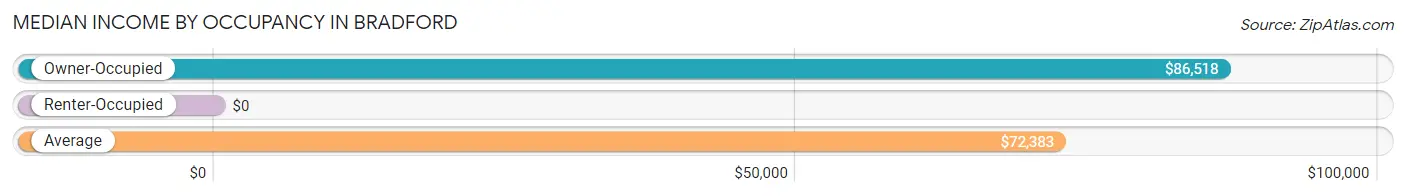
| Occupancy Type | # Households | Median Income |
| Owner-Occupied | 329 (63.6%) | $86,518 |
| Renter-Occupied | 188 (36.4%) | $0 |
| Average | 517 (100.0%) | $72,383 |
Occupancy by Householder Income Bracket in Bradford
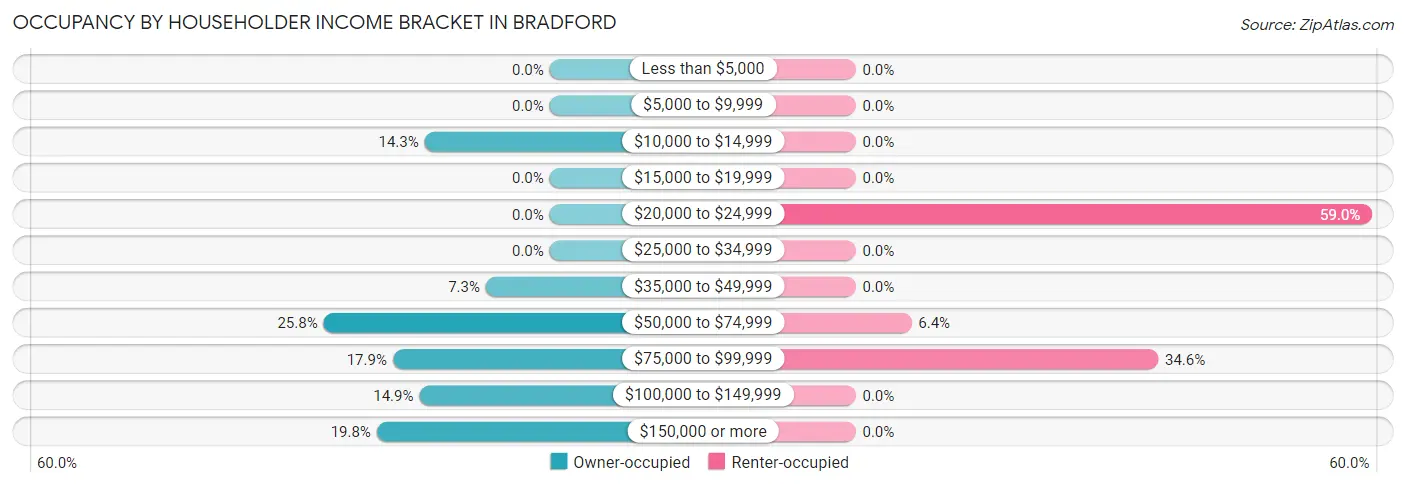
| Income Bracket | Owner-occupied | Renter-occupied |
| Less than $5,000 | 0 (0.0%) | 0 (0.0%) |
| $5,000 to $9,999 | 0 (0.0%) | 0 (0.0%) |
| $10,000 to $14,999 | 47 (14.3%) | 0 (0.0%) |
| $15,000 to $19,999 | 0 (0.0%) | 0 (0.0%) |
| $20,000 to $24,999 | 0 (0.0%) | 111 (59.0%) |
| $25,000 to $34,999 | 0 (0.0%) | 0 (0.0%) |
| $35,000 to $49,999 | 24 (7.3%) | 0 (0.0%) |
| $50,000 to $74,999 | 85 (25.8%) | 12 (6.4%) |
| $75,000 to $99,999 | 59 (17.9%) | 65 (34.6%) |
| $100,000 to $149,999 | 49 (14.9%) | 0 (0.0%) |
| $150,000 or more | 65 (19.8%) | 0 (0.0%) |
| Total | 329 (100.0%) | 188 (100.0%) |
Monthly Housing Cost Tiers in Bradford
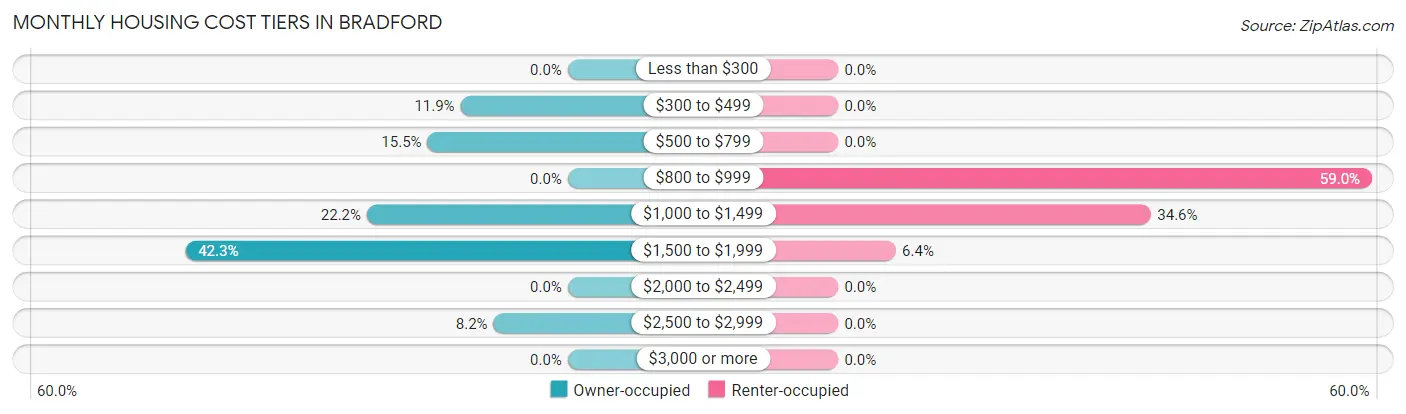
| Monthly Cost | Owner-occupied | Renter-occupied |
| Less than $300 | 0 (0.0%) | 0 (0.0%) |
| $300 to $499 | 39 (11.8%) | 0 (0.0%) |
| $500 to $799 | 51 (15.5%) | 0 (0.0%) |
| $800 to $999 | 0 (0.0%) | 111 (59.0%) |
| $1,000 to $1,499 | 73 (22.2%) | 65 (34.6%) |
| $1,500 to $1,999 | 139 (42.2%) | 12 (6.4%) |
| $2,000 to $2,499 | 0 (0.0%) | 0 (0.0%) |
| $2,500 to $2,999 | 27 (8.2%) | 0 (0.0%) |
| $3,000 or more | 0 (0.0%) | 0 (0.0%) |
| Total | 329 (100.0%) | 188 (100.0%) |
Physical Housing Characteristics in Bradford
Housing Structures in Bradford
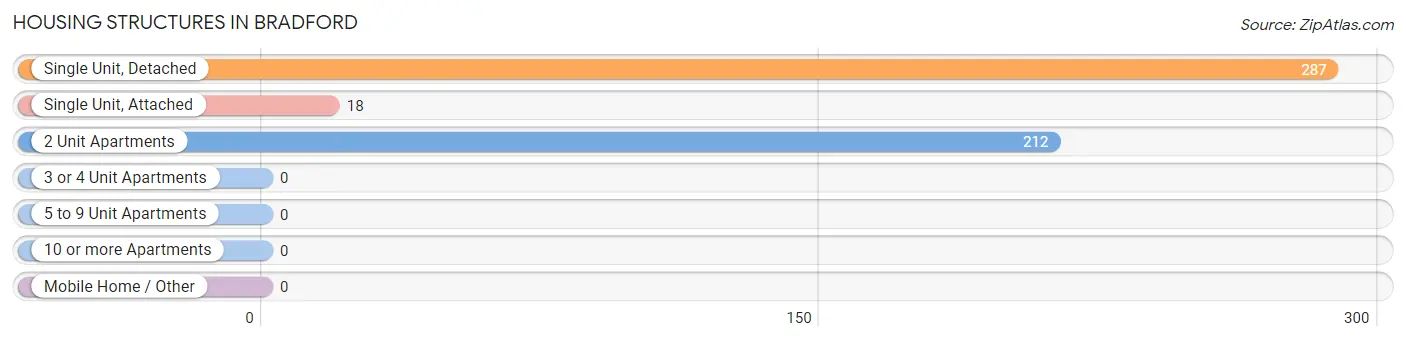
| Structure Type | # Housing Units | % Housing Units |
| Single Unit, Detached | 287 | 55.5% |
| Single Unit, Attached | 18 | 3.5% |
| 2 Unit Apartments | 212 | 41.0% |
| 3 or 4 Unit Apartments | 0 | 0.0% |
| 5 to 9 Unit Apartments | 0 | 0.0% |
| 10 or more Apartments | 0 | 0.0% |
| Mobile Home / Other | 0 | 0.0% |
| Total | 517 | 100.0% |
Housing Structures by Occupancy in Bradford
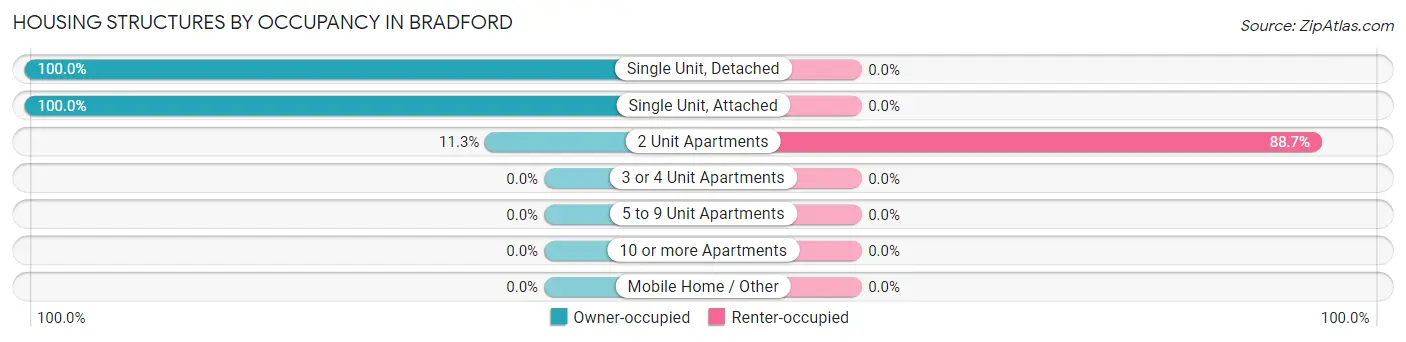
| Structure Type | Owner-occupied | Renter-occupied |
| Single Unit, Detached | 287 (100.0%) | 0 (0.0%) |
| Single Unit, Attached | 18 (100.0%) | 0 (0.0%) |
| 2 Unit Apartments | 24 (11.3%) | 188 (88.7%) |
| 3 or 4 Unit Apartments | 0 (0.0%) | 0 (0.0%) |
| 5 to 9 Unit Apartments | 0 (0.0%) | 0 (0.0%) |
| 10 or more Apartments | 0 (0.0%) | 0 (0.0%) |
| Mobile Home / Other | 0 (0.0%) | 0 (0.0%) |
| Total | 329 (63.6%) | 188 (36.4%) |
Housing Structures by Number of Rooms in Bradford
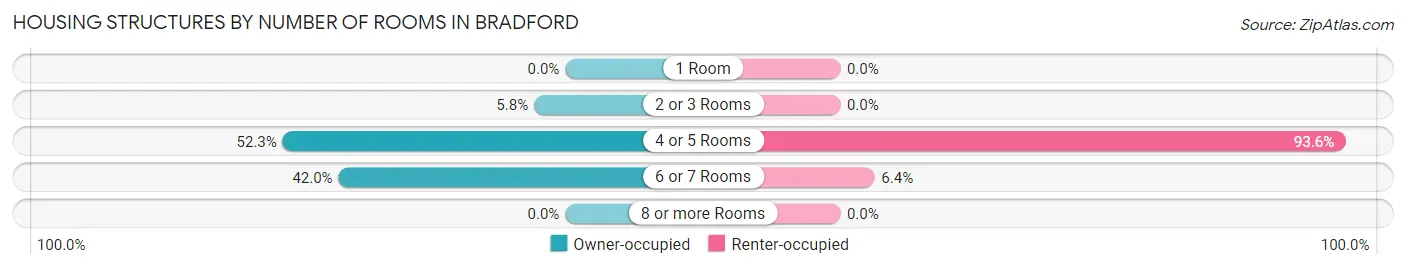
| Number of Rooms | Owner-occupied | Renter-occupied |
| 1 Room | 0 (0.0%) | 0 (0.0%) |
| 2 or 3 Rooms | 19 (5.8%) | 0 (0.0%) |
| 4 or 5 Rooms | 172 (52.3%) | 176 (93.6%) |
| 6 or 7 Rooms | 138 (41.9%) | 12 (6.4%) |
| 8 or more Rooms | 0 (0.0%) | 0 (0.0%) |
| Total | 329 (100.0%) | 188 (100.0%) |
Housing Structure by Heating Type in Bradford
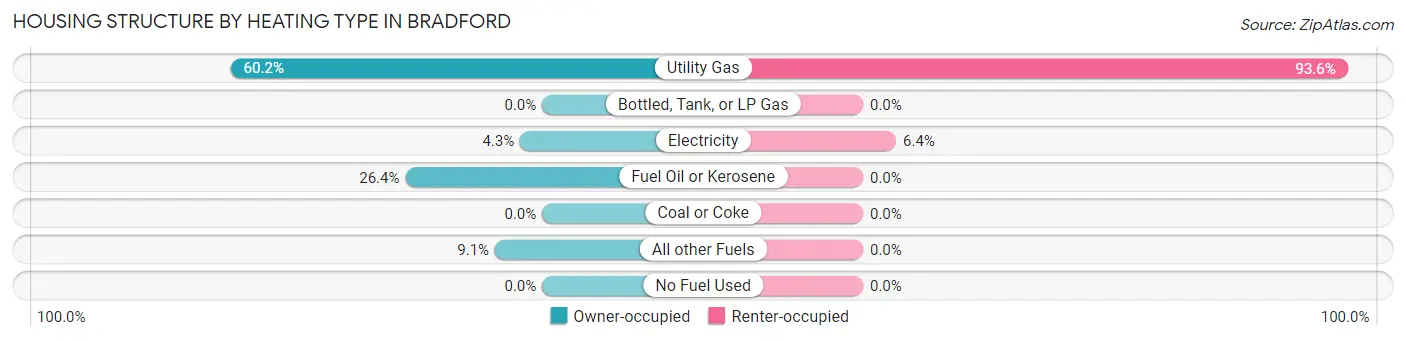
| Heating Type | Owner-occupied | Renter-occupied |
| Utility Gas | 198 (60.2%) | 176 (93.6%) |
| Bottled, Tank, or LP Gas | 0 (0.0%) | 0 (0.0%) |
| Electricity | 14 (4.3%) | 12 (6.4%) |
| Fuel Oil or Kerosene | 87 (26.4%) | 0 (0.0%) |
| Coal or Coke | 0 (0.0%) | 0 (0.0%) |
| All other Fuels | 30 (9.1%) | 0 (0.0%) |
| No Fuel Used | 0 (0.0%) | 0 (0.0%) |
| Total | 329 (100.0%) | 188 (100.0%) |
Household Vehicle Usage in Bradford
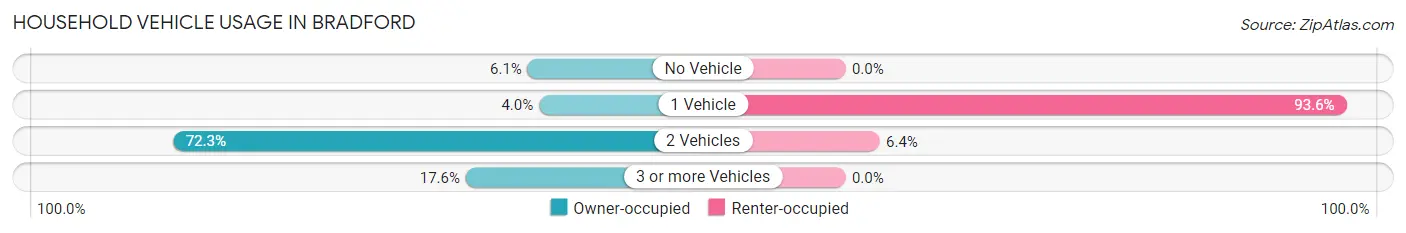
| Vehicles per Household | Owner-occupied | Renter-occupied |
| No Vehicle | 20 (6.1%) | 0 (0.0%) |
| 1 Vehicle | 13 (4.0%) | 176 (93.6%) |
| 2 Vehicles | 238 (72.3%) | 12 (6.4%) |
| 3 or more Vehicles | 58 (17.6%) | 0 (0.0%) |
| Total | 329 (100.0%) | 188 (100.0%) |
Real Estate & Mortgages in Bradford
Real Estate and Mortgage Overview in Bradford
| Characteristic | Without Mortgage | With Mortgage |
| Housing Units | 90 | 239 |
| Median Property Value | $210,700 | $287,100 |
| Median Household Income | $58,750 | $65 |
| Monthly Housing Costs | $512 | $0 |
| Real Estate Taxes | - | - |
Property Value by Mortgage Status in Bradford
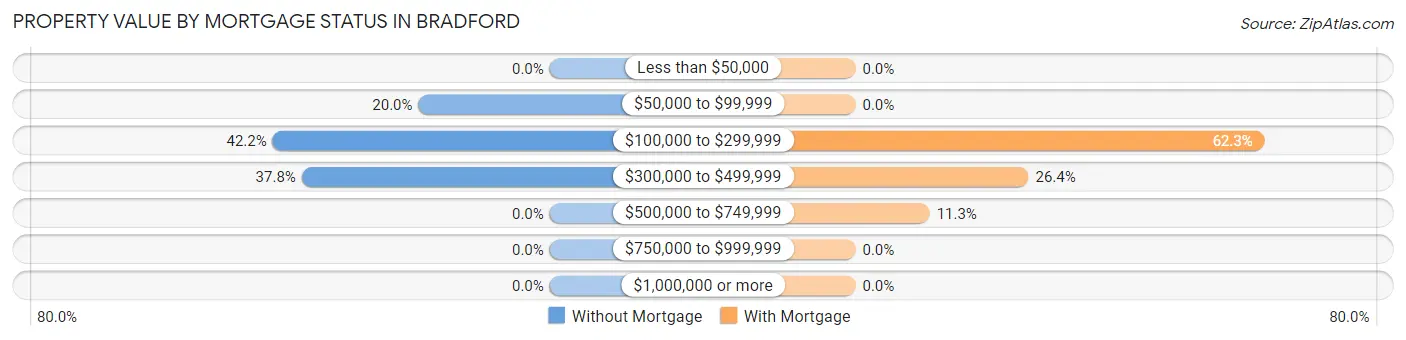
| Property Value | Without Mortgage | With Mortgage |
| Less than $50,000 | 0 (0.0%) | 0 (0.0%) |
| $50,000 to $99,999 | 18 (20.0%) | 0 (0.0%) |
| $100,000 to $299,999 | 38 (42.2%) | 149 (62.3%) |
| $300,000 to $499,999 | 34 (37.8%) | 63 (26.4%) |
| $500,000 to $749,999 | 0 (0.0%) | 27 (11.3%) |
| $750,000 to $999,999 | 0 (0.0%) | 0 (0.0%) |
| $1,000,000 or more | 0 (0.0%) | 0 (0.0%) |
| Total | 90 (100.0%) | 239 (100.0%) |
Household Income by Mortgage Status in Bradford
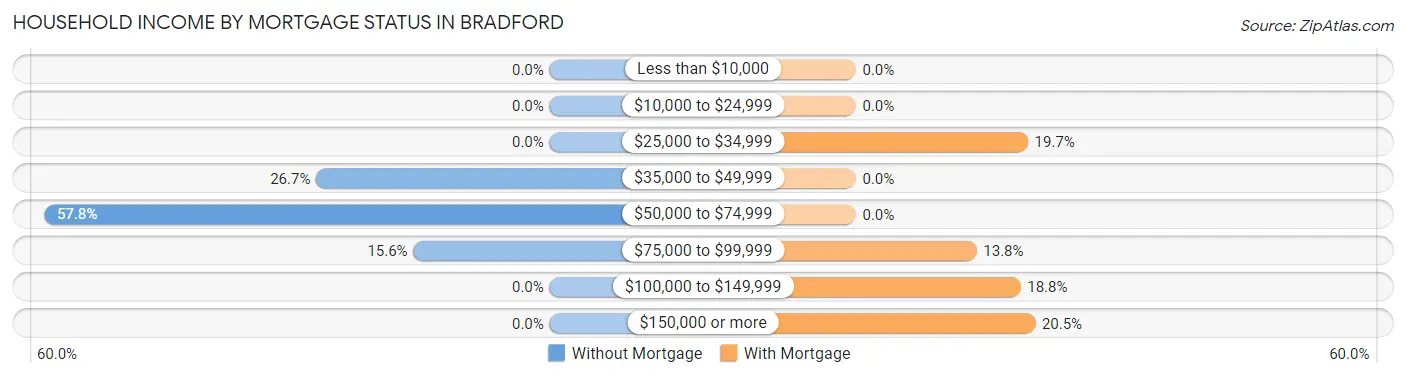
| Household Income | Without Mortgage | With Mortgage |
| Less than $10,000 | 0 (0.0%) | 0 (0.0%) |
| $10,000 to $24,999 | 0 (0.0%) | 0 (0.0%) |
| $25,000 to $34,999 | 0 (0.0%) | 47 (19.7%) |
| $35,000 to $49,999 | 24 (26.7%) | 0 (0.0%) |
| $50,000 to $74,999 | 52 (57.8%) | 0 (0.0%) |
| $75,000 to $99,999 | 14 (15.6%) | 33 (13.8%) |
| $100,000 to $149,999 | 0 (0.0%) | 45 (18.8%) |
| $150,000 or more | 0 (0.0%) | 49 (20.5%) |
| Total | 90 (100.0%) | 239 (100.0%) |
Property Value to Household Income Ratio in Bradford
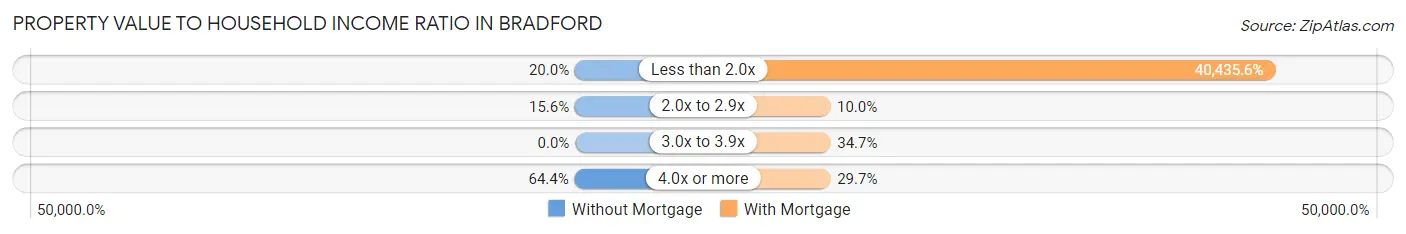
| Value-to-Income Ratio | Without Mortgage | With Mortgage |
| Less than 2.0x | 18 (20.0%) | 96,641 (40,435.6%) |
| 2.0x to 2.9x | 14 (15.6%) | 24 (10.0%) |
| 3.0x to 3.9x | 0 (0.0%) | 83 (34.7%) |
| 4.0x or more | 58 (64.4%) | 71 (29.7%) |
| Total | 90 (100.0%) | 239 (100.0%) |
Real Estate Taxes by Mortgage Status in Bradford
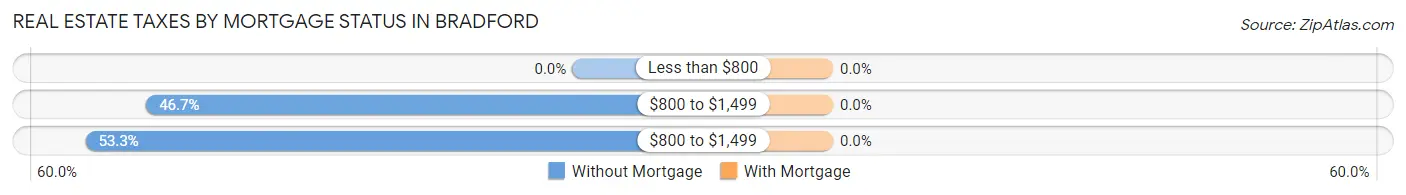
| Property Taxes | Without Mortgage | With Mortgage |
| Less than $800 | 0 (0.0%) | 0 (0.0%) |
| $800 to $1,499 | 42 (46.7%) | 0 (0.0%) |
| $800 to $1,499 | 48 (53.3%) | 0 (0.0%) |
| Total | 90 (100.0%) | 239 (100.0%) |
Health & Disability in Bradford
Health Insurance Coverage by Age in Bradford
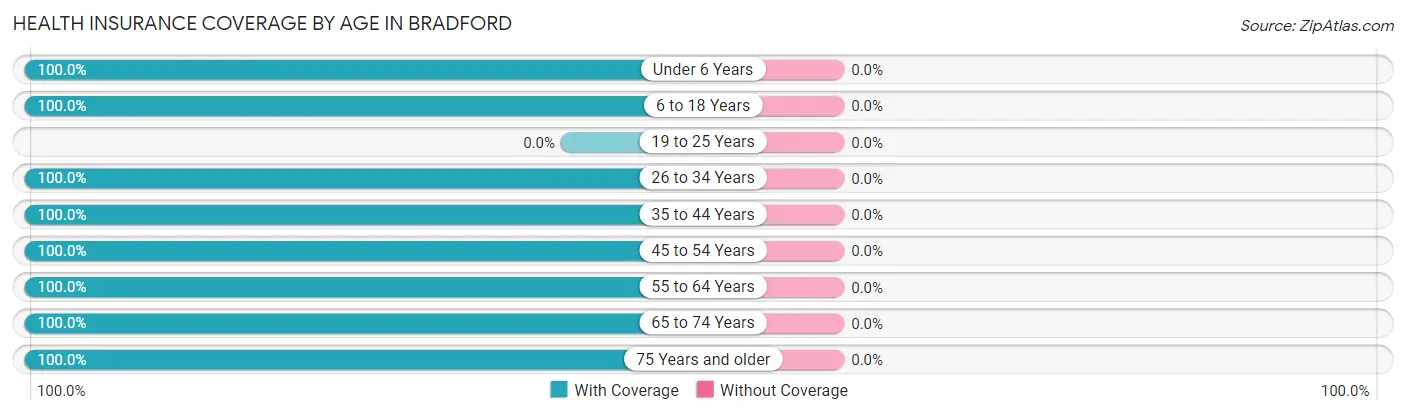
| Age Bracket | With Coverage | Without Coverage |
| Under 6 Years | 44 (100.0%) | 0 (0.0%) |
| 6 to 18 Years | 250 (100.0%) | 0 (0.0%) |
| 19 to 25 Years | 0 (0.0%) | 0 (0.0%) |
| 26 to 34 Years | 86 (100.0%) | 0 (0.0%) |
| 35 to 44 Years | 274 (100.0%) | 0 (0.0%) |
| 45 to 54 Years | 134 (100.0%) | 0 (0.0%) |
| 55 to 64 Years | 280 (100.0%) | 0 (0.0%) |
| 65 to 74 Years | 107 (100.0%) | 0 (0.0%) |
| 75 Years and older | 14 (100.0%) | 0 (0.0%) |
| Total | 1,189 (100.0%) | 0 (0.0%) |
Health Insurance Coverage by Citizenship Status in Bradford
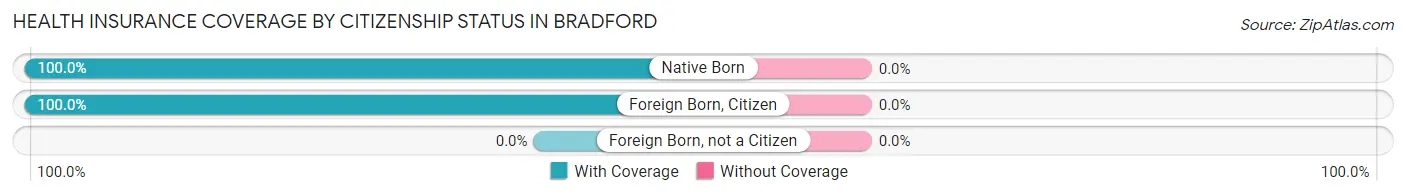
| Citizenship Status | With Coverage | Without Coverage |
| Native Born | 44 (100.0%) | 0 (0.0%) |
| Foreign Born, Citizen | 250 (100.0%) | 0 (0.0%) |
| Foreign Born, not a Citizen | 0 (0.0%) | 0 (0.0%) |
Health Insurance Coverage by Household Income in Bradford
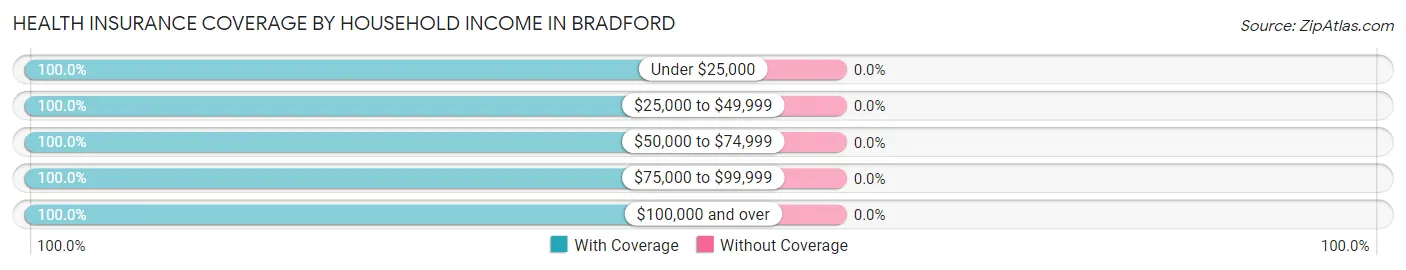
| Household Income | With Coverage | Without Coverage |
| Under $25,000 | 158 (100.0%) | 0 (0.0%) |
| $25,000 to $49,999 | 89 (100.0%) | 0 (0.0%) |
| $50,000 to $74,999 | 218 (100.0%) | 0 (0.0%) |
| $75,000 to $99,999 | 406 (100.0%) | 0 (0.0%) |
| $100,000 and over | 318 (100.0%) | 0 (0.0%) |
Public vs Private Health Insurance Coverage by Age in Bradford
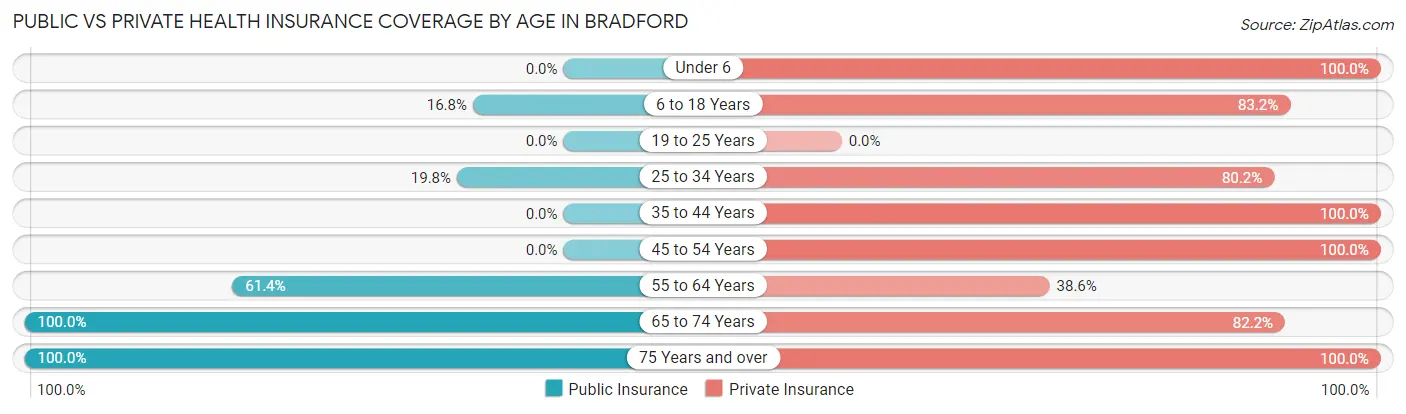
| Age Bracket | Public Insurance | Private Insurance |
| Under 6 | 0 (0.0%) | 44 (100.0%) |
| 6 to 18 Years | 42 (16.8%) | 208 (83.2%) |
| 19 to 25 Years | 0 (0.0%) | 0 (0.0%) |
| 25 to 34 Years | 17 (19.8%) | 69 (80.2%) |
| 35 to 44 Years | 0 (0.0%) | 274 (100.0%) |
| 45 to 54 Years | 0 (0.0%) | 134 (100.0%) |
| 55 to 64 Years | 172 (61.4%) | 108 (38.6%) |
| 65 to 74 Years | 107 (100.0%) | 88 (82.2%) |
| 75 Years and over | 14 (100.0%) | 14 (100.0%) |
| Total | 352 (29.6%) | 939 (79.0%) |
Disability Status by Sex by Age in Bradford
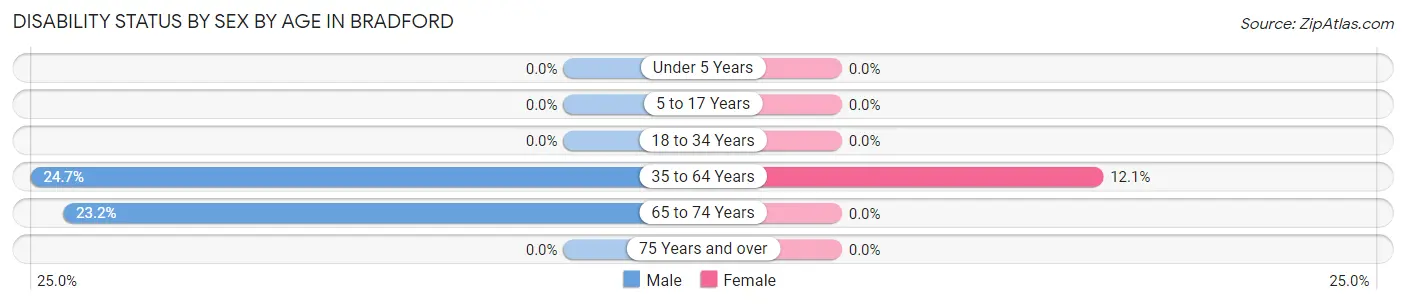
| Age Bracket | Male | Female |
| Under 5 Years | 0 (0.0%) | 0 (0.0%) |
| 5 to 17 Years | 0 (0.0%) | 0 (0.0%) |
| 18 to 34 Years | 0 (0.0%) | 0 (0.0%) |
| 35 to 64 Years | 111 (24.7%) | 29 (12.1%) |
| 65 to 74 Years | 13 (23.2%) | 0 (0.0%) |
| 75 Years and over | 0 (0.0%) | 0 (0.0%) |
Disability Class by Sex by Age in Bradford
Disability Class: Hearing Difficulty
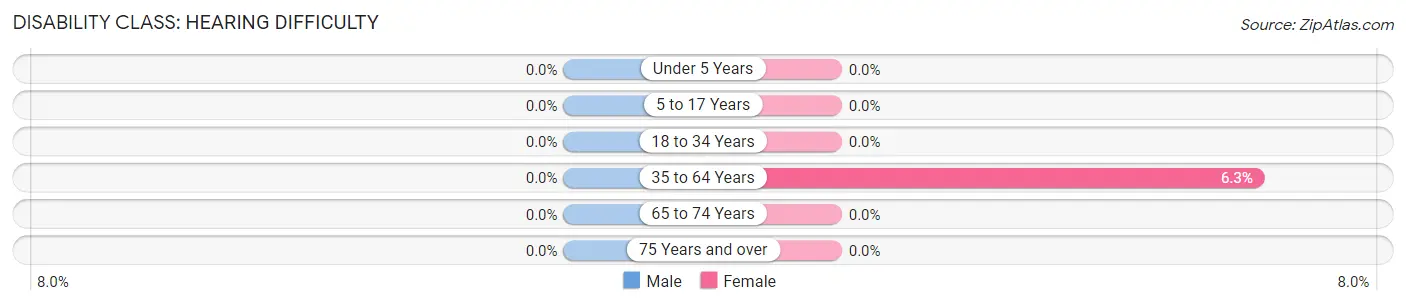
| Age Bracket | Male | Female |
| Under 5 Years | 0 (0.0%) | 0 (0.0%) |
| 5 to 17 Years | 0 (0.0%) | 0 (0.0%) |
| 18 to 34 Years | 0 (0.0%) | 0 (0.0%) |
| 35 to 64 Years | 0 (0.0%) | 15 (6.3%) |
| 65 to 74 Years | 0 (0.0%) | 0 (0.0%) |
| 75 Years and over | 0 (0.0%) | 0 (0.0%) |
Disability Class: Vision Difficulty
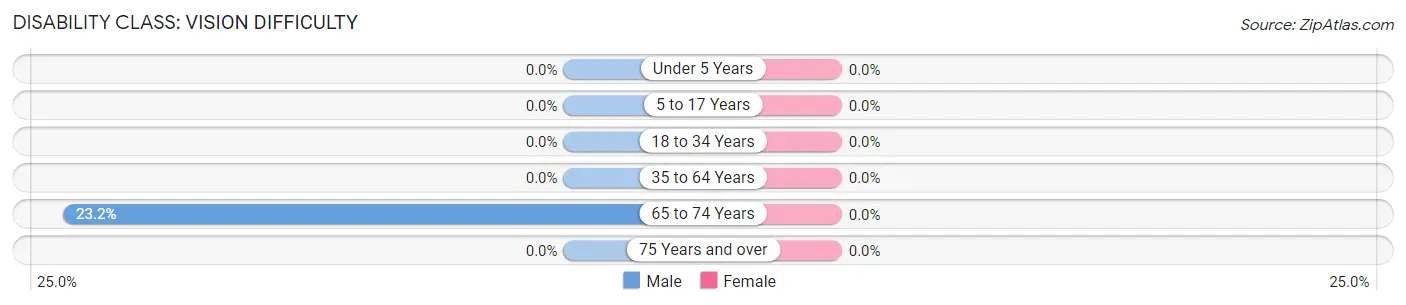
| Age Bracket | Male | Female |
| Under 5 Years | 0 (0.0%) | 0 (0.0%) |
| 5 to 17 Years | 0 (0.0%) | 0 (0.0%) |
| 18 to 34 Years | 0 (0.0%) | 0 (0.0%) |
| 35 to 64 Years | 0 (0.0%) | 0 (0.0%) |
| 65 to 74 Years | 13 (23.2%) | 0 (0.0%) |
| 75 Years and over | 0 (0.0%) | 0 (0.0%) |
Disability Class: Cognitive Difficulty
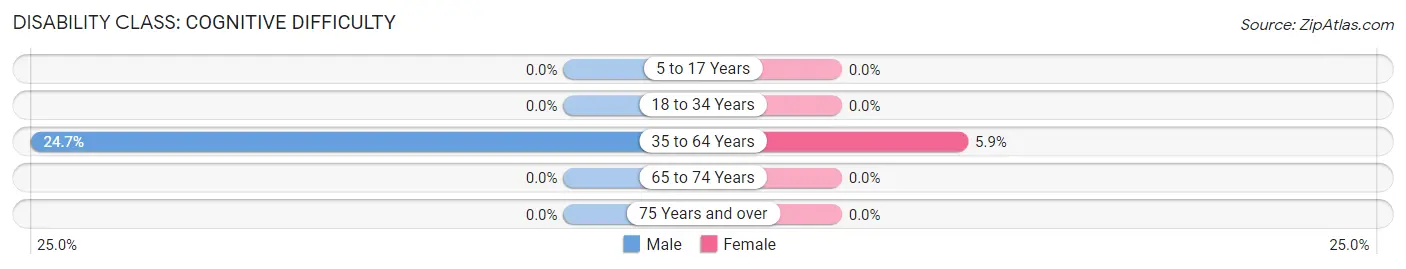
| Age Bracket | Male | Female |
| 5 to 17 Years | 0 (0.0%) | 0 (0.0%) |
| 18 to 34 Years | 0 (0.0%) | 0 (0.0%) |
| 35 to 64 Years | 111 (24.7%) | 14 (5.9%) |
| 65 to 74 Years | 0 (0.0%) | 0 (0.0%) |
| 75 Years and over | 0 (0.0%) | 0 (0.0%) |
Disability Class: Ambulatory Difficulty
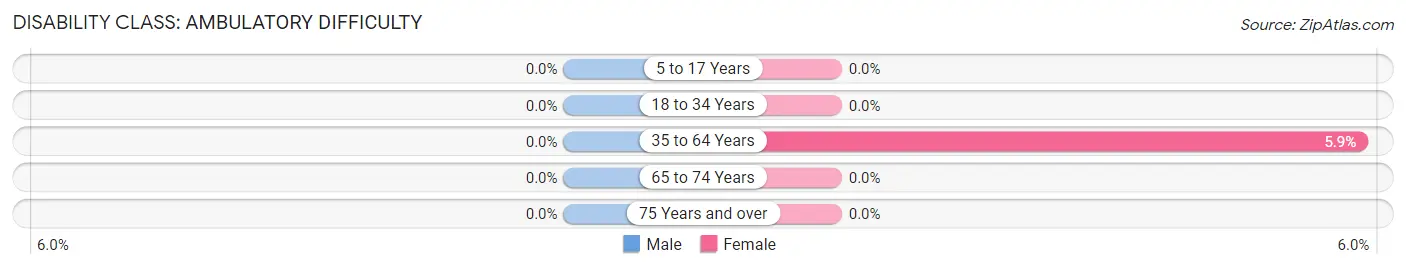
| Age Bracket | Male | Female |
| 5 to 17 Years | 0 (0.0%) | 0 (0.0%) |
| 18 to 34 Years | 0 (0.0%) | 0 (0.0%) |
| 35 to 64 Years | 0 (0.0%) | 14 (5.9%) |
| 65 to 74 Years | 0 (0.0%) | 0 (0.0%) |
| 75 Years and over | 0 (0.0%) | 0 (0.0%) |
Disability Class: Self-Care Difficulty
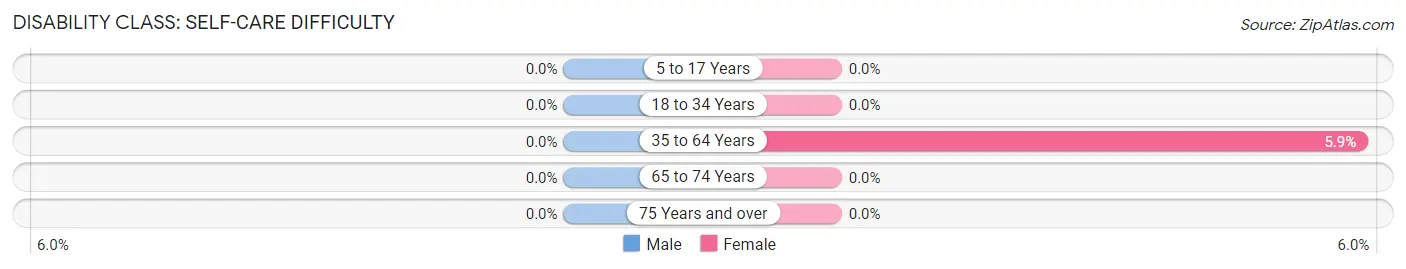
| Age Bracket | Male | Female |
| 5 to 17 Years | 0 (0.0%) | 0 (0.0%) |
| 18 to 34 Years | 0 (0.0%) | 0 (0.0%) |
| 35 to 64 Years | 0 (0.0%) | 14 (5.9%) |
| 65 to 74 Years | 0 (0.0%) | 0 (0.0%) |
| 75 Years and over | 0 (0.0%) | 0 (0.0%) |
Technology Access in Bradford
Computing Device Access in Bradford
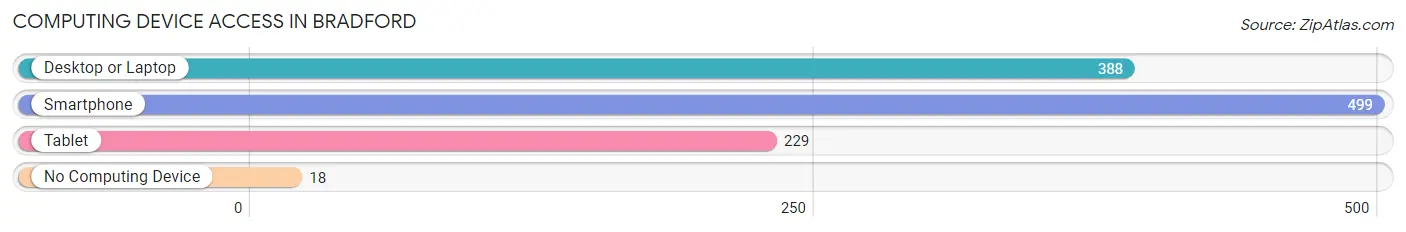
| Device Type | # Households | % Households |
| Desktop or Laptop | 388 | 75.0% |
| Smartphone | 499 | 96.5% |
| Tablet | 229 | 44.3% |
| No Computing Device | 18 | 3.5% |
| Total | 517 | 100.0% |
Internet Access in Bradford
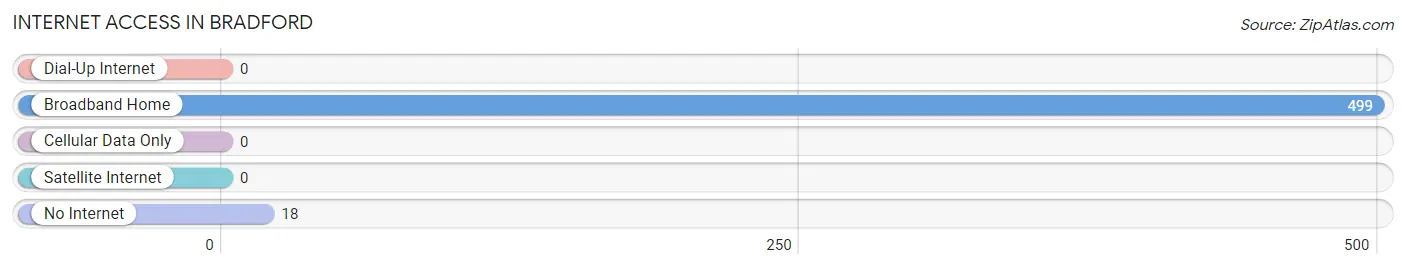
| Internet Type | # Households | % Households |
| Dial-Up Internet | 0 | 0.0% |
| Broadband Home | 499 | 96.5% |
| Cellular Data Only | 0 | 0.0% |
| Satellite Internet | 0 | 0.0% |
| No Internet | 18 | 3.5% |
| Total | 517 | 100.0% |
Bradford Summary
Bradford, Rhode Island is a small town located in the southwestern corner of the state. It is bordered by the towns of Westerly, Charlestown, and Hopkinton. The town has a population of approximately 1,500 people and covers an area of 8.3 square miles.
History
Bradford was first settled in 1661 by a group of English settlers from Massachusetts. The town was originally part of Westerly, but was incorporated as its own town in 1719. The town was named after William Bradford, who was the governor of the Plymouth Colony in Massachusetts.
The town was primarily an agricultural community for much of its history. The town was known for its dairy farms and apple orchards. In the late 19th century, the town began to develop a small manufacturing industry. The town was home to several small factories, including a paper mill, a sawmill, and a gristmill.
Geography
Bradford is located in the southwestern corner of Rhode Island. It is bordered by the towns of Westerly, Charlestown, and Hopkinton. The town is located on the Pawcatuck River, which forms the border between Rhode Island and Connecticut. The town is mostly rural, with rolling hills and forests. The highest point in the town is the summit of Bradford Hill, which is located at an elevation of 545 feet.
Economy
The economy of Bradford is largely based on agriculture and tourism. The town is home to several small farms, which produce dairy products, fruits, and vegetables. The town is also home to several small businesses, including restaurants, shops, and a marina.
Tourism is an important part of the economy of Bradford. The town is home to several popular attractions, including the Bradford Historical Society, the Bradford Town Beach, and the Bradford Country Club. The town is also home to several popular festivals, including the Bradford Apple Festival and the Bradford Summer Festival.
Demographics
As of the 2010 census, the population of Bradford was 1,521. The racial makeup of the town was 94.3% White, 1.2% African American, 0.3% Native American, 0.7% Asian, 0.1% Pacific Islander, 1.2% from other races, and 2.3% from two or more races. Hispanic or Latino of any race were 3.2% of the population.
The median household income in Bradford was $60,938, and the median family income was $68,750. The per capita income for the town was $27,945. About 5.3% of families and 6.7% of the population were below the poverty line, including 8.3% of those under age 18 and 4.2% of those age 65 or over.
Common Questions
What is the Total Population of Bradford?
Total Population of Bradford is 1,189.
What is the Total Male Population of Bradford?
Total Male Population of Bradford is 724.
What is the Total Female Population of Bradford?
Total Female Population of Bradford is 465.
What is the Ratio of Males per 100 Females in Bradford?
There are 155.70 Males per 100 Females in Bradford.
What is the Ratio of Females per 100 Males in Bradford?
There are 64.23 Females per 100 Males in Bradford.
What is the Median Population Age in Bradford?
Median Population Age in Bradford is 41.8 Years.
What is the Average Family Size in Bradford
Average Family Size in Bradford is 2.6 People.
What is the Average Household Size in Bradford
Average Household Size in Bradford is 2.3 People.
What is Per Capita Income in Bradford?
Per Capita income in Bradford is $32,670.
What is the Median Family Income in Bradford?
Median Family Income in Bradford is $93,319.
What is the Median Household income in Bradford?
Median Household Income in Bradford is $72,383.
What is Income or Wage Gap in Bradford?
Income or Wage Gap in Bradford is 61.7%.
Women in Bradford earn 38.3 cents for every dollar earned by a man.
What is Inequality or Gini Index in Bradford?
Inequality or Gini Index in Bradford is 0.37.
How Large is the Labor Force in Bradford?
There are 668 People in the Labor Forcein in Bradford.
What is the Percentage of People in the Labor Force in Bradford?
65.4% of People are in the Labor Force in Bradford.
What is the Unemployment Rate in Bradford?
Unemployment Rate in Bradford is 15.1%.