Palmas del Mar, PR
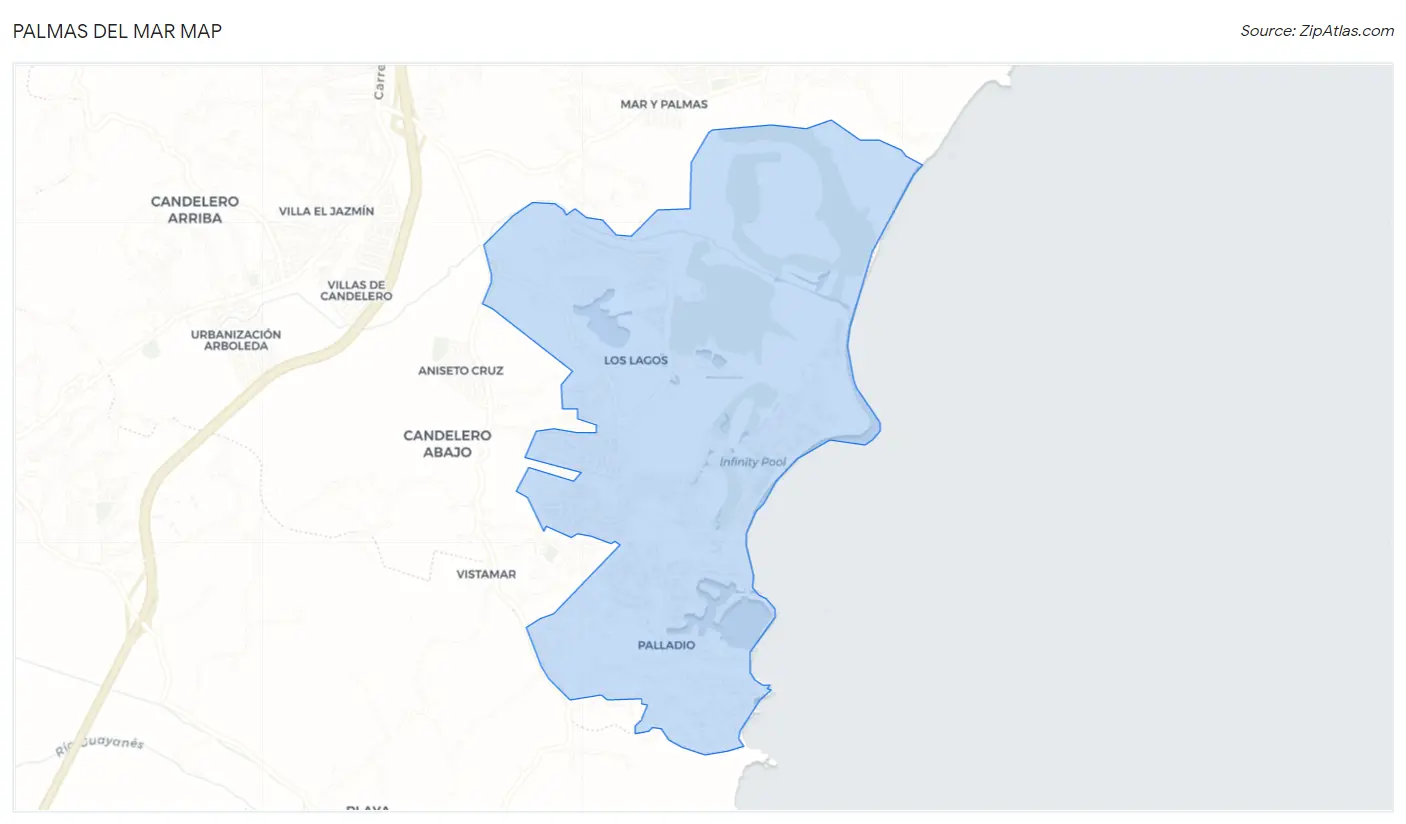
Palmas del Mar Map
Palmas del Mar Overview
2,492
TOTAL POPULATION
1,193
MALE POPULATION
1,299
FEMALE POPULATION
91.84
MALES / 100 FEMALES
108.89
FEMALES / 100 MALES
46.3
MEDIAN AGE
3.3
AVG FAMILY SIZE
3.2
AVG HOUSEHOLD SIZE
$40,419
PER CAPITA INCOME
$84,732
AVG FAMILY INCOME
$89,231
AVG HOUSEHOLD INCOME
$2,959
FAMILY INCOME DEFICIT
0.48
INEQUALITY / GINI INDEX
1,065
LABOR FORCE [ PEOPLE ]
47.2%
PERCENT IN LABOR FORCE
1.1%
UNEMPLOYMENT RATE
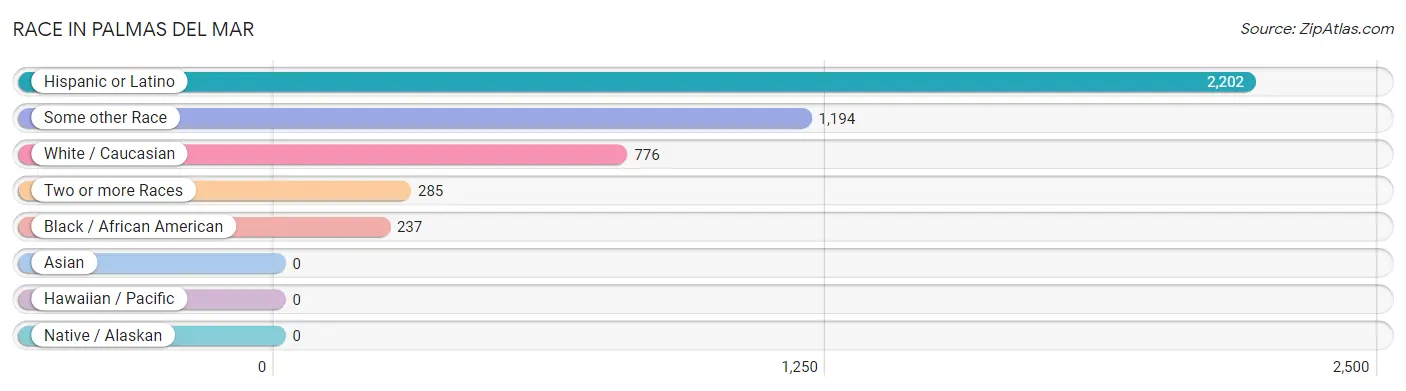
Race in Palmas del Mar
The most populous races in Palmas del Mar are Hispanic or Latino (2,202 | 88.4%), Some other Race (1,194 | 47.9%), and White / Caucasian (776 | 31.1%).
| Race | # Population | % Population |
| Asian | 0 | 0.0% |
| Black / African American | 237 | 9.5% |
| Hawaiian / Pacific | 0 | 0.0% |
| Hispanic or Latino | 2,202 | 88.4% |
| Native / Alaskan | 0 | 0.0% |
| White / Caucasian | 776 | 31.1% |
| Two or more Races | 285 | 11.4% |
| Some other Race | 1,194 | 47.9% |
| Total | 2,492 | 100.0% |
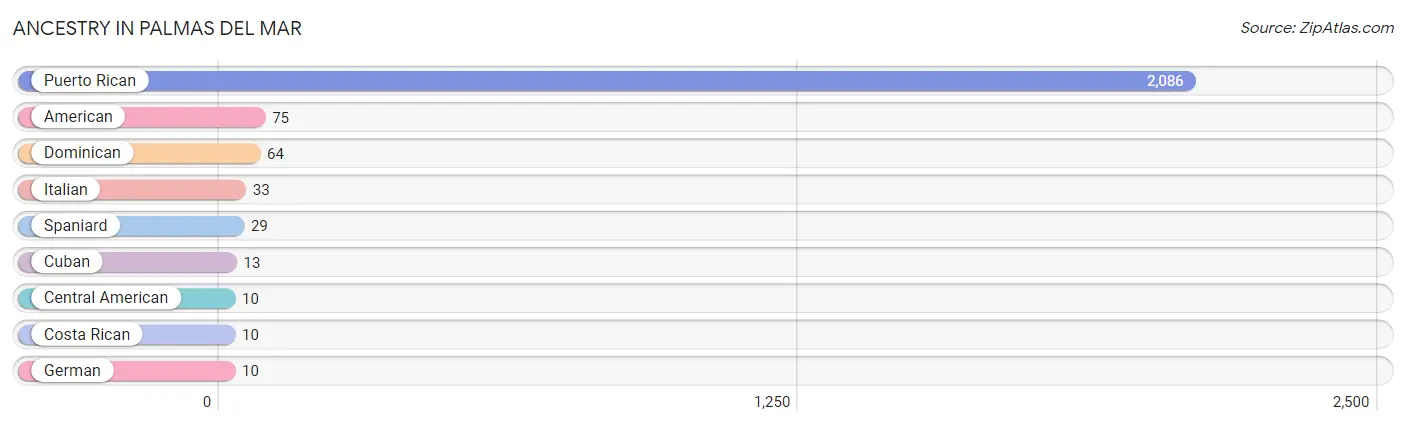
Ancestry in Palmas del Mar
The most populous ancestries reported in Palmas del Mar are Puerto Rican (2,086 | 83.7%), American (75 | 3.0%), Dominican (64 | 2.6%), Italian (33 | 1.3%), and Spaniard (29 | 1.2%), together accounting for 91.8% of all Palmas del Mar residents.
| Ancestry | # Population | % Population |
| American | 75 | 3.0% |
| Central American | 10 | 0.4% |
| Costa Rican | 10 | 0.4% |
| Cuban | 13 | 0.5% |
| Dominican | 64 | 2.6% |
| German | 10 | 0.4% |
| Italian | 33 | 1.3% |
| Puerto Rican | 2,086 | 83.7% |
| Spaniard | 29 | 1.2% | View All 9 Rows |
Immigrants in Palmas del Mar

| Immigration Origin | # Population | % Population | View All 0 Rows |
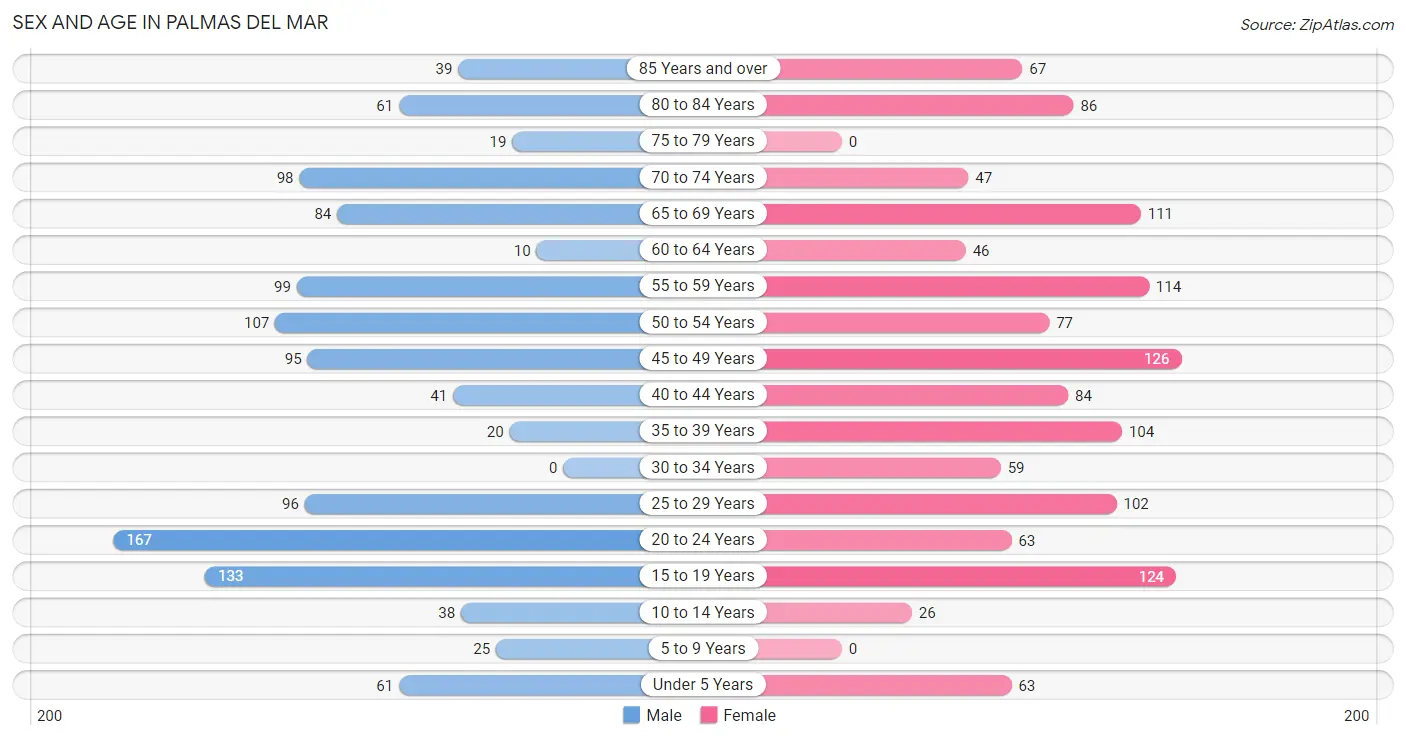
Sex and Age in Palmas del Mar
Sex and Age in Palmas del Mar
The most populous age groups in Palmas del Mar are 20 to 24 Years (167 | 14.0%) for men and 45 to 49 Years (126 | 9.7%) for women.
| Age Bracket | Male | Female |
| Under 5 Years | 61 (5.1%) | 63 (4.9%) |
| 5 to 9 Years | 25 (2.1%) | 0 (0.0%) |
| 10 to 14 Years | 38 (3.2%) | 26 (2.0%) |
| 15 to 19 Years | 133 (11.2%) | 124 (9.6%) |
| 20 to 24 Years | 167 (14.0%) | 63 (4.9%) |
| 25 to 29 Years | 96 (8.1%) | 102 (7.9%) |
| 30 to 34 Years | 0 (0.0%) | 59 (4.5%) |
| 35 to 39 Years | 20 (1.7%) | 104 (8.0%) |
| 40 to 44 Years | 41 (3.4%) | 84 (6.5%) |
| 45 to 49 Years | 95 (8.0%) | 126 (9.7%) |
| 50 to 54 Years | 107 (9.0%) | 77 (5.9%) |
| 55 to 59 Years | 99 (8.3%) | 114 (8.8%) |
| 60 to 64 Years | 10 (0.8%) | 46 (3.5%) |
| 65 to 69 Years | 84 (7.0%) | 111 (8.6%) |
| 70 to 74 Years | 98 (8.2%) | 47 (3.6%) |
| 75 to 79 Years | 19 (1.6%) | 0 (0.0%) |
| 80 to 84 Years | 61 (5.1%) | 86 (6.6%) |
| 85 Years and over | 39 (3.3%) | 67 (5.2%) |
| Total | 1,193 (100.0%) | 1,299 (100.0%) |
Families and Households in Palmas del Mar
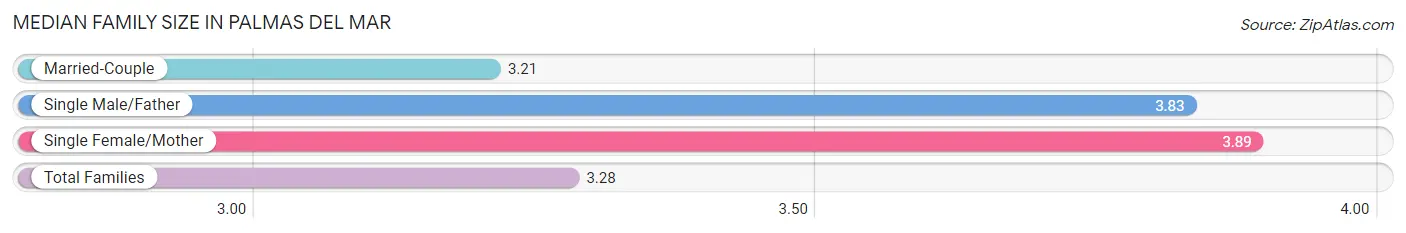
Median Family Size in Palmas del Mar
The median family size in Palmas del Mar is 3.28 persons per family, with single female/mother families (37 | 5.6%) accounting for the largest median family size of 3.89 persons per family. On the other hand, married-couple families (582 | 88.2%) represent the smallest median family size with 3.21 persons per family.
| Family Type | # Families | Family Size |
| Married-Couple | 582 (88.2%) | 3.21 |
| Single Male/Father | 41 (6.2%) | 3.83 |
| Single Female/Mother | 37 (5.6%) | 3.89 |
| Total Families | 660 (100.0%) | 3.28 |
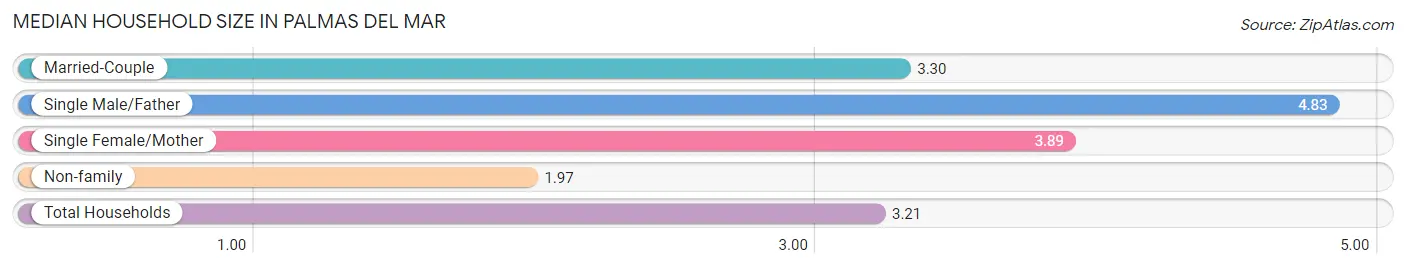
Median Household Size in Palmas del Mar
The median household size in Palmas del Mar is 3.21 persons per household, with single male/father households (41 | 5.3%) accounting for the largest median household size of 4.83 persons per household. non-family households (116 | 14.9%) represent the smallest median household size with 1.97 persons per household.
| Household Type | # Households | Household Size |
| Married-Couple | 582 (75.0%) | 3.30 |
| Single Male/Father | 41 (5.3%) | 4.83 |
| Single Female/Mother | 37 (4.8%) | 3.89 |
| Non-family | 116 (14.9%) | 1.97 |
| Total Households | 776 (100.0%) | 3.21 |
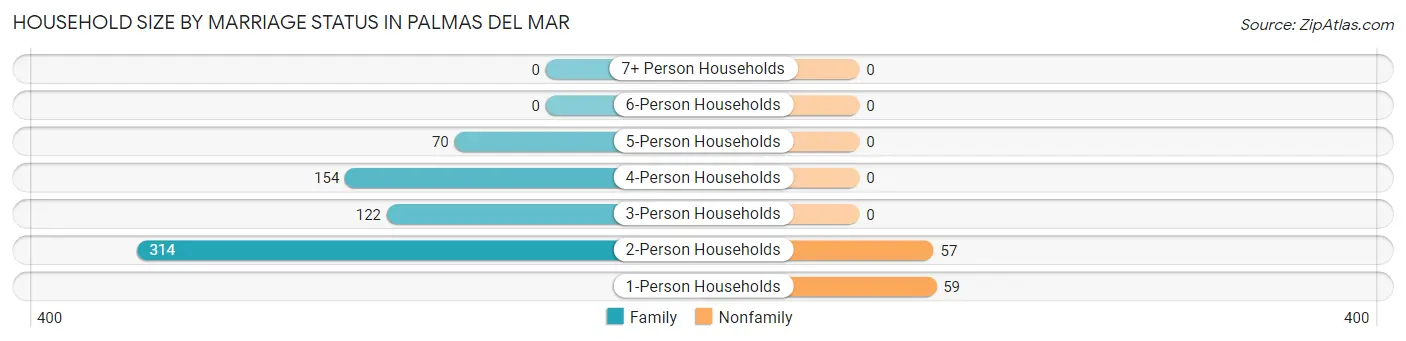
Household Size by Marriage Status in Palmas del Mar
Out of a total of 776 households in Palmas del Mar, 660 (85.1%) are family households, while 116 (14.9%) are nonfamily households. The most numerous type of family households are 2-person households, comprising 314, and the most common type of nonfamily households are 1-person households, comprising 59.
| Household Size | Family Households | Nonfamily Households |
| 1-Person Households | - | 59 (7.6%) |
| 2-Person Households | 314 (40.5%) | 57 (7.3%) |
| 3-Person Households | 122 (15.7%) | 0 (0.0%) |
| 4-Person Households | 154 (19.9%) | 0 (0.0%) |
| 5-Person Households | 70 (9.0%) | 0 (0.0%) |
| 6-Person Households | 0 (0.0%) | 0 (0.0%) |
| 7+ Person Households | 0 (0.0%) | 0 (0.0%) |
| Total | 660 (85.1%) | 116 (14.9%) |
Female Fertility in Palmas del Mar
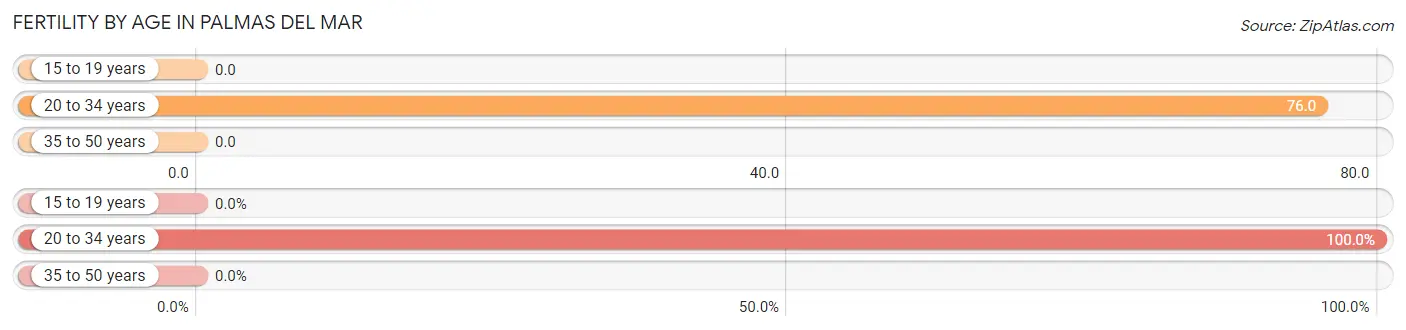
Fertility by Age in Palmas del Mar
Average fertility rate in Palmas del Mar is 26.0 births per 1,000 women. Women in the age bracket of 20 to 34 years have the highest fertility rate with 76.0 births per 1,000 women. Women in the age bracket of 20 to 34 years acount for 100.0% of all women with births.
| Age Bracket | Women with Births | Births / 1,000 Women |
| 15 to 19 years | 0 (0.0%) | 0.0 |
| 20 to 34 years | 17 (100.0%) | 76.0 |
| 35 to 50 years | 0 (0.0%) | 0.0 |
| Total | 17 (100.0%) | 26.0 |
Fertility by Age by Marriage Status in Palmas del Mar
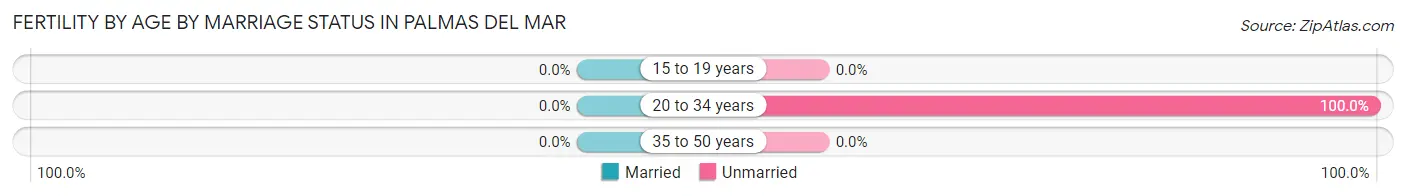
| Age Bracket | Married | Unmarried |
| 15 to 19 years | 0 (0.0%) | 0 (0.0%) |
| 20 to 34 years | 0 (0.0%) | 17 (100.0%) |
| 35 to 50 years | 0 (0.0%) | 0 (0.0%) |
| Total | 0 (0.0%) | 17 (100.0%) |
Fertility by Education in Palmas del Mar
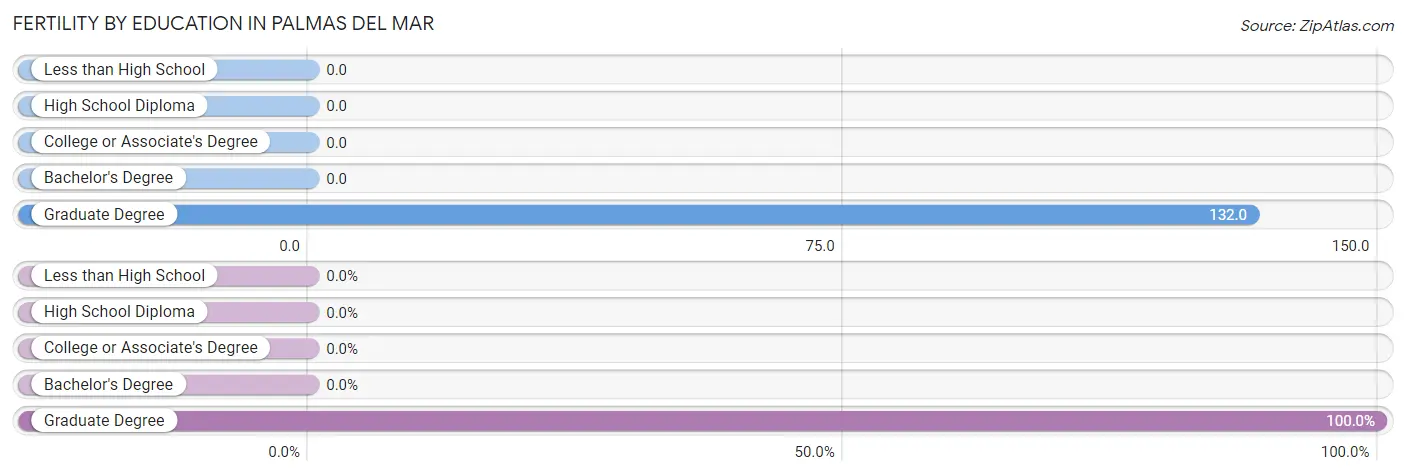
| Educational Attainment | Women with Births | Births / 1,000 Women |
| Less than High School | 0 (0.0%) | 0.0 |
| High School Diploma | 0 (0.0%) | 0.0 |
| College or Associate's Degree | 0 (0.0%) | 0.0 |
| Bachelor's Degree | 0 (0.0%) | 0.0 |
| Graduate Degree | 17 (100.0%) | 132.0 |
| Total | 17 (100.0%) | 26.0 |
Fertility by Education by Marriage Status in Palmas del Mar
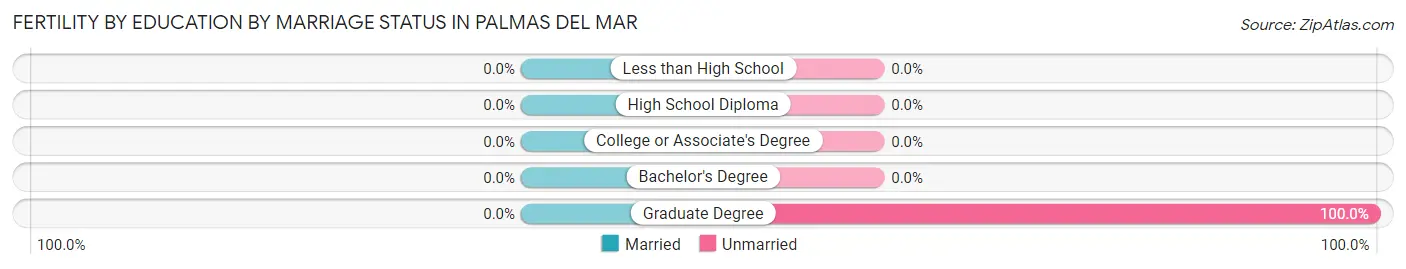
| Educational Attainment | Married | Unmarried |
| Less than High School | 0 (0.0%) | 0 (0.0%) |
| High School Diploma | 0 (0.0%) | 0 (0.0%) |
| College or Associate's Degree | 0 (0.0%) | 0 (0.0%) |
| Bachelor's Degree | 0 (0.0%) | 0 (0.0%) |
| Graduate Degree | 0 (0.0%) | 17 (100.0%) |
| Total | 0 (0.0%) | 17 (100.0%) |
Income in Palmas del Mar
Income Overview in Palmas del Mar
Per Capita Income in Palmas del Mar is $40,419, while median incomes of families and households are $84,732 and $89,231 respectively.
| Characteristic | Number | Measure |
| Per Capita Income | 2,492 | $40,419 |
| Median Family Income | 660 | $84,732 |
| Mean Family Income | 660 | $123,336 |
| Median Household Income | 776 | $89,231 |
| Mean Household Income | 776 | $122,257 |
| Income Deficit | 660 | $2,959 |
| Wage / Income Gap (%) | 2,492 | 0.00% |
| Wage / Income Gap ($) | 2,492 | 100.00¢ per $1 |
| Gini / Inequality Index | 2,492 | 0.48 |
Earnings by Sex in Palmas del Mar
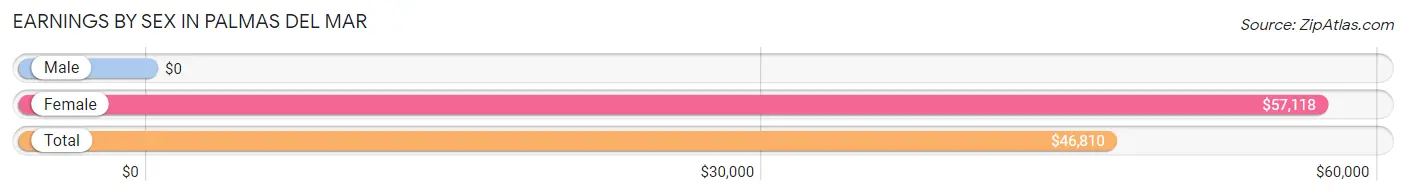
| Sex | Number | Average Earnings |
| Male | 619 (55.4%) | $0 |
| Female | 499 (44.6%) | $57,118 |
| Total | 1,118 (100.0%) | $46,810 |
Earnings by Sex by Income Bracket in Palmas del Mar
The most common earnings brackets in Palmas del Mar are $100,000+ for men (188 | 30.4%) and $75,000 to $99,999 for women (152 | 30.5%).
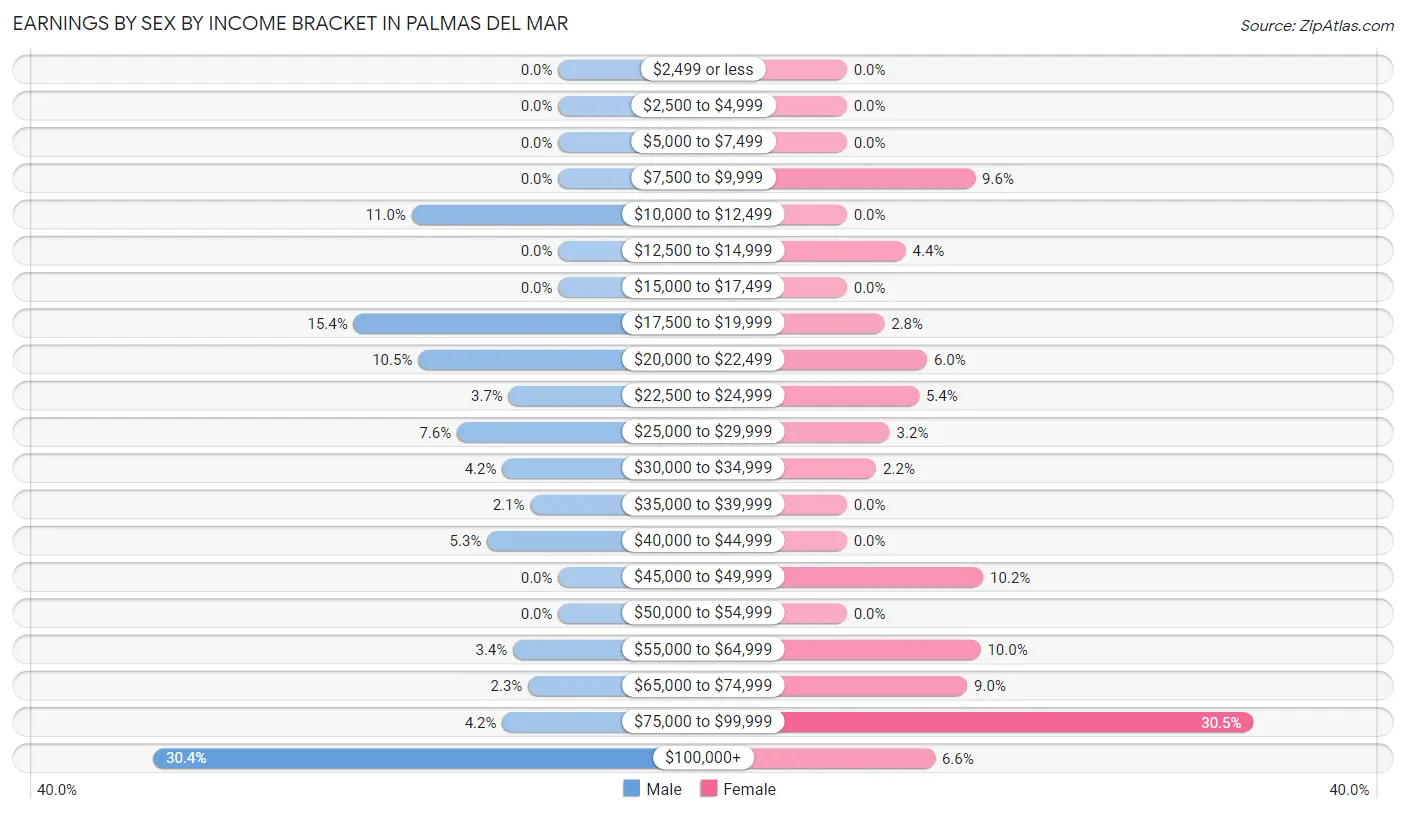
| Income | Male | Female |
| $2,499 or less | 0 (0.0%) | 0 (0.0%) |
| $2,500 to $4,999 | 0 (0.0%) | 0 (0.0%) |
| $5,000 to $7,499 | 0 (0.0%) | 0 (0.0%) |
| $7,500 to $9,999 | 0 (0.0%) | 48 (9.6%) |
| $10,000 to $12,499 | 68 (11.0%) | 0 (0.0%) |
| $12,500 to $14,999 | 0 (0.0%) | 22 (4.4%) |
| $15,000 to $17,499 | 0 (0.0%) | 0 (0.0%) |
| $17,500 to $19,999 | 95 (15.3%) | 14 (2.8%) |
| $20,000 to $22,499 | 65 (10.5%) | 30 (6.0%) |
| $22,500 to $24,999 | 23 (3.7%) | 27 (5.4%) |
| $25,000 to $29,999 | 47 (7.6%) | 16 (3.2%) |
| $30,000 to $34,999 | 26 (4.2%) | 11 (2.2%) |
| $35,000 to $39,999 | 13 (2.1%) | 0 (0.0%) |
| $40,000 to $44,999 | 33 (5.3%) | 0 (0.0%) |
| $45,000 to $49,999 | 0 (0.0%) | 51 (10.2%) |
| $50,000 to $54,999 | 0 (0.0%) | 0 (0.0%) |
| $55,000 to $64,999 | 21 (3.4%) | 50 (10.0%) |
| $65,000 to $74,999 | 14 (2.3%) | 45 (9.0%) |
| $75,000 to $99,999 | 26 (4.2%) | 152 (30.5%) |
| $100,000+ | 188 (30.4%) | 33 (6.6%) |
| Total | 619 (100.0%) | 499 (100.0%) |
Earnings by Sex by Educational Attainment in Palmas del Mar
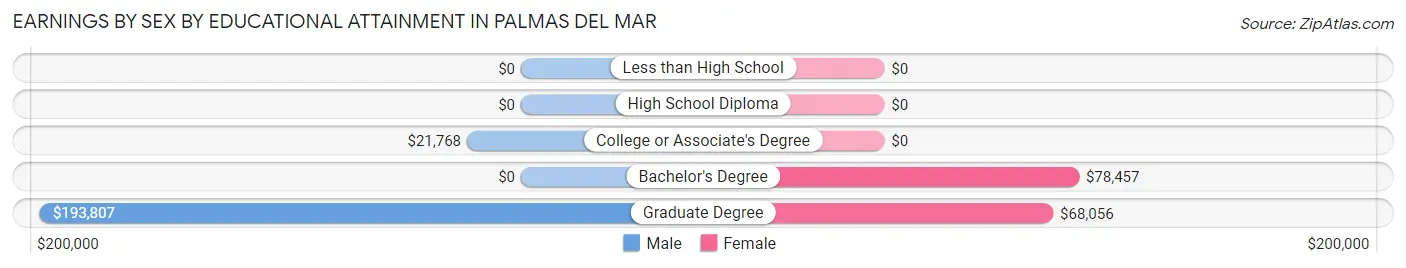
| Educational Attainment | Male Income | Female Income |
| Less than High School | - | - |
| High School Diploma | - | - |
| College or Associate's Degree | $21,768 | $0 |
| Bachelor's Degree | - | - |
| Graduate Degree | $193,807 | $68,056 |
| Total | - | - |
Family Income in Palmas del Mar
Family Income Brackets in Palmas del Mar
According to the Palmas del Mar family income data, there are 164 families falling into the $200,000+ income range, which is the most common income bracket and makes up 24.8% of all families.
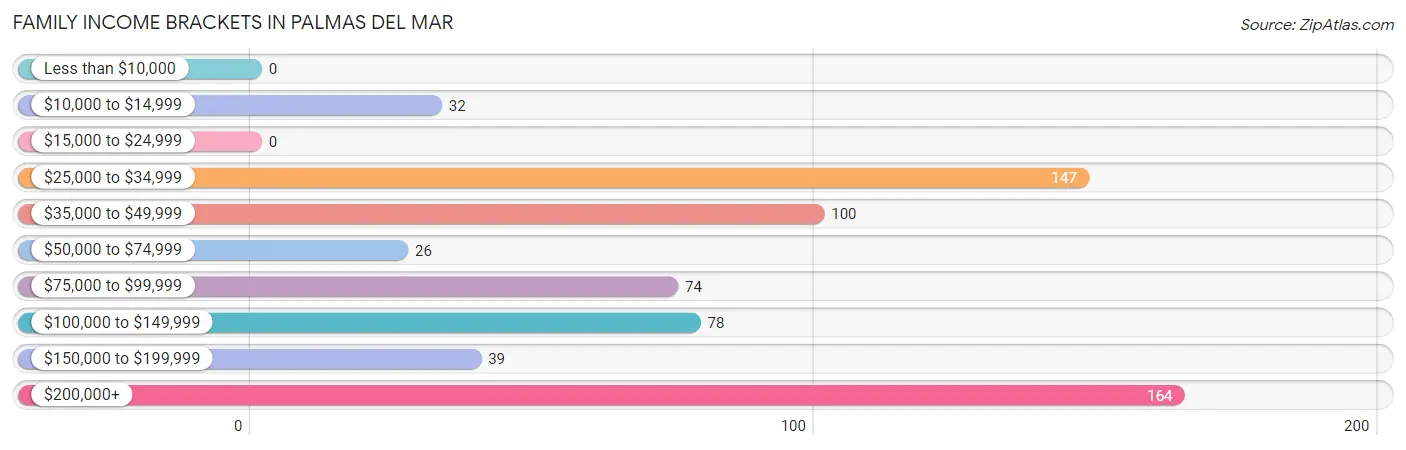
| Income Bracket | # Families | % Families |
| Less than $10,000 | 0 | 0.0% |
| $10,000 to $14,999 | 32 | 4.8% |
| $15,000 to $24,999 | 0 | 0.0% |
| $25,000 to $34,999 | 147 | 22.3% |
| $35,000 to $49,999 | 100 | 15.2% |
| $50,000 to $74,999 | 26 | 3.9% |
| $75,000 to $99,999 | 74 | 11.2% |
| $100,000 to $149,999 | 78 | 11.8% |
| $150,000 to $199,999 | 39 | 5.9% |
| $200,000+ | 164 | 24.8% |
Family Income by Famaliy Size in Palmas del Mar
| Income Bracket | # Families | Median Income |
| 2-Person Families | 324 (49.1%) | $0 |
| 3-Person Families | 186 (28.2%) | $0 |
| 4-Person Families | 80 (12.1%) | $0 |
| 5-Person Families | 70 (10.6%) | $0 |
| 6-Person Families | 0 (0.0%) | $0 |
| 7+ Person Families | 0 (0.0%) | $0 |
| Total | 660 (100.0%) | $84,732 |
Family Income by Number of Earners in Palmas del Mar
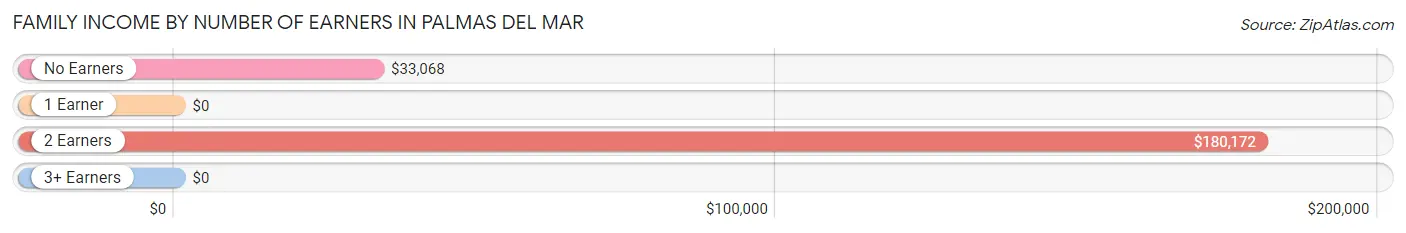
| Number of Earners | # Families | Median Income |
| No Earners | 172 (26.1%) | $33,068 |
| 1 Earner | 212 (32.1%) | $0 |
| 2 Earners | 250 (37.9%) | $180,172 |
| 3+ Earners | 26 (3.9%) | $0 |
| Total | 660 (100.0%) | $84,732 |
Household Income in Palmas del Mar
Household Income Brackets in Palmas del Mar
With 177 households falling in the category, the $200,000+ income range is the most frequent in Palmas del Mar, accounting for 22.8% of all households.
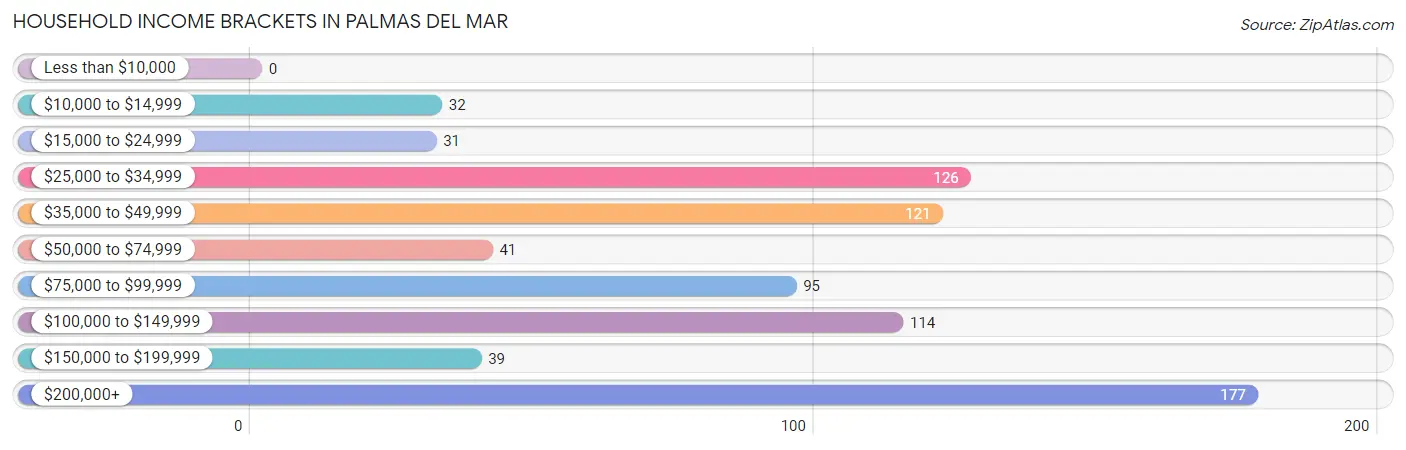
| Income Bracket | # Households | % Households |
| Less than $10,000 | 0 | 0.0% |
| $10,000 to $14,999 | 32 | 4.1% |
| $15,000 to $24,999 | 31 | 4.0% |
| $25,000 to $34,999 | 126 | 16.2% |
| $35,000 to $49,999 | 121 | 15.6% |
| $50,000 to $74,999 | 41 | 5.3% |
| $75,000 to $99,999 | 95 | 12.2% |
| $100,000 to $149,999 | 114 | 14.7% |
| $150,000 to $199,999 | 39 | 5.0% |
| $200,000+ | 177 | 22.8% |
Household Income by Householder Age in Palmas del Mar
The median household income in Palmas del Mar is $89,231, with the highest median household income of $127,704 found in the 45 to 64 years age bracket for the primary householder. A total of 368 households (47.4%) fall into this category.
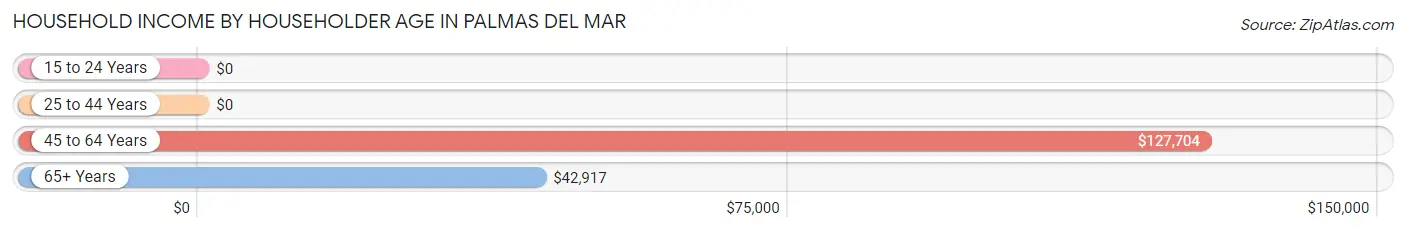
| Income Bracket | # Households | Median Income |
| 15 to 24 Years | 0 (0.0%) | $0 |
| 25 to 44 Years | 100 (12.9%) | $0 |
| 45 to 64 Years | 368 (47.4%) | $127,704 |
| 65+ Years | 308 (39.7%) | $42,917 |
| Total | 776 (100.0%) | $89,231 |
Poverty in Palmas del Mar
Income Below Poverty by Sex and Age in Palmas del Mar
With 16.9% poverty level for males and 24.3% for females among the residents of Palmas del Mar, 6 to 11 year old males and 12 to 14 year old females are the most vulnerable to poverty, with 49 males (77.8%) and 26 females (100.0%) in their respective age groups living below the poverty level.
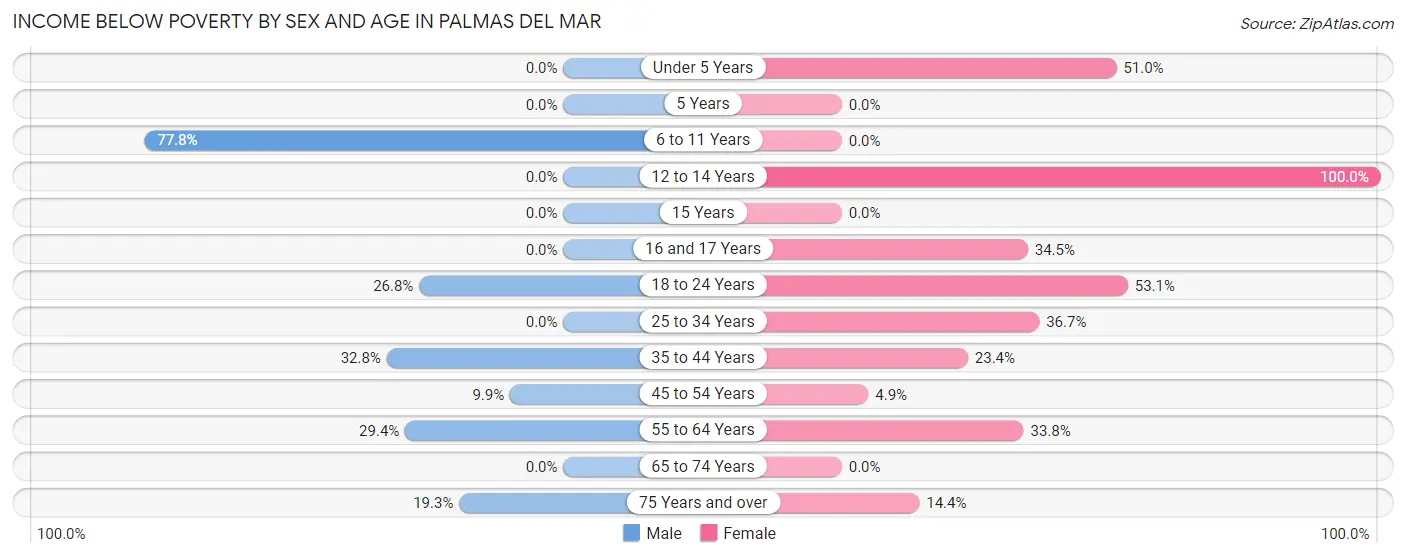
| Age Bracket | Male | Female |
| Under 5 Years | 0 (0.0%) | 26 (51.0%) |
| 5 Years | 0 (0.0%) | 0 (0.0%) |
| 6 to 11 Years | 49 (77.8%) | 0 (0.0%) |
| 12 to 14 Years | 0 (0.0%) | 26 (100.0%) |
| 15 Years | 0 (0.0%) | 0 (0.0%) |
| 16 and 17 Years | 0 (0.0%) | 29 (34.5%) |
| 18 to 24 Years | 57 (26.8%) | 43 (53.1%) |
| 25 to 34 Years | 0 (0.0%) | 59 (36.6%) |
| 35 to 44 Years | 20 (32.8%) | 44 (23.4%) |
| 45 to 54 Years | 20 (9.9%) | 10 (4.9%) |
| 55 to 64 Years | 32 (29.4%) | 54 (33.8%) |
| 65 to 74 Years | 0 (0.0%) | 0 (0.0%) |
| 75 Years and over | 23 (19.3%) | 22 (14.4%) |
| Total | 201 (16.9%) | 313 (24.3%) |
Income Above Poverty by Sex and Age in Palmas del Mar
According to the poverty statistics in Palmas del Mar, males aged under 5 years and females aged 15 years are the age groups that are most secure financially, with 100.0% of males and 100.0% of females in these age groups living above the poverty line.
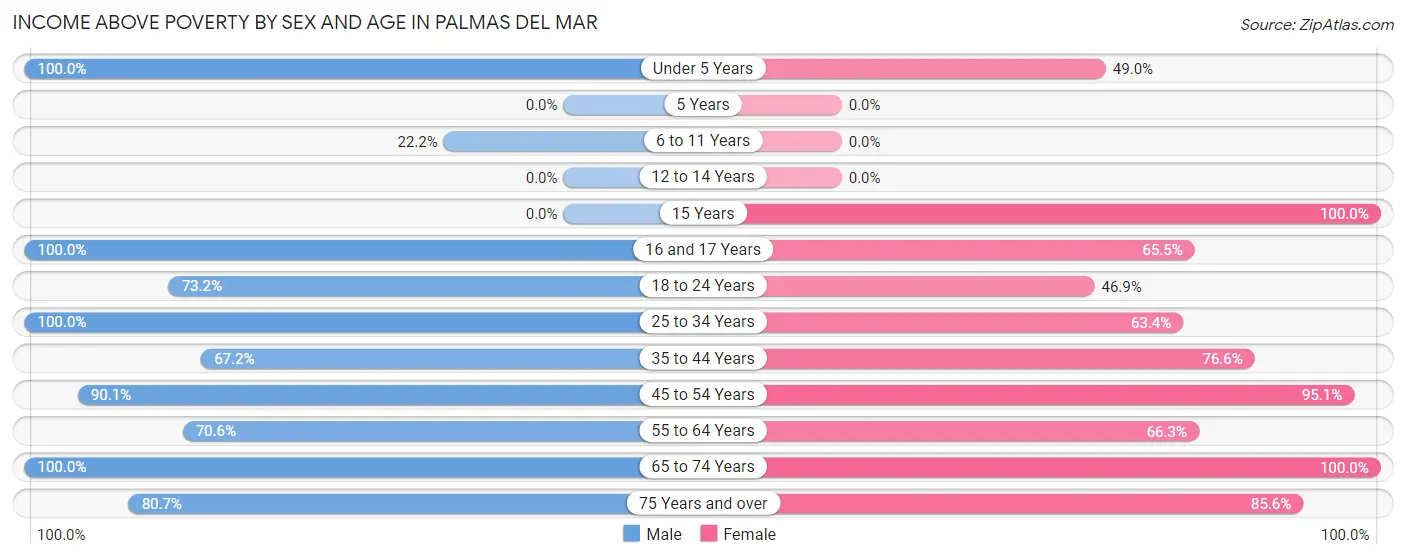
| Age Bracket | Male | Female |
| Under 5 Years | 61 (100.0%) | 25 (49.0%) |
| 5 Years | 0 (0.0%) | 0 (0.0%) |
| 6 to 11 Years | 14 (22.2%) | 0 (0.0%) |
| 12 to 14 Years | 0 (0.0%) | 0 (0.0%) |
| 15 Years | 0 (0.0%) | 22 (100.0%) |
| 16 and 17 Years | 87 (100.0%) | 55 (65.5%) |
| 18 to 24 Years | 156 (73.2%) | 38 (46.9%) |
| 25 to 34 Years | 96 (100.0%) | 102 (63.3%) |
| 35 to 44 Years | 41 (67.2%) | 144 (76.6%) |
| 45 to 54 Years | 182 (90.1%) | 193 (95.1%) |
| 55 to 64 Years | 77 (70.6%) | 106 (66.2%) |
| 65 to 74 Years | 182 (100.0%) | 158 (100.0%) |
| 75 Years and over | 96 (80.7%) | 131 (85.6%) |
| Total | 992 (83.2%) | 974 (75.7%) |
Income Below Poverty Among Married-Couple Families in Palmas del Mar
The poverty statistics for married-couple families in Palmas del Mar show that 16.5% or 96 of the total 582 families live below the poverty line. Families with 1 or 2 children have the highest poverty rate of 45.1%, comprising of 64 families. On the other hand, families with no children have the lowest poverty rate of 7.3%, which includes 32 families.
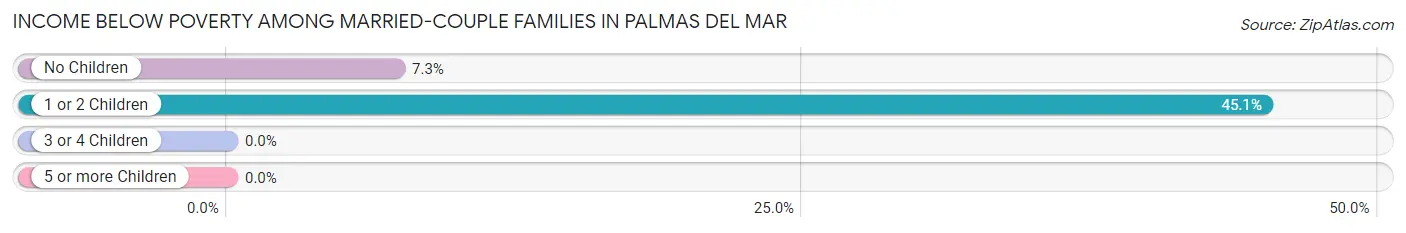
| Children | Above Poverty | Below Poverty |
| No Children | 408 (92.7%) | 32 (7.3%) |
| 1 or 2 Children | 78 (54.9%) | 64 (45.1%) |
| 3 or 4 Children | 0 (0.0%) | 0 (0.0%) |
| 5 or more Children | 0 (0.0%) | 0 (0.0%) |
| Total | 486 (83.5%) | 96 (16.5%) |
Income Below Poverty Among Single-Parent Households in Palmas del Mar
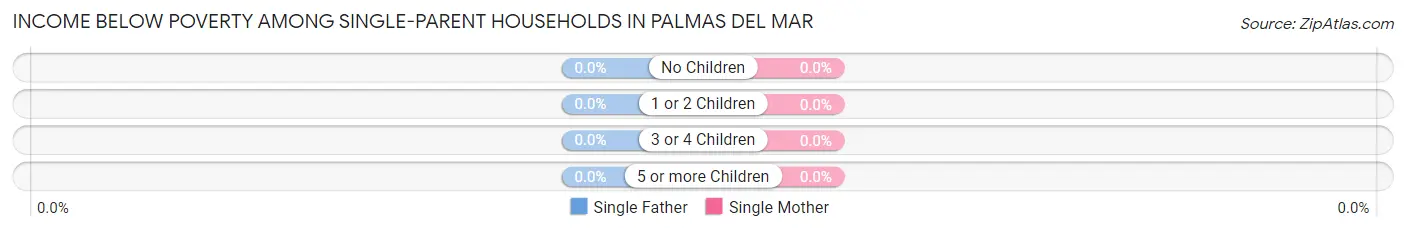
| Children | Single Father | Single Mother |
| No Children | 0 (0.0%) | 0 (0.0%) |
| 1 or 2 Children | 0 (0.0%) | 0 (0.0%) |
| 3 or 4 Children | 0 (0.0%) | 0 (0.0%) |
| 5 or more Children | 0 (0.0%) | 0 (0.0%) |
| Total | 0 (0.0%) | 0 (0.0%) |
Income Below Poverty Among Married-Couple vs Single-Parent Households in Palmas del Mar
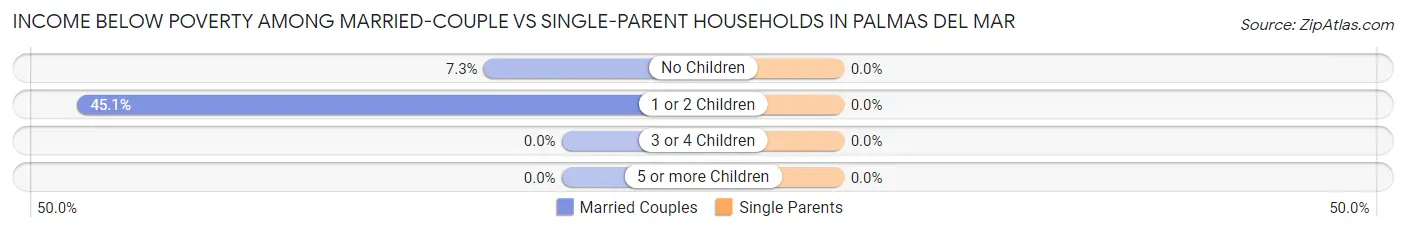
| Children | Married-Couple Families | Single-Parent Households |
| No Children | 32 (7.3%) | 0 (0.0%) |
| 1 or 2 Children | 64 (45.1%) | 0 (0.0%) |
| 3 or 4 Children | 0 (0.0%) | 0 (0.0%) |
| 5 or more Children | 0 (0.0%) | 0 (0.0%) |
| Total | 96 (16.5%) | 0 (0.0%) |
Employment Characteristics in Palmas del Mar
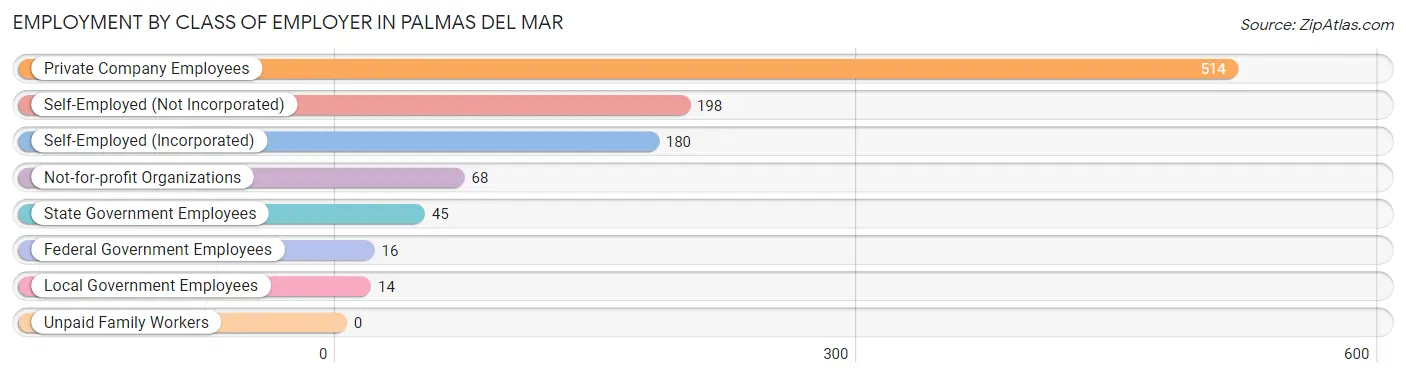
Employment by Class of Employer in Palmas del Mar
Among the 1,035 employed individuals in Palmas del Mar, private company employees (514 | 49.7%), self-employed (not incorporated) (198 | 19.1%), and self-employed (incorporated) (180 | 17.4%) make up the most common classes of employment.
| Employer Class | # Employees | % Employees |
| Private Company Employees | 514 | 49.7% |
| Self-Employed (Incorporated) | 180 | 17.4% |
| Self-Employed (Not Incorporated) | 198 | 19.1% |
| Not-for-profit Organizations | 68 | 6.6% |
| Local Government Employees | 14 | 1.3% |
| State Government Employees | 45 | 4.3% |
| Federal Government Employees | 16 | 1.5% |
| Unpaid Family Workers | 0 | 0.0% |
| Total | 1,035 | 100.0% |
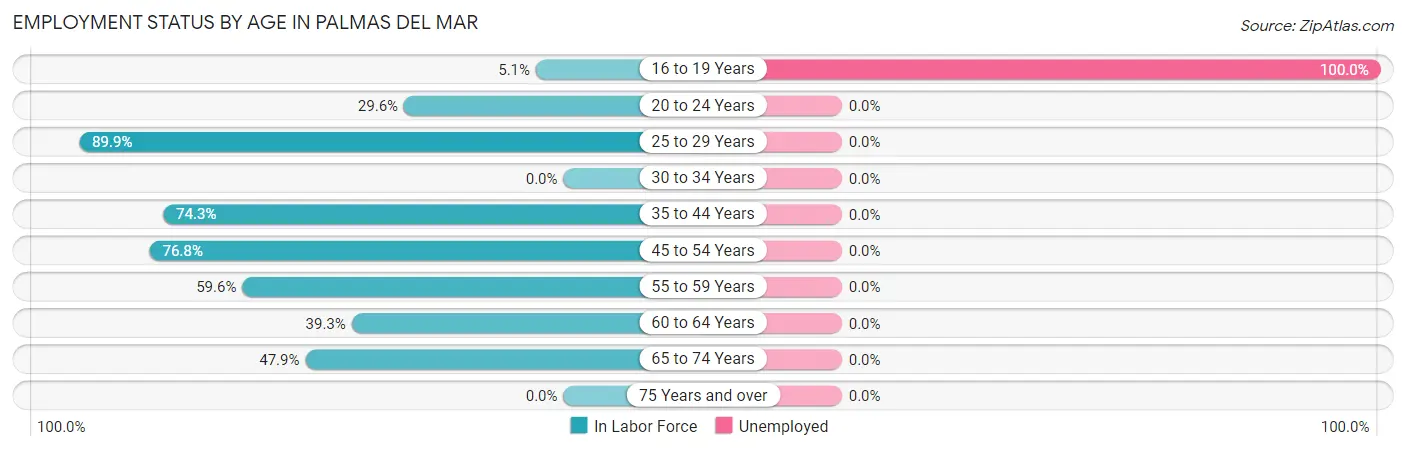
Employment Status by Age in Palmas del Mar
According to the labor force statistics for Palmas del Mar, out of the total population over 16 years of age (2,257), 47.2% or 1,065 individuals are in the labor force, with 1.1% or 12 of them unemployed. The age group with the highest labor force participation rate is 25 to 29 years, with 89.9% or 178 individuals in the labor force. Within the labor force, the 16 to 19 years age range has the highest percentage of unemployed individuals, with 100.0% or 12 of them being unemployed.
| Age Bracket | In Labor Force | Unemployed |
| 16 to 19 Years | 12 (5.1%) | 12 (100.0%) |
| 20 to 24 Years | 68 (29.6%) | 0 (0.0%) |
| 25 to 29 Years | 178 (89.9%) | 0 (0.0%) |
| 30 to 34 Years | 0 (0.0%) | 0 (0.0%) |
| 35 to 44 Years | 185 (74.3%) | 0 (0.0%) |
| 45 to 54 Years | 311 (76.8%) | 0 (0.0%) |
| 55 to 59 Years | 127 (59.6%) | 0 (0.0%) |
| 60 to 64 Years | 22 (39.3%) | 0 (0.0%) |
| 65 to 74 Years | 163 (47.9%) | 0 (0.0%) |
| 75 Years and over | 0 (0.0%) | 0 (0.0%) |
| Total | 1,065 (47.2%) | 12 (1.1%) |
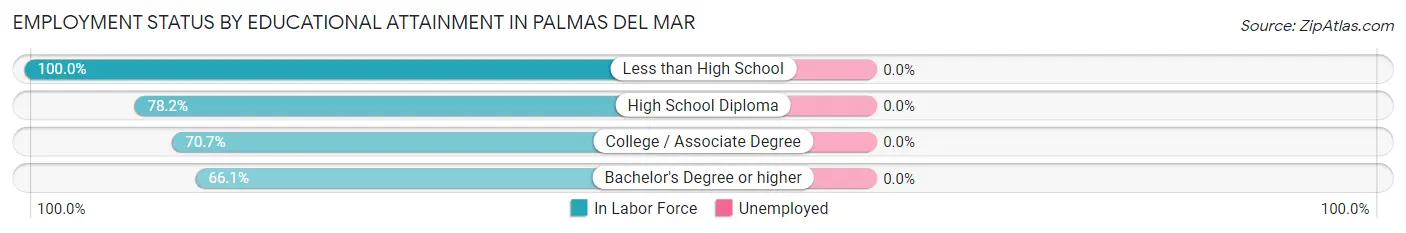
Employment Status by Educational Attainment in Palmas del Mar
| Educational Attainment | In Labor Force | Unemployed |
| Less than High School | 51 (100.0%) | 0 (0.0%) |
| High School Diploma | 86 (78.2%) | 0 (0.0%) |
| College / Associate Degree | 188 (70.7%) | 0 (0.0%) |
| Bachelor's Degree or higher | 498 (66.1%) | 0 (0.0%) |
| Total | 822 (69.7%) | 0 (0.0%) |
Employment Occupations by Sex in Palmas del Mar
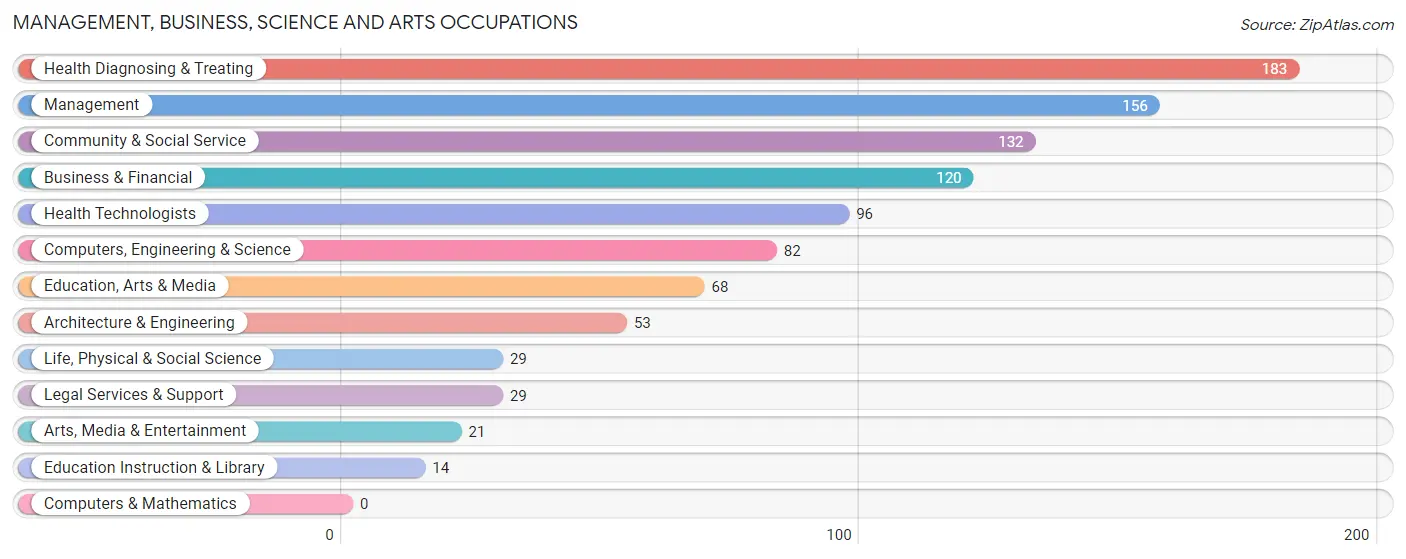
Management, Business, Science and Arts Occupations
The most common Management, Business, Science and Arts occupations in Palmas del Mar are Health Diagnosing & Treating (183 | 17.4%), Management (156 | 14.8%), Community & Social Service (132 | 12.5%), Business & Financial (120 | 11.4%), and Health Technologists (96 | 9.1%).
Management, Business, Science and Arts Occupations by Sex
Within the Management, Business, Science and Arts occupations in Palmas del Mar, the most male-oriented occupations are Architecture & Engineering (100.0%), Education, Arts & Media (100.0%), and Legal Services & Support (100.0%), while the most female-oriented occupations are Life, Physical & Social Science (100.0%), Education Instruction & Library (100.0%), and Business & Financial (62.5%).
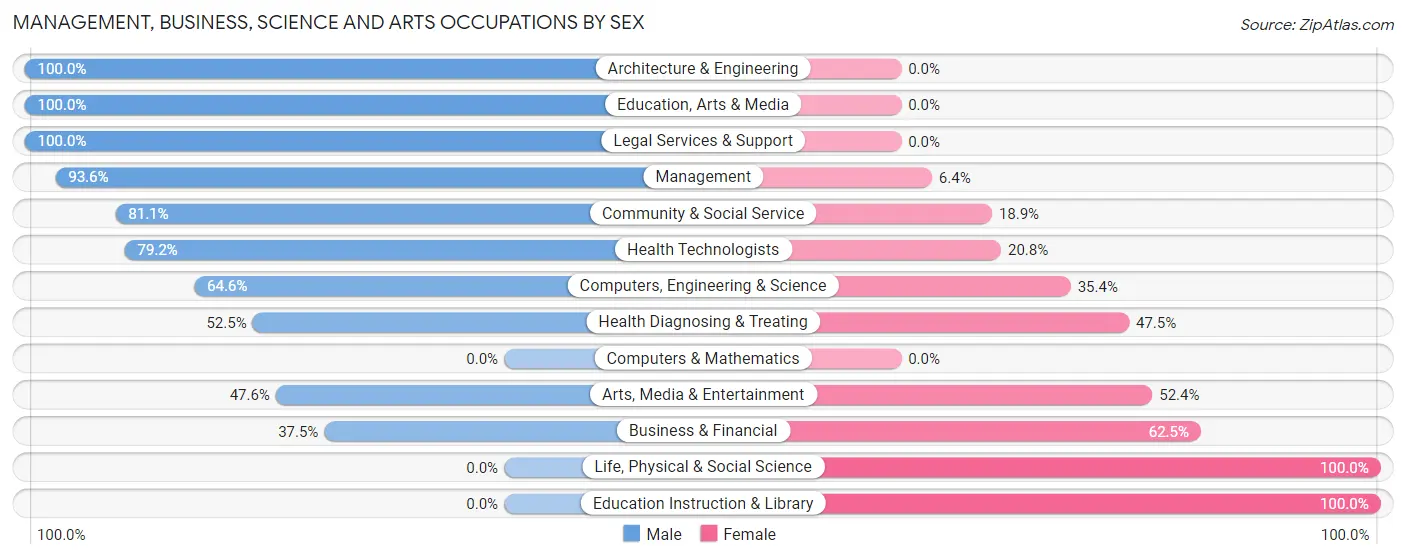
| Occupation | Male | Female |
| Management | 146 (93.6%) | 10 (6.4%) |
| Business & Financial | 45 (37.5%) | 75 (62.5%) |
| Computers, Engineering & Science | 53 (64.6%) | 29 (35.4%) |
| Computers & Mathematics | 0 (0.0%) | 0 (0.0%) |
| Architecture & Engineering | 53 (100.0%) | 0 (0.0%) |
| Life, Physical & Social Science | 0 (0.0%) | 29 (100.0%) |
| Community & Social Service | 107 (81.1%) | 25 (18.9%) |
| Education, Arts & Media | 68 (100.0%) | 0 (0.0%) |
| Legal Services & Support | 29 (100.0%) | 0 (0.0%) |
| Education Instruction & Library | 0 (0.0%) | 14 (100.0%) |
| Arts, Media & Entertainment | 10 (47.6%) | 11 (52.4%) |
| Health Diagnosing & Treating | 96 (52.5%) | 87 (47.5%) |
| Health Technologists | 76 (79.2%) | 20 (20.8%) |
| Total (Category) | 447 (66.4%) | 226 (33.6%) |
| Total (Overall) | 619 (58.7%) | 435 (41.3%) |
Services Occupations
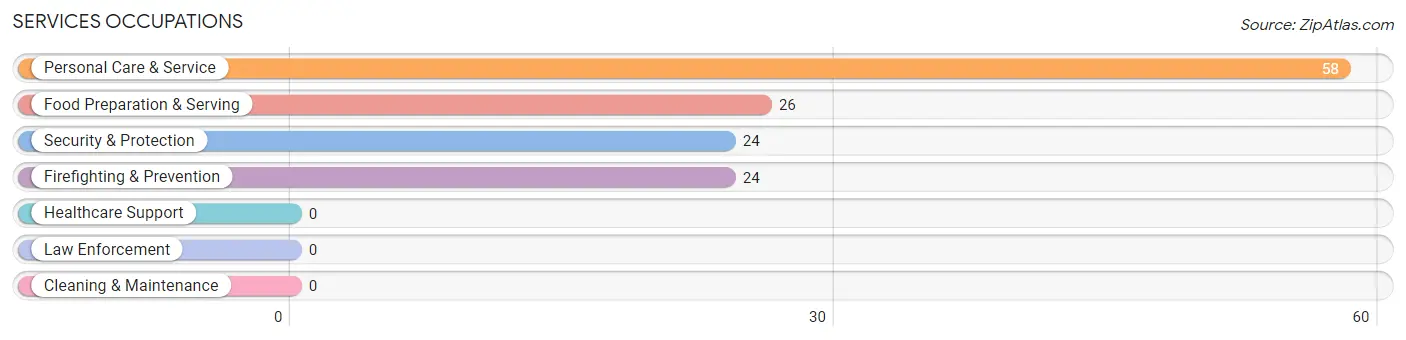
The most common Services occupations in Palmas del Mar are Personal Care & Service (58 | 5.5%), Food Preparation & Serving (26 | 2.5%), Security & Protection (24 | 2.3%), and Firefighting & Prevention (24 | 2.3%).
Services Occupations by Sex
Within the Services occupations in Palmas del Mar, the most male-oriented occupations are Security & Protection (100.0%), and Firefighting & Prevention (100.0%), while the most female-oriented occupations are Food Preparation & Serving (100.0%), and Personal Care & Service (100.0%).
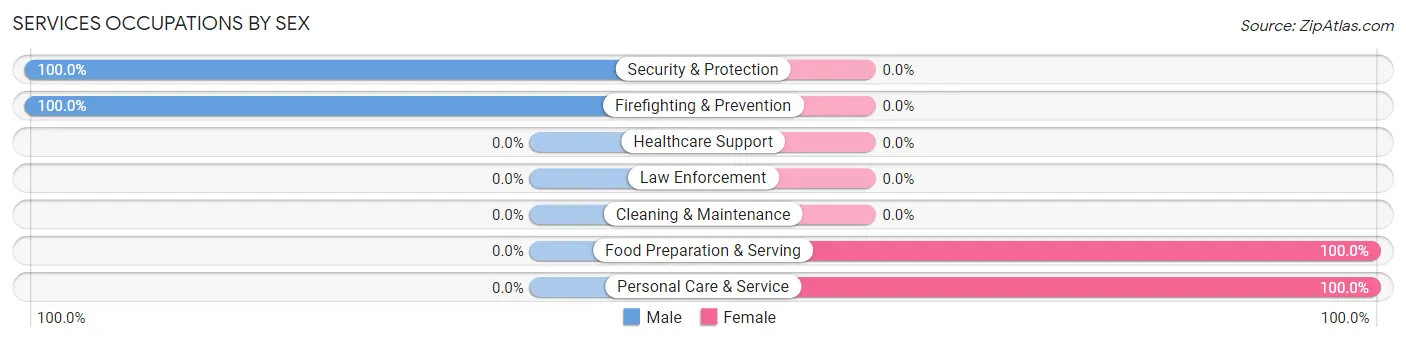
| Occupation | Male | Female |
| Healthcare Support | 0 (0.0%) | 0 (0.0%) |
| Security & Protection | 24 (100.0%) | 0 (0.0%) |
| Firefighting & Prevention | 24 (100.0%) | 0 (0.0%) |
| Law Enforcement | 0 (0.0%) | 0 (0.0%) |
| Food Preparation & Serving | 0 (0.0%) | 26 (100.0%) |
| Cleaning & Maintenance | 0 (0.0%) | 0 (0.0%) |
| Personal Care & Service | 0 (0.0%) | 58 (100.0%) |
| Total (Category) | 24 (22.2%) | 84 (77.8%) |
| Total (Overall) | 619 (58.7%) | 435 (41.3%) |
Sales and Office Occupations
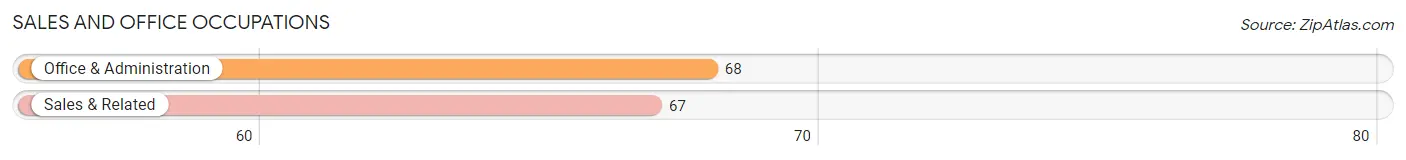
The most common Sales and Office occupations in Palmas del Mar are Office & Administration (68 | 6.5%), and Sales & Related (67 | 6.4%).
Sales and Office Occupations by Sex
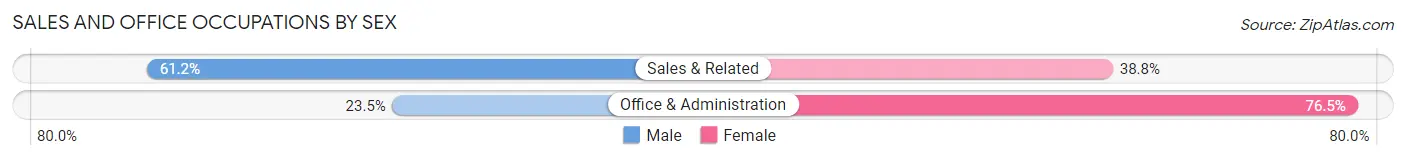
| Occupation | Male | Female |
| Sales & Related | 41 (61.2%) | 26 (38.8%) |
| Office & Administration | 16 (23.5%) | 52 (76.5%) |
| Total (Category) | 57 (42.2%) | 78 (57.8%) |
| Total (Overall) | 619 (58.7%) | 435 (41.3%) |
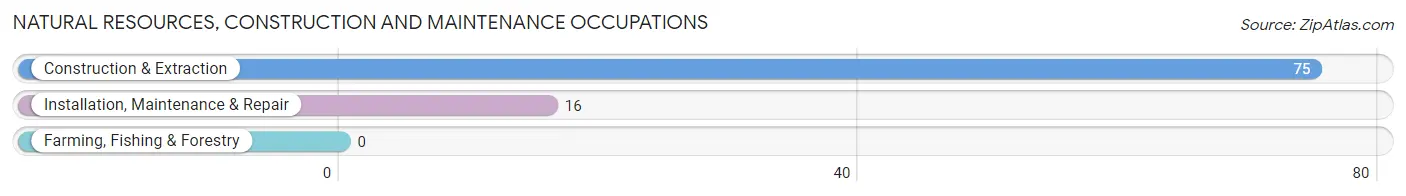
Natural Resources, Construction and Maintenance Occupations
The most common Natural Resources, Construction and Maintenance occupations in Palmas del Mar are Construction & Extraction (75 | 7.1%), and Installation, Maintenance & Repair (16 | 1.5%).
Natural Resources, Construction and Maintenance Occupations by Sex
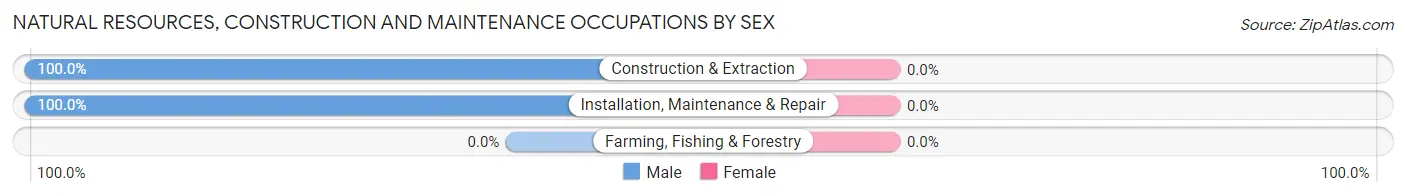
| Occupation | Male | Female |
| Farming, Fishing & Forestry | 0 (0.0%) | 0 (0.0%) |
| Construction & Extraction | 75 (100.0%) | 0 (0.0%) |
| Installation, Maintenance & Repair | 16 (100.0%) | 0 (0.0%) |
| Total (Category) | 91 (100.0%) | 0 (0.0%) |
| Total (Overall) | 619 (58.7%) | 435 (41.3%) |
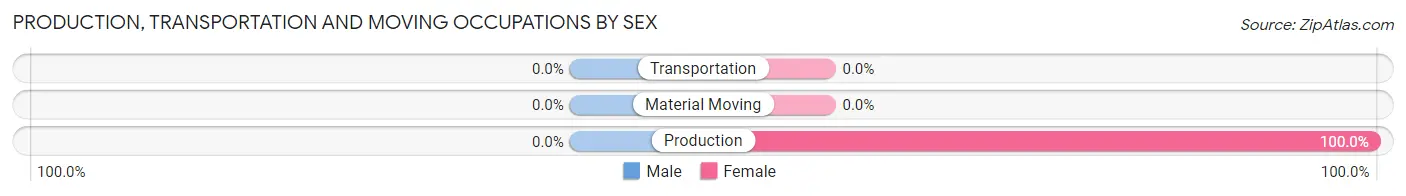
Production, Transportation and Moving Occupations
The most common Production, Transportation and Moving occupations in Palmas del Mar are , and Production (47 | 4.5%).
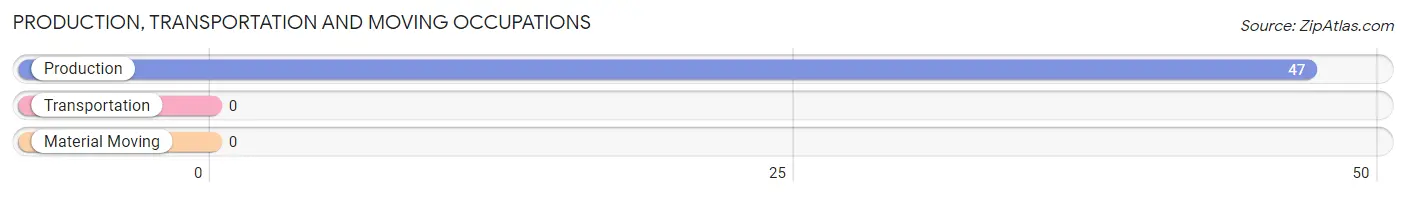
Production, Transportation and Moving Occupations by Sex
| Occupation | Male | Female |
| Production | 0 (0.0%) | 47 (100.0%) |
| Transportation | 0 (0.0%) | 0 (0.0%) |
| Material Moving | 0 (0.0%) | 0 (0.0%) |
| Total (Category) | 0 (0.0%) | 47 (100.0%) |
| Total (Overall) | 619 (58.7%) | 435 (41.3%) |
Employment Industries by Sex in Palmas del Mar
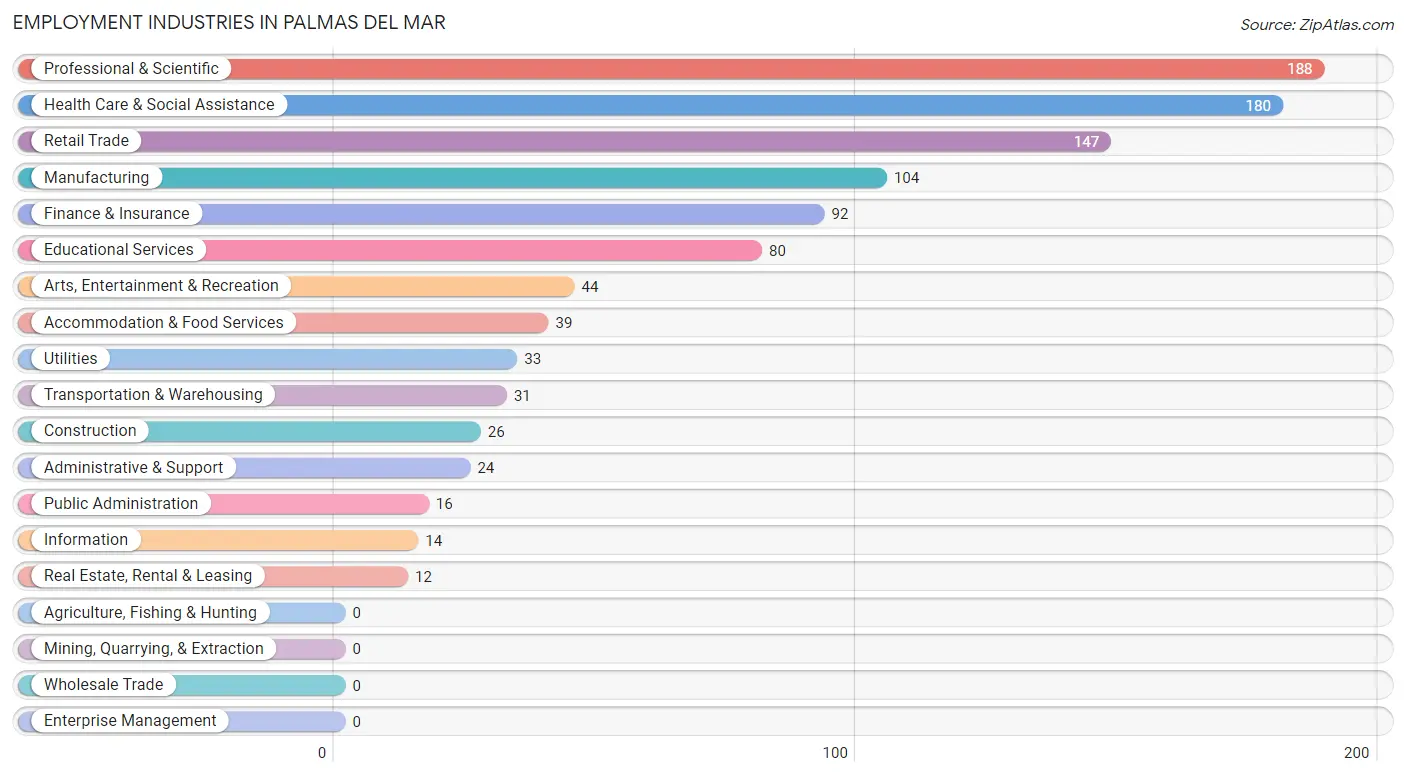
Employment Industries in Palmas del Mar
The major employment industries in Palmas del Mar include Professional & Scientific (188 | 17.8%), Health Care & Social Assistance (180 | 17.1%), Retail Trade (147 | 14.0%), Manufacturing (104 | 9.9%), and Finance & Insurance (92 | 8.7%).
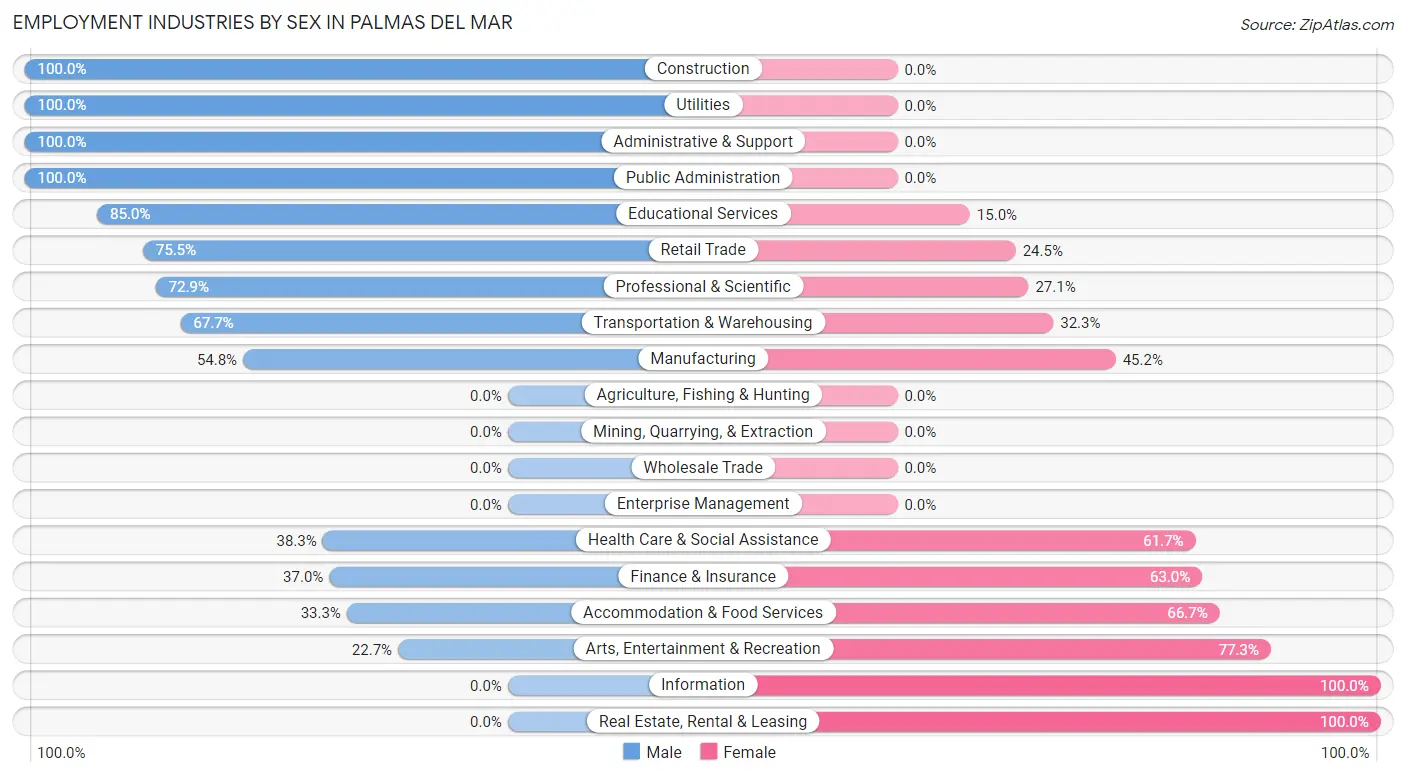
Employment Industries by Sex in Palmas del Mar
The Palmas del Mar industries that see more men than women are Construction (100.0%), Utilities (100.0%), and Administrative & Support (100.0%), whereas the industries that tend to have a higher number of women are Information (100.0%), Real Estate, Rental & Leasing (100.0%), and Arts, Entertainment & Recreation (77.3%).
| Industry | Male | Female |
| Agriculture, Fishing & Hunting | 0 (0.0%) | 0 (0.0%) |
| Mining, Quarrying, & Extraction | 0 (0.0%) | 0 (0.0%) |
| Construction | 26 (100.0%) | 0 (0.0%) |
| Manufacturing | 57 (54.8%) | 47 (45.2%) |
| Wholesale Trade | 0 (0.0%) | 0 (0.0%) |
| Retail Trade | 111 (75.5%) | 36 (24.5%) |
| Transportation & Warehousing | 21 (67.7%) | 10 (32.3%) |
| Utilities | 33 (100.0%) | 0 (0.0%) |
| Information | 0 (0.0%) | 14 (100.0%) |
| Finance & Insurance | 34 (37.0%) | 58 (63.0%) |
| Real Estate, Rental & Leasing | 0 (0.0%) | 12 (100.0%) |
| Professional & Scientific | 137 (72.9%) | 51 (27.1%) |
| Enterprise Management | 0 (0.0%) | 0 (0.0%) |
| Administrative & Support | 24 (100.0%) | 0 (0.0%) |
| Educational Services | 68 (85.0%) | 12 (15.0%) |
| Health Care & Social Assistance | 69 (38.3%) | 111 (61.7%) |
| Arts, Entertainment & Recreation | 10 (22.7%) | 34 (77.3%) |
| Accommodation & Food Services | 13 (33.3%) | 26 (66.7%) |
| Public Administration | 16 (100.0%) | 0 (0.0%) |
| Total | 619 (58.7%) | 435 (41.3%) |
Education in Palmas del Mar
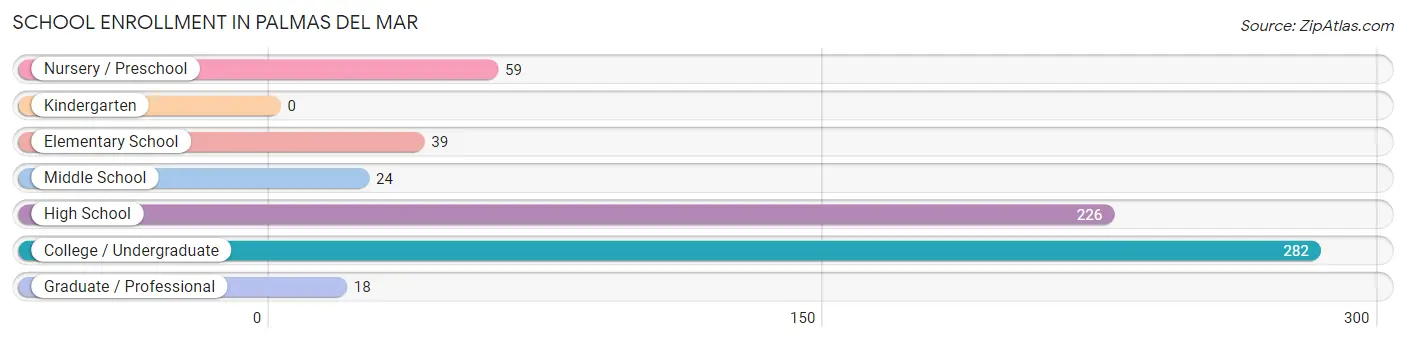
School Enrollment in Palmas del Mar
The most common levels of schooling among the 648 students in Palmas del Mar are college / undergraduate (282 | 43.5%), high school (226 | 34.9%), and nursery / preschool (59 | 9.1%).
| School Level | # Students | % Students |
| Nursery / Preschool | 59 | 9.1% |
| Kindergarten | 0 | 0.0% |
| Elementary School | 39 | 6.0% |
| Middle School | 24 | 3.7% |
| High School | 226 | 34.9% |
| College / Undergraduate | 282 | 43.5% |
| Graduate / Professional | 18 | 2.8% |
| Total | 648 | 100.0% |
School Enrollment by Age by Funding Source in Palmas del Mar
Out of a total of 648 students who are enrolled in schools in Palmas del Mar, 447 (69.0%) attend a private institution, while the remaining 201 (31.0%) are enrolled in public schools. The age group of 18 to 19 year olds has the highest likelihood of being enrolled in private schools, with 64 (100.0% in the age bracket) enrolled. Conversely, the age group of 5 to 9 year old has the lowest likelihood of being enrolled in a private school, with 25 (100.0% in the age bracket) attending a public institution.
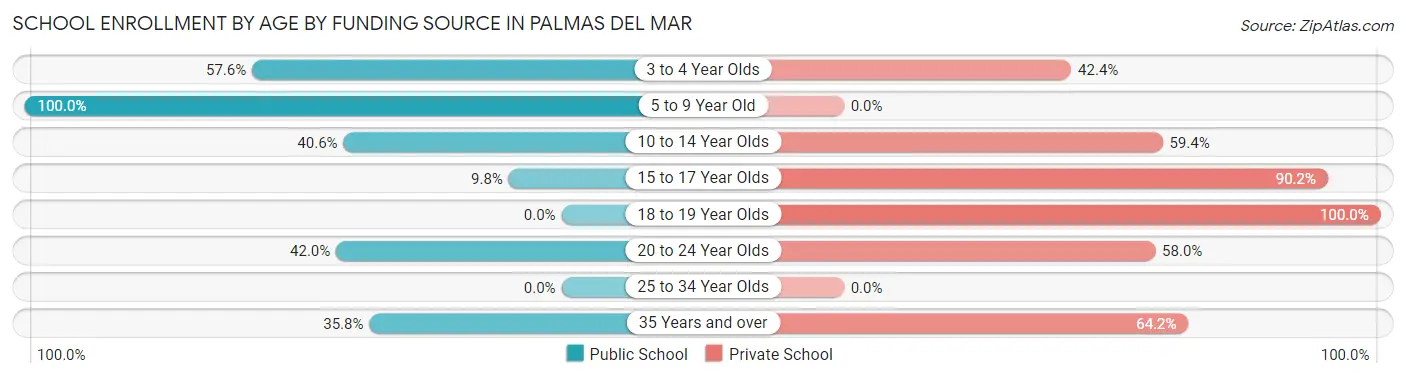
| Age Bracket | Public School | Private School |
| 3 to 4 Year Olds | 34 (57.6%) | 25 (42.4%) |
| 5 to 9 Year Old | 25 (100.0%) | 0 (0.0%) |
| 10 to 14 Year Olds | 26 (40.6%) | 38 (59.4%) |
| 15 to 17 Year Olds | 19 (9.8%) | 174 (90.2%) |
| 18 to 19 Year Olds | 0 (0.0%) | 64 (100.0%) |
| 20 to 24 Year Olds | 68 (42.0%) | 94 (58.0%) |
| 25 to 34 Year Olds | 0 (0.0%) | 0 (0.0%) |
| 35 Years and over | 29 (35.8%) | 52 (64.2%) |
| Total | 201 (31.0%) | 447 (69.0%) |
Educational Attainment by Field of Study in Palmas del Mar
Business (376 | 31.9%), engineering (165 | 14.0%), science & technology (122 | 10.4%), visual & performing arts (116 | 9.9%), and psychology (94 | 8.0%) are the most common fields of study among 1,178 individuals in Palmas del Mar who have obtained a bachelor's degree or higher.
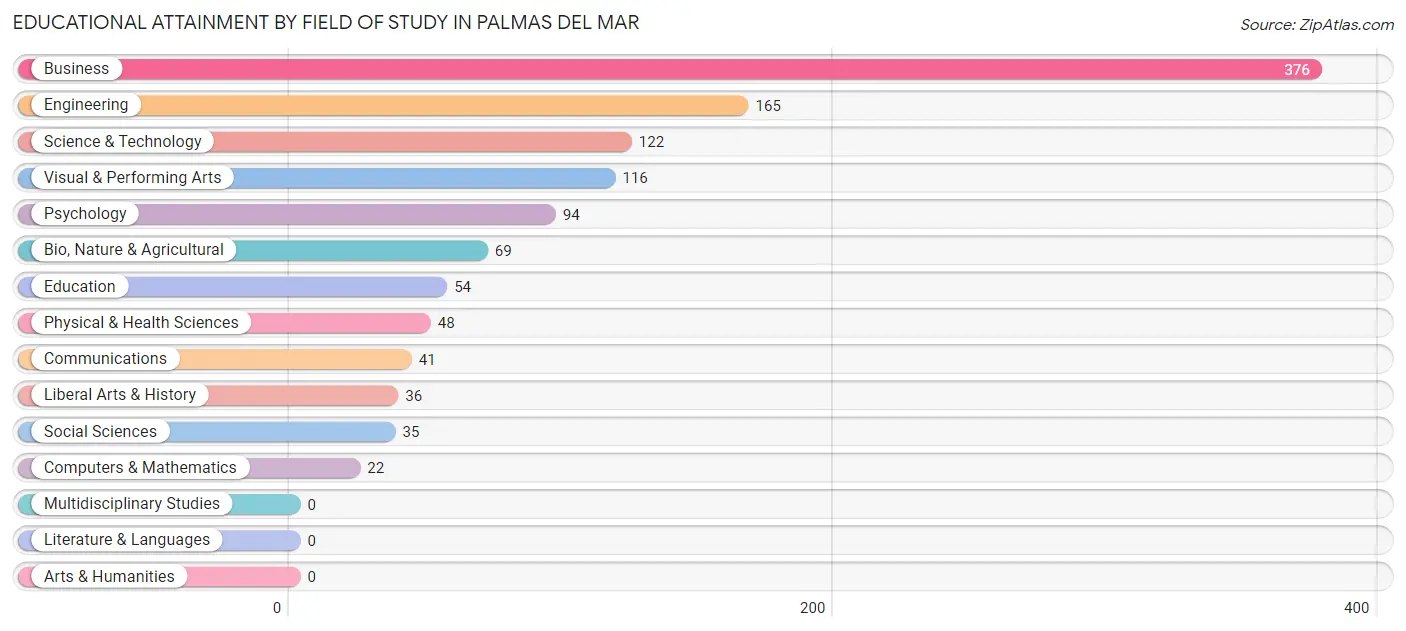
| Field of Study | # Graduates | % Graduates |
| Computers & Mathematics | 22 | 1.9% |
| Bio, Nature & Agricultural | 69 | 5.9% |
| Physical & Health Sciences | 48 | 4.1% |
| Psychology | 94 | 8.0% |
| Social Sciences | 35 | 3.0% |
| Engineering | 165 | 14.0% |
| Multidisciplinary Studies | 0 | 0.0% |
| Science & Technology | 122 | 10.4% |
| Business | 376 | 31.9% |
| Education | 54 | 4.6% |
| Literature & Languages | 0 | 0.0% |
| Liberal Arts & History | 36 | 3.1% |
| Visual & Performing Arts | 116 | 9.9% |
| Communications | 41 | 3.5% |
| Arts & Humanities | 0 | 0.0% |
| Total | 1,178 | 100.0% |
Transportation & Commute in Palmas del Mar
Vehicle Availability by Sex in Palmas del Mar
The most prevalent vehicle ownership categories in Palmas del Mar are males with 2 vehicles (246, accounting for 40.4%) and females with 2 vehicles (163, making up 57.8%).
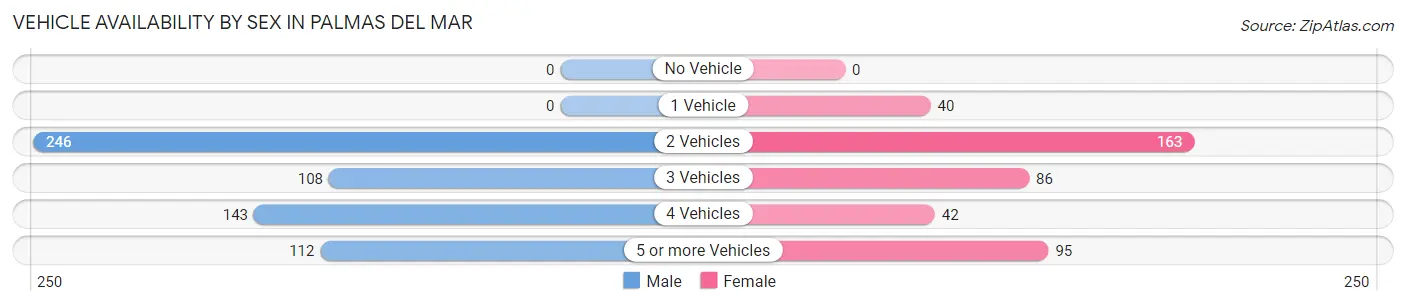
| Vehicles Available | Male | Female |
| No Vehicle | 0 (0.0%) | 0 (0.0%) |
| 1 Vehicle | 0 (0.0%) | 40 (9.4%) |
| 2 Vehicles | 246 (40.4%) | 163 (38.3%) |
| 3 Vehicles | 108 (17.7%) | 86 (20.2%) |
| 4 Vehicles | 143 (23.5%) | 42 (9.9%) |
| 5 or more Vehicles | 112 (18.4%) | 95 (22.3%) |
| Total | 609 (100.0%) | 426 (100.0%) |
Commute Time in Palmas del Mar
The most frequently occuring commute durations in Palmas del Mar are 20 to 24 minutes (245 commuters, 26.4%), 60 to 89 minutes (214 commuters, 23.0%), and 30 to 34 minutes (161 commuters, 17.3%).
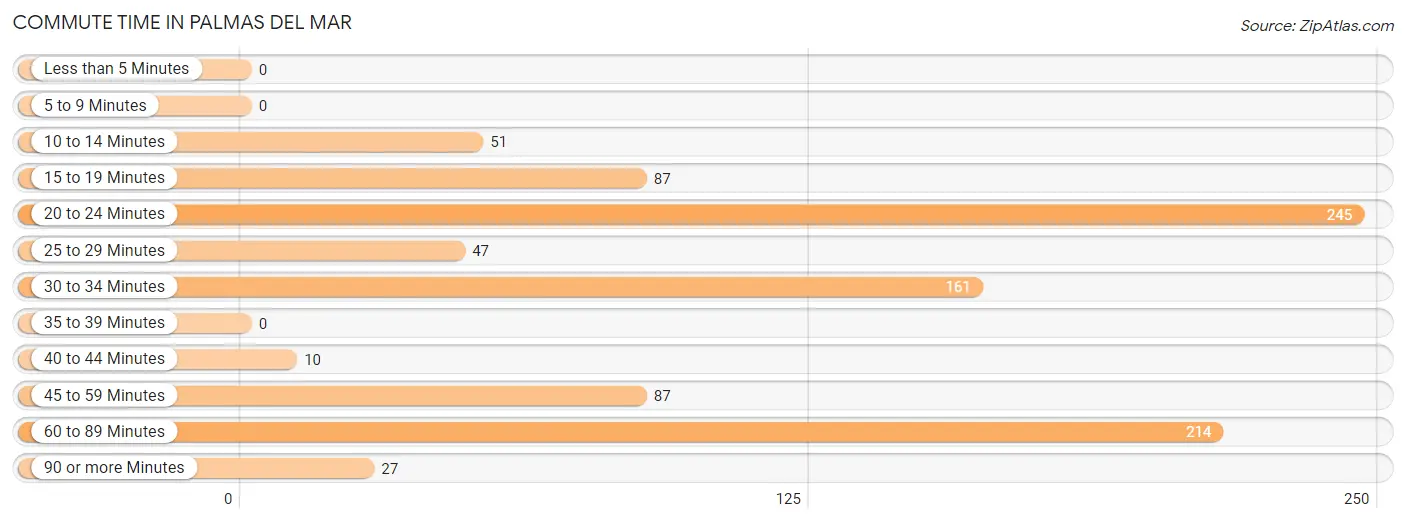
| Commute Time | # Commuters | % Commuters |
| Less than 5 Minutes | 0 | 0.0% |
| 5 to 9 Minutes | 0 | 0.0% |
| 10 to 14 Minutes | 51 | 5.5% |
| 15 to 19 Minutes | 87 | 9.4% |
| 20 to 24 Minutes | 245 | 26.4% |
| 25 to 29 Minutes | 47 | 5.1% |
| 30 to 34 Minutes | 161 | 17.3% |
| 35 to 39 Minutes | 0 | 0.0% |
| 40 to 44 Minutes | 10 | 1.1% |
| 45 to 59 Minutes | 87 | 9.4% |
| 60 to 89 Minutes | 214 | 23.0% |
| 90 or more Minutes | 27 | 2.9% |
Commute Time by Sex in Palmas del Mar
The most common commute times in Palmas del Mar are 60 to 89 minutes (191 commuters, 34.5%) for males and 20 to 24 minutes (98 commuters, 26.1%) for females.
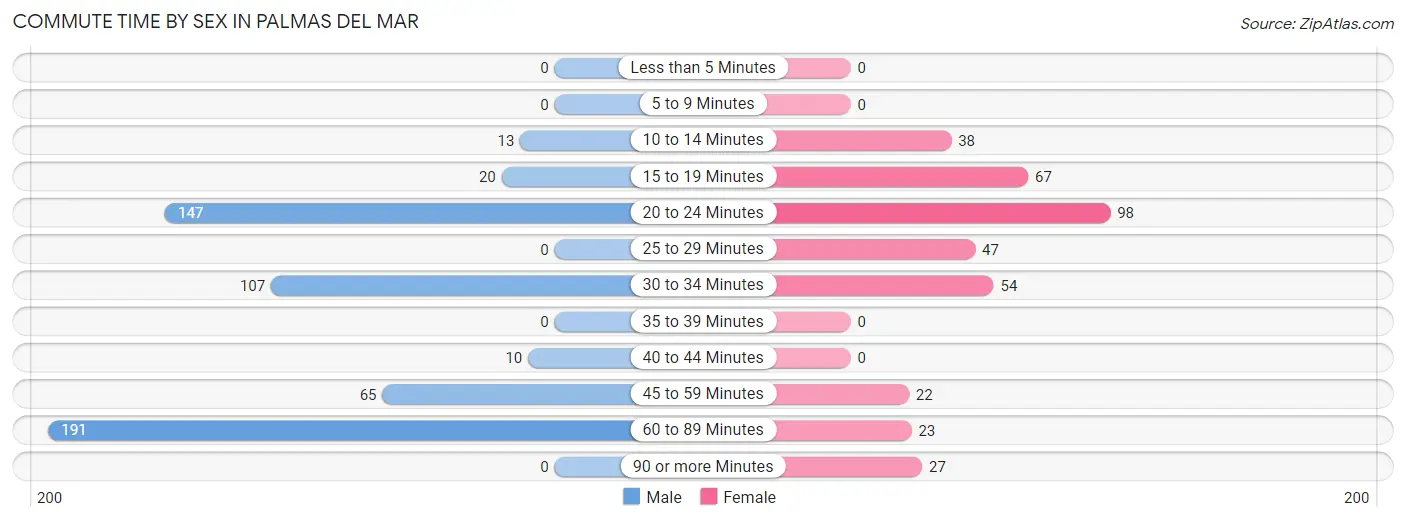
| Commute Time | Male | Female |
| Less than 5 Minutes | 0 (0.0%) | 0 (0.0%) |
| 5 to 9 Minutes | 0 (0.0%) | 0 (0.0%) |
| 10 to 14 Minutes | 13 (2.4%) | 38 (10.1%) |
| 15 to 19 Minutes | 20 (3.6%) | 67 (17.8%) |
| 20 to 24 Minutes | 147 (26.6%) | 98 (26.1%) |
| 25 to 29 Minutes | 0 (0.0%) | 47 (12.5%) |
| 30 to 34 Minutes | 107 (19.4%) | 54 (14.4%) |
| 35 to 39 Minutes | 0 (0.0%) | 0 (0.0%) |
| 40 to 44 Minutes | 10 (1.8%) | 0 (0.0%) |
| 45 to 59 Minutes | 65 (11.7%) | 22 (5.9%) |
| 60 to 89 Minutes | 191 (34.5%) | 23 (6.1%) |
| 90 or more Minutes | 0 (0.0%) | 27 (7.2%) |
Time of Departure to Work by Sex in Palmas del Mar
The most frequent times of departure to work in Palmas del Mar are 7:00 AM to 7:29 AM (115, 20.8%) for males and 7:00 AM to 7:29 AM (105, 27.9%) for females.
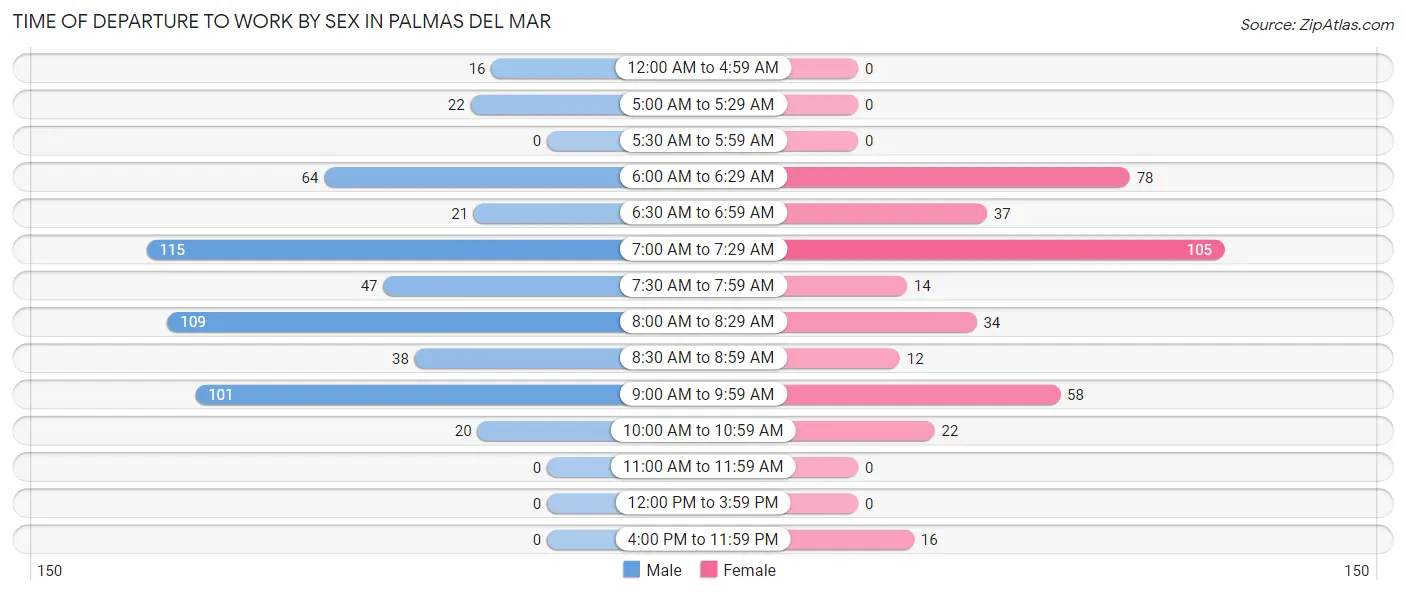
| Time of Departure | Male | Female |
| 12:00 AM to 4:59 AM | 16 (2.9%) | 0 (0.0%) |
| 5:00 AM to 5:29 AM | 22 (4.0%) | 0 (0.0%) |
| 5:30 AM to 5:59 AM | 0 (0.0%) | 0 (0.0%) |
| 6:00 AM to 6:29 AM | 64 (11.6%) | 78 (20.7%) |
| 6:30 AM to 6:59 AM | 21 (3.8%) | 37 (9.8%) |
| 7:00 AM to 7:29 AM | 115 (20.8%) | 105 (27.9%) |
| 7:30 AM to 7:59 AM | 47 (8.5%) | 14 (3.7%) |
| 8:00 AM to 8:29 AM | 109 (19.7%) | 34 (9.0%) |
| 8:30 AM to 8:59 AM | 38 (6.9%) | 12 (3.2%) |
| 9:00 AM to 9:59 AM | 101 (18.3%) | 58 (15.4%) |
| 10:00 AM to 10:59 AM | 20 (3.6%) | 22 (5.9%) |
| 11:00 AM to 11:59 AM | 0 (0.0%) | 0 (0.0%) |
| 12:00 PM to 3:59 PM | 0 (0.0%) | 0 (0.0%) |
| 4:00 PM to 11:59 PM | 0 (0.0%) | 16 (4.3%) |
| Total | 553 (100.0%) | 376 (100.0%) |
Housing Occupancy in Palmas del Mar
Occupancy by Ownership in Palmas del Mar
Of the total 776 dwellings in Palmas del Mar, owner-occupied units account for 691 (89.0%), while renter-occupied units make up 85 (11.0%).
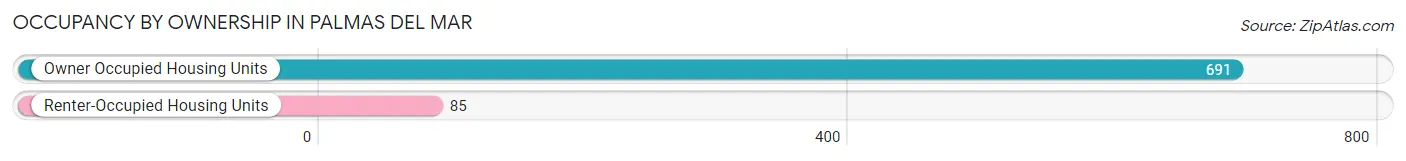
| Occupancy | # Housing Units | % Housing Units |
| Owner Occupied Housing Units | 691 | 89.0% |
| Renter-Occupied Housing Units | 85 | 11.0% |
| Total Occupied Housing Units | 776 | 100.0% |
Occupancy by Household Size in Palmas del Mar
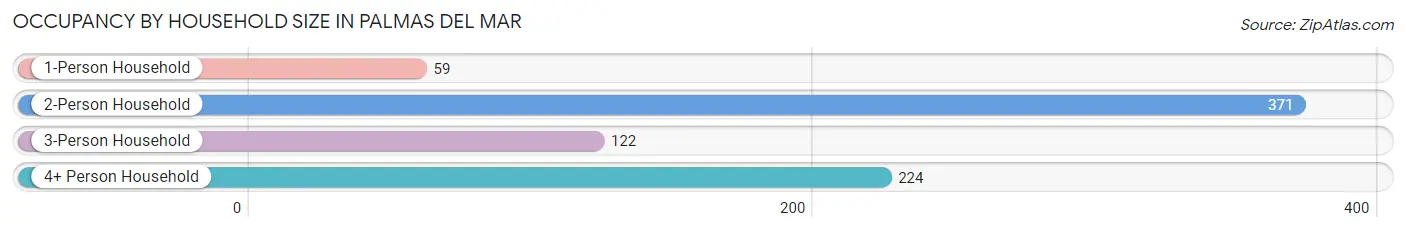
| Household Size | # Housing Units | % Housing Units |
| 1-Person Household | 59 | 7.6% |
| 2-Person Household | 371 | 47.8% |
| 3-Person Household | 122 | 15.7% |
| 4+ Person Household | 224 | 28.9% |
| Total Housing Units | 776 | 100.0% |
Occupancy by Ownership by Household Size in Palmas del Mar
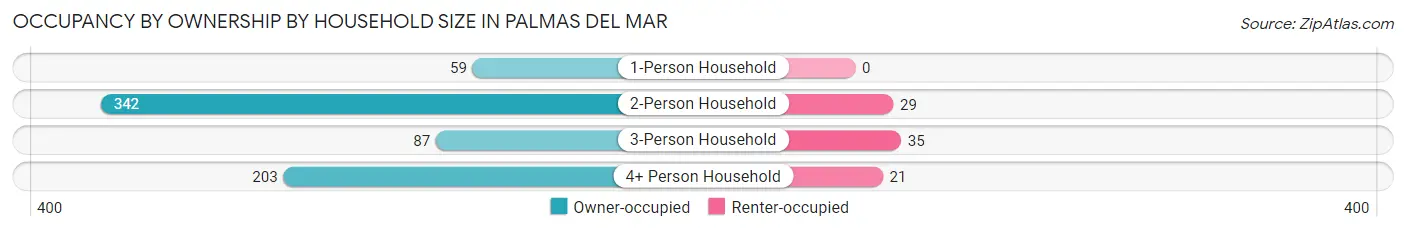
| Household Size | Owner-occupied | Renter-occupied |
| 1-Person Household | 59 (100.0%) | 0 (0.0%) |
| 2-Person Household | 342 (92.2%) | 29 (7.8%) |
| 3-Person Household | 87 (71.3%) | 35 (28.7%) |
| 4+ Person Household | 203 (90.6%) | 21 (9.4%) |
| Total Housing Units | 691 (89.0%) | 85 (11.0%) |
Occupancy by Educational Attainment in Palmas del Mar
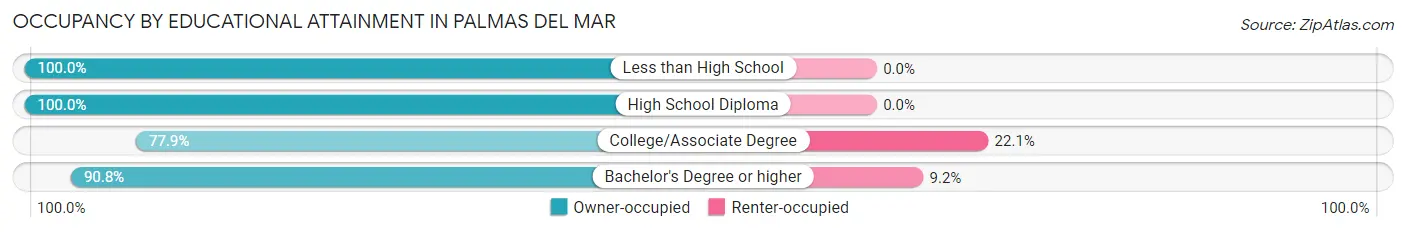
| Household Size | Owner-occupied | Renter-occupied |
| Less than High School | 12 (100.0%) | 0 (0.0%) |
| High School Diploma | 94 (100.0%) | 0 (0.0%) |
| College/Associate Degree | 141 (77.9%) | 40 (22.1%) |
| Bachelor's Degree or higher | 444 (90.8%) | 45 (9.2%) |
Occupancy by Age of Householder in Palmas del Mar
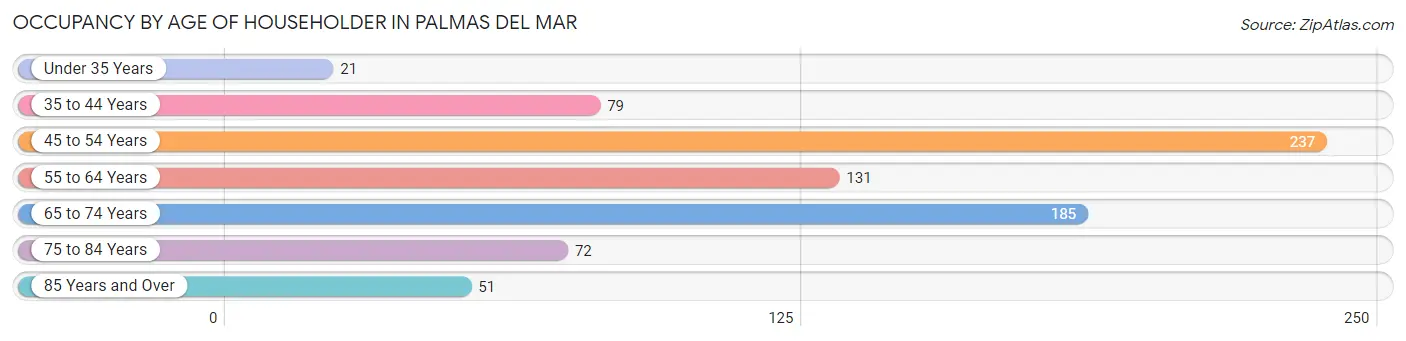
| Age Bracket | # Households | % Households |
| Under 35 Years | 21 | 2.7% |
| 35 to 44 Years | 79 | 10.2% |
| 45 to 54 Years | 237 | 30.5% |
| 55 to 64 Years | 131 | 16.9% |
| 65 to 74 Years | 185 | 23.8% |
| 75 to 84 Years | 72 | 9.3% |
| 85 Years and Over | 51 | 6.6% |
| Total | 776 | 100.0% |
Housing Finances in Palmas del Mar
Median Income by Occupancy in Palmas del Mar
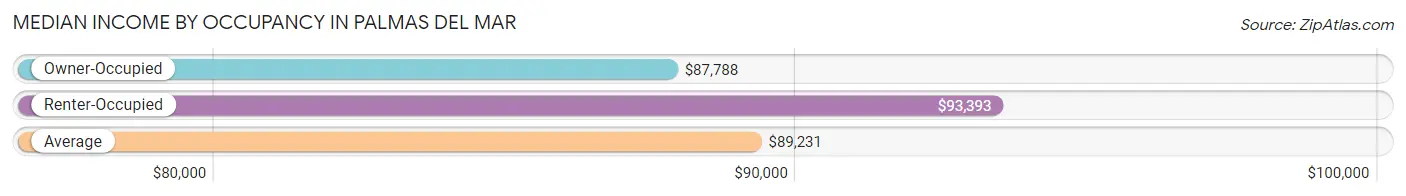
| Occupancy Type | # Households | Median Income |
| Owner-Occupied | 691 (89.0%) | $87,788 |
| Renter-Occupied | 85 (11.0%) | $93,393 |
| Average | 776 (100.0%) | $89,231 |
Occupancy by Householder Income Bracket in Palmas del Mar
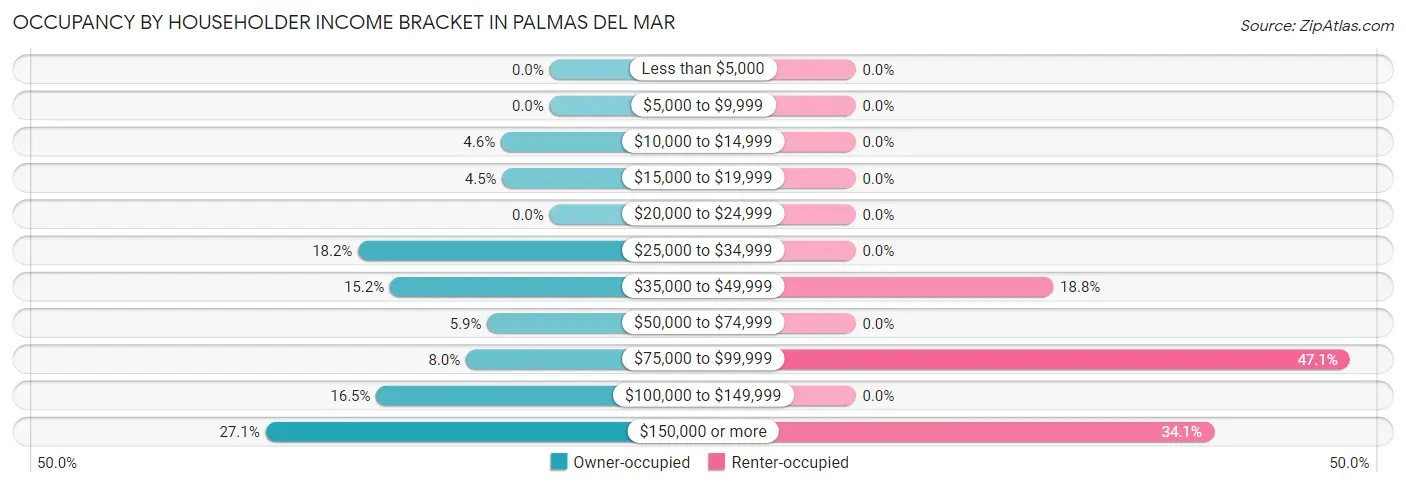
| Income Bracket | Owner-occupied | Renter-occupied |
| Less than $5,000 | 0 (0.0%) | 0 (0.0%) |
| $5,000 to $9,999 | 0 (0.0%) | 0 (0.0%) |
| $10,000 to $14,999 | 32 (4.6%) | 0 (0.0%) |
| $15,000 to $19,999 | 31 (4.5%) | 0 (0.0%) |
| $20,000 to $24,999 | 0 (0.0%) | 0 (0.0%) |
| $25,000 to $34,999 | 126 (18.2%) | 0 (0.0%) |
| $35,000 to $49,999 | 105 (15.2%) | 16 (18.8%) |
| $50,000 to $74,999 | 41 (5.9%) | 0 (0.0%) |
| $75,000 to $99,999 | 55 (8.0%) | 40 (47.1%) |
| $100,000 to $149,999 | 114 (16.5%) | 0 (0.0%) |
| $150,000 or more | 187 (27.1%) | 29 (34.1%) |
| Total | 691 (100.0%) | 85 (100.0%) |
Monthly Housing Cost Tiers in Palmas del Mar
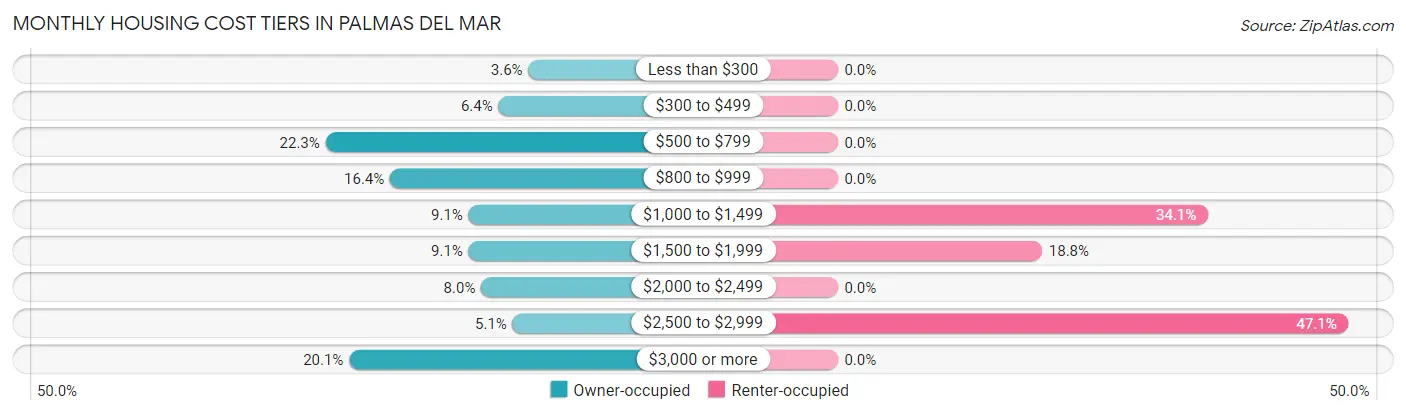
| Monthly Cost | Owner-occupied | Renter-occupied |
| Less than $300 | 25 (3.6%) | 0 (0.0%) |
| $300 to $499 | 44 (6.4%) | 0 (0.0%) |
| $500 to $799 | 154 (22.3%) | 0 (0.0%) |
| $800 to $999 | 113 (16.4%) | 0 (0.0%) |
| $1,000 to $1,499 | 63 (9.1%) | 29 (34.1%) |
| $1,500 to $1,999 | 63 (9.1%) | 16 (18.8%) |
| $2,000 to $2,499 | 55 (8.0%) | 0 (0.0%) |
| $2,500 to $2,999 | 35 (5.1%) | 40 (47.1%) |
| $3,000 or more | 139 (20.1%) | 0 (0.0%) |
| Total | 691 (100.0%) | 85 (100.0%) |
Physical Housing Characteristics in Palmas del Mar
Housing Structures in Palmas del Mar
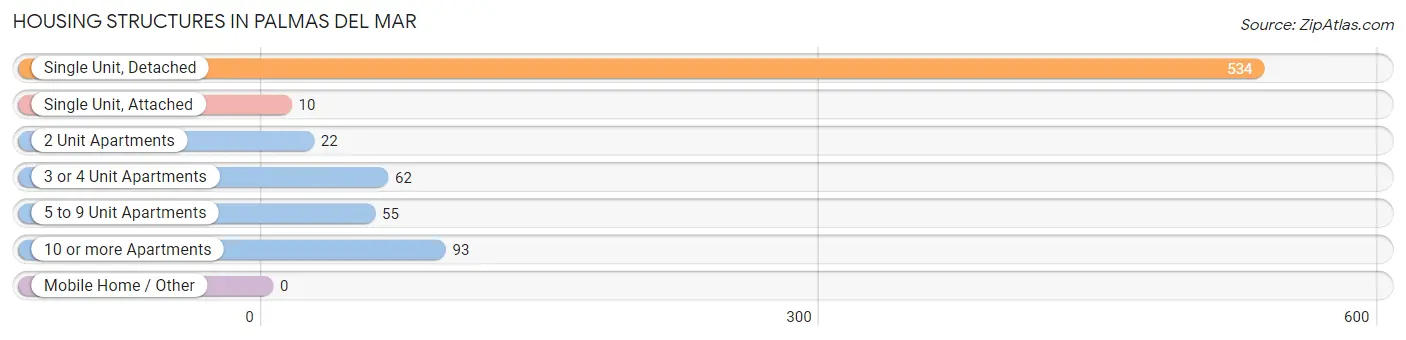
| Structure Type | # Housing Units | % Housing Units |
| Single Unit, Detached | 534 | 68.8% |
| Single Unit, Attached | 10 | 1.3% |
| 2 Unit Apartments | 22 | 2.8% |
| 3 or 4 Unit Apartments | 62 | 8.0% |
| 5 to 9 Unit Apartments | 55 | 7.1% |
| 10 or more Apartments | 93 | 12.0% |
| Mobile Home / Other | 0 | 0.0% |
| Total | 776 | 100.0% |
Housing Structures by Occupancy in Palmas del Mar
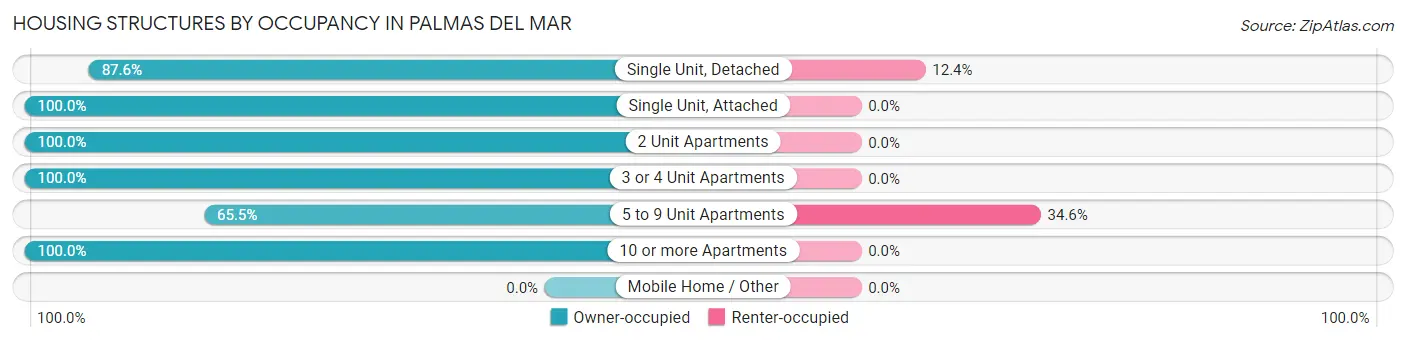
| Structure Type | Owner-occupied | Renter-occupied |
| Single Unit, Detached | 468 (87.6%) | 66 (12.4%) |
| Single Unit, Attached | 10 (100.0%) | 0 (0.0%) |
| 2 Unit Apartments | 22 (100.0%) | 0 (0.0%) |
| 3 or 4 Unit Apartments | 62 (100.0%) | 0 (0.0%) |
| 5 to 9 Unit Apartments | 36 (65.4%) | 19 (34.5%) |
| 10 or more Apartments | 93 (100.0%) | 0 (0.0%) |
| Mobile Home / Other | 0 (0.0%) | 0 (0.0%) |
| Total | 691 (89.0%) | 85 (11.0%) |
Housing Structures by Number of Rooms in Palmas del Mar
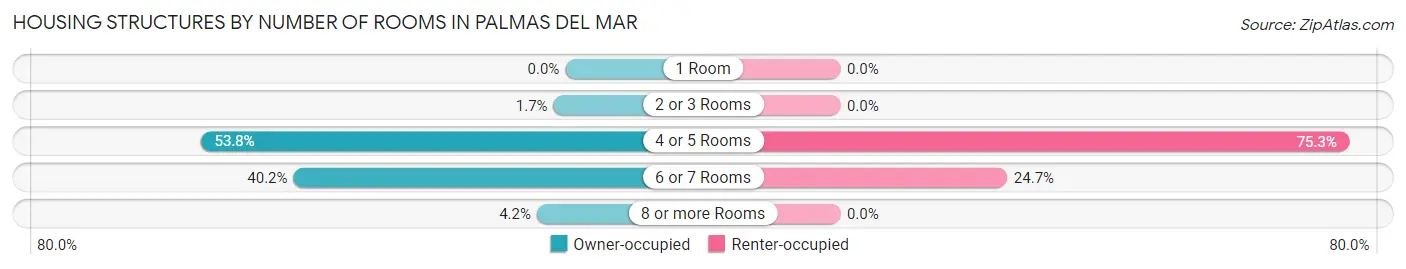
| Number of Rooms | Owner-occupied | Renter-occupied |
| 1 Room | 0 (0.0%) | 0 (0.0%) |
| 2 or 3 Rooms | 12 (1.7%) | 0 (0.0%) |
| 4 or 5 Rooms | 372 (53.8%) | 64 (75.3%) |
| 6 or 7 Rooms | 278 (40.2%) | 21 (24.7%) |
| 8 or more Rooms | 29 (4.2%) | 0 (0.0%) |
| Total | 691 (100.0%) | 85 (100.0%) |
Housing Structure by Heating Type in Palmas del Mar
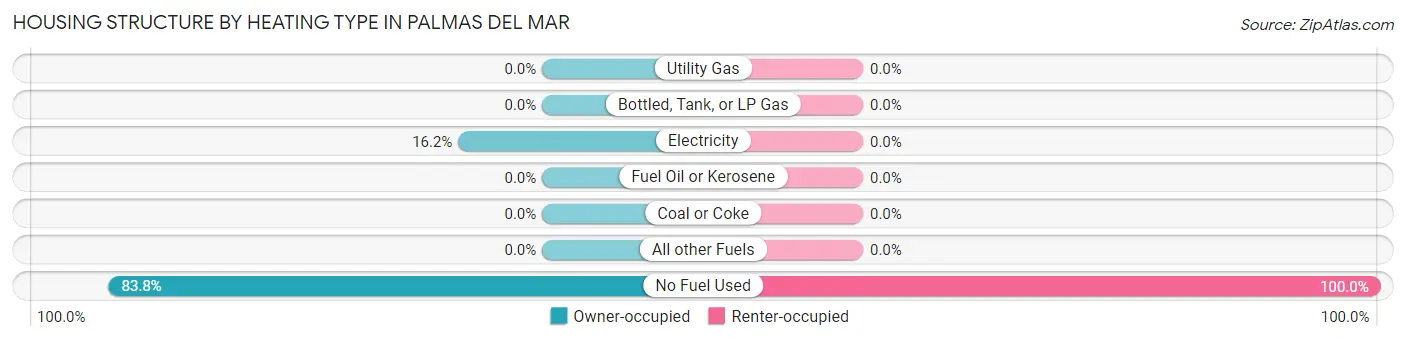
| Heating Type | Owner-occupied | Renter-occupied |
| Utility Gas | 0 (0.0%) | 0 (0.0%) |
| Bottled, Tank, or LP Gas | 0 (0.0%) | 0 (0.0%) |
| Electricity | 112 (16.2%) | 0 (0.0%) |
| Fuel Oil or Kerosene | 0 (0.0%) | 0 (0.0%) |
| Coal or Coke | 0 (0.0%) | 0 (0.0%) |
| All other Fuels | 0 (0.0%) | 0 (0.0%) |
| No Fuel Used | 579 (83.8%) | 85 (100.0%) |
| Total | 691 (100.0%) | 85 (100.0%) |
Household Vehicle Usage in Palmas del Mar
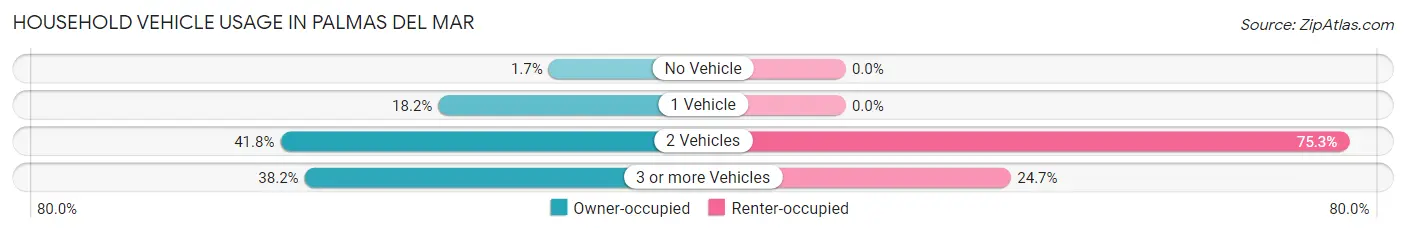
| Vehicles per Household | Owner-occupied | Renter-occupied |
| No Vehicle | 12 (1.7%) | 0 (0.0%) |
| 1 Vehicle | 126 (18.2%) | 0 (0.0%) |
| 2 Vehicles | 289 (41.8%) | 64 (75.3%) |
| 3 or more Vehicles | 264 (38.2%) | 21 (24.7%) |
| Total | 691 (100.0%) | 85 (100.0%) |
Real Estate & Mortgages in Palmas del Mar
Real Estate and Mortgage Overview in Palmas del Mar
| Characteristic | Without Mortgage | With Mortgage |
| Housing Units | 251 | 440 |
| Median Property Value | $437,700 | $357,600 |
| Median Household Income | - | - |
| Monthly Housing Costs | $597 | $139 |
| Real Estate Taxes | $2,172 | $164 |
Property Value by Mortgage Status in Palmas del Mar
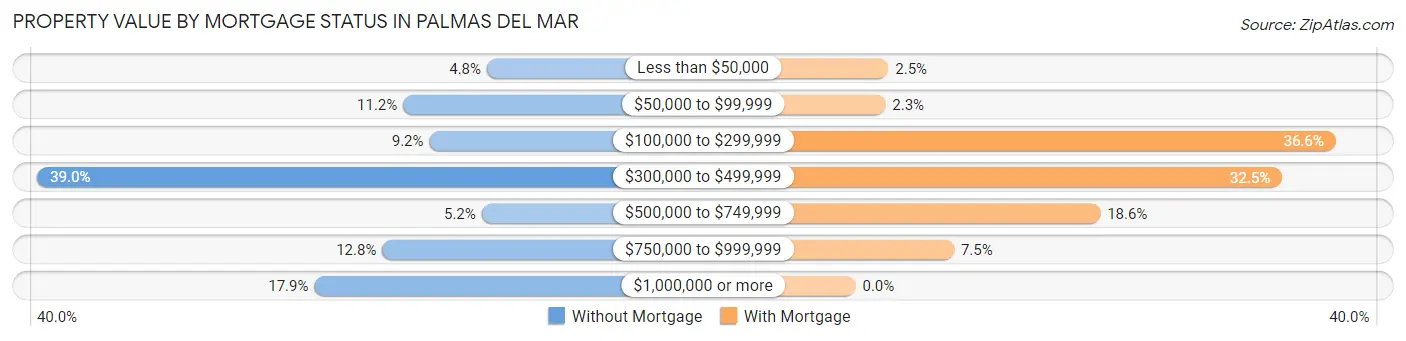
| Property Value | Without Mortgage | With Mortgage |
| Less than $50,000 | 12 (4.8%) | 11 (2.5%) |
| $50,000 to $99,999 | 28 (11.2%) | 10 (2.3%) |
| $100,000 to $299,999 | 23 (9.2%) | 161 (36.6%) |
| $300,000 to $499,999 | 98 (39.0%) | 143 (32.5%) |
| $500,000 to $749,999 | 13 (5.2%) | 82 (18.6%) |
| $750,000 to $999,999 | 32 (12.8%) | 33 (7.5%) |
| $1,000,000 or more | 45 (17.9%) | 0 (0.0%) |
| Total | 251 (100.0%) | 440 (100.0%) |
Household Income by Mortgage Status in Palmas del Mar
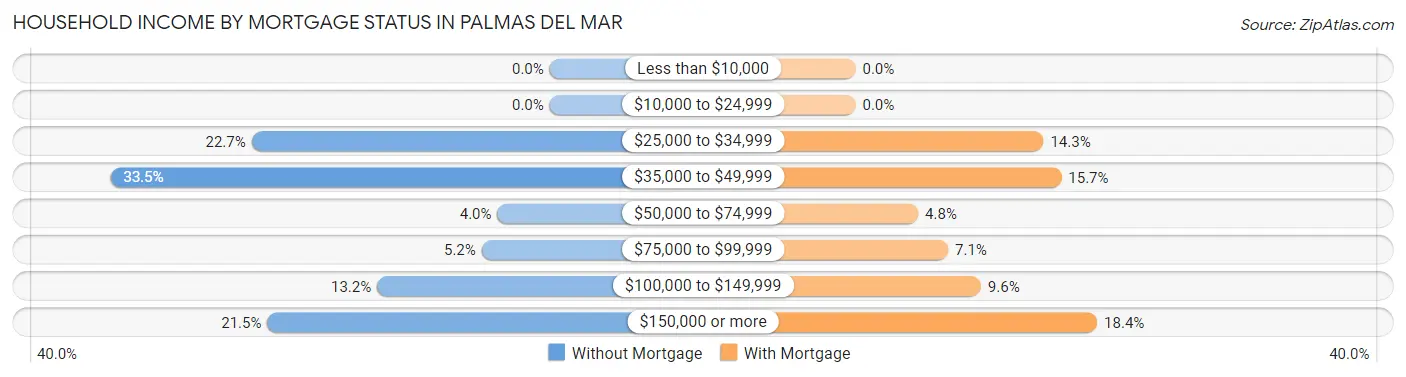
| Household Income | Without Mortgage | With Mortgage |
| Less than $10,000 | 0 (0.0%) | 0 (0.0%) |
| $10,000 to $24,999 | 0 (0.0%) | 0 (0.0%) |
| $25,000 to $34,999 | 57 (22.7%) | 63 (14.3%) |
| $35,000 to $49,999 | 84 (33.5%) | 69 (15.7%) |
| $50,000 to $74,999 | 10 (4.0%) | 21 (4.8%) |
| $75,000 to $99,999 | 13 (5.2%) | 31 (7.0%) |
| $100,000 to $149,999 | 33 (13.2%) | 42 (9.6%) |
| $150,000 or more | 54 (21.5%) | 81 (18.4%) |
| Total | 251 (100.0%) | 440 (100.0%) |
Property Value to Household Income Ratio in Palmas del Mar
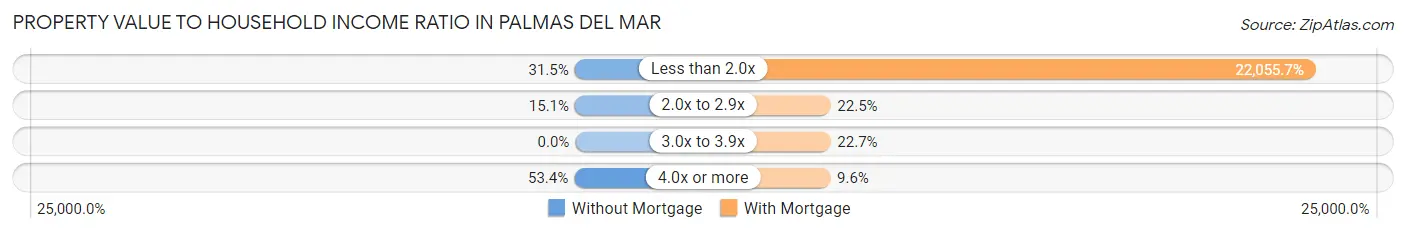
| Value-to-Income Ratio | Without Mortgage | With Mortgage |
| Less than 2.0x | 79 (31.5%) | 97,045 (22,055.7%) |
| 2.0x to 2.9x | 38 (15.1%) | 99 (22.5%) |
| 3.0x to 3.9x | 0 (0.0%) | 100 (22.7%) |
| 4.0x or more | 134 (53.4%) | 42 (9.6%) |
| Total | 251 (100.0%) | 440 (100.0%) |
Real Estate Taxes by Mortgage Status in Palmas del Mar
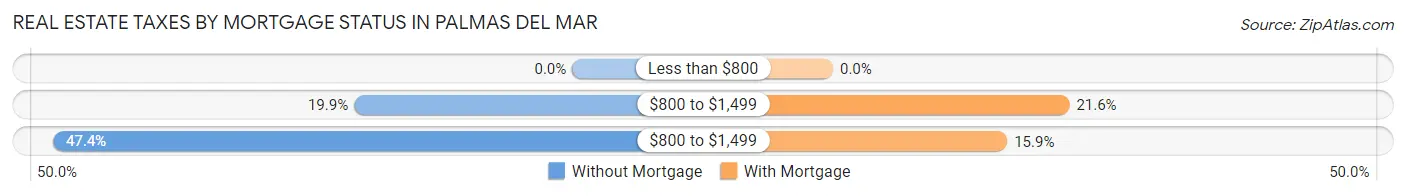
| Property Taxes | Without Mortgage | With Mortgage |
| Less than $800 | 0 (0.0%) | 0 (0.0%) |
| $800 to $1,499 | 50 (19.9%) | 95 (21.6%) |
| $800 to $1,499 | 119 (47.4%) | 70 (15.9%) |
| Total | 251 (100.0%) | 440 (100.0%) |
Health & Disability in Palmas del Mar
Health Insurance Coverage by Age in Palmas del Mar
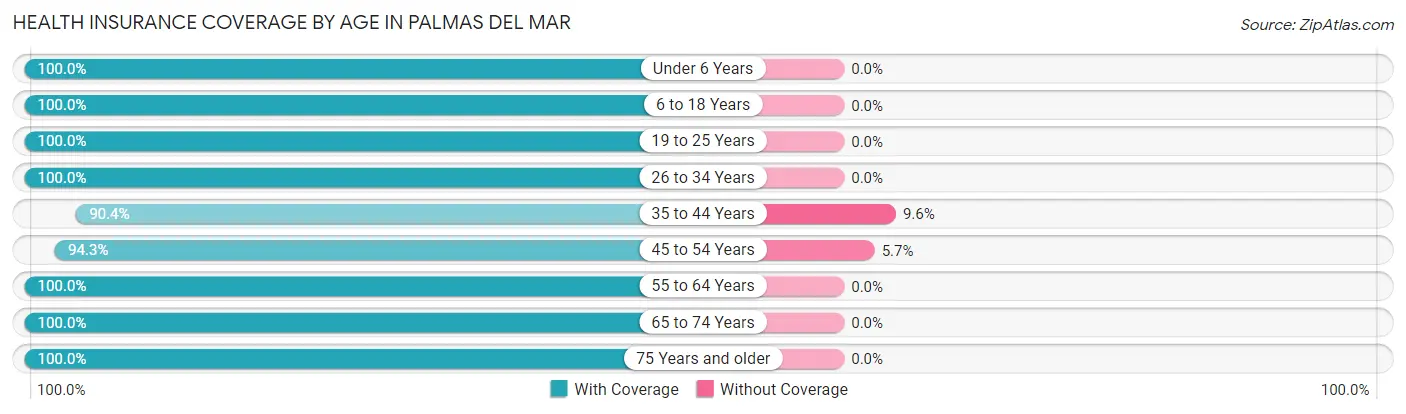
| Age Bracket | With Coverage | Without Coverage |
| Under 6 Years | 124 (100.0%) | 0 (0.0%) |
| 6 to 18 Years | 301 (100.0%) | 0 (0.0%) |
| 19 to 25 Years | 293 (100.0%) | 0 (0.0%) |
| 26 to 34 Years | 239 (100.0%) | 0 (0.0%) |
| 35 to 44 Years | 225 (90.4%) | 24 (9.6%) |
| 45 to 54 Years | 382 (94.3%) | 23 (5.7%) |
| 55 to 64 Years | 269 (100.0%) | 0 (0.0%) |
| 65 to 74 Years | 340 (100.0%) | 0 (0.0%) |
| 75 Years and older | 272 (100.0%) | 0 (0.0%) |
| Total | 2,445 (98.1%) | 47 (1.9%) |
Health Insurance Coverage by Citizenship Status in Palmas del Mar
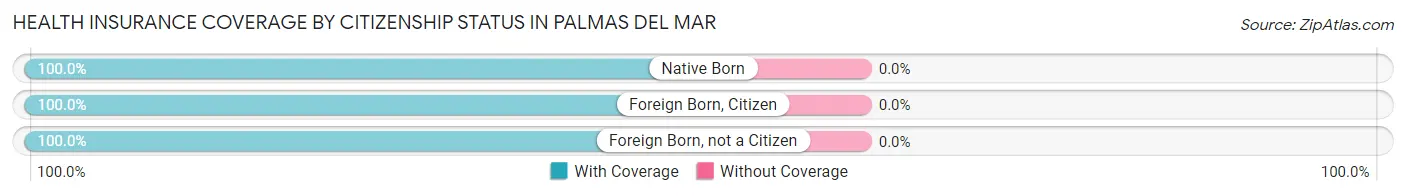
| Citizenship Status | With Coverage | Without Coverage |
| Native Born | 124 (100.0%) | 0 (0.0%) |
| Foreign Born, Citizen | 301 (100.0%) | 0 (0.0%) |
| Foreign Born, not a Citizen | 293 (100.0%) | 0 (0.0%) |
Health Insurance Coverage by Household Income in Palmas del Mar
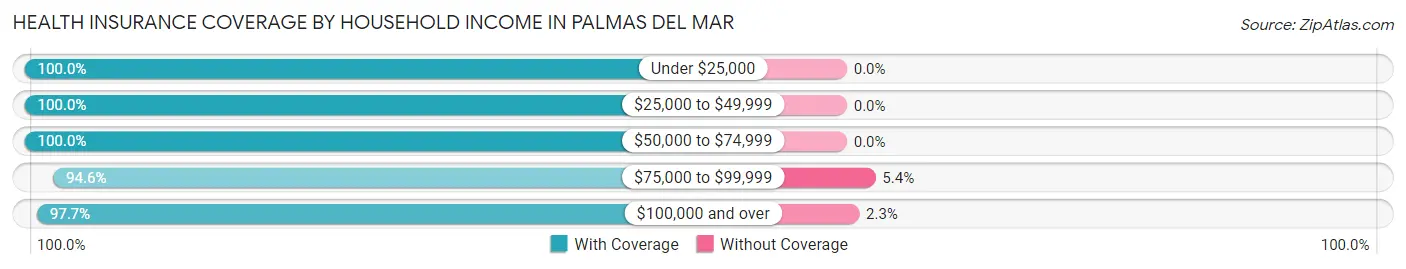
| Household Income | With Coverage | Without Coverage |
| Under $25,000 | 96 (100.0%) | 0 (0.0%) |
| $25,000 to $49,999 | 840 (100.0%) | 0 (0.0%) |
| $50,000 to $74,999 | 110 (100.0%) | 0 (0.0%) |
| $75,000 to $99,999 | 424 (94.6%) | 24 (5.4%) |
| $100,000 and over | 975 (97.7%) | 23 (2.3%) |
Public vs Private Health Insurance Coverage by Age in Palmas del Mar
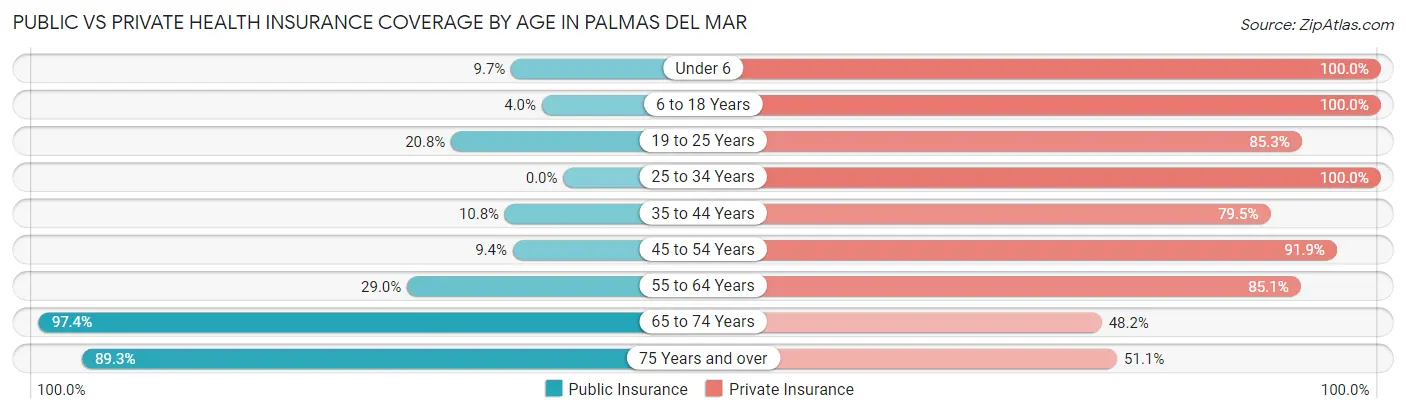
| Age Bracket | Public Insurance | Private Insurance |
| Under 6 | 12 (9.7%) | 124 (100.0%) |
| 6 to 18 Years | 12 (4.0%) | 301 (100.0%) |
| 19 to 25 Years | 61 (20.8%) | 250 (85.3%) |
| 25 to 34 Years | 0 (0.0%) | 239 (100.0%) |
| 35 to 44 Years | 27 (10.8%) | 198 (79.5%) |
| 45 to 54 Years | 38 (9.4%) | 372 (91.8%) |
| 55 to 64 Years | 78 (29.0%) | 229 (85.1%) |
| 65 to 74 Years | 331 (97.4%) | 164 (48.2%) |
| 75 Years and over | 243 (89.3%) | 139 (51.1%) |
| Total | 802 (32.2%) | 2,016 (80.9%) |
Disability Status by Sex by Age in Palmas del Mar
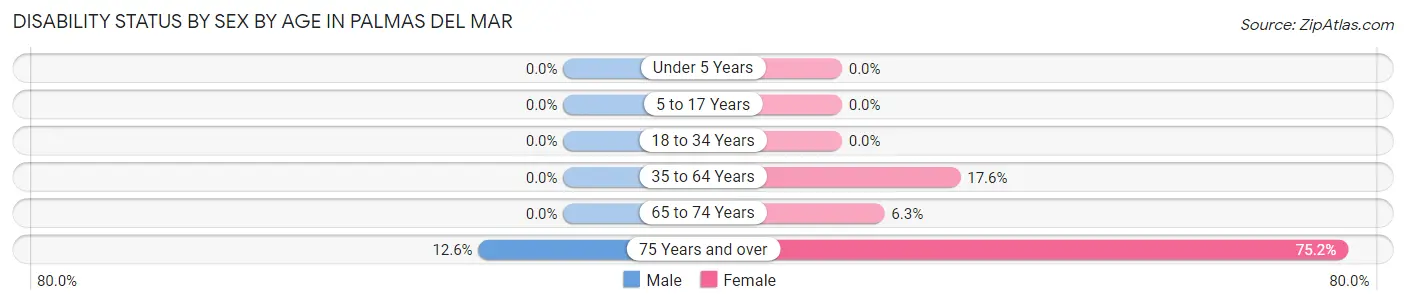
| Age Bracket | Male | Female |
| Under 5 Years | 0 (0.0%) | 0 (0.0%) |
| 5 to 17 Years | 0 (0.0%) | 0 (0.0%) |
| 18 to 34 Years | 0 (0.0%) | 0 (0.0%) |
| 35 to 64 Years | 0 (0.0%) | 97 (17.6%) |
| 65 to 74 Years | 0 (0.0%) | 10 (6.3%) |
| 75 Years and over | 15 (12.6%) | 115 (75.2%) |
Disability Class by Sex by Age in Palmas del Mar
Disability Class: Hearing Difficulty
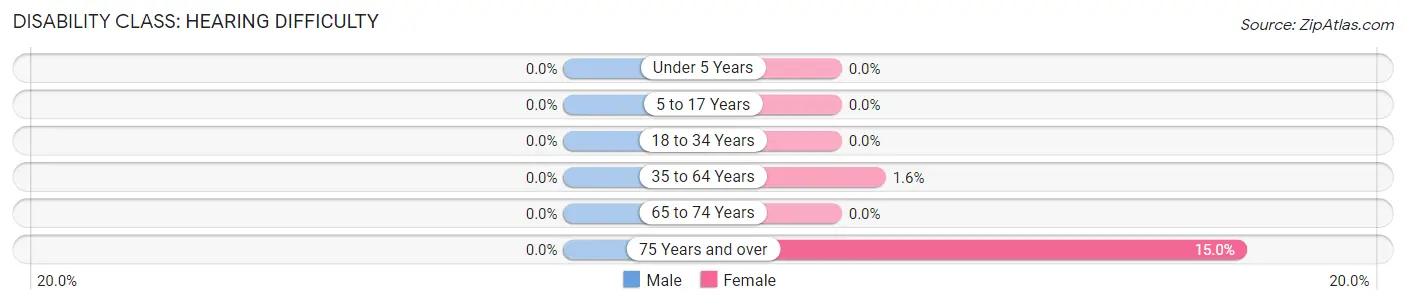
| Age Bracket | Male | Female |
| Under 5 Years | 0 (0.0%) | 0 (0.0%) |
| 5 to 17 Years | 0 (0.0%) | 0 (0.0%) |
| 18 to 34 Years | 0 (0.0%) | 0 (0.0%) |
| 35 to 64 Years | 0 (0.0%) | 9 (1.6%) |
| 65 to 74 Years | 0 (0.0%) | 0 (0.0%) |
| 75 Years and over | 0 (0.0%) | 23 (15.0%) |
Disability Class: Vision Difficulty
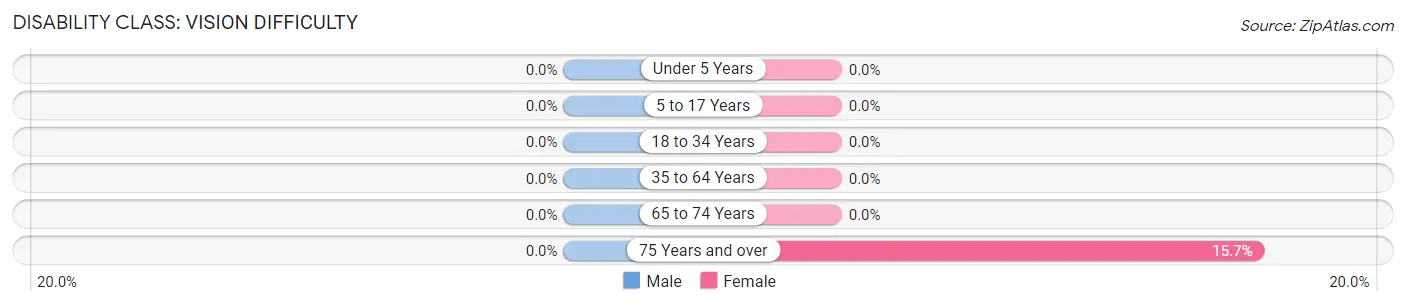
| Age Bracket | Male | Female |
| Under 5 Years | 0 (0.0%) | 0 (0.0%) |
| 5 to 17 Years | 0 (0.0%) | 0 (0.0%) |
| 18 to 34 Years | 0 (0.0%) | 0 (0.0%) |
| 35 to 64 Years | 0 (0.0%) | 0 (0.0%) |
| 65 to 74 Years | 0 (0.0%) | 0 (0.0%) |
| 75 Years and over | 0 (0.0%) | 24 (15.7%) |
Disability Class: Cognitive Difficulty
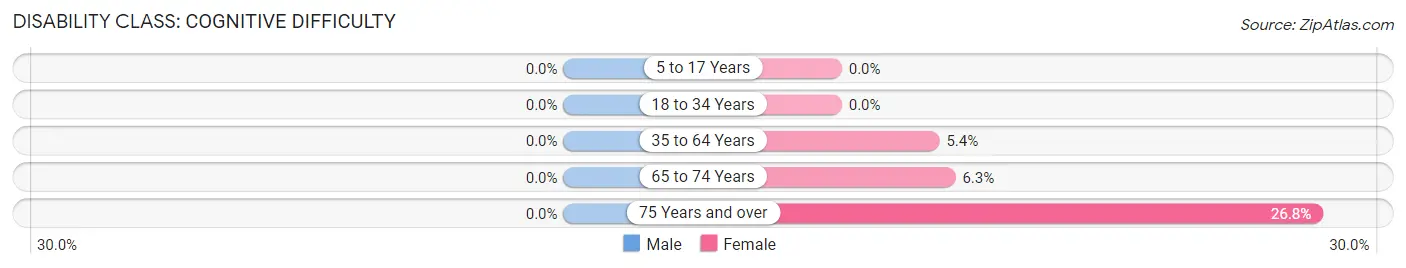
| Age Bracket | Male | Female |
| 5 to 17 Years | 0 (0.0%) | 0 (0.0%) |
| 18 to 34 Years | 0 (0.0%) | 0 (0.0%) |
| 35 to 64 Years | 0 (0.0%) | 30 (5.4%) |
| 65 to 74 Years | 0 (0.0%) | 10 (6.3%) |
| 75 Years and over | 0 (0.0%) | 41 (26.8%) |
Disability Class: Ambulatory Difficulty
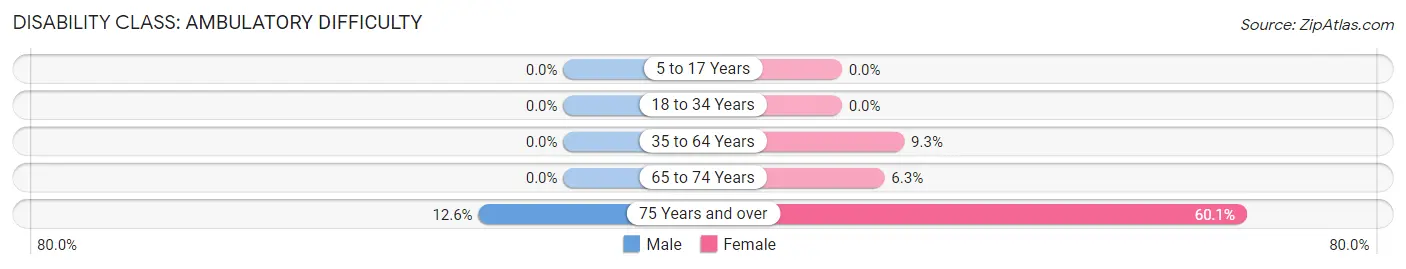
| Age Bracket | Male | Female |
| 5 to 17 Years | 0 (0.0%) | 0 (0.0%) |
| 18 to 34 Years | 0 (0.0%) | 0 (0.0%) |
| 35 to 64 Years | 0 (0.0%) | 51 (9.3%) |
| 65 to 74 Years | 0 (0.0%) | 10 (6.3%) |
| 75 Years and over | 15 (12.6%) | 92 (60.1%) |
Disability Class: Self-Care Difficulty
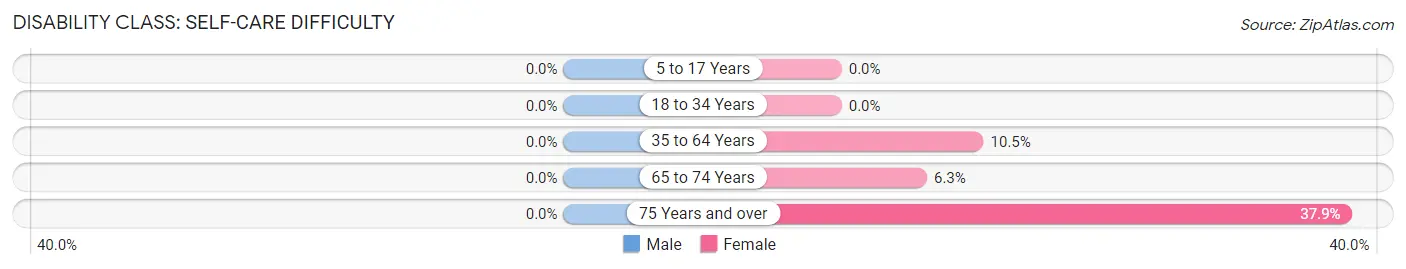
| Age Bracket | Male | Female |
| 5 to 17 Years | 0 (0.0%) | 0 (0.0%) |
| 18 to 34 Years | 0 (0.0%) | 0 (0.0%) |
| 35 to 64 Years | 0 (0.0%) | 58 (10.5%) |
| 65 to 74 Years | 0 (0.0%) | 10 (6.3%) |
| 75 Years and over | 0 (0.0%) | 58 (37.9%) |
Technology Access in Palmas del Mar
Computing Device Access in Palmas del Mar
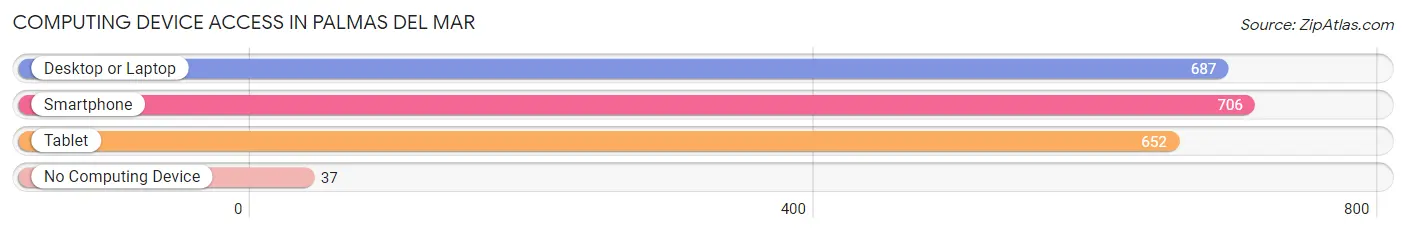
| Device Type | # Households | % Households |
| Desktop or Laptop | 687 | 88.5% |
| Smartphone | 706 | 91.0% |
| Tablet | 652 | 84.0% |
| No Computing Device | 37 | 4.8% |
| Total | 776 | 100.0% |
Internet Access in Palmas del Mar
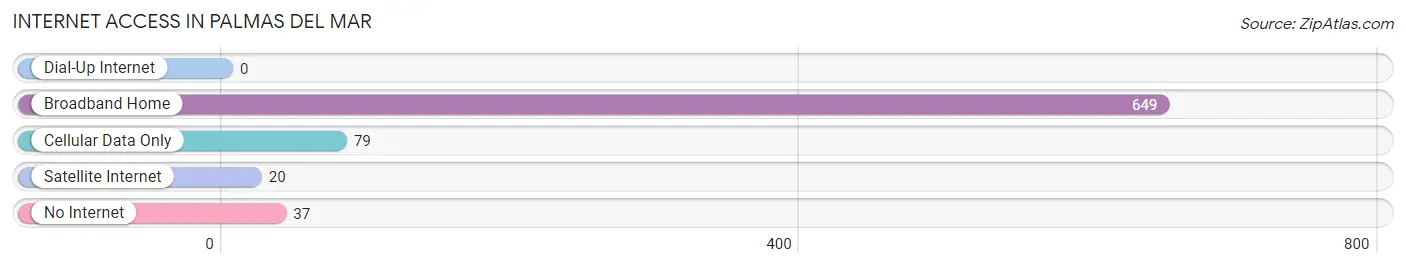
| Internet Type | # Households | % Households |
| Dial-Up Internet | 0 | 0.0% |
| Broadband Home | 649 | 83.6% |
| Cellular Data Only | 79 | 10.2% |
| Satellite Internet | 20 | 2.6% |
| No Internet | 37 | 4.8% |
| Total | 776 | 100.0% |
Palmas del Mar Summary
Palmas Del Mar is a resort community located on the southeastern coast of Puerto Rico. It is situated on the Caribbean Sea, just east of the city of Humacao. The community is part of the municipality of Humacao and is located within the Humacao Natural Reserve. Palmas Del Mar is a popular tourist destination, offering a variety of activities and attractions for visitors.
History
Palmas Del Mar was founded in the late 1970s by the Puerto Rican government as part of a plan to develop the eastern coast of the island. The community was designed to be a resort destination, with a focus on providing a luxurious lifestyle for its residents. The development of the community was funded by the Puerto Rican government, as well as private investors.
The first phase of the development was completed in 1982, and included the construction of a marina, golf course, and several luxury hotels. The second phase of the development was completed in the late 1980s, and included the construction of additional hotels, restaurants, and shopping centers.
Geography
Palmas Del Mar is located on the southeastern coast of Puerto Rico, just east of the city of Humacao. The community is situated on the Caribbean Sea, and is surrounded by the Humacao Natural Reserve. The community is located at an elevation of approximately 10 feet above sea level.
The climate in Palmas Del Mar is tropical, with temperatures ranging from the mid-70s to the mid-80s throughout the year. The area receives an average of about 60 inches of rain per year.
Economy
The economy of Palmas Del Mar is largely based on tourism. The community is home to several luxury hotels, restaurants, and shopping centers, which attract visitors from around the world. The community also has a marina, which is used by both recreational and commercial vessels.
In addition to tourism, Palmas Del Mar is home to several businesses, including a number of manufacturing companies. The community is also home to a number of financial institutions, including banks and insurance companies.
Demographics
As of the 2010 census, the population of Palmas Del Mar was 8,845. The population is largely composed of Puerto Ricans, with a small percentage of other ethnicities. The median age of the population is 40 years old, and the median household income is $45,000.
The majority of the population is Roman Catholic, with a small percentage of other religious affiliations. The primary language spoken in Palmas Del Mar is Spanish, although English is also widely spoken.
Conclusion
Palmas Del Mar is a resort community located on the southeastern coast of Puerto Rico. The community was founded in the late 1970s and has since become a popular tourist destination. The economy of Palmas Del Mar is largely based on tourism, with a number of luxury hotels, restaurants, and shopping centers. The population of Palmas Del Mar is largely composed of Puerto Ricans, with a median age of 40 years old and a median household income of $45,000.
Common Questions
What is the Total Population of Palmas del Mar?
Total Population of Palmas del Mar is 2,492.
What is the Total Male Population of Palmas del Mar?
Total Male Population of Palmas del Mar is 1,193.
What is the Total Female Population of Palmas del Mar?
Total Female Population of Palmas del Mar is 1,299.
What is the Ratio of Males per 100 Females in Palmas del Mar?
There are 91.84 Males per 100 Females in Palmas del Mar.
What is the Ratio of Females per 100 Males in Palmas del Mar?
There are 108.89 Females per 100 Males in Palmas del Mar.
What is the Median Population Age in Palmas del Mar?
Median Population Age in Palmas del Mar is 46.3 Years.
What is the Average Family Size in Palmas del Mar
Average Family Size in Palmas del Mar is 3.3 People.
What is the Average Household Size in Palmas del Mar
Average Household Size in Palmas del Mar is 3.2 People.
What is Per Capita Income in Palmas del Mar?
Per Capita income in Palmas del Mar is $40,419.
What is the Median Family Income in Palmas del Mar?
Median Family Income in Palmas del Mar is $84,732.
What is the Median Household income in Palmas del Mar?
Median Household Income in Palmas del Mar is $89,231.
What is Family Income Deficit in Palmas del Mar?
Family Income Deficit in Palmas del Mar is $2,959.
Families that are below poverty line in Palmas del Mar earn $2,959 less on average than the poverty threshold level.
What is Inequality or Gini Index in Palmas del Mar?
Inequality or Gini Index in Palmas del Mar is 0.48.
How Large is the Labor Force in Palmas del Mar?
There are 1,065 People in the Labor Forcein in Palmas del Mar.
What is the Percentage of People in the Labor Force in Palmas del Mar?
47.2% of People are in the Labor Force in Palmas del Mar.
What is the Unemployment Rate in Palmas del Mar?
Unemployment Rate in Palmas del Mar is 1.1%.