La Dolores, PR
La Dolores Map
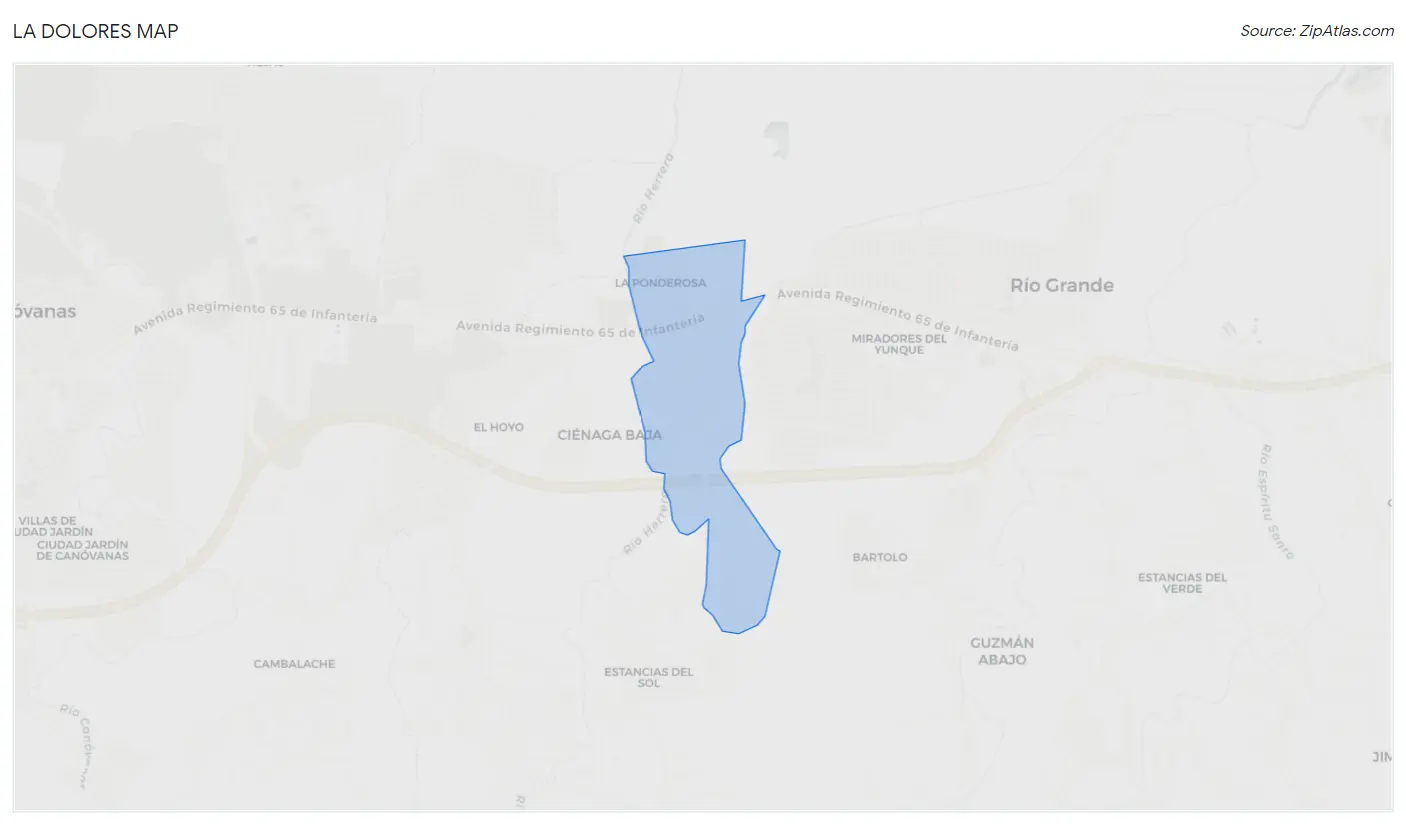
La Dolores Overview
2,861
TOTAL POPULATION
1,469
MALE POPULATION
1,392
FEMALE POPULATION
105.53
MALES / 100 FEMALES
94.76
FEMALES / 100 MALES
49.6
MEDIAN AGE
3.9
AVG FAMILY SIZE
3.1
AVG HOUSEHOLD SIZE
$11,731
PER CAPITA INCOME
$25,547
AVG FAMILY INCOME
$22,704
AVG HOUSEHOLD INCOME
4.7%
WAGE / INCOME GAP [ % ]
95.3¢/ $1
WAGE / INCOME GAP [ $ ]
0.46
INEQUALITY / GINI INDEX
1,305
LABOR FORCE [ PEOPLE ]
50.7%
PERCENT IN LABOR FORCE
23.5%
UNEMPLOYMENT RATE
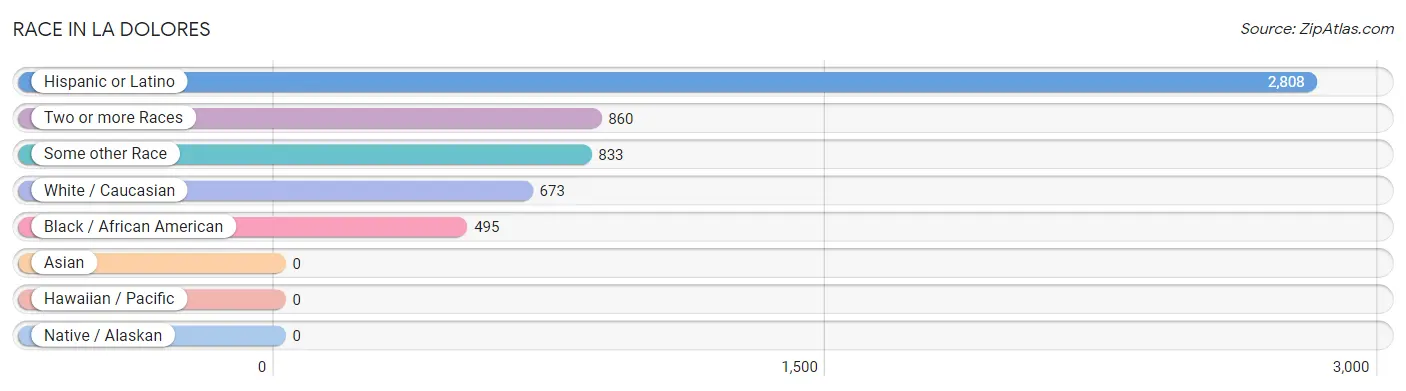
Race in La Dolores
The most populous races in La Dolores are Hispanic or Latino (2,808 | 98.2%), Two or more Races (860 | 30.1%), and Some other Race (833 | 29.1%).
| Race | # Population | % Population |
| Asian | 0 | 0.0% |
| Black / African American | 495 | 17.3% |
| Hawaiian / Pacific | 0 | 0.0% |
| Hispanic or Latino | 2,808 | 98.2% |
| Native / Alaskan | 0 | 0.0% |
| White / Caucasian | 673 | 23.5% |
| Two or more Races | 860 | 30.1% |
| Some other Race | 833 | 29.1% |
| Total | 2,861 | 100.0% |
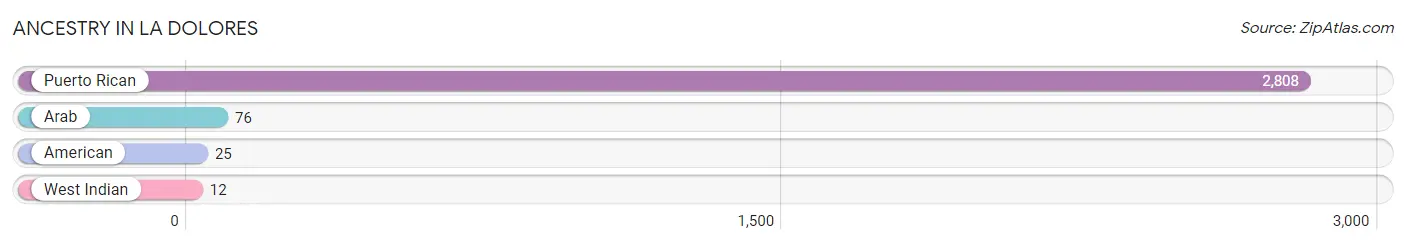
Ancestry in La Dolores
The most populous ancestries reported in La Dolores are Puerto Rican (2,808 | 98.2%), Arab (76 | 2.7%), American (25 | 0.9%), and West Indian (12 | 0.4%), together accounting for 102.1% of all La Dolores residents.
| Ancestry | # Population | % Population |
| American | 25 | 0.9% |
| Arab | 76 | 2.7% |
| Puerto Rican | 2,808 | 98.2% |
| West Indian | 12 | 0.4% | View All 4 Rows |
Immigrants in La Dolores

| Immigration Origin | # Population | % Population | View All 0 Rows |
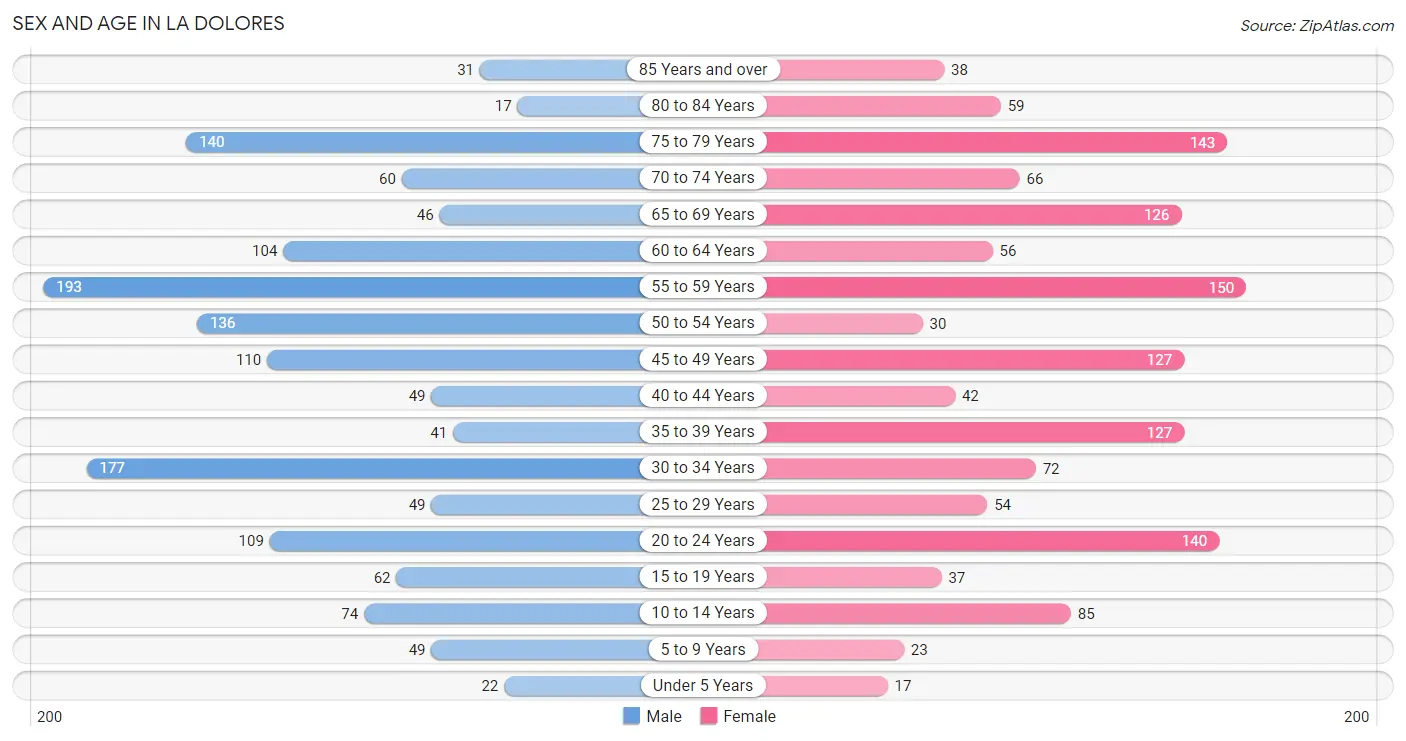
Sex and Age in La Dolores
Sex and Age in La Dolores
The most populous age groups in La Dolores are 55 to 59 Years (193 | 13.1%) for men and 55 to 59 Years (150 | 10.8%) for women.
| Age Bracket | Male | Female |
| Under 5 Years | 22 (1.5%) | 17 (1.2%) |
| 5 to 9 Years | 49 (3.3%) | 23 (1.7%) |
| 10 to 14 Years | 74 (5.0%) | 85 (6.1%) |
| 15 to 19 Years | 62 (4.2%) | 37 (2.7%) |
| 20 to 24 Years | 109 (7.4%) | 140 (10.1%) |
| 25 to 29 Years | 49 (3.3%) | 54 (3.9%) |
| 30 to 34 Years | 177 (12.0%) | 72 (5.2%) |
| 35 to 39 Years | 41 (2.8%) | 127 (9.1%) |
| 40 to 44 Years | 49 (3.3%) | 42 (3.0%) |
| 45 to 49 Years | 110 (7.5%) | 127 (9.1%) |
| 50 to 54 Years | 136 (9.3%) | 30 (2.2%) |
| 55 to 59 Years | 193 (13.1%) | 150 (10.8%) |
| 60 to 64 Years | 104 (7.1%) | 56 (4.0%) |
| 65 to 69 Years | 46 (3.1%) | 126 (9.0%) |
| 70 to 74 Years | 60 (4.1%) | 66 (4.7%) |
| 75 to 79 Years | 140 (9.5%) | 143 (10.3%) |
| 80 to 84 Years | 17 (1.2%) | 59 (4.2%) |
| 85 Years and over | 31 (2.1%) | 38 (2.7%) |
| Total | 1,469 (100.0%) | 1,392 (100.0%) |
Families and Households in La Dolores
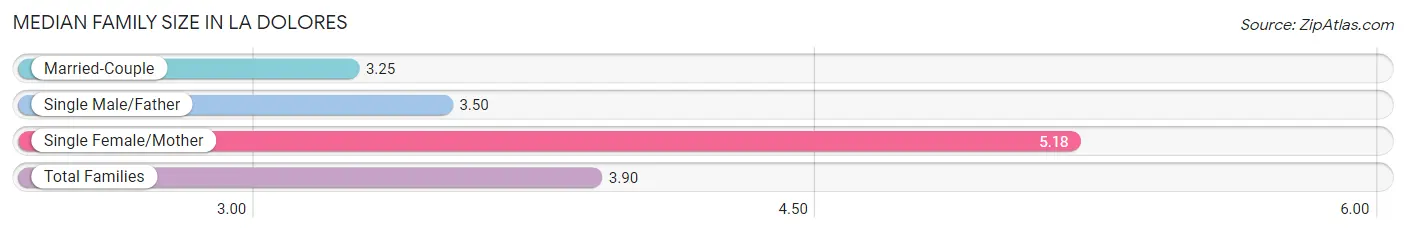
Median Family Size in La Dolores
The median family size in La Dolores is 3.90 persons per family, with single female/mother families (210 | 32.9%) accounting for the largest median family size of 5.18 persons per family. On the other hand, married-couple families (393 | 61.5%) represent the smallest median family size with 3.25 persons per family.
| Family Type | # Families | Family Size |
| Married-Couple | 393 (61.5%) | 3.25 |
| Single Male/Father | 36 (5.6%) | 3.50 |
| Single Female/Mother | 210 (32.9%) | 5.18 |
| Total Families | 639 (100.0%) | 3.90 |
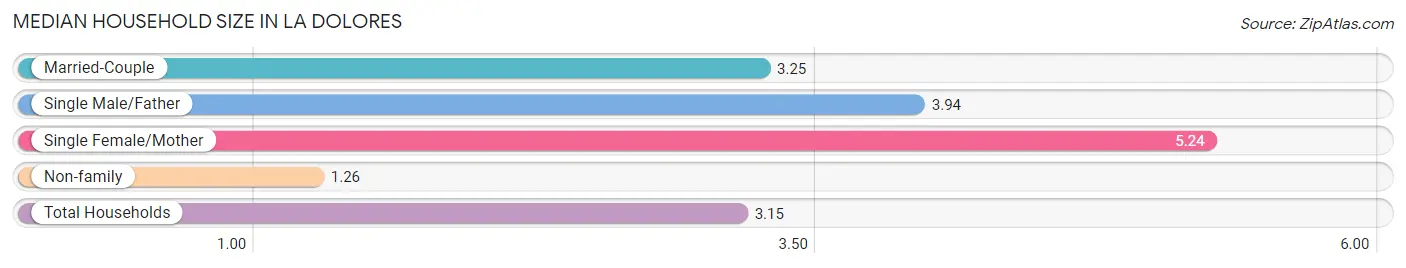
Median Household Size in La Dolores
The median household size in La Dolores is 3.15 persons per household, with single female/mother households (210 | 23.2%) accounting for the largest median household size of 5.24 persons per household. non-family households (265 | 29.3%) represent the smallest median household size with 1.26 persons per household.
| Household Type | # Households | Household Size |
| Married-Couple | 393 (43.5%) | 3.25 |
| Single Male/Father | 36 (4.0%) | 3.94 |
| Single Female/Mother | 210 (23.2%) | 5.24 |
| Non-family | 265 (29.3%) | 1.26 |
| Total Households | 904 (100.0%) | 3.15 |
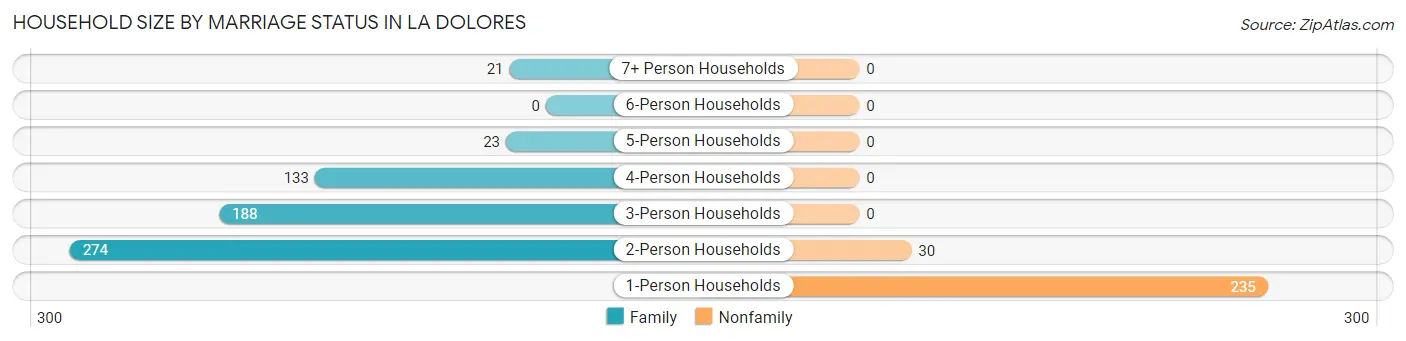
Household Size by Marriage Status in La Dolores
Out of a total of 904 households in La Dolores, 639 (70.7%) are family households, while 265 (29.3%) are nonfamily households. The most numerous type of family households are 2-person households, comprising 274, and the most common type of nonfamily households are 1-person households, comprising 235.
| Household Size | Family Households | Nonfamily Households |
| 1-Person Households | - | 235 (26.0%) |
| 2-Person Households | 274 (30.3%) | 30 (3.3%) |
| 3-Person Households | 188 (20.8%) | 0 (0.0%) |
| 4-Person Households | 133 (14.7%) | 0 (0.0%) |
| 5-Person Households | 23 (2.5%) | 0 (0.0%) |
| 6-Person Households | 0 (0.0%) | 0 (0.0%) |
| 7+ Person Households | 21 (2.3%) | 0 (0.0%) |
| Total | 639 (70.7%) | 265 (29.3%) |
Female Fertility in La Dolores
Fertility by Age in La Dolores
| Age Bracket | Women with Births | Births / 1,000 Women |
| 15 to 19 years | 0 (0.0%) | 0.0 |
| 20 to 34 years | 0 (0.0%) | 0.0 |
| 35 to 50 years | 0 (0.0%) | 0.0 |
| Total | 0 (0.0%) | 0.0 |
Fertility by Age by Marriage Status in La Dolores
| Age Bracket | Married | Unmarried |
| 15 to 19 years | 0 (0.0%) | 0 (0.0%) |
| 20 to 34 years | 0 (0.0%) | 0 (0.0%) |
| 35 to 50 years | 0 (0.0%) | 0 (0.0%) |
| Total | 0 (0.0%) | 0 (0.0%) |
Fertility by Education in La Dolores
| Educational Attainment | Women with Births | Births / 1,000 Women |
| Less than High School | 0 (0.0%) | 0.0 |
| High School Diploma | 0 (0.0%) | 0.0 |
| College or Associate's Degree | 0 (0.0%) | 0.0 |
| Bachelor's Degree | 0 (0.0%) | 0.0 |
| Graduate Degree | 0 (0.0%) | 0.0 |
| Total | 0 (0.0%) | 0.0 |
Fertility by Education by Marriage Status in La Dolores
| Educational Attainment | Married | Unmarried |
| Less than High School | 0 (0.0%) | 0 (0.0%) |
| High School Diploma | 0 (0.0%) | 0 (0.0%) |
| College or Associate's Degree | 0 (0.0%) | 0 (0.0%) |
| Bachelor's Degree | 0 (0.0%) | 0 (0.0%) |
| Graduate Degree | 0 (0.0%) | 0 (0.0%) |
| Total | 0 (0.0%) | 0 (0.0%) |
Income in La Dolores
Income Overview in La Dolores
Per Capita Income in La Dolores is $11,731, while median incomes of families and households are $25,547 and $22,704 respectively.
| Characteristic | Number | Measure |
| Per Capita Income | 2,861 | $11,731 |
| Median Family Income | 639 | $25,547 |
| Mean Family Income | 639 | $35,695 |
| Median Household Income | 904 | $22,704 |
| Mean Household Income | 904 | $30,205 |
| Income Deficit | 639 | $0 |
| Wage / Income Gap (%) | 2,861 | 4.72% |
| Wage / Income Gap ($) | 2,861 | 95.28¢ per $1 |
| Gini / Inequality Index | 2,861 | 0.46 |
Earnings by Sex in La Dolores
Average Earnings in La Dolores are $18,670, $18,304 for men and $19,211 for women, a difference of 4.7%.
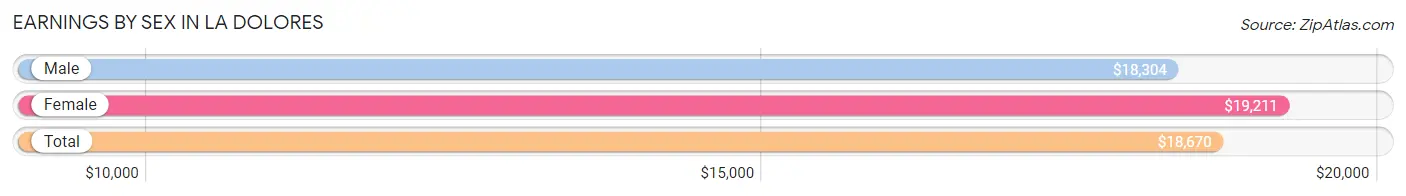
| Sex | Number | Average Earnings |
| Male | 630 (56.2%) | $18,304 |
| Female | 490 (43.8%) | $19,211 |
| Total | 1,120 (100.0%) | $18,670 |
Earnings by Sex by Income Bracket in La Dolores
The most common earnings brackets in La Dolores are $17,500 to $19,999 for men (84 | 13.3%) and $5,000 to $7,499 for women (81 | 16.5%).
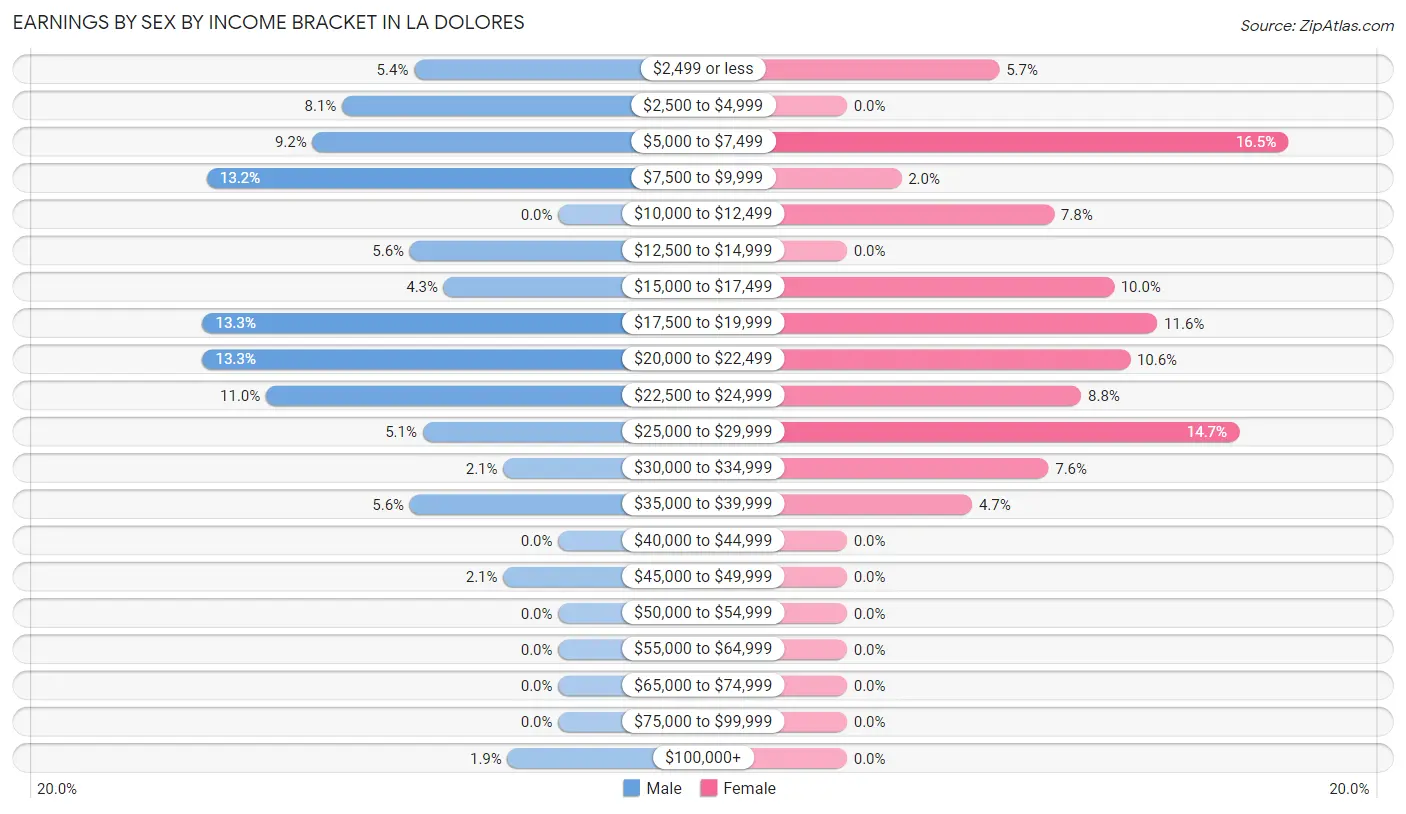
| Income | Male | Female |
| $2,499 or less | 34 (5.4%) | 28 (5.7%) |
| $2,500 to $4,999 | 51 (8.1%) | 0 (0.0%) |
| $5,000 to $7,499 | 58 (9.2%) | 81 (16.5%) |
| $7,500 to $9,999 | 83 (13.2%) | 10 (2.0%) |
| $10,000 to $12,499 | 0 (0.0%) | 38 (7.8%) |
| $12,500 to $14,999 | 35 (5.6%) | 0 (0.0%) |
| $15,000 to $17,499 | 27 (4.3%) | 49 (10.0%) |
| $17,500 to $19,999 | 84 (13.3%) | 57 (11.6%) |
| $20,000 to $22,499 | 84 (13.3%) | 52 (10.6%) |
| $22,500 to $24,999 | 69 (11.0%) | 43 (8.8%) |
| $25,000 to $29,999 | 32 (5.1%) | 72 (14.7%) |
| $30,000 to $34,999 | 13 (2.1%) | 37 (7.5%) |
| $35,000 to $39,999 | 35 (5.6%) | 23 (4.7%) |
| $40,000 to $44,999 | 0 (0.0%) | 0 (0.0%) |
| $45,000 to $49,999 | 13 (2.1%) | 0 (0.0%) |
| $50,000 to $54,999 | 0 (0.0%) | 0 (0.0%) |
| $55,000 to $64,999 | 0 (0.0%) | 0 (0.0%) |
| $65,000 to $74,999 | 0 (0.0%) | 0 (0.0%) |
| $75,000 to $99,999 | 0 (0.0%) | 0 (0.0%) |
| $100,000+ | 12 (1.9%) | 0 (0.0%) |
| Total | 630 (100.0%) | 490 (100.0%) |
Earnings by Sex by Educational Attainment in La Dolores
Average earnings in La Dolores are $19,315 for men and $21,202 for women, a difference of 8.9%. Men with an educational attainment of college or associate's degree enjoy the highest average annual earnings of $23,571, while those with less than high school education earn the least with $15,556. Women with an educational attainment of college or associate's degree earn the most with the average annual earnings of $24,716, while those with bachelor's degree education have the smallest earnings of $19,364.
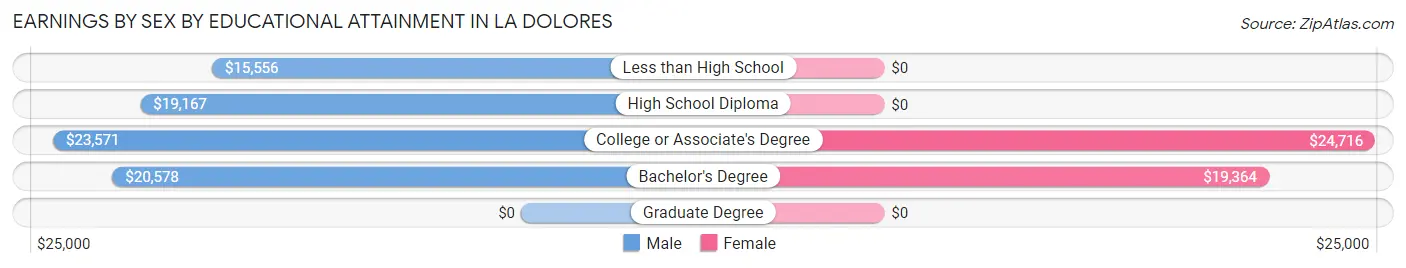
| Educational Attainment | Male Income | Female Income |
| Less than High School | $15,556 | $0 |
| High School Diploma | $19,167 | $0 |
| College or Associate's Degree | $23,571 | $24,716 |
| Bachelor's Degree | $20,578 | $19,364 |
| Graduate Degree | - | - |
| Total | $19,315 | $21,202 |
Family Income in La Dolores
Family Income Brackets in La Dolores
According to the La Dolores family income data, there are 149 families falling into the $35,000 to $49,999 income range, which is the most common income bracket and makes up 23.3% of all families.
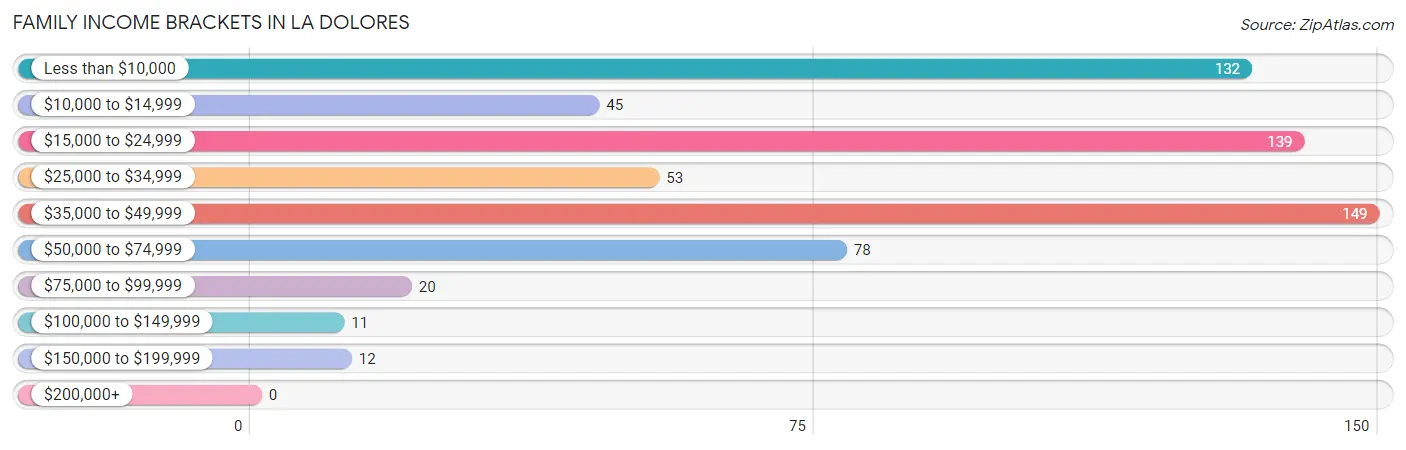
| Income Bracket | # Families | % Families |
| Less than $10,000 | 132 | 20.7% |
| $10,000 to $14,999 | 45 | 7.0% |
| $15,000 to $24,999 | 139 | 21.8% |
| $25,000 to $34,999 | 53 | 8.3% |
| $35,000 to $49,999 | 149 | 23.3% |
| $50,000 to $74,999 | 78 | 12.2% |
| $75,000 to $99,999 | 20 | 3.1% |
| $100,000 to $149,999 | 11 | 1.7% |
| $150,000 to $199,999 | 12 | 1.9% |
| $200,000+ | 0 | 0.0% |
Family Income by Famaliy Size in La Dolores
4-person families (148 | 23.2%) account for the highest median family income in La Dolores with $40,521 per family, while 3-person families (173 | 27.1%) have the highest median income of $11,637 per family member.
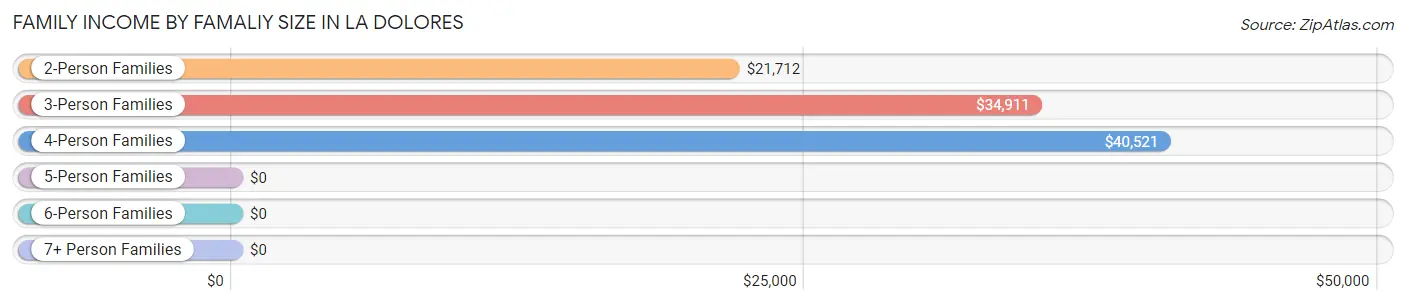
| Income Bracket | # Families | Median Income |
| 2-Person Families | 289 (45.2%) | $21,712 |
| 3-Person Families | 173 (27.1%) | $34,911 |
| 4-Person Families | 148 (23.2%) | $40,521 |
| 5-Person Families | 8 (1.3%) | $0 |
| 6-Person Families | 0 (0.0%) | $0 |
| 7+ Person Families | 21 (3.3%) | $0 |
| Total | 639 (100.0%) | $25,547 |
Family Income by Number of Earners in La Dolores
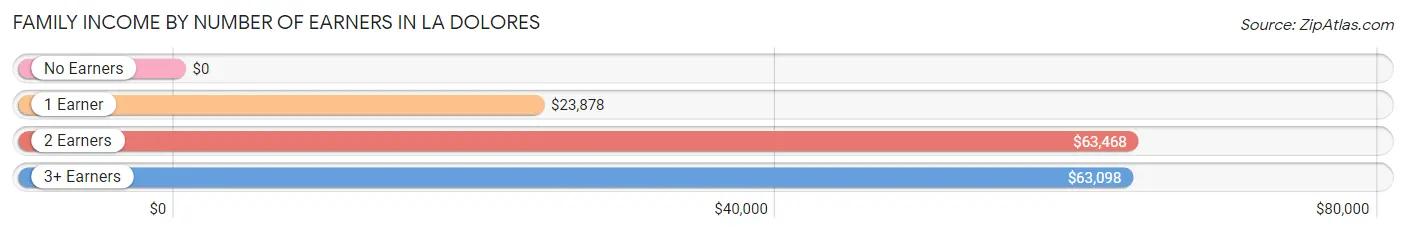
| Number of Earners | # Families | Median Income |
| No Earners | 202 (31.6%) | $0 |
| 1 Earner | 268 (41.9%) | $23,878 |
| 2 Earners | 102 (16.0%) | $63,468 |
| 3+ Earners | 67 (10.5%) | $63,098 |
| Total | 639 (100.0%) | $25,547 |
Household Income in La Dolores
Household Income Brackets in La Dolores
With 244 households falling in the category, the less than $10,000 income range is the most frequent in La Dolores, accounting for 27.0% of all households.
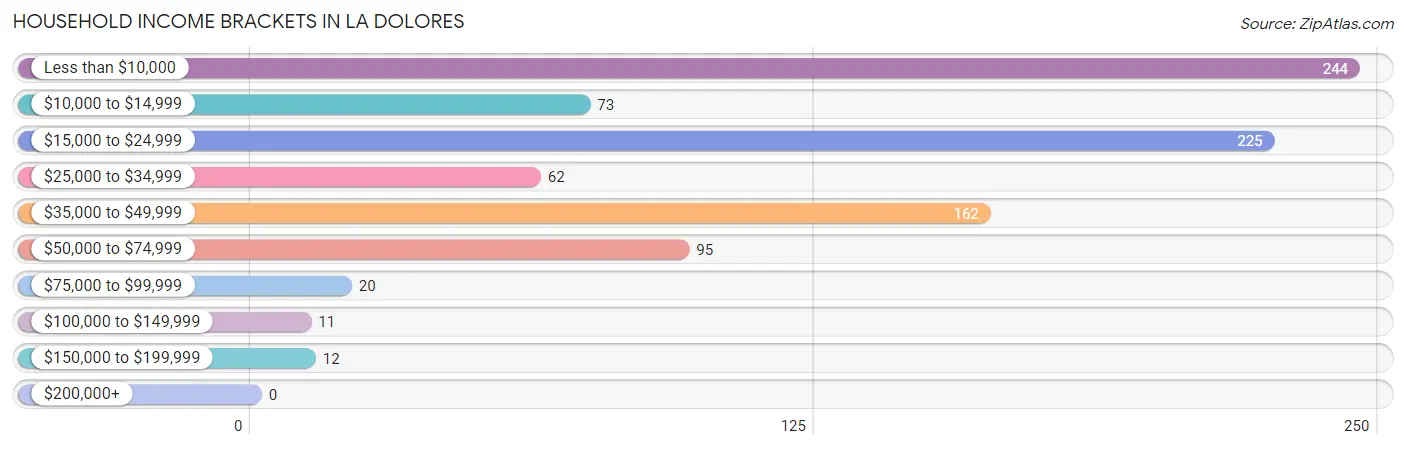
| Income Bracket | # Households | % Households |
| Less than $10,000 | 244 | 27.0% |
| $10,000 to $14,999 | 73 | 8.1% |
| $15,000 to $24,999 | 225 | 24.9% |
| $25,000 to $34,999 | 62 | 6.9% |
| $35,000 to $49,999 | 162 | 17.9% |
| $50,000 to $74,999 | 95 | 10.5% |
| $75,000 to $99,999 | 20 | 2.2% |
| $100,000 to $149,999 | 11 | 1.2% |
| $150,000 to $199,999 | 12 | 1.3% |
| $200,000+ | 0 | 0.0% |
Household Income by Householder Age in La Dolores
The median household income in La Dolores is $22,704, with the highest median household income of $24,159 found in the 45 to 64 years age bracket for the primary householder. A total of 347 households (38.4%) fall into this category. Meanwhile, the 15 to 24 years age bracket for the primary householder has the lowest median household income of $0, with 4 households (0.4%) in this group.
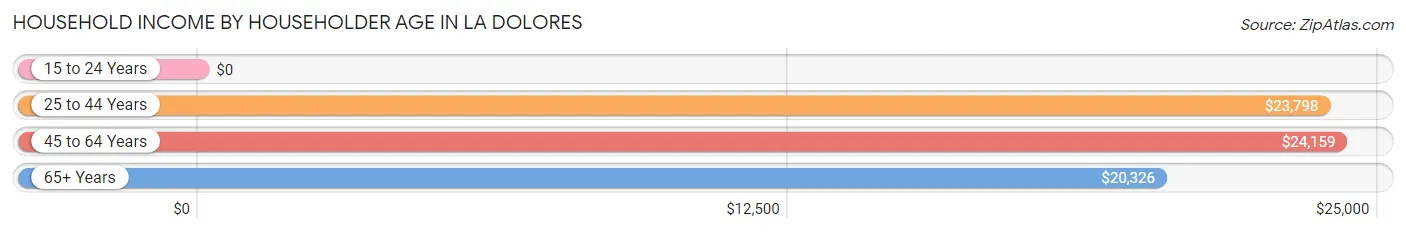
| Income Bracket | # Households | Median Income |
| 15 to 24 Years | 4 (0.4%) | $0 |
| 25 to 44 Years | 145 (16.0%) | $23,798 |
| 45 to 64 Years | 347 (38.4%) | $24,159 |
| 65+ Years | 408 (45.1%) | $20,326 |
| Total | 904 (100.0%) | $22,704 |
Poverty in La Dolores
Income Below Poverty by Sex and Age in La Dolores
With 35.4% poverty level for males and 52.1% for females among the residents of La Dolores, under 5 year old males and under 5 year old females are the most vulnerable to poverty, with 22 males (100.0%) and 17 females (100.0%) in their respective age groups living below the poverty level.
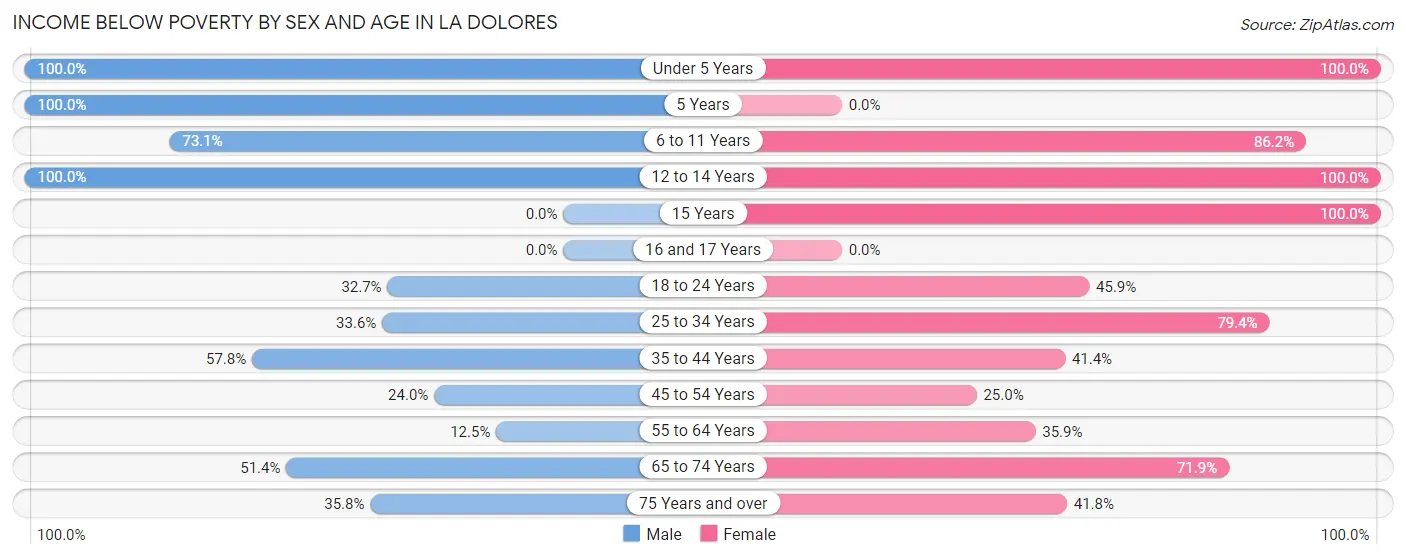
| Age Bracket | Male | Female |
| Under 5 Years | 22 (100.0%) | 17 (100.0%) |
| 5 Years | 13 (100.0%) | 0 (0.0%) |
| 6 to 11 Years | 49 (73.1%) | 81 (86.2%) |
| 12 to 14 Years | 43 (100.0%) | 14 (100.0%) |
| 15 Years | 0 (0.0%) | 18 (100.0%) |
| 16 and 17 Years | 0 (0.0%) | 0 (0.0%) |
| 18 to 24 Years | 48 (32.7%) | 73 (45.9%) |
| 25 to 34 Years | 76 (33.6%) | 100 (79.4%) |
| 35 to 44 Years | 52 (57.8%) | 70 (41.4%) |
| 45 to 54 Years | 59 (24.0%) | 39 (25.0%) |
| 55 to 64 Years | 37 (12.5%) | 74 (35.9%) |
| 65 to 74 Years | 54 (51.4%) | 138 (71.9%) |
| 75 Years and over | 67 (35.8%) | 99 (41.8%) |
| Total | 520 (35.4%) | 723 (52.1%) |
Income Above Poverty by Sex and Age in La Dolores
According to the poverty statistics in La Dolores, males aged 16 and 17 years and females aged 45 to 54 years are the age groups that are most secure financially, with 100.0% of males and 75.0% of females in these age groups living above the poverty line.
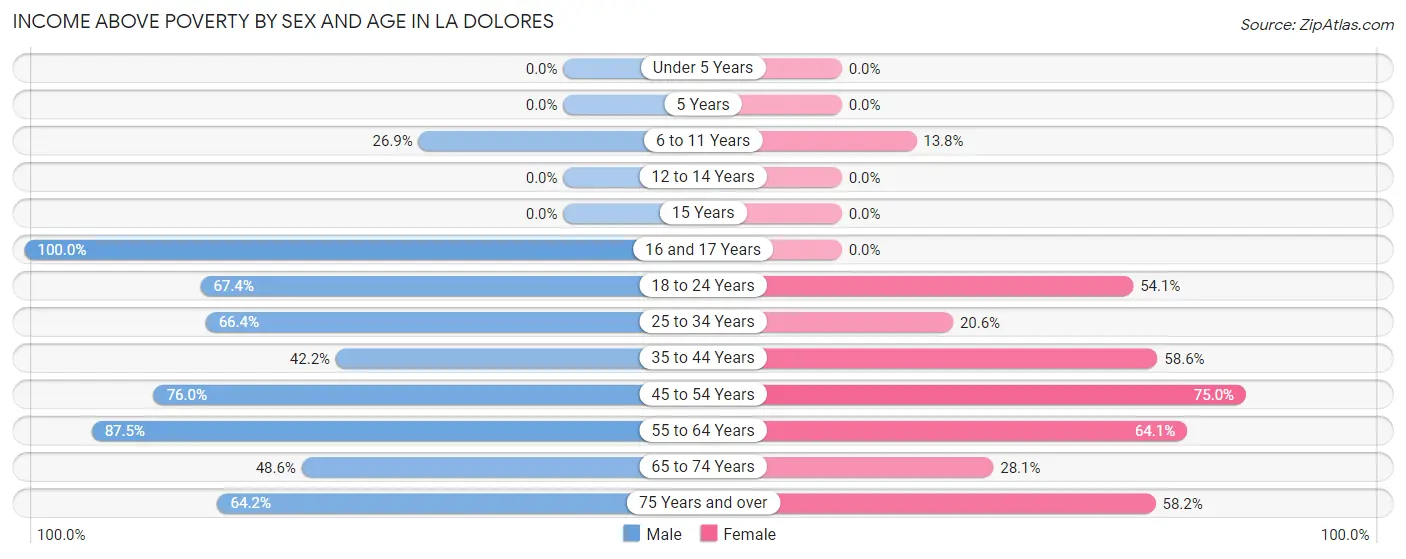
| Age Bracket | Male | Female |
| Under 5 Years | 0 (0.0%) | 0 (0.0%) |
| 5 Years | 0 (0.0%) | 0 (0.0%) |
| 6 to 11 Years | 18 (26.9%) | 13 (13.8%) |
| 12 to 14 Years | 0 (0.0%) | 0 (0.0%) |
| 15 Years | 0 (0.0%) | 0 (0.0%) |
| 16 and 17 Years | 24 (100.0%) | 0 (0.0%) |
| 18 to 24 Years | 99 (67.3%) | 86 (54.1%) |
| 25 to 34 Years | 150 (66.4%) | 26 (20.6%) |
| 35 to 44 Years | 38 (42.2%) | 99 (58.6%) |
| 45 to 54 Years | 187 (76.0%) | 117 (75.0%) |
| 55 to 64 Years | 260 (87.5%) | 132 (64.1%) |
| 65 to 74 Years | 51 (48.6%) | 54 (28.1%) |
| 75 Years and over | 120 (64.2%) | 138 (58.2%) |
| Total | 947 (64.5%) | 665 (47.9%) |
Income Below Poverty Among Married-Couple Families in La Dolores
The poverty statistics for married-couple families in La Dolores show that 27.7% or 109 of the total 393 families live below the poverty line. Families with no children have the highest poverty rate of 28.0%, comprising of 98 families. On the other hand, families with 1 or 2 children have the lowest poverty rate of 25.6%, which includes 11 families.
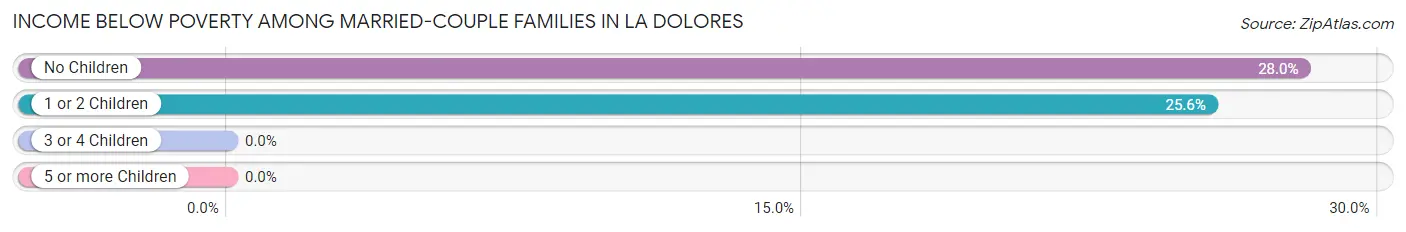
| Children | Above Poverty | Below Poverty |
| No Children | 252 (72.0%) | 98 (28.0%) |
| 1 or 2 Children | 32 (74.4%) | 11 (25.6%) |
| 3 or 4 Children | 0 (0.0%) | 0 (0.0%) |
| 5 or more Children | 0 (0.0%) | 0 (0.0%) |
| Total | 284 (72.3%) | 109 (27.7%) |
Income Below Poverty Among Single-Parent Households in La Dolores
According to the poverty data in La Dolores, 52.8% or 19 single-father households and 60.0% or 126 single-mother households are living below the poverty line. Among single-father households, those with 1 or 2 children have the highest poverty rate, with 15 households (100.0%) experiencing poverty. Likewise, among single-mother households, those with 1 or 2 children have the highest poverty rate, with 76 households (100.0%) falling below the poverty line.
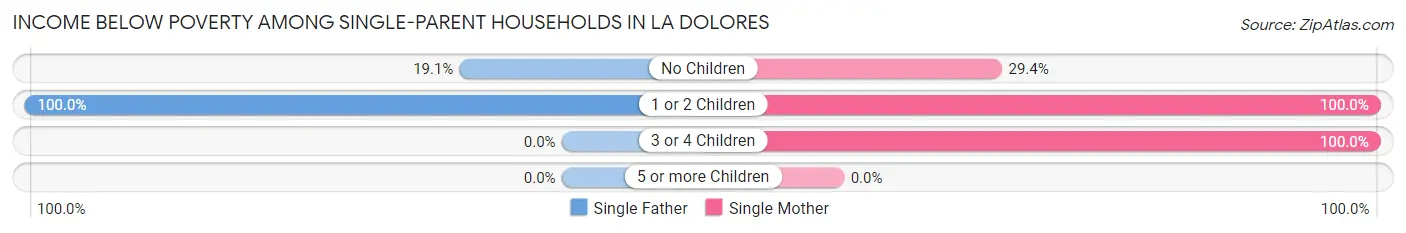
| Children | Single Father | Single Mother |
| No Children | 4 (19.1%) | 35 (29.4%) |
| 1 or 2 Children | 15 (100.0%) | 76 (100.0%) |
| 3 or 4 Children | 0 (0.0%) | 15 (100.0%) |
| 5 or more Children | 0 (0.0%) | 0 (0.0%) |
| Total | 19 (52.8%) | 126 (60.0%) |
Income Below Poverty Among Married-Couple vs Single-Parent Households in La Dolores
The poverty data for La Dolores shows that 109 of the married-couple family households (27.7%) and 145 of the single-parent households (58.9%) are living below the poverty level. Within the married-couple family households, those with no children have the highest poverty rate, with 98 households (28.0%) falling below the poverty line. Among the single-parent households, those with 1 or 2 children have the highest poverty rate, with 91 household (100.0%) living below poverty.
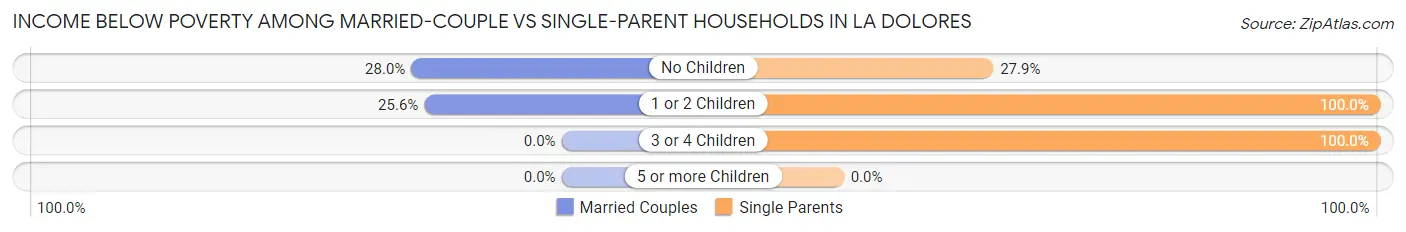
| Children | Married-Couple Families | Single-Parent Households |
| No Children | 98 (28.0%) | 39 (27.9%) |
| 1 or 2 Children | 11 (25.6%) | 91 (100.0%) |
| 3 or 4 Children | 0 (0.0%) | 15 (100.0%) |
| 5 or more Children | 0 (0.0%) | 0 (0.0%) |
| Total | 109 (27.7%) | 145 (58.9%) |
Employment Characteristics in La Dolores
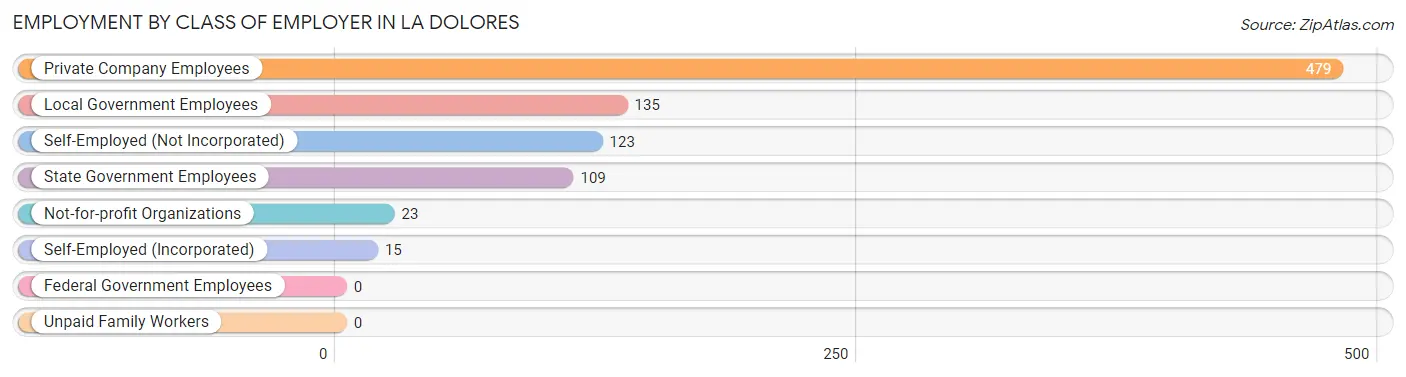
Employment by Class of Employer in La Dolores
Among the 884 employed individuals in La Dolores, private company employees (479 | 54.2%), local government employees (135 | 15.3%), and self-employed (not incorporated) (123 | 13.9%) make up the most common classes of employment.
| Employer Class | # Employees | % Employees |
| Private Company Employees | 479 | 54.2% |
| Self-Employed (Incorporated) | 15 | 1.7% |
| Self-Employed (Not Incorporated) | 123 | 13.9% |
| Not-for-profit Organizations | 23 | 2.6% |
| Local Government Employees | 135 | 15.3% |
| State Government Employees | 109 | 12.3% |
| Federal Government Employees | 0 | 0.0% |
| Unpaid Family Workers | 0 | 0.0% |
| Total | 884 | 100.0% |
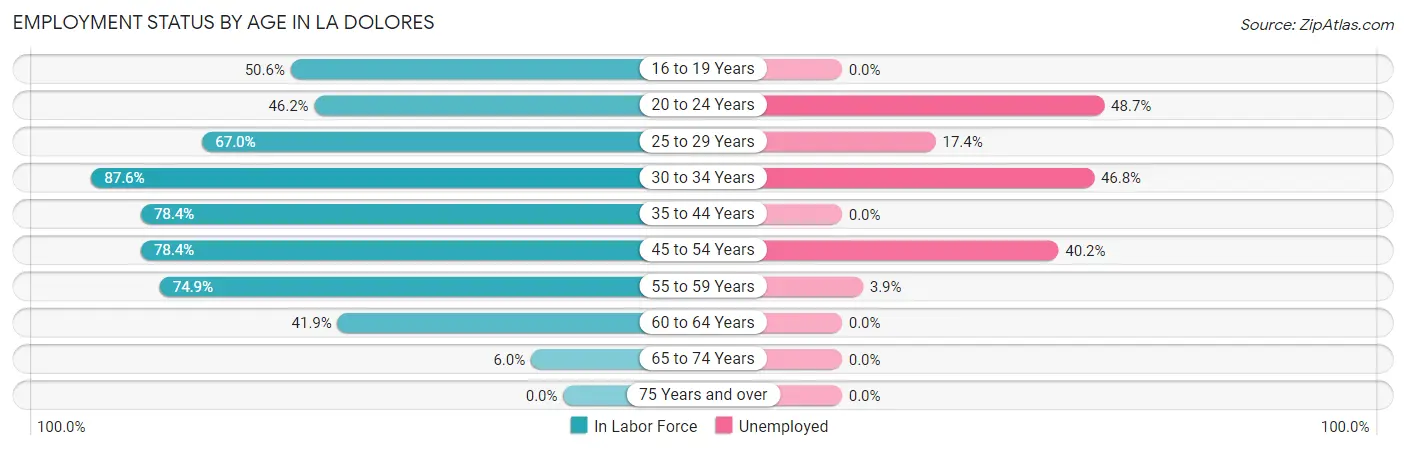
Employment Status by Age in La Dolores
According to the labor force statistics for La Dolores, out of the total population over 16 years of age (2,573), 50.7% or 1,305 individuals are in the labor force, with 23.5% or 307 of them unemployed. The age group with the highest labor force participation rate is 30 to 34 years, with 87.6% or 218 individuals in the labor force. Within the labor force, the 20 to 24 years age range has the highest percentage of unemployed individuals, with 48.7% or 56 of them being unemployed.
| Age Bracket | In Labor Force | Unemployed |
| 16 to 19 Years | 41 (50.6%) | 0 (0.0%) |
| 20 to 24 Years | 115 (46.2%) | 56 (48.7%) |
| 25 to 29 Years | 69 (67.0%) | 12 (17.4%) |
| 30 to 34 Years | 218 (87.6%) | 102 (46.8%) |
| 35 to 44 Years | 203 (78.4%) | 0 (0.0%) |
| 45 to 54 Years | 316 (78.4%) | 127 (40.2%) |
| 55 to 59 Years | 257 (74.9%) | 10 (3.9%) |
| 60 to 64 Years | 67 (41.9%) | 0 (0.0%) |
| 65 to 74 Years | 18 (6.0%) | 0 (0.0%) |
| 75 Years and over | 0 (0.0%) | 0 (0.0%) |
| Total | 1,305 (50.7%) | 307 (23.5%) |
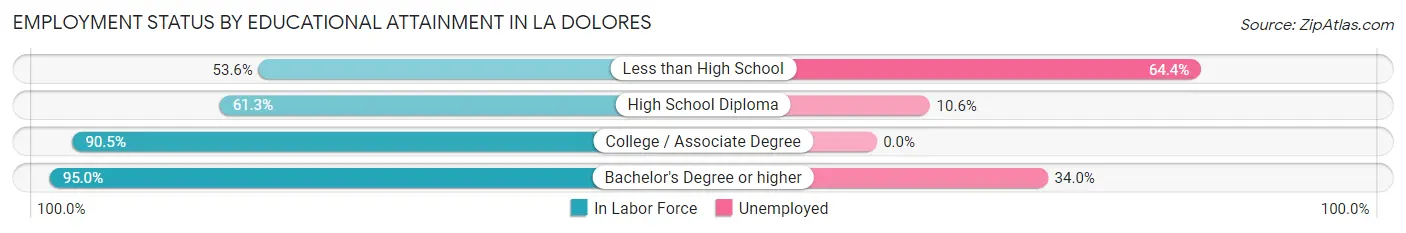
Employment Status by Educational Attainment in La Dolores
According to labor force statistics for La Dolores, 74.5% of individuals (1,130) out of the total population between 25 and 64 years of age (1,517) are in the labor force, with 22.2% or 251 of them being unemployed. The group with the highest labor force participation rate are those with the educational attainment of bachelor's degree or higher, with 95.0% or 397 individuals in the labor force. Within the labor force, individuals with less than high school education have the highest percentage of unemployment, with 64.4% or 76 of them being unemployed.
| Educational Attainment | In Labor Force | Unemployed |
| Less than High School | 118 (53.6%) | 142 (64.4%) |
| High School Diploma | 378 (61.3%) | 65 (10.6%) |
| College / Associate Degree | 237 (90.5%) | 0 (0.0%) |
| Bachelor's Degree or higher | 397 (95.0%) | 142 (34.0%) |
| Total | 1,130 (74.5%) | 337 (22.2%) |
Employment Occupations by Sex in La Dolores
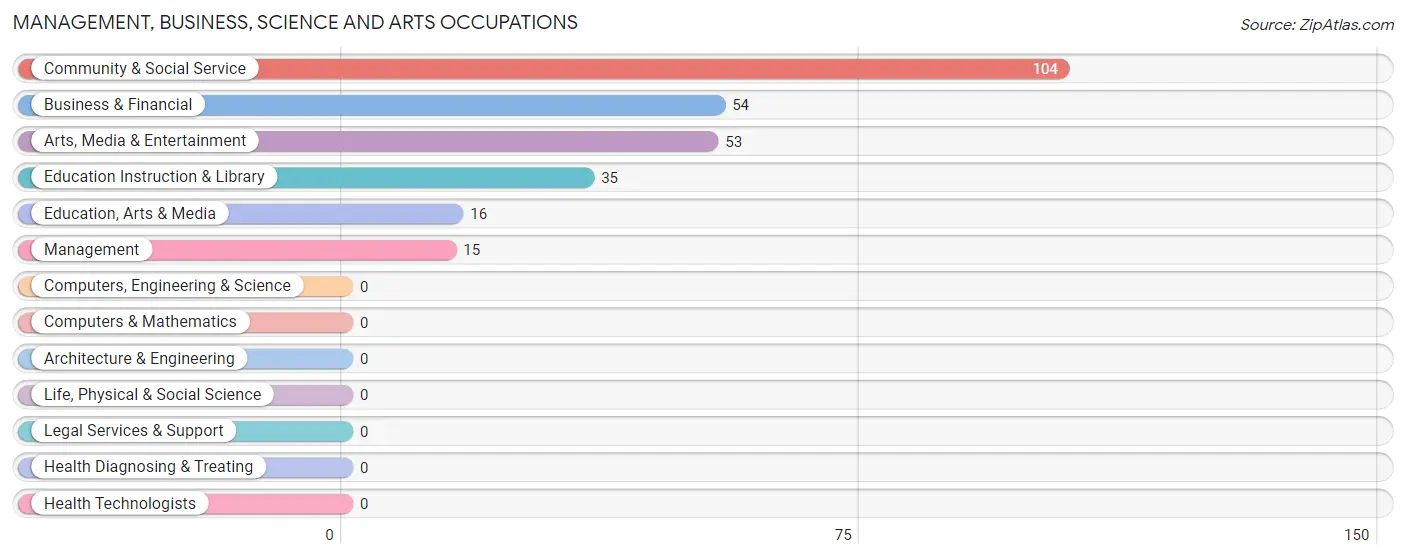
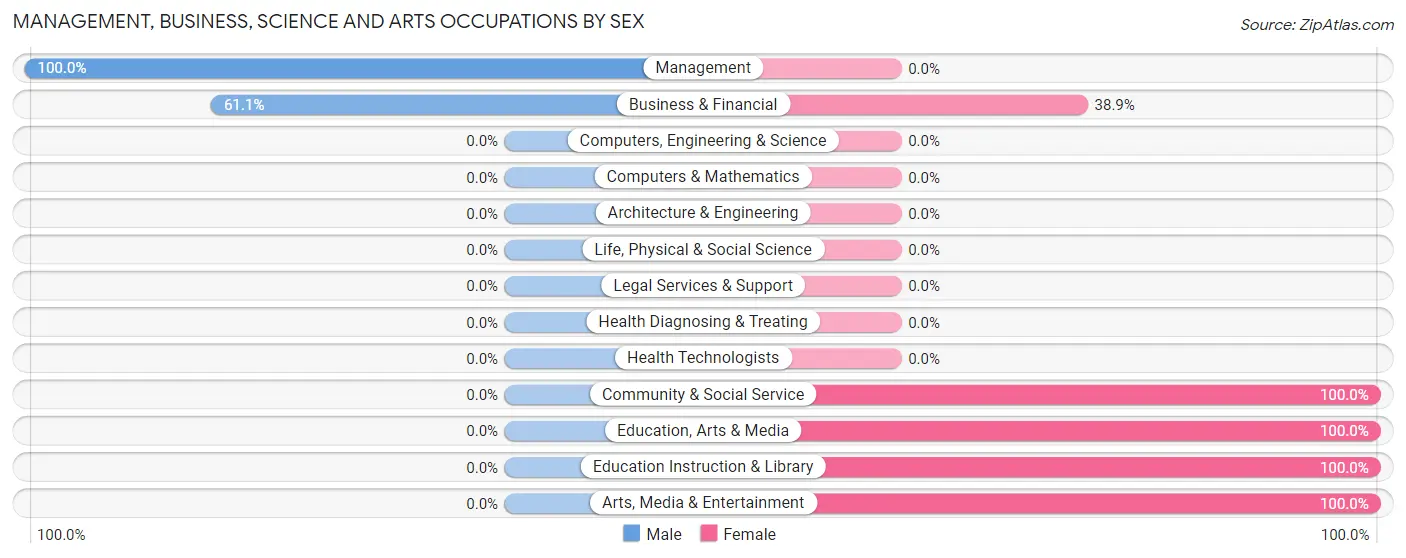
Management, Business, Science and Arts Occupations
The most common Management, Business, Science and Arts occupations in La Dolores are Community & Social Service (104 | 10.4%), Business & Financial (54 | 5.4%), Arts, Media & Entertainment (53 | 5.3%), Education Instruction & Library (35 | 3.5%), and Education, Arts & Media (16 | 1.6%).
Management, Business, Science and Arts Occupations by Sex
Within the Management, Business, Science and Arts occupations in La Dolores, the most male-oriented occupations are Management (100.0%), and Business & Financial (61.1%), while the most female-oriented occupations are Community & Social Service (100.0%), Education, Arts & Media (100.0%), and Education Instruction & Library (100.0%).
| Occupation | Male | Female |
| Management | 15 (100.0%) | 0 (0.0%) |
| Business & Financial | 33 (61.1%) | 21 (38.9%) |
| Computers, Engineering & Science | 0 (0.0%) | 0 (0.0%) |
| Computers & Mathematics | 0 (0.0%) | 0 (0.0%) |
| Architecture & Engineering | 0 (0.0%) | 0 (0.0%) |
| Life, Physical & Social Science | 0 (0.0%) | 0 (0.0%) |
| Community & Social Service | 0 (0.0%) | 104 (100.0%) |
| Education, Arts & Media | 0 (0.0%) | 16 (100.0%) |
| Legal Services & Support | 0 (0.0%) | 0 (0.0%) |
| Education Instruction & Library | 0 (0.0%) | 35 (100.0%) |
| Arts, Media & Entertainment | 0 (0.0%) | 53 (100.0%) |
| Health Diagnosing & Treating | 0 (0.0%) | 0 (0.0%) |
| Health Technologists | 0 (0.0%) | 0 (0.0%) |
| Total (Category) | 48 (27.8%) | 125 (72.3%) |
| Total (Overall) | 549 (55.1%) | 448 (44.9%) |
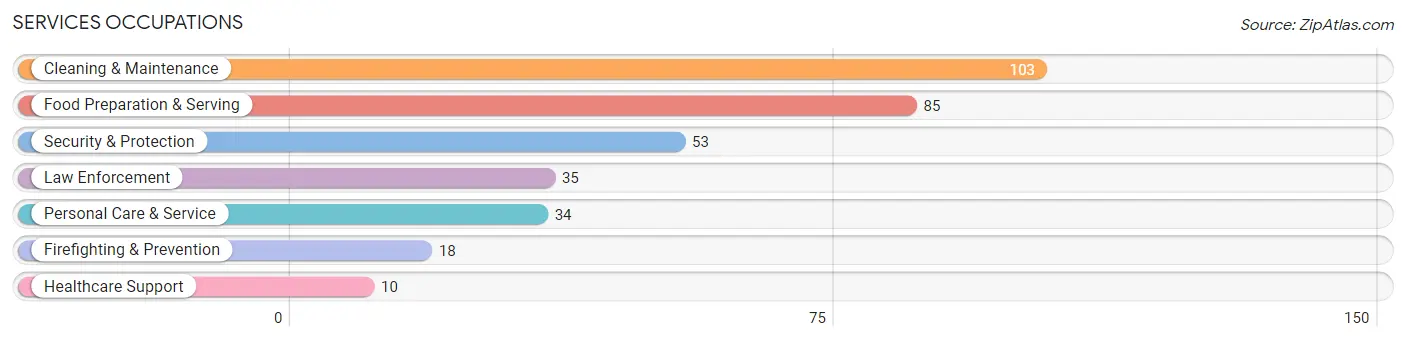
Services Occupations
The most common Services occupations in La Dolores are Cleaning & Maintenance (103 | 10.3%), Food Preparation & Serving (85 | 8.5%), Security & Protection (53 | 5.3%), Law Enforcement (35 | 3.5%), and Personal Care & Service (34 | 3.4%).
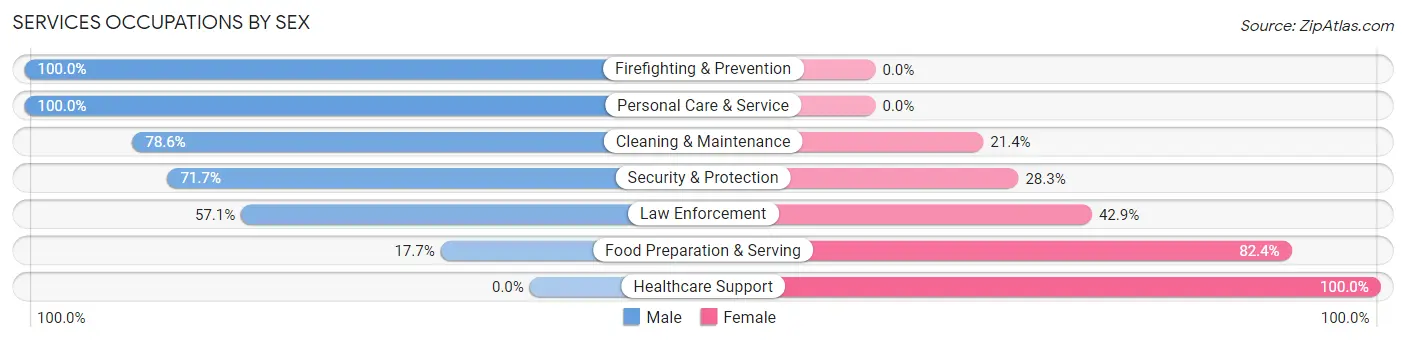
Services Occupations by Sex
Within the Services occupations in La Dolores, the most male-oriented occupations are Firefighting & Prevention (100.0%), Personal Care & Service (100.0%), and Cleaning & Maintenance (78.6%), while the most female-oriented occupations are Healthcare Support (100.0%), Food Preparation & Serving (82.4%), and Law Enforcement (42.9%).
| Occupation | Male | Female |
| Healthcare Support | 0 (0.0%) | 10 (100.0%) |
| Security & Protection | 38 (71.7%) | 15 (28.3%) |
| Firefighting & Prevention | 18 (100.0%) | 0 (0.0%) |
| Law Enforcement | 20 (57.1%) | 15 (42.9%) |
| Food Preparation & Serving | 15 (17.6%) | 70 (82.4%) |
| Cleaning & Maintenance | 81 (78.6%) | 22 (21.4%) |
| Personal Care & Service | 34 (100.0%) | 0 (0.0%) |
| Total (Category) | 168 (59.0%) | 117 (41.0%) |
| Total (Overall) | 549 (55.1%) | 448 (44.9%) |
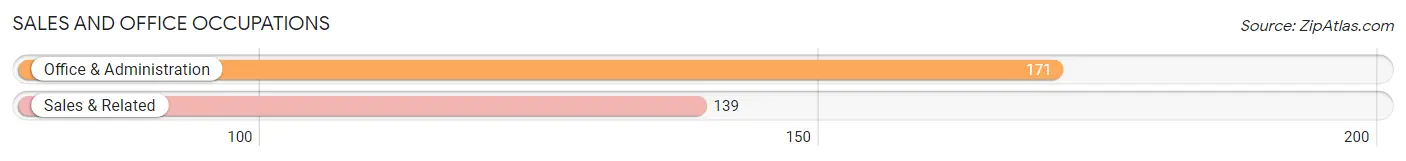
Sales and Office Occupations
The most common Sales and Office occupations in La Dolores are Office & Administration (171 | 17.2%), and Sales & Related (139 | 13.9%).
Sales and Office Occupations by Sex
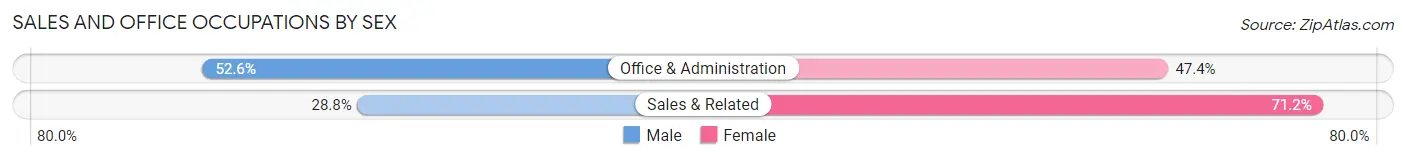
| Occupation | Male | Female |
| Sales & Related | 40 (28.8%) | 99 (71.2%) |
| Office & Administration | 90 (52.6%) | 81 (47.4%) |
| Total (Category) | 130 (41.9%) | 180 (58.1%) |
| Total (Overall) | 549 (55.1%) | 448 (44.9%) |
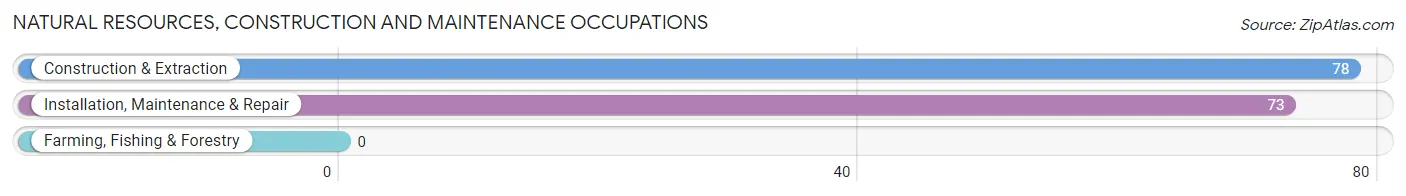
Natural Resources, Construction and Maintenance Occupations
The most common Natural Resources, Construction and Maintenance occupations in La Dolores are Construction & Extraction (78 | 7.8%), and Installation, Maintenance & Repair (73 | 7.3%).
Natural Resources, Construction and Maintenance Occupations by Sex
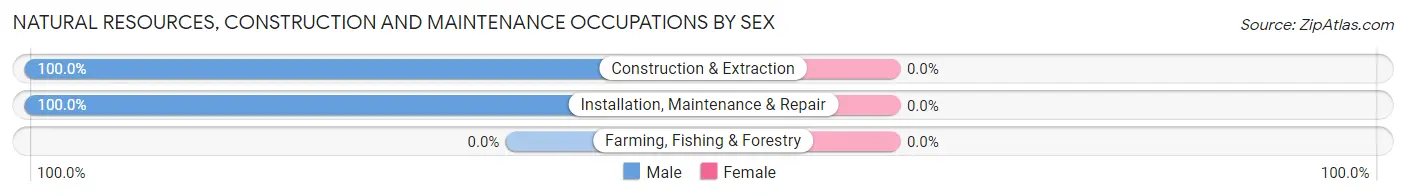
| Occupation | Male | Female |
| Farming, Fishing & Forestry | 0 (0.0%) | 0 (0.0%) |
| Construction & Extraction | 78 (100.0%) | 0 (0.0%) |
| Installation, Maintenance & Repair | 73 (100.0%) | 0 (0.0%) |
| Total (Category) | 151 (100.0%) | 0 (0.0%) |
| Total (Overall) | 549 (55.1%) | 448 (44.9%) |
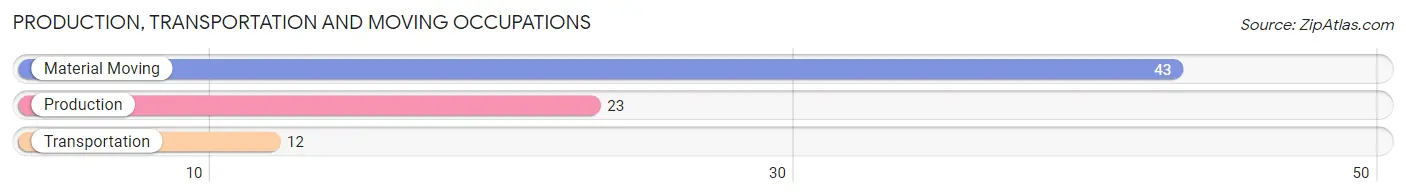
Production, Transportation and Moving Occupations
The most common Production, Transportation and Moving occupations in La Dolores are Material Moving (43 | 4.3%), Production (23 | 2.3%), and Transportation (12 | 1.2%).
Production, Transportation and Moving Occupations by Sex
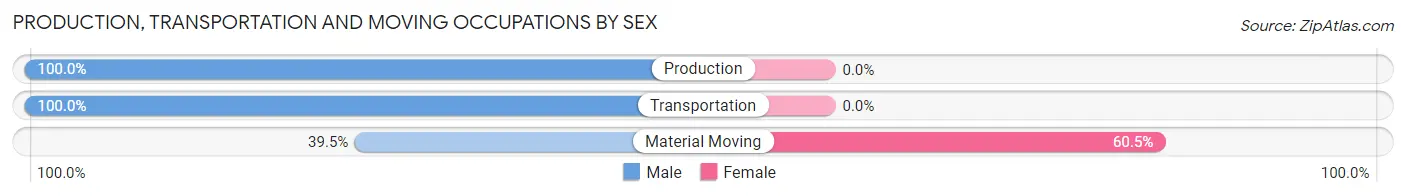
| Occupation | Male | Female |
| Production | 23 (100.0%) | 0 (0.0%) |
| Transportation | 12 (100.0%) | 0 (0.0%) |
| Material Moving | 17 (39.5%) | 26 (60.5%) |
| Total (Category) | 52 (66.7%) | 26 (33.3%) |
| Total (Overall) | 549 (55.1%) | 448 (44.9%) |
Employment Industries by Sex in La Dolores
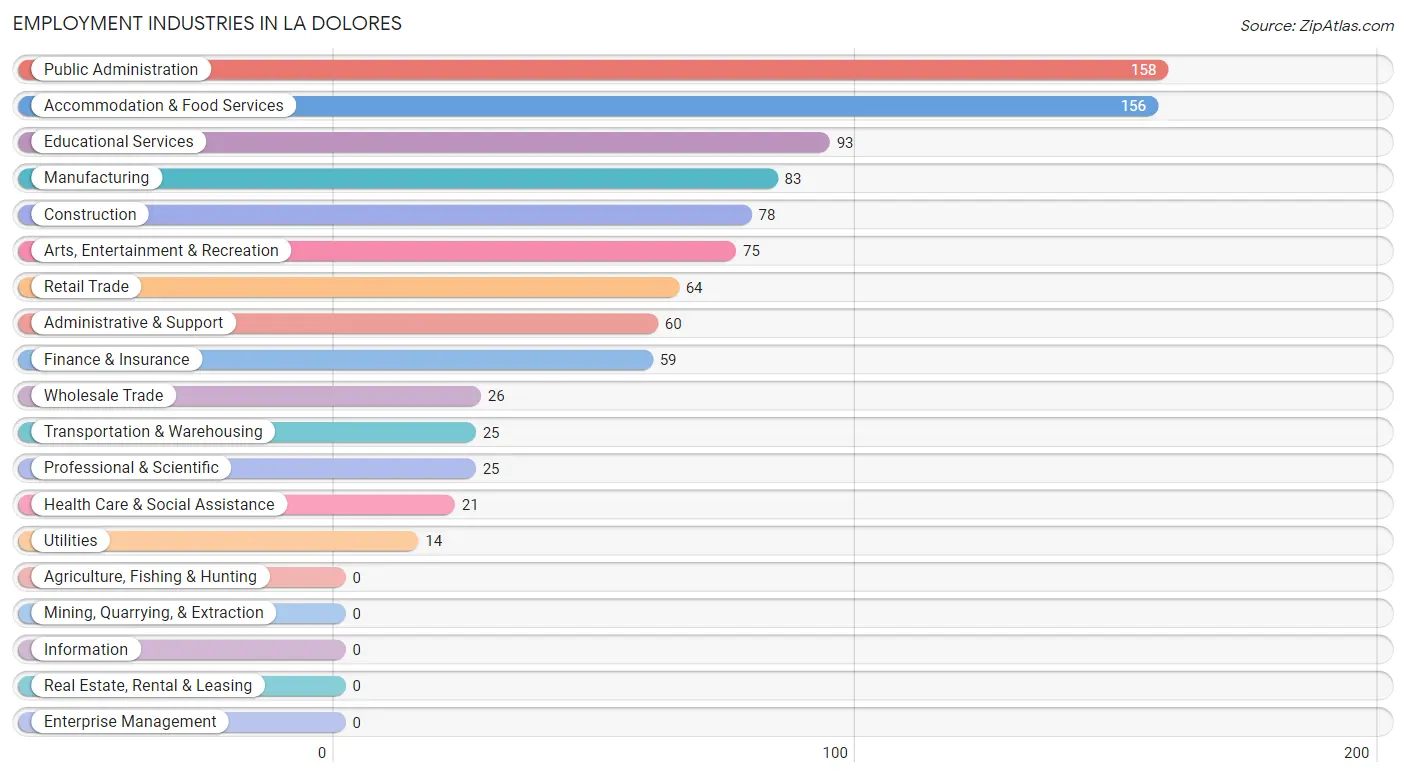
Employment Industries in La Dolores
The major employment industries in La Dolores include Public Administration (158 | 15.9%), Accommodation & Food Services (156 | 15.7%), Educational Services (93 | 9.3%), Manufacturing (83 | 8.3%), and Construction (78 | 7.8%).
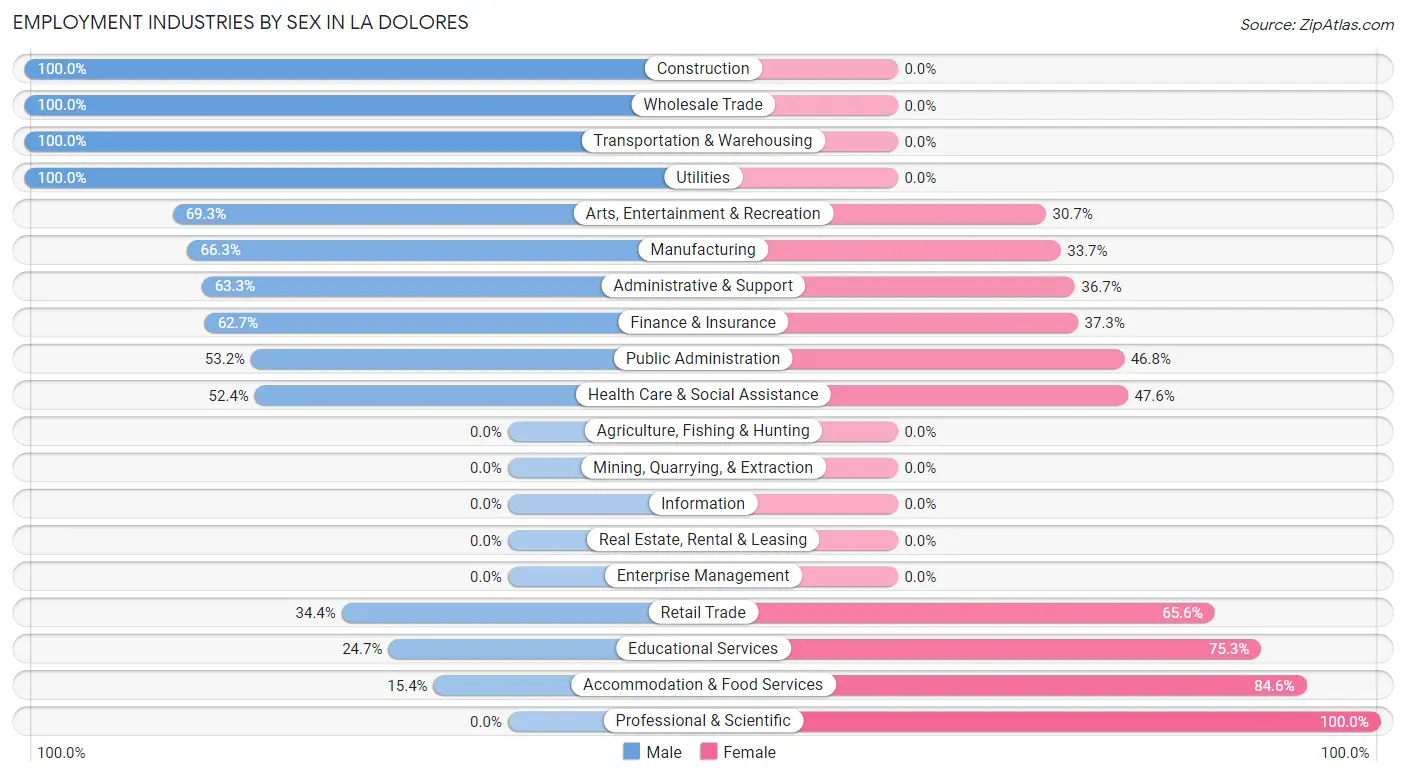
Employment Industries by Sex in La Dolores
The La Dolores industries that see more men than women are Construction (100.0%), Wholesale Trade (100.0%), and Transportation & Warehousing (100.0%), whereas the industries that tend to have a higher number of women are Professional & Scientific (100.0%), Accommodation & Food Services (84.6%), and Educational Services (75.3%).
| Industry | Male | Female |
| Agriculture, Fishing & Hunting | 0 (0.0%) | 0 (0.0%) |
| Mining, Quarrying, & Extraction | 0 (0.0%) | 0 (0.0%) |
| Construction | 78 (100.0%) | 0 (0.0%) |
| Manufacturing | 55 (66.3%) | 28 (33.7%) |
| Wholesale Trade | 26 (100.0%) | 0 (0.0%) |
| Retail Trade | 22 (34.4%) | 42 (65.6%) |
| Transportation & Warehousing | 25 (100.0%) | 0 (0.0%) |
| Utilities | 14 (100.0%) | 0 (0.0%) |
| Information | 0 (0.0%) | 0 (0.0%) |
| Finance & Insurance | 37 (62.7%) | 22 (37.3%) |
| Real Estate, Rental & Leasing | 0 (0.0%) | 0 (0.0%) |
| Professional & Scientific | 0 (0.0%) | 25 (100.0%) |
| Enterprise Management | 0 (0.0%) | 0 (0.0%) |
| Administrative & Support | 38 (63.3%) | 22 (36.7%) |
| Educational Services | 23 (24.7%) | 70 (75.3%) |
| Health Care & Social Assistance | 11 (52.4%) | 10 (47.6%) |
| Arts, Entertainment & Recreation | 52 (69.3%) | 23 (30.7%) |
| Accommodation & Food Services | 24 (15.4%) | 132 (84.6%) |
| Public Administration | 84 (53.2%) | 74 (46.8%) |
| Total | 549 (55.1%) | 448 (44.9%) |
Education in La Dolores
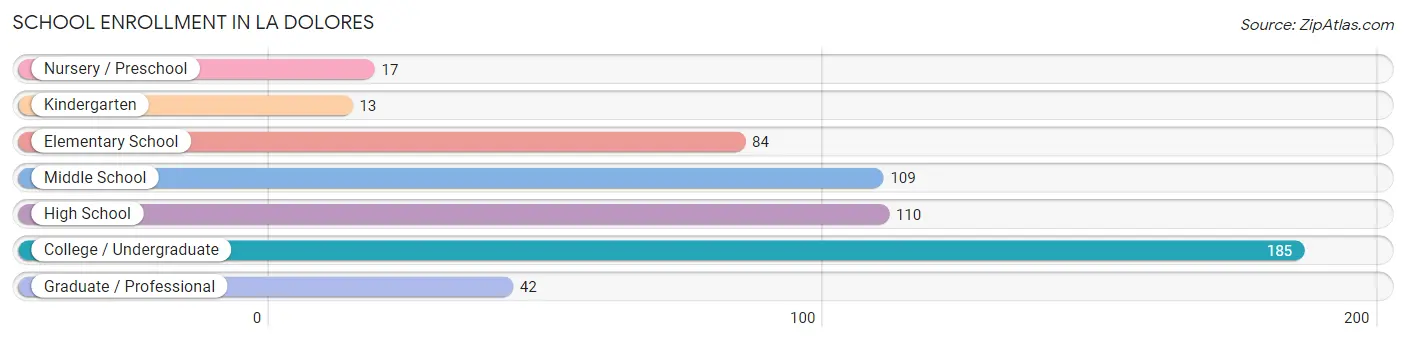
School Enrollment in La Dolores
The most common levels of schooling among the 560 students in La Dolores are college / undergraduate (185 | 33.0%), high school (110 | 19.6%), and middle school (109 | 19.5%).
| School Level | # Students | % Students |
| Nursery / Preschool | 17 | 3.0% |
| Kindergarten | 13 | 2.3% |
| Elementary School | 84 | 15.0% |
| Middle School | 109 | 19.5% |
| High School | 110 | 19.6% |
| College / Undergraduate | 185 | 33.0% |
| Graduate / Professional | 42 | 7.5% |
| Total | 560 | 100.0% |
School Enrollment by Age by Funding Source in La Dolores
Out of a total of 560 students who are enrolled in schools in La Dolores, 234 (41.8%) attend a private institution, while the remaining 326 (58.2%) are enrolled in public schools. The age group of 20 to 24 year olds has the highest likelihood of being enrolled in private schools, with 132 (88.6% in the age bracket) enrolled. Conversely, the age group of 3 to 4 year olds has the lowest likelihood of being enrolled in a private school, with 17 (100.0% in the age bracket) attending a public institution.
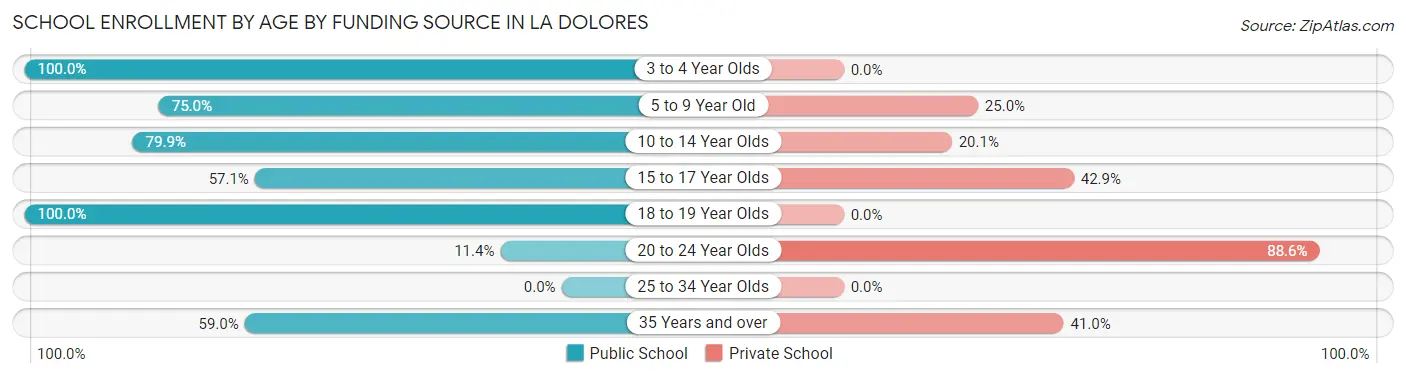
| Age Bracket | Public School | Private School |
| 3 to 4 Year Olds | 17 (100.0%) | 0 (0.0%) |
| 5 to 9 Year Old | 54 (75.0%) | 18 (25.0%) |
| 10 to 14 Year Olds | 127 (79.9%) | 32 (20.1%) |
| 15 to 17 Year Olds | 24 (57.1%) | 18 (42.9%) |
| 18 to 19 Year Olds | 38 (100.0%) | 0 (0.0%) |
| 20 to 24 Year Olds | 17 (11.4%) | 132 (88.6%) |
| 25 to 34 Year Olds | 0 (0.0%) | 0 (0.0%) |
| 35 Years and over | 49 (59.0%) | 34 (41.0%) |
| Total | 326 (58.2%) | 234 (41.8%) |
Educational Attainment by Field of Study in La Dolores
Business (186 | 31.3%), science & technology (135 | 22.7%), education (116 | 19.5%), computers & mathematics (75 | 12.6%), and physical & health sciences (21 | 3.5%) are the most common fields of study among 594 individuals in La Dolores who have obtained a bachelor's degree or higher.
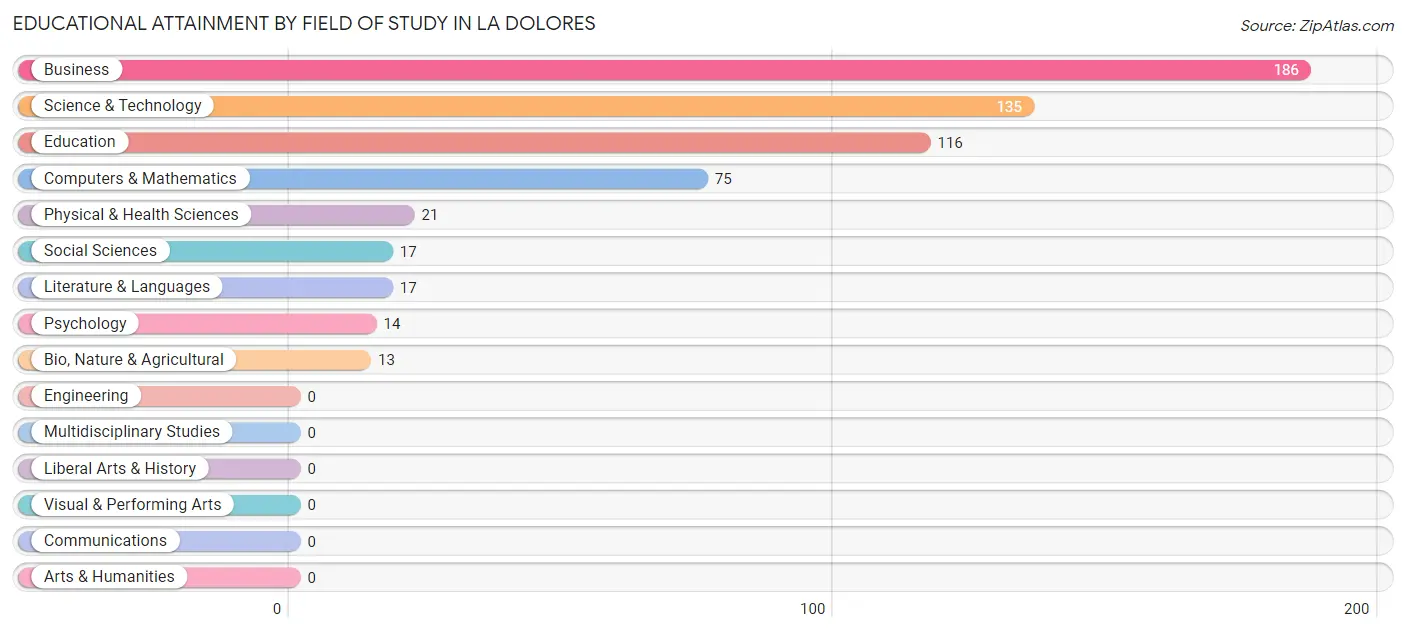
| Field of Study | # Graduates | % Graduates |
| Computers & Mathematics | 75 | 12.6% |
| Bio, Nature & Agricultural | 13 | 2.2% |
| Physical & Health Sciences | 21 | 3.5% |
| Psychology | 14 | 2.4% |
| Social Sciences | 17 | 2.9% |
| Engineering | 0 | 0.0% |
| Multidisciplinary Studies | 0 | 0.0% |
| Science & Technology | 135 | 22.7% |
| Business | 186 | 31.3% |
| Education | 116 | 19.5% |
| Literature & Languages | 17 | 2.9% |
| Liberal Arts & History | 0 | 0.0% |
| Visual & Performing Arts | 0 | 0.0% |
| Communications | 0 | 0.0% |
| Arts & Humanities | 0 | 0.0% |
| Total | 594 | 100.0% |
Transportation & Commute in La Dolores
Vehicle Availability by Sex in La Dolores
The most prevalent vehicle ownership categories in La Dolores are males with 1 vehicle (309, accounting for 62.5%) and females with 1 vehicle (233, making up 79.2%).
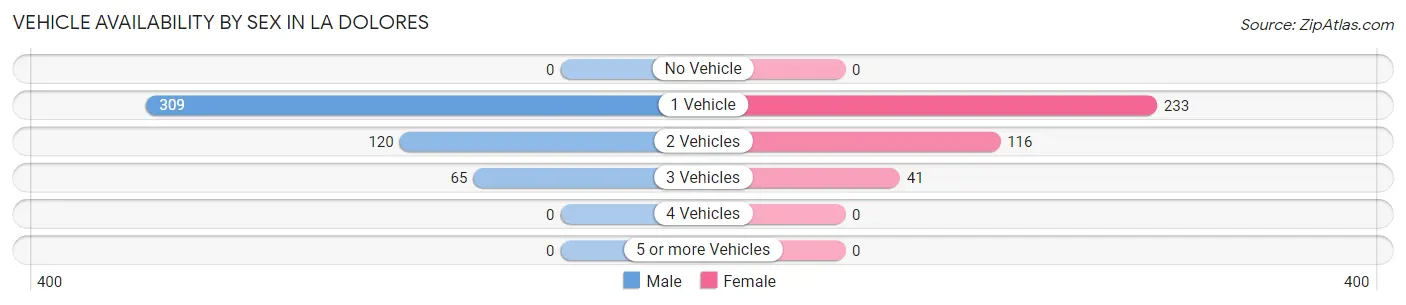
| Vehicles Available | Male | Female |
| No Vehicle | 0 (0.0%) | 0 (0.0%) |
| 1 Vehicle | 309 (62.5%) | 233 (59.7%) |
| 2 Vehicles | 120 (24.3%) | 116 (29.7%) |
| 3 Vehicles | 65 (13.2%) | 41 (10.5%) |
| 4 Vehicles | 0 (0.0%) | 0 (0.0%) |
| 5 or more Vehicles | 0 (0.0%) | 0 (0.0%) |
| Total | 494 (100.0%) | 390 (100.0%) |
Commute Time in La Dolores
The most frequently occuring commute durations in La Dolores are 10 to 14 minutes (200 commuters, 23.6%), 60 to 89 minutes (123 commuters, 14.5%), and 40 to 44 minutes (103 commuters, 12.2%).
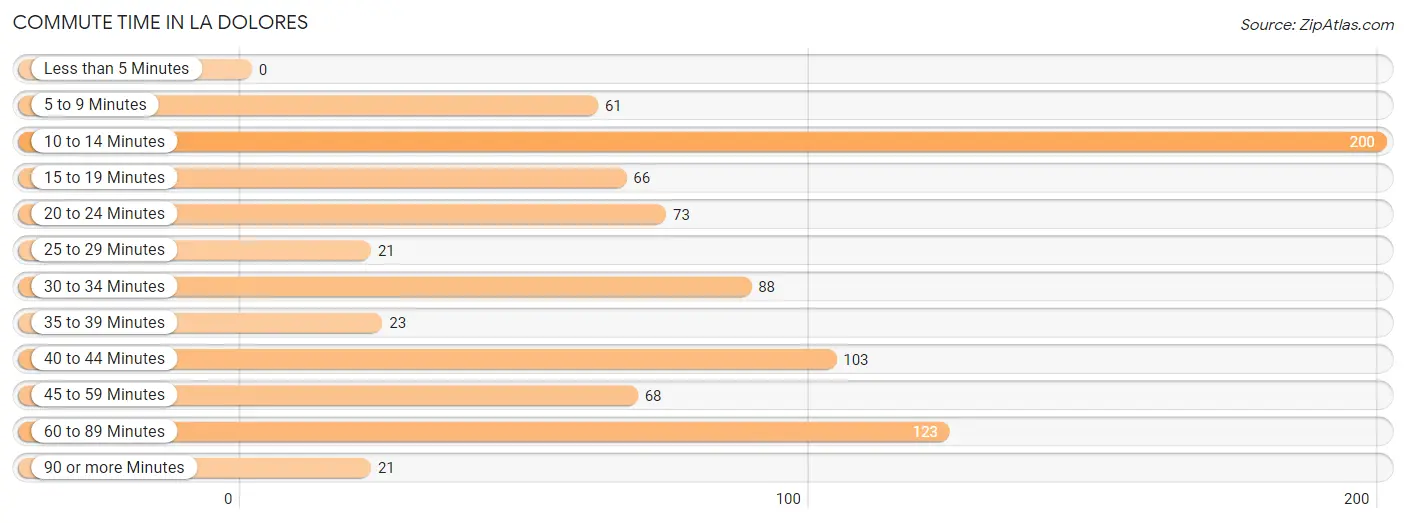
| Commute Time | # Commuters | % Commuters |
| Less than 5 Minutes | 0 | 0.0% |
| 5 to 9 Minutes | 61 | 7.2% |
| 10 to 14 Minutes | 200 | 23.6% |
| 15 to 19 Minutes | 66 | 7.8% |
| 20 to 24 Minutes | 73 | 8.6% |
| 25 to 29 Minutes | 21 | 2.5% |
| 30 to 34 Minutes | 88 | 10.4% |
| 35 to 39 Minutes | 23 | 2.7% |
| 40 to 44 Minutes | 103 | 12.2% |
| 45 to 59 Minutes | 68 | 8.0% |
| 60 to 89 Minutes | 123 | 14.5% |
| 90 or more Minutes | 21 | 2.5% |
Commute Time by Sex in La Dolores
The most common commute times in La Dolores are 10 to 14 minutes (151 commuters, 31.5%) for males and 60 to 89 minutes (99 commuters, 26.9%) for females.
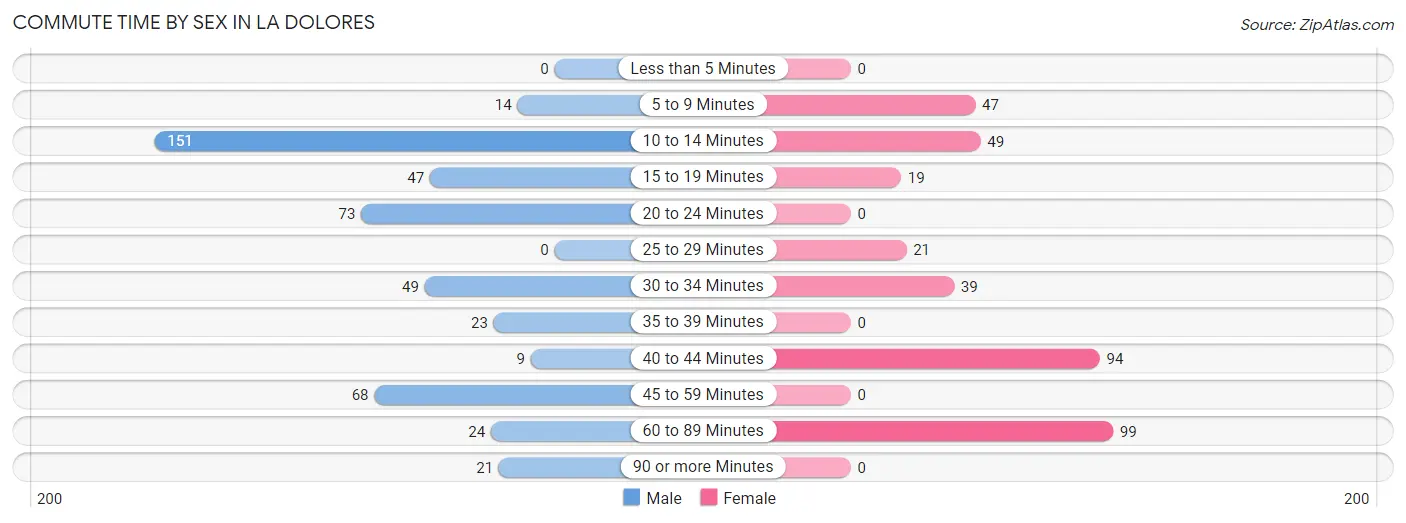
| Commute Time | Male | Female |
| Less than 5 Minutes | 0 (0.0%) | 0 (0.0%) |
| 5 to 9 Minutes | 14 (2.9%) | 47 (12.8%) |
| 10 to 14 Minutes | 151 (31.5%) | 49 (13.3%) |
| 15 to 19 Minutes | 47 (9.8%) | 19 (5.2%) |
| 20 to 24 Minutes | 73 (15.2%) | 0 (0.0%) |
| 25 to 29 Minutes | 0 (0.0%) | 21 (5.7%) |
| 30 to 34 Minutes | 49 (10.2%) | 39 (10.6%) |
| 35 to 39 Minutes | 23 (4.8%) | 0 (0.0%) |
| 40 to 44 Minutes | 9 (1.9%) | 94 (25.5%) |
| 45 to 59 Minutes | 68 (14.2%) | 0 (0.0%) |
| 60 to 89 Minutes | 24 (5.0%) | 99 (26.9%) |
| 90 or more Minutes | 21 (4.4%) | 0 (0.0%) |
Time of Departure to Work by Sex in La Dolores
The most frequent times of departure to work in La Dolores are 7:00 AM to 7:29 AM (179, 37.4%) for males and 6:00 AM to 6:29 AM (64, 17.4%) for females.
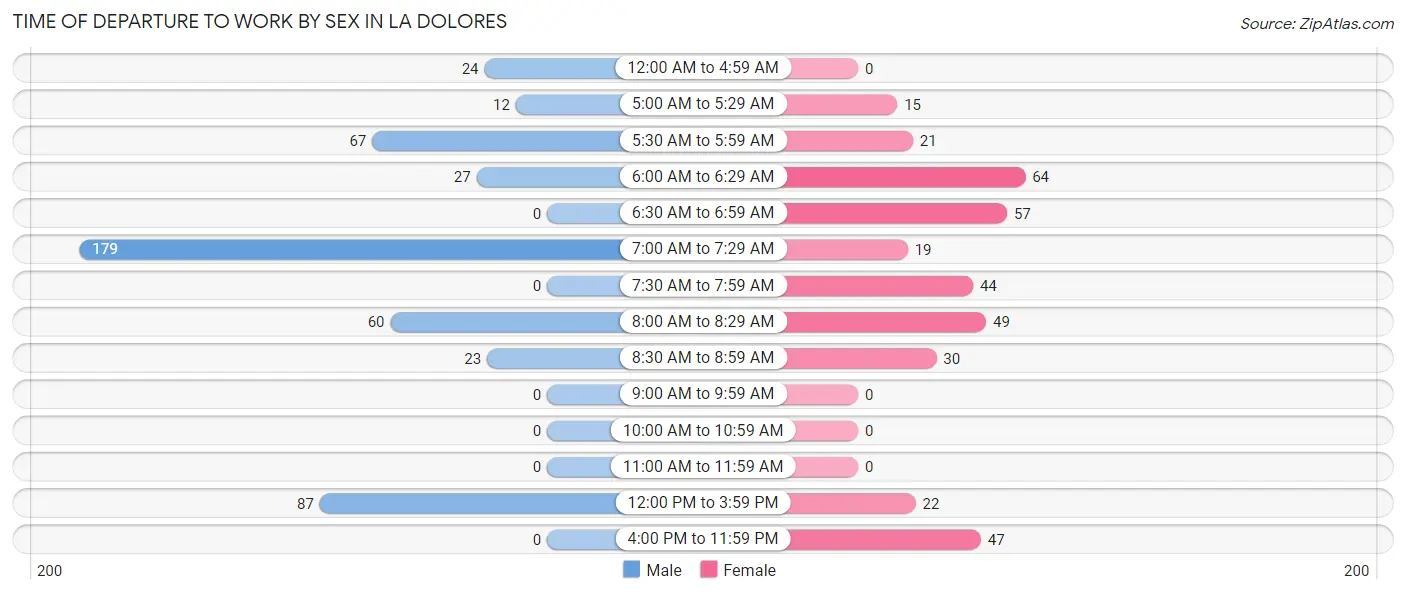
| Time of Departure | Male | Female |
| 12:00 AM to 4:59 AM | 24 (5.0%) | 0 (0.0%) |
| 5:00 AM to 5:29 AM | 12 (2.5%) | 15 (4.1%) |
| 5:30 AM to 5:59 AM | 67 (14.0%) | 21 (5.7%) |
| 6:00 AM to 6:29 AM | 27 (5.6%) | 64 (17.4%) |
| 6:30 AM to 6:59 AM | 0 (0.0%) | 57 (15.5%) |
| 7:00 AM to 7:29 AM | 179 (37.4%) | 19 (5.2%) |
| 7:30 AM to 7:59 AM | 0 (0.0%) | 44 (12.0%) |
| 8:00 AM to 8:29 AM | 60 (12.5%) | 49 (13.3%) |
| 8:30 AM to 8:59 AM | 23 (4.8%) | 30 (8.2%) |
| 9:00 AM to 9:59 AM | 0 (0.0%) | 0 (0.0%) |
| 10:00 AM to 10:59 AM | 0 (0.0%) | 0 (0.0%) |
| 11:00 AM to 11:59 AM | 0 (0.0%) | 0 (0.0%) |
| 12:00 PM to 3:59 PM | 87 (18.2%) | 22 (6.0%) |
| 4:00 PM to 11:59 PM | 0 (0.0%) | 47 (12.8%) |
| Total | 479 (100.0%) | 368 (100.0%) |
Housing Occupancy in La Dolores
Occupancy by Ownership in La Dolores
Of the total 904 dwellings in La Dolores, owner-occupied units account for 530 (58.6%), while renter-occupied units make up 374 (41.4%).
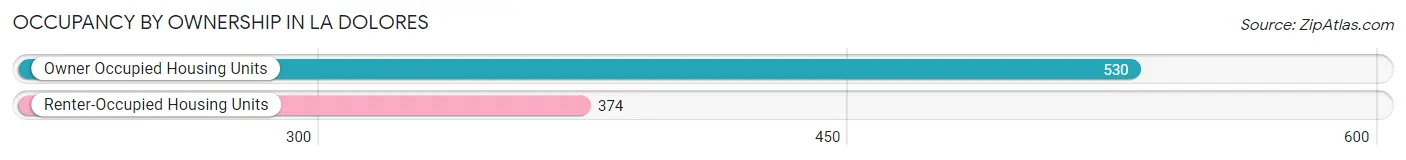
| Occupancy | # Housing Units | % Housing Units |
| Owner Occupied Housing Units | 530 | 58.6% |
| Renter-Occupied Housing Units | 374 | 41.4% |
| Total Occupied Housing Units | 904 | 100.0% |
Occupancy by Household Size in La Dolores
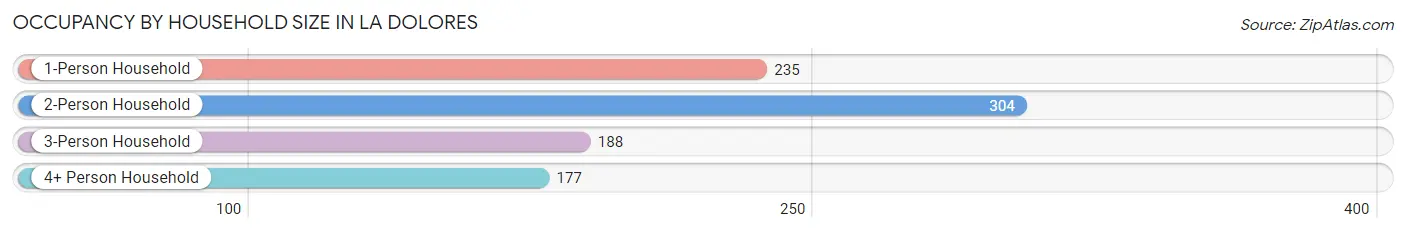
| Household Size | # Housing Units | % Housing Units |
| 1-Person Household | 235 | 26.0% |
| 2-Person Household | 304 | 33.6% |
| 3-Person Household | 188 | 20.8% |
| 4+ Person Household | 177 | 19.6% |
| Total Housing Units | 904 | 100.0% |
Occupancy by Ownership by Household Size in La Dolores
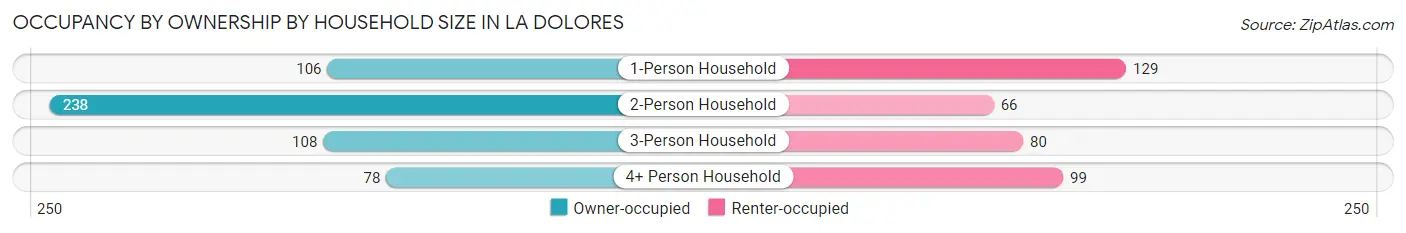
| Household Size | Owner-occupied | Renter-occupied |
| 1-Person Household | 106 (45.1%) | 129 (54.9%) |
| 2-Person Household | 238 (78.3%) | 66 (21.7%) |
| 3-Person Household | 108 (57.5%) | 80 (42.5%) |
| 4+ Person Household | 78 (44.1%) | 99 (55.9%) |
| Total Housing Units | 530 (58.6%) | 374 (41.4%) |
Occupancy by Educational Attainment in La Dolores
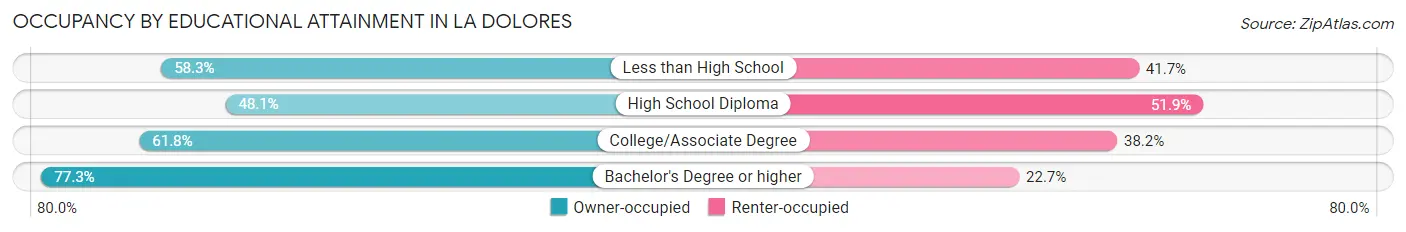
| Household Size | Owner-occupied | Renter-occupied |
| Less than High School | 196 (58.3%) | 140 (41.7%) |
| High School Diploma | 142 (48.1%) | 153 (51.9%) |
| College/Associate Degree | 76 (61.8%) | 47 (38.2%) |
| Bachelor's Degree or higher | 116 (77.3%) | 34 (22.7%) |
Occupancy by Age of Householder in La Dolores
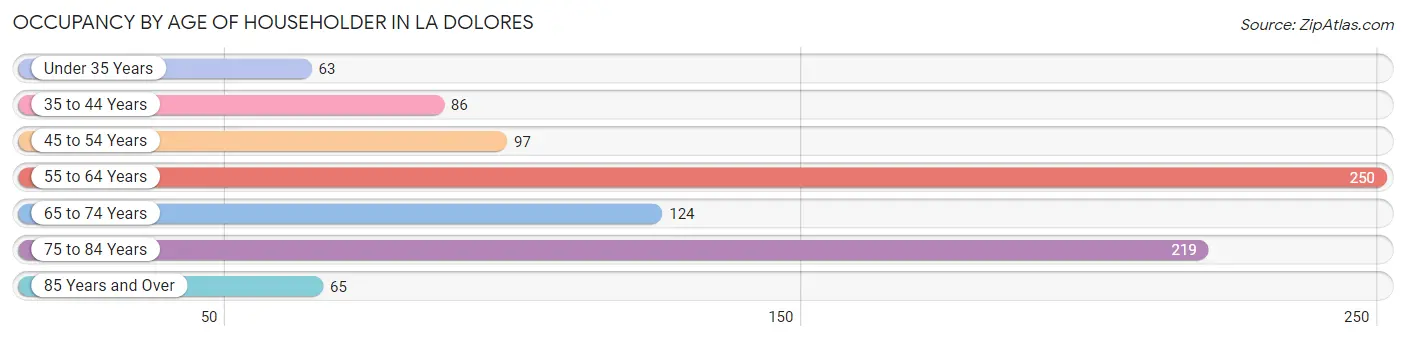
| Age Bracket | # Households | % Households |
| Under 35 Years | 63 | 7.0% |
| 35 to 44 Years | 86 | 9.5% |
| 45 to 54 Years | 97 | 10.7% |
| 55 to 64 Years | 250 | 27.7% |
| 65 to 74 Years | 124 | 13.7% |
| 75 to 84 Years | 219 | 24.2% |
| 85 Years and Over | 65 | 7.2% |
| Total | 904 | 100.0% |
Housing Finances in La Dolores
Median Income by Occupancy in La Dolores
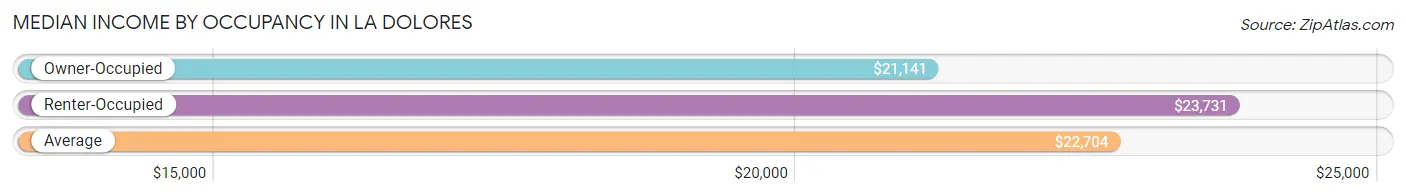
| Occupancy Type | # Households | Median Income |
| Owner-Occupied | 530 (58.6%) | $21,141 |
| Renter-Occupied | 374 (41.4%) | $23,731 |
| Average | 904 (100.0%) | $22,704 |
Occupancy by Householder Income Bracket in La Dolores
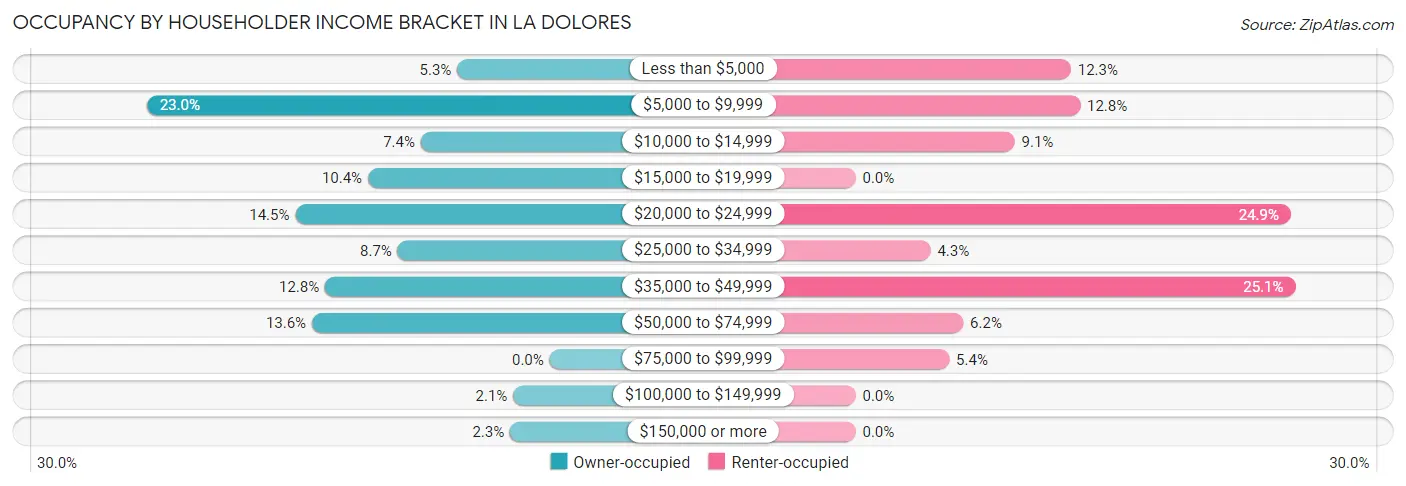
| Income Bracket | Owner-occupied | Renter-occupied |
| Less than $5,000 | 28 (5.3%) | 46 (12.3%) |
| $5,000 to $9,999 | 122 (23.0%) | 48 (12.8%) |
| $10,000 to $14,999 | 39 (7.4%) | 34 (9.1%) |
| $15,000 to $19,999 | 55 (10.4%) | 0 (0.0%) |
| $20,000 to $24,999 | 77 (14.5%) | 93 (24.9%) |
| $25,000 to $34,999 | 46 (8.7%) | 16 (4.3%) |
| $35,000 to $49,999 | 68 (12.8%) | 94 (25.1%) |
| $50,000 to $74,999 | 72 (13.6%) | 23 (6.1%) |
| $75,000 to $99,999 | 0 (0.0%) | 20 (5.3%) |
| $100,000 to $149,999 | 11 (2.1%) | 0 (0.0%) |
| $150,000 or more | 12 (2.3%) | 0 (0.0%) |
| Total | 530 (100.0%) | 374 (100.0%) |
Monthly Housing Cost Tiers in La Dolores
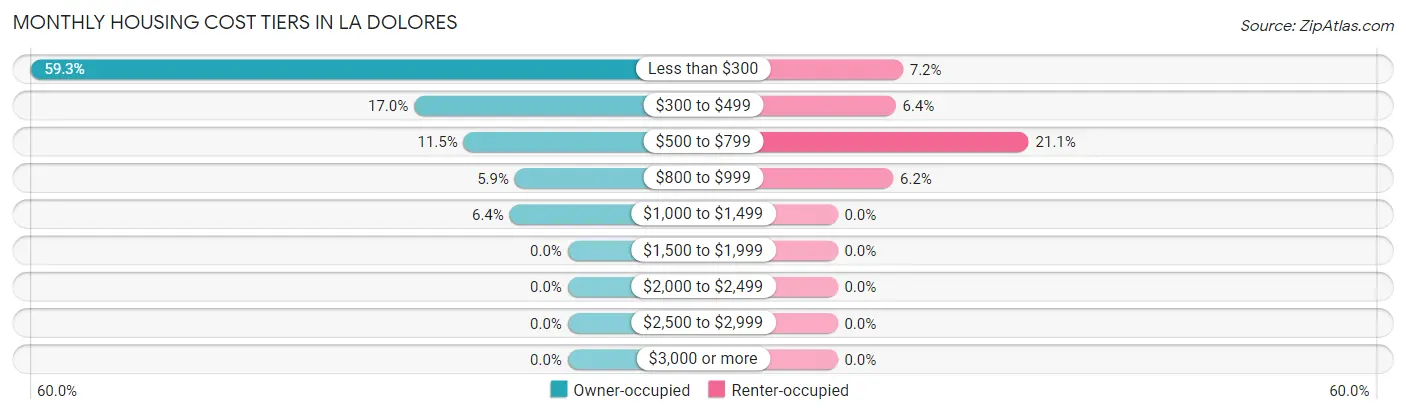
| Monthly Cost | Owner-occupied | Renter-occupied |
| Less than $300 | 314 (59.3%) | 27 (7.2%) |
| $300 to $499 | 90 (17.0%) | 24 (6.4%) |
| $500 to $799 | 61 (11.5%) | 79 (21.1%) |
| $800 to $999 | 31 (5.9%) | 23 (6.1%) |
| $1,000 to $1,499 | 34 (6.4%) | 0 (0.0%) |
| $1,500 to $1,999 | 0 (0.0%) | 0 (0.0%) |
| $2,000 to $2,499 | 0 (0.0%) | 0 (0.0%) |
| $2,500 to $2,999 | 0 (0.0%) | 0 (0.0%) |
| $3,000 or more | 0 (0.0%) | 0 (0.0%) |
| Total | 530 (100.0%) | 374 (100.0%) |
Physical Housing Characteristics in La Dolores
Housing Structures in La Dolores
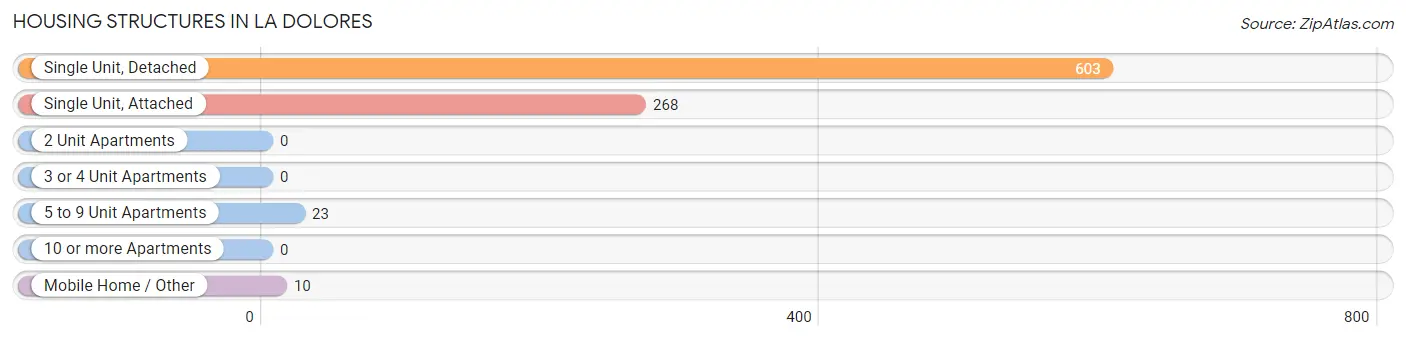
| Structure Type | # Housing Units | % Housing Units |
| Single Unit, Detached | 603 | 66.7% |
| Single Unit, Attached | 268 | 29.6% |
| 2 Unit Apartments | 0 | 0.0% |
| 3 or 4 Unit Apartments | 0 | 0.0% |
| 5 to 9 Unit Apartments | 23 | 2.5% |
| 10 or more Apartments | 0 | 0.0% |
| Mobile Home / Other | 10 | 1.1% |
| Total | 904 | 100.0% |
Housing Structures by Occupancy in La Dolores
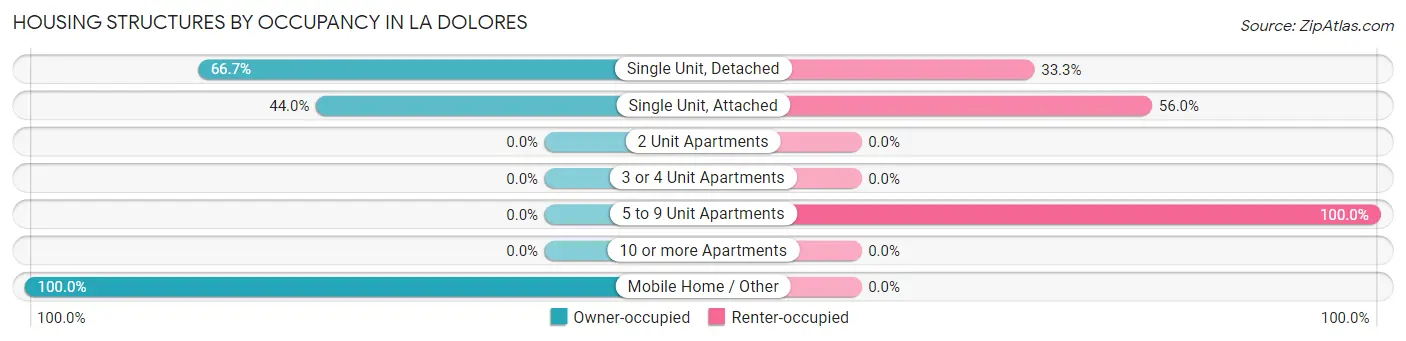
| Structure Type | Owner-occupied | Renter-occupied |
| Single Unit, Detached | 402 (66.7%) | 201 (33.3%) |
| Single Unit, Attached | 118 (44.0%) | 150 (56.0%) |
| 2 Unit Apartments | 0 (0.0%) | 0 (0.0%) |
| 3 or 4 Unit Apartments | 0 (0.0%) | 0 (0.0%) |
| 5 to 9 Unit Apartments | 0 (0.0%) | 23 (100.0%) |
| 10 or more Apartments | 0 (0.0%) | 0 (0.0%) |
| Mobile Home / Other | 10 (100.0%) | 0 (0.0%) |
| Total | 530 (58.6%) | 374 (41.4%) |
Housing Structures by Number of Rooms in La Dolores
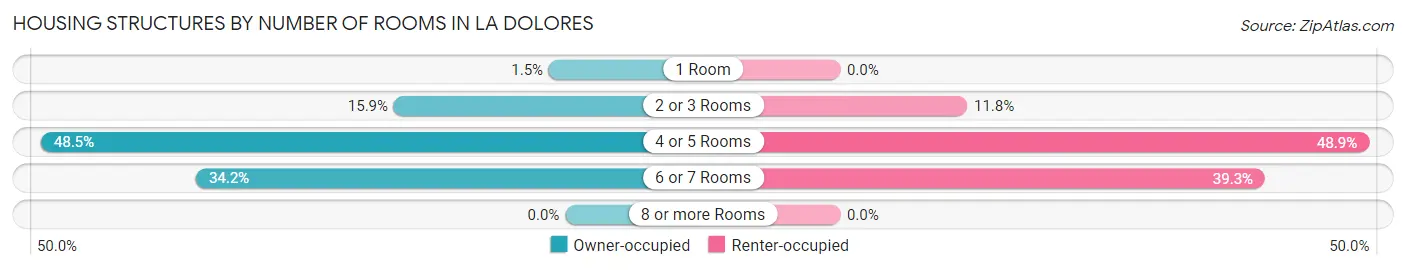
| Number of Rooms | Owner-occupied | Renter-occupied |
| 1 Room | 8 (1.5%) | 0 (0.0%) |
| 2 or 3 Rooms | 84 (15.9%) | 44 (11.8%) |
| 4 or 5 Rooms | 257 (48.5%) | 183 (48.9%) |
| 6 or 7 Rooms | 181 (34.2%) | 147 (39.3%) |
| 8 or more Rooms | 0 (0.0%) | 0 (0.0%) |
| Total | 530 (100.0%) | 374 (100.0%) |
Housing Structure by Heating Type in La Dolores
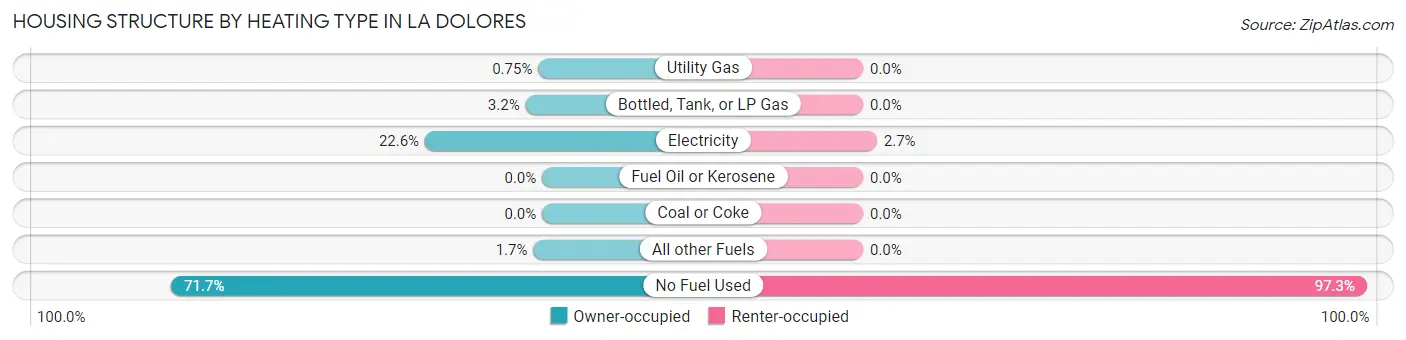
| Heating Type | Owner-occupied | Renter-occupied |
| Utility Gas | 4 (0.7%) | 0 (0.0%) |
| Bottled, Tank, or LP Gas | 17 (3.2%) | 0 (0.0%) |
| Electricity | 120 (22.6%) | 10 (2.7%) |
| Fuel Oil or Kerosene | 0 (0.0%) | 0 (0.0%) |
| Coal or Coke | 0 (0.0%) | 0 (0.0%) |
| All other Fuels | 9 (1.7%) | 0 (0.0%) |
| No Fuel Used | 380 (71.7%) | 364 (97.3%) |
| Total | 530 (100.0%) | 374 (100.0%) |
Household Vehicle Usage in La Dolores
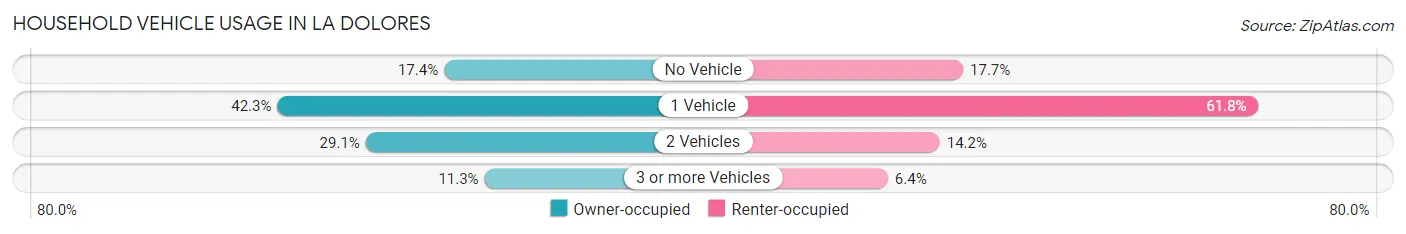
| Vehicles per Household | Owner-occupied | Renter-occupied |
| No Vehicle | 92 (17.4%) | 66 (17.6%) |
| 1 Vehicle | 224 (42.3%) | 231 (61.8%) |
| 2 Vehicles | 154 (29.1%) | 53 (14.2%) |
| 3 or more Vehicles | 60 (11.3%) | 24 (6.4%) |
| Total | 530 (100.0%) | 374 (100.0%) |
Real Estate & Mortgages in La Dolores
Real Estate and Mortgage Overview in La Dolores
| Characteristic | Without Mortgage | With Mortgage |
| Housing Units | 384 | 146 |
| Median Property Value | $87,700 | $88,800 |
| Median Household Income | $18,333 | $12 |
| Monthly Housing Costs | $171 | $0 |
| Real Estate Taxes | $904 | $128 |
Property Value by Mortgage Status in La Dolores
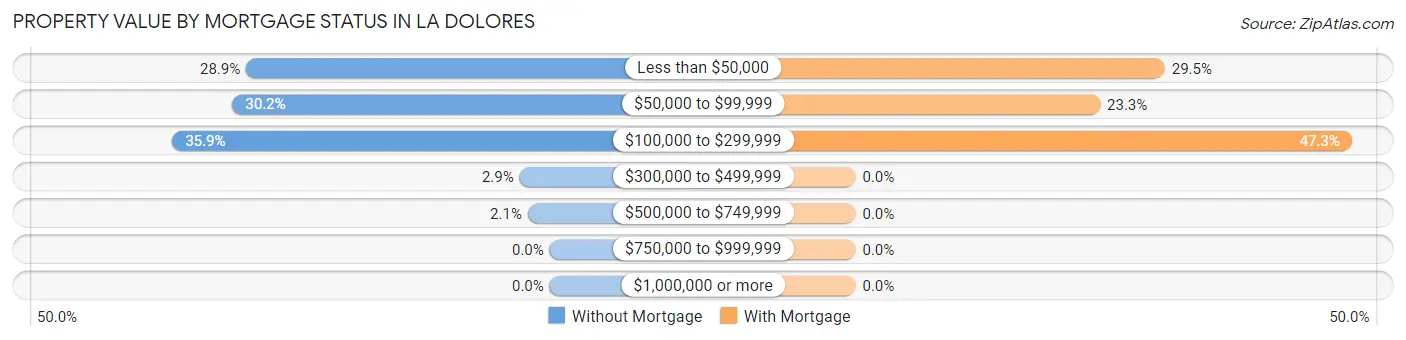
| Property Value | Without Mortgage | With Mortgage |
| Less than $50,000 | 111 (28.9%) | 43 (29.4%) |
| $50,000 to $99,999 | 116 (30.2%) | 34 (23.3%) |
| $100,000 to $299,999 | 138 (35.9%) | 69 (47.3%) |
| $300,000 to $499,999 | 11 (2.9%) | 0 (0.0%) |
| $500,000 to $749,999 | 8 (2.1%) | 0 (0.0%) |
| $750,000 to $999,999 | 0 (0.0%) | 0 (0.0%) |
| $1,000,000 or more | 0 (0.0%) | 0 (0.0%) |
| Total | 384 (100.0%) | 146 (100.0%) |
Household Income by Mortgage Status in La Dolores
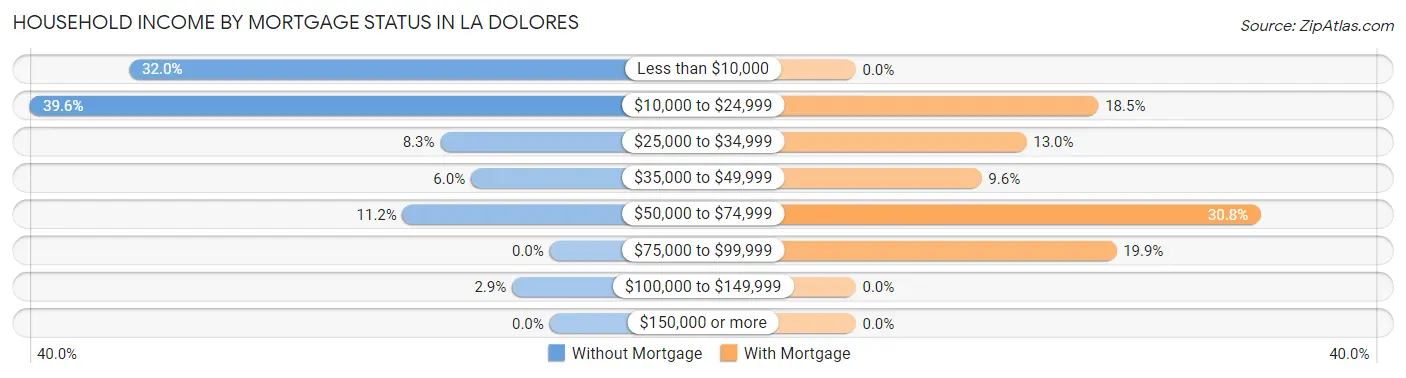
| Household Income | Without Mortgage | With Mortgage |
| Less than $10,000 | 123 (32.0%) | 0 (0.0%) |
| $10,000 to $24,999 | 152 (39.6%) | 27 (18.5%) |
| $25,000 to $34,999 | 32 (8.3%) | 19 (13.0%) |
| $35,000 to $49,999 | 23 (6.0%) | 14 (9.6%) |
| $50,000 to $74,999 | 43 (11.2%) | 45 (30.8%) |
| $75,000 to $99,999 | 0 (0.0%) | 29 (19.9%) |
| $100,000 to $149,999 | 11 (2.9%) | 0 (0.0%) |
| $150,000 or more | 0 (0.0%) | 0 (0.0%) |
| Total | 384 (100.0%) | 146 (100.0%) |
Property Value to Household Income Ratio in La Dolores
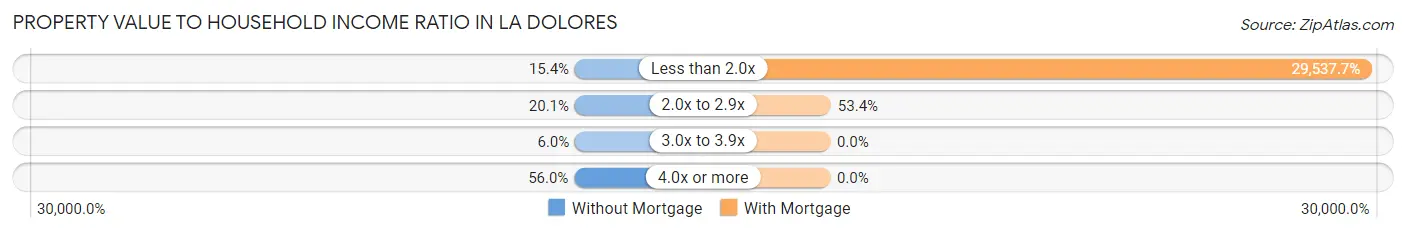
| Value-to-Income Ratio | Without Mortgage | With Mortgage |
| Less than 2.0x | 59 (15.4%) | 43,125 (29,537.7%) |
| 2.0x to 2.9x | 77 (20.1%) | 78 (53.4%) |
| 3.0x to 3.9x | 23 (6.0%) | 0 (0.0%) |
| 4.0x or more | 215 (56.0%) | 0 (0.0%) |
| Total | 384 (100.0%) | 146 (100.0%) |
Real Estate Taxes by Mortgage Status in La Dolores
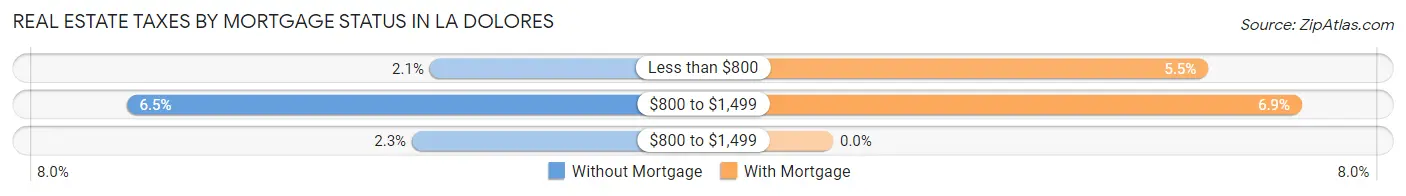
| Property Taxes | Without Mortgage | With Mortgage |
| Less than $800 | 8 (2.1%) | 8 (5.5%) |
| $800 to $1,499 | 25 (6.5%) | 10 (6.9%) |
| $800 to $1,499 | 9 (2.3%) | 0 (0.0%) |
| Total | 384 (100.0%) | 146 (100.0%) |
Health & Disability in La Dolores
Health Insurance Coverage by Age in La Dolores
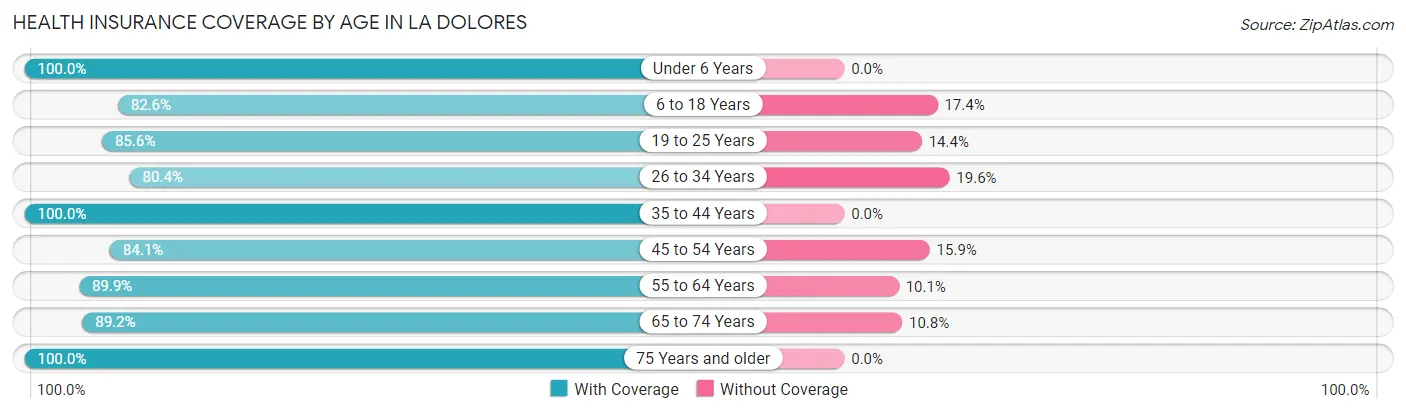
| Age Bracket | With Coverage | Without Coverage |
| Under 6 Years | 52 (100.0%) | 0 (0.0%) |
| 6 to 18 Years | 233 (82.6%) | 49 (17.4%) |
| 19 to 25 Years | 243 (85.6%) | 41 (14.4%) |
| 26 to 34 Years | 283 (80.4%) | 69 (19.6%) |
| 35 to 44 Years | 259 (100.0%) | 0 (0.0%) |
| 45 to 54 Years | 338 (84.1%) | 64 (15.9%) |
| 55 to 64 Years | 452 (89.9%) | 51 (10.1%) |
| 65 to 74 Years | 265 (89.2%) | 32 (10.8%) |
| 75 Years and older | 424 (100.0%) | 0 (0.0%) |
| Total | 2,549 (89.3%) | 306 (10.7%) |
Health Insurance Coverage by Citizenship Status in La Dolores

| Citizenship Status | With Coverage | Without Coverage |
| Native Born | 52 (100.0%) | 0 (0.0%) |
| Foreign Born, Citizen | 233 (82.6%) | 49 (17.4%) |
| Foreign Born, not a Citizen | 243 (85.6%) | 41 (14.4%) |
Health Insurance Coverage by Household Income in La Dolores
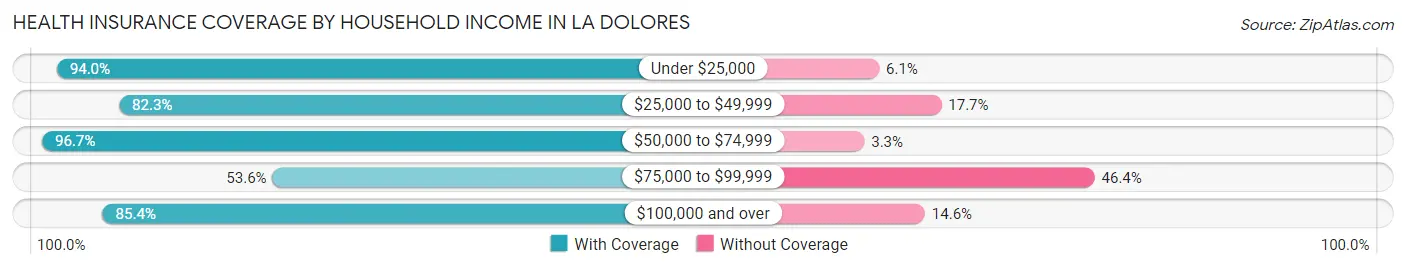
| Household Income | With Coverage | Without Coverage |
| Under $25,000 | 1,319 (94.0%) | 85 (6.0%) |
| $25,000 to $49,999 | 729 (82.3%) | 157 (17.7%) |
| $50,000 to $74,999 | 383 (96.7%) | 13 (3.3%) |
| $75,000 to $99,999 | 45 (53.6%) | 39 (46.4%) |
| $100,000 and over | 70 (85.4%) | 12 (14.6%) |
Public vs Private Health Insurance Coverage by Age in La Dolores
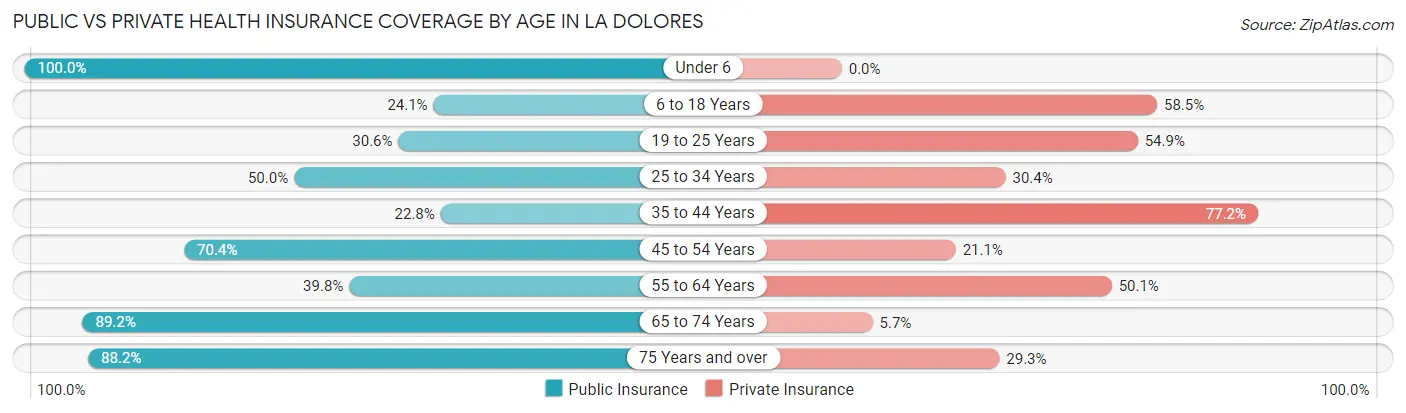
| Age Bracket | Public Insurance | Private Insurance |
| Under 6 | 52 (100.0%) | 0 (0.0%) |
| 6 to 18 Years | 68 (24.1%) | 165 (58.5%) |
| 19 to 25 Years | 87 (30.6%) | 156 (54.9%) |
| 25 to 34 Years | 176 (50.0%) | 107 (30.4%) |
| 35 to 44 Years | 59 (22.8%) | 200 (77.2%) |
| 45 to 54 Years | 283 (70.4%) | 85 (21.1%) |
| 55 to 64 Years | 200 (39.8%) | 252 (50.1%) |
| 65 to 74 Years | 265 (89.2%) | 17 (5.7%) |
| 75 Years and over | 374 (88.2%) | 124 (29.2%) |
| Total | 1,564 (54.8%) | 1,106 (38.7%) |
Disability Status by Sex by Age in La Dolores
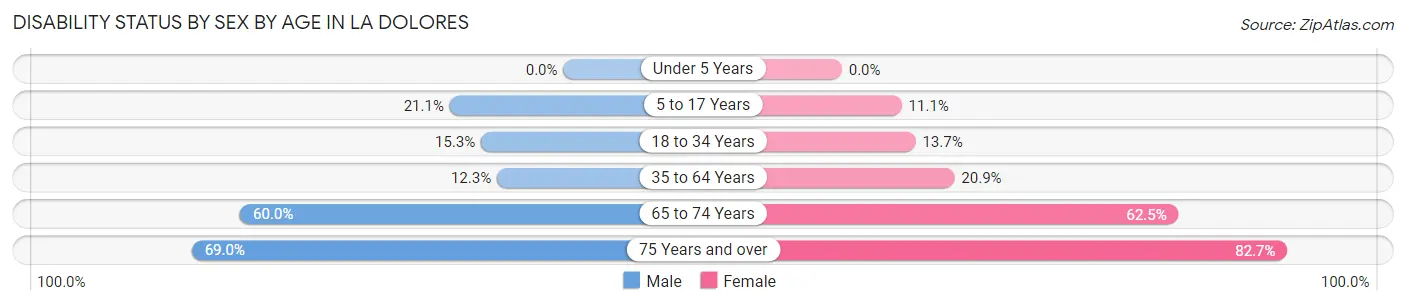
| Age Bracket | Male | Female |
| Under 5 Years | 0 (0.0%) | 0 (0.0%) |
| 5 to 17 Years | 31 (21.1%) | 14 (11.1%) |
| 18 to 34 Years | 57 (15.3%) | 39 (13.7%) |
| 35 to 64 Years | 78 (12.3%) | 111 (20.9%) |
| 65 to 74 Years | 63 (60.0%) | 120 (62.5%) |
| 75 Years and over | 129 (69.0%) | 196 (82.7%) |
Disability Class by Sex by Age in La Dolores
Disability Class: Hearing Difficulty
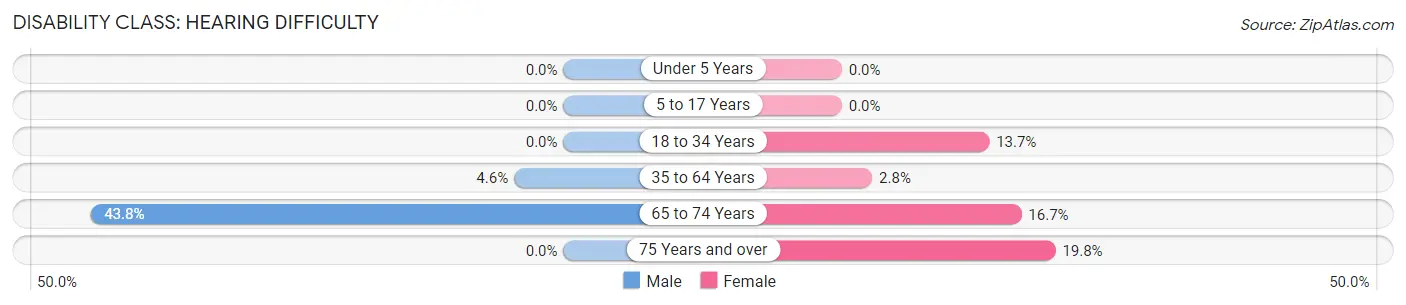
| Age Bracket | Male | Female |
| Under 5 Years | 0 (0.0%) | 0 (0.0%) |
| 5 to 17 Years | 0 (0.0%) | 0 (0.0%) |
| 18 to 34 Years | 0 (0.0%) | 39 (13.7%) |
| 35 to 64 Years | 29 (4.6%) | 15 (2.8%) |
| 65 to 74 Years | 46 (43.8%) | 32 (16.7%) |
| 75 Years and over | 0 (0.0%) | 47 (19.8%) |
Disability Class: Vision Difficulty
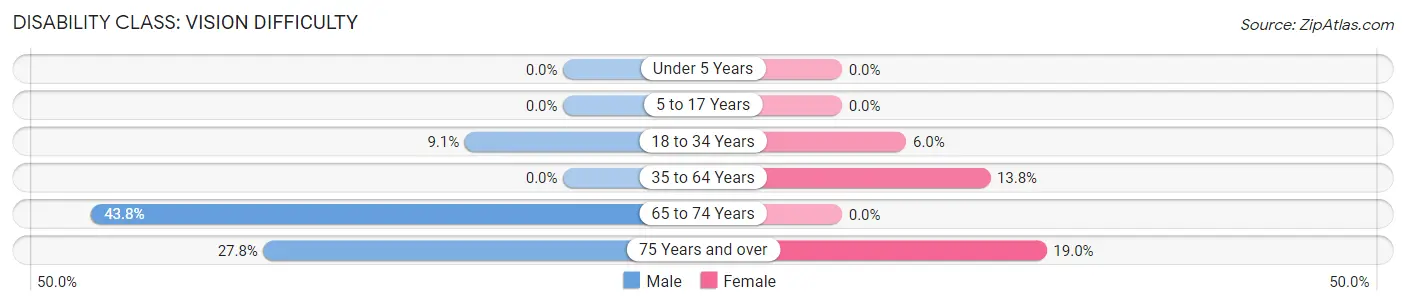
| Age Bracket | Male | Female |
| Under 5 Years | 0 (0.0%) | 0 (0.0%) |
| 5 to 17 Years | 0 (0.0%) | 0 (0.0%) |
| 18 to 34 Years | 34 (9.1%) | 17 (6.0%) |
| 35 to 64 Years | 0 (0.0%) | 73 (13.8%) |
| 65 to 74 Years | 46 (43.8%) | 0 (0.0%) |
| 75 Years and over | 52 (27.8%) | 45 (19.0%) |
Disability Class: Cognitive Difficulty
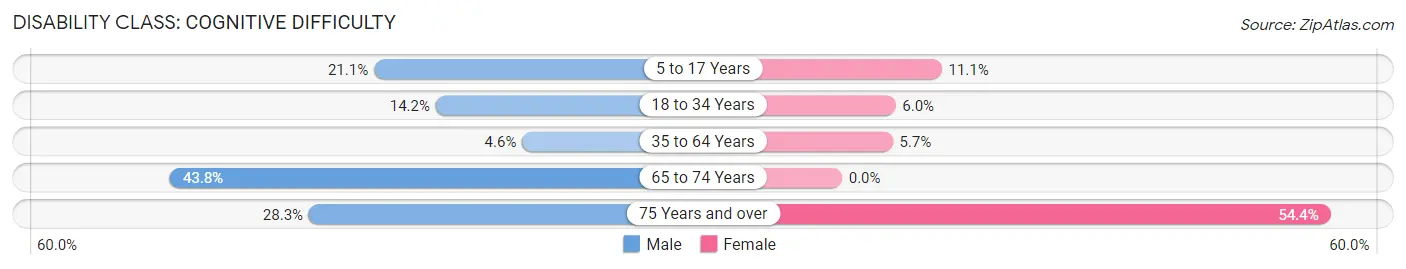
| Age Bracket | Male | Female |
| 5 to 17 Years | 31 (21.1%) | 14 (11.1%) |
| 18 to 34 Years | 53 (14.2%) | 17 (6.0%) |
| 35 to 64 Years | 29 (4.6%) | 30 (5.7%) |
| 65 to 74 Years | 46 (43.8%) | 0 (0.0%) |
| 75 Years and over | 53 (28.3%) | 129 (54.4%) |
Disability Class: Ambulatory Difficulty
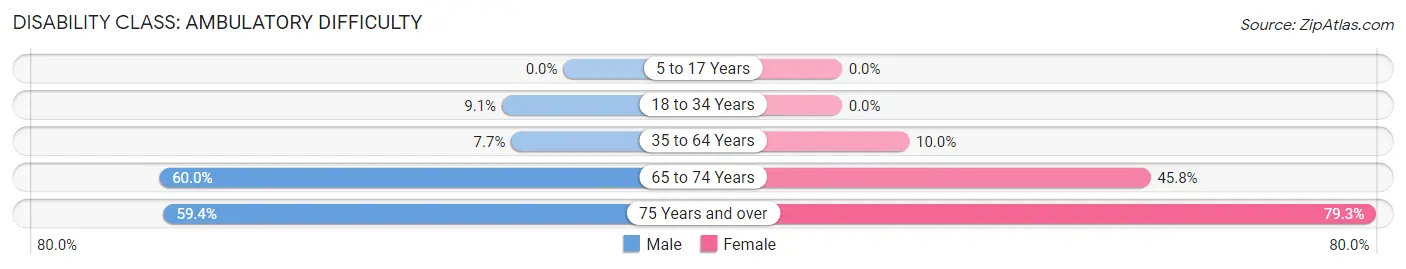
| Age Bracket | Male | Female |
| 5 to 17 Years | 0 (0.0%) | 0 (0.0%) |
| 18 to 34 Years | 34 (9.1%) | 0 (0.0%) |
| 35 to 64 Years | 49 (7.7%) | 53 (10.0%) |
| 65 to 74 Years | 63 (60.0%) | 88 (45.8%) |
| 75 Years and over | 111 (59.4%) | 188 (79.3%) |
Disability Class: Self-Care Difficulty
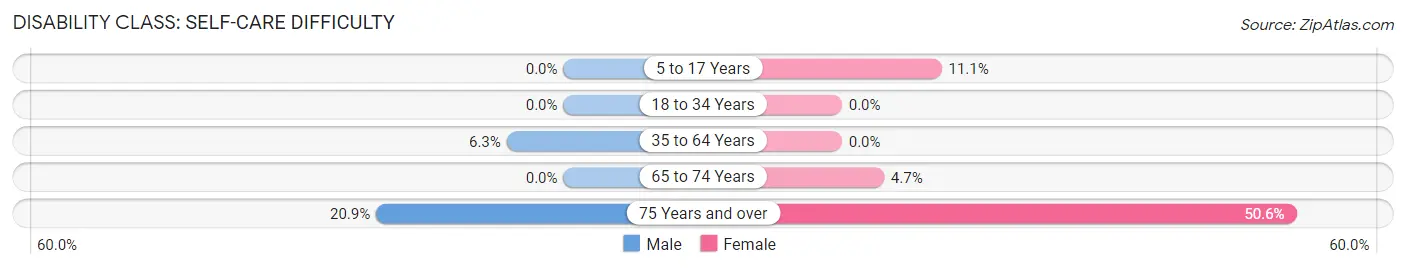
| Age Bracket | Male | Female |
| 5 to 17 Years | 0 (0.0%) | 14 (11.1%) |
| 18 to 34 Years | 0 (0.0%) | 0 (0.0%) |
| 35 to 64 Years | 40 (6.3%) | 0 (0.0%) |
| 65 to 74 Years | 0 (0.0%) | 9 (4.7%) |
| 75 Years and over | 39 (20.9%) | 120 (50.6%) |
Technology Access in La Dolores
Computing Device Access in La Dolores
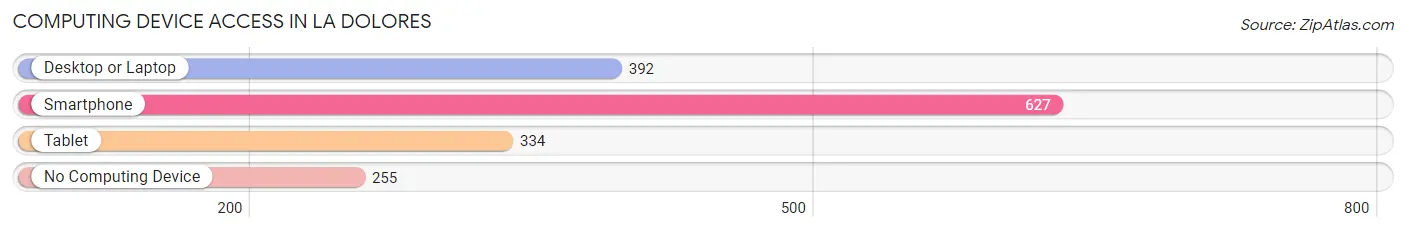
| Device Type | # Households | % Households |
| Desktop or Laptop | 392 | 43.4% |
| Smartphone | 627 | 69.4% |
| Tablet | 334 | 36.9% |
| No Computing Device | 255 | 28.2% |
| Total | 904 | 100.0% |
Internet Access in La Dolores
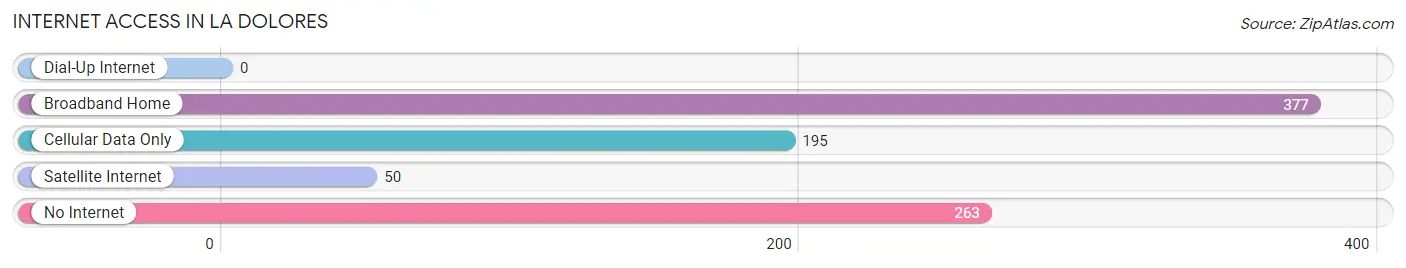
| Internet Type | # Households | % Households |
| Dial-Up Internet | 0 | 0.0% |
| Broadband Home | 377 | 41.7% |
| Cellular Data Only | 195 | 21.6% |
| Satellite Internet | 50 | 5.5% |
| No Internet | 263 | 29.1% |
| Total | 904 | 100.0% |
La Dolores Summary
Dolores, Puerto Rico is a small municipality located in the central region of the island of Puerto Rico. It is part of the San Juan-Caguas-Guaynabo Metropolitan Statistical Area. The municipality is bordered by the municipalities of Ciales, Morovis, Orocovis, and Villalba. As of the 2010 census, the population of Dolores was 8,845.
Geography
Dolores is located in the central region of Puerto Rico, in the Cordillera Central mountain range. It is situated in the northern part of the island, between the municipalities of Ciales and Morovis. The municipality covers an area of approximately 24 square miles (62 km2). The terrain is mostly mountainous, with elevations ranging from 1,000 to 2,000 feet (300 to 600 m). The highest point in the municipality is Cerro de la Cruz, which has an elevation of 2,000 feet (600 m).
The climate in Dolores is tropical, with temperatures ranging from the mid-70s to the mid-80s Fahrenheit (21 to 29 Celsius). The average annual precipitation is approximately 60 inches (1,500 mm).
Economy
The economy of Dolores is largely based on agriculture. The main crops grown in the municipality are coffee, plantains, bananas, and yams. Livestock production is also important, with cattle, pigs, and goats being the main animals raised.
The municipality also has a small manufacturing sector, with several small factories producing clothing, furniture, and other goods. Tourism is also an important part of the economy, with several small hotels and restaurants located in the area.
Demographics
As of the 2010 census, the population of Dolores was 8,845. The population is mostly of mixed European and African descent, with a small percentage of Native American and Asian ancestry. The majority of the population is Roman Catholic, with a small percentage of other religious affiliations.
The median household income in Dolores is $14,845, which is lower than the national average. The unemployment rate is also higher than the national average, at 16.2%.
Education
Dolores has several public schools, including elementary, middle, and high schools. The municipality also has several private schools, including a Catholic school and a Montessori school.
Conclusion
Dolores, Puerto Rico is a small municipality located in the central region of the island. The economy is largely based on agriculture, with coffee, plantains, bananas, and yams being the main crops. The population is mostly of mixed European and African descent, with a small percentage of Native American and Asian ancestry. The median household income is lower than the national average, and the unemployment rate is higher than the national average. Dolores has several public and private schools, providing educational opportunities for the residents of the municipality.
Common Questions
What is the Total Population of La Dolores?
Total Population of La Dolores is 2,861.
What is the Total Male Population of La Dolores?
Total Male Population of La Dolores is 1,469.
What is the Total Female Population of La Dolores?
Total Female Population of La Dolores is 1,392.
What is the Ratio of Males per 100 Females in La Dolores?
There are 105.53 Males per 100 Females in La Dolores.
What is the Ratio of Females per 100 Males in La Dolores?
There are 94.76 Females per 100 Males in La Dolores.
What is the Median Population Age in La Dolores?
Median Population Age in La Dolores is 49.6 Years.
What is the Average Family Size in La Dolores
Average Family Size in La Dolores is 3.9 People.
What is the Average Household Size in La Dolores
Average Household Size in La Dolores is 3.1 People.
What is Per Capita Income in La Dolores?
Per Capita income in La Dolores is $11,731.
What is the Median Family Income in La Dolores?
Median Family Income in La Dolores is $25,547.
What is the Median Household income in La Dolores?
Median Household Income in La Dolores is $22,704.
What is Income or Wage Gap in La Dolores?
Income or Wage Gap in La Dolores is 4.7%.
Women in La Dolores earn 95.3 cents for every dollar earned by a man.
What is Inequality or Gini Index in La Dolores?
Inequality or Gini Index in La Dolores is 0.46.
How Large is the Labor Force in La Dolores?
There are 1,305 People in the Labor Forcein in La Dolores.
What is the Percentage of People in the Labor Force in La Dolores?
50.7% of People are in the Labor Force in La Dolores.
What is the Unemployment Rate in La Dolores?
Unemployment Rate in La Dolores is 23.5%.