Hato Arriba, PR
Hato Arriba Map
Hato Arriba Overview
775
TOTAL POPULATION
336
MALE POPULATION
439
FEMALE POPULATION
76.54
MALES / 100 FEMALES
130.65
FEMALES / 100 MALES
63.5
MEDIAN AGE
3.5
AVG FAMILY SIZE
2.2
AVG HOUSEHOLD SIZE
$7,211
PER CAPITA INCOME
$13,846
AVG FAMILY INCOME
$13,598
AVG HOUSEHOLD INCOME
0.25
INEQUALITY / GINI INDEX
77
LABOR FORCE [ PEOPLE ]
10.5%
PERCENT IN LABOR FORCE
40.3%
UNEMPLOYMENT RATE
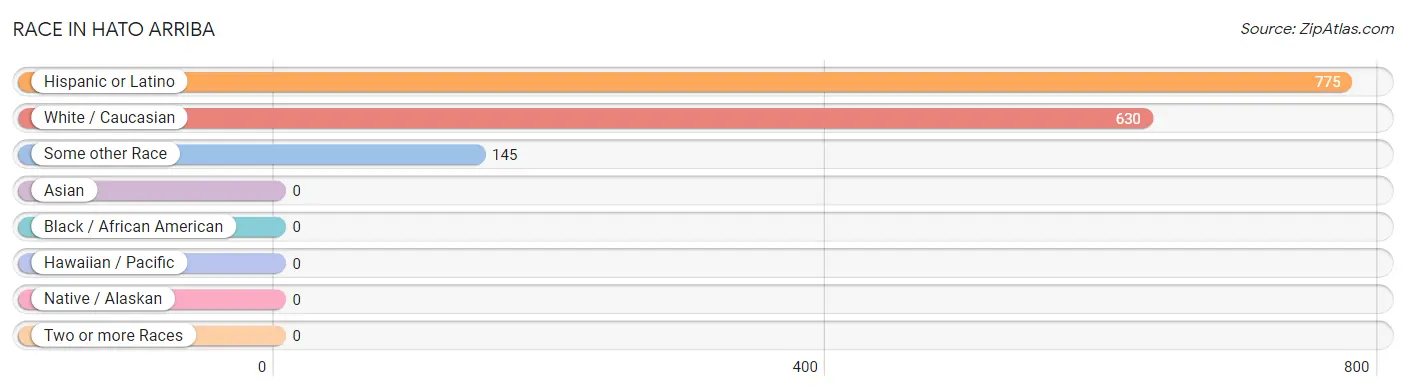
Race in Hato Arriba
The most populous races in Hato Arriba are Hispanic or Latino (775 | 100.0%), White / Caucasian (630 | 81.3%), and Some other Race (145 | 18.7%).
| Race | # Population | % Population |
| Asian | 0 | 0.0% |
| Black / African American | 0 | 0.0% |
| Hawaiian / Pacific | 0 | 0.0% |
| Hispanic or Latino | 775 | 100.0% |
| Native / Alaskan | 0 | 0.0% |
| White / Caucasian | 630 | 81.3% |
| Two or more Races | 0 | 0.0% |
| Some other Race | 145 | 18.7% |
| Total | 775 | 100.0% |
Ancestry in Hato Arriba
The most populous ancestries reported in Hato Arriba are , and Puerto Rican (775 | 100.0%), together accounting for 100.0% of all Hato Arriba residents.

| Ancestry | # Population | % Population |
| Puerto Rican | 775 | 100.0% | View All 1 Rows |
Immigrants in Hato Arriba

| Immigration Origin | # Population | % Population | View All 0 Rows |
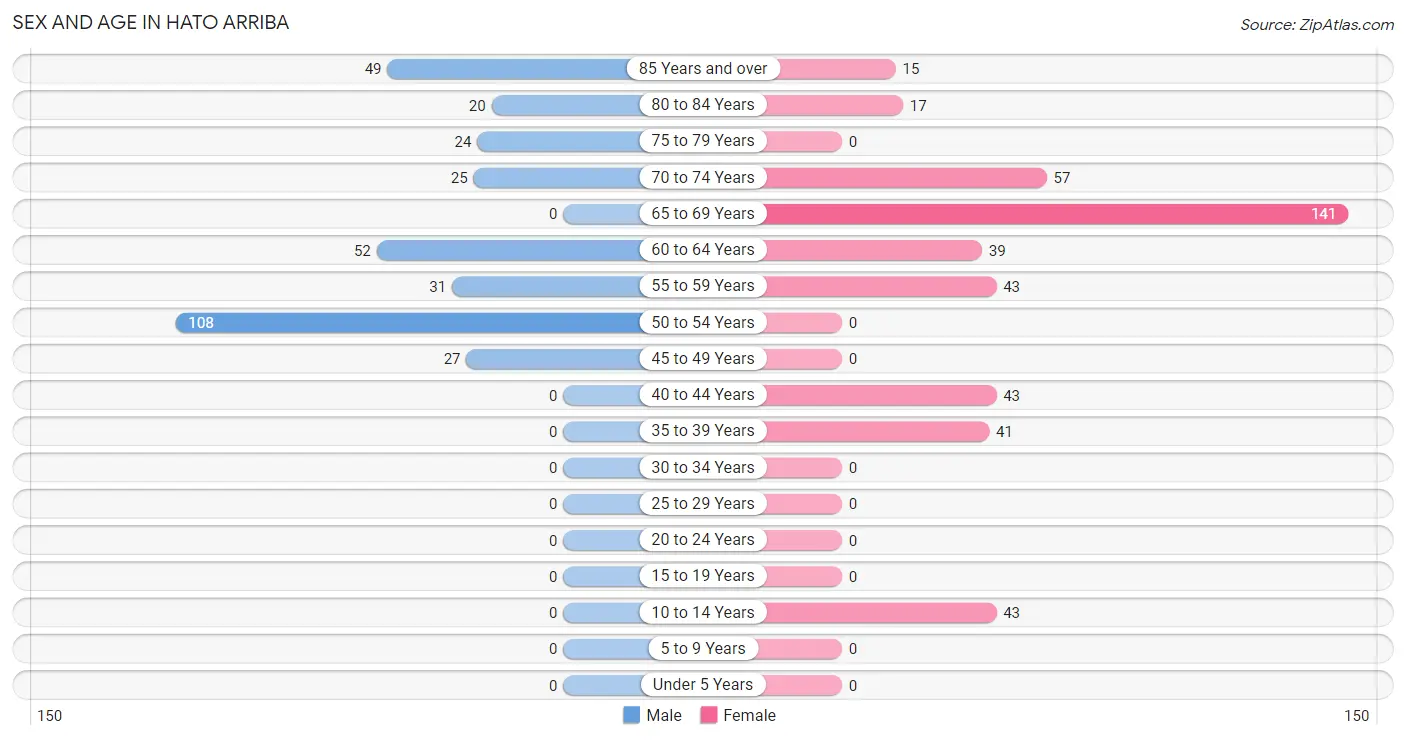
Sex and Age in Hato Arriba
Sex and Age in Hato Arriba
The most populous age groups in Hato Arriba are 50 to 54 Years (108 | 32.1%) for men and 65 to 69 Years (141 | 32.1%) for women.
| Age Bracket | Male | Female |
| Under 5 Years | 0 (0.0%) | 0 (0.0%) |
| 5 to 9 Years | 0 (0.0%) | 0 (0.0%) |
| 10 to 14 Years | 0 (0.0%) | 43 (9.8%) |
| 15 to 19 Years | 0 (0.0%) | 0 (0.0%) |
| 20 to 24 Years | 0 (0.0%) | 0 (0.0%) |
| 25 to 29 Years | 0 (0.0%) | 0 (0.0%) |
| 30 to 34 Years | 0 (0.0%) | 0 (0.0%) |
| 35 to 39 Years | 0 (0.0%) | 41 (9.3%) |
| 40 to 44 Years | 0 (0.0%) | 43 (9.8%) |
| 45 to 49 Years | 27 (8.0%) | 0 (0.0%) |
| 50 to 54 Years | 108 (32.1%) | 0 (0.0%) |
| 55 to 59 Years | 31 (9.2%) | 43 (9.8%) |
| 60 to 64 Years | 52 (15.5%) | 39 (8.9%) |
| 65 to 69 Years | 0 (0.0%) | 141 (32.1%) |
| 70 to 74 Years | 25 (7.4%) | 57 (13.0%) |
| 75 to 79 Years | 24 (7.1%) | 0 (0.0%) |
| 80 to 84 Years | 20 (5.9%) | 17 (3.9%) |
| 85 Years and over | 49 (14.6%) | 15 (3.4%) |
| Total | 336 (100.0%) | 439 (100.0%) |
Families and Households in Hato Arriba
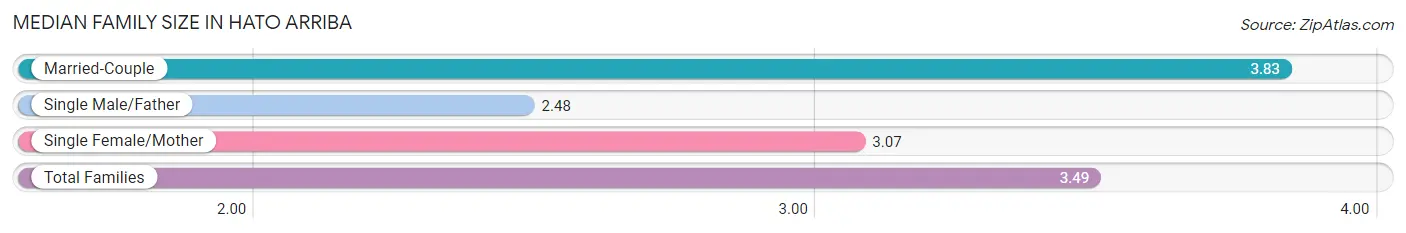
Median Family Size in Hato Arriba
The median family size in Hato Arriba is 3.49 persons per family, with married-couple families (104 | 70.3%) accounting for the largest median family size of 3.83 persons per family. On the other hand, single male/father families (29 | 19.6%) represent the smallest median family size with 2.48 persons per family.
| Family Type | # Families | Family Size |
| Married-Couple | 104 (70.3%) | 3.83 |
| Single Male/Father | 29 (19.6%) | 2.48 |
| Single Female/Mother | 15 (10.1%) | 3.07 |
| Total Families | 148 (100.0%) | 3.49 |
Median Household Size in Hato Arriba
The median household size in Hato Arriba is 2.22 persons per household, with single male/father households (29 | 8.3%) accounting for the largest median household size of 3.9 persons per household. non-family households (201 | 57.6%) represent the smallest median household size with 1.08 persons per household.
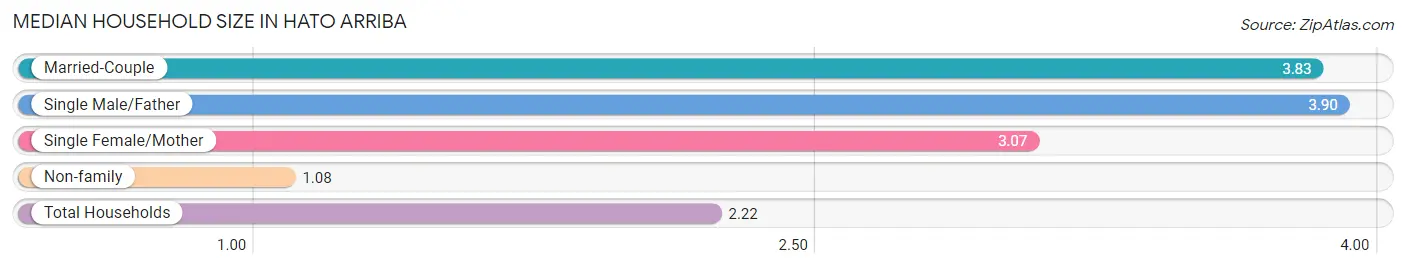
| Household Type | # Households | Household Size |
| Married-Couple | 104 (29.8%) | 3.83 |
| Single Male/Father | 29 (8.3%) | 3.90 |
| Single Female/Mother | 15 (4.3%) | 3.07 |
| Non-family | 201 (57.6%) | 1.08 |
| Total Households | 349 (100.0%) | 2.22 |
Household Size by Marriage Status in Hato Arriba
Out of a total of 349 households in Hato Arriba, 148 (42.4%) are family households, while 201 (57.6%) are nonfamily households. The most numerous type of family households are 3-person households, comprising 92, and the most common type of nonfamily households are 1-person households, comprising 177.
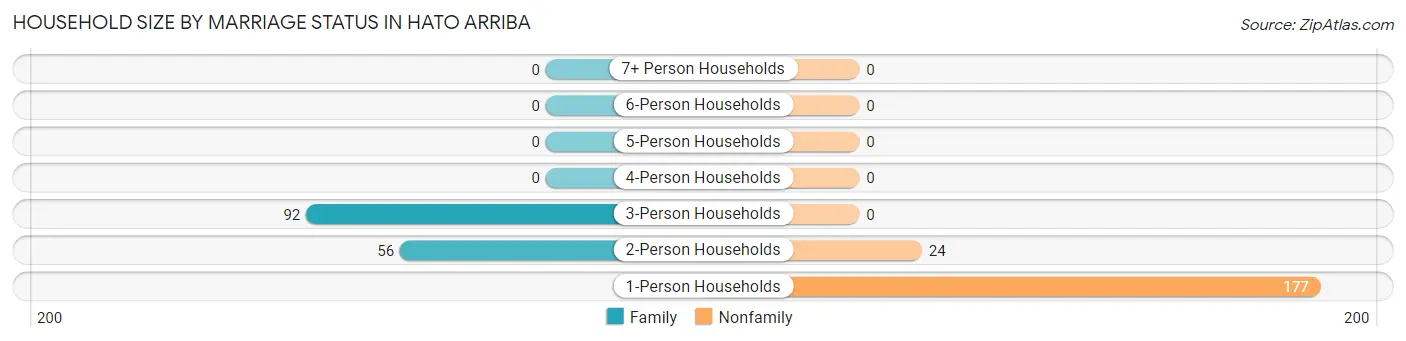
| Household Size | Family Households | Nonfamily Households |
| 1-Person Households | - | 177 (50.7%) |
| 2-Person Households | 56 (16.1%) | 24 (6.9%) |
| 3-Person Households | 92 (26.4%) | 0 (0.0%) |
| 4-Person Households | 0 (0.0%) | 0 (0.0%) |
| 5-Person Households | 0 (0.0%) | 0 (0.0%) |
| 6-Person Households | 0 (0.0%) | 0 (0.0%) |
| 7+ Person Households | 0 (0.0%) | 0 (0.0%) |
| Total | 148 (42.4%) | 201 (57.6%) |
Female Fertility in Hato Arriba
Fertility by Age in Hato Arriba
| Age Bracket | Women with Births | Births / 1,000 Women |
| 15 to 19 years | 0 (0.0%) | 0.0 |
| 20 to 34 years | 0 (0.0%) | 0.0 |
| 35 to 50 years | 0 (0.0%) | 0.0 |
| Total | 0 (0.0%) | 0.0 |
Fertility by Age by Marriage Status in Hato Arriba
| Age Bracket | Married | Unmarried |
| 15 to 19 years | 0 (0.0%) | 0 (0.0%) |
| 20 to 34 years | 0 (0.0%) | 0 (0.0%) |
| 35 to 50 years | 0 (0.0%) | 0 (0.0%) |
| Total | 0 (0.0%) | 0 (0.0%) |
Fertility by Education in Hato Arriba
| Educational Attainment | Women with Births | Births / 1,000 Women |
| Less than High School | 0 (0.0%) | 0.0 |
| High School Diploma | 0 (0.0%) | 0.0 |
| College or Associate's Degree | 0 (0.0%) | 0.0 |
| Bachelor's Degree | 0 (0.0%) | 0.0 |
| Graduate Degree | 0 (0.0%) | 0.0 |
| Total | 0 (0.0%) | 0.0 |
Fertility by Education by Marriage Status in Hato Arriba
| Educational Attainment | Married | Unmarried |
| Less than High School | 0 (0.0%) | 0 (0.0%) |
| High School Diploma | 0 (0.0%) | 0 (0.0%) |
| College or Associate's Degree | 0 (0.0%) | 0 (0.0%) |
| Bachelor's Degree | 0 (0.0%) | 0 (0.0%) |
| Graduate Degree | 0 (0.0%) | 0 (0.0%) |
| Total | 0 (0.0%) | 0 (0.0%) |
Income in Hato Arriba
Income Overview in Hato Arriba
Per Capita Income in Hato Arriba is $7,211, while median incomes of families and households are $13,846 and $13,598 respectively.
| Characteristic | Number | Measure |
| Per Capita Income | 775 | $7,211 |
| Median Family Income | 148 | $13,846 |
| Mean Family Income | 148 | $15,378 |
| Median Household Income | 349 | $13,598 |
| Mean Household Income | 349 | $13,948 |
| Income Deficit | 148 | $0 |
| Wage / Income Gap (%) | 775 | 0.00% |
| Wage / Income Gap ($) | 775 | 100.00¢ per $1 |
| Gini / Inequality Index | 775 | 0.25 |
Earnings by Sex in Hato Arriba
| Sex | Number | Average Earnings |
| Male | 58 (75.3%) | $0 |
| Female | 19 (24.7%) | $0 |
| Total | 77 (100.0%) | $0 |
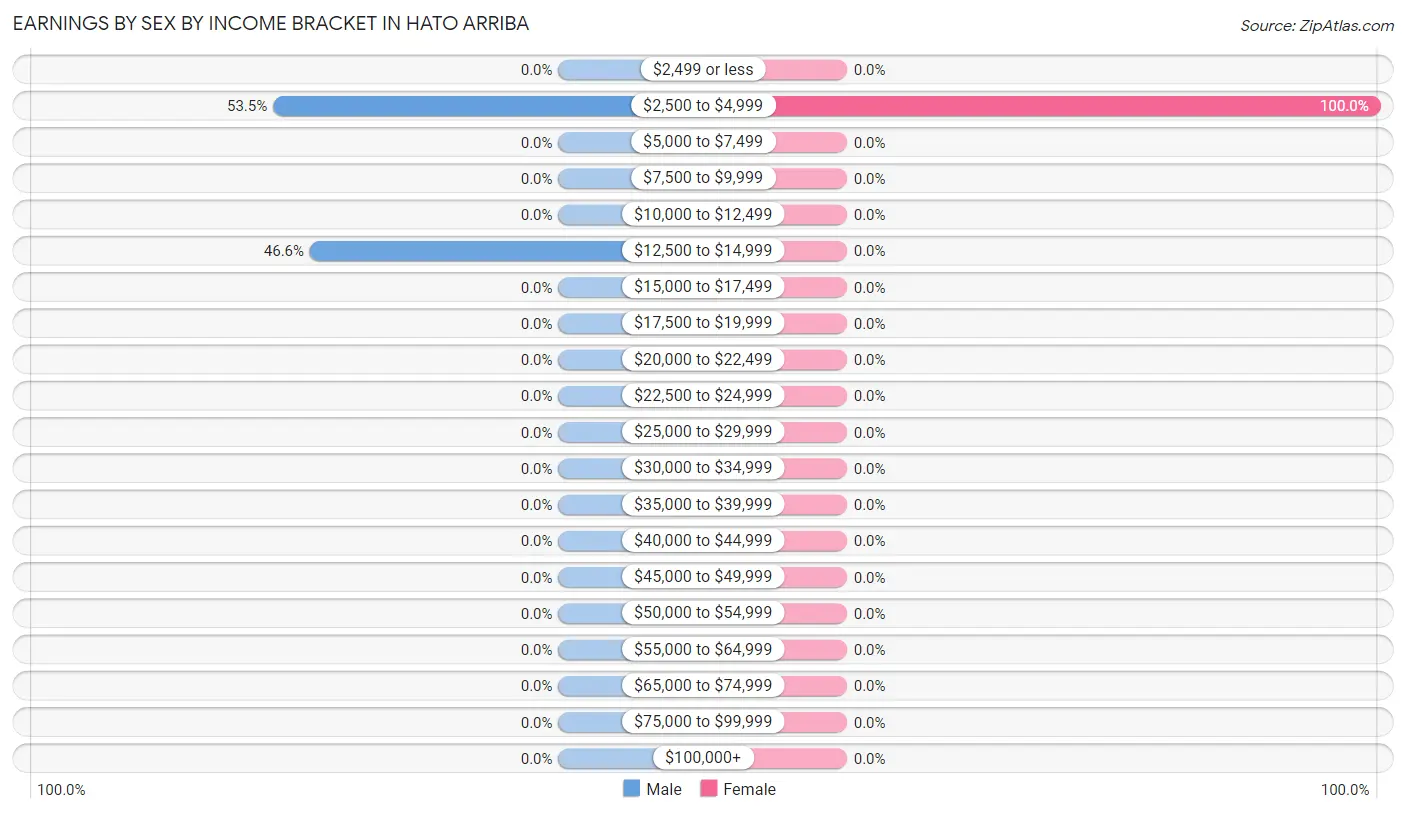
Earnings by Sex by Income Bracket in Hato Arriba
The most common earnings brackets in Hato Arriba are $2,500 to $4,999 for men (31 | 53.4%) and $2,500 to $4,999 for women (19 | 100.0%).
| Income | Male | Female |
| $2,499 or less | 0 (0.0%) | 0 (0.0%) |
| $2,500 to $4,999 | 31 (53.4%) | 19 (100.0%) |
| $5,000 to $7,499 | 0 (0.0%) | 0 (0.0%) |
| $7,500 to $9,999 | 0 (0.0%) | 0 (0.0%) |
| $10,000 to $12,499 | 0 (0.0%) | 0 (0.0%) |
| $12,500 to $14,999 | 27 (46.6%) | 0 (0.0%) |
| $15,000 to $17,499 | 0 (0.0%) | 0 (0.0%) |
| $17,500 to $19,999 | 0 (0.0%) | 0 (0.0%) |
| $20,000 to $22,499 | 0 (0.0%) | 0 (0.0%) |
| $22,500 to $24,999 | 0 (0.0%) | 0 (0.0%) |
| $25,000 to $29,999 | 0 (0.0%) | 0 (0.0%) |
| $30,000 to $34,999 | 0 (0.0%) | 0 (0.0%) |
| $35,000 to $39,999 | 0 (0.0%) | 0 (0.0%) |
| $40,000 to $44,999 | 0 (0.0%) | 0 (0.0%) |
| $45,000 to $49,999 | 0 (0.0%) | 0 (0.0%) |
| $50,000 to $54,999 | 0 (0.0%) | 0 (0.0%) |
| $55,000 to $64,999 | 0 (0.0%) | 0 (0.0%) |
| $65,000 to $74,999 | 0 (0.0%) | 0 (0.0%) |
| $75,000 to $99,999 | 0 (0.0%) | 0 (0.0%) |
| $100,000+ | 0 (0.0%) | 0 (0.0%) |
| Total | 58 (100.0%) | 19 (100.0%) |
Earnings by Sex by Educational Attainment in Hato Arriba
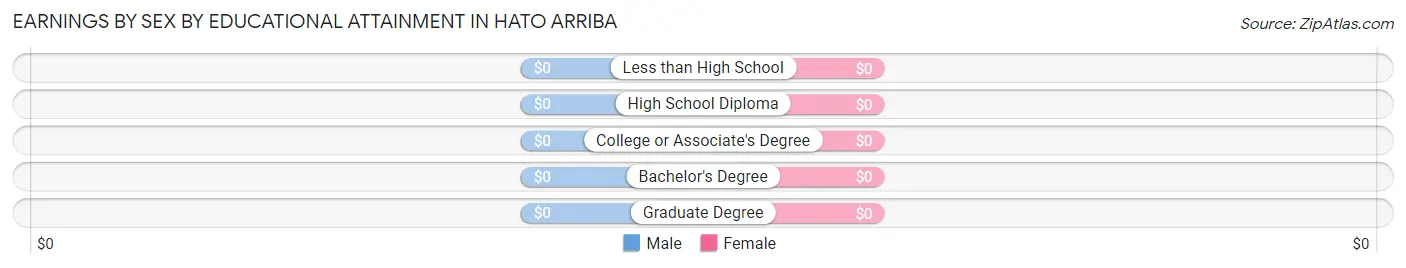
| Educational Attainment | Male Income | Female Income |
| Less than High School | - | - |
| High School Diploma | - | - |
| College or Associate's Degree | - | - |
| Bachelor's Degree | - | - |
| Graduate Degree | - | - |
| Total | - | - |
Family Income in Hato Arriba
Family Income Brackets in Hato Arriba
According to the Hato Arriba family income data, there are 65 families falling into the $10,000 to $14,999 income range, which is the most common income bracket and makes up 43.9% of all families.
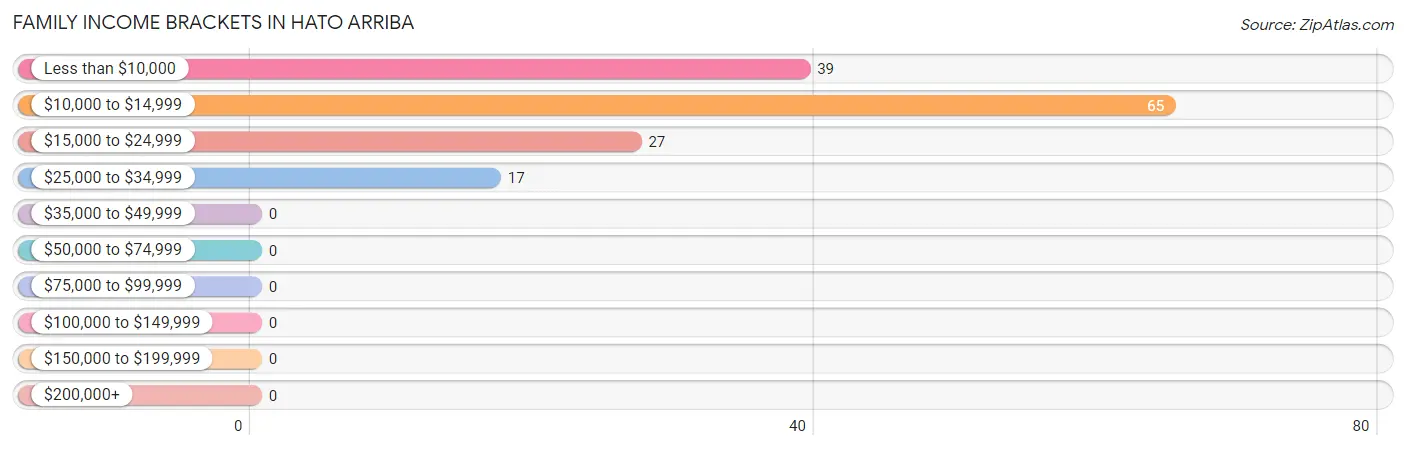
| Income Bracket | # Families | % Families |
| Less than $10,000 | 39 | 26.4% |
| $10,000 to $14,999 | 65 | 43.9% |
| $15,000 to $24,999 | 27 | 18.2% |
| $25,000 to $34,999 | 17 | 11.5% |
| $35,000 to $49,999 | 0 | 0.0% |
| $50,000 to $74,999 | 0 | 0.0% |
| $75,000 to $99,999 | 0 | 0.0% |
| $100,000 to $149,999 | 0 | 0.0% |
| $150,000 to $199,999 | 0 | 0.0% |
| $200,000+ | 0 | 0.0% |
Family Income by Famaliy Size in Hato Arriba
2-person families (85 | 57.4%) account for the highest median family income in Hato Arriba with $12,802 per family, while 2-person families (85 | 57.4%) have the highest median income of $6,401 per family member.
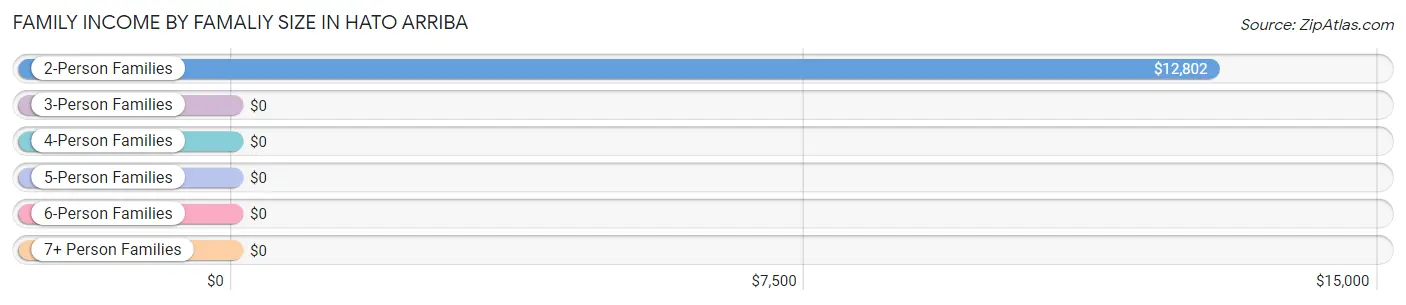
| Income Bracket | # Families | Median Income |
| 2-Person Families | 85 (57.4%) | $12,802 |
| 3-Person Families | 63 (42.6%) | $0 |
| 4-Person Families | 0 (0.0%) | $0 |
| 5-Person Families | 0 (0.0%) | $0 |
| 6-Person Families | 0 (0.0%) | $0 |
| 7+ Person Families | 0 (0.0%) | $0 |
| Total | 148 (100.0%) | $13,846 |
Family Income by Number of Earners in Hato Arriba
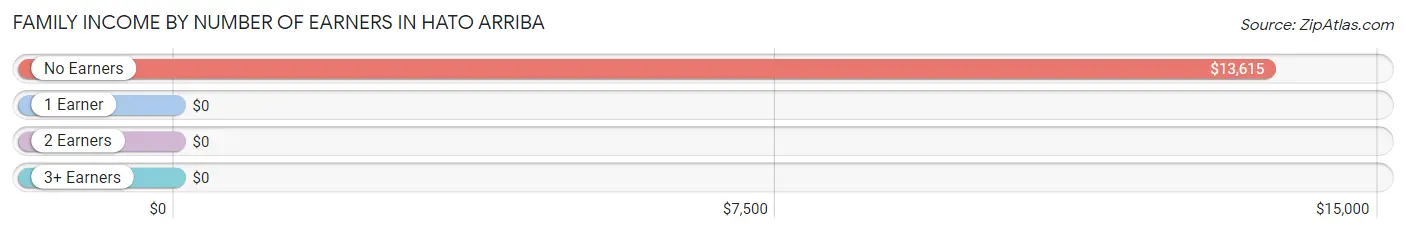
| Number of Earners | # Families | Median Income |
| No Earners | 106 (71.6%) | $13,615 |
| 1 Earner | 42 (28.4%) | $0 |
| 2 Earners | 0 (0.0%) | $0 |
| 3+ Earners | 0 (0.0%) | $0 |
| Total | 148 (100.0%) | $13,846 |
Household Income in Hato Arriba
Household Income Brackets in Hato Arriba
With 180 households falling in the category, the $10,000 to $14,999 income range is the most frequent in Hato Arriba, accounting for 51.6% of all households.
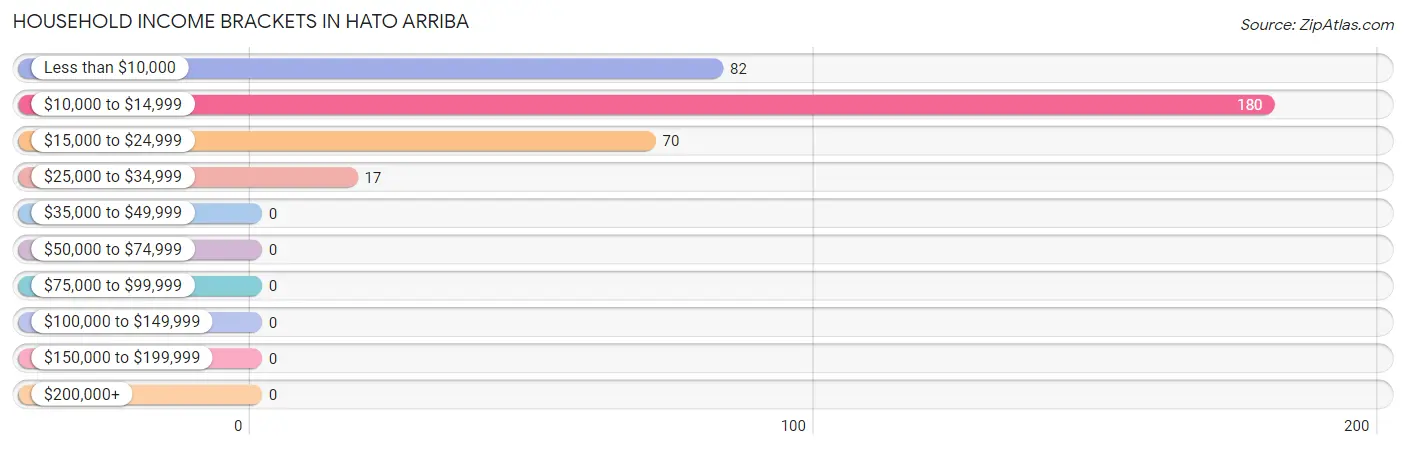
| Income Bracket | # Households | % Households |
| Less than $10,000 | 82 | 23.5% |
| $10,000 to $14,999 | 180 | 51.6% |
| $15,000 to $24,999 | 70 | 20.1% |
| $25,000 to $34,999 | 17 | 4.9% |
| $35,000 to $49,999 | 0 | 0.0% |
| $50,000 to $74,999 | 0 | 0.0% |
| $75,000 to $99,999 | 0 | 0.0% |
| $100,000 to $149,999 | 0 | 0.0% |
| $150,000 to $199,999 | 0 | 0.0% |
| $200,000+ | 0 | 0.0% |
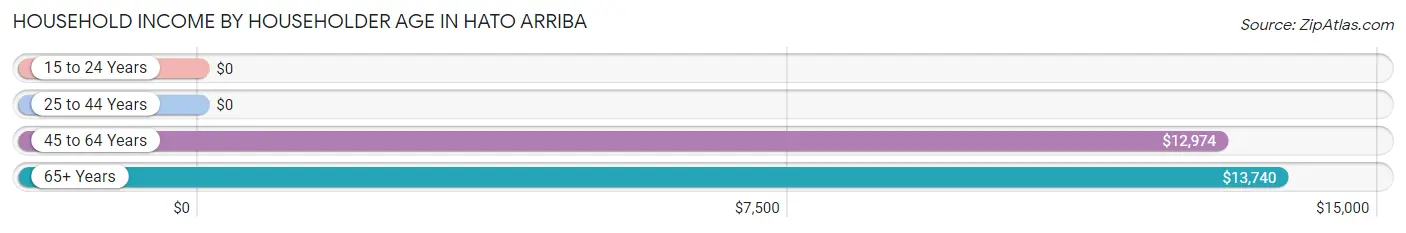
Household Income by Householder Age in Hato Arriba
The median household income in Hato Arriba is $13,598, with the highest median household income of $13,740 found in the 65+ years age bracket for the primary householder. A total of 204 households (58.5%) fall into this category.
| Income Bracket | # Households | Median Income |
| 15 to 24 Years | 0 (0.0%) | $0 |
| 25 to 44 Years | 0 (0.0%) | $0 |
| 45 to 64 Years | 145 (41.5%) | $12,974 |
| 65+ Years | 204 (58.5%) | $13,740 |
| Total | 349 (100.0%) | $13,598 |
Poverty in Hato Arriba
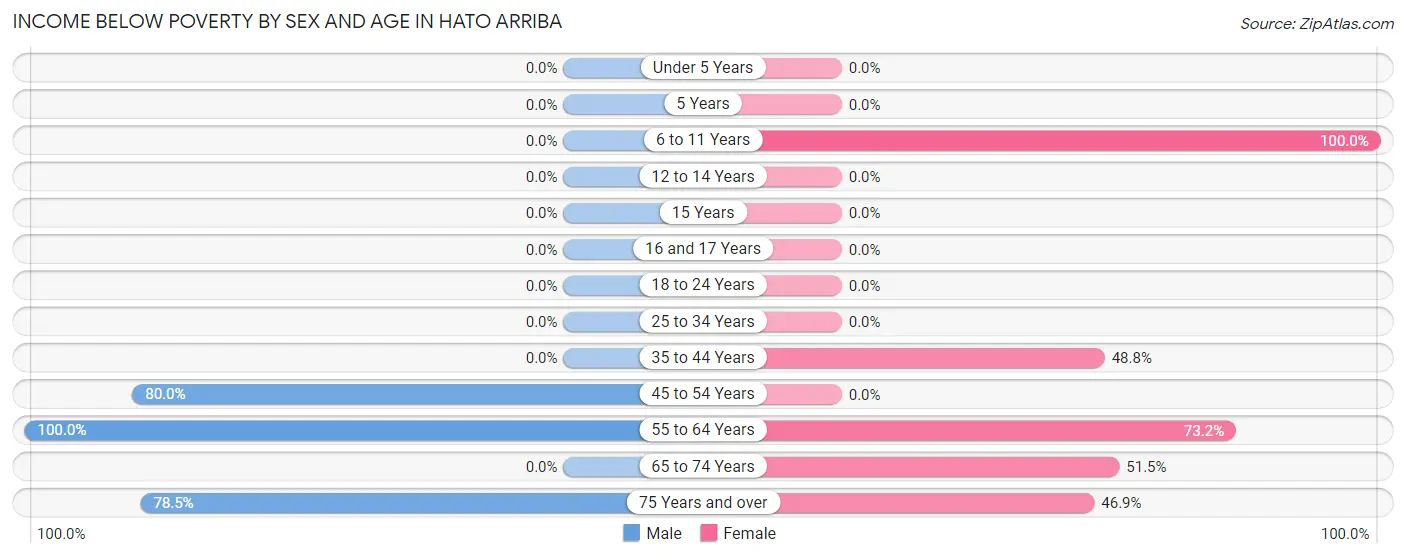
Income Below Poverty by Sex and Age in Hato Arriba
With 78.6% poverty level for males and 59.5% for females among the residents of Hato Arriba, 55 to 64 year old males and 6 to 11 year old females are the most vulnerable to poverty, with 83 males (100.0%) and 43 females (100.0%) in their respective age groups living below the poverty level.
| Age Bracket | Male | Female |
| Under 5 Years | 0 (0.0%) | 0 (0.0%) |
| 5 Years | 0 (0.0%) | 0 (0.0%) |
| 6 to 11 Years | 0 (0.0%) | 43 (100.0%) |
| 12 to 14 Years | 0 (0.0%) | 0 (0.0%) |
| 15 Years | 0 (0.0%) | 0 (0.0%) |
| 16 and 17 Years | 0 (0.0%) | 0 (0.0%) |
| 18 to 24 Years | 0 (0.0%) | 0 (0.0%) |
| 25 to 34 Years | 0 (0.0%) | 0 (0.0%) |
| 35 to 44 Years | 0 (0.0%) | 41 (48.8%) |
| 45 to 54 Years | 108 (80.0%) | 0 (0.0%) |
| 55 to 64 Years | 83 (100.0%) | 60 (73.2%) |
| 65 to 74 Years | 0 (0.0%) | 102 (51.5%) |
| 75 Years and over | 73 (78.5%) | 15 (46.9%) |
| Total | 264 (78.6%) | 261 (59.5%) |
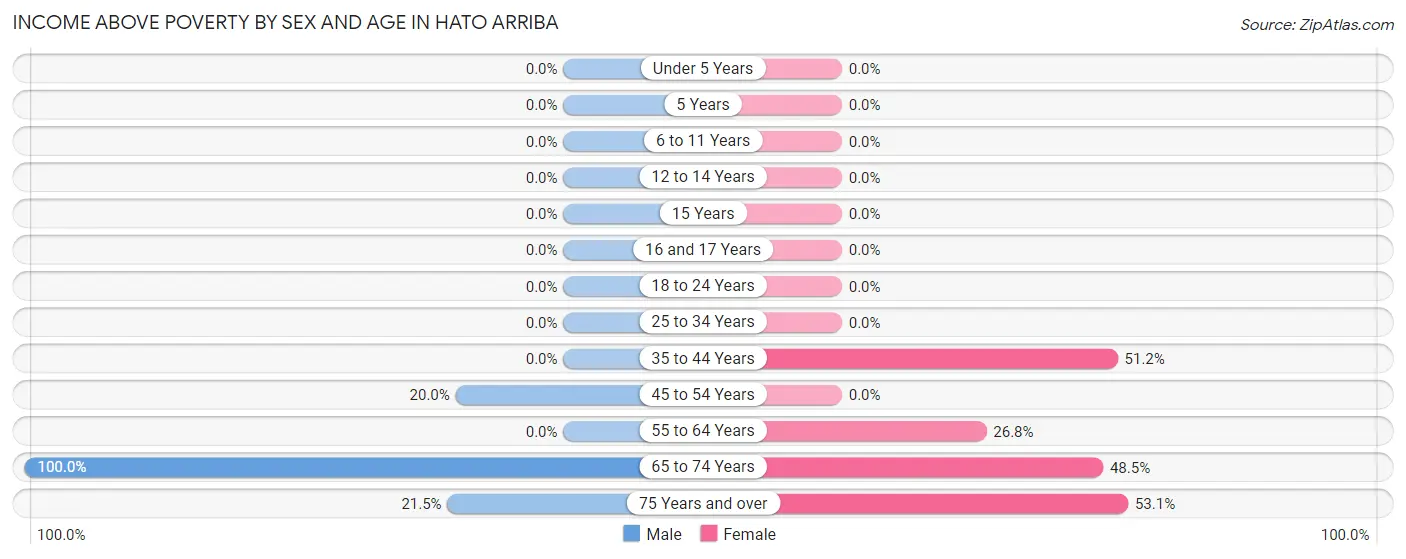
Income Above Poverty by Sex and Age in Hato Arriba
According to the poverty statistics in Hato Arriba, males aged 65 to 74 years and females aged 75 years and over are the age groups that are most secure financially, with 100.0% of males and 53.1% of females in these age groups living above the poverty line.
| Age Bracket | Male | Female |
| Under 5 Years | 0 (0.0%) | 0 (0.0%) |
| 5 Years | 0 (0.0%) | 0 (0.0%) |
| 6 to 11 Years | 0 (0.0%) | 0 (0.0%) |
| 12 to 14 Years | 0 (0.0%) | 0 (0.0%) |
| 15 Years | 0 (0.0%) | 0 (0.0%) |
| 16 and 17 Years | 0 (0.0%) | 0 (0.0%) |
| 18 to 24 Years | 0 (0.0%) | 0 (0.0%) |
| 25 to 34 Years | 0 (0.0%) | 0 (0.0%) |
| 35 to 44 Years | 0 (0.0%) | 43 (51.2%) |
| 45 to 54 Years | 27 (20.0%) | 0 (0.0%) |
| 55 to 64 Years | 0 (0.0%) | 22 (26.8%) |
| 65 to 74 Years | 25 (100.0%) | 96 (48.5%) |
| 75 Years and over | 20 (21.5%) | 17 (53.1%) |
| Total | 72 (21.4%) | 178 (40.6%) |
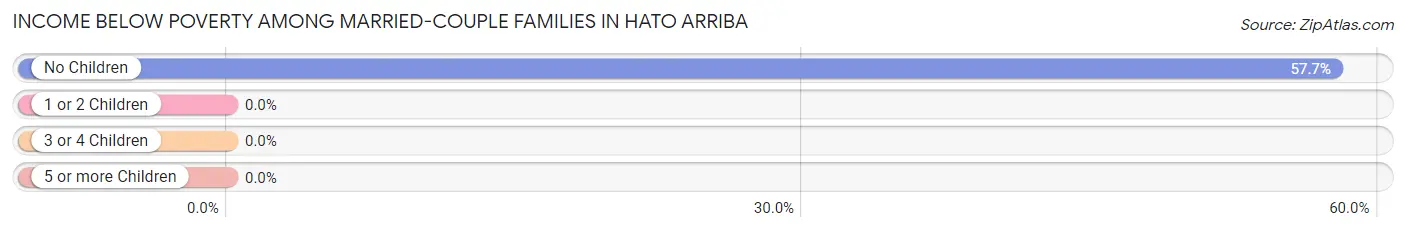
Income Below Poverty Among Married-Couple Families in Hato Arriba
The poverty statistics for married-couple families in Hato Arriba show that 57.7% or 60 of the total 104 families live below the poverty line. Families with no children have the highest poverty rate of 57.7%, comprising of 60 families. On the other hand, families with no children have the lowest poverty rate of 57.7%, which includes 60 families.
| Children | Above Poverty | Below Poverty |
| No Children | 44 (42.3%) | 60 (57.7%) |
| 1 or 2 Children | 0 (0.0%) | 0 (0.0%) |
| 3 or 4 Children | 0 (0.0%) | 0 (0.0%) |
| 5 or more Children | 0 (0.0%) | 0 (0.0%) |
| Total | 44 (42.3%) | 60 (57.7%) |
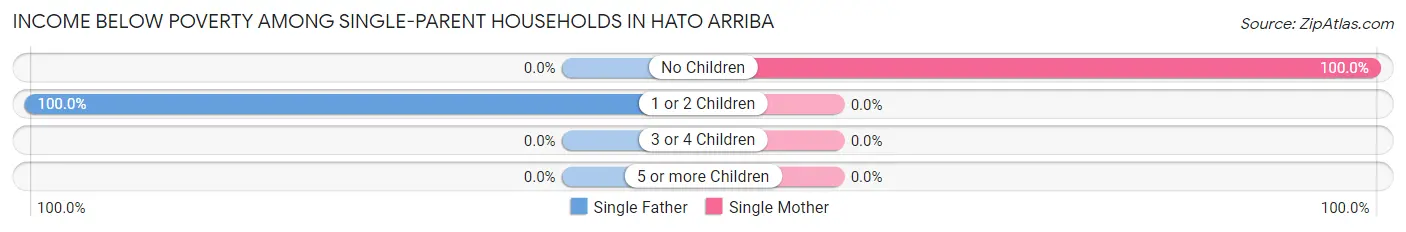
Income Below Poverty Among Single-Parent Households in Hato Arriba
According to the poverty data in Hato Arriba, 100.0% or 29 single-father households and 100.0% or 15 single-mother households are living below the poverty line. Among single-father households, those with 1 or 2 children have the highest poverty rate, with 29 households (100.0%) experiencing poverty. Likewise, among single-mother households, those with no children have the highest poverty rate, with 15 households (100.0%) falling below the poverty line.
| Children | Single Father | Single Mother |
| No Children | 0 (0.0%) | 15 (100.0%) |
| 1 or 2 Children | 29 (100.0%) | 0 (0.0%) |
| 3 or 4 Children | 0 (0.0%) | 0 (0.0%) |
| 5 or more Children | 0 (0.0%) | 0 (0.0%) |
| Total | 29 (100.0%) | 15 (100.0%) |
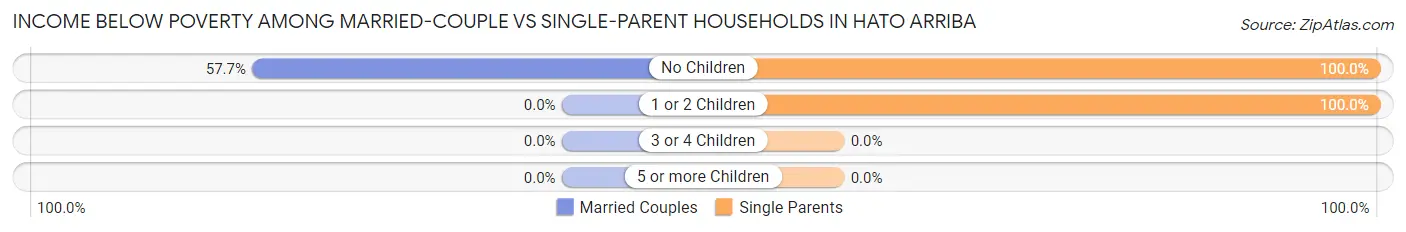
Income Below Poverty Among Married-Couple vs Single-Parent Households in Hato Arriba
The poverty data for Hato Arriba shows that 60 of the married-couple family households (57.7%) and 44 of the single-parent households (100.0%) are living below the poverty level. Within the married-couple family households, those with no children have the highest poverty rate, with 60 households (57.7%) falling below the poverty line. Among the single-parent households, those with no children have the highest poverty rate, with 15 household (100.0%) living below poverty.
| Children | Married-Couple Families | Single-Parent Households |
| No Children | 60 (57.7%) | 15 (100.0%) |
| 1 or 2 Children | 0 (0.0%) | 29 (100.0%) |
| 3 or 4 Children | 0 (0.0%) | 0 (0.0%) |
| 5 or more Children | 0 (0.0%) | 0 (0.0%) |
| Total | 60 (57.7%) | 44 (100.0%) |
Employment Characteristics in Hato Arriba
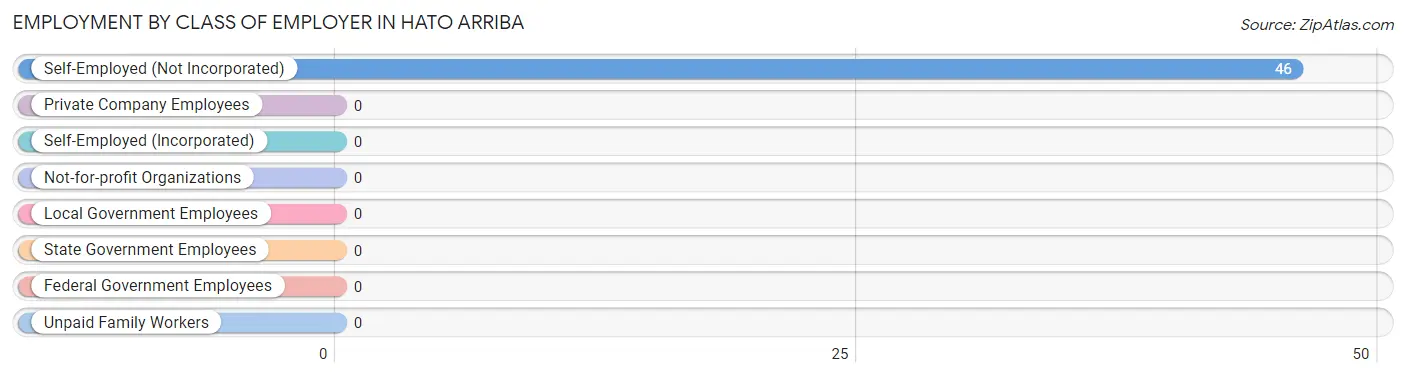
Employment by Class of Employer in Hato Arriba
Among the 46 employed individuals in Hato Arriba, , and self-employed (not incorporated) (46 | 100.0%) make up the most common classes of employment.
| Employer Class | # Employees | % Employees |
| Private Company Employees | 0 | 0.0% |
| Self-Employed (Incorporated) | 0 | 0.0% |
| Self-Employed (Not Incorporated) | 46 | 100.0% |
| Not-for-profit Organizations | 0 | 0.0% |
| Local Government Employees | 0 | 0.0% |
| State Government Employees | 0 | 0.0% |
| Federal Government Employees | 0 | 0.0% |
| Unpaid Family Workers | 0 | 0.0% |
| Total | 46 | 100.0% |
Employment Status by Age in Hato Arriba
According to the labor force statistics for Hato Arriba, out of the total population over 16 years of age (732), 10.5% or 77 individuals are in the labor force, with 40.3% or 31 of them unemployed. The age group with the highest labor force participation rate is 55 to 59 years, with 67.6% or 50 individuals in the labor force. Within the labor force, the 55 to 59 years age range has the highest percentage of unemployed individuals, with 62.0% or 31 of them being unemployed.
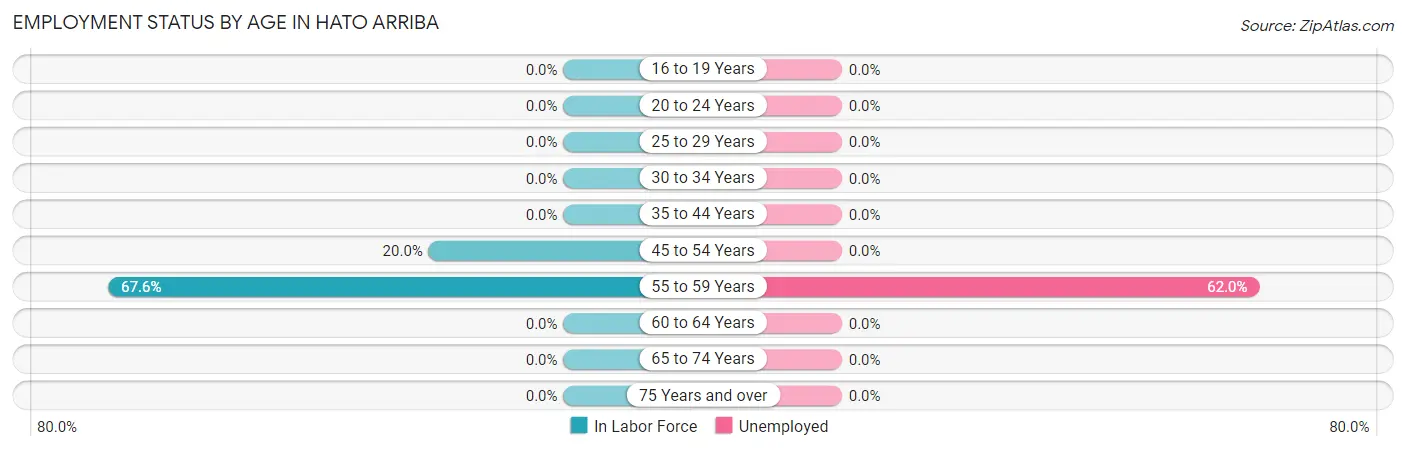
| Age Bracket | In Labor Force | Unemployed |
| 16 to 19 Years | 0 (0.0%) | 0 (0.0%) |
| 20 to 24 Years | 0 (0.0%) | 0 (0.0%) |
| 25 to 29 Years | 0 (0.0%) | 0 (0.0%) |
| 30 to 34 Years | 0 (0.0%) | 0 (0.0%) |
| 35 to 44 Years | 0 (0.0%) | 0 (0.0%) |
| 45 to 54 Years | 27 (20.0%) | 0 (0.0%) |
| 55 to 59 Years | 50 (67.6%) | 31 (62.0%) |
| 60 to 64 Years | 0 (0.0%) | 0 (0.0%) |
| 65 to 74 Years | 0 (0.0%) | 0 (0.0%) |
| 75 Years and over | 0 (0.0%) | 0 (0.0%) |
| Total | 77 (10.5%) | 31 (40.3%) |
Employment Status by Educational Attainment in Hato Arriba
According to labor force statistics for Hato Arriba, 20.1% of individuals (77) out of the total population between 25 and 64 years of age (384) are in the labor force, with 40.3% or 31 of them being unemployed. The group with the highest labor force participation rate are those with the educational attainment of less than high school, with 30.7% or 58 individuals in the labor force. Within the labor force, individuals with less than high school education have the highest percentage of unemployment, with 53.4% or 31 of them being unemployed.
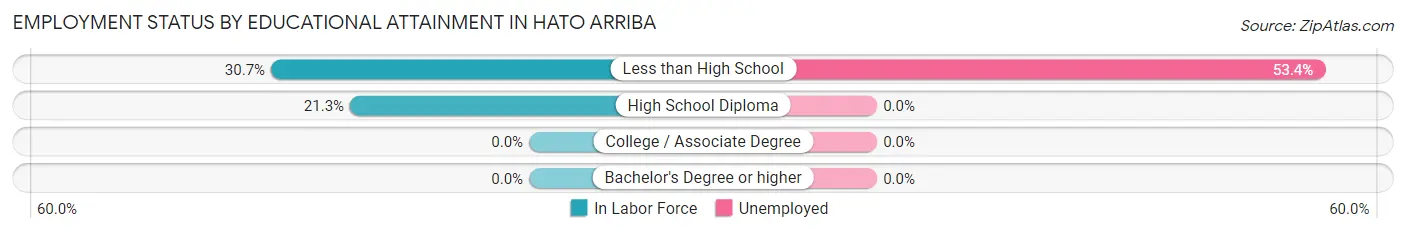
| Educational Attainment | In Labor Force | Unemployed |
| Less than High School | 58 (30.7%) | 101 (53.4%) |
| High School Diploma | 19 (21.3%) | 0 (0.0%) |
| College / Associate Degree | 0 (0.0%) | 0 (0.0%) |
| Bachelor's Degree or higher | 0 (0.0%) | 0 (0.0%) |
| Total | 77 (20.1%) | 155 (40.3%) |
Employment Occupations by Sex in Hato Arriba
Management, Business, Science and Arts Occupations
Management, Business, Science and Arts Occupations by Sex
| Occupation | Male | Female |
| Management | 0 (0.0%) | 0 (0.0%) |
| Business & Financial | 0 (0.0%) | 0 (0.0%) |
| Computers, Engineering & Science | 0 (0.0%) | 0 (0.0%) |
| Computers & Mathematics | 0 (0.0%) | 0 (0.0%) |
| Architecture & Engineering | 0 (0.0%) | 0 (0.0%) |
| Life, Physical & Social Science | 0 (0.0%) | 0 (0.0%) |
| Community & Social Service | 0 (0.0%) | 0 (0.0%) |
| Education, Arts & Media | 0 (0.0%) | 0 (0.0%) |
| Legal Services & Support | 0 (0.0%) | 0 (0.0%) |
| Education Instruction & Library | 0 (0.0%) | 0 (0.0%) |
| Arts, Media & Entertainment | 0 (0.0%) | 0 (0.0%) |
| Health Diagnosing & Treating | 0 (0.0%) | 0 (0.0%) |
| Health Technologists | 0 (0.0%) | 0 (0.0%) |
| Total (Category) | 0 (0.0%) | 0 (0.0%) |
| Total (Overall) | 27 (58.7%) | 19 (41.3%) |
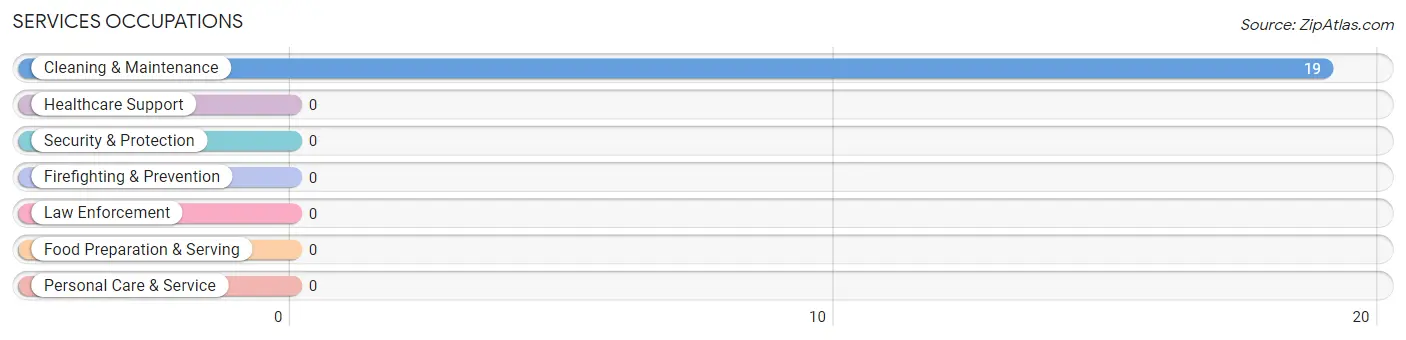
Services Occupations
The most common Services occupations in Hato Arriba are , and Cleaning & Maintenance (19 | 41.3%).
Services Occupations by Sex
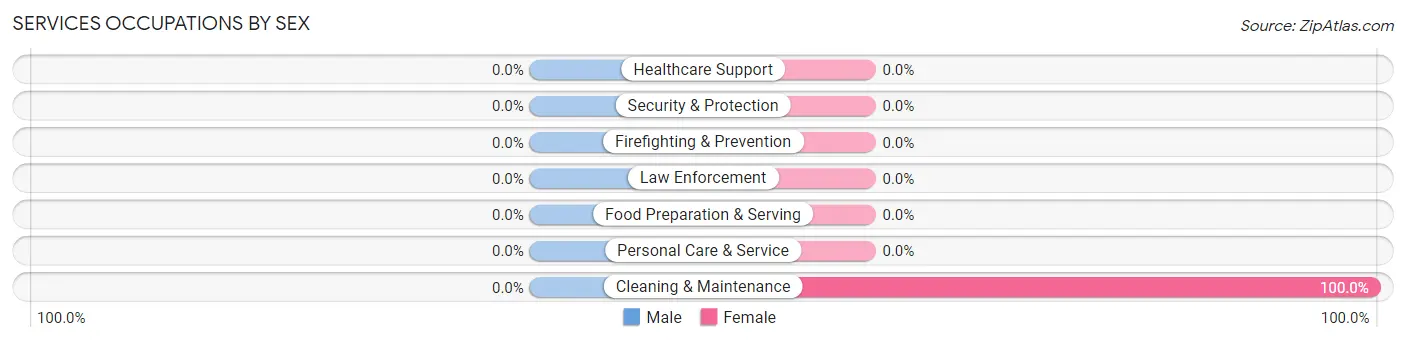
| Occupation | Male | Female |
| Healthcare Support | 0 (0.0%) | 0 (0.0%) |
| Security & Protection | 0 (0.0%) | 0 (0.0%) |
| Firefighting & Prevention | 0 (0.0%) | 0 (0.0%) |
| Law Enforcement | 0 (0.0%) | 0 (0.0%) |
| Food Preparation & Serving | 0 (0.0%) | 0 (0.0%) |
| Cleaning & Maintenance | 0 (0.0%) | 19 (100.0%) |
| Personal Care & Service | 0 (0.0%) | 0 (0.0%) |
| Total (Category) | 0 (0.0%) | 19 (100.0%) |
| Total (Overall) | 27 (58.7%) | 19 (41.3%) |
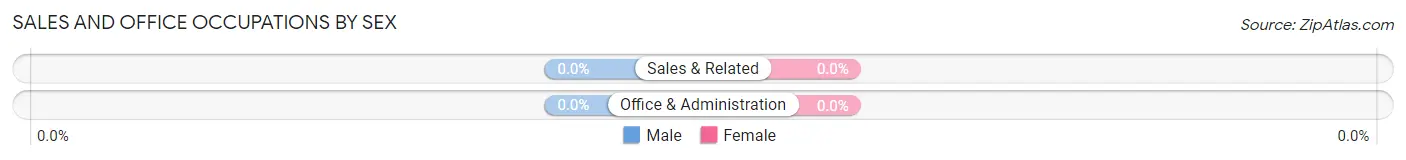
Sales and Office Occupations
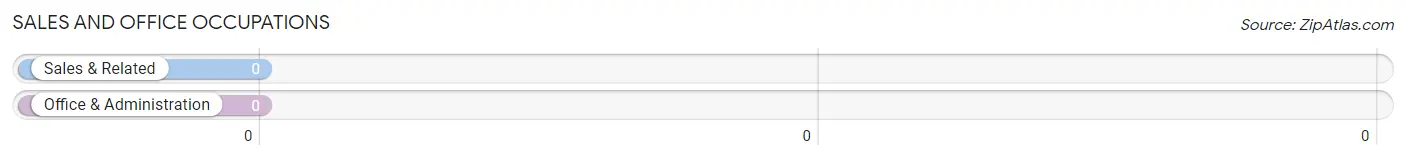
Sales and Office Occupations by Sex
| Occupation | Male | Female |
| Sales & Related | 0 (0.0%) | 0 (0.0%) |
| Office & Administration | 0 (0.0%) | 0 (0.0%) |
| Total (Category) | 0 (0.0%) | 0 (0.0%) |
| Total (Overall) | 27 (58.7%) | 19 (41.3%) |
Natural Resources, Construction and Maintenance Occupations
Natural Resources, Construction and Maintenance Occupations by Sex
| Occupation | Male | Female |
| Farming, Fishing & Forestry | 0 (0.0%) | 0 (0.0%) |
| Construction & Extraction | 0 (0.0%) | 0 (0.0%) |
| Installation, Maintenance & Repair | 0 (0.0%) | 0 (0.0%) |
| Total (Category) | 0 (0.0%) | 0 (0.0%) |
| Total (Overall) | 27 (58.7%) | 19 (41.3%) |
Production, Transportation and Moving Occupations
The most common Production, Transportation and Moving occupations in Hato Arriba are , and Production (27 | 58.7%).
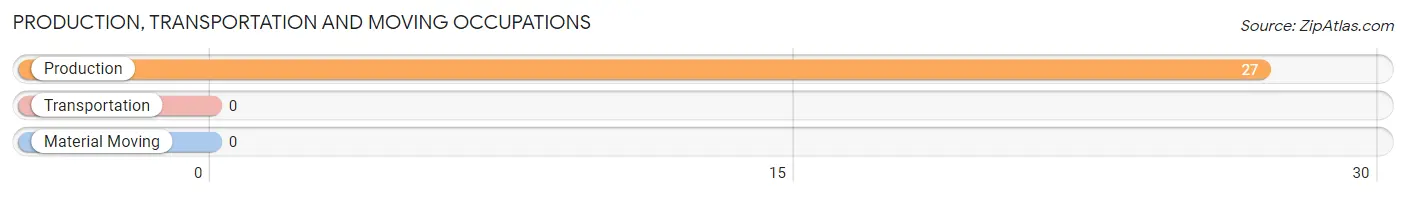
Production, Transportation and Moving Occupations by Sex
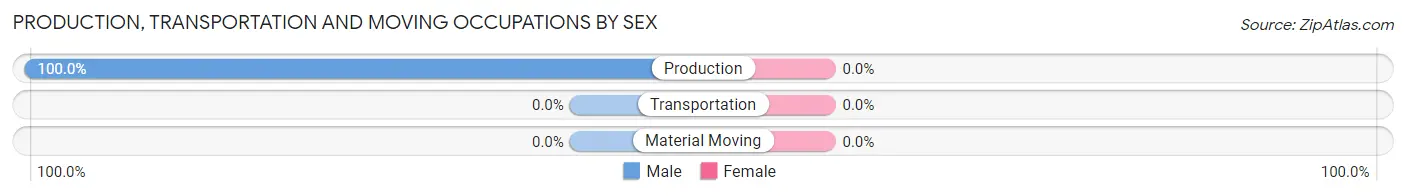
| Occupation | Male | Female |
| Production | 27 (100.0%) | 0 (0.0%) |
| Transportation | 0 (0.0%) | 0 (0.0%) |
| Material Moving | 0 (0.0%) | 0 (0.0%) |
| Total (Category) | 27 (100.0%) | 0 (0.0%) |
| Total (Overall) | 27 (58.7%) | 19 (41.3%) |
Employment Industries by Sex in Hato Arriba
Employment Industries in Hato Arriba
Employment Industries by Sex in Hato Arriba
| Industry | Male | Female |
| Agriculture, Fishing & Hunting | 0 (0.0%) | 0 (0.0%) |
| Mining, Quarrying, & Extraction | 0 (0.0%) | 0 (0.0%) |
| Construction | 0 (0.0%) | 0 (0.0%) |
| Manufacturing | 0 (0.0%) | 0 (0.0%) |
| Wholesale Trade | 0 (0.0%) | 0 (0.0%) |
| Retail Trade | 0 (0.0%) | 0 (0.0%) |
| Transportation & Warehousing | 0 (0.0%) | 0 (0.0%) |
| Utilities | 0 (0.0%) | 0 (0.0%) |
| Information | 0 (0.0%) | 0 (0.0%) |
| Finance & Insurance | 0 (0.0%) | 0 (0.0%) |
| Real Estate, Rental & Leasing | 0 (0.0%) | 0 (0.0%) |
| Professional & Scientific | 0 (0.0%) | 0 (0.0%) |
| Enterprise Management | 0 (0.0%) | 0 (0.0%) |
| Administrative & Support | 0 (0.0%) | 0 (0.0%) |
| Educational Services | 0 (0.0%) | 0 (0.0%) |
| Health Care & Social Assistance | 0 (0.0%) | 0 (0.0%) |
| Arts, Entertainment & Recreation | 0 (0.0%) | 0 (0.0%) |
| Accommodation & Food Services | 0 (0.0%) | 0 (0.0%) |
| Public Administration | 0 (0.0%) | 0 (0.0%) |
| Total | 27 (58.7%) | 19 (41.3%) |
Education in Hato Arriba
School Enrollment in Hato Arriba
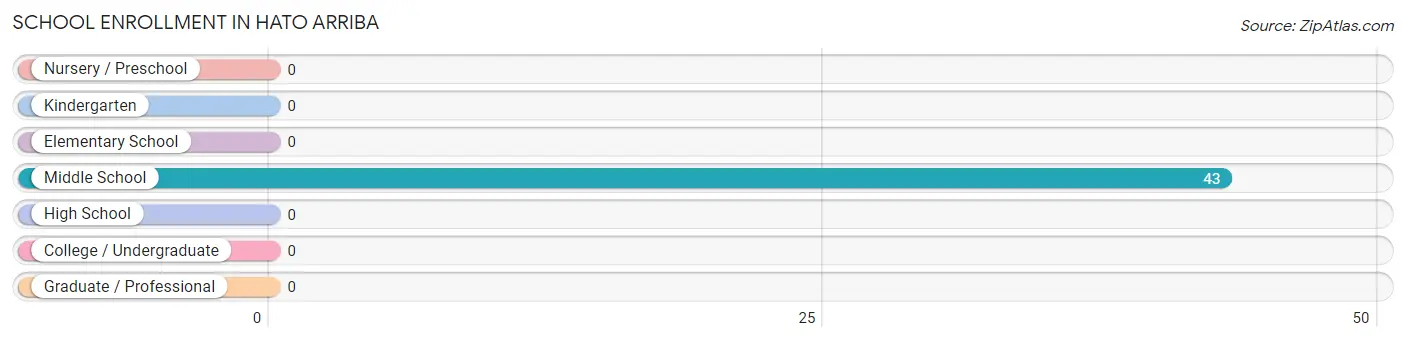
| School Level | # Students | % Students |
| Nursery / Preschool | 0 | 0.0% |
| Kindergarten | 0 | 0.0% |
| Elementary School | 0 | 0.0% |
| Middle School | 43 | 100.0% |
| High School | 0 | 0.0% |
| College / Undergraduate | 0 | 0.0% |
| Graduate / Professional | 0 | 0.0% |
| Total | 43 | 100.0% |
School Enrollment by Age by Funding Source in Hato Arriba
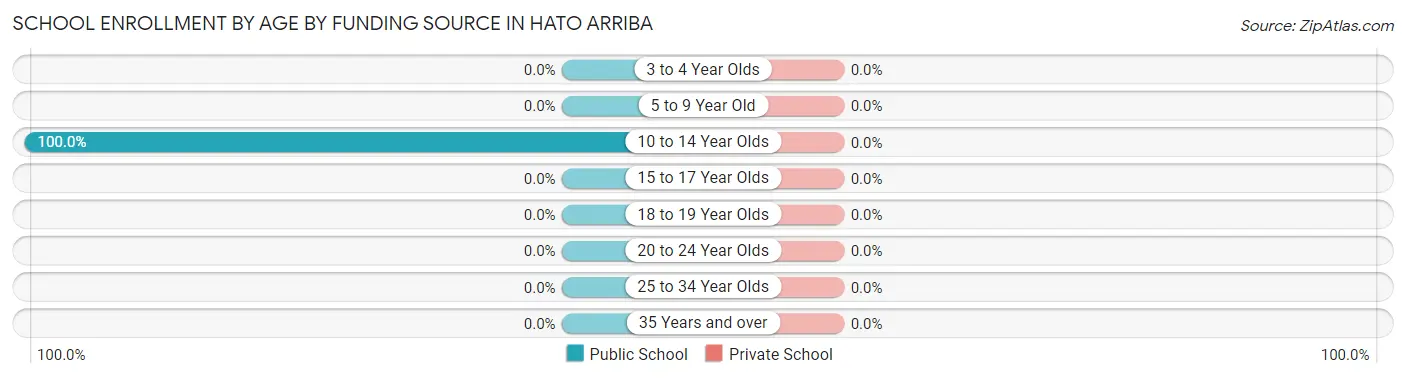
| Age Bracket | Public School | Private School |
| 3 to 4 Year Olds | 0 (0.0%) | 0 (0.0%) |
| 5 to 9 Year Old | 0 (0.0%) | 0 (0.0%) |
| 10 to 14 Year Olds | 43 (100.0%) | 0 (0.0%) |
| 15 to 17 Year Olds | 0 (0.0%) | 0 (0.0%) |
| 18 to 19 Year Olds | 0 (0.0%) | 0 (0.0%) |
| 20 to 24 Year Olds | 0 (0.0%) | 0 (0.0%) |
| 25 to 34 Year Olds | 0 (0.0%) | 0 (0.0%) |
| 35 Years and over | 0 (0.0%) | 0 (0.0%) |
| Total | 43 (100.0%) | 0 (0.0%) |
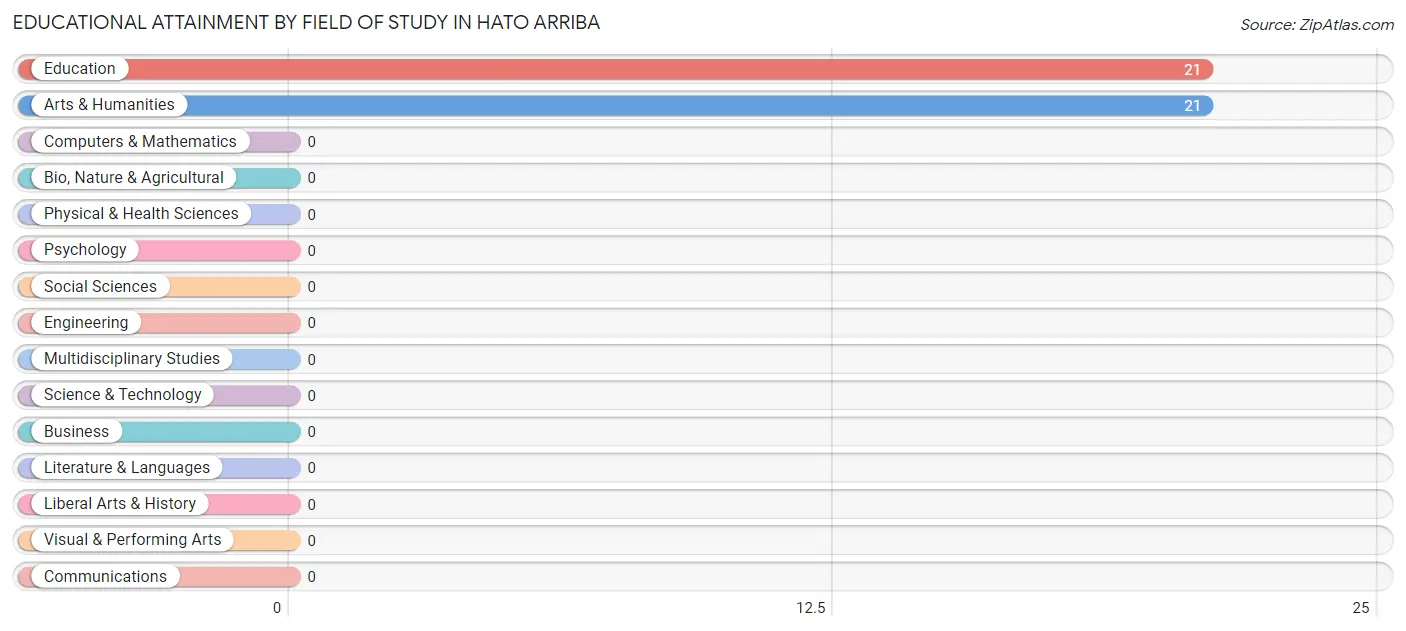
Educational Attainment by Field of Study in Hato Arriba
Education (21 | 50.0%), and arts & humanities (21 | 50.0%) are the most common fields of study among 42 individuals in Hato Arriba who have obtained a bachelor's degree or higher.
| Field of Study | # Graduates | % Graduates |
| Computers & Mathematics | 0 | 0.0% |
| Bio, Nature & Agricultural | 0 | 0.0% |
| Physical & Health Sciences | 0 | 0.0% |
| Psychology | 0 | 0.0% |
| Social Sciences | 0 | 0.0% |
| Engineering | 0 | 0.0% |
| Multidisciplinary Studies | 0 | 0.0% |
| Science & Technology | 0 | 0.0% |
| Business | 0 | 0.0% |
| Education | 21 | 50.0% |
| Literature & Languages | 0 | 0.0% |
| Liberal Arts & History | 0 | 0.0% |
| Visual & Performing Arts | 0 | 0.0% |
| Communications | 0 | 0.0% |
| Arts & Humanities | 21 | 50.0% |
| Total | 42 | 100.0% |
Transportation & Commute in Hato Arriba
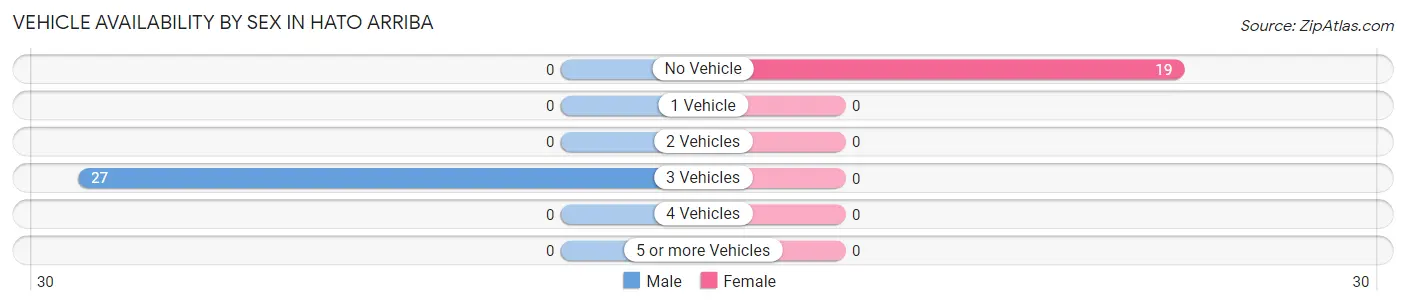
Vehicle Availability by Sex in Hato Arriba
The most prevalent vehicle ownership categories in Hato Arriba are males with 3 vehicles (27, accounting for 100.0%) and females with 3 vehicles (0, making up 142.1%).
| Vehicles Available | Male | Female |
| No Vehicle | 0 (0.0%) | 19 (100.0%) |
| 1 Vehicle | 0 (0.0%) | 0 (0.0%) |
| 2 Vehicles | 0 (0.0%) | 0 (0.0%) |
| 3 Vehicles | 27 (100.0%) | 0 (0.0%) |
| 4 Vehicles | 0 (0.0%) | 0 (0.0%) |
| 5 or more Vehicles | 0 (0.0%) | 0 (0.0%) |
| Total | 27 (100.0%) | 19 (100.0%) |
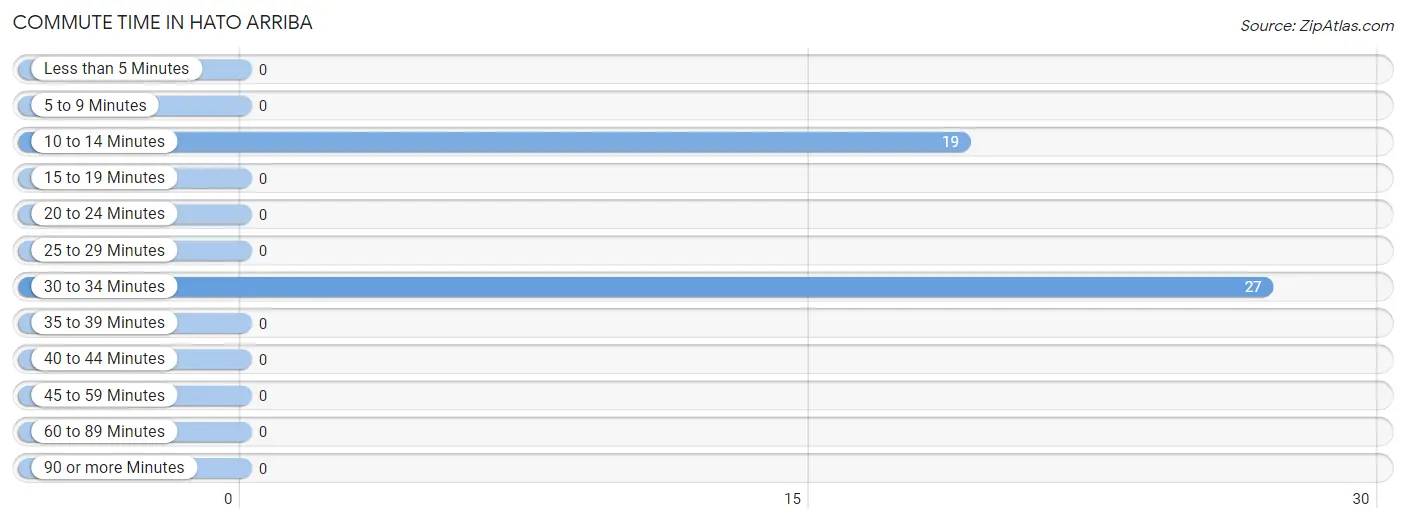
Commute Time in Hato Arriba
The most frequently occuring commute durations in Hato Arriba are 30 to 34 minutes (27 commuters, 58.7%), 10 to 14 minutes (19 commuters, 41.3%), and less than 5 minutes (0 commuters, 0.0%).
| Commute Time | # Commuters | % Commuters |
| Less than 5 Minutes | 0 | 0.0% |
| 5 to 9 Minutes | 0 | 0.0% |
| 10 to 14 Minutes | 19 | 41.3% |
| 15 to 19 Minutes | 0 | 0.0% |
| 20 to 24 Minutes | 0 | 0.0% |
| 25 to 29 Minutes | 0 | 0.0% |
| 30 to 34 Minutes | 27 | 58.7% |
| 35 to 39 Minutes | 0 | 0.0% |
| 40 to 44 Minutes | 0 | 0.0% |
| 45 to 59 Minutes | 0 | 0.0% |
| 60 to 89 Minutes | 0 | 0.0% |
| 90 or more Minutes | 0 | 0.0% |
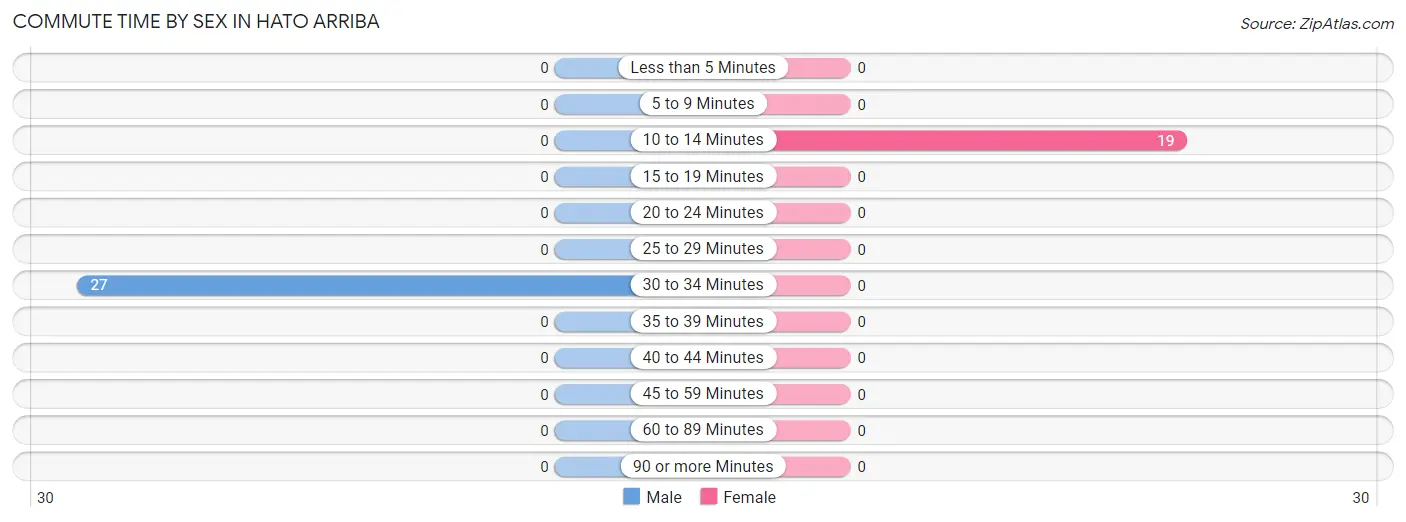
Commute Time by Sex in Hato Arriba
The most common commute times in Hato Arriba are 30 to 34 minutes (27 commuters, 100.0%) for males and 10 to 14 minutes (19 commuters, 100.0%) for females.
| Commute Time | Male | Female |
| Less than 5 Minutes | 0 (0.0%) | 0 (0.0%) |
| 5 to 9 Minutes | 0 (0.0%) | 0 (0.0%) |
| 10 to 14 Minutes | 0 (0.0%) | 19 (100.0%) |
| 15 to 19 Minutes | 0 (0.0%) | 0 (0.0%) |
| 20 to 24 Minutes | 0 (0.0%) | 0 (0.0%) |
| 25 to 29 Minutes | 0 (0.0%) | 0 (0.0%) |
| 30 to 34 Minutes | 27 (100.0%) | 0 (0.0%) |
| 35 to 39 Minutes | 0 (0.0%) | 0 (0.0%) |
| 40 to 44 Minutes | 0 (0.0%) | 0 (0.0%) |
| 45 to 59 Minutes | 0 (0.0%) | 0 (0.0%) |
| 60 to 89 Minutes | 0 (0.0%) | 0 (0.0%) |
| 90 or more Minutes | 0 (0.0%) | 0 (0.0%) |
Time of Departure to Work by Sex in Hato Arriba
The most frequent times of departure to work in Hato Arriba are 5:00 AM to 5:29 AM (27, 100.0%) for males and 4:00 PM to 11:59 PM (19, 100.0%) for females.
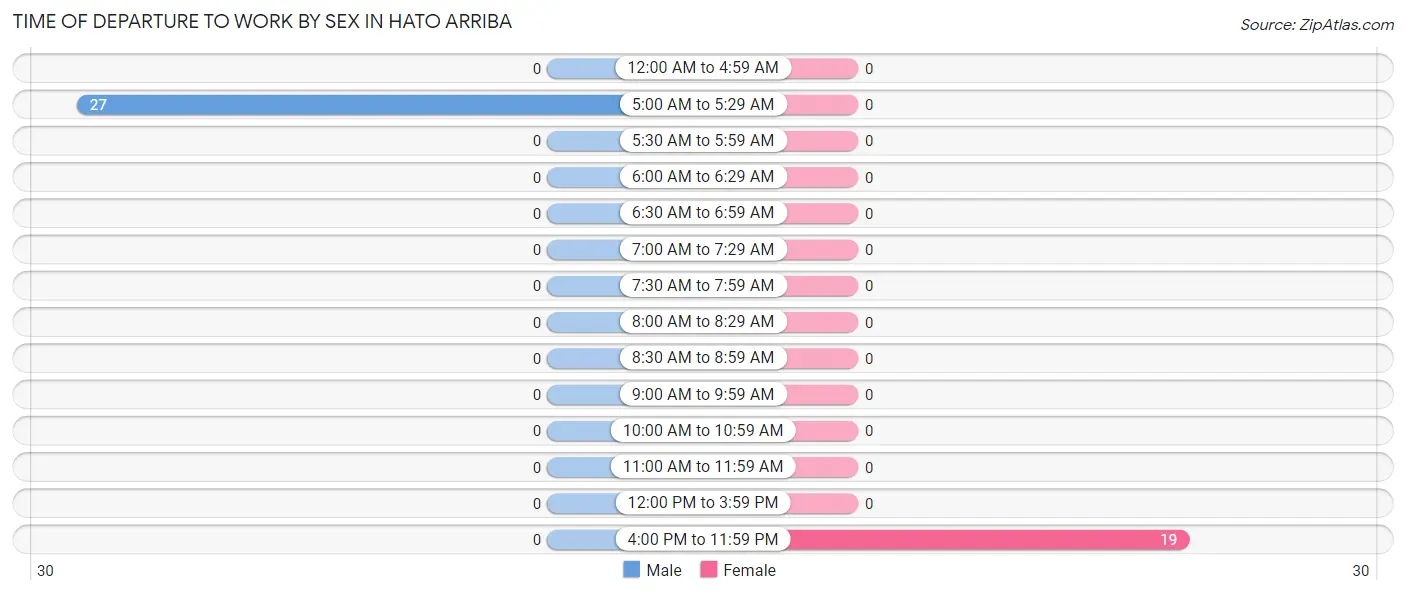
| Time of Departure | Male | Female |
| 12:00 AM to 4:59 AM | 0 (0.0%) | 0 (0.0%) |
| 5:00 AM to 5:29 AM | 27 (100.0%) | 0 (0.0%) |
| 5:30 AM to 5:59 AM | 0 (0.0%) | 0 (0.0%) |
| 6:00 AM to 6:29 AM | 0 (0.0%) | 0 (0.0%) |
| 6:30 AM to 6:59 AM | 0 (0.0%) | 0 (0.0%) |
| 7:00 AM to 7:29 AM | 0 (0.0%) | 0 (0.0%) |
| 7:30 AM to 7:59 AM | 0 (0.0%) | 0 (0.0%) |
| 8:00 AM to 8:29 AM | 0 (0.0%) | 0 (0.0%) |
| 8:30 AM to 8:59 AM | 0 (0.0%) | 0 (0.0%) |
| 9:00 AM to 9:59 AM | 0 (0.0%) | 0 (0.0%) |
| 10:00 AM to 10:59 AM | 0 (0.0%) | 0 (0.0%) |
| 11:00 AM to 11:59 AM | 0 (0.0%) | 0 (0.0%) |
| 12:00 PM to 3:59 PM | 0 (0.0%) | 0 (0.0%) |
| 4:00 PM to 11:59 PM | 0 (0.0%) | 19 (100.0%) |
| Total | 27 (100.0%) | 19 (100.0%) |
Housing Occupancy in Hato Arriba
Occupancy by Ownership in Hato Arriba
Of the total 349 dwellings in Hato Arriba, owner-occupied units account for 303 (86.8%), while renter-occupied units make up 46 (13.2%).
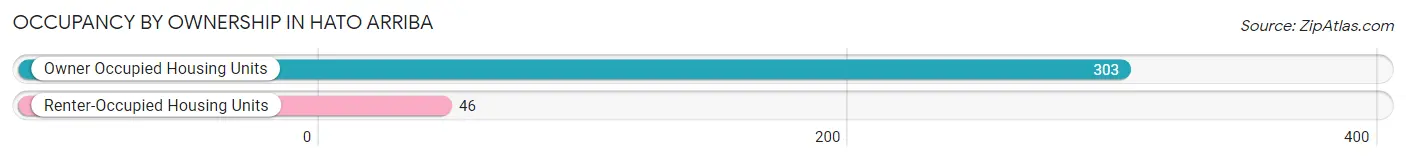
| Occupancy | # Housing Units | % Housing Units |
| Owner Occupied Housing Units | 303 | 86.8% |
| Renter-Occupied Housing Units | 46 | 13.2% |
| Total Occupied Housing Units | 349 | 100.0% |
Occupancy by Household Size in Hato Arriba
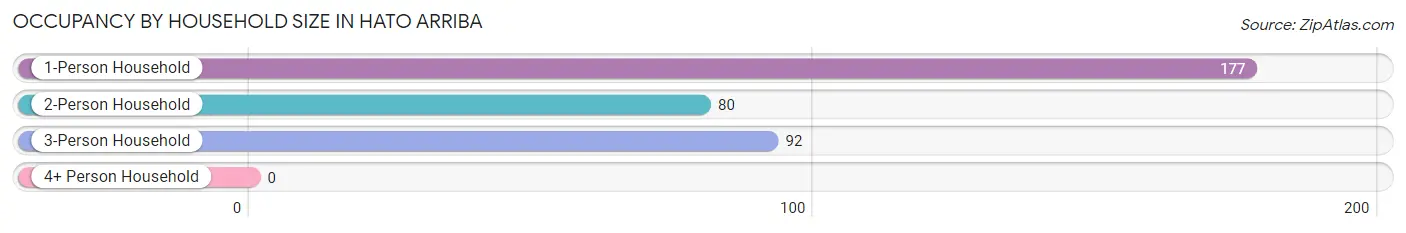
| Household Size | # Housing Units | % Housing Units |
| 1-Person Household | 177 | 50.7% |
| 2-Person Household | 80 | 22.9% |
| 3-Person Household | 92 | 26.4% |
| 4+ Person Household | 0 | 0.0% |
| Total Housing Units | 349 | 100.0% |
Occupancy by Ownership by Household Size in Hato Arriba
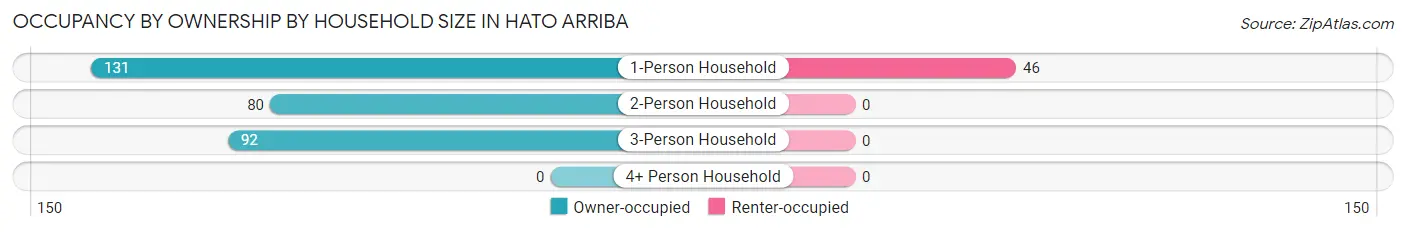
| Household Size | Owner-occupied | Renter-occupied |
| 1-Person Household | 131 (74.0%) | 46 (26.0%) |
| 2-Person Household | 80 (100.0%) | 0 (0.0%) |
| 3-Person Household | 92 (100.0%) | 0 (0.0%) |
| 4+ Person Household | 0 (0.0%) | 0 (0.0%) |
| Total Housing Units | 303 (86.8%) | 46 (13.2%) |
Occupancy by Educational Attainment in Hato Arriba
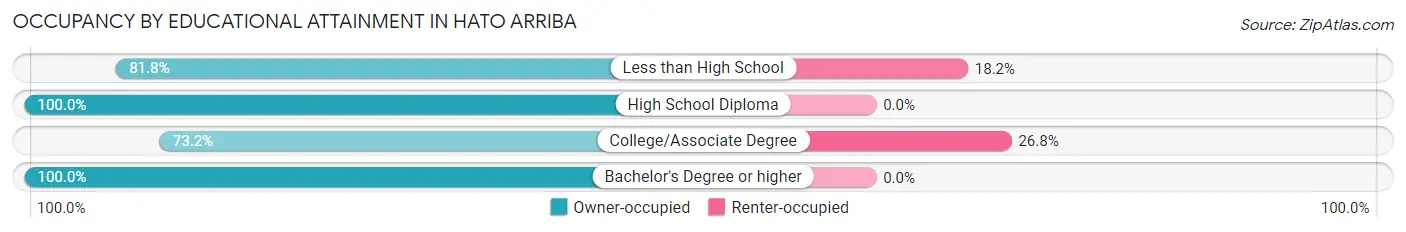
| Household Size | Owner-occupied | Renter-occupied |
| Less than High School | 108 (81.8%) | 24 (18.2%) |
| High School Diploma | 114 (100.0%) | 0 (0.0%) |
| College/Associate Degree | 60 (73.2%) | 22 (26.8%) |
| Bachelor's Degree or higher | 21 (100.0%) | 0 (0.0%) |
Occupancy by Age of Householder in Hato Arriba
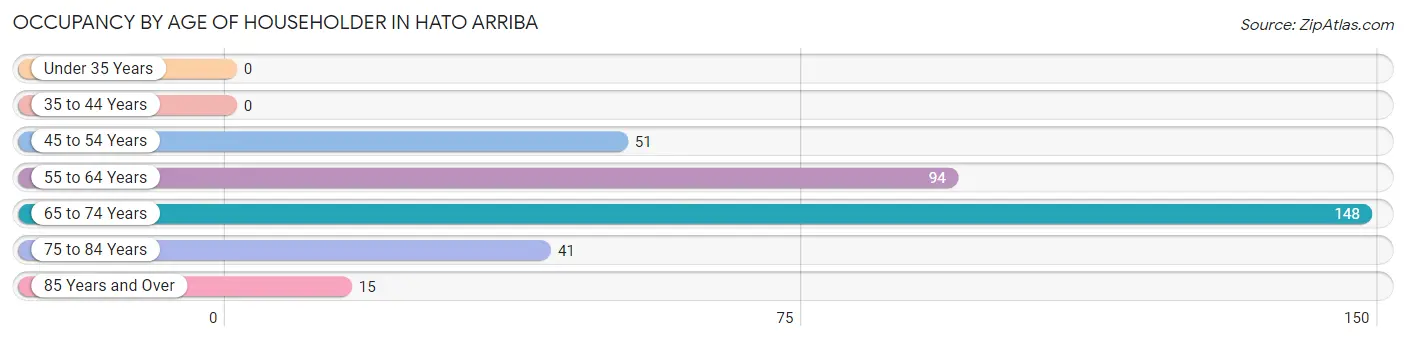
| Age Bracket | # Households | % Households |
| Under 35 Years | 0 | 0.0% |
| 35 to 44 Years | 0 | 0.0% |
| 45 to 54 Years | 51 | 14.6% |
| 55 to 64 Years | 94 | 26.9% |
| 65 to 74 Years | 148 | 42.4% |
| 75 to 84 Years | 41 | 11.7% |
| 85 Years and Over | 15 | 4.3% |
| Total | 349 | 100.0% |
Housing Finances in Hato Arriba
Median Income by Occupancy in Hato Arriba
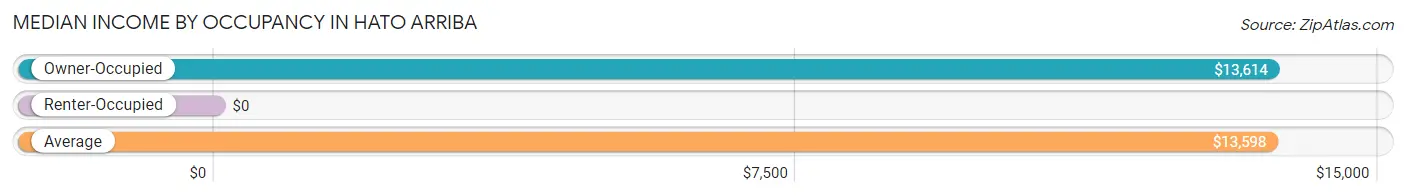
| Occupancy Type | # Households | Median Income |
| Owner-Occupied | 303 (86.8%) | $13,614 |
| Renter-Occupied | 46 (13.2%) | $0 |
| Average | 349 (100.0%) | $13,598 |
Occupancy by Householder Income Bracket in Hato Arriba
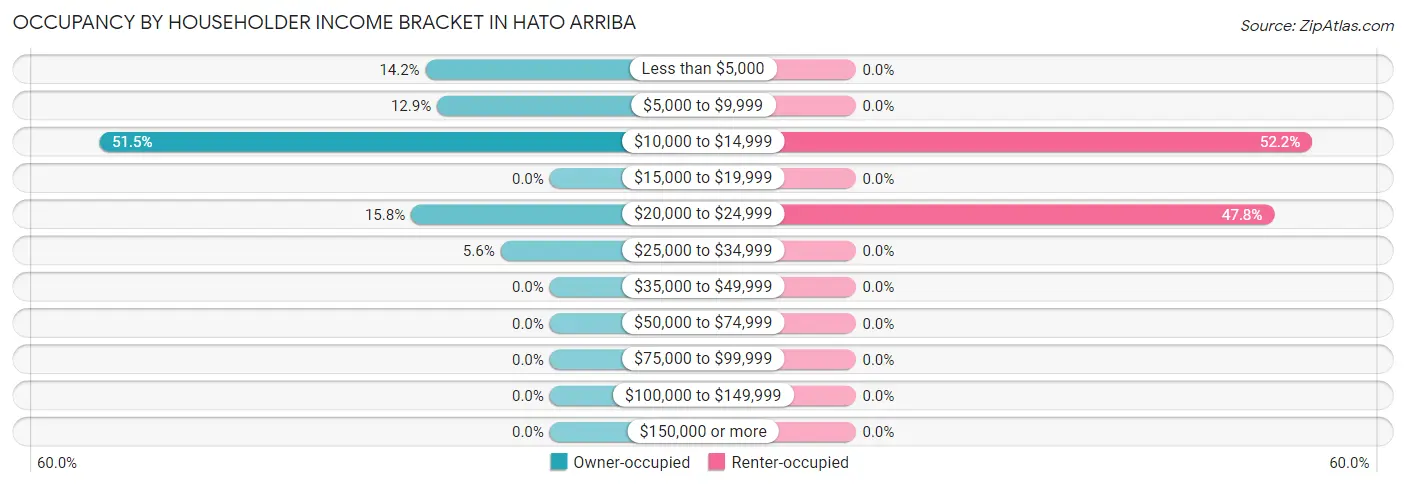
| Income Bracket | Owner-occupied | Renter-occupied |
| Less than $5,000 | 43 (14.2%) | 0 (0.0%) |
| $5,000 to $9,999 | 39 (12.9%) | 0 (0.0%) |
| $10,000 to $14,999 | 156 (51.5%) | 24 (52.2%) |
| $15,000 to $19,999 | 0 (0.0%) | 0 (0.0%) |
| $20,000 to $24,999 | 48 (15.8%) | 22 (47.8%) |
| $25,000 to $34,999 | 17 (5.6%) | 0 (0.0%) |
| $35,000 to $49,999 | 0 (0.0%) | 0 (0.0%) |
| $50,000 to $74,999 | 0 (0.0%) | 0 (0.0%) |
| $75,000 to $99,999 | 0 (0.0%) | 0 (0.0%) |
| $100,000 to $149,999 | 0 (0.0%) | 0 (0.0%) |
| $150,000 or more | 0 (0.0%) | 0 (0.0%) |
| Total | 303 (100.0%) | 46 (100.0%) |
Monthly Housing Cost Tiers in Hato Arriba
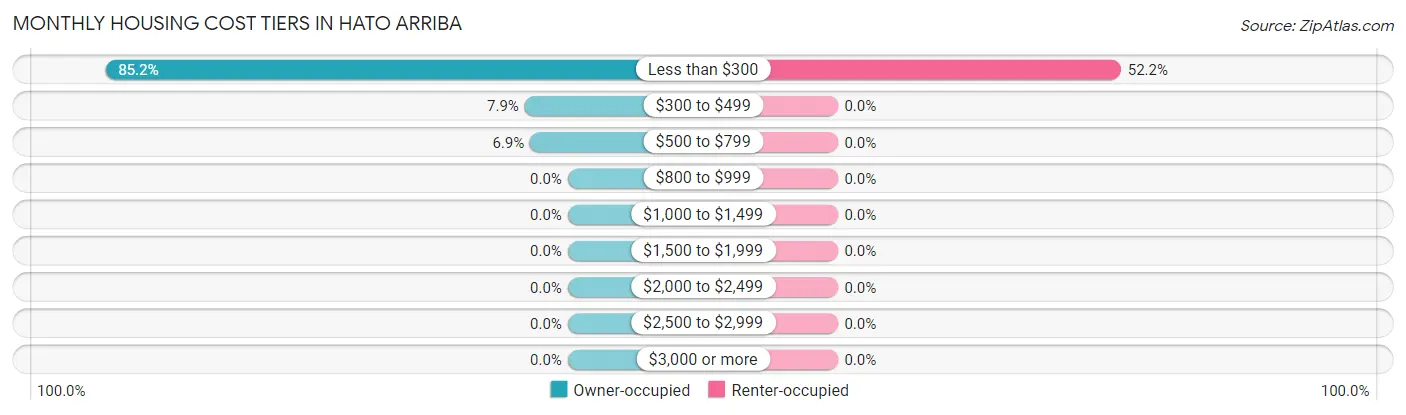
| Monthly Cost | Owner-occupied | Renter-occupied |
| Less than $300 | 258 (85.2%) | 24 (52.2%) |
| $300 to $499 | 24 (7.9%) | 0 (0.0%) |
| $500 to $799 | 21 (6.9%) | 0 (0.0%) |
| $800 to $999 | 0 (0.0%) | 0 (0.0%) |
| $1,000 to $1,499 | 0 (0.0%) | 0 (0.0%) |
| $1,500 to $1,999 | 0 (0.0%) | 0 (0.0%) |
| $2,000 to $2,499 | 0 (0.0%) | 0 (0.0%) |
| $2,500 to $2,999 | 0 (0.0%) | 0 (0.0%) |
| $3,000 or more | 0 (0.0%) | 0 (0.0%) |
| Total | 303 (100.0%) | 46 (100.0%) |
Physical Housing Characteristics in Hato Arriba
Housing Structures in Hato Arriba
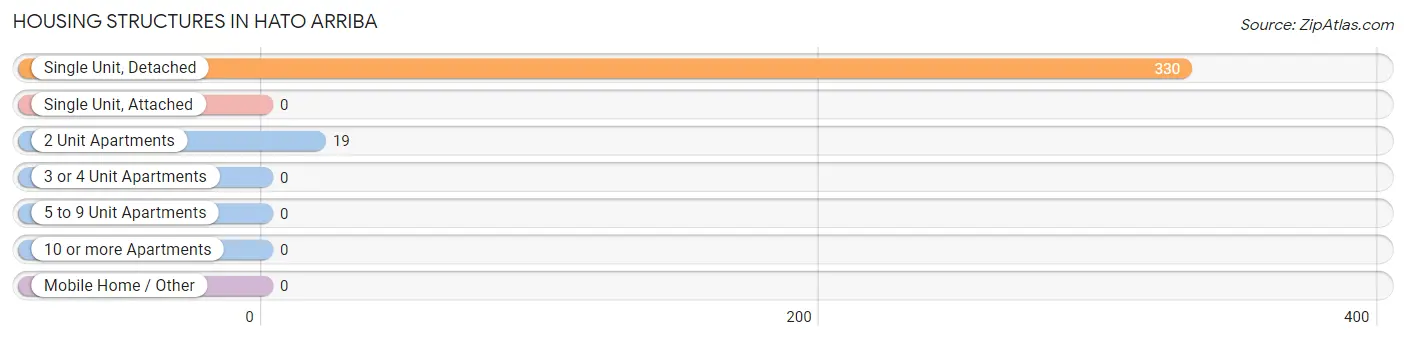
| Structure Type | # Housing Units | % Housing Units |
| Single Unit, Detached | 330 | 94.6% |
| Single Unit, Attached | 0 | 0.0% |
| 2 Unit Apartments | 19 | 5.4% |
| 3 or 4 Unit Apartments | 0 | 0.0% |
| 5 to 9 Unit Apartments | 0 | 0.0% |
| 10 or more Apartments | 0 | 0.0% |
| Mobile Home / Other | 0 | 0.0% |
| Total | 349 | 100.0% |
Housing Structures by Occupancy in Hato Arriba
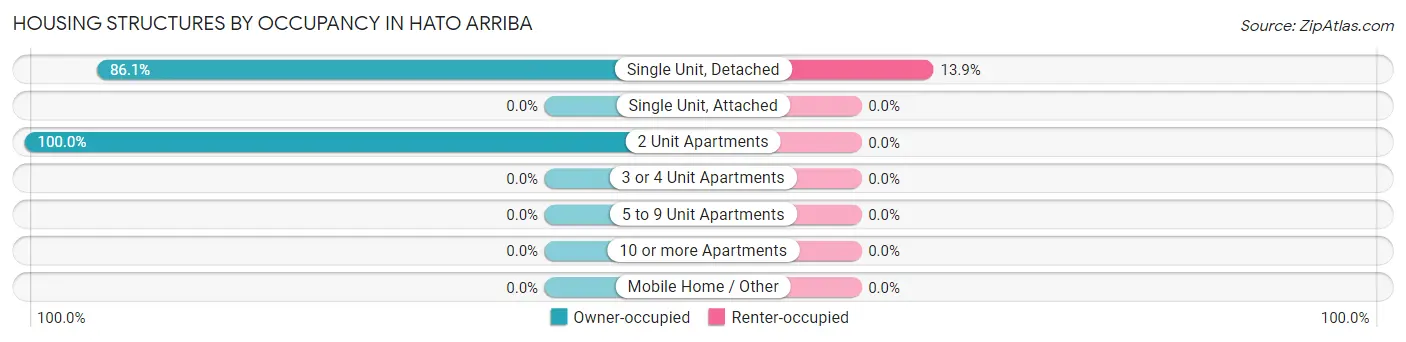
| Structure Type | Owner-occupied | Renter-occupied |
| Single Unit, Detached | 284 (86.1%) | 46 (13.9%) |
| Single Unit, Attached | 0 (0.0%) | 0 (0.0%) |
| 2 Unit Apartments | 19 (100.0%) | 0 (0.0%) |
| 3 or 4 Unit Apartments | 0 (0.0%) | 0 (0.0%) |
| 5 to 9 Unit Apartments | 0 (0.0%) | 0 (0.0%) |
| 10 or more Apartments | 0 (0.0%) | 0 (0.0%) |
| Mobile Home / Other | 0 (0.0%) | 0 (0.0%) |
| Total | 303 (86.8%) | 46 (13.2%) |
Housing Structures by Number of Rooms in Hato Arriba
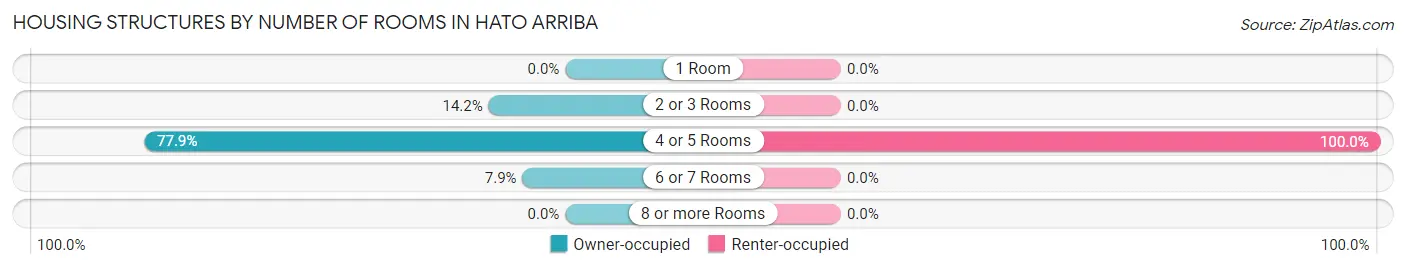
| Number of Rooms | Owner-occupied | Renter-occupied |
| 1 Room | 0 (0.0%) | 0 (0.0%) |
| 2 or 3 Rooms | 43 (14.2%) | 0 (0.0%) |
| 4 or 5 Rooms | 236 (77.9%) | 46 (100.0%) |
| 6 or 7 Rooms | 24 (7.9%) | 0 (0.0%) |
| 8 or more Rooms | 0 (0.0%) | 0 (0.0%) |
| Total | 303 (100.0%) | 46 (100.0%) |
Housing Structure by Heating Type in Hato Arriba
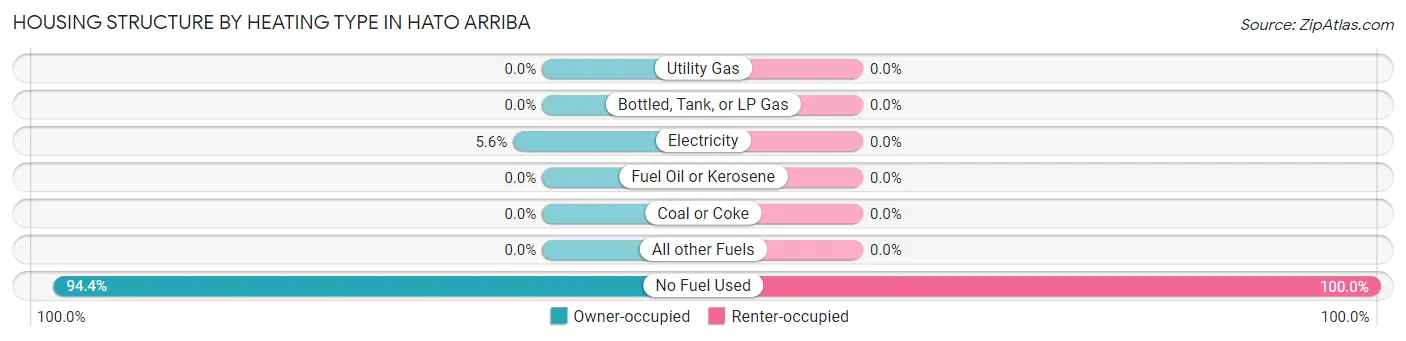
| Heating Type | Owner-occupied | Renter-occupied |
| Utility Gas | 0 (0.0%) | 0 (0.0%) |
| Bottled, Tank, or LP Gas | 0 (0.0%) | 0 (0.0%) |
| Electricity | 17 (5.6%) | 0 (0.0%) |
| Fuel Oil or Kerosene | 0 (0.0%) | 0 (0.0%) |
| Coal or Coke | 0 (0.0%) | 0 (0.0%) |
| All other Fuels | 0 (0.0%) | 0 (0.0%) |
| No Fuel Used | 286 (94.4%) | 46 (100.0%) |
| Total | 303 (100.0%) | 46 (100.0%) |
Household Vehicle Usage in Hato Arriba
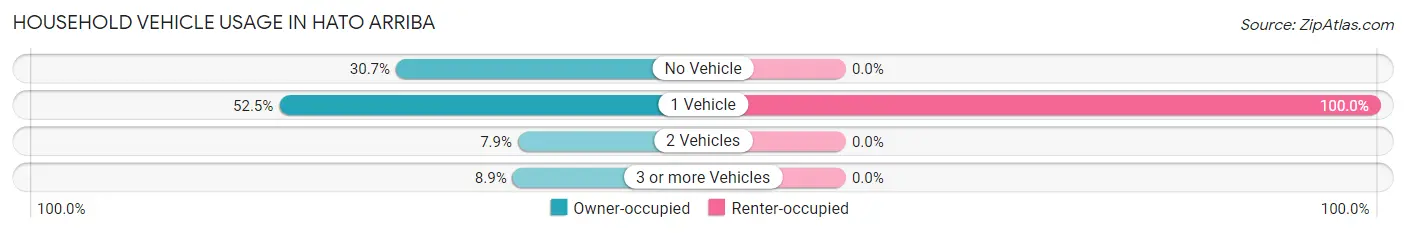
| Vehicles per Household | Owner-occupied | Renter-occupied |
| No Vehicle | 93 (30.7%) | 0 (0.0%) |
| 1 Vehicle | 159 (52.5%) | 46 (100.0%) |
| 2 Vehicles | 24 (7.9%) | 0 (0.0%) |
| 3 or more Vehicles | 27 (8.9%) | 0 (0.0%) |
| Total | 303 (100.0%) | 46 (100.0%) |
Real Estate & Mortgages in Hato Arriba
Real Estate and Mortgage Overview in Hato Arriba
| Characteristic | Without Mortgage | With Mortgage |
| Housing Units | 216 | 87 |
| Median Property Value | $91,100 | $175,800 |
| Median Household Income | $13,596 | $0 |
| Monthly Housing Costs | $125 | $0 |
| Real Estate Taxes | - | - |
Property Value by Mortgage Status in Hato Arriba
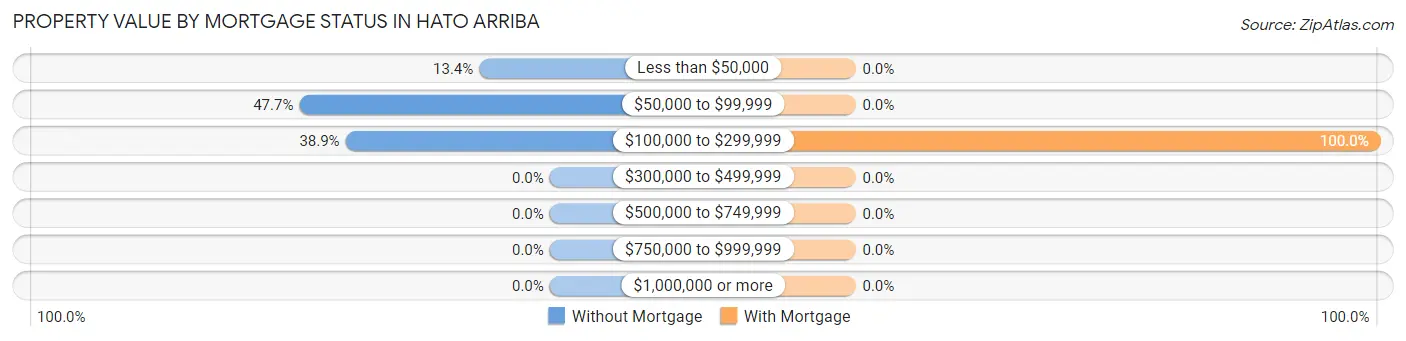
| Property Value | Without Mortgage | With Mortgage |
| Less than $50,000 | 29 (13.4%) | 0 (0.0%) |
| $50,000 to $99,999 | 103 (47.7%) | 0 (0.0%) |
| $100,000 to $299,999 | 84 (38.9%) | 87 (100.0%) |
| $300,000 to $499,999 | 0 (0.0%) | 0 (0.0%) |
| $500,000 to $749,999 | 0 (0.0%) | 0 (0.0%) |
| $750,000 to $999,999 | 0 (0.0%) | 0 (0.0%) |
| $1,000,000 or more | 0 (0.0%) | 0 (0.0%) |
| Total | 216 (100.0%) | 87 (100.0%) |
Household Income by Mortgage Status in Hato Arriba
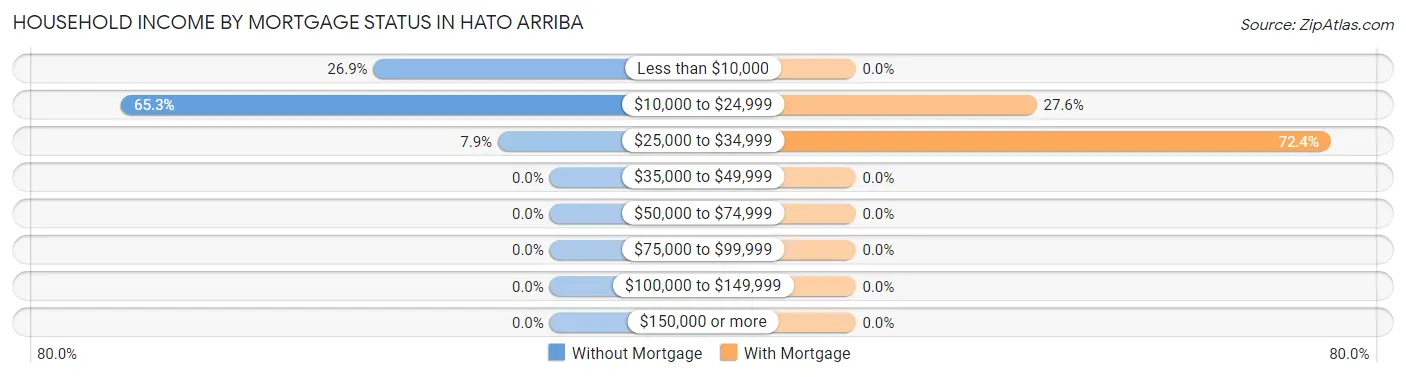
| Household Income | Without Mortgage | With Mortgage |
| Less than $10,000 | 58 (26.9%) | 0 (0.0%) |
| $10,000 to $24,999 | 141 (65.3%) | 24 (27.6%) |
| $25,000 to $34,999 | 17 (7.9%) | 63 (72.4%) |
| $35,000 to $49,999 | 0 (0.0%) | 0 (0.0%) |
| $50,000 to $74,999 | 0 (0.0%) | 0 (0.0%) |
| $75,000 to $99,999 | 0 (0.0%) | 0 (0.0%) |
| $100,000 to $149,999 | 0 (0.0%) | 0 (0.0%) |
| $150,000 or more | 0 (0.0%) | 0 (0.0%) |
| Total | 216 (100.0%) | 87 (100.0%) |
Property Value to Household Income Ratio in Hato Arriba
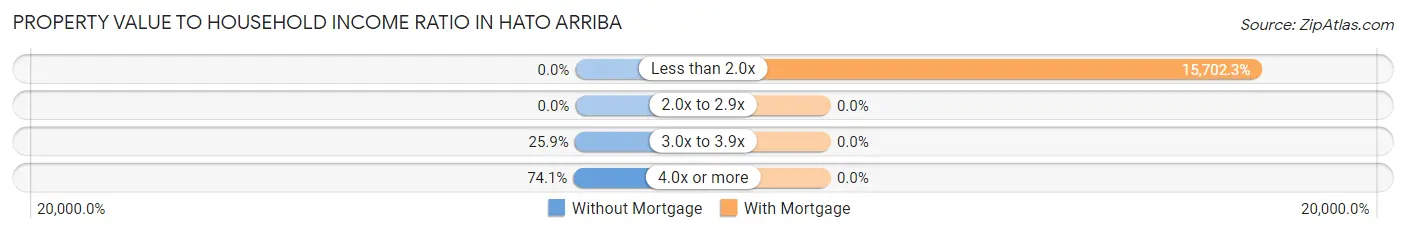
| Value-to-Income Ratio | Without Mortgage | With Mortgage |
| Less than 2.0x | 0 (0.0%) | 13,661 (15,702.3%) |
| 2.0x to 2.9x | 0 (0.0%) | 0 (0.0%) |
| 3.0x to 3.9x | 56 (25.9%) | 0 (0.0%) |
| 4.0x or more | 160 (74.1%) | 0 (0.0%) |
| Total | 216 (100.0%) | 87 (100.0%) |
Real Estate Taxes by Mortgage Status in Hato Arriba
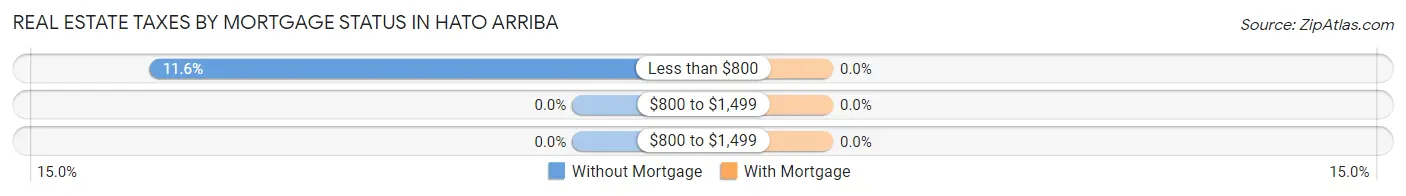
| Property Taxes | Without Mortgage | With Mortgage |
| Less than $800 | 25 (11.6%) | 0 (0.0%) |
| $800 to $1,499 | 0 (0.0%) | 0 (0.0%) |
| $800 to $1,499 | 0 (0.0%) | 0 (0.0%) |
| Total | 216 (100.0%) | 87 (100.0%) |
Health & Disability in Hato Arriba
Health Insurance Coverage by Age in Hato Arriba
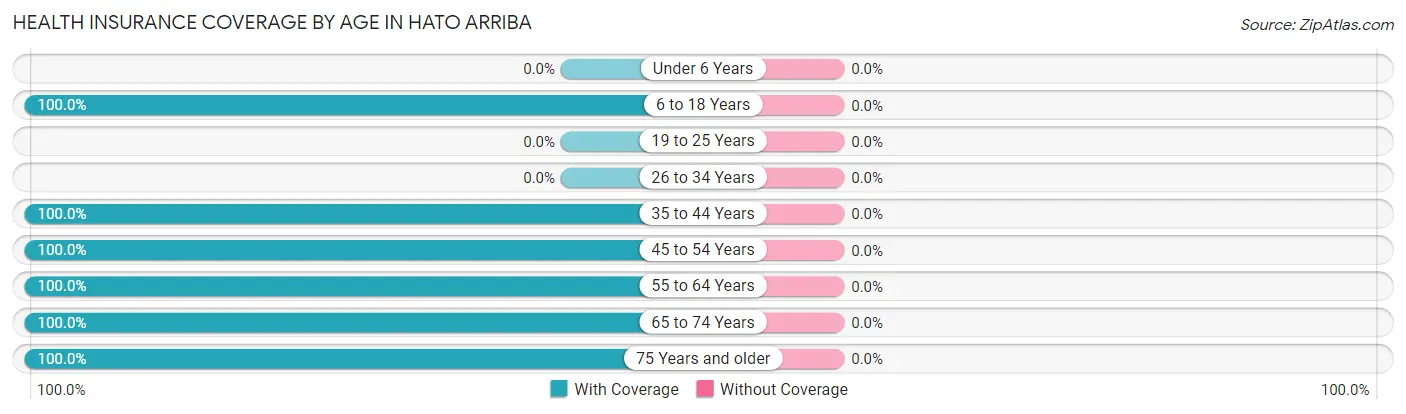
| Age Bracket | With Coverage | Without Coverage |
| Under 6 Years | 0 (0.0%) | 0 (0.0%) |
| 6 to 18 Years | 43 (100.0%) | 0 (0.0%) |
| 19 to 25 Years | 0 (0.0%) | 0 (0.0%) |
| 26 to 34 Years | 0 (0.0%) | 0 (0.0%) |
| 35 to 44 Years | 84 (100.0%) | 0 (0.0%) |
| 45 to 54 Years | 135 (100.0%) | 0 (0.0%) |
| 55 to 64 Years | 165 (100.0%) | 0 (0.0%) |
| 65 to 74 Years | 223 (100.0%) | 0 (0.0%) |
| 75 Years and older | 125 (100.0%) | 0 (0.0%) |
| Total | 775 (100.0%) | 0 (0.0%) |
Health Insurance Coverage by Citizenship Status in Hato Arriba
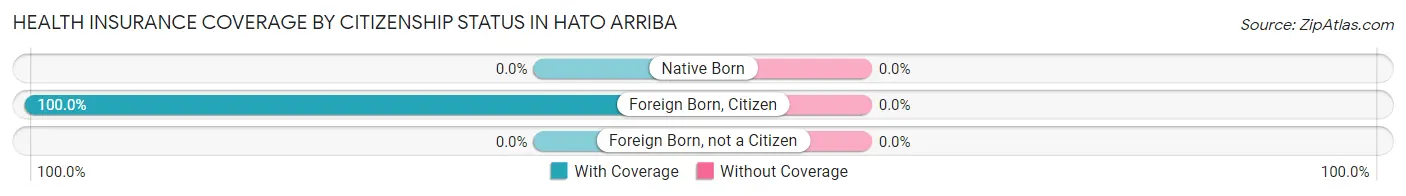
| Citizenship Status | With Coverage | Without Coverage |
| Native Born | 0 (0.0%) | 0 (0.0%) |
| Foreign Born, Citizen | 43 (100.0%) | 0 (0.0%) |
| Foreign Born, not a Citizen | 0 (0.0%) | 0 (0.0%) |
Health Insurance Coverage by Household Income in Hato Arriba
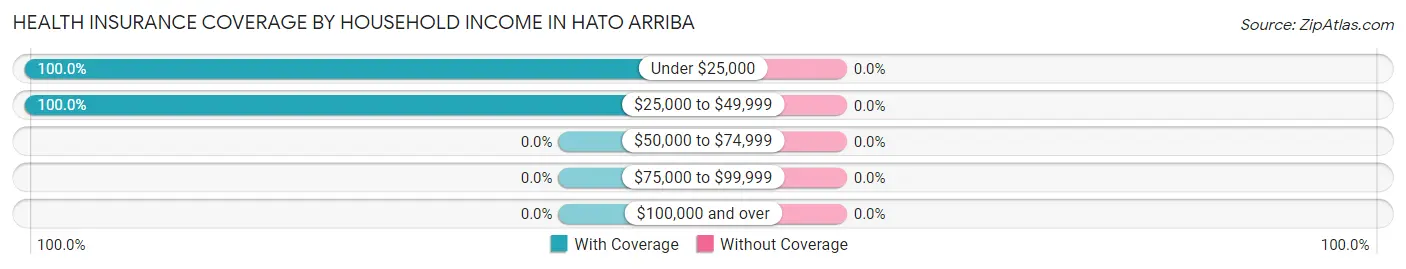
| Household Income | With Coverage | Without Coverage |
| Under $25,000 | 738 (100.0%) | 0 (0.0%) |
| $25,000 to $49,999 | 37 (100.0%) | 0 (0.0%) |
| $50,000 to $74,999 | 0 (0.0%) | 0 (0.0%) |
| $75,000 to $99,999 | 0 (0.0%) | 0 (0.0%) |
| $100,000 and over | 0 (0.0%) | 0 (0.0%) |
Public vs Private Health Insurance Coverage by Age in Hato Arriba
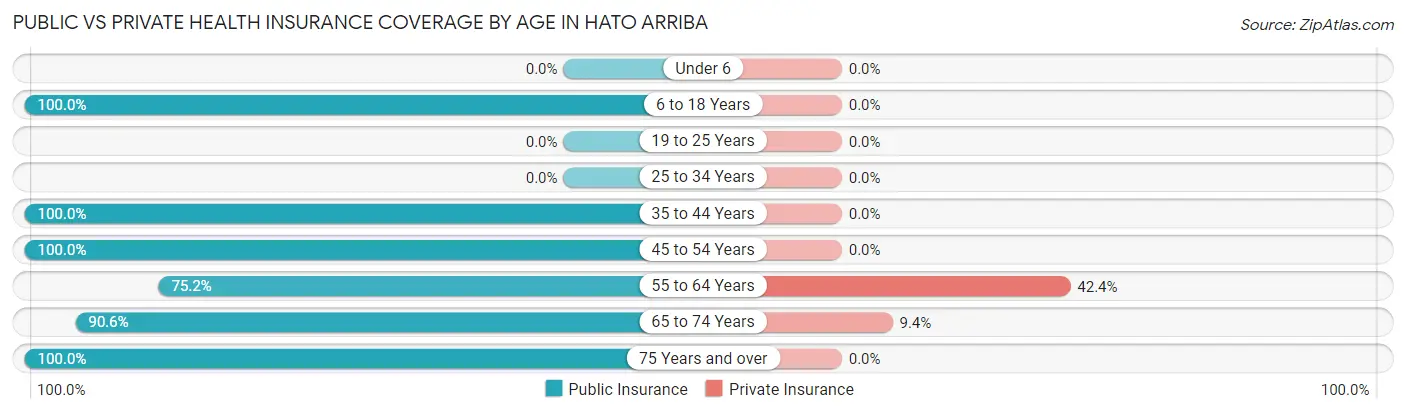
| Age Bracket | Public Insurance | Private Insurance |
| Under 6 | 0 (0.0%) | 0 (0.0%) |
| 6 to 18 Years | 43 (100.0%) | 0 (0.0%) |
| 19 to 25 Years | 0 (0.0%) | 0 (0.0%) |
| 25 to 34 Years | 0 (0.0%) | 0 (0.0%) |
| 35 to 44 Years | 84 (100.0%) | 0 (0.0%) |
| 45 to 54 Years | 135 (100.0%) | 0 (0.0%) |
| 55 to 64 Years | 124 (75.1%) | 70 (42.4%) |
| 65 to 74 Years | 202 (90.6%) | 21 (9.4%) |
| 75 Years and over | 125 (100.0%) | 0 (0.0%) |
| Total | 713 (92.0%) | 91 (11.7%) |
Disability Status by Sex by Age in Hato Arriba
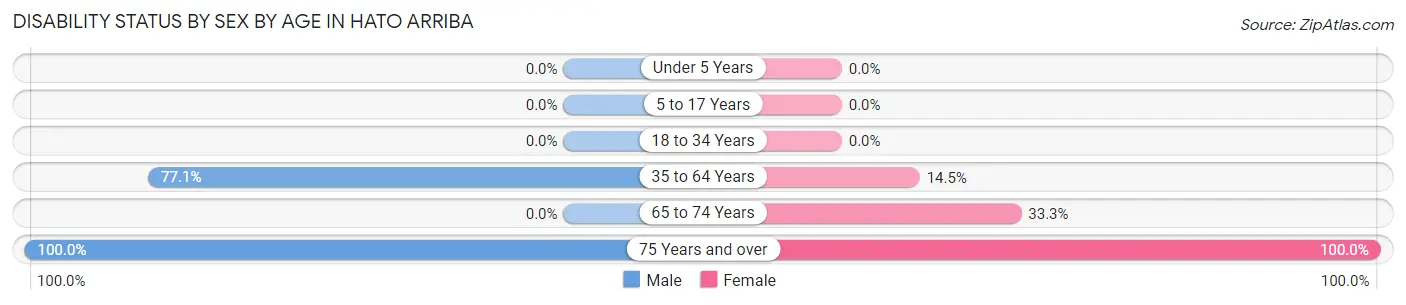
| Age Bracket | Male | Female |
| Under 5 Years | 0 (0.0%) | 0 (0.0%) |
| 5 to 17 Years | 0 (0.0%) | 0 (0.0%) |
| 18 to 34 Years | 0 (0.0%) | 0 (0.0%) |
| 35 to 64 Years | 168 (77.1%) | 24 (14.5%) |
| 65 to 74 Years | 0 (0.0%) | 66 (33.3%) |
| 75 Years and over | 93 (100.0%) | 32 (100.0%) |
Disability Class by Sex by Age in Hato Arriba
Disability Class: Hearing Difficulty
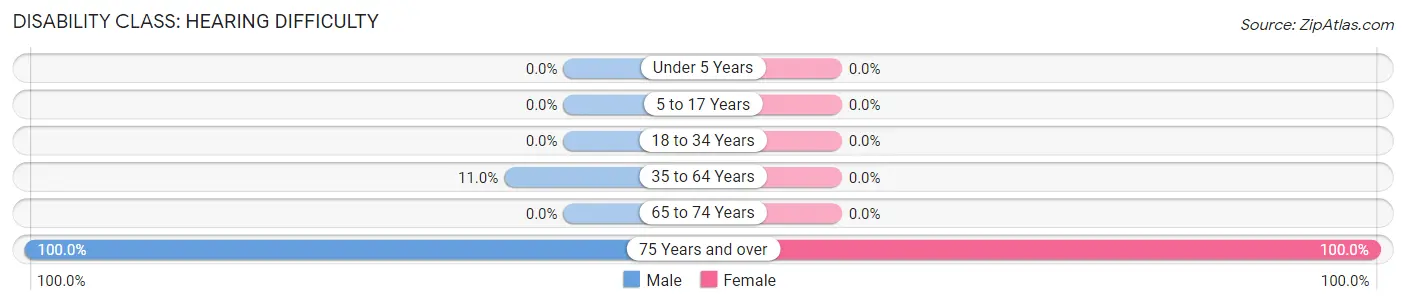
| Age Bracket | Male | Female |
| Under 5 Years | 0 (0.0%) | 0 (0.0%) |
| 5 to 17 Years | 0 (0.0%) | 0 (0.0%) |
| 18 to 34 Years | 0 (0.0%) | 0 (0.0%) |
| 35 to 64 Years | 24 (11.0%) | 0 (0.0%) |
| 65 to 74 Years | 0 (0.0%) | 0 (0.0%) |
| 75 Years and over | 93 (100.0%) | 32 (100.0%) |
Disability Class: Vision Difficulty
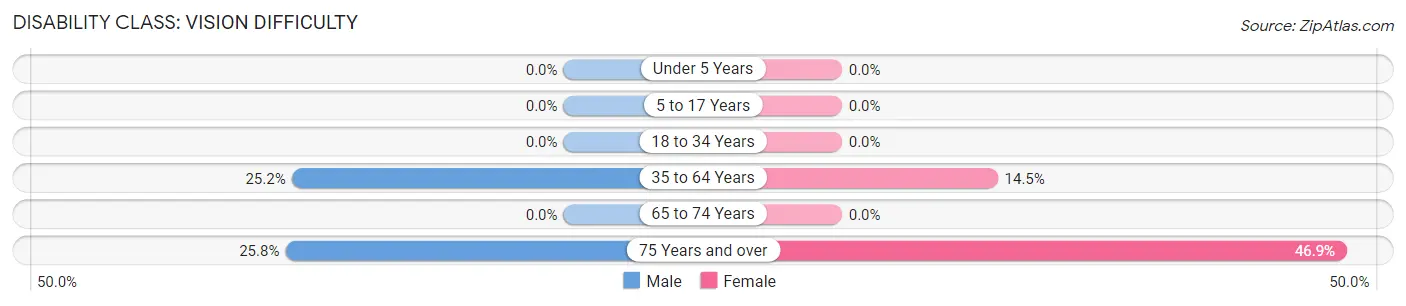
| Age Bracket | Male | Female |
| Under 5 Years | 0 (0.0%) | 0 (0.0%) |
| 5 to 17 Years | 0 (0.0%) | 0 (0.0%) |
| 18 to 34 Years | 0 (0.0%) | 0 (0.0%) |
| 35 to 64 Years | 55 (25.2%) | 24 (14.5%) |
| 65 to 74 Years | 0 (0.0%) | 0 (0.0%) |
| 75 Years and over | 24 (25.8%) | 15 (46.9%) |
Disability Class: Cognitive Difficulty
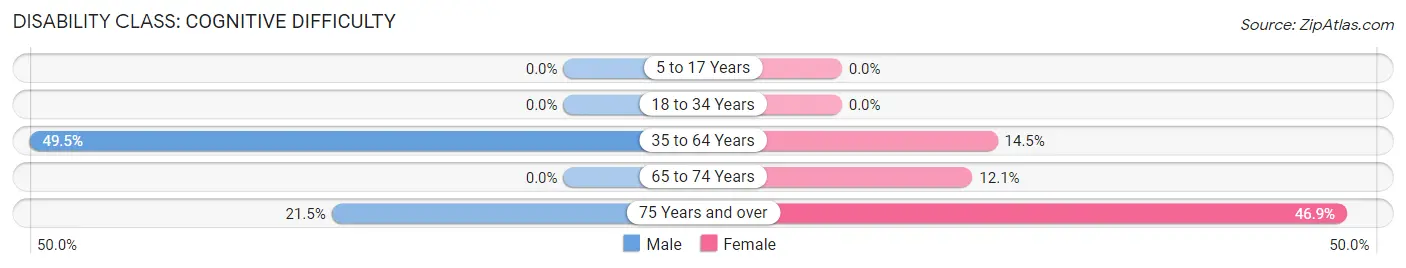
| Age Bracket | Male | Female |
| 5 to 17 Years | 0 (0.0%) | 0 (0.0%) |
| 18 to 34 Years | 0 (0.0%) | 0 (0.0%) |
| 35 to 64 Years | 108 (49.5%) | 24 (14.5%) |
| 65 to 74 Years | 0 (0.0%) | 24 (12.1%) |
| 75 Years and over | 20 (21.5%) | 15 (46.9%) |
Disability Class: Ambulatory Difficulty
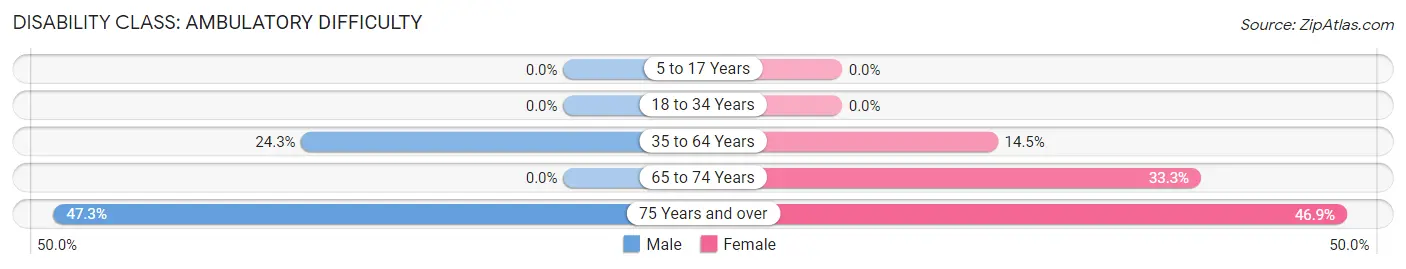
| Age Bracket | Male | Female |
| 5 to 17 Years | 0 (0.0%) | 0 (0.0%) |
| 18 to 34 Years | 0 (0.0%) | 0 (0.0%) |
| 35 to 64 Years | 53 (24.3%) | 24 (14.5%) |
| 65 to 74 Years | 0 (0.0%) | 66 (33.3%) |
| 75 Years and over | 44 (47.3%) | 15 (46.9%) |
Disability Class: Self-Care Difficulty
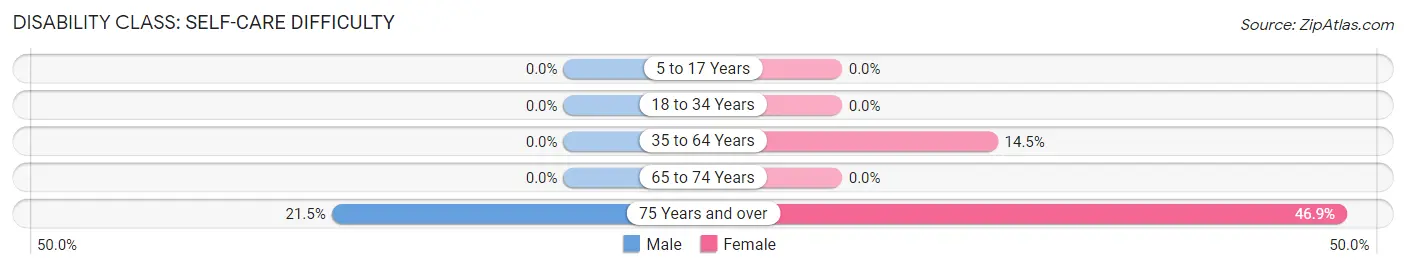
| Age Bracket | Male | Female |
| 5 to 17 Years | 0 (0.0%) | 0 (0.0%) |
| 18 to 34 Years | 0 (0.0%) | 0 (0.0%) |
| 35 to 64 Years | 0 (0.0%) | 24 (14.5%) |
| 65 to 74 Years | 0 (0.0%) | 0 (0.0%) |
| 75 Years and over | 20 (21.5%) | 15 (46.9%) |
Technology Access in Hato Arriba
Computing Device Access in Hato Arriba
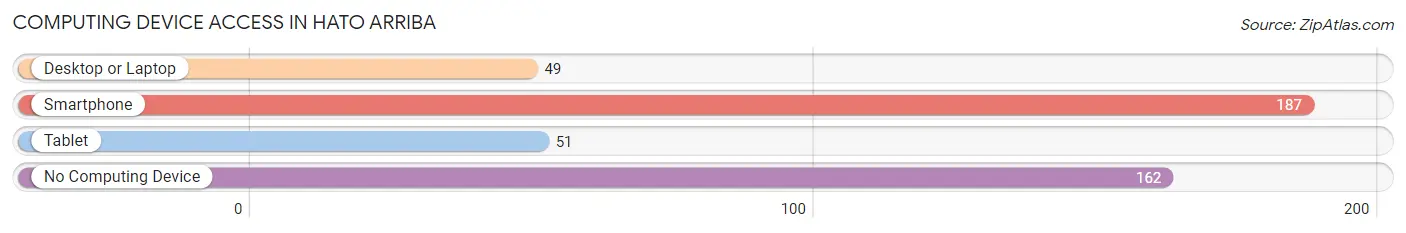
| Device Type | # Households | % Households |
| Desktop or Laptop | 49 | 14.0% |
| Smartphone | 187 | 53.6% |
| Tablet | 51 | 14.6% |
| No Computing Device | 162 | 46.4% |
| Total | 349 | 100.0% |
Internet Access in Hato Arriba
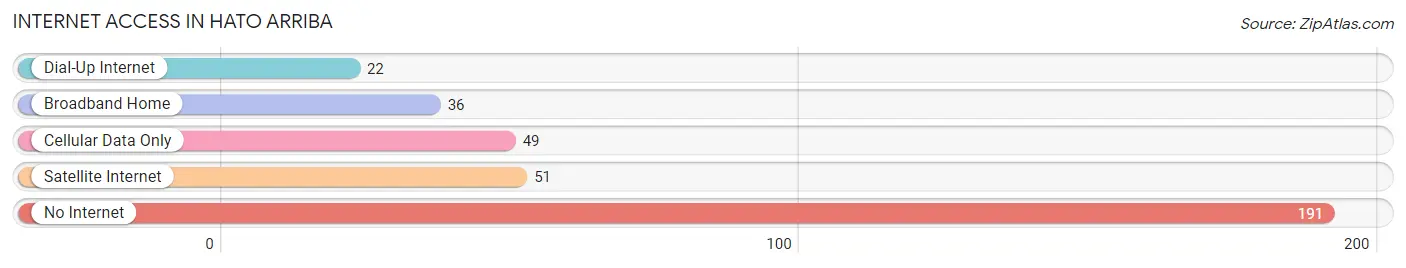
| Internet Type | # Households | % Households |
| Dial-Up Internet | 22 | 6.3% |
| Broadband Home | 36 | 10.3% |
| Cellular Data Only | 49 | 14.0% |
| Satellite Internet | 51 | 14.6% |
| No Internet | 191 | 54.7% |
| Total | 349 | 100.0% |
Hato Arriba Summary
Hato Arriba is a small municipality located in the central region of Puerto Rico. It is part of the San Juan-Caguas-Guaynabo Metropolitan Statistical Area. The municipality is bordered by the municipalities of San Lorenzo, Gurabo, and Caguas. As of the 2010 census, the population of Hato Arriba was 8,845.
Geography
Hato Arriba is located in the central region of Puerto Rico, in the Caguas Valley. It is bordered by the municipalities of San Lorenzo, Gurabo, and Caguas. The municipality covers an area of 8.9 square miles (23.1 km2). The terrain is mostly flat, with some hills in the northern part of the municipality. The highest point is Cerro de la Cruz, which rises to an elevation of 1,068 feet (325 m).
Climate
Hato Arriba has a tropical climate, with hot and humid summers and mild winters. The average annual temperature is 79°F (26°C). The average annual precipitation is 56 inches (1,420 mm).
History
Hato Arriba was founded in 1815 by Don Juan de la Cruz. The name of the municipality comes from the Spanish phrase “el hato arriba”, which means “the upper farm”. The area was originally used for cattle ranching.
In the late 19th century, the area began to be used for sugarcane production. The sugar industry was the main economic activity in the municipality until the mid-20th century.
Economy
The economy of Hato Arriba is largely based on agriculture. The main crops are sugarcane, plantains, and bananas. The municipality also has some light manufacturing and service industries.
Demographics
As of the 2010 census, the population of Hato Arriba was 8,845. The population is mostly of Puerto Rican descent, with a small minority of African and European descent. The median household income is $17,845. The unemployment rate is 11.3%.
Education
Hato Arriba has two public schools: Escuela Primaria Hato Arriba and Escuela Secundaria Hato Arriba. The municipality also has two private schools: Colegio San Juan Bautista and Colegio San Antonio.
Transportation
Hato Arriba is served by the Puerto Rico Highway System. The main roads are PR-1, PR-2, and PR-3. The municipality is also served by the Caguas Valley Transit Authority, which provides public bus service to the surrounding municipalities.
Culture
Hato Arriba is home to several cultural events and festivals. The most popular is the Festival de la Caña, which is held every year in October. The festival celebrates the sugarcane harvest and features traditional music, food, and dance.
The municipality also has several museums, including the Museo de la Caña and the Museo de la Historia de Hato Arriba. The Museo de la Caña is dedicated to the history of the sugar industry in the municipality, while the Museo de la Historia de Hato Arriba is dedicated to the history of the municipality.
Conclusion
Hato Arriba is a small municipality located in the central region of Puerto Rico. It is bordered by the municipalities of San Lorenzo, Gurabo, and Caguas. The economy of the municipality is largely based on agriculture, with sugarcane, plantains, and bananas being the main crops. The population of Hato Arriba is mostly of Puerto Rican descent, with a small minority of African and European descent. The municipality is home to several cultural events and festivals, as well as several museums.
Common Questions
What is the Total Population of Hato Arriba?
Total Population of Hato Arriba is 775.
What is the Total Male Population of Hato Arriba?
Total Male Population of Hato Arriba is 336.
What is the Total Female Population of Hato Arriba?
Total Female Population of Hato Arriba is 439.
What is the Ratio of Males per 100 Females in Hato Arriba?
There are 76.54 Males per 100 Females in Hato Arriba.
What is the Ratio of Females per 100 Males in Hato Arriba?
There are 130.65 Females per 100 Males in Hato Arriba.
What is the Median Population Age in Hato Arriba?
Median Population Age in Hato Arriba is 63.5 Years.
What is the Average Family Size in Hato Arriba
Average Family Size in Hato Arriba is 3.5 People.
What is the Average Household Size in Hato Arriba
Average Household Size in Hato Arriba is 2.2 People.
What is Per Capita Income in Hato Arriba?
Per Capita income in Hato Arriba is $7,211.
What is the Median Family Income in Hato Arriba?
Median Family Income in Hato Arriba is $13,846.
What is the Median Household income in Hato Arriba?
Median Household Income in Hato Arriba is $13,598.
What is Inequality or Gini Index in Hato Arriba?
Inequality or Gini Index in Hato Arriba is 0.25.
How Large is the Labor Force in Hato Arriba?
There are 77 People in the Labor Forcein in Hato Arriba.
What is the Percentage of People in the Labor Force in Hato Arriba?
10.5% of People are in the Labor Force in Hato Arriba.
What is the Unemployment Rate in Hato Arriba?
Unemployment Rate in Hato Arriba is 40.3%.