Candelero Abajo, PR
Candelero Abajo Map
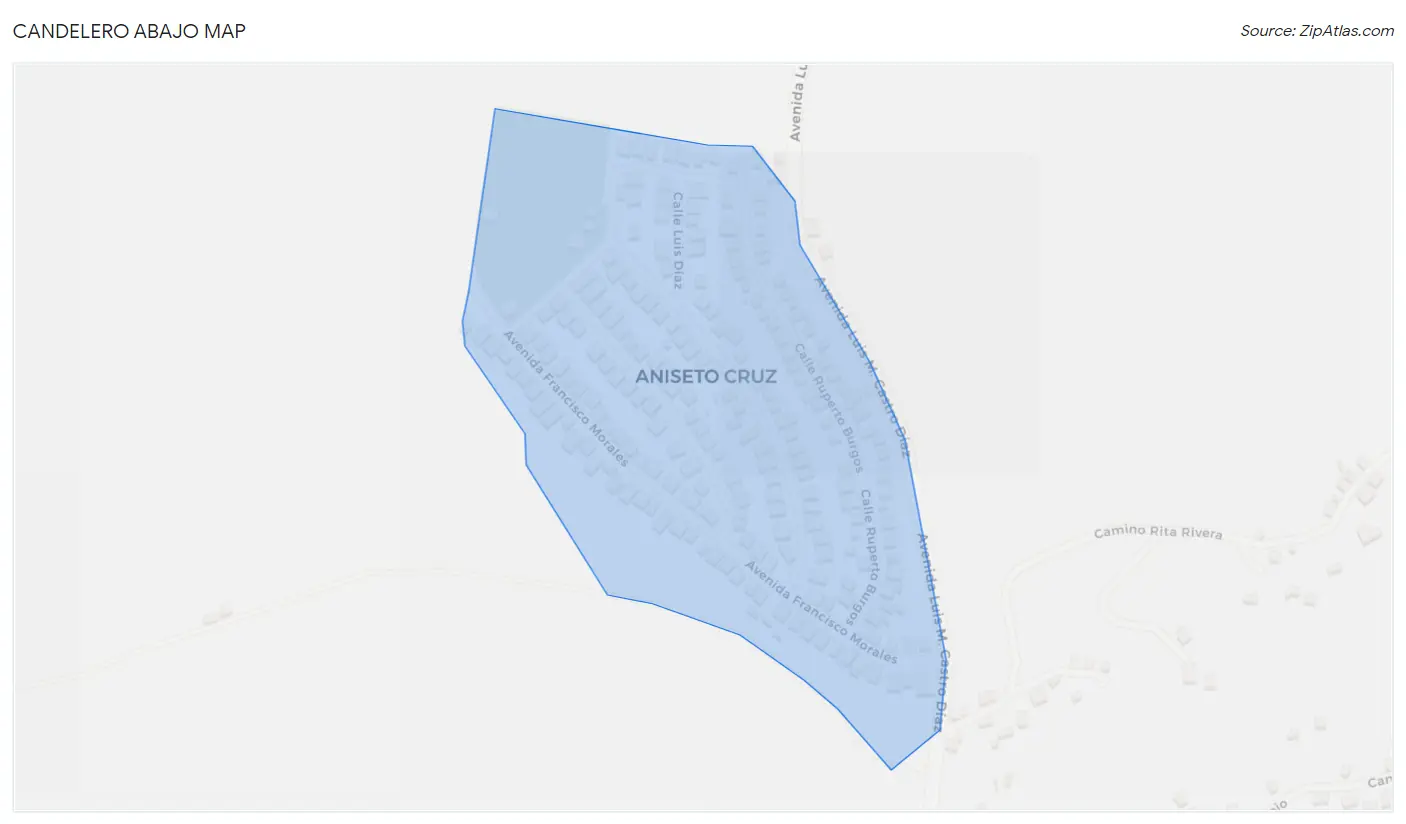
Candelero Abajo Overview
482
TOTAL POPULATION
261
MALE POPULATION
221
FEMALE POPULATION
118.10
MALES / 100 FEMALES
84.67
FEMALES / 100 MALES
34.2
MEDIAN AGE
2.8
AVG FAMILY SIZE
2.6
AVG HOUSEHOLD SIZE
$9,432
PER CAPITA INCOME
$16,167
AVG FAMILY INCOME
$21,985
AVG HOUSEHOLD INCOME
31.4%
WAGE / INCOME GAP [ % ]
68.6¢/ $1
WAGE / INCOME GAP [ $ ]
$12,234
FAMILY INCOME DEFICIT
0.28
INEQUALITY / GINI INDEX
148
LABOR FORCE [ PEOPLE ]
48.2%
PERCENT IN LABOR FORCE
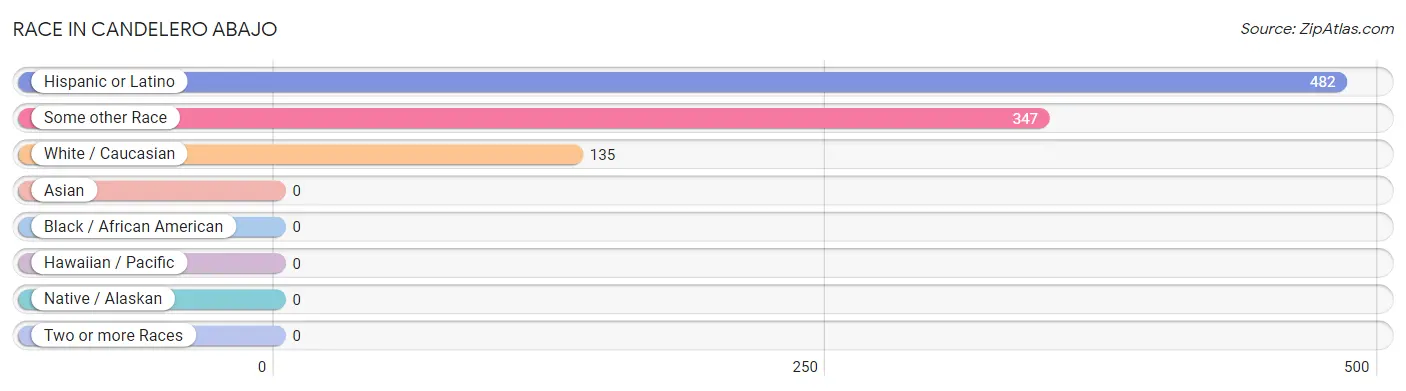
Race in Candelero Abajo
The most populous races in Candelero Abajo are Hispanic or Latino (482 | 100.0%), Some other Race (347 | 72.0%), and White / Caucasian (135 | 28.0%).
| Race | # Population | % Population |
| Asian | 0 | 0.0% |
| Black / African American | 0 | 0.0% |
| Hawaiian / Pacific | 0 | 0.0% |
| Hispanic or Latino | 482 | 100.0% |
| Native / Alaskan | 0 | 0.0% |
| White / Caucasian | 135 | 28.0% |
| Two or more Races | 0 | 0.0% |
| Some other Race | 347 | 72.0% |
| Total | 482 | 100.0% |
Ancestry in Candelero Abajo
The most populous ancestries reported in Candelero Abajo are , and Puerto Rican (482 | 100.0%), together accounting for 100.0% of all Candelero Abajo residents.

| Ancestry | # Population | % Population |
| Puerto Rican | 482 | 100.0% | View All 1 Rows |
Immigrants in Candelero Abajo

| Immigration Origin | # Population | % Population | View All 0 Rows |
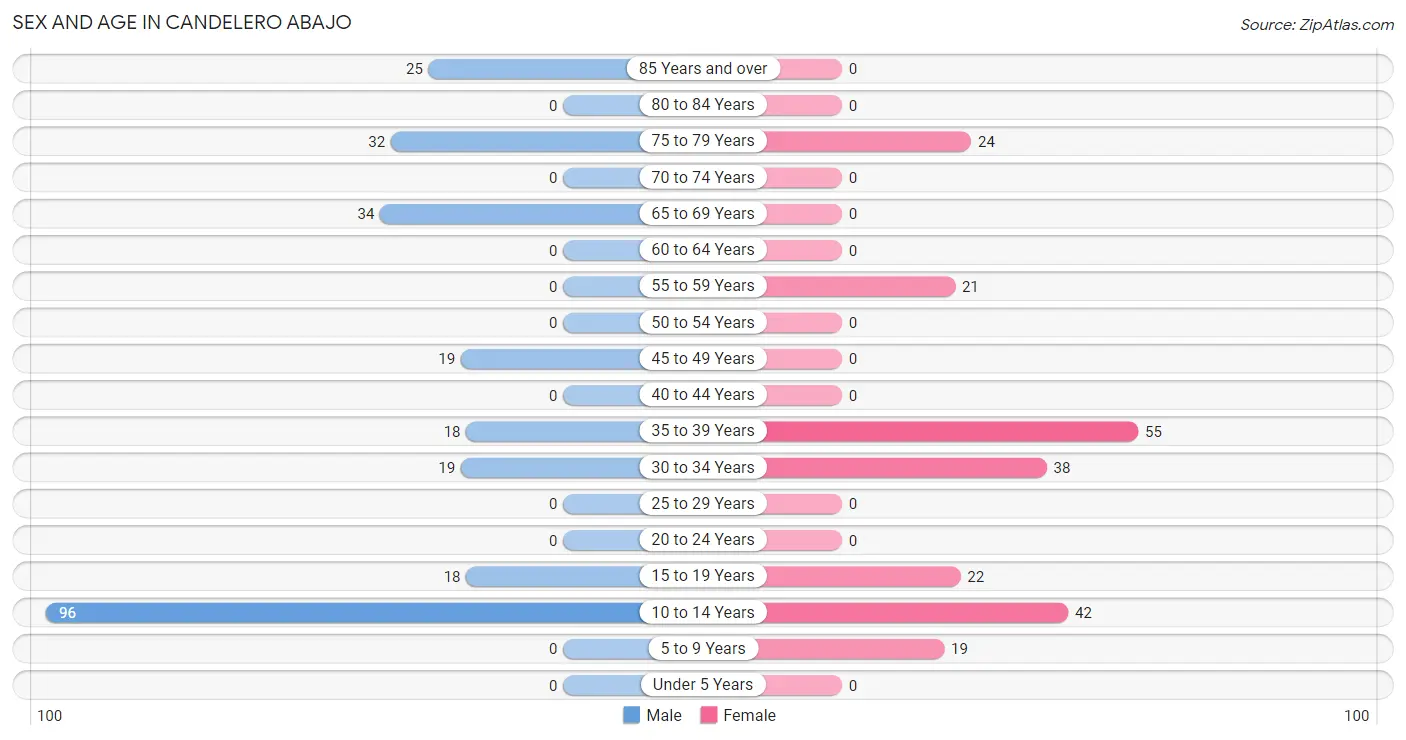
Sex and Age in Candelero Abajo
Sex and Age in Candelero Abajo
The most populous age groups in Candelero Abajo are 10 to 14 Years (96 | 36.8%) for men and 35 to 39 Years (55 | 24.9%) for women.
| Age Bracket | Male | Female |
| Under 5 Years | 0 (0.0%) | 0 (0.0%) |
| 5 to 9 Years | 0 (0.0%) | 19 (8.6%) |
| 10 to 14 Years | 96 (36.8%) | 42 (19.0%) |
| 15 to 19 Years | 18 (6.9%) | 22 (10.0%) |
| 20 to 24 Years | 0 (0.0%) | 0 (0.0%) |
| 25 to 29 Years | 0 (0.0%) | 0 (0.0%) |
| 30 to 34 Years | 19 (7.3%) | 38 (17.2%) |
| 35 to 39 Years | 18 (6.9%) | 55 (24.9%) |
| 40 to 44 Years | 0 (0.0%) | 0 (0.0%) |
| 45 to 49 Years | 19 (7.3%) | 0 (0.0%) |
| 50 to 54 Years | 0 (0.0%) | 0 (0.0%) |
| 55 to 59 Years | 0 (0.0%) | 21 (9.5%) |
| 60 to 64 Years | 0 (0.0%) | 0 (0.0%) |
| 65 to 69 Years | 34 (13.0%) | 0 (0.0%) |
| 70 to 74 Years | 0 (0.0%) | 0 (0.0%) |
| 75 to 79 Years | 32 (12.3%) | 24 (10.9%) |
| 80 to 84 Years | 0 (0.0%) | 0 (0.0%) |
| 85 Years and over | 25 (9.6%) | 0 (0.0%) |
| Total | 261 (100.0%) | 221 (100.0%) |
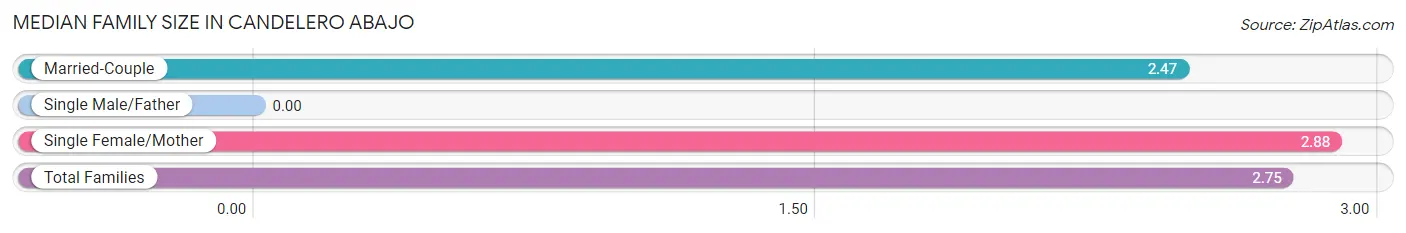
Families and Households in Candelero Abajo
Median Family Size in Candelero Abajo
| Family Type | # Families | Family Size |
| Married-Couple | 45 (32.6%) | 2.47 |
| Single Male/Father | 0 (0.0%) | - |
| Single Female/Mother | 93 (67.4%) | 2.88 |
| Total Families | 138 (100.0%) | 2.75 |
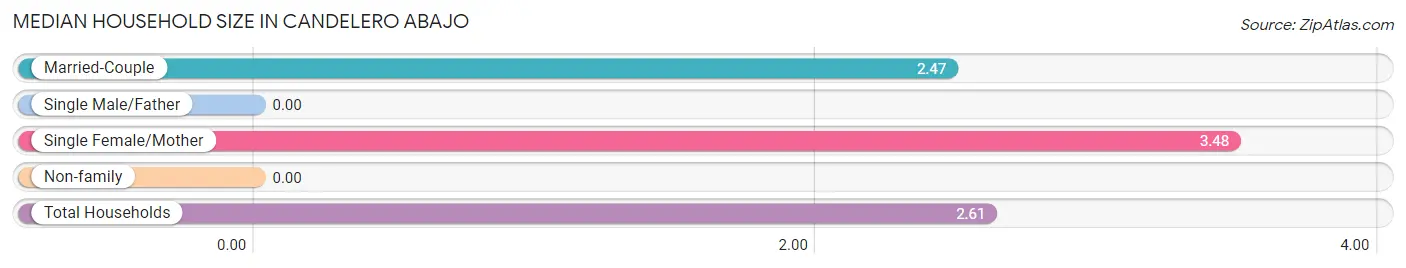
Median Household Size in Candelero Abajo
| Household Type | # Households | Household Size |
| Married-Couple | 45 (24.3%) | 2.47 |
| Single Male/Father | 0 (0.0%) | - |
| Single Female/Mother | 93 (50.3%) | 3.48 |
| Non-family | 47 (25.4%) | - |
| Total Households | 185 (100.0%) | 2.61 |
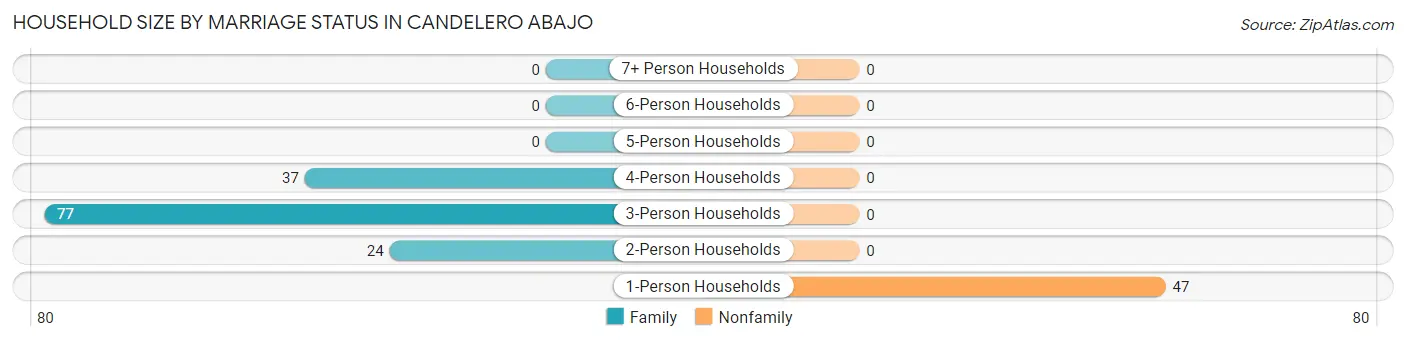
Household Size by Marriage Status in Candelero Abajo
Out of a total of 185 households in Candelero Abajo, 138 (74.6%) are family households, while 47 (25.4%) are nonfamily households. The most numerous type of family households are 3-person households, comprising 77, and the most common type of nonfamily households are 1-person households, comprising 47.
| Household Size | Family Households | Nonfamily Households |
| 1-Person Households | - | 47 (25.4%) |
| 2-Person Households | 24 (13.0%) | 0 (0.0%) |
| 3-Person Households | 77 (41.6%) | 0 (0.0%) |
| 4-Person Households | 37 (20.0%) | 0 (0.0%) |
| 5-Person Households | 0 (0.0%) | 0 (0.0%) |
| 6-Person Households | 0 (0.0%) | 0 (0.0%) |
| 7+ Person Households | 0 (0.0%) | 0 (0.0%) |
| Total | 138 (74.6%) | 47 (25.4%) |
Female Fertility in Candelero Abajo
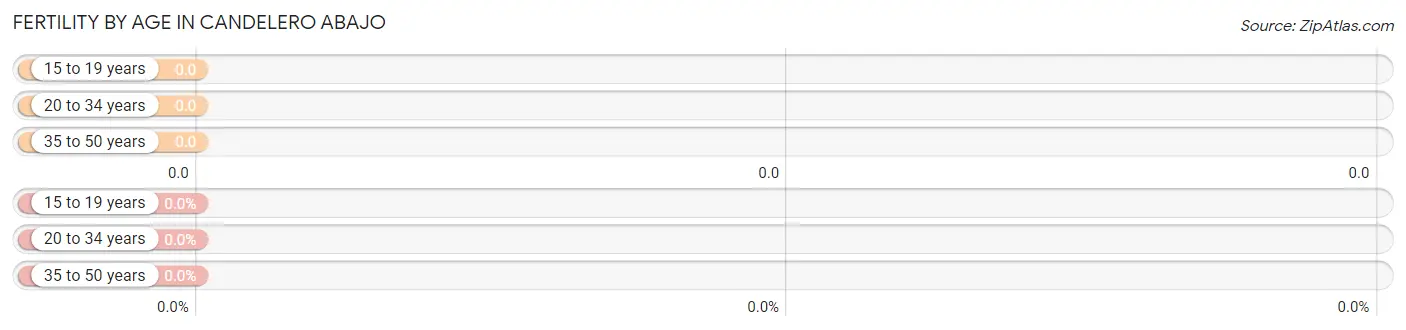
Fertility by Age in Candelero Abajo
| Age Bracket | Women with Births | Births / 1,000 Women |
| 15 to 19 years | 0 (0.0%) | 0.0 |
| 20 to 34 years | 0 (0.0%) | 0.0 |
| 35 to 50 years | 0 (0.0%) | 0.0 |
| Total | 0 (0.0%) | 0.0 |
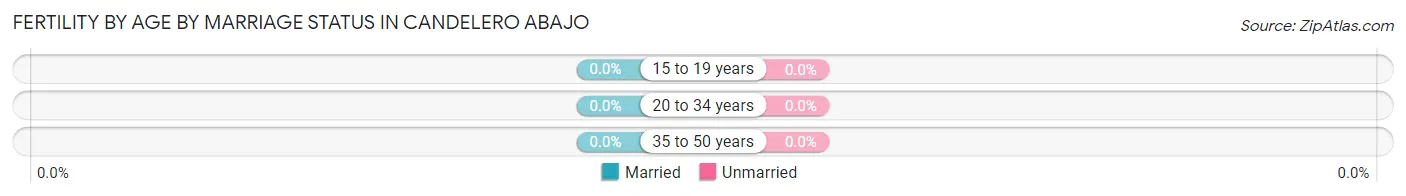
Fertility by Age by Marriage Status in Candelero Abajo
| Age Bracket | Married | Unmarried |
| 15 to 19 years | 0 (0.0%) | 0 (0.0%) |
| 20 to 34 years | 0 (0.0%) | 0 (0.0%) |
| 35 to 50 years | 0 (0.0%) | 0 (0.0%) |
| Total | 0 (0.0%) | 0 (0.0%) |
Fertility by Education in Candelero Abajo
| Educational Attainment | Women with Births | Births / 1,000 Women |
| Less than High School | 0 (0.0%) | 0.0 |
| High School Diploma | 0 (0.0%) | 0.0 |
| College or Associate's Degree | 0 (0.0%) | 0.0 |
| Bachelor's Degree | 0 (0.0%) | 0.0 |
| Graduate Degree | 0 (0.0%) | 0.0 |
| Total | 0 (0.0%) | 0.0 |
Fertility by Education by Marriage Status in Candelero Abajo
| Educational Attainment | Married | Unmarried |
| Less than High School | 0 (0.0%) | 0 (0.0%) |
| High School Diploma | 0 (0.0%) | 0 (0.0%) |
| College or Associate's Degree | 0 (0.0%) | 0 (0.0%) |
| Bachelor's Degree | 0 (0.0%) | 0 (0.0%) |
| Graduate Degree | 0 (0.0%) | 0 (0.0%) |
| Total | 0 (0.0%) | 0 (0.0%) |
Income in Candelero Abajo
Income Overview in Candelero Abajo
Per Capita Income in Candelero Abajo is $9,432, while median incomes of families and households are $16,167 and $21,985 respectively.
| Characteristic | Number | Measure |
| Per Capita Income | 482 | $9,432 |
| Median Family Income | 138 | $16,167 |
| Mean Family Income | 138 | $20,766 |
| Median Household Income | 185 | $21,985 |
| Mean Household Income | 185 | $25,242 |
| Income Deficit | 138 | $12,234 |
| Wage / Income Gap (%) | 482 | 31.35% |
| Wage / Income Gap ($) | 482 | 68.65¢ per $1 |
| Gini / Inequality Index | 482 | 0.28 |
Earnings by Sex in Candelero Abajo
Average Earnings in Candelero Abajo are $14,392, $13,783 for men and $20,078 for women, a difference of 31.4%.
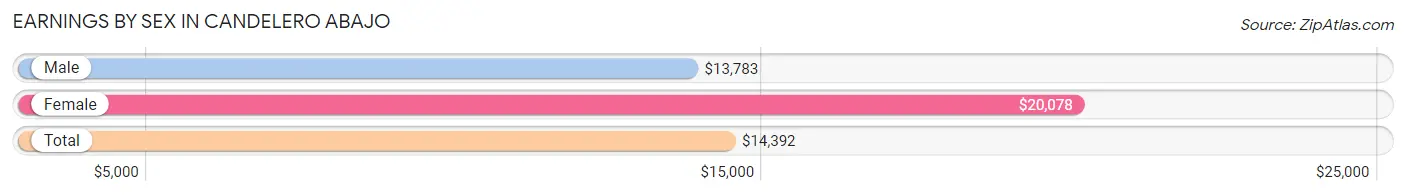
| Sex | Number | Average Earnings |
| Male | 75 (50.7%) | $13,783 |
| Female | 73 (49.3%) | $20,078 |
| Total | 148 (100.0%) | $14,392 |
Earnings by Sex by Income Bracket in Candelero Abajo
The most common earnings brackets in Candelero Abajo are $12,500 to $14,999 for men (38 | 50.7%) and $12,500 to $14,999 for women (36 | 49.3%).
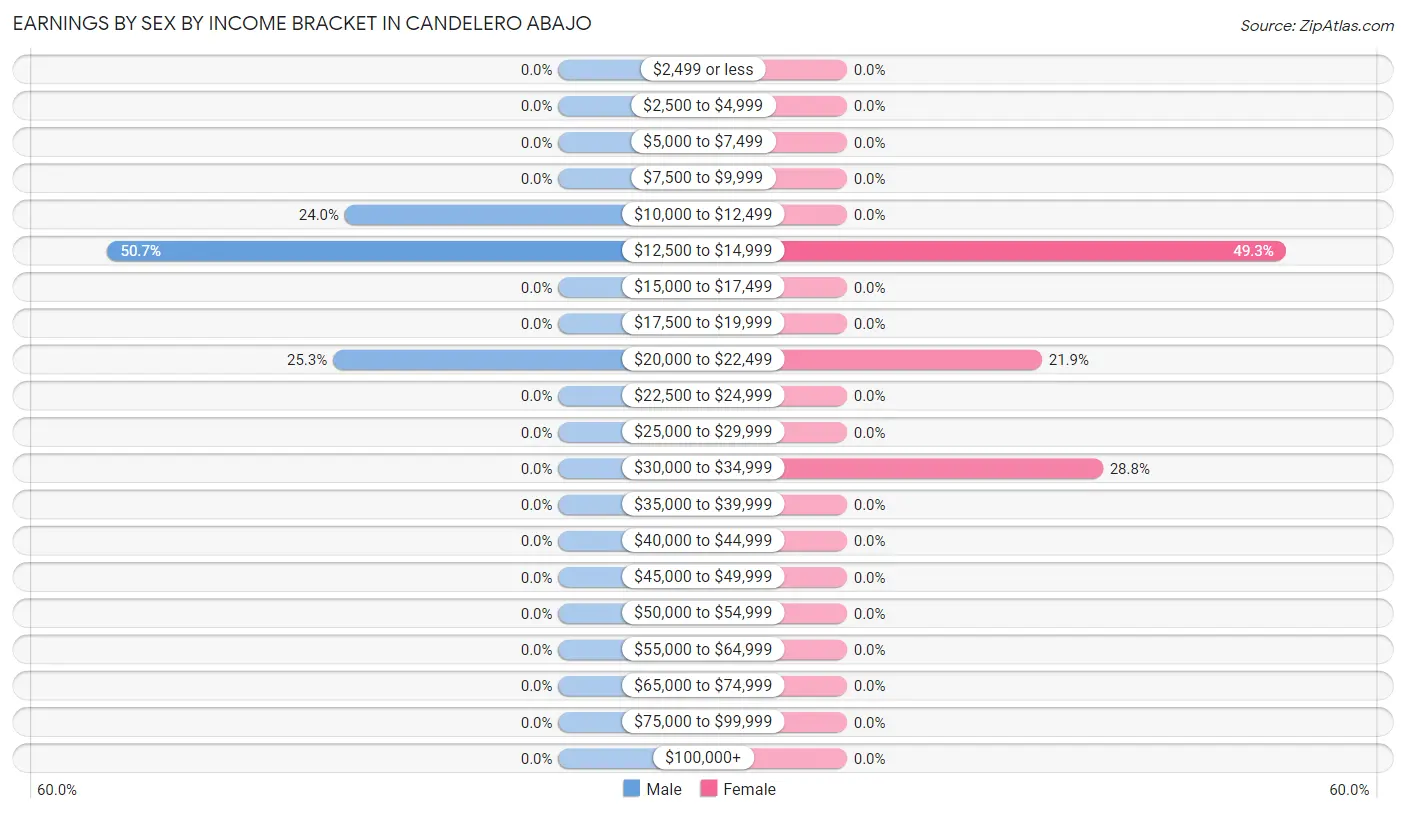
| Income | Male | Female |
| $2,499 or less | 0 (0.0%) | 0 (0.0%) |
| $2,500 to $4,999 | 0 (0.0%) | 0 (0.0%) |
| $5,000 to $7,499 | 0 (0.0%) | 0 (0.0%) |
| $7,500 to $9,999 | 0 (0.0%) | 0 (0.0%) |
| $10,000 to $12,499 | 18 (24.0%) | 0 (0.0%) |
| $12,500 to $14,999 | 38 (50.7%) | 36 (49.3%) |
| $15,000 to $17,499 | 0 (0.0%) | 0 (0.0%) |
| $17,500 to $19,999 | 0 (0.0%) | 0 (0.0%) |
| $20,000 to $22,499 | 19 (25.3%) | 16 (21.9%) |
| $22,500 to $24,999 | 0 (0.0%) | 0 (0.0%) |
| $25,000 to $29,999 | 0 (0.0%) | 0 (0.0%) |
| $30,000 to $34,999 | 0 (0.0%) | 21 (28.8%) |
| $35,000 to $39,999 | 0 (0.0%) | 0 (0.0%) |
| $40,000 to $44,999 | 0 (0.0%) | 0 (0.0%) |
| $45,000 to $49,999 | 0 (0.0%) | 0 (0.0%) |
| $50,000 to $54,999 | 0 (0.0%) | 0 (0.0%) |
| $55,000 to $64,999 | 0 (0.0%) | 0 (0.0%) |
| $65,000 to $74,999 | 0 (0.0%) | 0 (0.0%) |
| $75,000 to $99,999 | 0 (0.0%) | 0 (0.0%) |
| $100,000+ | 0 (0.0%) | 0 (0.0%) |
| Total | 75 (100.0%) | 73 (100.0%) |
Earnings by Sex by Educational Attainment in Candelero Abajo
Average earnings in Candelero Abajo are $13,783 for men and $20,078 for women, a difference of 31.4%. Men with an educational attainment of high school diploma enjoy the highest average annual earnings of $13,783, while those with high school diploma education earn the least with $13,783. Women with an educational attainment of college or associate's degree earn the most with the average annual earnings of $21,250, while those with college or associate's degree education have the smallest earnings of $21,250.
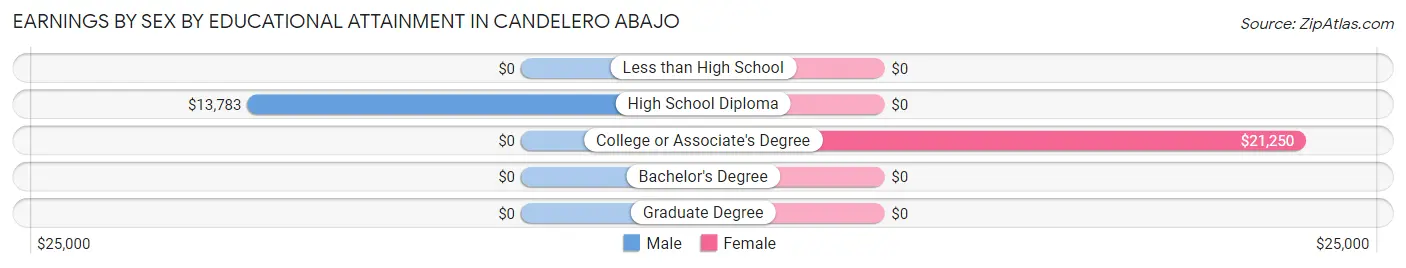
| Educational Attainment | Male Income | Female Income |
| Less than High School | - | - |
| High School Diploma | $13,783 | $0 |
| College or Associate's Degree | - | - |
| Bachelor's Degree | - | - |
| Graduate Degree | - | - |
| Total | $13,783 | $20,078 |
Family Income in Candelero Abajo
Family Income Brackets in Candelero Abajo
According to the Candelero Abajo family income data, there are 55 families falling into the $15,000 to $24,999 income range, which is the most common income bracket and makes up 39.9% of all families.
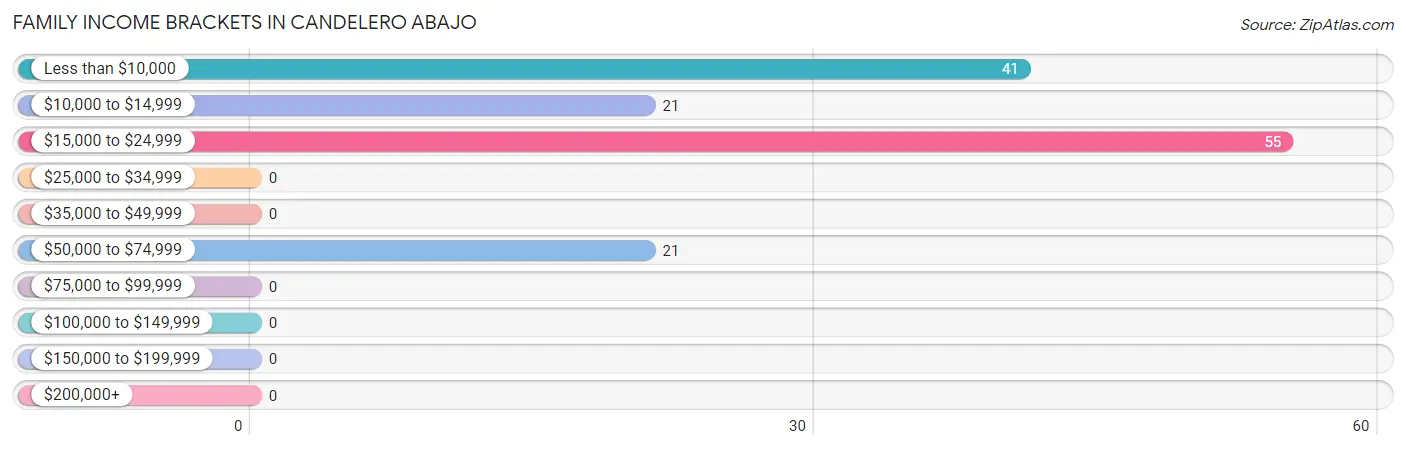
| Income Bracket | # Families | % Families |
| Less than $10,000 | 41 | 29.7% |
| $10,000 to $14,999 | 21 | 15.2% |
| $15,000 to $24,999 | 55 | 39.9% |
| $25,000 to $34,999 | 0 | 0.0% |
| $35,000 to $49,999 | 0 | 0.0% |
| $50,000 to $74,999 | 21 | 15.2% |
| $75,000 to $99,999 | 0 | 0.0% |
| $100,000 to $149,999 | 0 | 0.0% |
| $150,000 to $199,999 | 0 | 0.0% |
| $200,000+ | 0 | 0.0% |
Family Income by Famaliy Size in Candelero Abajo
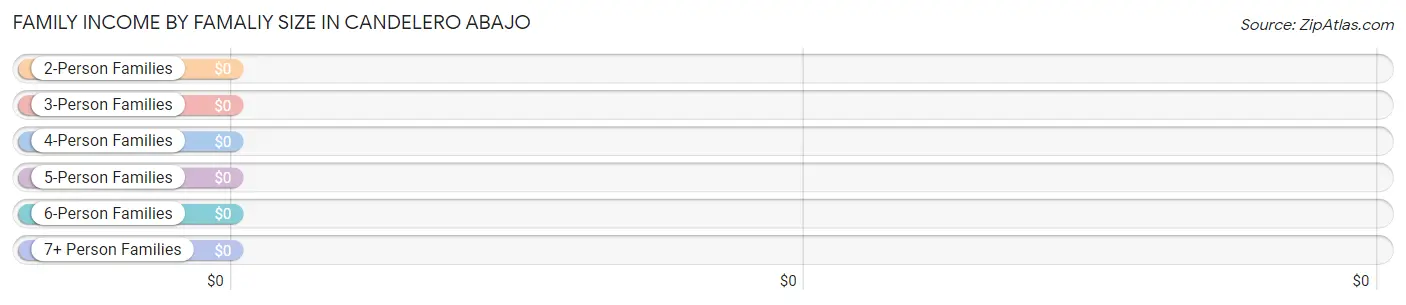
| Income Bracket | # Families | Median Income |
| 2-Person Families | 64 (46.4%) | $0 |
| 3-Person Families | 59 (42.7%) | $0 |
| 4-Person Families | 15 (10.9%) | $0 |
| 5-Person Families | 0 (0.0%) | $0 |
| 6-Person Families | 0 (0.0%) | $0 |
| 7+ Person Families | 0 (0.0%) | $0 |
| Total | 138 (100.0%) | $16,167 |
Family Income by Number of Earners in Candelero Abajo
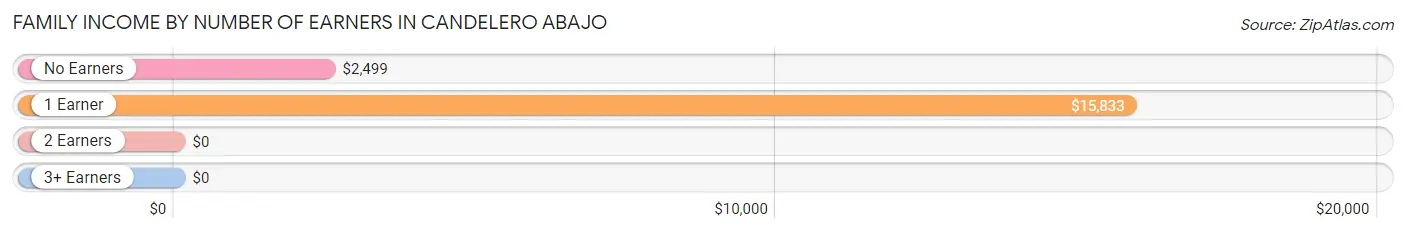
| Number of Earners | # Families | Median Income |
| No Earners | 65 (47.1%) | $2,499 |
| 1 Earner | 52 (37.7%) | $15,833 |
| 2 Earners | 21 (15.2%) | $0 |
| 3+ Earners | 0 (0.0%) | $0 |
| Total | 138 (100.0%) | $16,167 |
Household Income in Candelero Abajo
Household Income Brackets in Candelero Abajo
With 106 households falling in the category, the $15,000 to $24,999 income range is the most frequent in Candelero Abajo, accounting for 57.3% of all households.
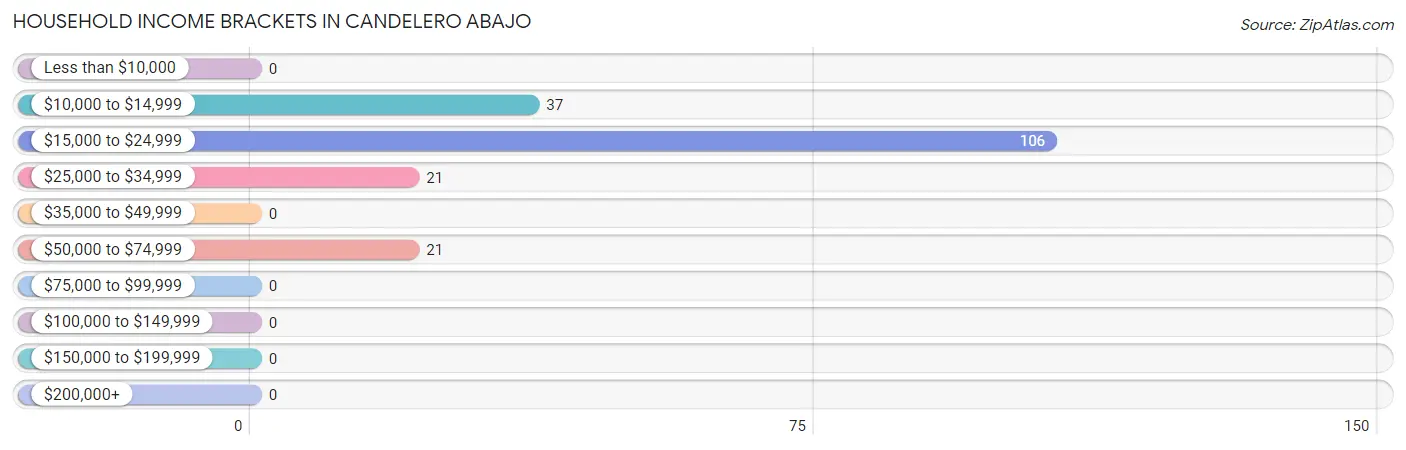
| Income Bracket | # Households | % Households |
| Less than $10,000 | 0 | 0.0% |
| $10,000 to $14,999 | 37 | 20.0% |
| $15,000 to $24,999 | 106 | 57.3% |
| $25,000 to $34,999 | 21 | 11.4% |
| $35,000 to $49,999 | 0 | 0.0% |
| $50,000 to $74,999 | 21 | 11.4% |
| $75,000 to $99,999 | 0 | 0.0% |
| $100,000 to $149,999 | 0 | 0.0% |
| $150,000 to $199,999 | 0 | 0.0% |
| $200,000+ | 0 | 0.0% |
Household Income by Householder Age in Candelero Abajo
The median household income in Candelero Abajo is $21,985, with the highest median household income of $21,602 found in the 65+ years age bracket for the primary householder. A total of 71 households (38.4%) fall into this category.
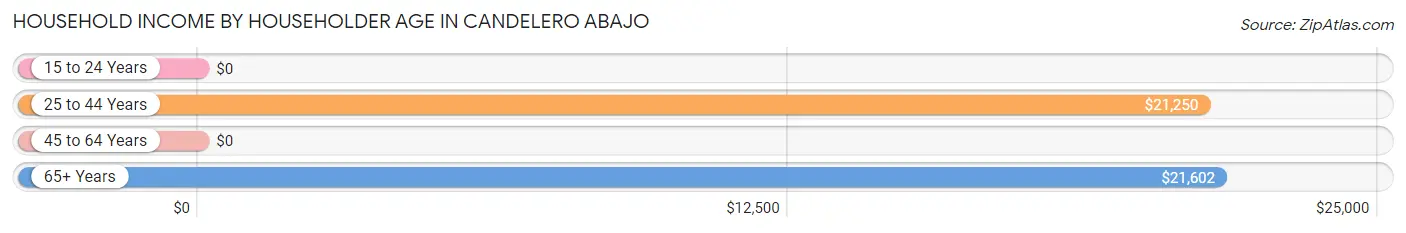
| Income Bracket | # Households | Median Income |
| 15 to 24 Years | 0 (0.0%) | $0 |
| 25 to 44 Years | 93 (50.3%) | $21,250 |
| 45 to 64 Years | 21 (11.4%) | $0 |
| 65+ Years | 71 (38.4%) | $21,602 |
| Total | 185 (100.0%) | $21,985 |
Poverty in Candelero Abajo
Income Below Poverty by Sex and Age in Candelero Abajo
With 63.6% poverty level for males and 69.7% for females among the residents of Candelero Abajo, 6 to 11 year old males and 6 to 11 year old females are the most vulnerable to poverty, with 37 males (100.0%) and 37 females (100.0%) in their respective age groups living below the poverty level.
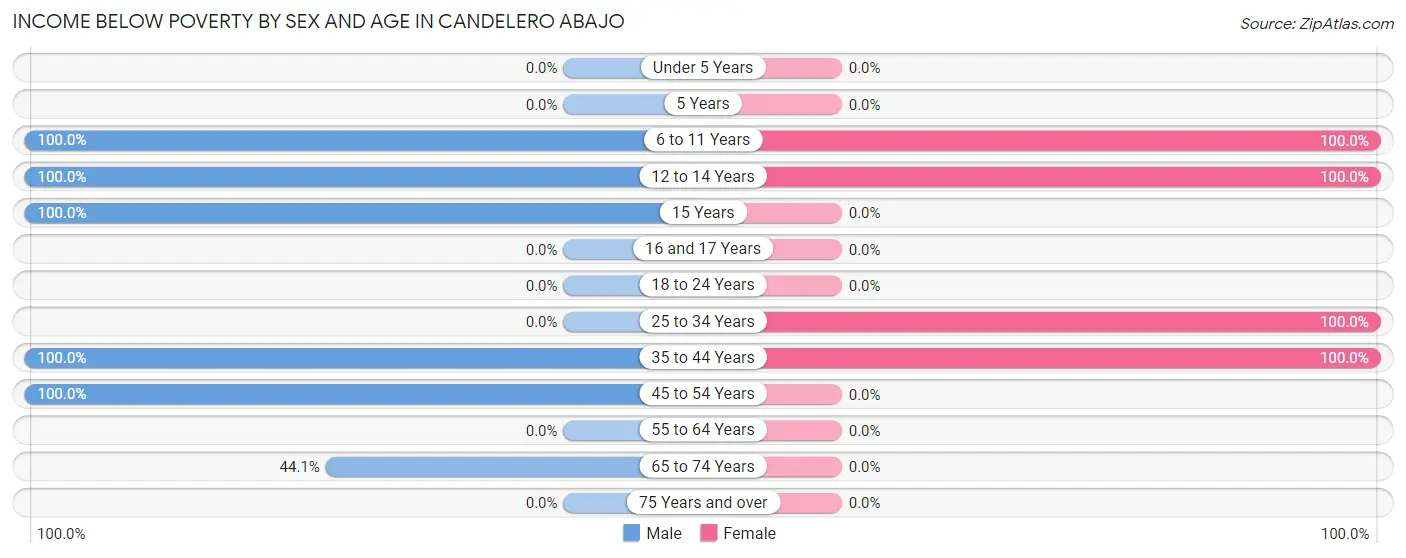
| Age Bracket | Male | Female |
| Under 5 Years | 0 (0.0%) | 0 (0.0%) |
| 5 Years | 0 (0.0%) | 0 (0.0%) |
| 6 to 11 Years | 37 (100.0%) | 37 (100.0%) |
| 12 to 14 Years | 59 (100.0%) | 24 (100.0%) |
| 15 Years | 18 (100.0%) | 0 (0.0%) |
| 16 and 17 Years | 0 (0.0%) | 0 (0.0%) |
| 18 to 24 Years | 0 (0.0%) | 0 (0.0%) |
| 25 to 34 Years | 0 (0.0%) | 38 (100.0%) |
| 35 to 44 Years | 18 (100.0%) | 55 (100.0%) |
| 45 to 54 Years | 19 (100.0%) | 0 (0.0%) |
| 55 to 64 Years | 0 (0.0%) | 0 (0.0%) |
| 65 to 74 Years | 15 (44.1%) | 0 (0.0%) |
| 75 Years and over | 0 (0.0%) | 0 (0.0%) |
| Total | 166 (63.6%) | 154 (69.7%) |
Income Above Poverty by Sex and Age in Candelero Abajo
According to the poverty statistics in Candelero Abajo, males aged 25 to 34 years and females aged 18 to 24 years are the age groups that are most secure financially, with 100.0% of males and 100.0% of females in these age groups living above the poverty line.
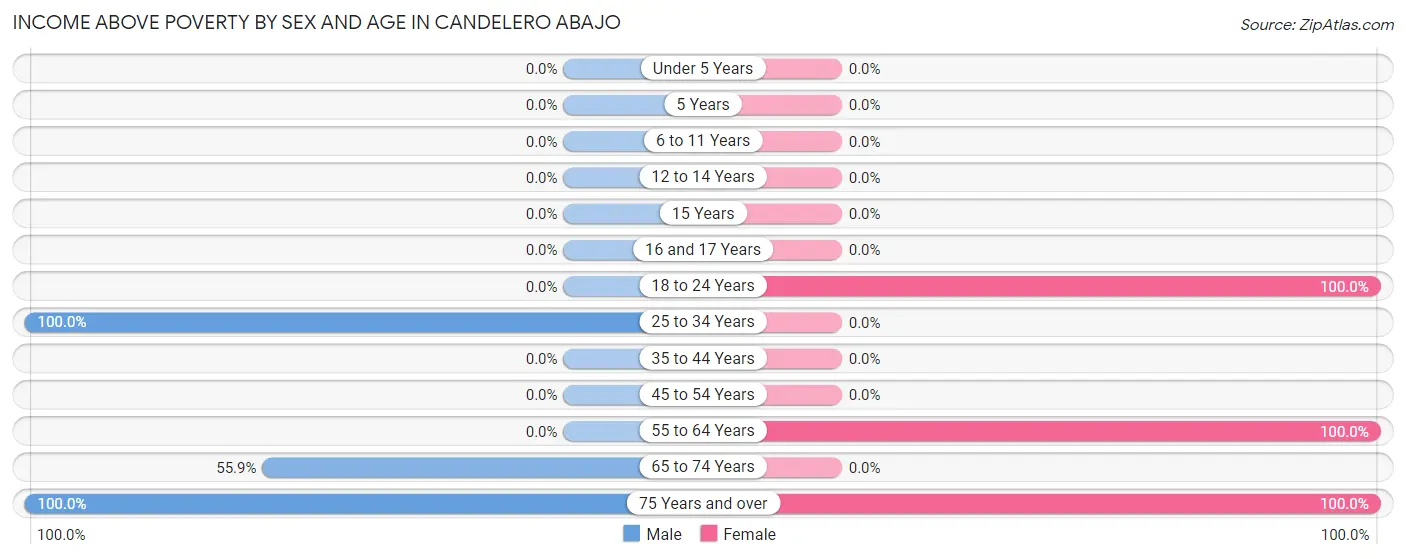
| Age Bracket | Male | Female |
| Under 5 Years | 0 (0.0%) | 0 (0.0%) |
| 5 Years | 0 (0.0%) | 0 (0.0%) |
| 6 to 11 Years | 0 (0.0%) | 0 (0.0%) |
| 12 to 14 Years | 0 (0.0%) | 0 (0.0%) |
| 15 Years | 0 (0.0%) | 0 (0.0%) |
| 16 and 17 Years | 0 (0.0%) | 0 (0.0%) |
| 18 to 24 Years | 0 (0.0%) | 22 (100.0%) |
| 25 to 34 Years | 19 (100.0%) | 0 (0.0%) |
| 35 to 44 Years | 0 (0.0%) | 0 (0.0%) |
| 45 to 54 Years | 0 (0.0%) | 0 (0.0%) |
| 55 to 64 Years | 0 (0.0%) | 21 (100.0%) |
| 65 to 74 Years | 19 (55.9%) | 0 (0.0%) |
| 75 Years and over | 57 (100.0%) | 24 (100.0%) |
| Total | 95 (36.4%) | 67 (30.3%) |
Income Below Poverty Among Married-Couple Families in Candelero Abajo
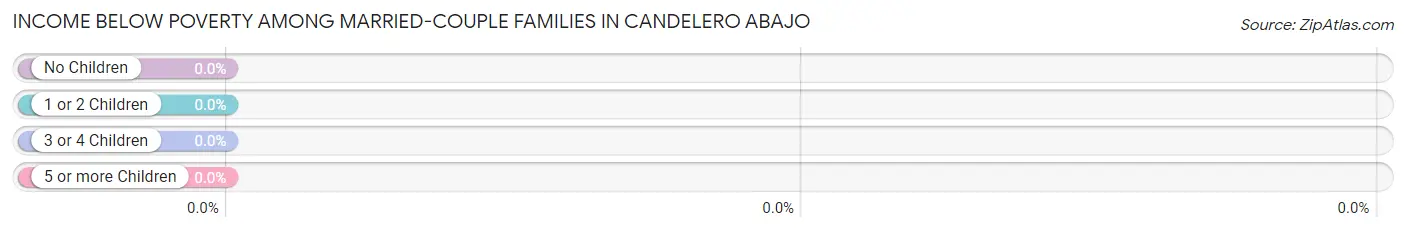
| Children | Above Poverty | Below Poverty |
| No Children | 45 (100.0%) | 0 (0.0%) |
| 1 or 2 Children | 0 (0.0%) | 0 (0.0%) |
| 3 or 4 Children | 0 (0.0%) | 0 (0.0%) |
| 5 or more Children | 0 (0.0%) | 0 (0.0%) |
| Total | 45 (100.0%) | 0 (0.0%) |
Income Below Poverty Among Single-Parent Households in Candelero Abajo
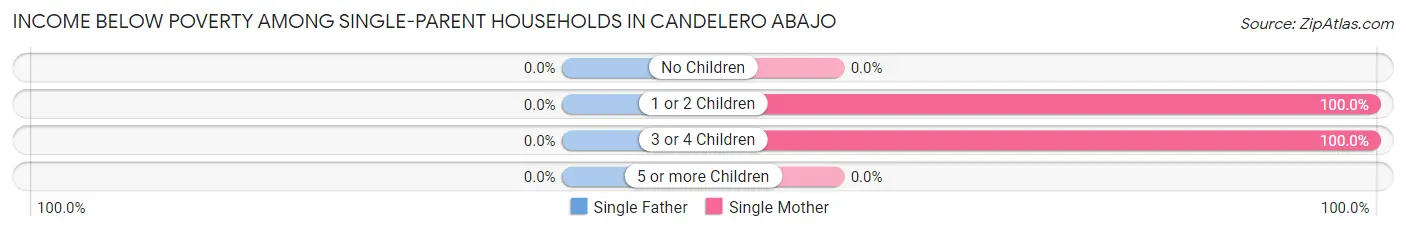
| Children | Single Father | Single Mother |
| No Children | 0 (0.0%) | 0 (0.0%) |
| 1 or 2 Children | 0 (0.0%) | 78 (100.0%) |
| 3 or 4 Children | 0 (0.0%) | 15 (100.0%) |
| 5 or more Children | 0 (0.0%) | 0 (0.0%) |
| Total | 0 (0.0%) | 93 (100.0%) |
Income Below Poverty Among Married-Couple vs Single-Parent Households in Candelero Abajo
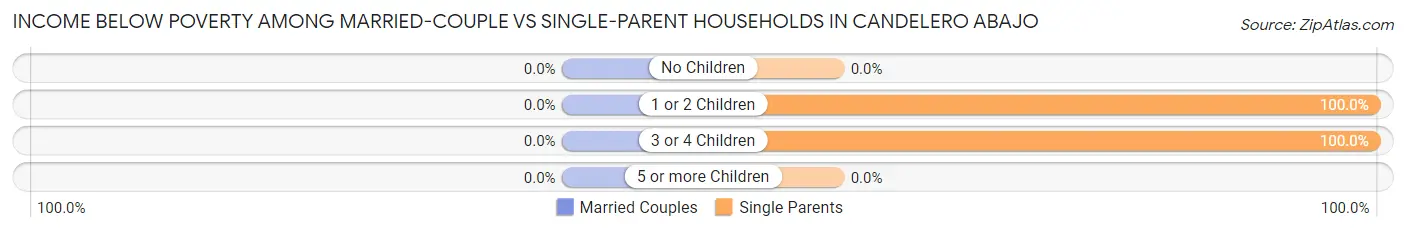
| Children | Married-Couple Families | Single-Parent Households |
| No Children | 0 (0.0%) | 0 (0.0%) |
| 1 or 2 Children | 0 (0.0%) | 78 (100.0%) |
| 3 or 4 Children | 0 (0.0%) | 15 (100.0%) |
| 5 or more Children | 0 (0.0%) | 0 (0.0%) |
| Total | 0 (0.0%) | 93 (100.0%) |
Employment Characteristics in Candelero Abajo
Employment by Class of Employer in Candelero Abajo
Among the 148 employed individuals in Candelero Abajo, self-employed (not incorporated) (58 | 39.2%), private company employees (50 | 33.8%), and not-for-profit organizations (40 | 27.0%) make up the most common classes of employment.
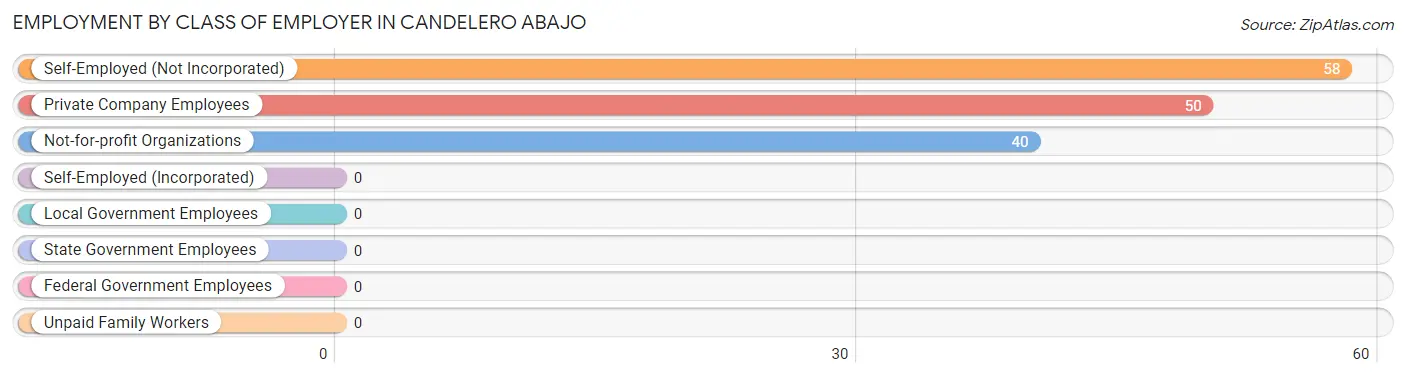
| Employer Class | # Employees | % Employees |
| Private Company Employees | 50 | 33.8% |
| Self-Employed (Incorporated) | 0 | 0.0% |
| Self-Employed (Not Incorporated) | 58 | 39.2% |
| Not-for-profit Organizations | 40 | 27.0% |
| Local Government Employees | 0 | 0.0% |
| State Government Employees | 0 | 0.0% |
| Federal Government Employees | 0 | 0.0% |
| Unpaid Family Workers | 0 | 0.0% |
| Total | 148 | 100.0% |
Employment Status by Age in Candelero Abajo
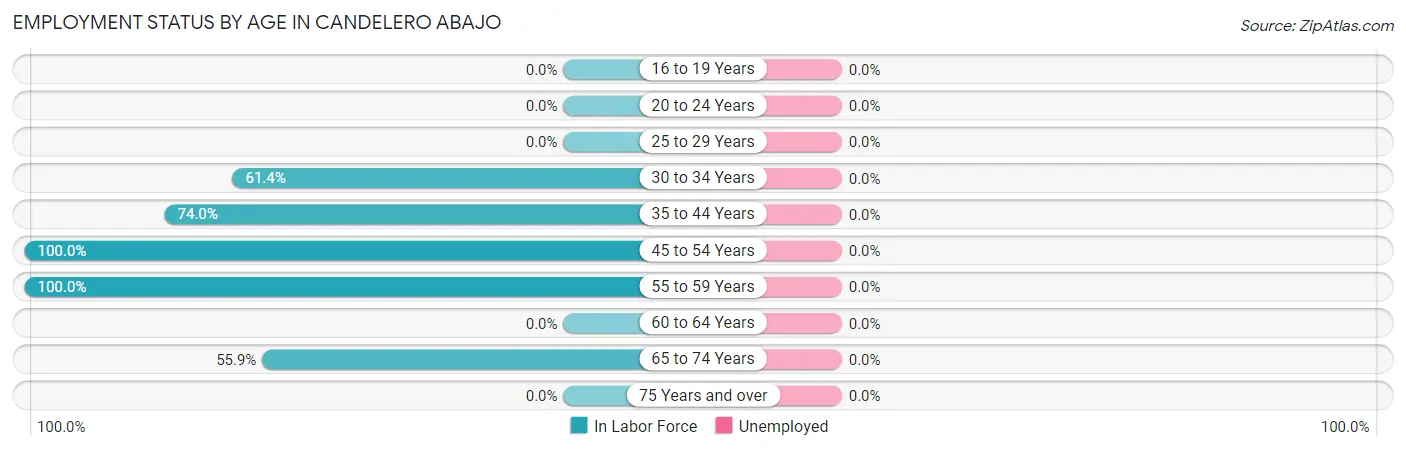
| Age Bracket | In Labor Force | Unemployed |
| 16 to 19 Years | 0 (0.0%) | 0 (0.0%) |
| 20 to 24 Years | 0 (0.0%) | 0 (0.0%) |
| 25 to 29 Years | 0 (0.0%) | 0 (0.0%) |
| 30 to 34 Years | 35 (61.4%) | 0 (0.0%) |
| 35 to 44 Years | 54 (74.0%) | 0 (0.0%) |
| 45 to 54 Years | 19 (100.0%) | 0 (0.0%) |
| 55 to 59 Years | 21 (100.0%) | 0 (0.0%) |
| 60 to 64 Years | 0 (0.0%) | 0 (0.0%) |
| 65 to 74 Years | 19 (55.9%) | 0 (0.0%) |
| 75 Years and over | 0 (0.0%) | 0 (0.0%) |
| Total | 148 (48.2%) | 0 (0.0%) |
Employment Status by Educational Attainment in Candelero Abajo
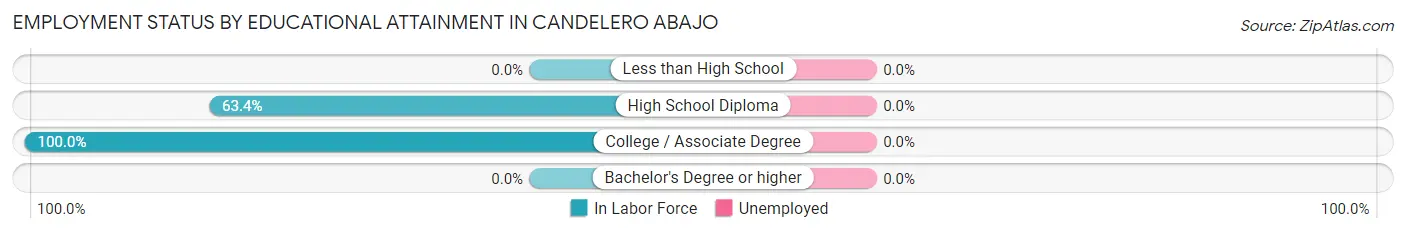
| Educational Attainment | In Labor Force | Unemployed |
| Less than High School | 0 (0.0%) | 0 (0.0%) |
| High School Diploma | 71 (63.4%) | 0 (0.0%) |
| College / Associate Degree | 58 (100.0%) | 0 (0.0%) |
| Bachelor's Degree or higher | 0 (0.0%) | 0 (0.0%) |
| Total | 129 (75.9%) | 0 (0.0%) |
Employment Occupations by Sex in Candelero Abajo
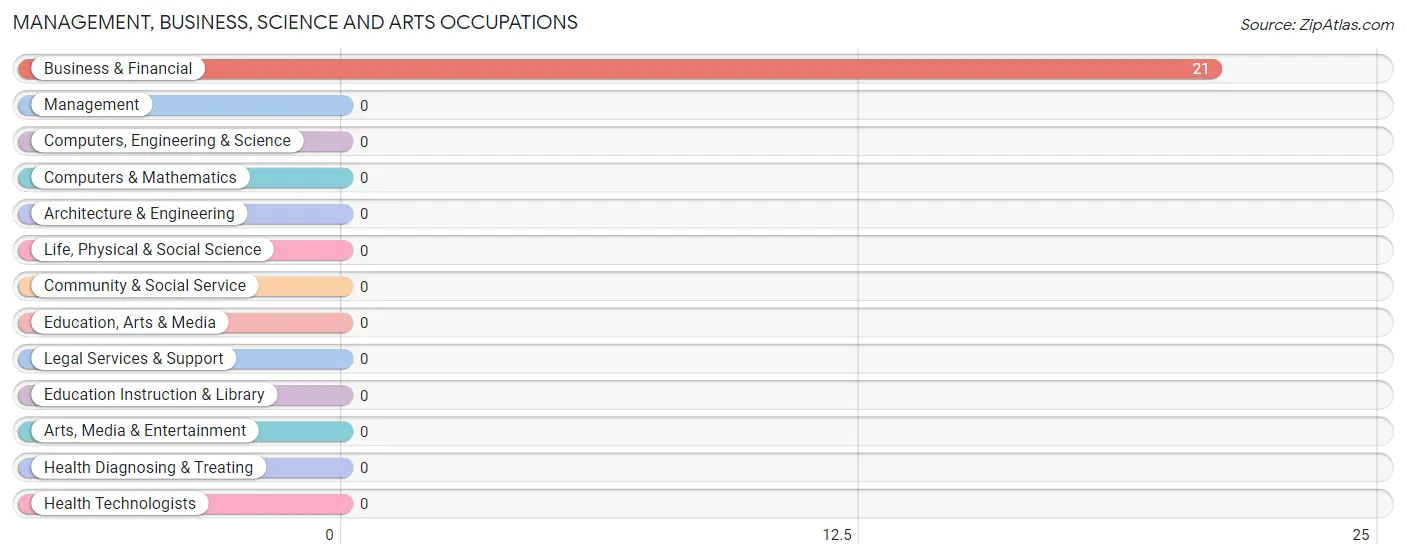
Management, Business, Science and Arts Occupations
The most common Management, Business, Science and Arts occupations in Candelero Abajo are , and Business & Financial (21 | 14.2%).
Management, Business, Science and Arts Occupations by Sex
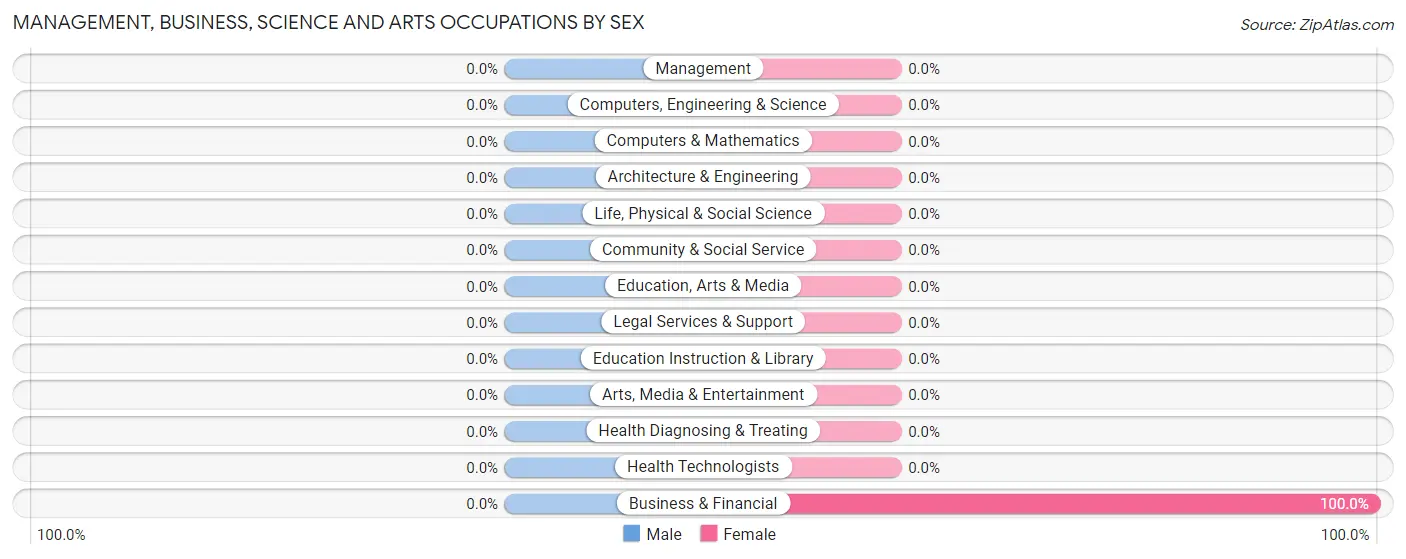
| Occupation | Male | Female |
| Management | 0 (0.0%) | 0 (0.0%) |
| Business & Financial | 0 (0.0%) | 21 (100.0%) |
| Computers, Engineering & Science | 0 (0.0%) | 0 (0.0%) |
| Computers & Mathematics | 0 (0.0%) | 0 (0.0%) |
| Architecture & Engineering | 0 (0.0%) | 0 (0.0%) |
| Life, Physical & Social Science | 0 (0.0%) | 0 (0.0%) |
| Community & Social Service | 0 (0.0%) | 0 (0.0%) |
| Education, Arts & Media | 0 (0.0%) | 0 (0.0%) |
| Legal Services & Support | 0 (0.0%) | 0 (0.0%) |
| Education Instruction & Library | 0 (0.0%) | 0 (0.0%) |
| Arts, Media & Entertainment | 0 (0.0%) | 0 (0.0%) |
| Health Diagnosing & Treating | 0 (0.0%) | 0 (0.0%) |
| Health Technologists | 0 (0.0%) | 0 (0.0%) |
| Total (Category) | 0 (0.0%) | 21 (100.0%) |
| Total (Overall) | 75 (50.7%) | 73 (49.3%) |
Services Occupations
The most common Services occupations in Candelero Abajo are Cleaning & Maintenance (19 | 12.8%), and Food Preparation & Serving (15 | 10.1%).
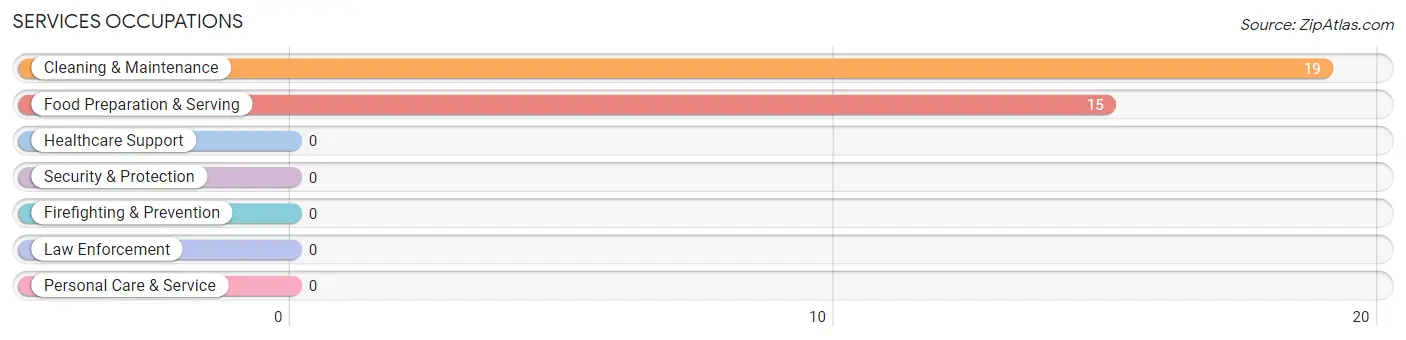
Services Occupations by Sex
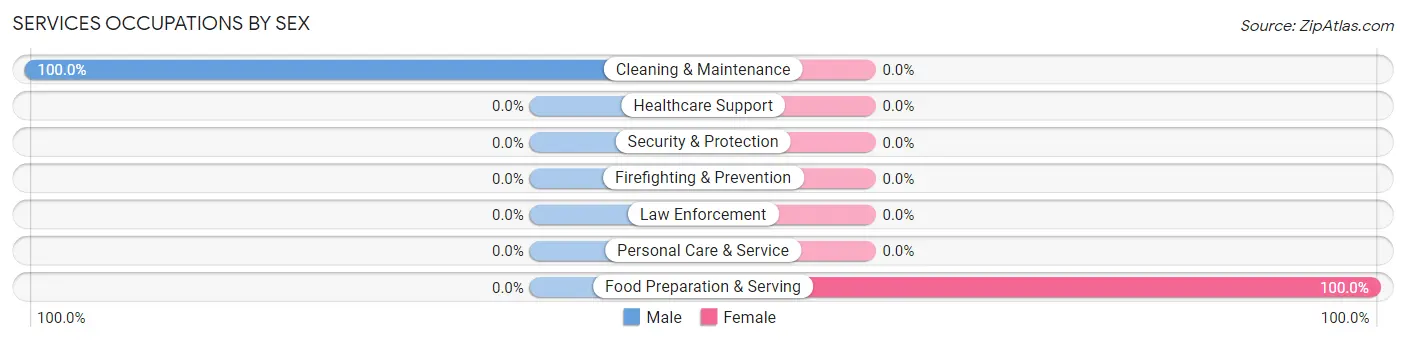
| Occupation | Male | Female |
| Healthcare Support | 0 (0.0%) | 0 (0.0%) |
| Security & Protection | 0 (0.0%) | 0 (0.0%) |
| Firefighting & Prevention | 0 (0.0%) | 0 (0.0%) |
| Law Enforcement | 0 (0.0%) | 0 (0.0%) |
| Food Preparation & Serving | 0 (0.0%) | 15 (100.0%) |
| Cleaning & Maintenance | 19 (100.0%) | 0 (0.0%) |
| Personal Care & Service | 0 (0.0%) | 0 (0.0%) |
| Total (Category) | 19 (55.9%) | 15 (44.1%) |
| Total (Overall) | 75 (50.7%) | 73 (49.3%) |
Sales and Office Occupations
The most common Sales and Office occupations in Candelero Abajo are Sales & Related (21 | 14.2%), and Office & Administration (16 | 10.8%).
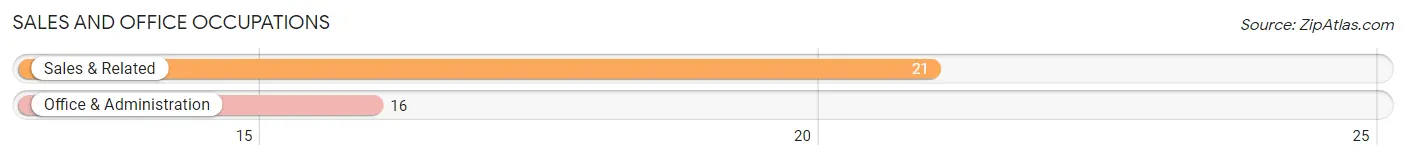
Sales and Office Occupations by Sex
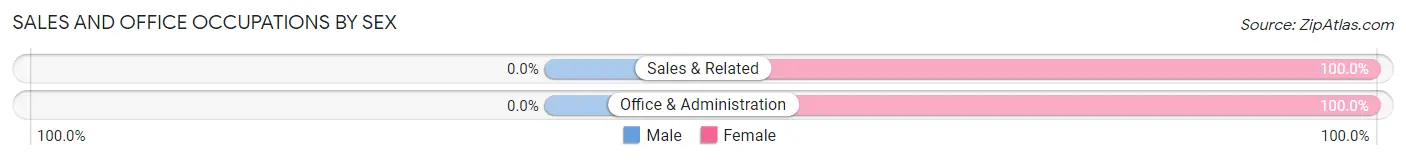
| Occupation | Male | Female |
| Sales & Related | 0 (0.0%) | 21 (100.0%) |
| Office & Administration | 0 (0.0%) | 16 (100.0%) |
| Total (Category) | 0 (0.0%) | 37 (100.0%) |
| Total (Overall) | 75 (50.7%) | 73 (49.3%) |
Natural Resources, Construction and Maintenance Occupations
The most common Natural Resources, Construction and Maintenance occupations in Candelero Abajo are Installation, Maintenance & Repair (19 | 12.8%), and Construction & Extraction (18 | 12.2%).
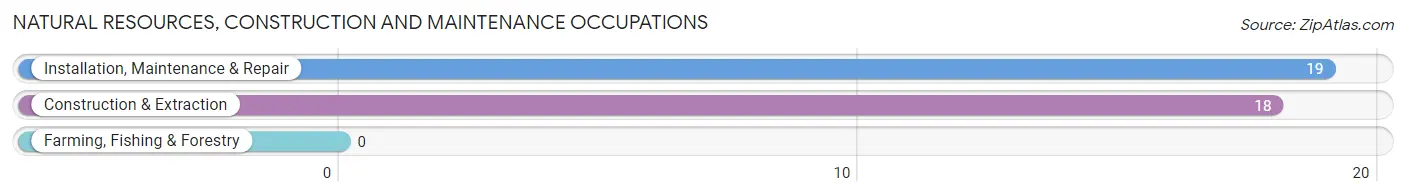
Natural Resources, Construction and Maintenance Occupations by Sex
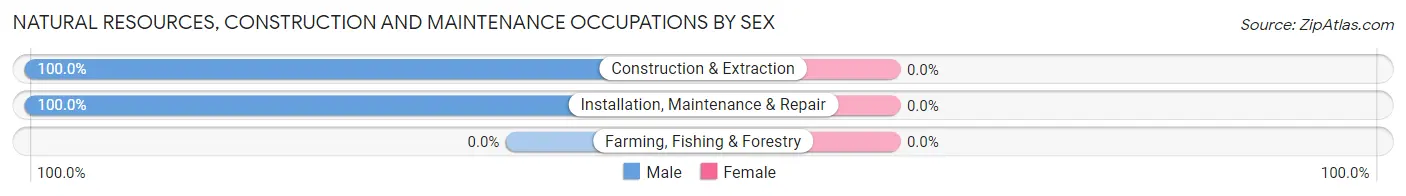
| Occupation | Male | Female |
| Farming, Fishing & Forestry | 0 (0.0%) | 0 (0.0%) |
| Construction & Extraction | 18 (100.0%) | 0 (0.0%) |
| Installation, Maintenance & Repair | 19 (100.0%) | 0 (0.0%) |
| Total (Category) | 37 (100.0%) | 0 (0.0%) |
| Total (Overall) | 75 (50.7%) | 73 (49.3%) |
Production, Transportation and Moving Occupations
The most common Production, Transportation and Moving occupations in Candelero Abajo are , and Material Moving (19 | 12.8%).
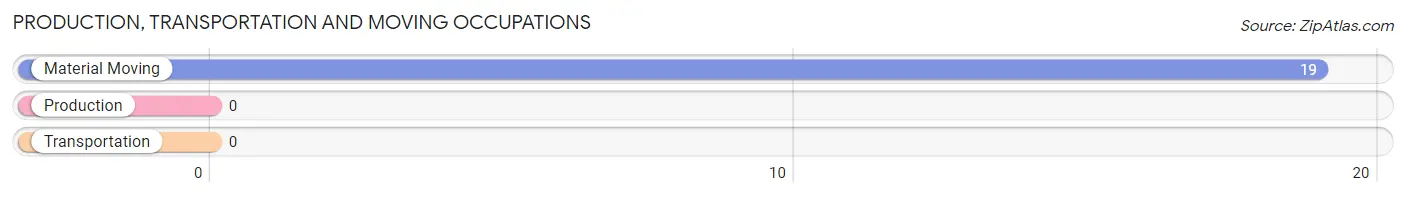
Production, Transportation and Moving Occupations by Sex
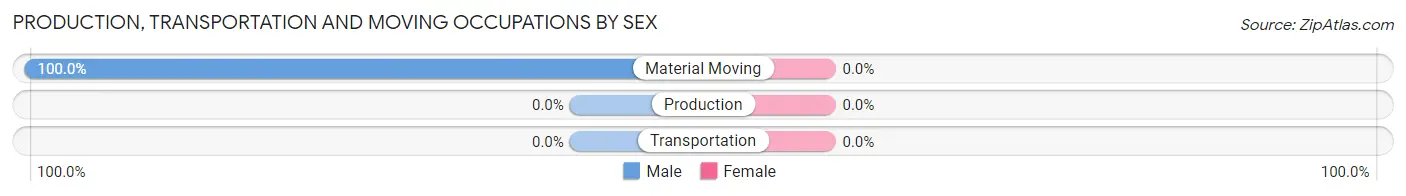
| Occupation | Male | Female |
| Production | 0 (0.0%) | 0 (0.0%) |
| Transportation | 0 (0.0%) | 0 (0.0%) |
| Material Moving | 19 (100.0%) | 0 (0.0%) |
| Total (Category) | 19 (100.0%) | 0 (0.0%) |
| Total (Overall) | 75 (50.7%) | 73 (49.3%) |
Employment Industries by Sex in Candelero Abajo
Employment Industries in Candelero Abajo
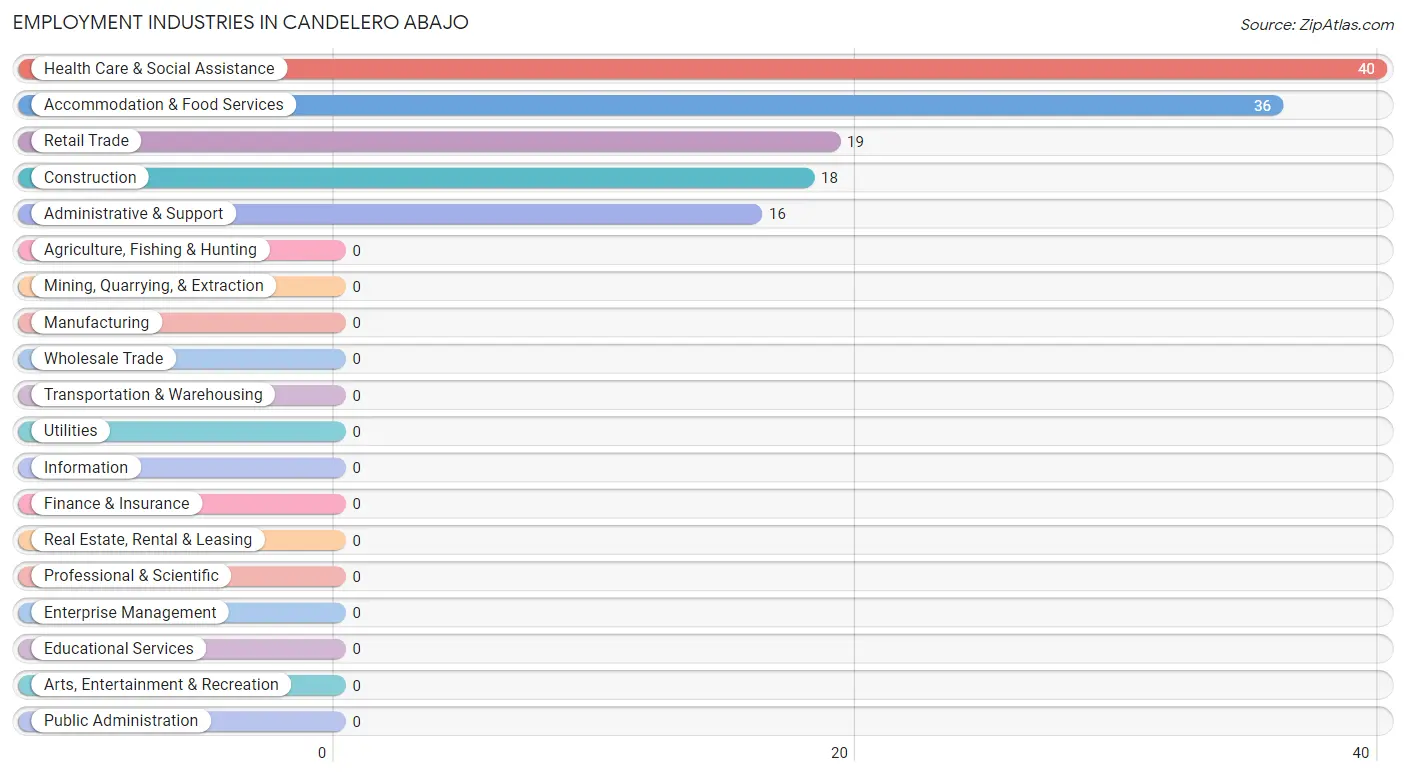
The major employment industries in Candelero Abajo include Health Care & Social Assistance (40 | 27.0%), Accommodation & Food Services (36 | 24.3%), Retail Trade (19 | 12.8%), Construction (18 | 12.2%), and Administrative & Support (16 | 10.8%).
Employment Industries by Sex in Candelero Abajo
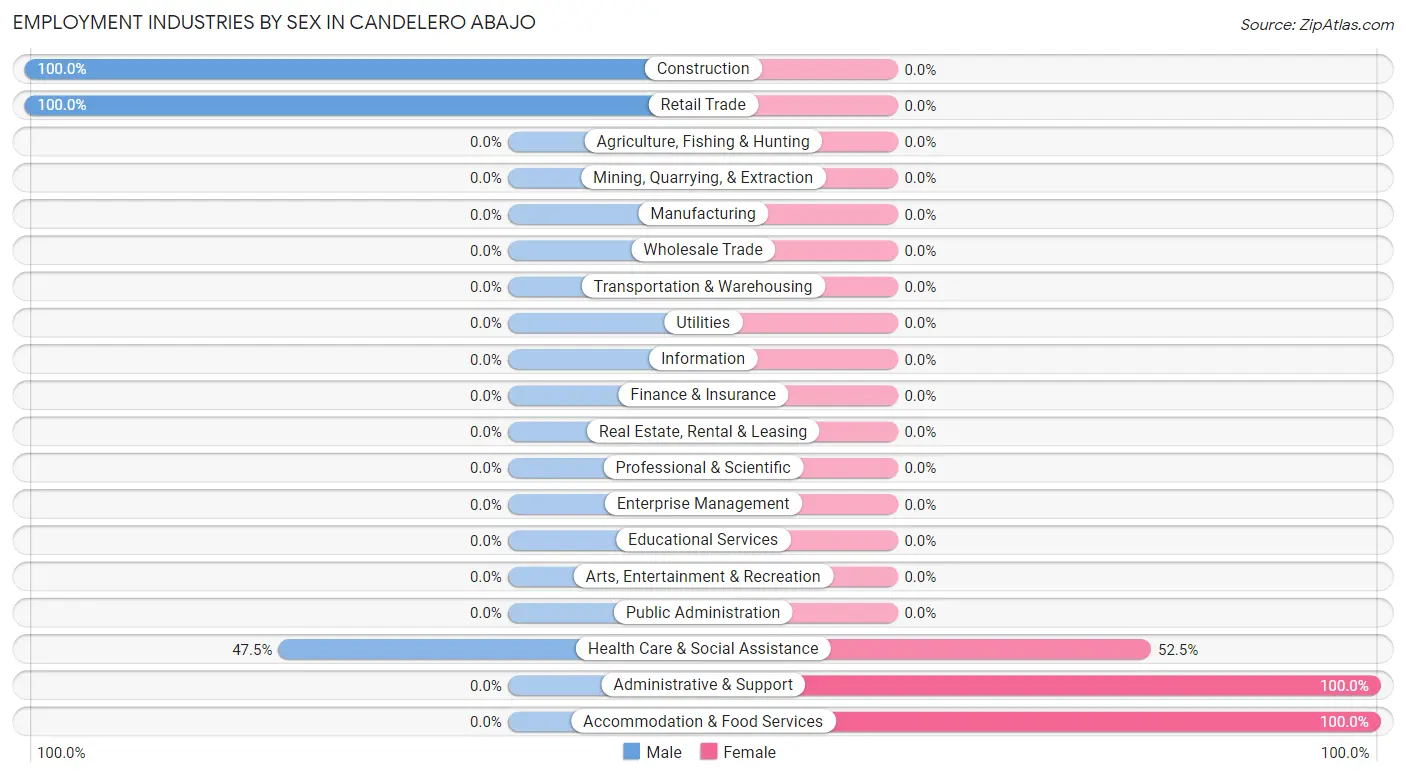
The Candelero Abajo industries that see more men than women are Construction (100.0%), Retail Trade (100.0%), and Health Care & Social Assistance (47.5%), whereas the industries that tend to have a higher number of women are Administrative & Support (100.0%), Accommodation & Food Services (100.0%), and Health Care & Social Assistance (52.5%).
| Industry | Male | Female |
| Agriculture, Fishing & Hunting | 0 (0.0%) | 0 (0.0%) |
| Mining, Quarrying, & Extraction | 0 (0.0%) | 0 (0.0%) |
| Construction | 18 (100.0%) | 0 (0.0%) |
| Manufacturing | 0 (0.0%) | 0 (0.0%) |
| Wholesale Trade | 0 (0.0%) | 0 (0.0%) |
| Retail Trade | 19 (100.0%) | 0 (0.0%) |
| Transportation & Warehousing | 0 (0.0%) | 0 (0.0%) |
| Utilities | 0 (0.0%) | 0 (0.0%) |
| Information | 0 (0.0%) | 0 (0.0%) |
| Finance & Insurance | 0 (0.0%) | 0 (0.0%) |
| Real Estate, Rental & Leasing | 0 (0.0%) | 0 (0.0%) |
| Professional & Scientific | 0 (0.0%) | 0 (0.0%) |
| Enterprise Management | 0 (0.0%) | 0 (0.0%) |
| Administrative & Support | 0 (0.0%) | 16 (100.0%) |
| Educational Services | 0 (0.0%) | 0 (0.0%) |
| Health Care & Social Assistance | 19 (47.5%) | 21 (52.5%) |
| Arts, Entertainment & Recreation | 0 (0.0%) | 0 (0.0%) |
| Accommodation & Food Services | 0 (0.0%) | 36 (100.0%) |
| Public Administration | 0 (0.0%) | 0 (0.0%) |
| Total | 75 (50.7%) | 73 (49.3%) |
Education in Candelero Abajo
School Enrollment in Candelero Abajo
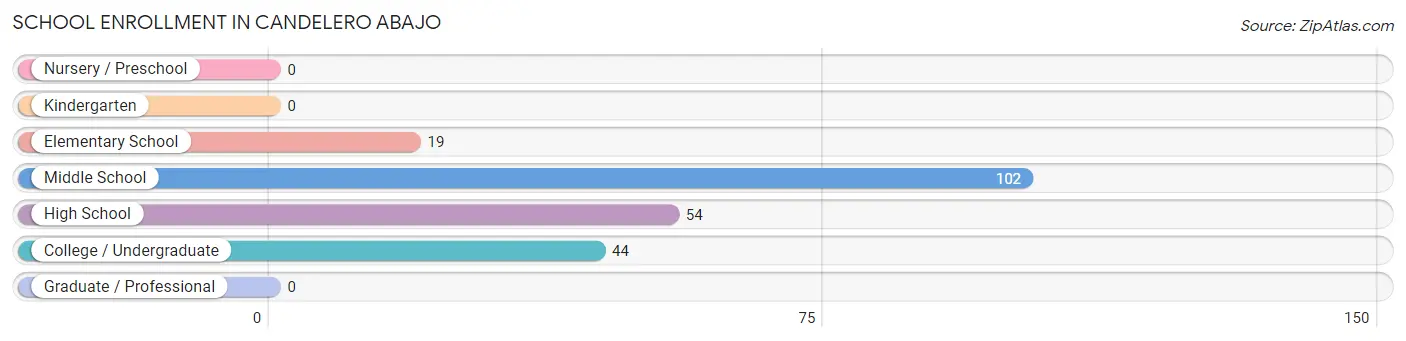
The most common levels of schooling among the 219 students in Candelero Abajo are middle school (102 | 46.6%), high school (54 | 24.7%), and college / undergraduate (44 | 20.1%).
| School Level | # Students | % Students |
| Nursery / Preschool | 0 | 0.0% |
| Kindergarten | 0 | 0.0% |
| Elementary School | 19 | 8.7% |
| Middle School | 102 | 46.6% |
| High School | 54 | 24.7% |
| College / Undergraduate | 44 | 20.1% |
| Graduate / Professional | 0 | 0.0% |
| Total | 219 | 100.0% |
School Enrollment by Age by Funding Source in Candelero Abajo
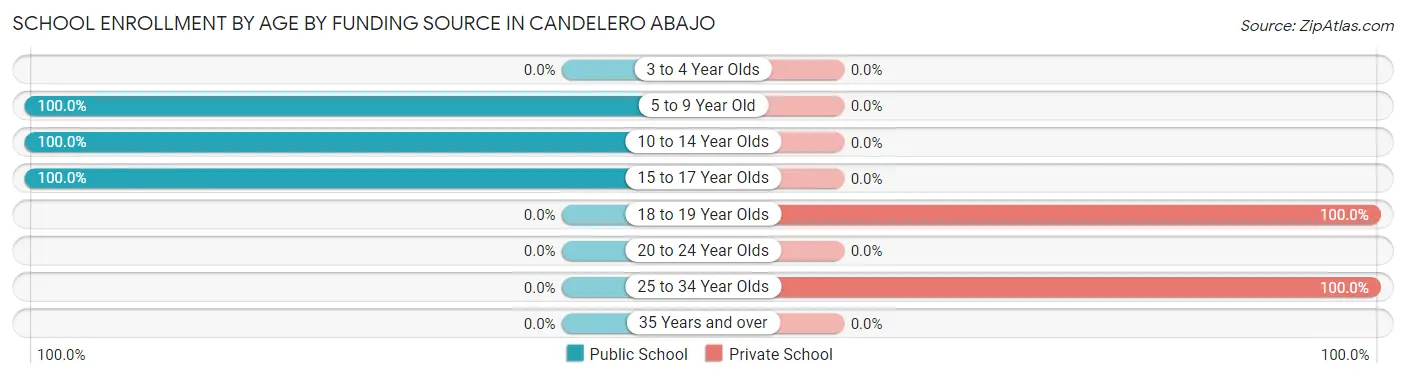
Out of a total of 219 students who are enrolled in schools in Candelero Abajo, 44 (20.1%) attend a private institution, while the remaining 175 (79.9%) are enrolled in public schools. The age group of 18 to 19 year olds has the highest likelihood of being enrolled in private schools, with 22 (100.0% in the age bracket) enrolled. Conversely, the age group of 5 to 9 year old has the lowest likelihood of being enrolled in a private school, with 19 (100.0% in the age bracket) attending a public institution.
| Age Bracket | Public School | Private School |
| 3 to 4 Year Olds | 0 (0.0%) | 0 (0.0%) |
| 5 to 9 Year Old | 19 (100.0%) | 0 (0.0%) |
| 10 to 14 Year Olds | 138 (100.0%) | 0 (0.0%) |
| 15 to 17 Year Olds | 18 (100.0%) | 0 (0.0%) |
| 18 to 19 Year Olds | 0 (0.0%) | 22 (100.0%) |
| 20 to 24 Year Olds | 0 (0.0%) | 0 (0.0%) |
| 25 to 34 Year Olds | 0 (0.0%) | 22 (100.0%) |
| 35 Years and over | 0 (0.0%) | 0 (0.0%) |
| Total | 175 (79.9%) | 44 (20.1%) |
Educational Attainment by Field of Study in Candelero Abajo
| Field of Study | # Graduates | % Graduates |
| Computers & Mathematics | 0 | 0.0% |
| Bio, Nature & Agricultural | 0 | 0.0% |
| Physical & Health Sciences | 0 | 0.0% |
| Psychology | 0 | 0.0% |
| Social Sciences | 0 | 0.0% |
| Engineering | 0 | 0.0% |
| Multidisciplinary Studies | 0 | 0.0% |
| Science & Technology | 0 | 0.0% |
| Business | 0 | 0.0% |
| Education | 0 | 0.0% |
| Literature & Languages | 0 | 0.0% |
| Liberal Arts & History | 0 | 0.0% |
| Visual & Performing Arts | 0 | 0.0% |
| Communications | 0 | 0.0% |
| Arts & Humanities | 0 | 0.0% |
| Total | 0 | 0.0% |
Transportation & Commute in Candelero Abajo
Vehicle Availability by Sex in Candelero Abajo
The most prevalent vehicle ownership categories in Candelero Abajo are males with 1 vehicle (19, accounting for 25.3%) and females with 1 vehicle (52, making up 26.0%).
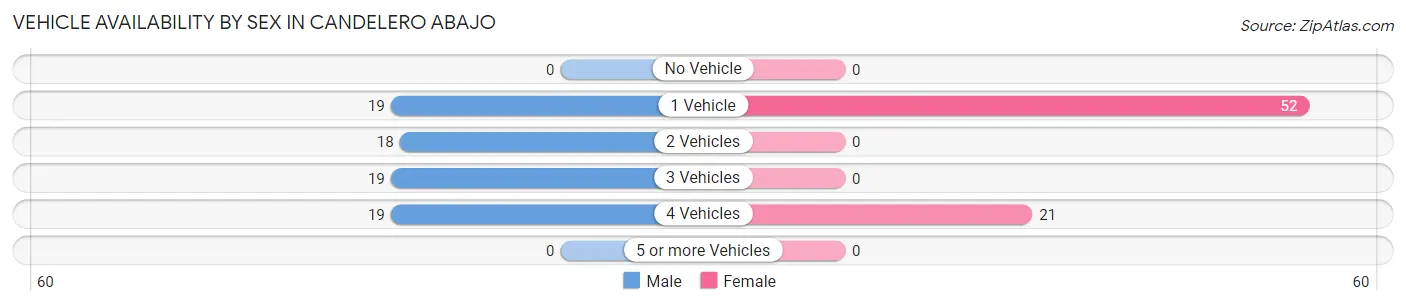
| Vehicles Available | Male | Female |
| No Vehicle | 0 (0.0%) | 0 (0.0%) |
| 1 Vehicle | 19 (25.3%) | 52 (71.2%) |
| 2 Vehicles | 18 (24.0%) | 0 (0.0%) |
| 3 Vehicles | 19 (25.3%) | 0 (0.0%) |
| 4 Vehicles | 19 (25.3%) | 21 (28.8%) |
| 5 or more Vehicles | 0 (0.0%) | 0 (0.0%) |
| Total | 75 (100.0%) | 73 (100.0%) |
Commute Time in Candelero Abajo
The most frequently occuring commute durations in Candelero Abajo are 15 to 19 minutes (71 commuters, 48.0%), 5 to 9 minutes (40 commuters, 27.0%), and 60 to 89 minutes (21 commuters, 14.2%).
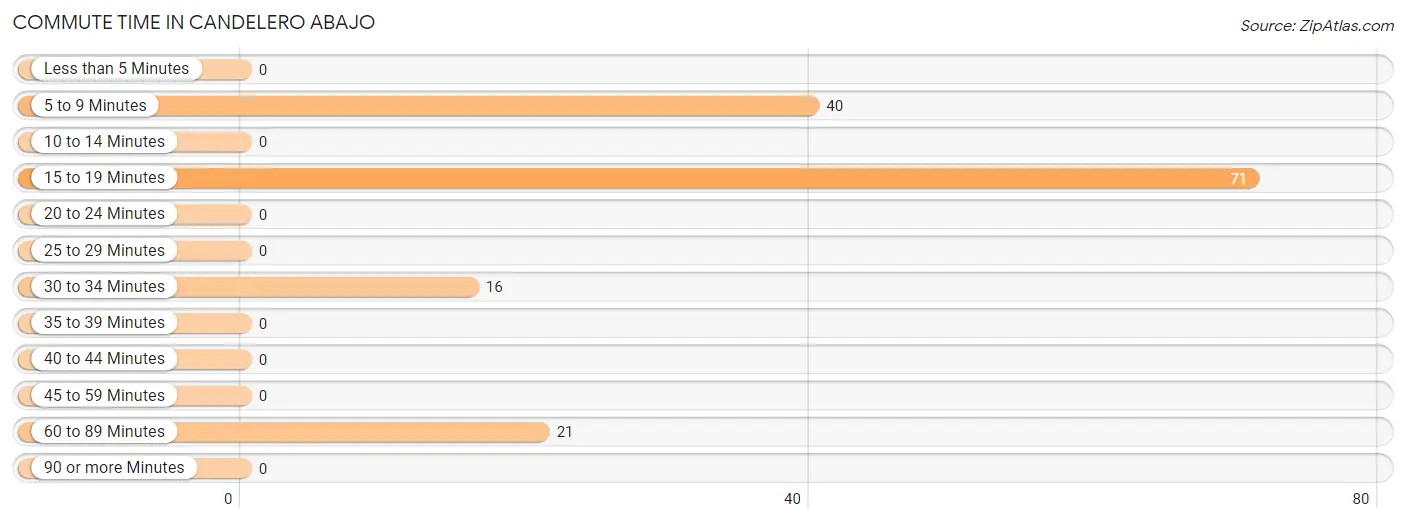
| Commute Time | # Commuters | % Commuters |
| Less than 5 Minutes | 0 | 0.0% |
| 5 to 9 Minutes | 40 | 27.0% |
| 10 to 14 Minutes | 0 | 0.0% |
| 15 to 19 Minutes | 71 | 48.0% |
| 20 to 24 Minutes | 0 | 0.0% |
| 25 to 29 Minutes | 0 | 0.0% |
| 30 to 34 Minutes | 16 | 10.8% |
| 35 to 39 Minutes | 0 | 0.0% |
| 40 to 44 Minutes | 0 | 0.0% |
| 45 to 59 Minutes | 0 | 0.0% |
| 60 to 89 Minutes | 21 | 14.2% |
| 90 or more Minutes | 0 | 0.0% |
Commute Time by Sex in Candelero Abajo
The most common commute times in Candelero Abajo are 15 to 19 minutes (56 commuters, 74.7%) for males and 5 to 9 minutes (21 commuters, 28.8%) for females.
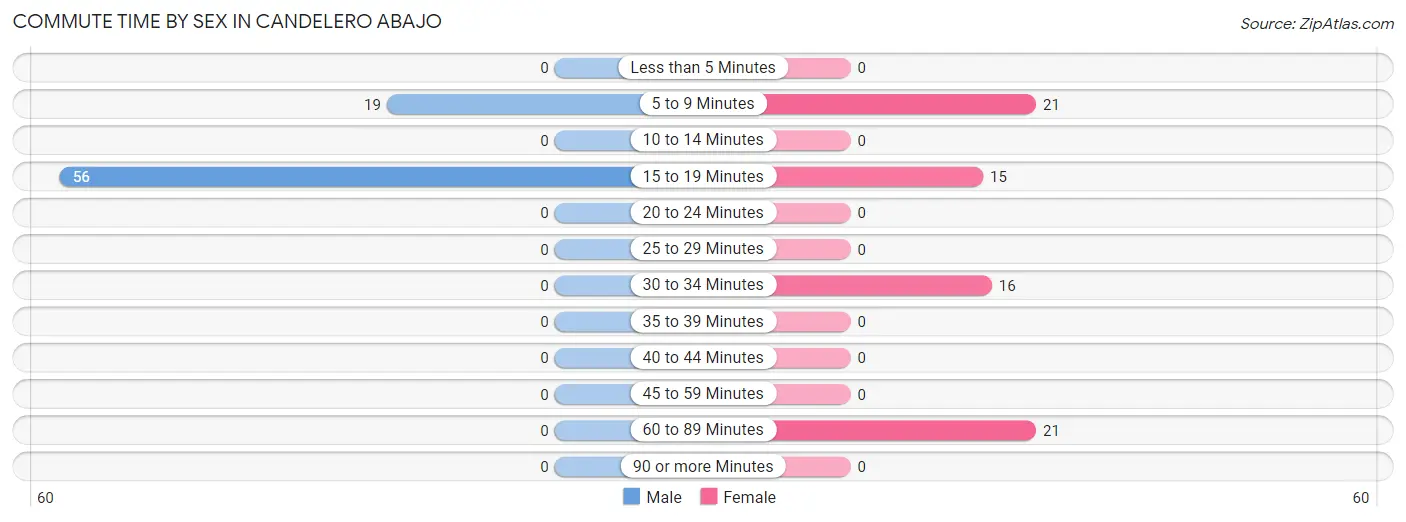
| Commute Time | Male | Female |
| Less than 5 Minutes | 0 (0.0%) | 0 (0.0%) |
| 5 to 9 Minutes | 19 (25.3%) | 21 (28.8%) |
| 10 to 14 Minutes | 0 (0.0%) | 0 (0.0%) |
| 15 to 19 Minutes | 56 (74.7%) | 15 (20.5%) |
| 20 to 24 Minutes | 0 (0.0%) | 0 (0.0%) |
| 25 to 29 Minutes | 0 (0.0%) | 0 (0.0%) |
| 30 to 34 Minutes | 0 (0.0%) | 16 (21.9%) |
| 35 to 39 Minutes | 0 (0.0%) | 0 (0.0%) |
| 40 to 44 Minutes | 0 (0.0%) | 0 (0.0%) |
| 45 to 59 Minutes | 0 (0.0%) | 0 (0.0%) |
| 60 to 89 Minutes | 0 (0.0%) | 21 (28.8%) |
| 90 or more Minutes | 0 (0.0%) | 0 (0.0%) |
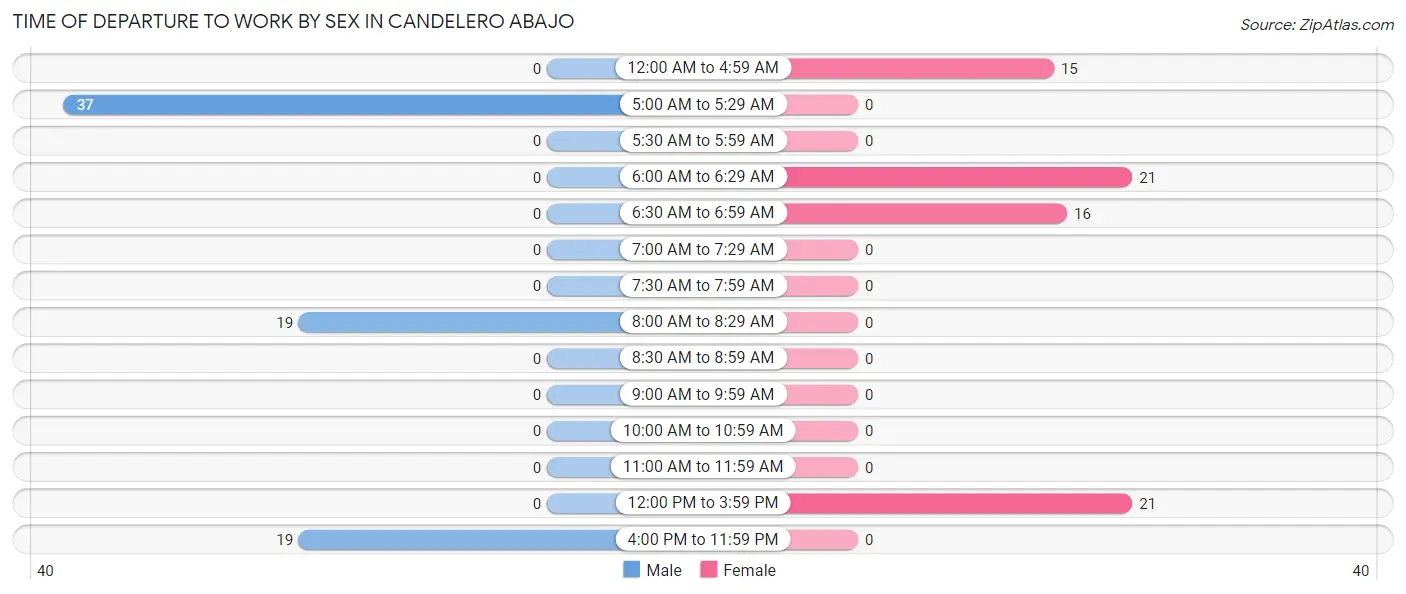
Time of Departure to Work by Sex in Candelero Abajo
The most frequent times of departure to work in Candelero Abajo are 5:00 AM to 5:29 AM (37, 49.3%) for males and 6:00 AM to 6:29 AM (21, 28.8%) for females.
| Time of Departure | Male | Female |
| 12:00 AM to 4:59 AM | 0 (0.0%) | 15 (20.5%) |
| 5:00 AM to 5:29 AM | 37 (49.3%) | 0 (0.0%) |
| 5:30 AM to 5:59 AM | 0 (0.0%) | 0 (0.0%) |
| 6:00 AM to 6:29 AM | 0 (0.0%) | 21 (28.8%) |
| 6:30 AM to 6:59 AM | 0 (0.0%) | 16 (21.9%) |
| 7:00 AM to 7:29 AM | 0 (0.0%) | 0 (0.0%) |
| 7:30 AM to 7:59 AM | 0 (0.0%) | 0 (0.0%) |
| 8:00 AM to 8:29 AM | 19 (25.3%) | 0 (0.0%) |
| 8:30 AM to 8:59 AM | 0 (0.0%) | 0 (0.0%) |
| 9:00 AM to 9:59 AM | 0 (0.0%) | 0 (0.0%) |
| 10:00 AM to 10:59 AM | 0 (0.0%) | 0 (0.0%) |
| 11:00 AM to 11:59 AM | 0 (0.0%) | 0 (0.0%) |
| 12:00 PM to 3:59 PM | 0 (0.0%) | 21 (28.8%) |
| 4:00 PM to 11:59 PM | 19 (25.3%) | 0 (0.0%) |
| Total | 75 (100.0%) | 73 (100.0%) |
Housing Occupancy in Candelero Abajo
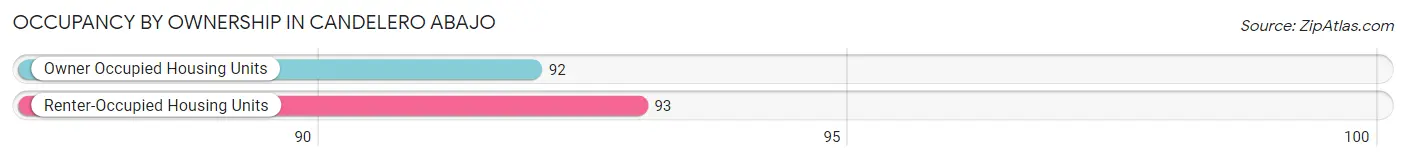
Occupancy by Ownership in Candelero Abajo
Of the total 185 dwellings in Candelero Abajo, owner-occupied units account for 92 (49.7%), while renter-occupied units make up 93 (50.3%).
| Occupancy | # Housing Units | % Housing Units |
| Owner Occupied Housing Units | 92 | 49.7% |
| Renter-Occupied Housing Units | 93 | 50.3% |
| Total Occupied Housing Units | 185 | 100.0% |
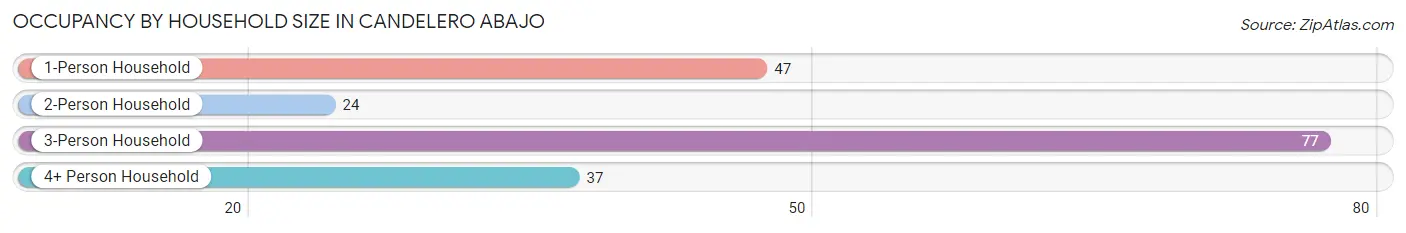
Occupancy by Household Size in Candelero Abajo
| Household Size | # Housing Units | % Housing Units |
| 1-Person Household | 47 | 25.4% |
| 2-Person Household | 24 | 13.0% |
| 3-Person Household | 77 | 41.6% |
| 4+ Person Household | 37 | 20.0% |
| Total Housing Units | 185 | 100.0% |
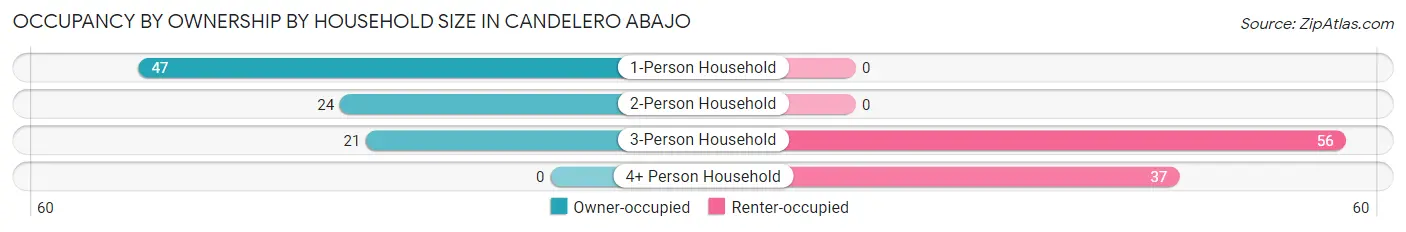
Occupancy by Ownership by Household Size in Candelero Abajo
| Household Size | Owner-occupied | Renter-occupied |
| 1-Person Household | 47 (100.0%) | 0 (0.0%) |
| 2-Person Household | 24 (100.0%) | 0 (0.0%) |
| 3-Person Household | 21 (27.3%) | 56 (72.7%) |
| 4+ Person Household | 0 (0.0%) | 37 (100.0%) |
| Total Housing Units | 92 (49.7%) | 93 (50.3%) |
Occupancy by Educational Attainment in Candelero Abajo
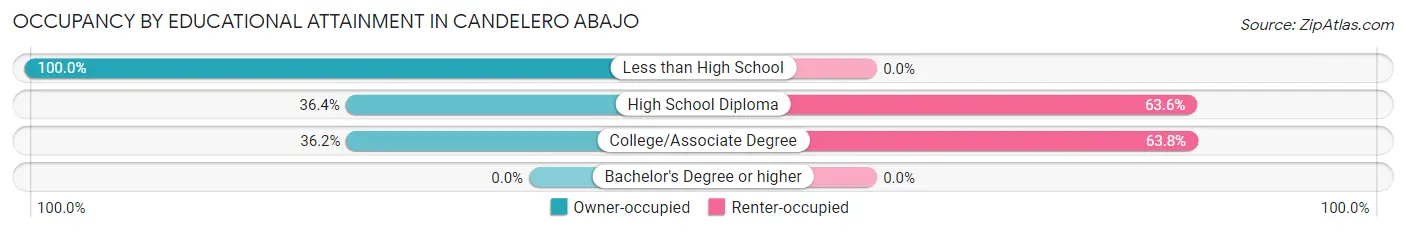
| Household Size | Owner-occupied | Renter-occupied |
| Less than High School | 39 (100.0%) | 0 (0.0%) |
| High School Diploma | 32 (36.4%) | 56 (63.6%) |
| College/Associate Degree | 21 (36.2%) | 37 (63.8%) |
| Bachelor's Degree or higher | 0 (0.0%) | 0 (0.0%) |
Occupancy by Age of Householder in Candelero Abajo
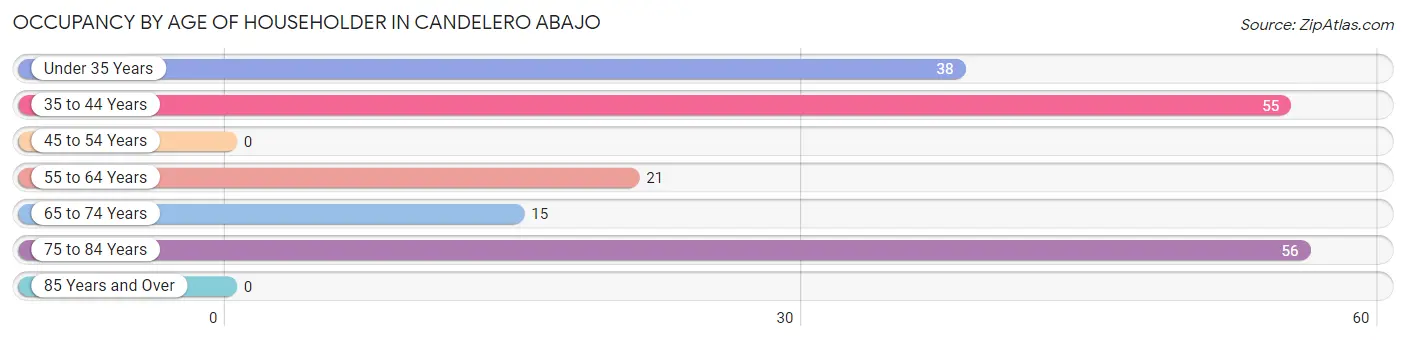
| Age Bracket | # Households | % Households |
| Under 35 Years | 38 | 20.5% |
| 35 to 44 Years | 55 | 29.7% |
| 45 to 54 Years | 0 | 0.0% |
| 55 to 64 Years | 21 | 11.4% |
| 65 to 74 Years | 15 | 8.1% |
| 75 to 84 Years | 56 | 30.3% |
| 85 Years and Over | 0 | 0.0% |
| Total | 185 | 100.0% |
Housing Finances in Candelero Abajo
Median Income by Occupancy in Candelero Abajo
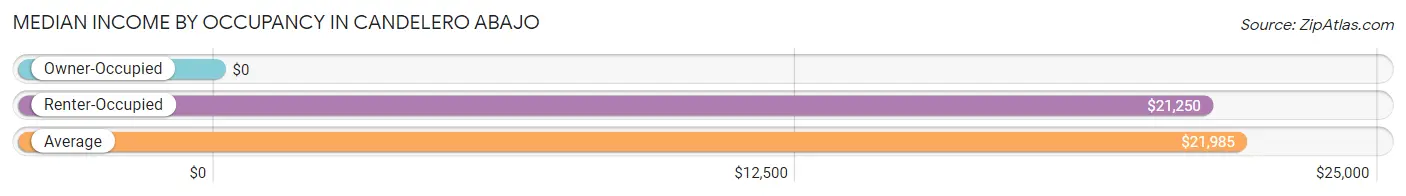
| Occupancy Type | # Households | Median Income |
| Owner-Occupied | 92 (49.7%) | $0 |
| Renter-Occupied | 93 (50.3%) | $21,250 |
| Average | 185 (100.0%) | $21,985 |
Occupancy by Householder Income Bracket in Candelero Abajo
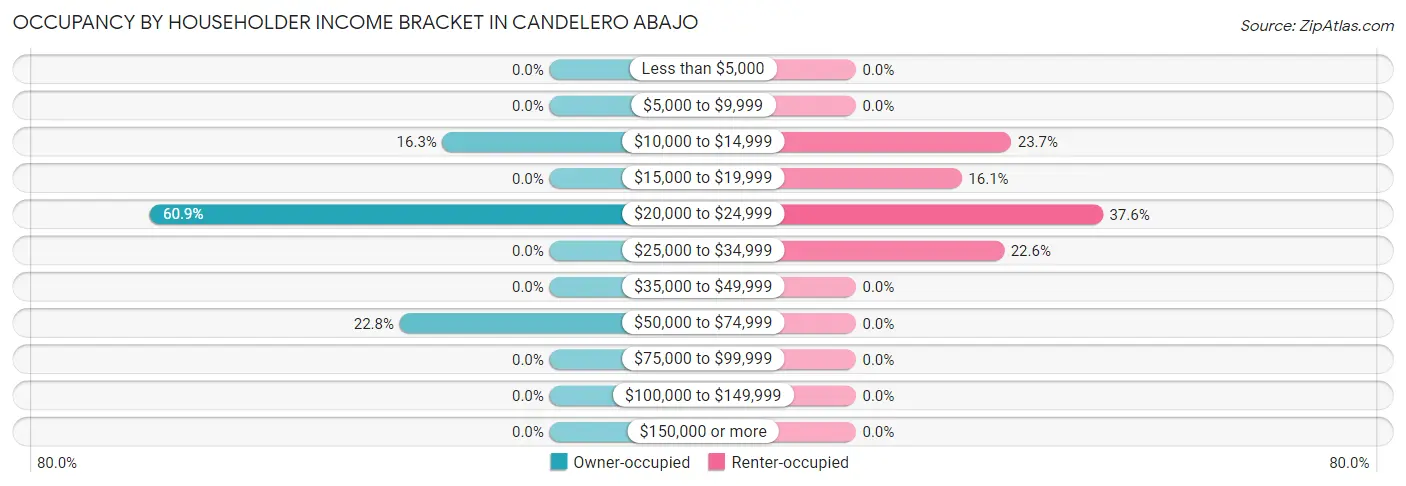
| Income Bracket | Owner-occupied | Renter-occupied |
| Less than $5,000 | 0 (0.0%) | 0 (0.0%) |
| $5,000 to $9,999 | 0 (0.0%) | 0 (0.0%) |
| $10,000 to $14,999 | 15 (16.3%) | 22 (23.7%) |
| $15,000 to $19,999 | 0 (0.0%) | 15 (16.1%) |
| $20,000 to $24,999 | 56 (60.9%) | 35 (37.6%) |
| $25,000 to $34,999 | 0 (0.0%) | 21 (22.6%) |
| $35,000 to $49,999 | 0 (0.0%) | 0 (0.0%) |
| $50,000 to $74,999 | 21 (22.8%) | 0 (0.0%) |
| $75,000 to $99,999 | 0 (0.0%) | 0 (0.0%) |
| $100,000 to $149,999 | 0 (0.0%) | 0 (0.0%) |
| $150,000 or more | 0 (0.0%) | 0 (0.0%) |
| Total | 92 (100.0%) | 93 (100.0%) |
Monthly Housing Cost Tiers in Candelero Abajo
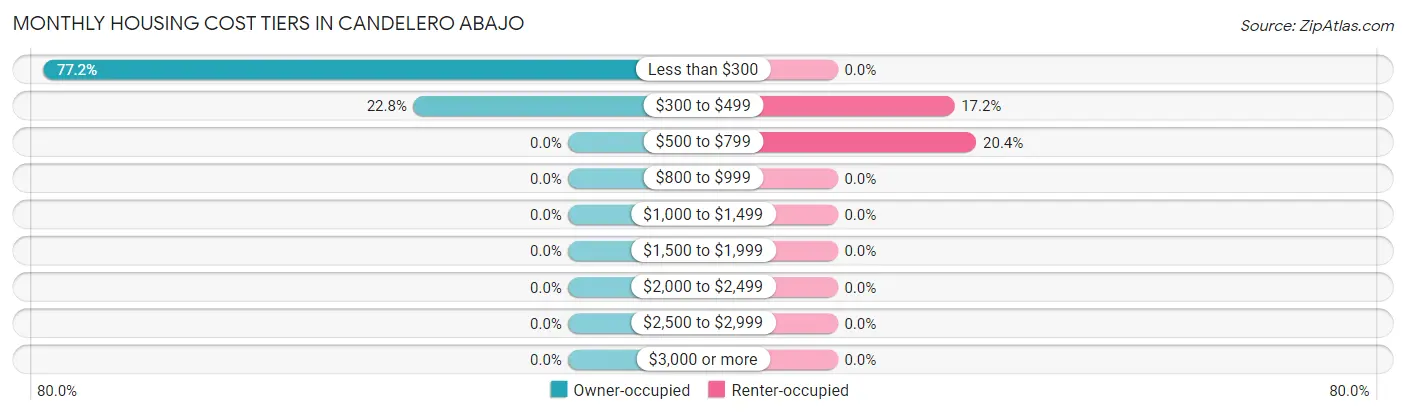
| Monthly Cost | Owner-occupied | Renter-occupied |
| Less than $300 | 71 (77.2%) | 0 (0.0%) |
| $300 to $499 | 21 (22.8%) | 16 (17.2%) |
| $500 to $799 | 0 (0.0%) | 19 (20.4%) |
| $800 to $999 | 0 (0.0%) | 0 (0.0%) |
| $1,000 to $1,499 | 0 (0.0%) | 0 (0.0%) |
| $1,500 to $1,999 | 0 (0.0%) | 0 (0.0%) |
| $2,000 to $2,499 | 0 (0.0%) | 0 (0.0%) |
| $2,500 to $2,999 | 0 (0.0%) | 0 (0.0%) |
| $3,000 or more | 0 (0.0%) | 0 (0.0%) |
| Total | 92 (100.0%) | 93 (100.0%) |
Physical Housing Characteristics in Candelero Abajo
Housing Structures in Candelero Abajo
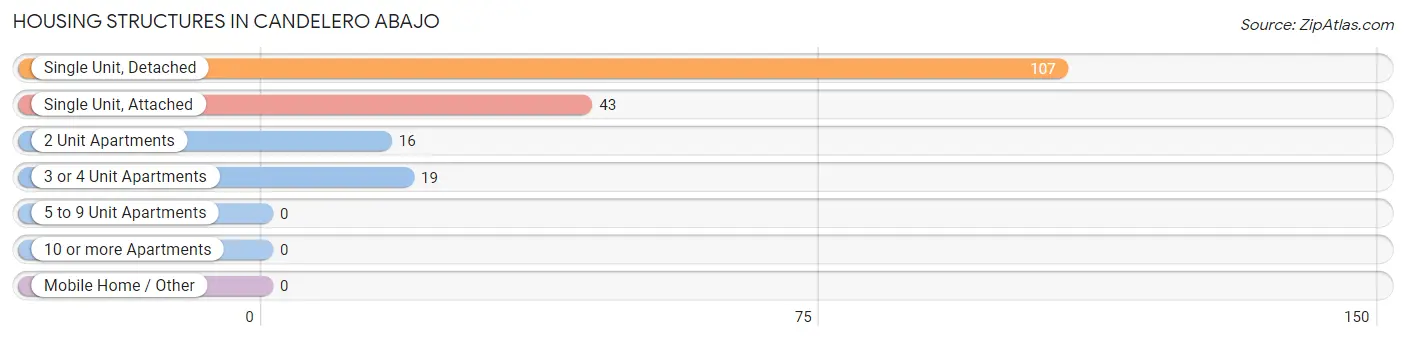
| Structure Type | # Housing Units | % Housing Units |
| Single Unit, Detached | 107 | 57.8% |
| Single Unit, Attached | 43 | 23.2% |
| 2 Unit Apartments | 16 | 8.6% |
| 3 or 4 Unit Apartments | 19 | 10.3% |
| 5 to 9 Unit Apartments | 0 | 0.0% |
| 10 or more Apartments | 0 | 0.0% |
| Mobile Home / Other | 0 | 0.0% |
| Total | 185 | 100.0% |
Housing Structures by Occupancy in Candelero Abajo
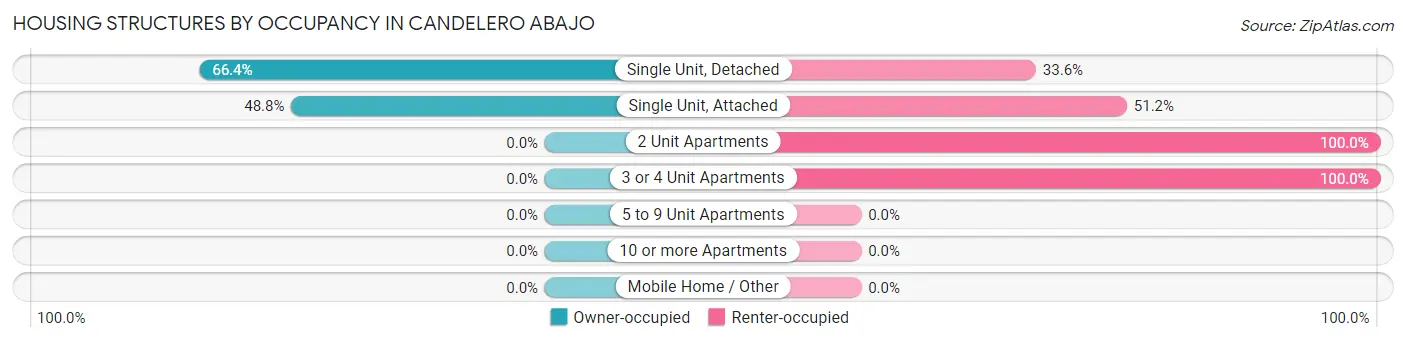
| Structure Type | Owner-occupied | Renter-occupied |
| Single Unit, Detached | 71 (66.4%) | 36 (33.6%) |
| Single Unit, Attached | 21 (48.8%) | 22 (51.2%) |
| 2 Unit Apartments | 0 (0.0%) | 16 (100.0%) |
| 3 or 4 Unit Apartments | 0 (0.0%) | 19 (100.0%) |
| 5 to 9 Unit Apartments | 0 (0.0%) | 0 (0.0%) |
| 10 or more Apartments | 0 (0.0%) | 0 (0.0%) |
| Mobile Home / Other | 0 (0.0%) | 0 (0.0%) |
| Total | 92 (49.7%) | 93 (50.3%) |
Housing Structures by Number of Rooms in Candelero Abajo
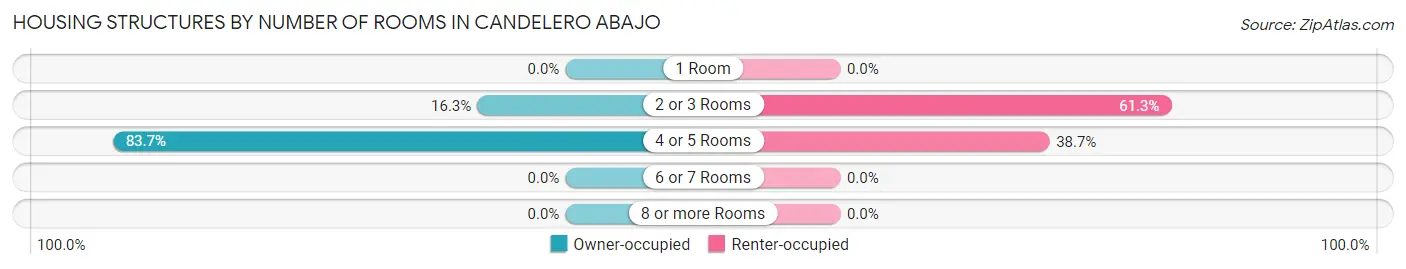
| Number of Rooms | Owner-occupied | Renter-occupied |
| 1 Room | 0 (0.0%) | 0 (0.0%) |
| 2 or 3 Rooms | 15 (16.3%) | 57 (61.3%) |
| 4 or 5 Rooms | 77 (83.7%) | 36 (38.7%) |
| 6 or 7 Rooms | 0 (0.0%) | 0 (0.0%) |
| 8 or more Rooms | 0 (0.0%) | 0 (0.0%) |
| Total | 92 (100.0%) | 93 (100.0%) |
Housing Structure by Heating Type in Candelero Abajo
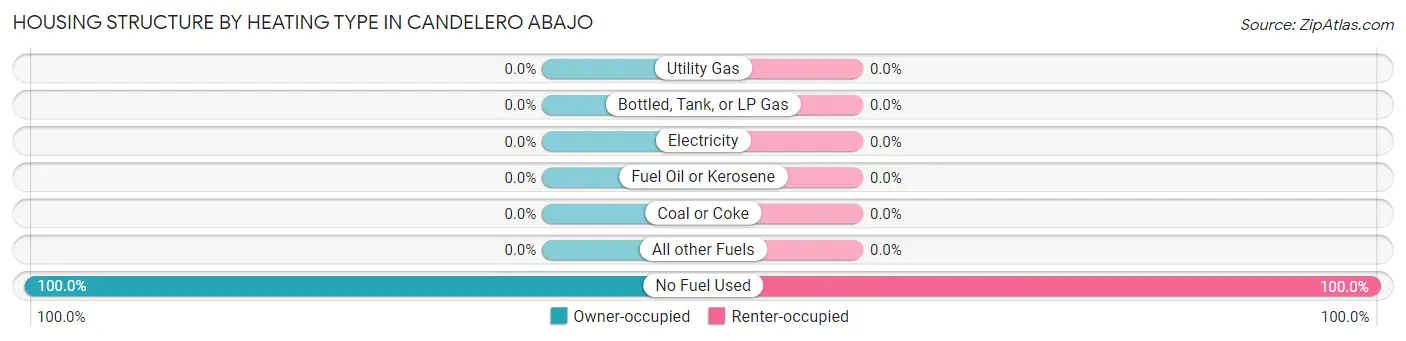
| Heating Type | Owner-occupied | Renter-occupied |
| Utility Gas | 0 (0.0%) | 0 (0.0%) |
| Bottled, Tank, or LP Gas | 0 (0.0%) | 0 (0.0%) |
| Electricity | 0 (0.0%) | 0 (0.0%) |
| Fuel Oil or Kerosene | 0 (0.0%) | 0 (0.0%) |
| Coal or Coke | 0 (0.0%) | 0 (0.0%) |
| All other Fuels | 0 (0.0%) | 0 (0.0%) |
| No Fuel Used | 92 (100.0%) | 93 (100.0%) |
| Total | 92 (100.0%) | 93 (100.0%) |
Household Vehicle Usage in Candelero Abajo
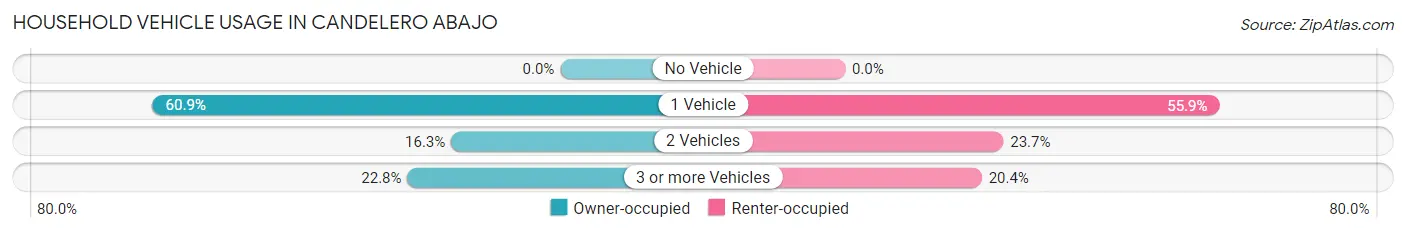
| Vehicles per Household | Owner-occupied | Renter-occupied |
| No Vehicle | 0 (0.0%) | 0 (0.0%) |
| 1 Vehicle | 56 (60.9%) | 52 (55.9%) |
| 2 Vehicles | 15 (16.3%) | 22 (23.7%) |
| 3 or more Vehicles | 21 (22.8%) | 19 (20.4%) |
| Total | 92 (100.0%) | 93 (100.0%) |
Real Estate & Mortgages in Candelero Abajo
Real Estate and Mortgage Overview in Candelero Abajo
| Characteristic | Without Mortgage | With Mortgage |
| Housing Units | 92 | 0 |
| Median Property Value | - | - |
| Median Household Income | - | - |
| Monthly Housing Costs | - | - |
| Real Estate Taxes | - | - |
Property Value by Mortgage Status in Candelero Abajo
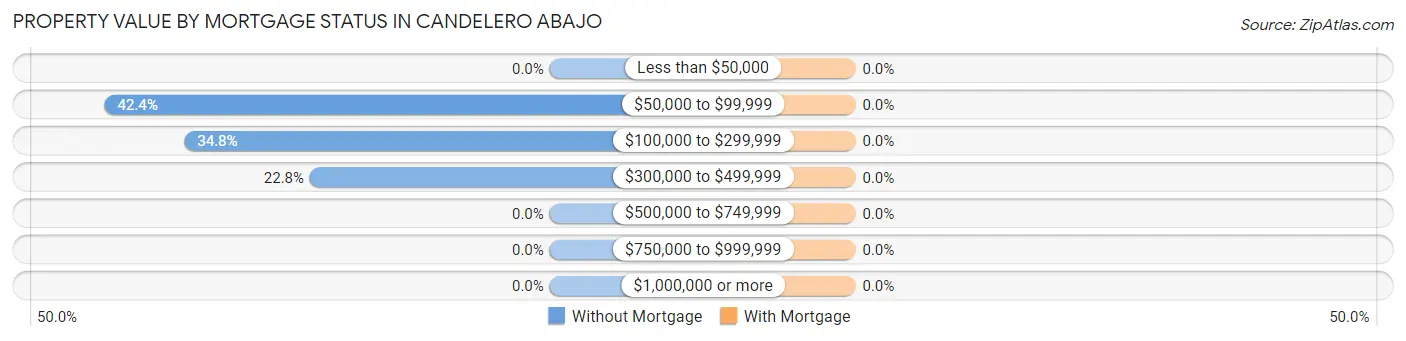
| Property Value | Without Mortgage | With Mortgage |
| Less than $50,000 | 0 (0.0%) | 0 (0.0%) |
| $50,000 to $99,999 | 39 (42.4%) | 0 (0.0%) |
| $100,000 to $299,999 | 32 (34.8%) | 0 (0.0%) |
| $300,000 to $499,999 | 21 (22.8%) | 0 (0.0%) |
| $500,000 to $749,999 | 0 (0.0%) | 0 (0.0%) |
| $750,000 to $999,999 | 0 (0.0%) | 0 (0.0%) |
| $1,000,000 or more | 0 (0.0%) | 0 (0.0%) |
| Total | 92 (100.0%) | 0 (0.0%) |
Household Income by Mortgage Status in Candelero Abajo
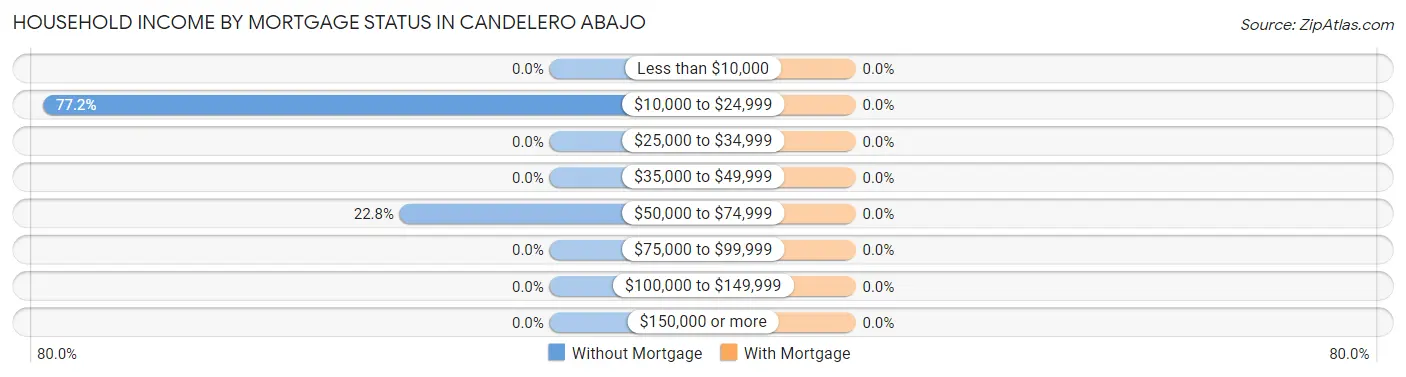
| Household Income | Without Mortgage | With Mortgage |
| Less than $10,000 | 0 (0.0%) | 0 (0.0%) |
| $10,000 to $24,999 | 71 (77.2%) | 0 (0.0%) |
| $25,000 to $34,999 | 0 (0.0%) | 0 (0.0%) |
| $35,000 to $49,999 | 0 (0.0%) | 0 (0.0%) |
| $50,000 to $74,999 | 21 (22.8%) | 0 (0.0%) |
| $75,000 to $99,999 | 0 (0.0%) | 0 (0.0%) |
| $100,000 to $149,999 | 0 (0.0%) | 0 (0.0%) |
| $150,000 or more | 0 (0.0%) | 0 (0.0%) |
| Total | 92 (100.0%) | 0 (0.0%) |
Property Value to Household Income Ratio in Candelero Abajo
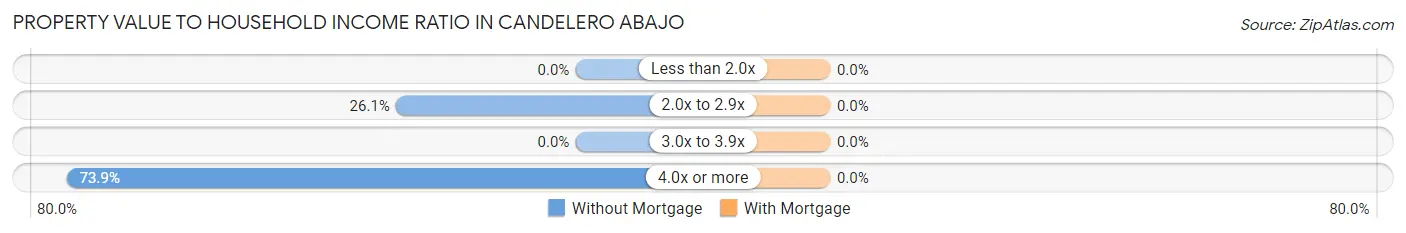
| Value-to-Income Ratio | Without Mortgage | With Mortgage |
| Less than 2.0x | 0 (0.0%) | 0 (0.0%) |
| 2.0x to 2.9x | 24 (26.1%) | 0 (0.0%) |
| 3.0x to 3.9x | 0 (0.0%) | 0 (0.0%) |
| 4.0x or more | 68 (73.9%) | 0 (0.0%) |
| Total | 92 (100.0%) | 0 (0.0%) |
Real Estate Taxes by Mortgage Status in Candelero Abajo
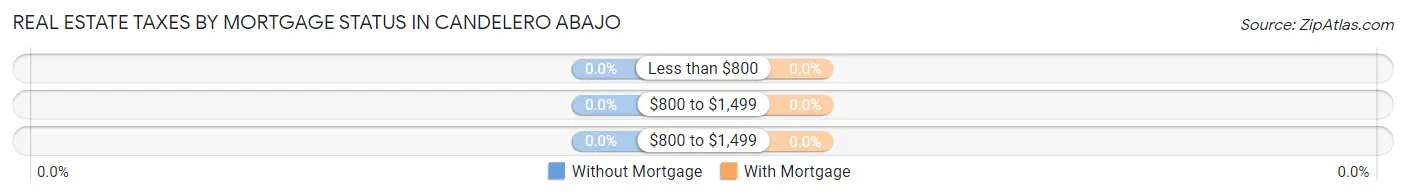
| Property Taxes | Without Mortgage | With Mortgage |
| Less than $800 | 0 (0.0%) | 0 (0.0%) |
| $800 to $1,499 | 0 (0.0%) | 0 (0.0%) |
| $800 to $1,499 | 0 (0.0%) | 0 (0.0%) |
| Total | 92 (100.0%) | 0 (0.0%) |
Health & Disability in Candelero Abajo
Health Insurance Coverage by Age in Candelero Abajo

| Age Bracket | With Coverage | Without Coverage |
| Under 6 Years | 0 (0.0%) | 0 (0.0%) |
| 6 to 18 Years | 175 (100.0%) | 0 (0.0%) |
| 19 to 25 Years | 22 (100.0%) | 0 (0.0%) |
| 26 to 34 Years | 57 (100.0%) | 0 (0.0%) |
| 35 to 44 Years | 73 (100.0%) | 0 (0.0%) |
| 45 to 54 Years | 0 (0.0%) | 19 (100.0%) |
| 55 to 64 Years | 21 (100.0%) | 0 (0.0%) |
| 65 to 74 Years | 34 (100.0%) | 0 (0.0%) |
| 75 Years and older | 81 (100.0%) | 0 (0.0%) |
| Total | 463 (96.1%) | 19 (3.9%) |
Health Insurance Coverage by Citizenship Status in Candelero Abajo
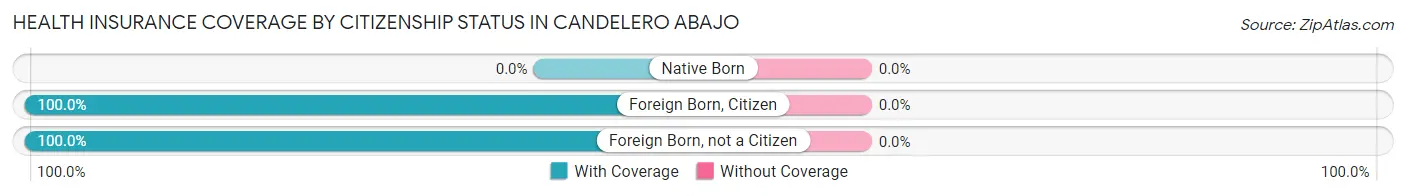
| Citizenship Status | With Coverage | Without Coverage |
| Native Born | 0 (0.0%) | 0 (0.0%) |
| Foreign Born, Citizen | 175 (100.0%) | 0 (0.0%) |
| Foreign Born, not a Citizen | 22 (100.0%) | 0 (0.0%) |
Health Insurance Coverage by Household Income in Candelero Abajo
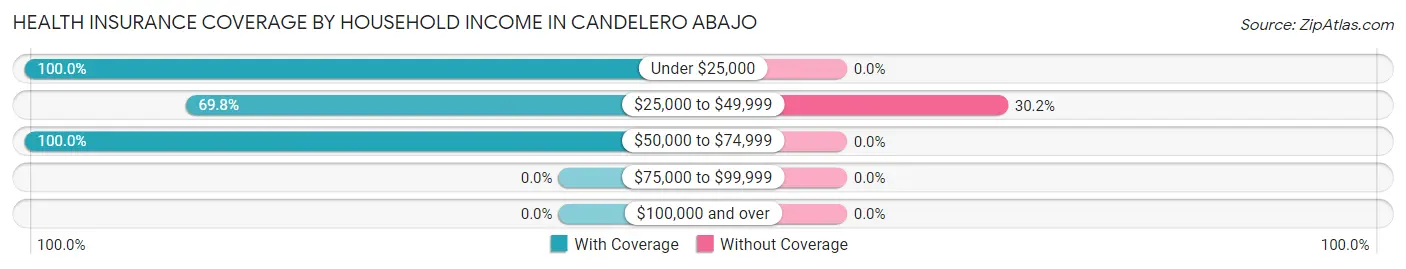
| Household Income | With Coverage | Without Coverage |
| Under $25,000 | 357 (100.0%) | 0 (0.0%) |
| $25,000 to $49,999 | 44 (69.8%) | 19 (30.2%) |
| $50,000 to $74,999 | 62 (100.0%) | 0 (0.0%) |
| $75,000 to $99,999 | 0 (0.0%) | 0 (0.0%) |
| $100,000 and over | 0 (0.0%) | 0 (0.0%) |
Public vs Private Health Insurance Coverage by Age in Candelero Abajo
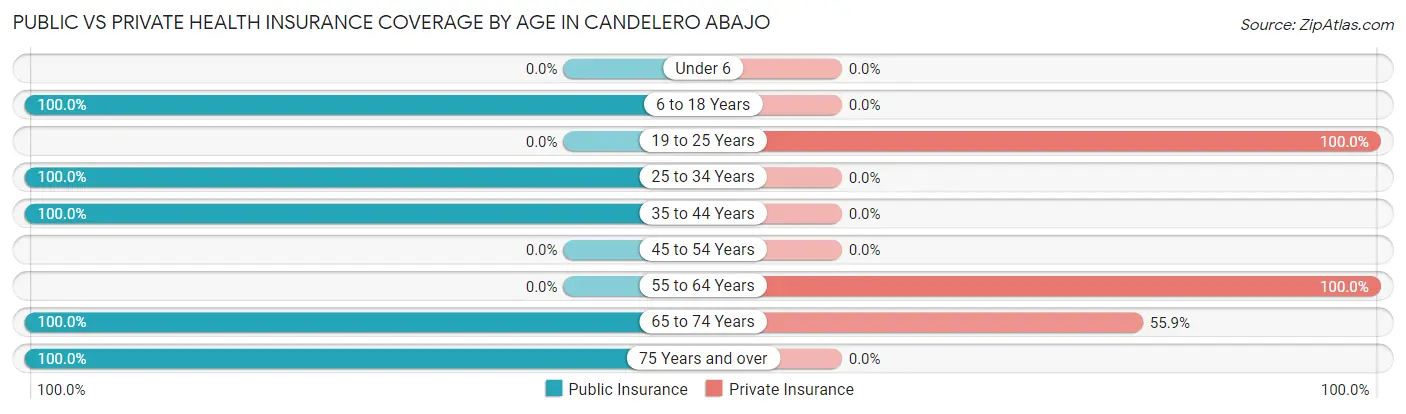
| Age Bracket | Public Insurance | Private Insurance |
| Under 6 | 0 (0.0%) | 0 (0.0%) |
| 6 to 18 Years | 175 (100.0%) | 0 (0.0%) |
| 19 to 25 Years | 0 (0.0%) | 22 (100.0%) |
| 25 to 34 Years | 57 (100.0%) | 0 (0.0%) |
| 35 to 44 Years | 73 (100.0%) | 0 (0.0%) |
| 45 to 54 Years | 0 (0.0%) | 0 (0.0%) |
| 55 to 64 Years | 0 (0.0%) | 21 (100.0%) |
| 65 to 74 Years | 34 (100.0%) | 19 (55.9%) |
| 75 Years and over | 81 (100.0%) | 0 (0.0%) |
| Total | 420 (87.1%) | 62 (12.9%) |
Disability Status by Sex by Age in Candelero Abajo
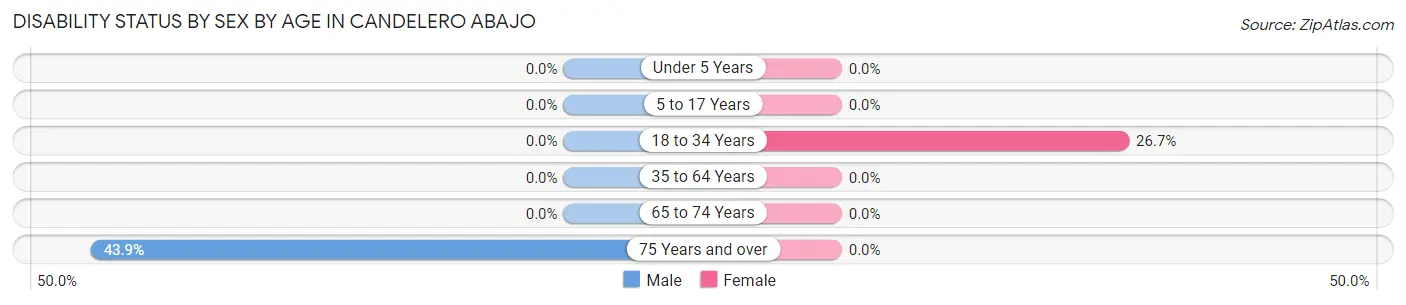
| Age Bracket | Male | Female |
| Under 5 Years | 0 (0.0%) | 0 (0.0%) |
| 5 to 17 Years | 0 (0.0%) | 0 (0.0%) |
| 18 to 34 Years | 0 (0.0%) | 16 (26.7%) |
| 35 to 64 Years | 0 (0.0%) | 0 (0.0%) |
| 65 to 74 Years | 0 (0.0%) | 0 (0.0%) |
| 75 Years and over | 25 (43.9%) | 0 (0.0%) |
Disability Class by Sex by Age in Candelero Abajo
Disability Class: Hearing Difficulty
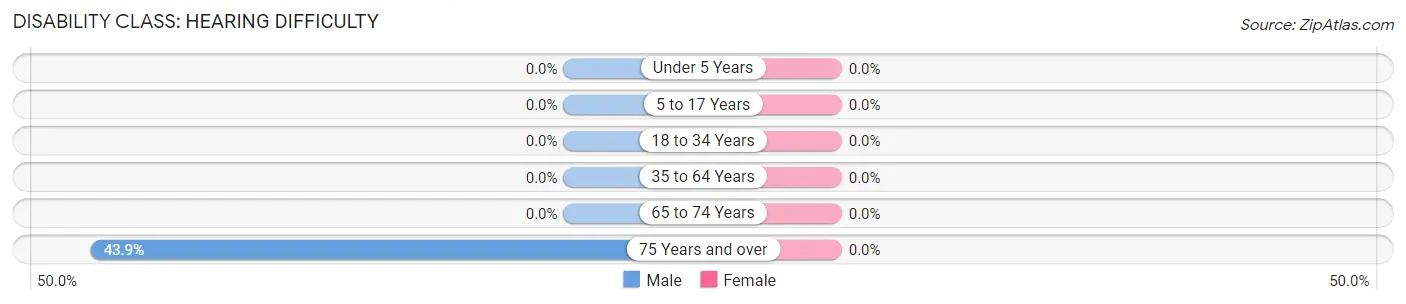
| Age Bracket | Male | Female |
| Under 5 Years | 0 (0.0%) | 0 (0.0%) |
| 5 to 17 Years | 0 (0.0%) | 0 (0.0%) |
| 18 to 34 Years | 0 (0.0%) | 0 (0.0%) |
| 35 to 64 Years | 0 (0.0%) | 0 (0.0%) |
| 65 to 74 Years | 0 (0.0%) | 0 (0.0%) |
| 75 Years and over | 25 (43.9%) | 0 (0.0%) |
Disability Class: Vision Difficulty
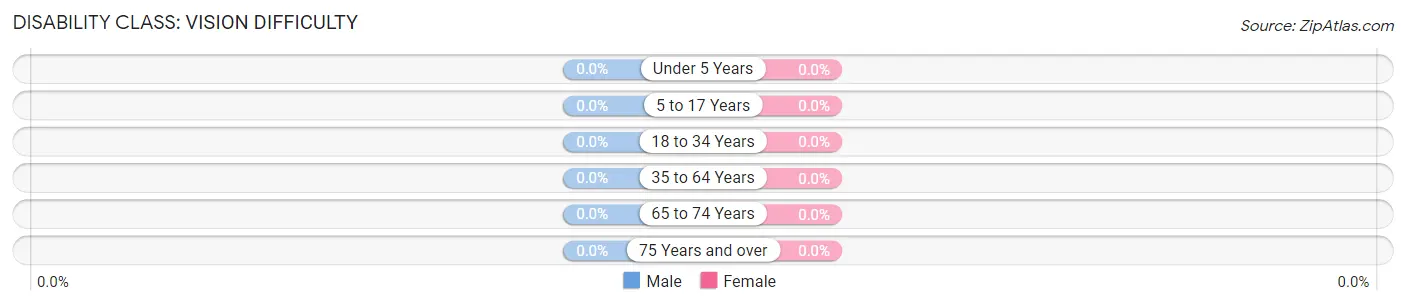
| Age Bracket | Male | Female |
| Under 5 Years | 0 (0.0%) | 0 (0.0%) |
| 5 to 17 Years | 0 (0.0%) | 0 (0.0%) |
| 18 to 34 Years | 0 (0.0%) | 0 (0.0%) |
| 35 to 64 Years | 0 (0.0%) | 0 (0.0%) |
| 65 to 74 Years | 0 (0.0%) | 0 (0.0%) |
| 75 Years and over | 0 (0.0%) | 0 (0.0%) |
Disability Class: Cognitive Difficulty
| Age Bracket | Male | Female |
| 5 to 17 Years | 0 (0.0%) | 0 (0.0%) |
| 18 to 34 Years | 0 (0.0%) | 0 (0.0%) |
| 35 to 64 Years | 0 (0.0%) | 0 (0.0%) |
| 65 to 74 Years | 0 (0.0%) | 0 (0.0%) |
| 75 Years and over | 0 (0.0%) | 0 (0.0%) |
Disability Class: Ambulatory Difficulty
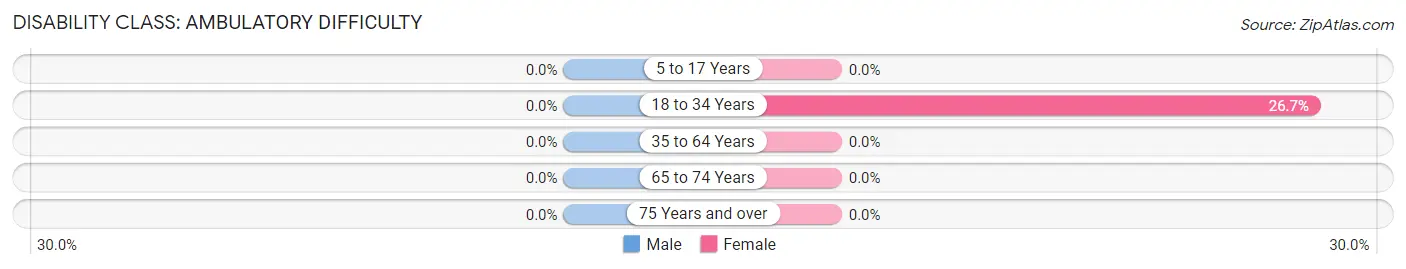
| Age Bracket | Male | Female |
| 5 to 17 Years | 0 (0.0%) | 0 (0.0%) |
| 18 to 34 Years | 0 (0.0%) | 16 (26.7%) |
| 35 to 64 Years | 0 (0.0%) | 0 (0.0%) |
| 65 to 74 Years | 0 (0.0%) | 0 (0.0%) |
| 75 Years and over | 0 (0.0%) | 0 (0.0%) |
Disability Class: Self-Care Difficulty
| Age Bracket | Male | Female |
| 5 to 17 Years | 0 (0.0%) | 0 (0.0%) |
| 18 to 34 Years | 0 (0.0%) | 0 (0.0%) |
| 35 to 64 Years | 0 (0.0%) | 0 (0.0%) |
| 65 to 74 Years | 0 (0.0%) | 0 (0.0%) |
| 75 Years and over | 0 (0.0%) | 0 (0.0%) |
Technology Access in Candelero Abajo
Computing Device Access in Candelero Abajo
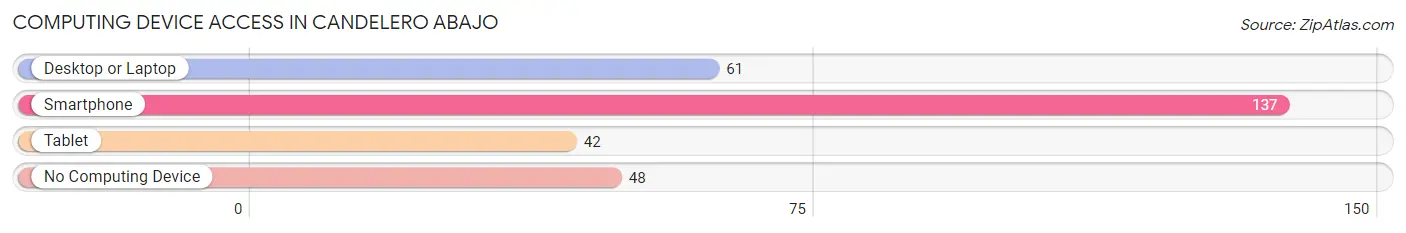
| Device Type | # Households | % Households |
| Desktop or Laptop | 61 | 33.0% |
| Smartphone | 137 | 74.1% |
| Tablet | 42 | 22.7% |
| No Computing Device | 48 | 26.0% |
| Total | 185 | 100.0% |
Internet Access in Candelero Abajo
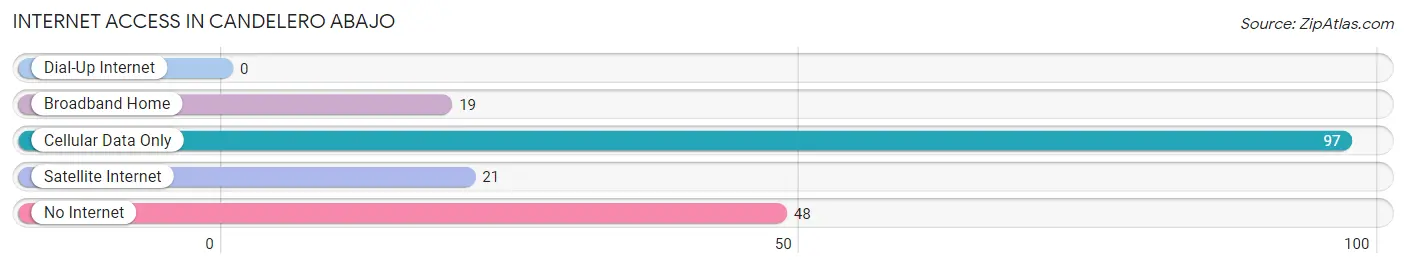
| Internet Type | # Households | % Households |
| Dial-Up Internet | 0 | 0.0% |
| Broadband Home | 19 | 10.3% |
| Cellular Data Only | 97 | 52.4% |
| Satellite Internet | 21 | 11.4% |
| No Internet | 48 | 26.0% |
| Total | 185 | 100.0% |
Candelero Abajo Summary
Candelero Abajo is a small municipality located in the central region of Puerto Rico. It is part of the San Juan-Caguas-Guaynabo Metropolitan Statistical Area and is situated in the northern part of the island. The municipality has a population of approximately 4,000 people and covers an area of 4.3 square miles.
Geography
Candelero Abajo is located in the northern part of Puerto Rico, in the central region of the island. It is bordered by the municipalities of San Juan, Caguas, and Guaynabo. The municipality is situated in the San Juan-Caguas-Guaynabo Metropolitan Statistical Area and is part of the San Juan-Caguas-Fajardo Combined Statistical Area. The municipality is located at an elevation of approximately 1,000 feet above sea level and is surrounded by mountains. The municipality is home to the Candelero River, which is a tributary of the Rio Grande de Loíza.
History
Candelero Abajo was founded in 1776 by Spanish settlers. The municipality was originally part of the municipality of San Juan, but was later separated and established as its own municipality in 1838. The municipality was named after the Candelero River, which runs through the area.
Economy
The economy of Candelero Abajo is largely based on agriculture and tourism. The municipality is home to several farms that produce a variety of fruits and vegetables, including bananas, plantains, and yams. The municipality is also home to several small businesses, including restaurants, bars, and shops. Tourism is also an important part of the economy, as the municipality is home to several popular tourist attractions, including the Candelero River, the Candelero Cave, and the Candelero Waterfall.
Demographics
As of the 2010 census, the population of Candelero Abajo was 4,039. The population is predominantly of Hispanic or Latino origin, with 97.3% of the population identifying as such. The median age of the population is 38.7 years, and the median household income is $17,845. The majority of the population (90.3%) is employed, with the majority of the employed population (71.3%) working in the service industry.
Conclusion
Candelero Abajo is a small municipality located in the central region of Puerto Rico. It is part of the San Juan-Caguas-Guaynabo Metropolitan Statistical Area and is situated in the northern part of the island. The municipality has a population of approximately 4,000 people and covers an area of 4.3 square miles. The economy of Candelero Abajo is largely based on agriculture and tourism, and the population is predominantly of Hispanic or Latino origin. The median age of the population is 38.7 years, and the median household income is $17,845.
Common Questions
What is the Total Population of Candelero Abajo?
Total Population of Candelero Abajo is 482.
What is the Total Male Population of Candelero Abajo?
Total Male Population of Candelero Abajo is 261.
What is the Total Female Population of Candelero Abajo?
Total Female Population of Candelero Abajo is 221.
What is the Ratio of Males per 100 Females in Candelero Abajo?
There are 118.10 Males per 100 Females in Candelero Abajo.
What is the Ratio of Females per 100 Males in Candelero Abajo?
There are 84.67 Females per 100 Males in Candelero Abajo.
What is the Median Population Age in Candelero Abajo?
Median Population Age in Candelero Abajo is 34.2 Years.
What is the Average Family Size in Candelero Abajo
Average Family Size in Candelero Abajo is 2.8 People.
What is the Average Household Size in Candelero Abajo
Average Household Size in Candelero Abajo is 2.6 People.
What is Per Capita Income in Candelero Abajo?
Per Capita income in Candelero Abajo is $9,432.
What is the Median Family Income in Candelero Abajo?
Median Family Income in Candelero Abajo is $16,167.
What is the Median Household income in Candelero Abajo?
Median Household Income in Candelero Abajo is $21,985.
What is Income or Wage Gap in Candelero Abajo?
Income or Wage Gap in Candelero Abajo is 31.4%.
Women in Candelero Abajo earn 68.6 cents for every dollar earned by a man.
What is Family Income Deficit in Candelero Abajo?
Family Income Deficit in Candelero Abajo is $12,234.
Families that are below poverty line in Candelero Abajo earn $12,234 less on average than the poverty threshold level.
What is Inequality or Gini Index in Candelero Abajo?
Inequality or Gini Index in Candelero Abajo is 0.28.
How Large is the Labor Force in Candelero Abajo?
There are 148 People in the Labor Forcein in Candelero Abajo.
What is the Percentage of People in the Labor Force in Candelero Abajo?
48.2% of People are in the Labor Force in Candelero Abajo.