Zip Codes with the Highest Percentage of Population Employed in Arts, Entertainment & Recreation in Bethlehem, PA
RELATED REPORTS & OPTIONS
Arts, Entertainment & Recreation
Bethlehem
Compare Zip Codes
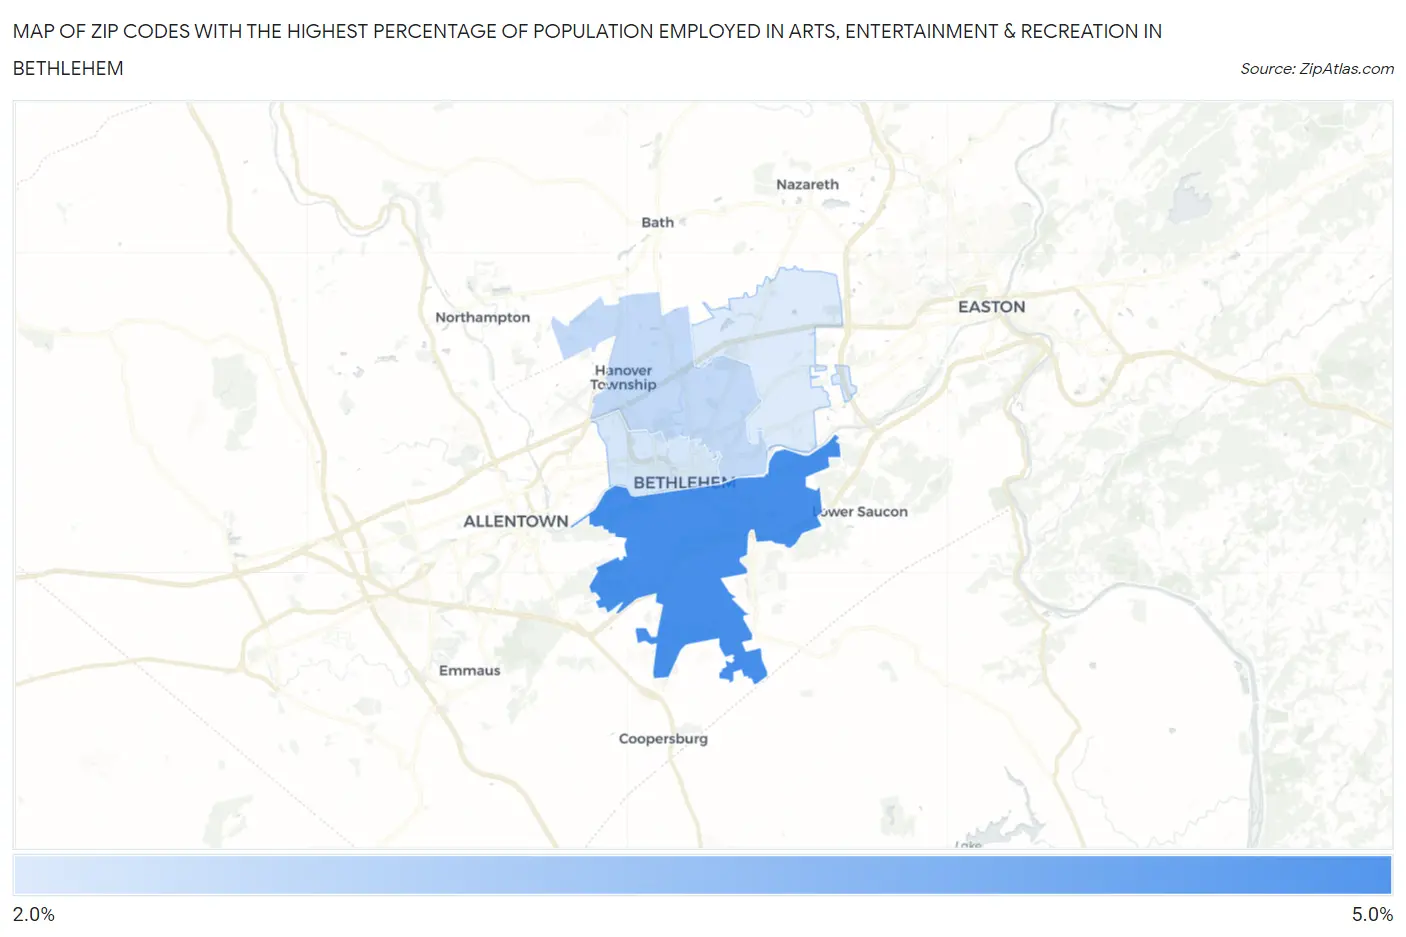
Map of Zip Codes with the Highest Percentage of Population Employed in Arts, Entertainment & Recreation in Bethlehem
0.0%
5.0%
Zip Codes with the Highest Percentage of Population Employed in Arts, Entertainment & Recreation in Bethlehem, PA
| Zip Code | % Employed | vs State | vs National | |
| 1. | 18015 | 4.3% | 1.8%(+2.50)#90 | 2.1%(+2.21)#2,969 |
| 2. | 18017 | 2.9% | 1.8%(+1.06)#215 | 2.1%(+0.779)#5,768 |
| 3. | 18018 | 2.6% | 1.8%(+0.816)#263 | 2.1%(+0.533)#6,689 |
| 4. | 18020 | 2.5% | 1.8%(+0.744)#276 | 2.1%(+0.461)#6,980 |
1
Common Questions
What are the Top 3 Zip Codes with the Highest Percentage of Population Employed in Arts, Entertainment & Recreation in Bethlehem, PA?
Top 3 Zip Codes with the Highest Percentage of Population Employed in Arts, Entertainment & Recreation in Bethlehem, PA are:
What zip code has the Highest Percentage of Population Employed in Arts, Entertainment & Recreation in Bethlehem, PA?
18015 has the Highest Percentage of Population Employed in Arts, Entertainment & Recreation in Bethlehem, PA with 4.3%.
What is the Percentage of Population Employed in Arts, Entertainment & Recreation in Bethlehem, PA?
Percentage of Population Employed in Arts, Entertainment & Recreation in Bethlehem is 3.4%.
What is the Percentage of Population Employed in Arts, Entertainment & Recreation in Pennsylvania?
Percentage of Population Employed in Arts, Entertainment & Recreation in Pennsylvania is 1.8%.
What is the Percentage of Population Employed in Arts, Entertainment & Recreation in the United States?
Percentage of Population Employed in Arts, Entertainment & Recreation in the United States is 2.1%.