Zip Codes with the Most Immigrants from Ethiopia in Oregon
RELATED REPORTS & OPTIONS
Ethiopia
Oregon
Compare Zip Codes
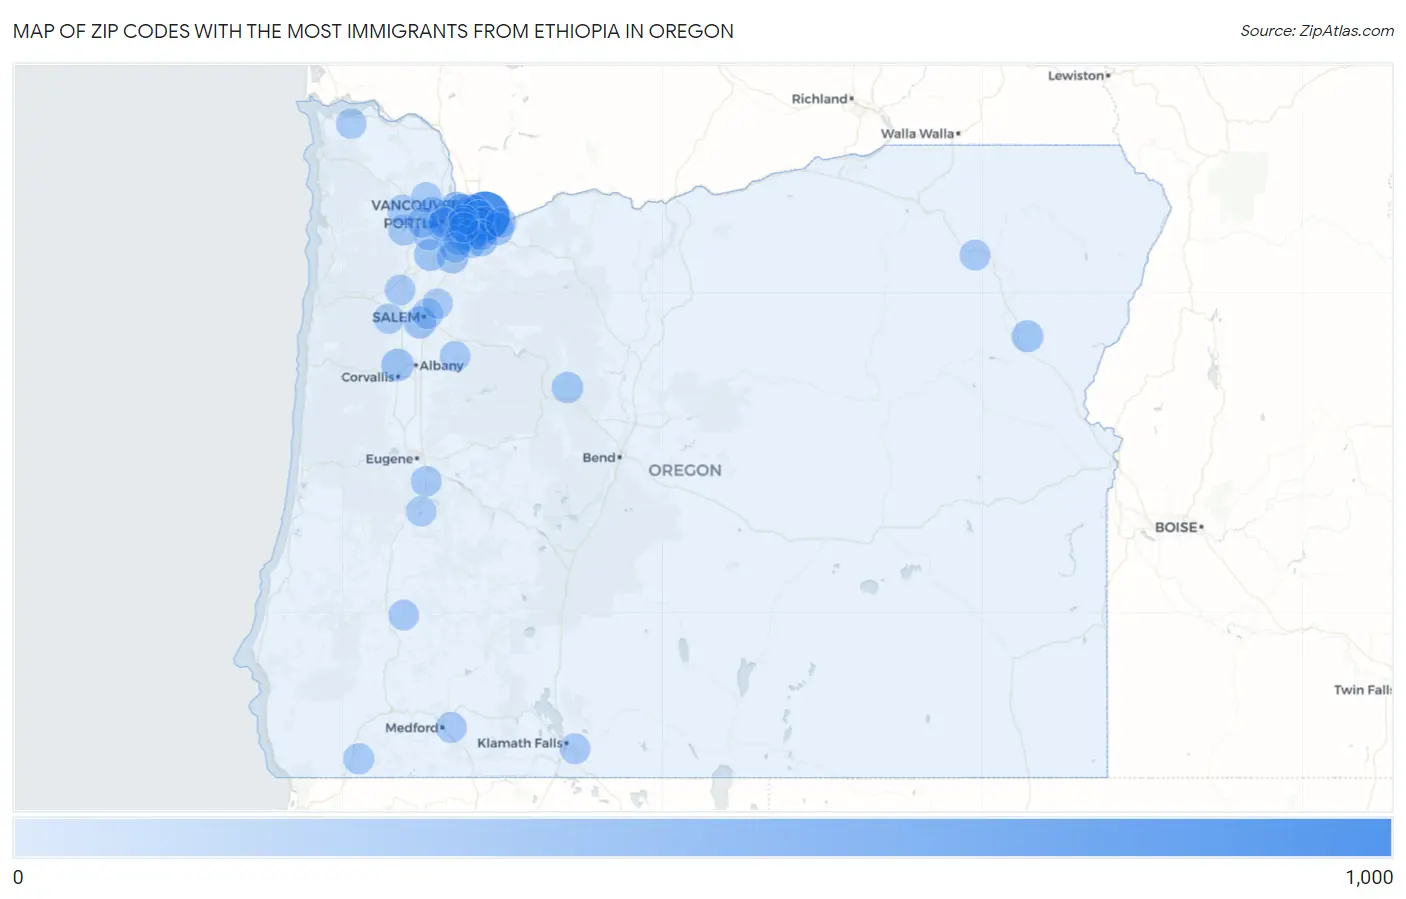
Map of Zip Codes with the Most Immigrants from Ethiopia in Oregon
0
1,000
Zip Codes with the Most Immigrants from Ethiopia in Oregon
| Zip Code | Ethiopia | vs State | vs National | |
| 1. | 97230 | 871 | 3,555(24.50%)#1 | 275,476(0.32%)#48 |
| 2. | 97211 | 268 | 3,555(7.54%)#2 | 275,476(0.10%)#225 |
| 3. | 97229 | 210 | 3,555(5.91%)#3 | 275,476(0.08%)#288 |
| 4. | 97216 | 178 | 3,555(5.01%)#4 | 275,476(0.06%)#339 |
| 5. | 97266 | 176 | 3,555(4.95%)#5 | 275,476(0.06%)#342 |
| 6. | 97203 | 161 | 3,555(4.53%)#6 | 275,476(0.06%)#372 |
| 7. | 97233 | 157 | 3,555(4.42%)#7 | 275,476(0.06%)#378 |
| 8. | 97003 | 111 | 3,555(3.12%)#8 | 275,476(0.04%)#527 |
| 9. | 97080 | 106 | 3,555(2.98%)#9 | 275,476(0.04%)#553 |
| 10. | 97015 | 104 | 3,555(2.93%)#10 | 275,476(0.04%)#570 |
| 11. | 97217 | 98 | 3,555(2.76%)#11 | 275,476(0.04%)#596 |
| 12. | 97220 | 97 | 3,555(2.73%)#12 | 275,476(0.04%)#602 |
| 13. | 97330 | 96 | 3,555(2.70%)#13 | 275,476(0.03%)#604 |
| 14. | 97302 | 79 | 3,555(2.22%)#14 | 275,476(0.03%)#694 |
| 15. | 97205 | 72 | 3,555(2.03%)#15 | 275,476(0.03%)#750 |
| 16. | 97219 | 69 | 3,555(1.94%)#16 | 275,476(0.03%)#769 |
| 17. | 97132 | 69 | 3,555(1.94%)#17 | 275,476(0.03%)#771 |
| 18. | 97070 | 67 | 3,555(1.88%)#18 | 275,476(0.02%)#787 |
| 19. | 97814 | 62 | 3,555(1.74%)#19 | 275,476(0.02%)#850 |
| 20. | 97222 | 61 | 3,555(1.72%)#20 | 275,476(0.02%)#860 |
| 21. | 97759 | 54 | 3,555(1.52%)#21 | 275,476(0.02%)#953 |
| 22. | 97124 | 37 | 3,555(1.04%)#22 | 275,476(0.01%)#1,182 |
| 23. | 97267 | 33 | 3,555(0.93%)#23 | 275,476(0.01%)#1,270 |
| 24. | 97119 | 28 | 3,555(0.79%)#24 | 275,476(0.01%)#1,397 |
| 25. | 97523 | 26 | 3,555(0.73%)#25 | 275,476(0.01%)#1,464 |
| 26. | 97504 | 23 | 3,555(0.65%)#26 | 275,476(0.01%)#1,531 |
| 27. | 97301 | 21 | 3,555(0.59%)#27 | 275,476(0.01%)#1,601 |
| 28. | 97116 | 18 | 3,555(0.51%)#28 | 275,476(0.01%)#1,719 |
| 29. | 97123 | 17 | 3,555(0.48%)#29 | 275,476(0.01%)#1,744 |
| 30. | 97035 | 17 | 3,555(0.48%)#30 | 275,476(0.01%)#1,764 |
| 31. | 97113 | 16 | 3,555(0.45%)#31 | 275,476(0.01%)#1,822 |
| 32. | 97850 | 14 | 3,555(0.39%)#32 | 275,476(0.01%)#1,918 |
| 33. | 97457 | 14 | 3,555(0.39%)#33 | 275,476(0.01%)#1,925 |
| 34. | 97086 | 13 | 3,555(0.37%)#34 | 275,476(0.00%)#1,953 |
| 35. | 97603 | 13 | 3,555(0.37%)#35 | 275,476(0.00%)#1,954 |
| 36. | 97426 | 13 | 3,555(0.37%)#36 | 275,476(0.00%)#1,977 |
| 37. | 97374 | 12 | 3,555(0.34%)#37 | 275,476(0.00%)#2,038 |
| 38. | 97006 | 11 | 3,555(0.31%)#38 | 275,476(0.00%)#2,060 |
| 39. | 97060 | 10 | 3,555(0.28%)#39 | 275,476(0.00%)#2,148 |
| 40. | 97133 | 10 | 3,555(0.28%)#40 | 275,476(0.00%)#2,166 |
| 41. | 97103 | 9 | 3,555(0.25%)#41 | 275,476(0.00%)#2,233 |
| 42. | 97101 | 9 | 3,555(0.25%)#42 | 275,476(0.00%)#2,252 |
| 43. | 97209 | 7 | 3,555(0.20%)#43 | 275,476(0.00%)#2,357 |
| 44. | 97424 | 5 | 3,555(0.14%)#44 | 275,476(0.00%)#2,491 |
| 45. | 97062 | 4 | 3,555(0.11%)#45 | 275,476(0.00%)#2,536 |
| 46. | 97338 | 4 | 3,555(0.11%)#46 | 275,476(0.00%)#2,544 |
| 47. | 97239 | 4 | 3,555(0.11%)#47 | 275,476(0.00%)#2,550 |
| 48. | 97305 | 1 | 3,555(0.03%)#48 | 275,476(0.00%)#2,705 |
Common Questions
What are the Top 10 Zip Codes with the Most Immigrants from Ethiopia in Oregon?
Top 10 Zip Codes with the Most Immigrants from Ethiopia in Oregon are:
What zip code has the Most Immigrants from Ethiopia in Oregon?
97230 has the Most Immigrants from Ethiopia in Oregon with 871.
What is the Total Immigrants from Ethiopia in the State of Oregon?
Total Immigrants from Ethiopia in Oregon is 3,555.
What is the Total Immigrants from Ethiopia in the United States?
Total Immigrants from Ethiopia in the United States is 275,476.