Zip Codes with the Highest Percentage of Population Employed in Legal Services & Support in Hillsboro, OR
RELATED REPORTS & OPTIONS
Legal Services & Support
Hillsboro
Compare Zip Codes
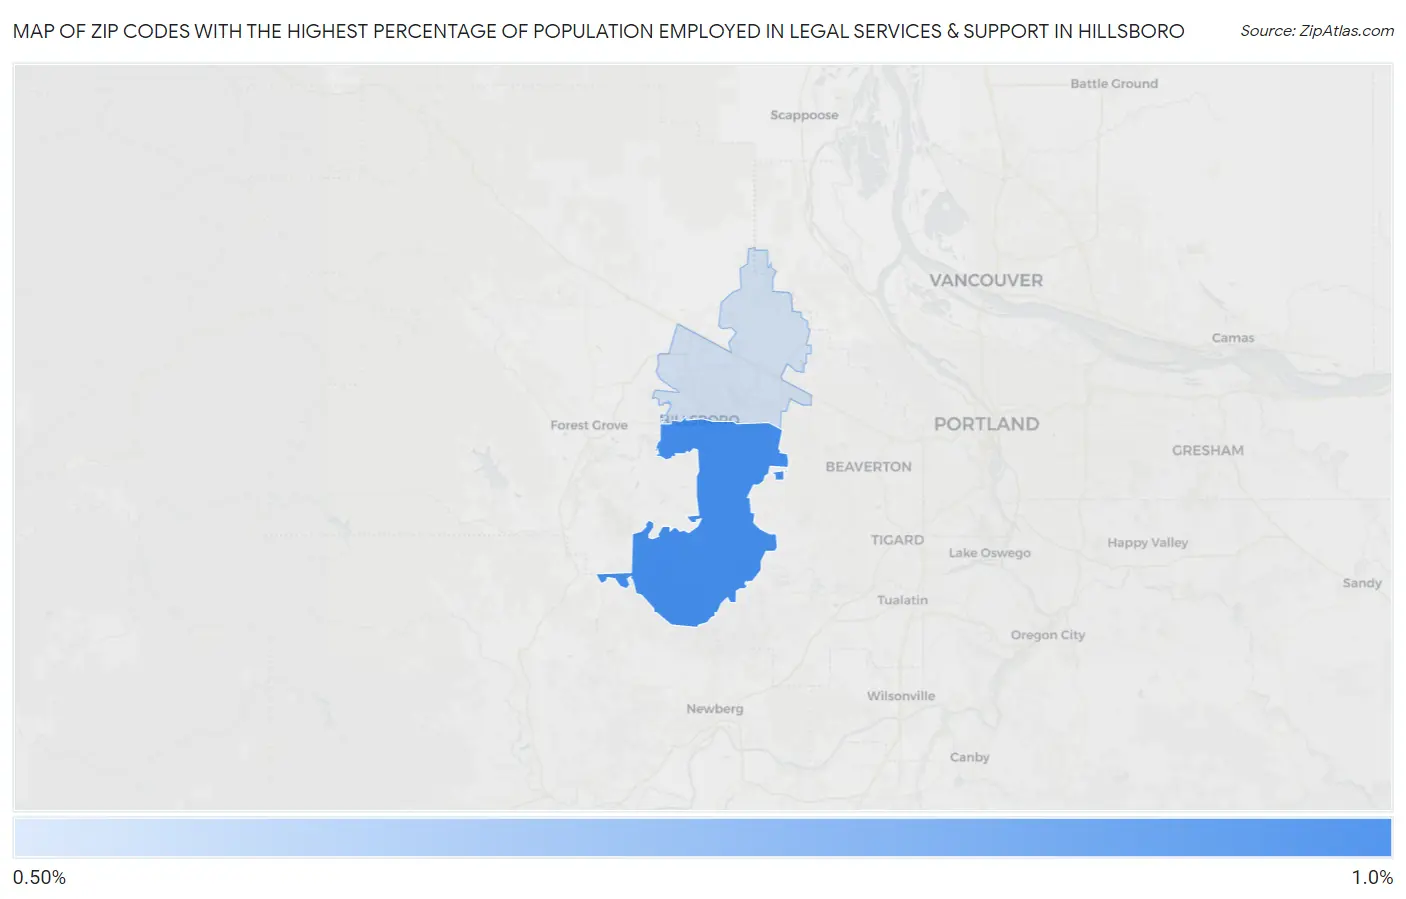
Map of Zip Codes with the Highest Percentage of Population Employed in Legal Services & Support in Hillsboro
0.0%
1.0%
Zip Codes with the Highest Percentage of Population Employed in Legal Services & Support in Hillsboro, OR
| Zip Code | % Employed | vs State | vs National | |
| 1. | 97123 | 0.84% | 1.1%(-0.259)#112 | 1.2%(-0.343)#9,093 |
| 2. | 97124 | 0.54% | 1.1%(-0.564)#158 | 1.2%(-0.647)#12,182 |
1
Common Questions
What are the Top Zip Codes with the Highest Percentage of Population Employed in Legal Services & Support in Hillsboro, OR?
Top Zip Codes with the Highest Percentage of Population Employed in Legal Services & Support in Hillsboro, OR are:
What zip code has the Highest Percentage of Population Employed in Legal Services & Support in Hillsboro, OR?
97123 has the Highest Percentage of Population Employed in Legal Services & Support in Hillsboro, OR with 0.84%.
What is the Percentage of Population Employed in Legal Services & Support in Hillsboro, OR?
Percentage of Population Employed in Legal Services & Support in Hillsboro is 0.88%.
What is the Percentage of Population Employed in Legal Services & Support in Oregon?
Percentage of Population Employed in Legal Services & Support in Oregon is 1.1%.
What is the Percentage of Population Employed in Legal Services & Support in the United States?
Percentage of Population Employed in Legal Services & Support in the United States is 1.2%.