Zip Codes with the Highest Percentage of Population Employed in Education Instruction & Library in Eugene, OR

RELATED REPORTS & OPTIONS

Education Instruction & Library
Population
Families and Households
Female Fertility
Female Fertility (Unmarried)
Race (Community Size)
Race (Percentage)
Ancestry (Community Size)
AfricanAlaskan AthabascanAleutAlsatianAmericanApacheArabArgentineanArmenianAustralianAustrianBangladeshiBasqueBelgianBhutaneseBlackfeetBolivianBrazilianBritishBulgarianBurmeseCajunCanadianCelticCentral AmericanCentral American IndianCherokeeCheyenneChickasawChileanChippewaChoctawColombianComancheCosta RicanCroatianCubanCzechCzechoslovakianDanishDominicanDutchEastern EuropeanEcuadorianEgyptianEnglishEstonianEuropeanFijianFilipinoFinnishFrenchFrench American IndianFrench CanadianGermanGreekGuamanian / ChamorroGuatemalanHaitianHonduranHungarianIcelanderIndian (Asian)IndonesianInupiatIranianIrishIroquoisIsraeliItalianJamaicanJapaneseKenyanKiowaKoreanLaotianLatvianLebaneseLithuanianLumbeeLuxembourgerMalaysianMalteseMexicanMexican American IndianMongolianNative HawaiianNavajoNicaraguanNigerianNorthern EuropeanNorwegianOsagePaiutePakistaniPalestinianPanamanianPennsylvania GermanPeruvianPolishPortuguesePotawatomiPuerto RicanRomanianRussianSalvadoranSamoanScandinavianScotch-IrishScottishSeminoleSerbianShoshoneSiouxSlavicSlovakSloveneSouth AfricanSouth AmericanSpaniardSpanishSri LankanSubsaharan AfricanSwedishSwissSyrianThaiTurkishUgandanUkrainianVenezuelanWelshYugoslavian
Ancestry (Percentage)
AfricanAlaskan AthabascanAleutAlsatianAmericanApacheArabArgentineanArmenianAustralianAustrianBangladeshiBasqueBelgianBhutaneseBlackfeetBolivianBrazilianBritishBulgarianBurmeseCajunCanadianCelticCentral AmericanCentral American IndianCherokeeCheyenneChickasawChileanChippewaChoctawColombianComancheCosta RicanCroatianCubanCzechCzechoslovakianDanishDominicanDutchEastern EuropeanEcuadorianEgyptianEnglishEstonianEuropeanFijianFilipinoFinnishFrenchFrench American IndianFrench CanadianGermanGreekGuamanian / ChamorroGuatemalanHaitianHonduranHungarianIcelanderIndian (Asian)IndonesianInupiatIranianIrishIroquoisIsraeliItalianJamaicanJapaneseKenyanKiowaKoreanLaotianLatvianLebaneseLithuanianLumbeeLuxembourgerMalaysianMalteseMexicanMexican American IndianMongolianNative HawaiianNavajoNicaraguanNigerianNorthern EuropeanNorwegianOsagePaiutePakistaniPalestinianPanamanianPennsylvania GermanPeruvianPolishPortuguesePotawatomiPuerto RicanRomanianRussianSalvadoranSamoanScandinavianScotch-IrishScottishSeminoleSerbianShoshoneSiouxSlavicSlovakSloveneSouth AfricanSouth AmericanSpaniardSpanishSri LankanSubsaharan AfricanSwedishSwissSyrianThaiTurkishUgandanUkrainianVenezuelanWelshYugoslavian
Immigrant Origin (Total)
Immigrant Origin (Percentage)
Income
Income (Families)
Income (Households)
Poverty
Poverty (Families)
Unemployment
Employment Occupations
Employment Industries
Employer Class
Commute Time
Commute Means
School Enrollment
Education by Degree Field
Occupancy
Finances
Physical Characteristics
Eugene
Compare Zip Codes
Comparison Subject

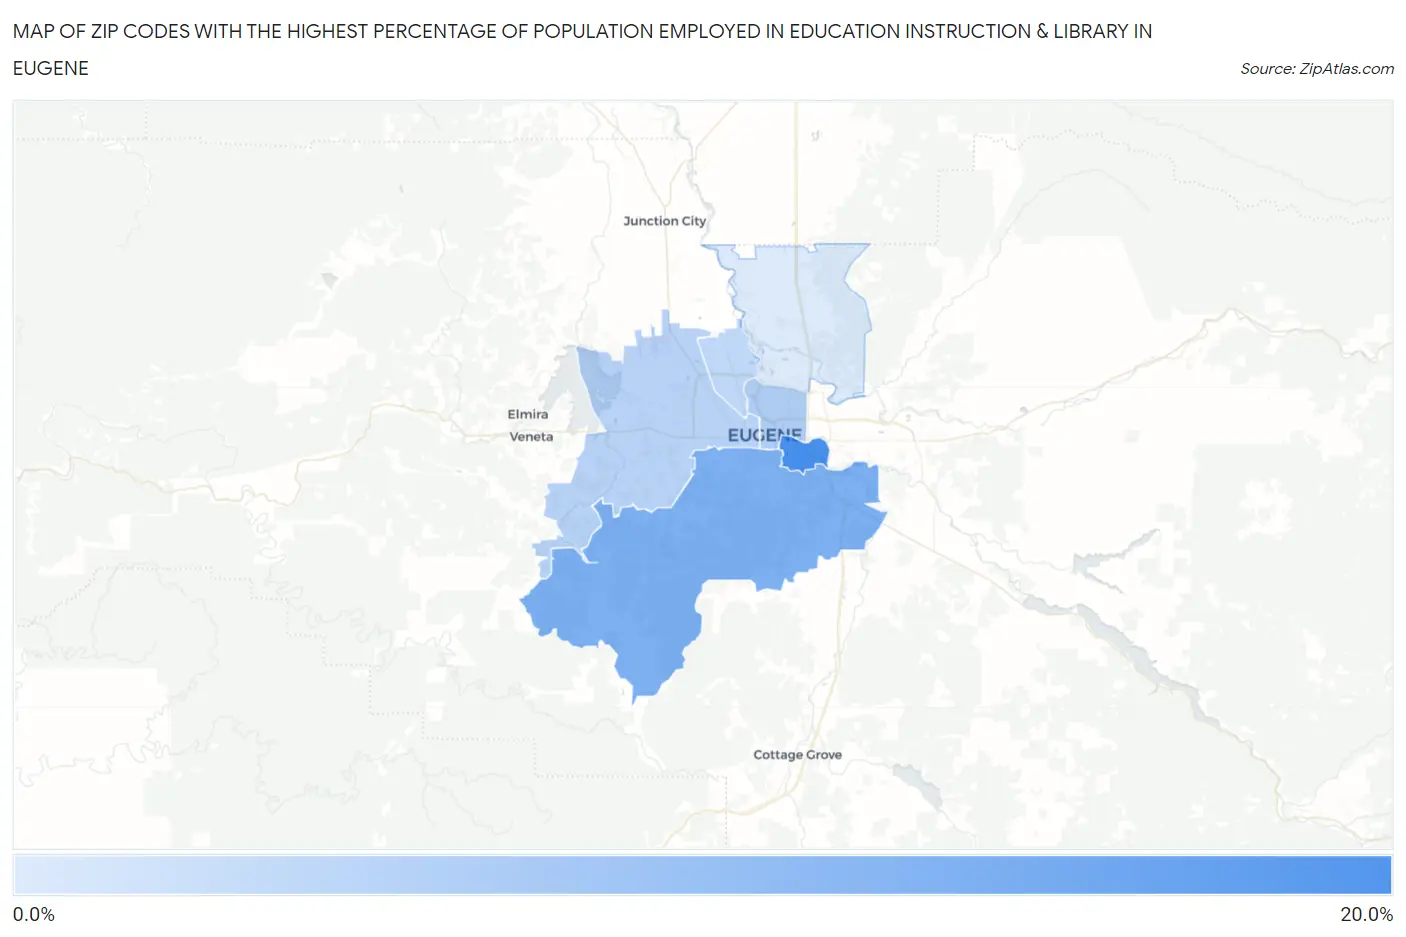
Map of Zip Codes with the Highest Percentage of Population Employed in Education Instruction & Library in Eugene

0.0%
20.0%
Zip Codes with the Highest Percentage of Population Employed in Education Instruction & Library in Eugene Map

Zip Codes with the Highest Percentage of Population Employed in Education Instruction & Library in Eugene, OR

Zip Code % Employed vs State vs National
1.9740315.9%5.6%(+10.3)#156.2%(+9.71)#1,111
2.9740512.0%5.6%(+6.34)#286.2%(+5.80)#2,395
3.974018.3%5.6%(+2.71)#746.2%(+2.16)#6,408
4.974027.7%5.6%(+2.07)#826.2%(+1.52)#7,872
5.974047.4%5.6%(+1.71)#916.2%(+1.17)#8,844
6.974085.2%5.6%(-0.395)#1816.2%(-0.941)#16,630

Common Questions

What are the Top 5 Zip Codes with the Highest Percentage of Population Employed in Education Instruction & Library in Eugene, OR?
Top 5 Zip Codes with the Highest Percentage of Population Employed in Education Instruction & Library in Eugene, OR are:
#1
15.9%
#2
12.0%
#3
8.3%
#4
7.7%
#5
7.4%
What zip code has the Highest Percentage of Population Employed in Education Instruction & Library in Eugene, OR?
97403 has the Highest Percentage of Population Employed in Education Instruction & Library in Eugene, OR with 15.9%.
What is the Percentage of Population Employed in Education Instruction & Library in Eugene, OR?
Percentage of Population Employed in Education Instruction & Library in Eugene is 9.6%.
What is the Percentage of Population Employed in Education Instruction & Library in Oregon?
Percentage of Population Employed in Education Instruction & Library in Oregon is 5.6%.
What is the Percentage of Population Employed in Education Instruction & Library in the United States?
Percentage of Population Employed in Education Instruction & Library in the United States is 6.2%.