Zip Codes with the Highest Percentage of Population with a Degree in Social Sciences in Westerville, OH
RELATED REPORTS & OPTIONS
Social Sciences
Westerville
Compare Zip Codes
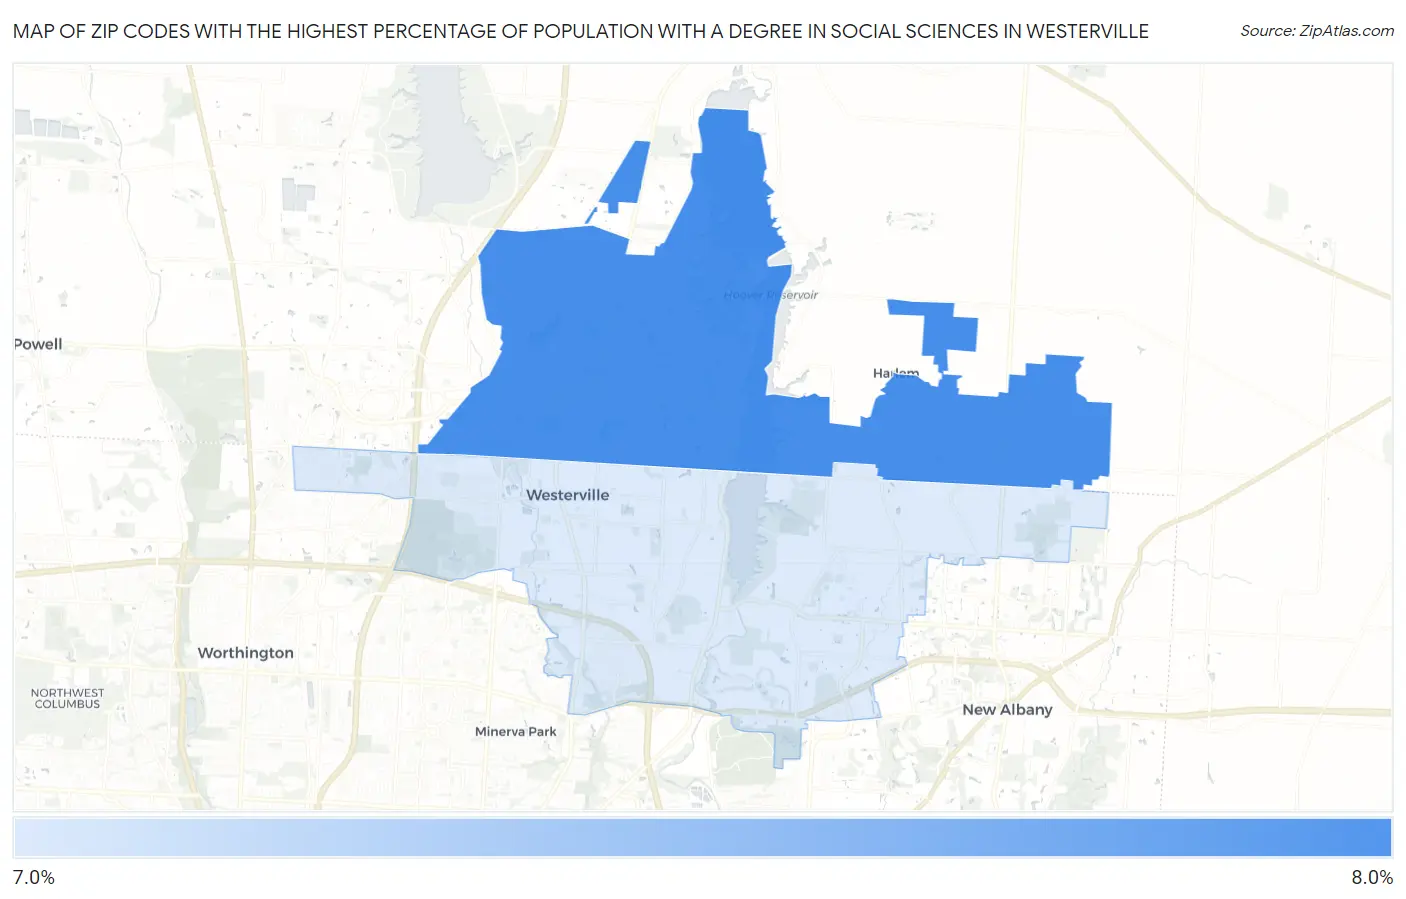
Map of Zip Codes with the Highest Percentage of Population with a Degree in Social Sciences in Westerville
0.0%
8.0%
Zip Codes with the Highest Percentage of Population with a Degree in Social Sciences in Westerville, OH
| Zip Code | % Graduates | vs State | vs National | |
| 1. | 43082 | 7.6% | 6.0%(+1.65)#192 | 8.1%(-0.425)#9,471 |
| 2. | 43081 | 7.1% | 6.0%(+1.05)#239 | 8.1%(-1.02)#10,798 |
1
Common Questions
What are the Top Zip Codes with the Highest Percentage of Population with a Degree in Social Sciences in Westerville, OH?
Top Zip Codes with the Highest Percentage of Population with a Degree in Social Sciences in Westerville, OH are:
What zip code has the Highest Percentage of Population with a Degree in Social Sciences in Westerville, OH?
43082 has the Highest Percentage of Population with a Degree in Social Sciences in Westerville, OH with 7.6%.
What is the Percentage of Population with a Degree in Social Sciences in Westerville, OH?
Percentage of Population with a Degree in Social Sciences in Westerville is 7.3%.
What is the Percentage of Population with a Degree in Social Sciences in Ohio?
Percentage of Population with a Degree in Social Sciences in Ohio is 6.0%.
What is the Percentage of Population with a Degree in Social Sciences in the United States?
Percentage of Population with a Degree in Social Sciences in the United States is 8.1%.