Zip Codes with the Highest Percentage of Population with a Degree in Literature and Languages in Akron, OH
RELATED REPORTS & OPTIONS
Literature and Languages
Akron
Compare Zip Codes
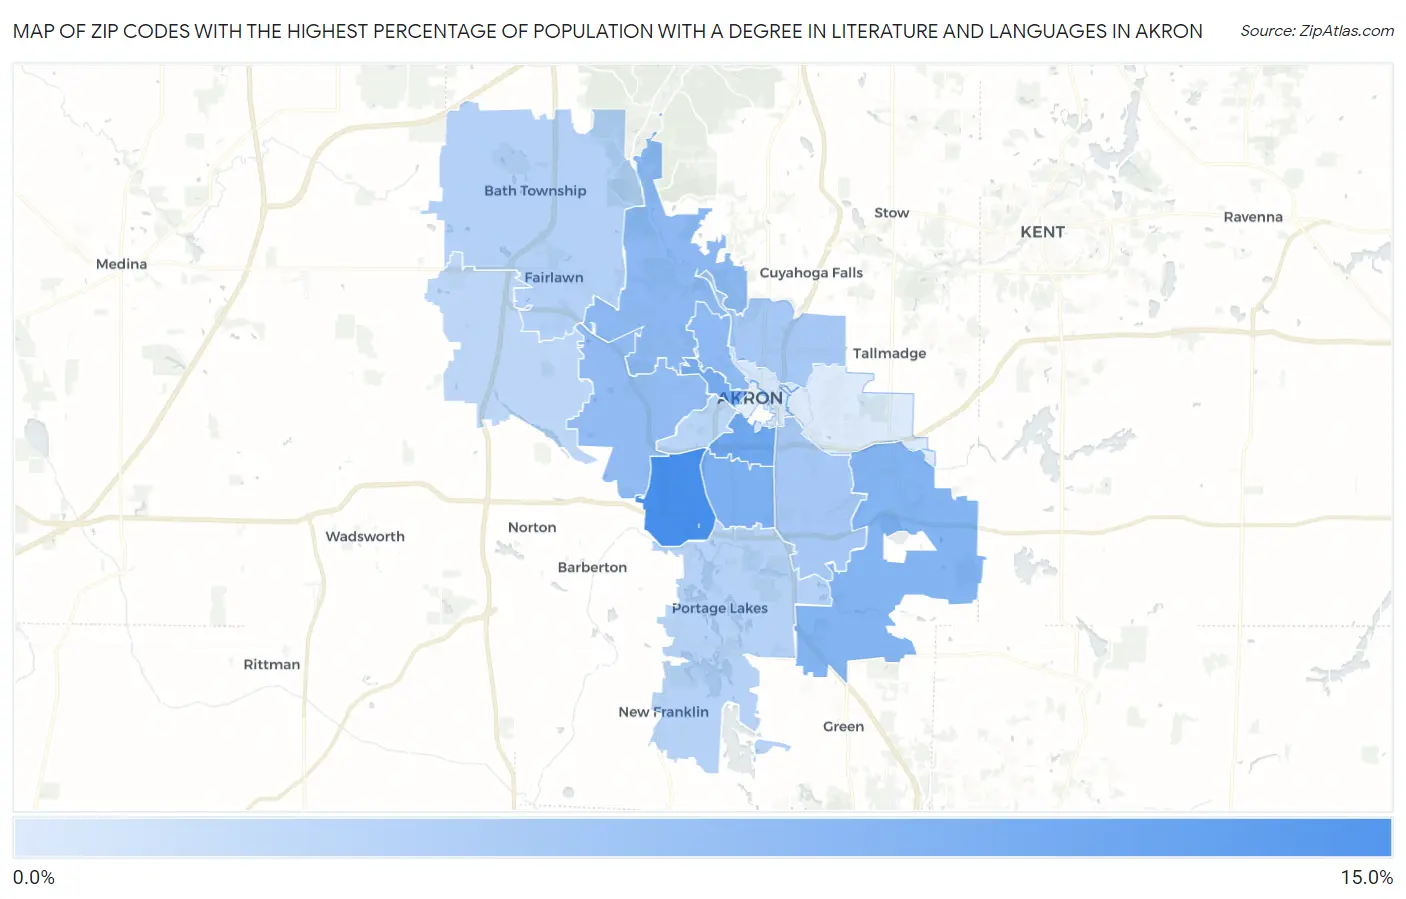
Map of Zip Codes with the Highest Percentage of Population with a Degree in Literature and Languages in Akron
0.0%
15.0%
Zip Codes with the Highest Percentage of Population with a Degree in Literature and Languages in Akron, OH
| Zip Code | % Graduates | vs State | vs National | |
| 1. | 44314 | 10.9% | 3.7%(+7.22)#32 | 4.4%(+6.49)#1,503 |
| 2. | 44311 | 7.9% | 3.7%(+4.20)#71 | 4.4%(+3.47)#3,085 |
| 3. | 44302 | 7.2% | 3.7%(+3.56)#86 | 4.4%(+2.83)#3,721 |
| 4. | 44301 | 6.9% | 3.7%(+3.22)#97 | 4.4%(+2.49)#4,106 |
| 5. | 44312 | 6.5% | 3.7%(+2.80)#120 | 4.4%(+2.07)#4,672 |
| 6. | 44313 | 5.7% | 3.7%(+2.03)#160 | 4.4%(+1.29)#5,935 |
| 7. | 44303 | 5.5% | 3.7%(+1.87)#173 | 4.4%(+1.14)#6,240 |
| 8. | 44320 | 5.4% | 3.7%(+1.77)#180 | 4.4%(+1.03)#6,422 |
| 9. | 44310 | 4.0% | 3.7%(+0.299)#299 | 4.4%(-0.435)#10,246 |
| 10. | 44306 | 4.0% | 3.7%(+0.274)#301 | 4.4%(-0.459)#10,330 |
| 11. | 44333 | 3.0% | 3.7%(-0.635)#418 | 4.4%(-1.37)#13,436 |
| 12. | 44319 | 2.8% | 3.7%(-0.875)#455 | 4.4%(-1.61)#14,258 |
| 13. | 44307 | 2.4% | 3.7%(-1.25)#517 | 4.4%(-1.98)#15,572 |
| 14. | 44321 | 2.3% | 3.7%(-1.35)#538 | 4.4%(-2.08)#15,941 |
| 15. | 44304 | 0.61% | 3.7%(-3.07)#740 | 4.4%(-3.80)#21,039 |
| 16. | 44305 | 0.079% | 3.7%(-3.60)#767 | 4.4%(-4.33)#21,685 |
1
Common Questions
What are the Top 10 Zip Codes with the Highest Percentage of Population with a Degree in Literature and Languages in Akron, OH?
Top 10 Zip Codes with the Highest Percentage of Population with a Degree in Literature and Languages in Akron, OH are:
What zip code has the Highest Percentage of Population with a Degree in Literature and Languages in Akron, OH?
44314 has the Highest Percentage of Population with a Degree in Literature and Languages in Akron, OH with 10.9%.
What is the Percentage of Population with a Degree in Literature and Languages in Akron, OH?
Percentage of Population with a Degree in Literature and Languages in Akron is 5.2%.
What is the Percentage of Population with a Degree in Literature and Languages in Ohio?
Percentage of Population with a Degree in Literature and Languages in Ohio is 3.7%.
What is the Percentage of Population with a Degree in Literature and Languages in the United States?
Percentage of Population with a Degree in Literature and Languages in the United States is 4.4%.