Zip Codes with the Most Immigrants from Southern Europe in Syracuse, NY

RELATED REPORTS & OPTIONS

Southern Europe
Population
Families and Households
Female Fertility
Female Fertility (Unmarried)
Race (Community Size)
Race (Percentage)
Ancestry (Community Size)
AfghanAfricanAlbanianAmericanApacheArabArgentineanArmenianAustrianBangladeshiBarbadianBelgianBhutaneseBlackfeetBrazilianBritishBritish West IndianBulgarianBurmeseCanadianCelticCentral AmericanCentral American IndianCherokeeChileanColombianCosta RicanCroatianCubanCzechCzechoslovakianDanishDominicanDutchEastern EuropeanEcuadorianEgyptianEnglishEstonianEthiopianEuropeanFilipinoFinnishFrenchFrench American IndianFrench CanadianGermanGhanaianGreekGuatemalanGuyaneseHaitianHonduranHungarianIndian (Asian)IndonesianIranianIraqiIrishIroquoisIsraeliItalianJamaicanJapaneseKoreanLaotianLatvianLebaneseLiberianLithuanianLuxembourgerMacedonianMalaysianMexicanNative HawaiianNavajoNicaraguanNigerianNorthern EuropeanNorwegianOkinawanPakistaniPalestinianPanamanianPennsylvania GermanPeruvianPolishPortuguesePuerto RicanRomanianRussianSalvadoranSamoanScandinavianScotch-IrishScottishSeminoleSerbianSiouxSlavicSlovakSloveneSomaliSouth AmericanSpaniardSpanishSri LankanSubsaharan AfricanSudaneseSwedishSwissSyrianThaiTrinidadian and TobagonianTurkishUkrainianVenezuelanVietnameseWelshWest IndianYugoslavian
Ancestry (Percentage)
AfghanAfricanAlbanianAmericanApacheArabArgentineanArmenianAustrianBangladeshiBarbadianBelgianBhutaneseBlackfeetBrazilianBritishBritish West IndianBulgarianBurmeseCanadianCelticCentral AmericanCentral American IndianCherokeeChileanColombianCosta RicanCroatianCubanCzechCzechoslovakianDanishDominicanDutchEastern EuropeanEcuadorianEgyptianEnglishEstonianEthiopianEuropeanFilipinoFinnishFrenchFrench American IndianFrench CanadianGermanGhanaianGreekGuatemalanGuyaneseHaitianHonduranHungarianIndian (Asian)IndonesianIranianIraqiIrishIroquoisIsraeliItalianJamaicanJapaneseKoreanLaotianLatvianLebaneseLiberianLithuanianLuxembourgerMacedonianMalaysianMexicanNative HawaiianNavajoNicaraguanNigerianNorthern EuropeanNorwegianOkinawanPakistaniPalestinianPanamanianPennsylvania GermanPeruvianPolishPortuguesePuerto RicanRomanianRussianSalvadoranSamoanScandinavianScotch-IrishScottishSeminoleSerbianSiouxSlavicSlovakSloveneSomaliSouth AmericanSpaniardSpanishSri LankanSubsaharan AfricanSudaneseSwedishSwissSyrianThaiTrinidadian and TobagonianTurkishUkrainianVenezuelanVietnameseWelshWest IndianYugoslavian
Immigrant Origin (Total)
AfghanistanAfricaArgentinaAsiaAustriaBahamasBangladeshBarbadosBelarusBosnia and HerzegovinaBrazilBurma / MyanmarCambodiaCanadaCaribbeanCentral AmericaChileChinaColombiaCongoCosta RicaCubaCzechoslovakiaDominican RepublicEastern AfricaEastern AsiaEastern EuropeEcuadorEl SalvadorEnglandEritreaEthiopiaEuropeFranceGermanyGhanaGreeceGrenadaGuatemalaGuyanaHaitiHondurasHong KongHungaryIndiaIndonesiaIranIraqIsraelItalyJamaicaJapanJordanKenyaKoreaKuwaitLaosLatin AmericaLiberiaMalaysiaMexicoMicronesiaMiddle AfricaMoroccoNepalNigeriaNorth MacedoniaNorthern AfricaNorthern EuropeOceaniaPakistanPanamaPeruPhilippinesPolandPortugalRussiaScotlandSingaporeSomaliaSouth AmericaSouth Central AsiaSouth Eastern AsiaSouthern EuropeSpainSri LankaSudanSwitzerlandSyriaTaiwanThailandTrinidad and TobagoTurkeyUkraineUzbekistanVietnamWestern AfricaWestern AsiaWestern EuropeYemenZaireZimbabwe
Immigrant Origin (Percentage)
AfghanistanAfricaArgentinaAsiaAustriaBahamasBangladeshBarbadosBelarusBosnia and HerzegovinaBrazilBurma / MyanmarCambodiaCanadaCaribbeanCentral AmericaChileChinaColombiaCongoCosta RicaCubaCzechoslovakiaDominican RepublicEastern AfricaEastern AsiaEastern EuropeEcuadorEl SalvadorEnglandEritreaEthiopiaEuropeFranceGermanyGhanaGreeceGrenadaGuatemalaGuyanaHaitiHondurasHong KongHungaryIndiaIndonesiaIranIraqIsraelItalyJamaicaJapanJordanKenyaKoreaKuwaitLaosLatin AmericaLiberiaMalaysiaMexicoMicronesiaMiddle AfricaMoroccoNepalNigeriaNorth MacedoniaNorthern AfricaNorthern EuropeOceaniaPakistanPanamaPeruPhilippinesPolandPortugalRussiaScotlandSingaporeSomaliaSouth AmericaSouth Central AsiaSouth Eastern AsiaSouthern EuropeSpainSri LankaSudanSwitzerlandSyriaTaiwanThailandTrinidad and TobagoTurkeyUkraineUzbekistanVietnamWestern AfricaWestern AsiaWestern EuropeYemenZaireZimbabwe
Income
Income (Families)
Income (Households)
Poverty
Poverty (Families)
Unemployment
Employment Occupations
Employment Industries
Employer Class
Commute Time
Commute Means
School Enrollment
Education by Degree Field
Occupancy
Finances
Physical Characteristics
Syracuse
Compare Zip Codes
Comparison Subject

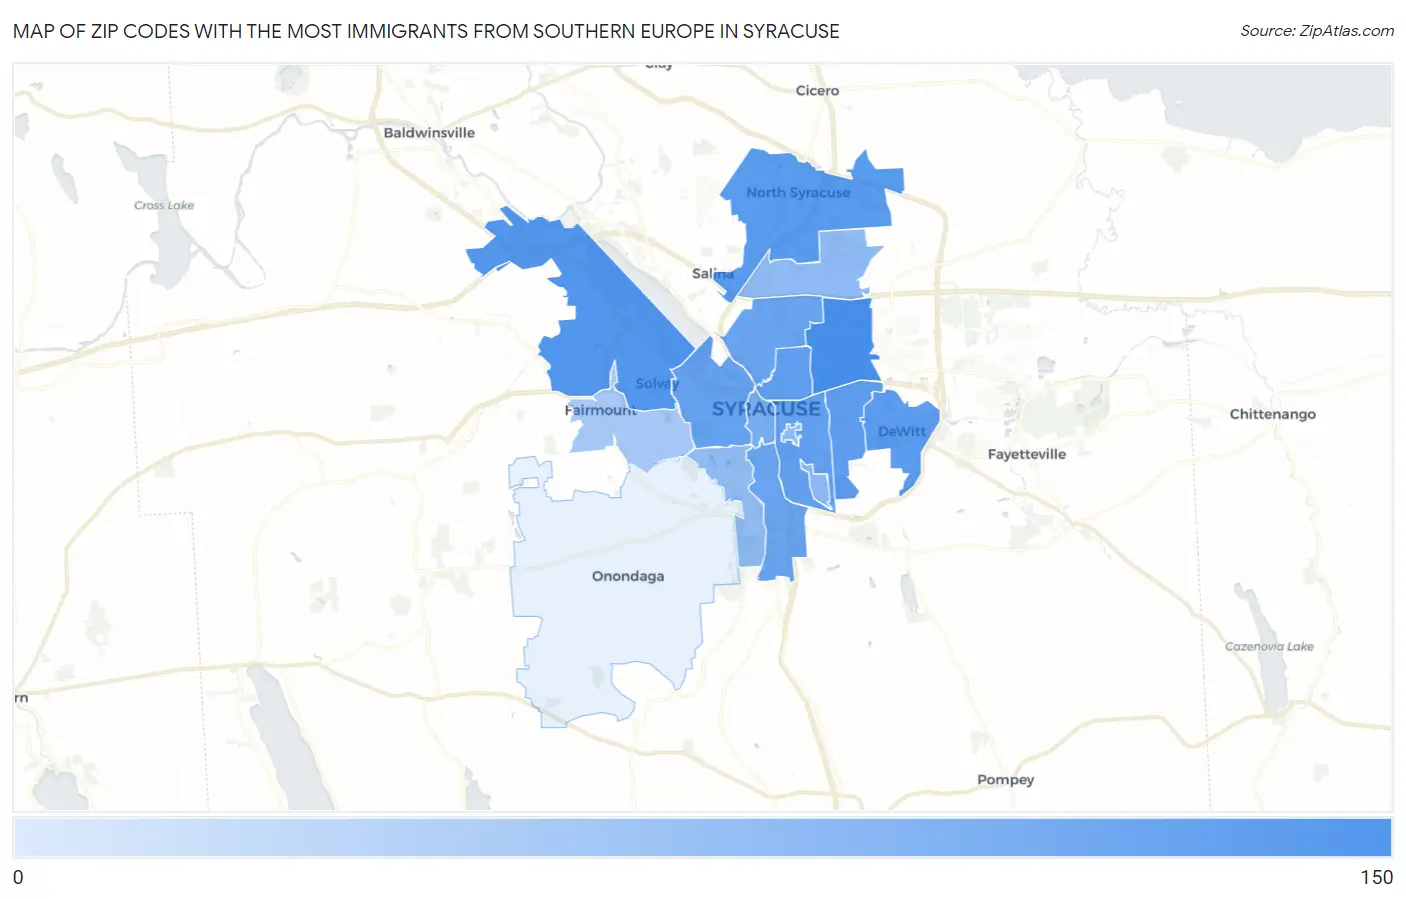
Map of Zip Codes with the Most Immigrants from Southern Europe in Syracuse

0
150
Zip Codes with the Most Immigrants from Southern Europe in Syracuse Map

Zip Codes with the Most Immigrants from Southern Europe in Syracuse, NY

Zip Code Southern Europe vs State vs National
1.13206135137,101(0.10%)#258728,588(0.02%)#1,346
2.1320991137,101(0.07%)#330728,588(0.01%)#2,046
3.1321282137,101(0.06%)#350728,588(0.01%)#2,238
4.1321470137,101(0.05%)#380728,588(0.01%)#2,582
5.1322463137,101(0.05%)#399728,588(0.01%)#2,809
6.1320357137,101(0.04%)#414728,588(0.01%)#3,019
7.1321053137,101(0.04%)#425728,588(0.01%)#3,193
8.1320451137,101(0.04%)#429728,588(0.01%)#3,283
9.1320844137,101(0.03%)#450728,588(0.01%)#3,614
10.1320544137,101(0.03%)#452728,588(0.01%)#3,621
11.1320226137,101(0.02%)#542728,588(0.00%)#4,894
12.1324413137,101(0.01%)#641728,588(0.00%)#6,387
13.1321112137,101(0.01%)#652728,588(0.00%)#6,559
14.1320711137,101(0.01%)#661728,588(0.00%)#6,691
15.132195137,101(0.00%)#754728,588(0.00%)#7,918

Common Questions

What are the Top 10 Zip Codes with the Most Immigrants from Southern Europe in Syracuse, NY?
Top 10 Zip Codes with the Most Immigrants from Southern Europe in Syracuse, NY are:
#1
135
#2
91
#3
82
#4
70
#5
63
#6
57
#7
53
#8
51
#9
44
#10
44
What zip code has the Most Immigrants from Southern Europe in Syracuse, NY?
13206 has the Most Immigrants from Southern Europe in Syracuse, NY with 135.
What is the Total Immigrants from Southern Europe in Syracuse, NY?
Total Immigrants from Southern Europe in Syracuse is 462.
What is the Total Immigrants from Southern Europe in New York?
Total Immigrants from Southern Europe in New York is 137,101.
What is the Total Immigrants from Southern Europe in the United States?
Total Immigrants from Southern Europe in the United States is 728,588.