Zip Codes with the Highest Percentage of Population Employed in Office & Administration in Hempstead, NY
RELATED REPORTS & OPTIONS
Office & Administration
Hempstead
Compare Zip Codes
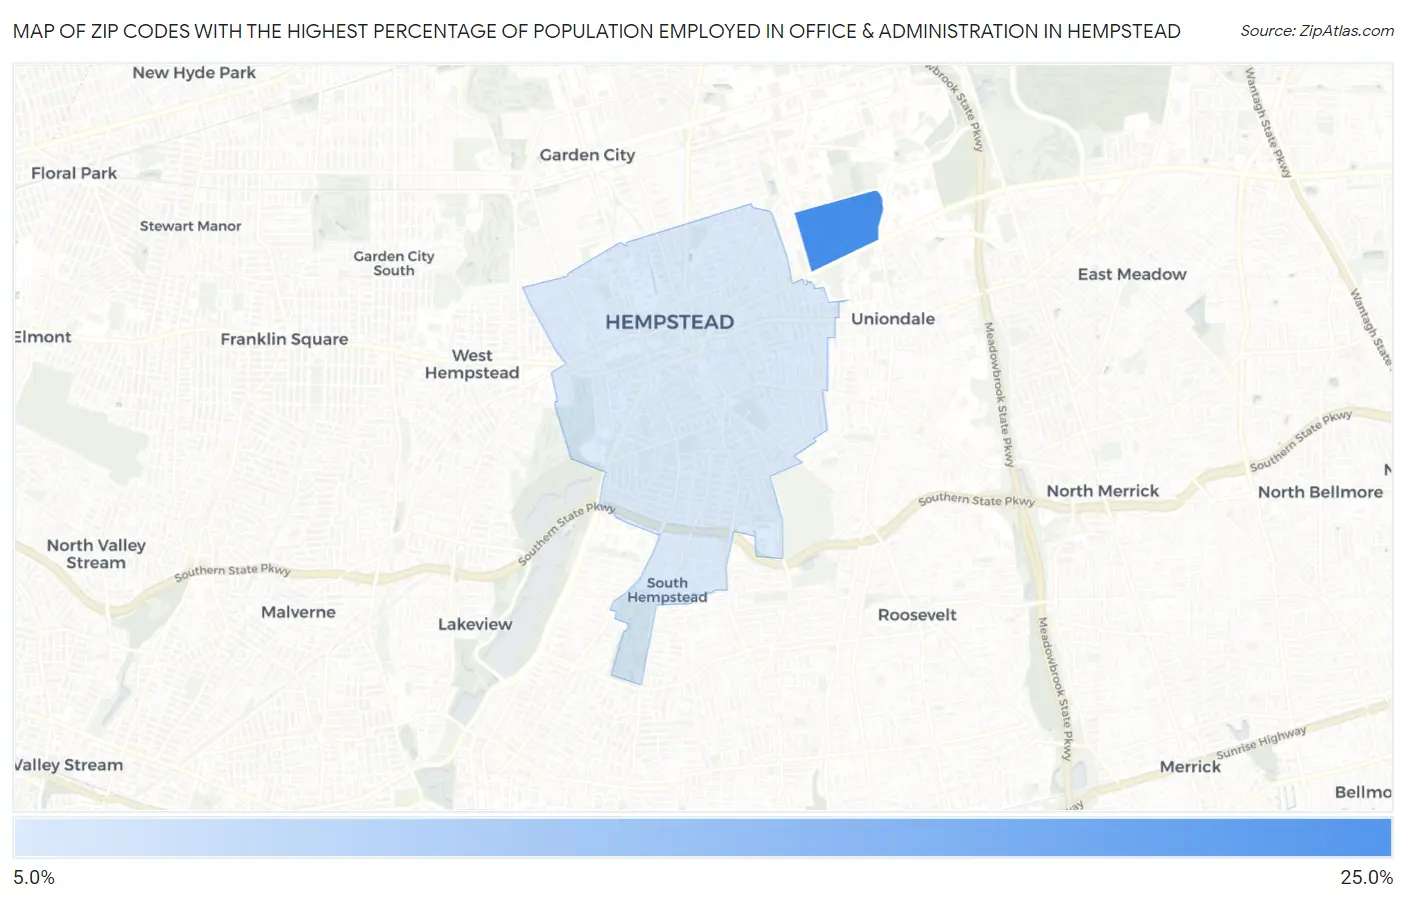
Map of Zip Codes with the Highest Percentage of Population Employed in Office & Administration in Hempstead
0.0%
25.0%
Zip Codes with the Highest Percentage of Population Employed in Office & Administration in Hempstead, NY
| Zip Code | % Employed | vs State | vs National | |
| 1. | 11549 | 22.2% | 10.8%(+11.4)#60 | 10.9%(+11.4)#1,267 |
| 2. | 11550 | 10.3% | 10.8%(-0.496)#891 | 10.9%(-0.511)#16,007 |
1
Common Questions
What are the Top Zip Codes with the Highest Percentage of Population Employed in Office & Administration in Hempstead, NY?
Top Zip Codes with the Highest Percentage of Population Employed in Office & Administration in Hempstead, NY are:
What zip code has the Highest Percentage of Population Employed in Office & Administration in Hempstead, NY?
11549 has the Highest Percentage of Population Employed in Office & Administration in Hempstead, NY with 22.2%.
What is the Percentage of Population Employed in Office & Administration in Hempstead, NY?
Percentage of Population Employed in Office & Administration in Hempstead is 10.4%.
What is the Percentage of Population Employed in Office & Administration in New York?
Percentage of Population Employed in Office & Administration in New York is 10.8%.
What is the Percentage of Population Employed in Office & Administration in the United States?
Percentage of Population Employed in Office & Administration in the United States is 10.9%.